Embed Size (px)
Citation preview

Salt budget of the upperSouth-Eastern Arabian Sea in
OPA modelFabien Durand*D. ShankarS.S.C. ShenoiS.R. ShetyeNational Institute of Oceanography, Goa, India
Bruno BlankeLPO, CNRS, Brest, France
Gurvan MadecLODYC, CNRS, Paris, France
* also at IRD / LEGOS, Toulouse, France
SEAS : a key-area for the coupled systemNorthern Indian Ocean�summer monsoon
• P.V. Joseph, 1990 : “The time of onset of the monsoon over India depends on the prevailing SST in the Northern Indian Ocean”
• S. Masson, 2004 : salt effects in the SEAS influence the timing of monsoon onset
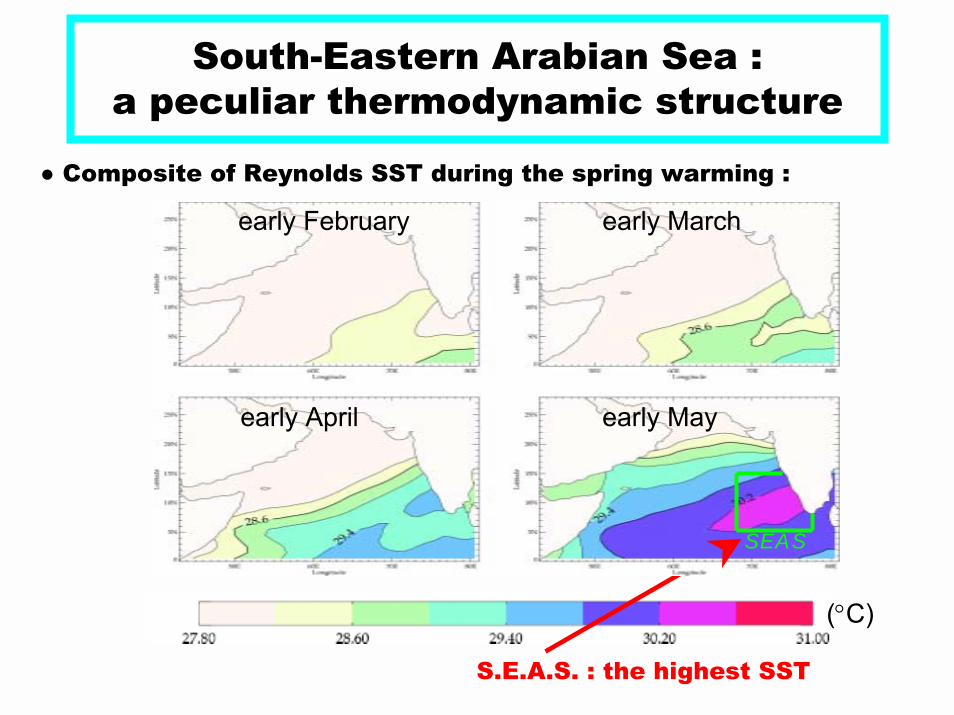
South-Eastern Arabian Sea :a peculiar thermodynamic structure
● Composite of Reynolds SST during the spring warming :
(°C)
SEAS
early February early March
early April early May
S.E.A.S. : the highest SST
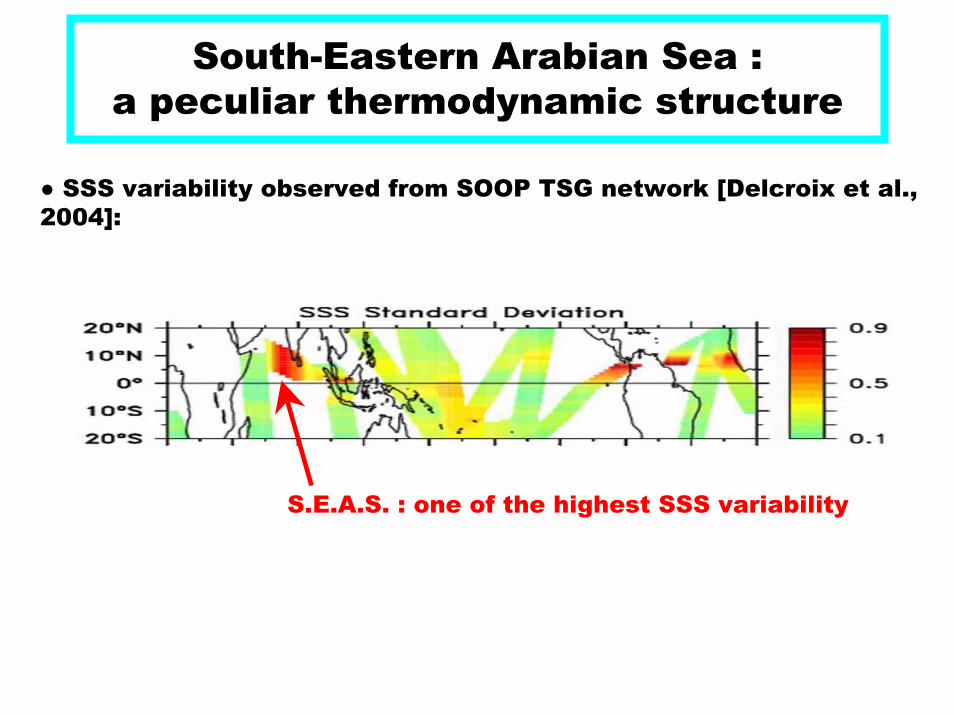
South-Eastern Arabian Sea :a peculiar thermodynamic structure
● SSS variability observed from SOOP TSG network [Delcroix et al., 2004]:
S.E.A.S. : one of the highest SSS variability
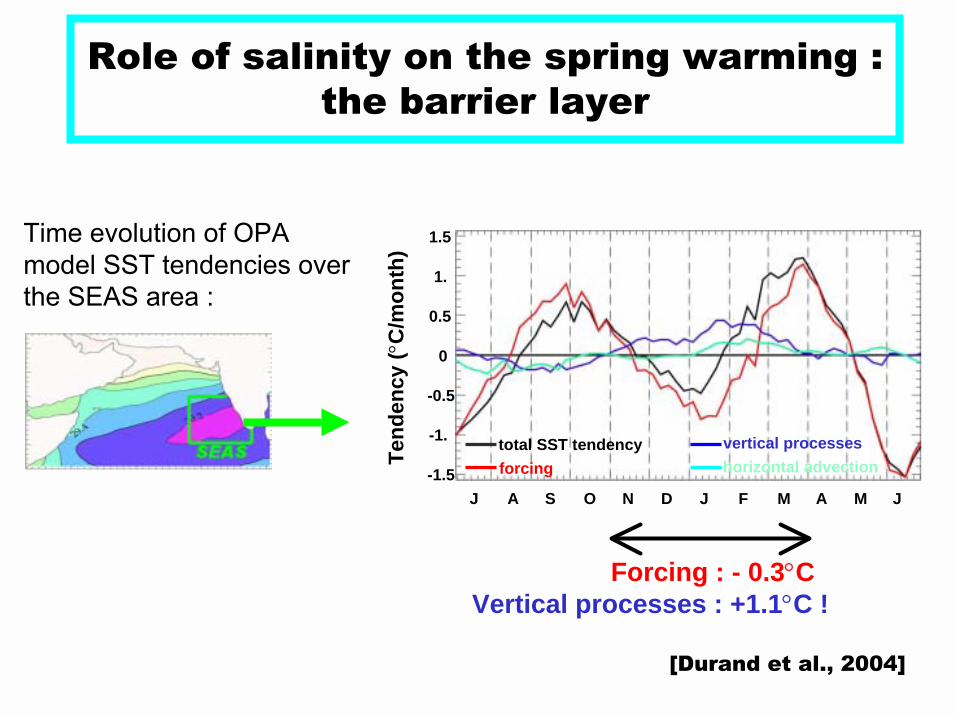
Role of salinity on the spring warming : the barrier layer
Time evolution of OPA model SST tendencies over the SEAS area :
Tend
ency
(°C
/mon
th)
J A S O N D J F M A M J-1.5
-1.
-0.5
0
0.5
1.5
forcingtotal SST tendency vertical processes
1.
horizontal advection
Forcing : - 0.3°CVertical processes : +1.1°C !
[Durand et al., 2004]
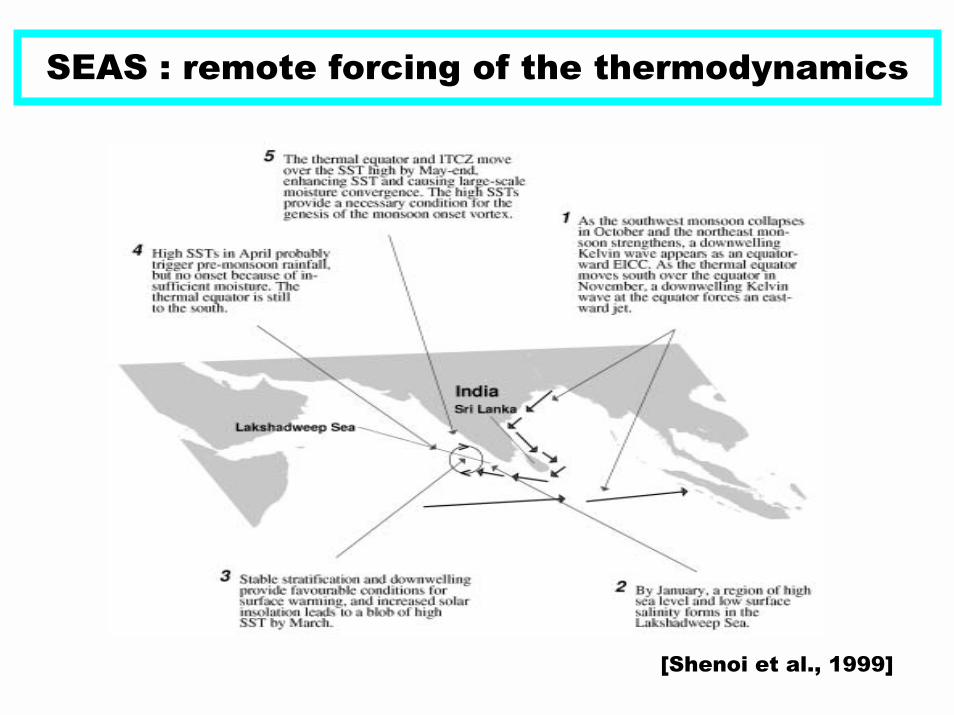
SEAS : remote forcing of the thermodynamics
[Shenoi et al., 1999]
This study : what is the barrier layer formation mechanism ?
Model : OPA9 [Madec et al., 1998]. ● 0.5° resolution and 10m vertical resolution● TKE vertical physics, partial steps, isopycnal lateral diffusion, Gent&McWilliams parameterization of baroclinicinstability● Closed boundaries at 35°S and 120°E ● Forcing : ERS wind stress, heat fluxes and evaporation computed through bulk formulae using NCEP atmospheric variables, CMAP precipitation.● No relaxation in SST nor SSS● Forcing strategy : we simulate the response of the model to the seasonal cycle of atmospheric fluxes.
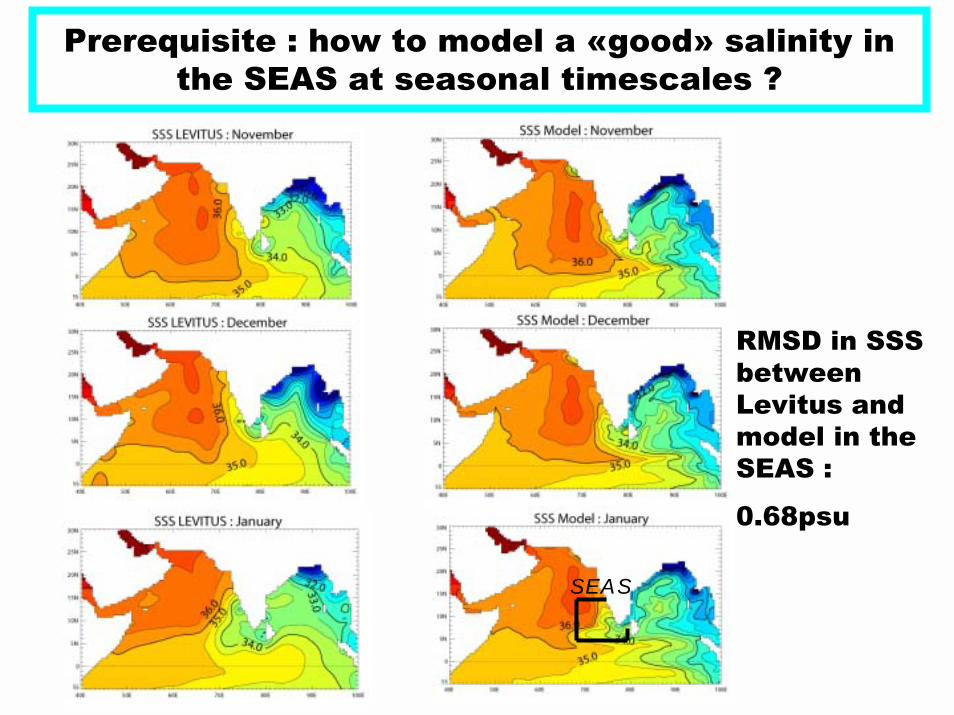
RMSD in SSS betweenLevitus andmodel in the SEAS :
0.68psu
SEAS
Prerequisite : how to model a «good» salinity in the SEAS at seasonal timescales ?
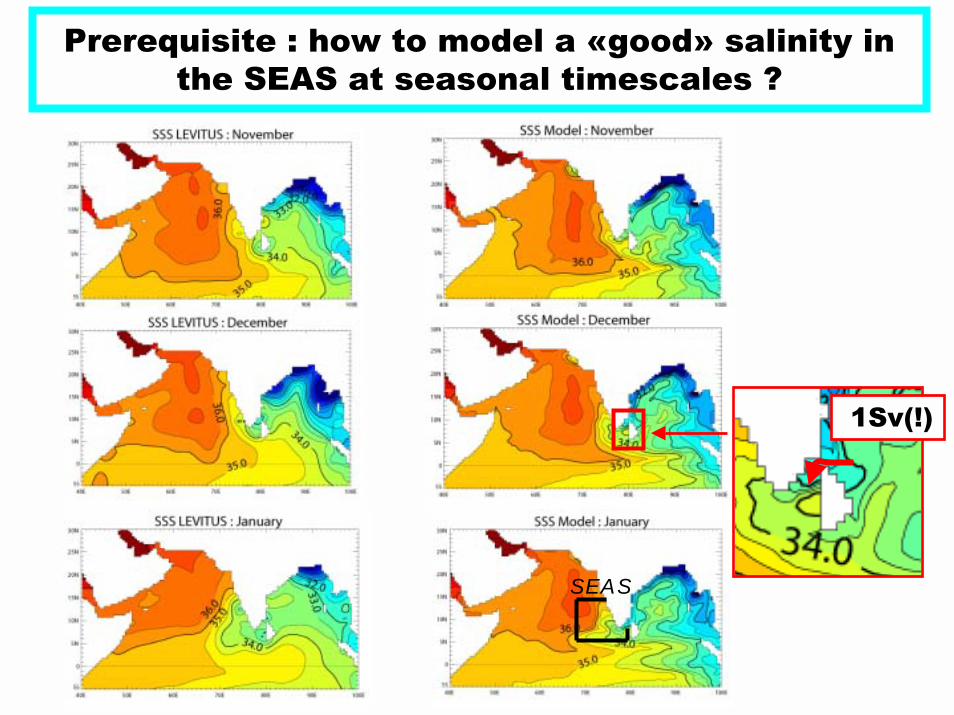
1Sv(!)
SEAS
Prerequisite : how to model a «good» salinity in the SEAS at seasonal timescales ?
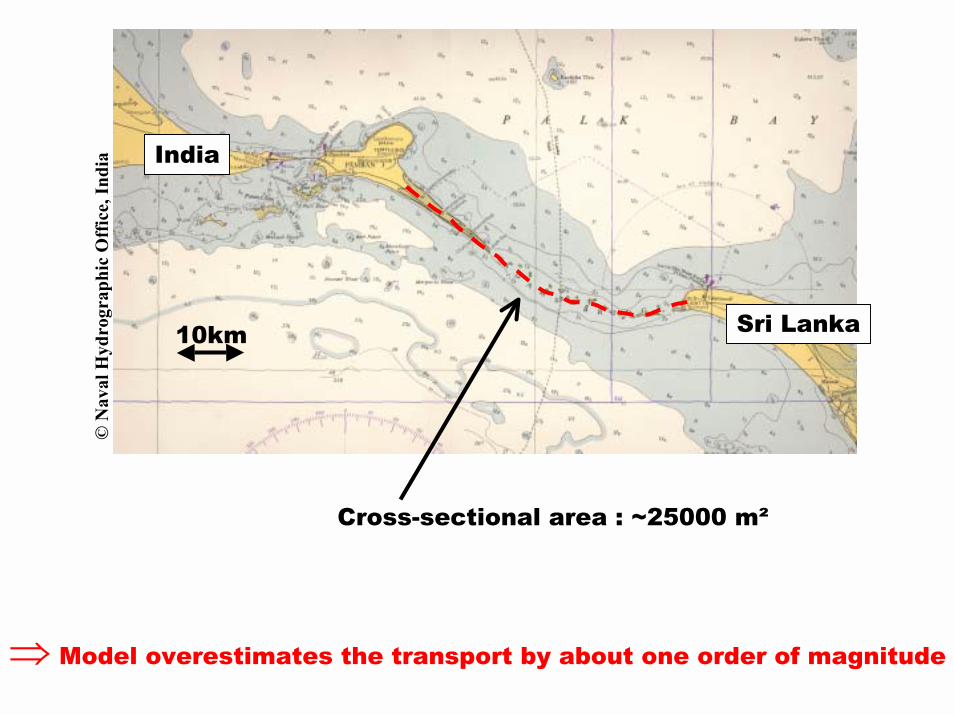
10km
India
Sri Lanka
©N
aval
Hyd
rogr
aphi
c O
ffic
e, In
dia
Cross-sectional area : ~25000 m²
⇒ Model overestimates the transport by about one order of magnitude
SEAS
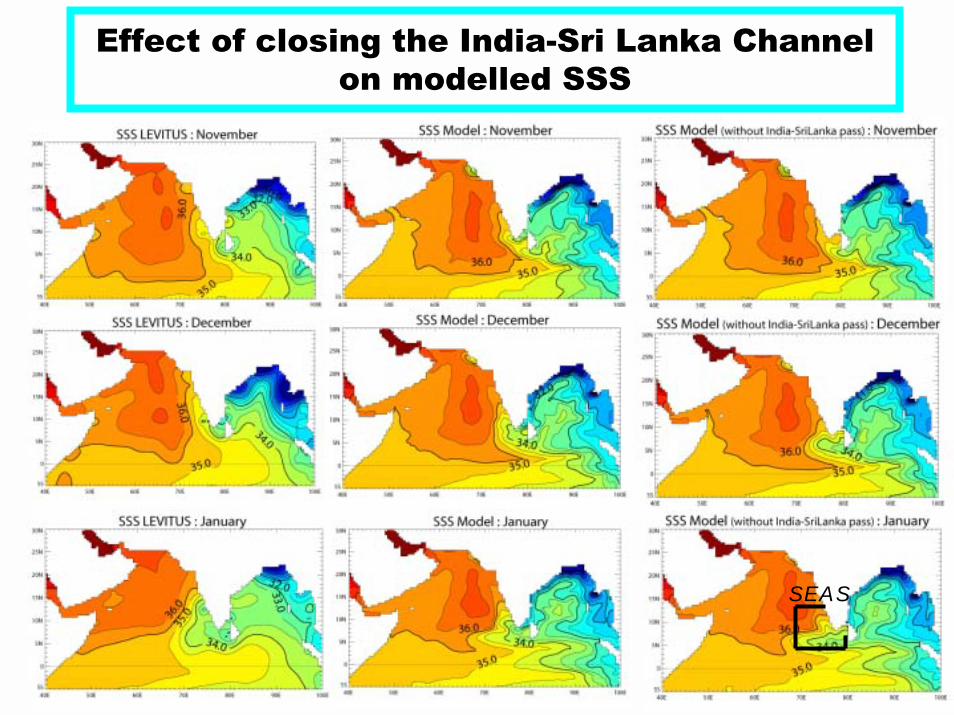
Effect of closing the India-Sri Lanka Channel on modelled SSS
Effect of closing the India-Sri Lanka Channel on modelled SSS in the SEAS :
RMSD in SSS between Levitus and model in the SEAS :
rises from 0.68psu to 0.81psu.
Why ?...
- wrong physics or too coarse resolution ?
- wrong E-P flux ?
- wrong runoff ?
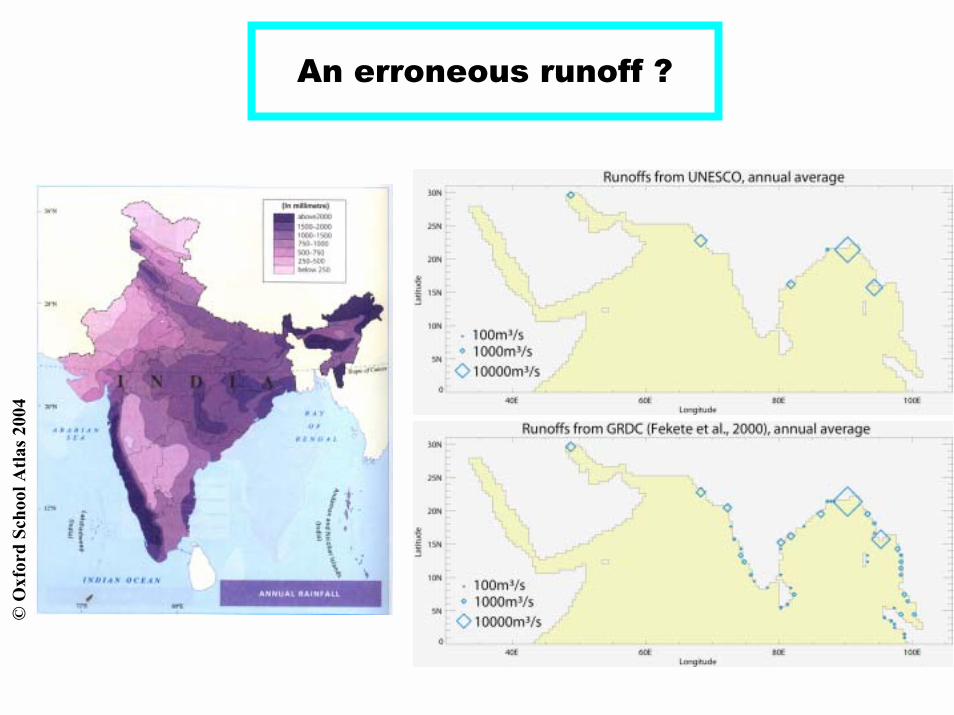
An erroneous runoff ?
©O
xfor
d Sc
hool
Atla
s 200
4
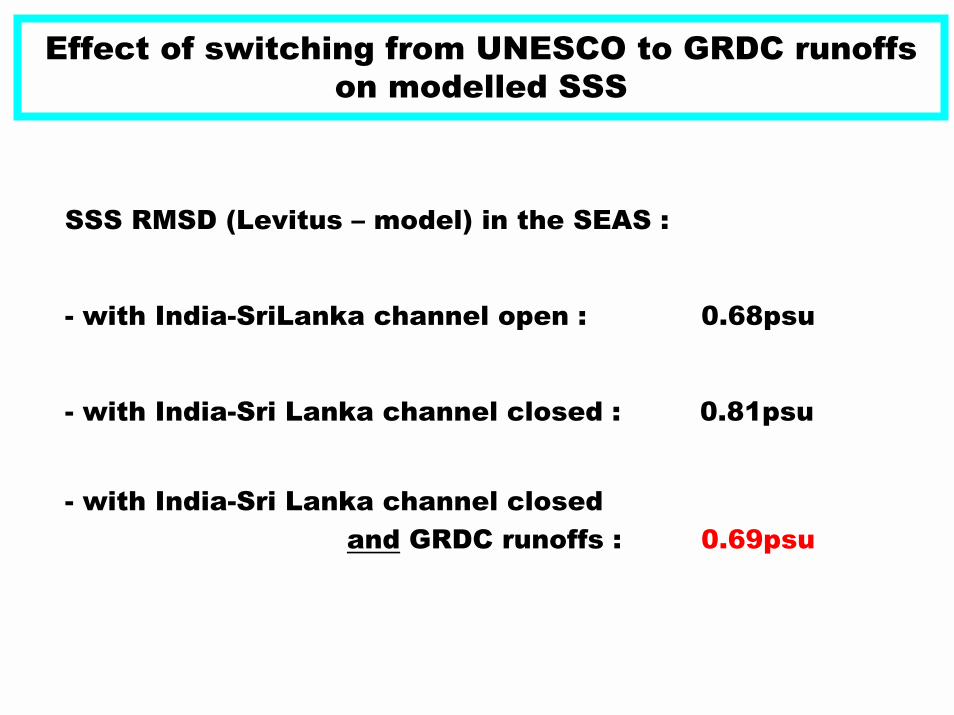
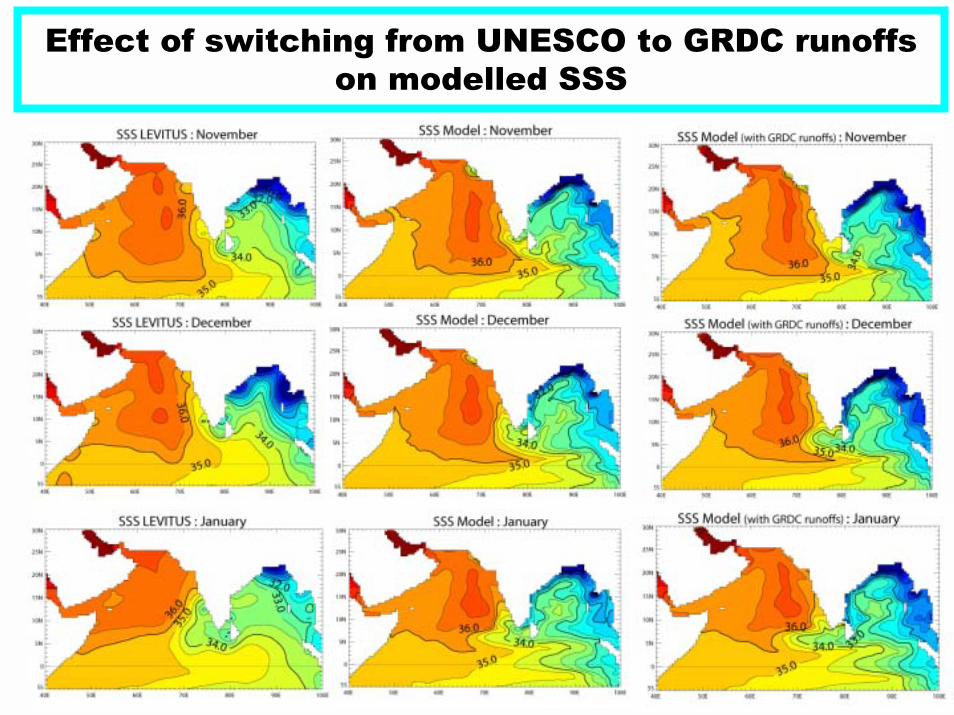
Effect of switching from UNESCO to GRDC runoffs on modelled SSS
SSS RMSD (Levitus � model) in the SEAS :
- with India-SriLanka channel open : 0.68psu
- with India-Sri Lanka channel closed : 0.81psu
- with India-Sri Lanka channel closed and GRDC runoffs : 0.69psu
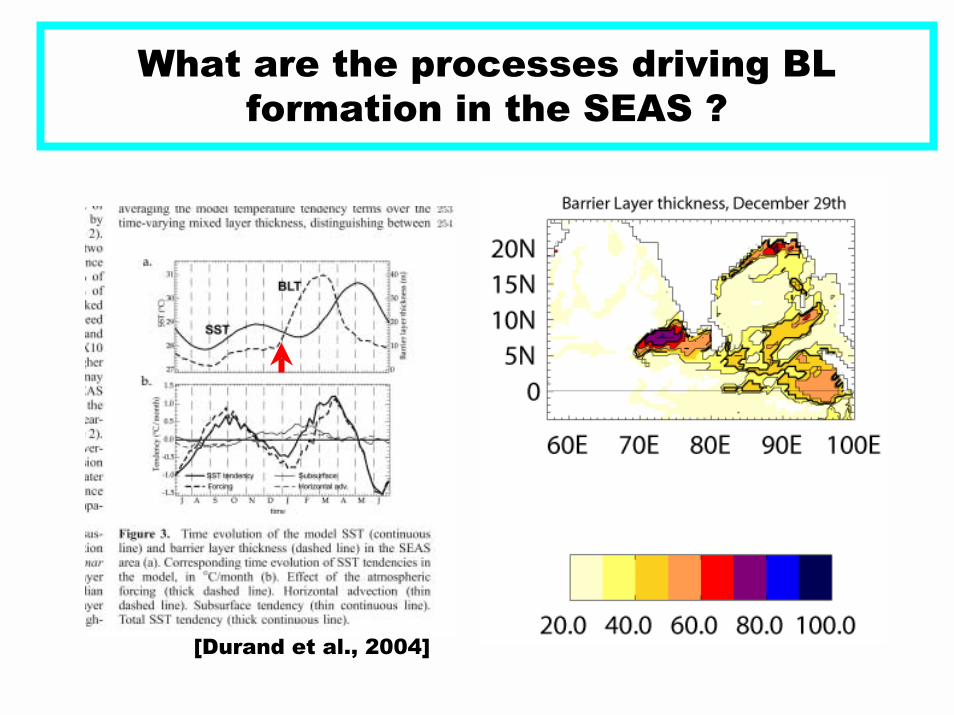
What are the processes driving BL formation in the SEAS ?
[Durand et al., 2004]
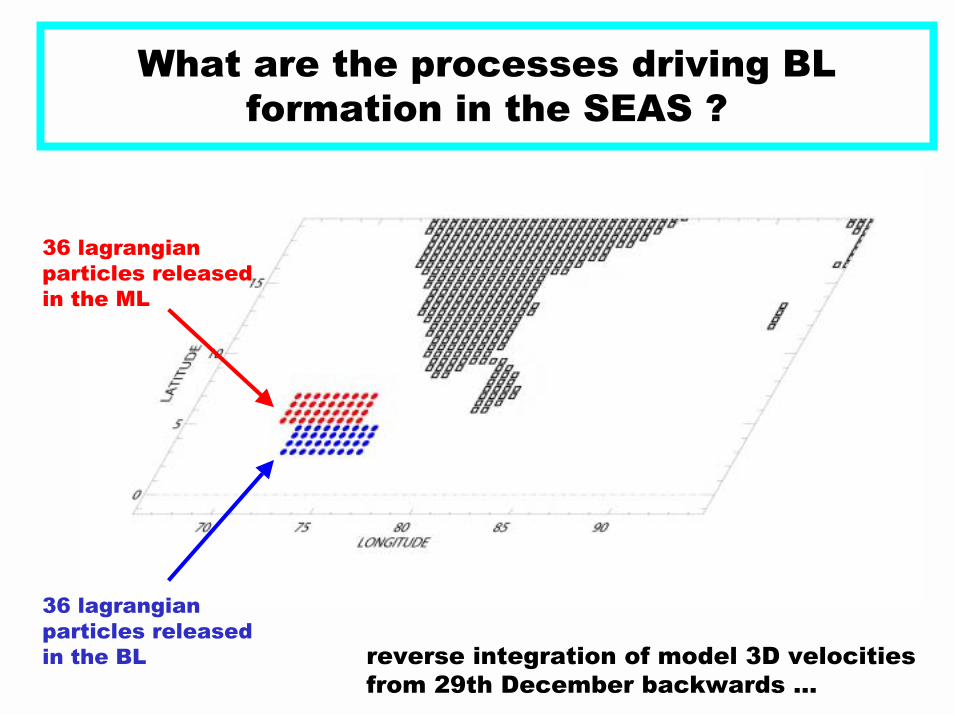
What are the processes driving BL formation in the SEAS ?
reverse integration of model 3D velocitiesfrom 29th December backwards �
36 lagrangianparticles released in the BL
36 lagrangianparticles released in the ML
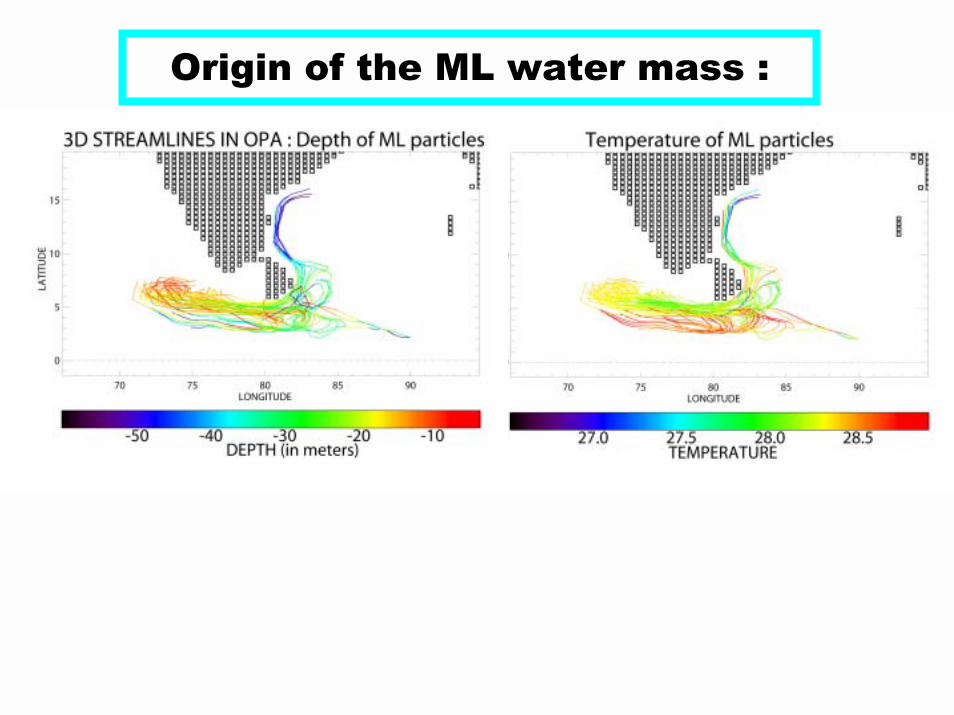
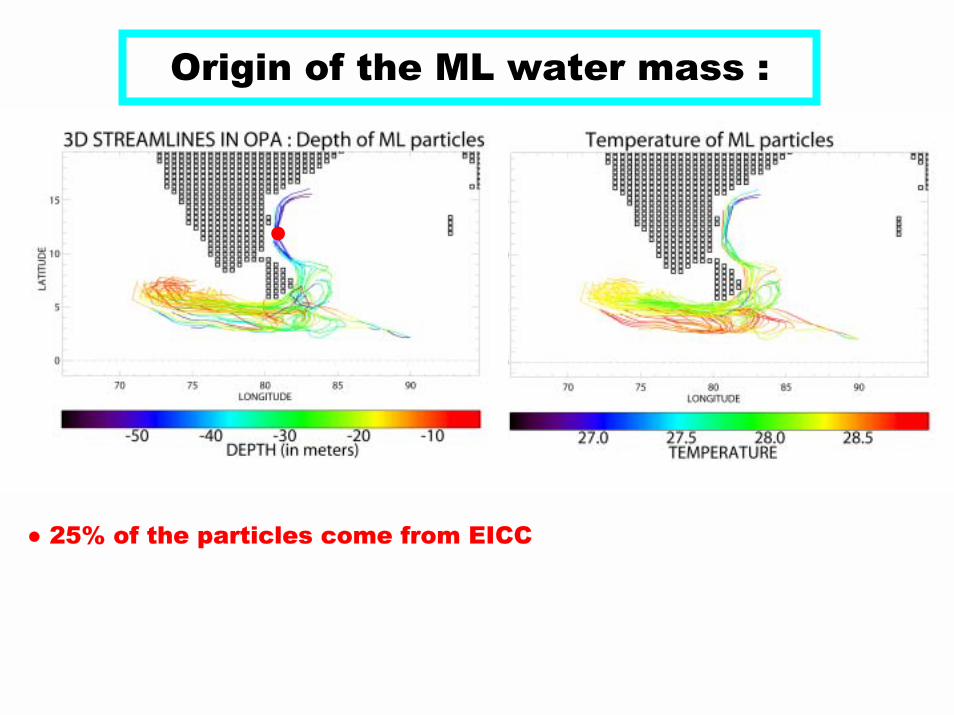
Origin of the ML water mass :
●
Origin of the ML water mass :
● 25% of the particles come from EICC
●
●
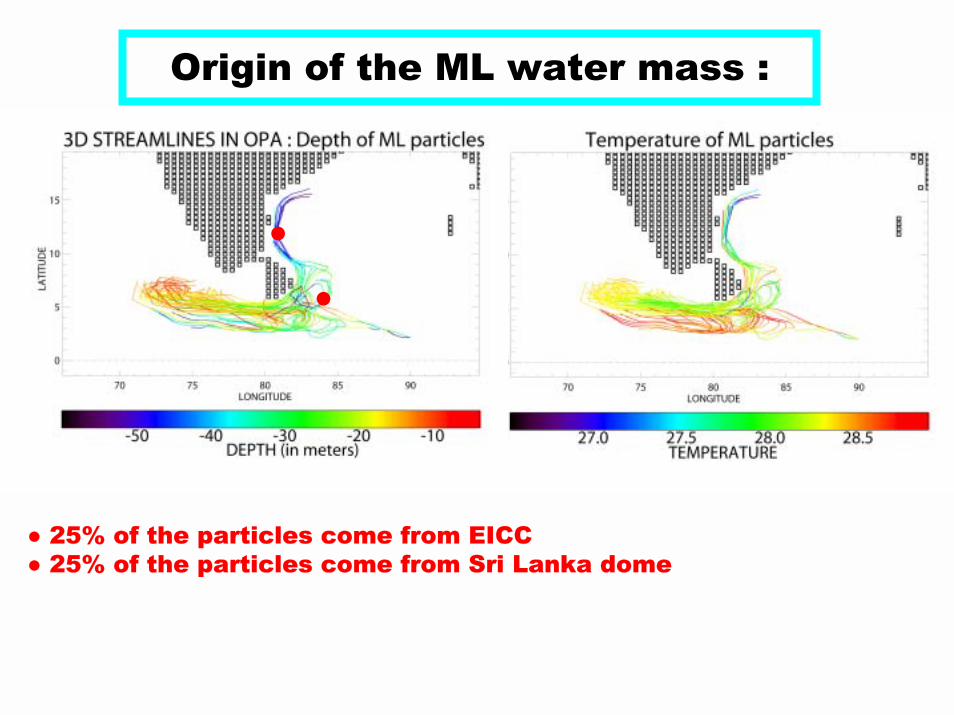
Origin of the ML water mass :
● 25% of the particles come from EICC● 25% of the particles come from Sri Lanka dome
●
●●
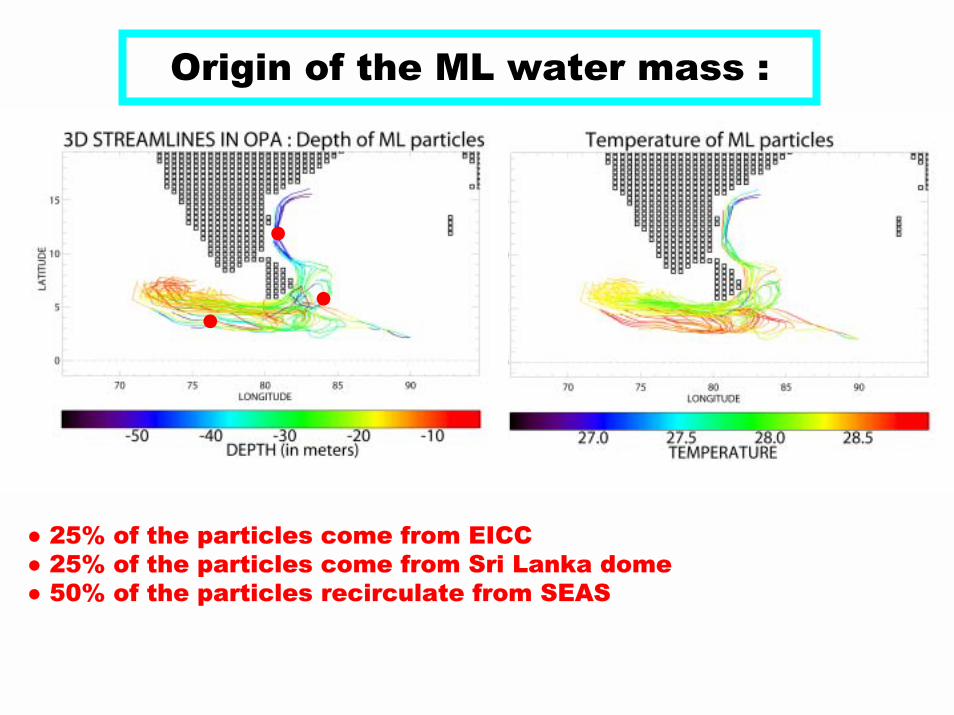
Origin of the ML water mass :
● 25% of the particles come from EICC● 25% of the particles come from Sri Lanka dome● 50% of the particles recirculate from SEAS
●
●● ●
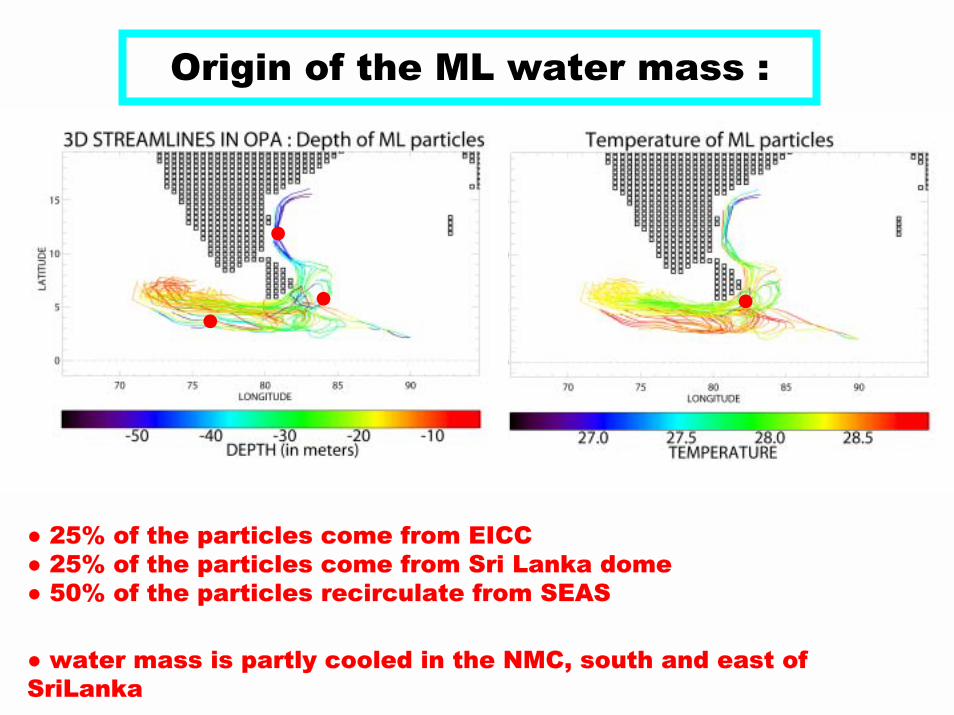
Origin of the ML water mass :
● 25% of the particles come from EICC● 25% of the particles come from Sri Lanka dome● 50% of the particles recirculate from SEAS
● water mass is partly cooled in the NMC, south and east ofSriLanka
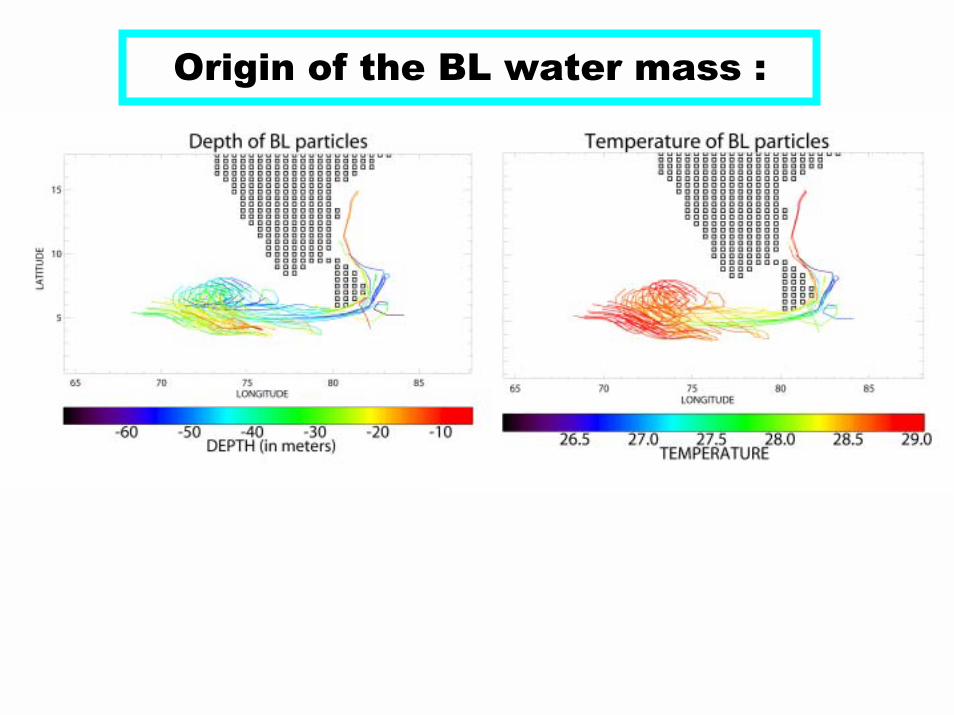
Origin of the BL water mass :
●
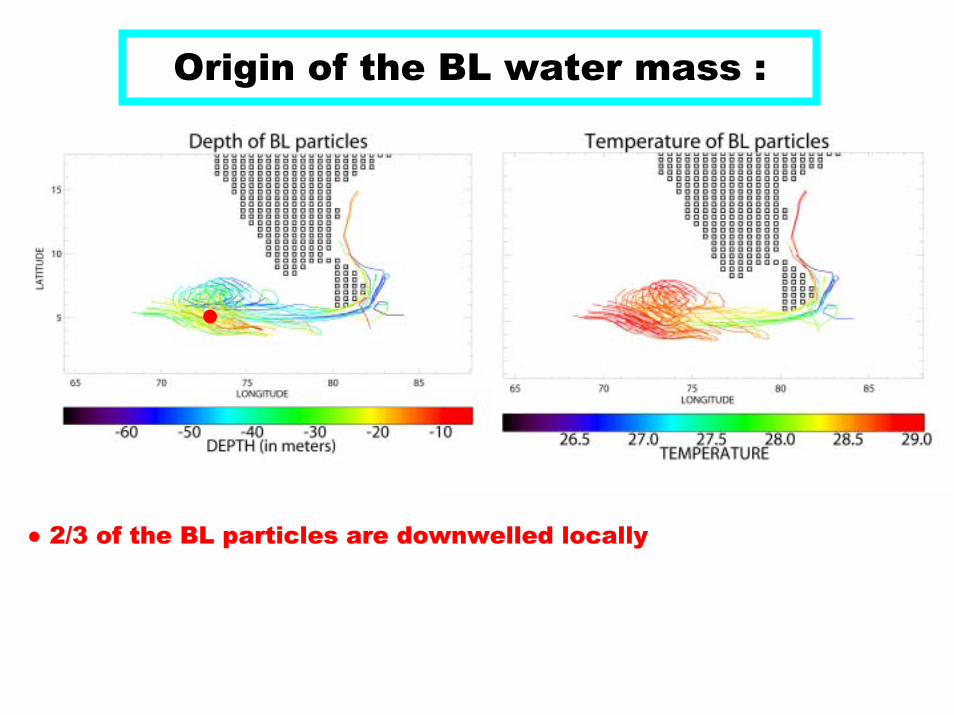
Origin of the BL water mass :
● 2/3 of the BL particles are downwelled locally
● ●
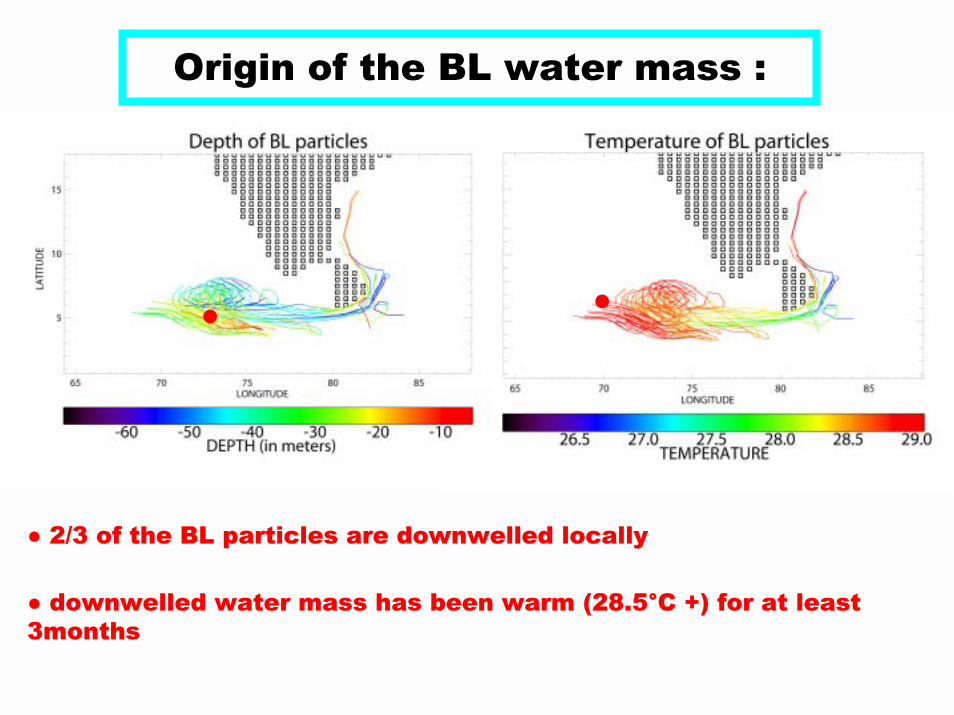
Origin of the BL water mass :
● 2/3 of the BL particles are downwelled locally
● downwelled water mass has been warm (28.5°C +) for at least 3months
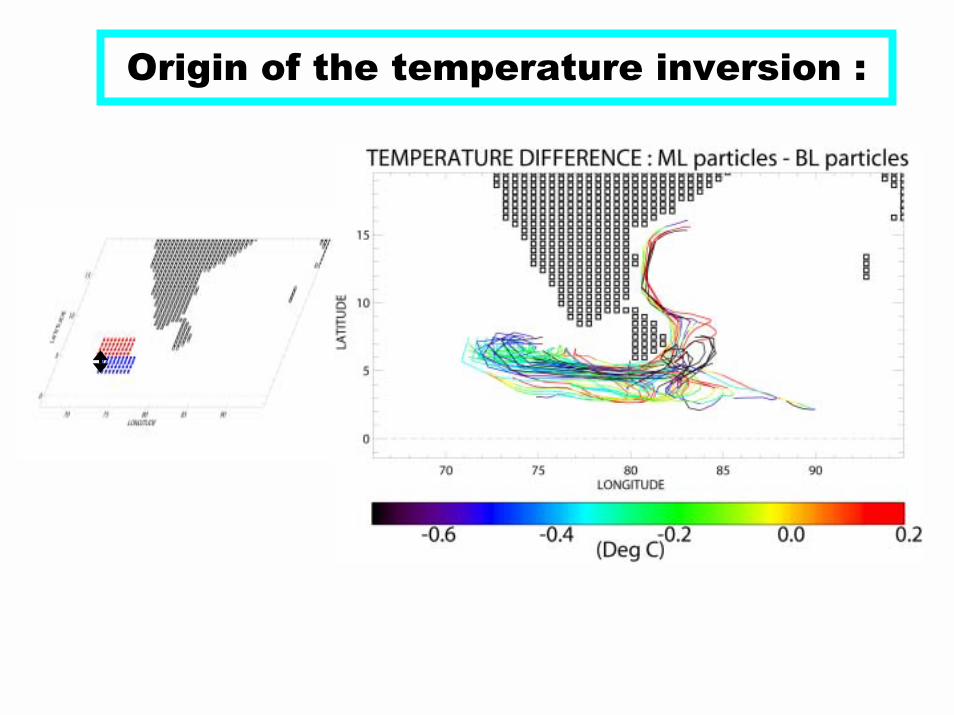
Origin of the temperature inversion :
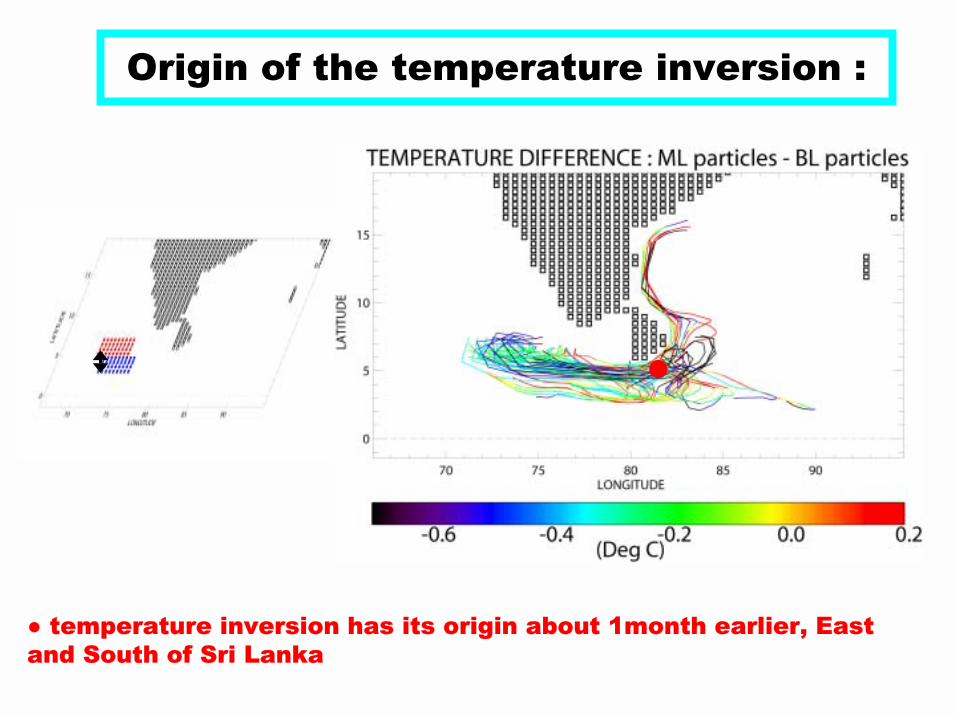
Origin of the temperature inversion :
●
● temperature inversion has its origin about 1month earlier, Eastand South of Sri Lanka
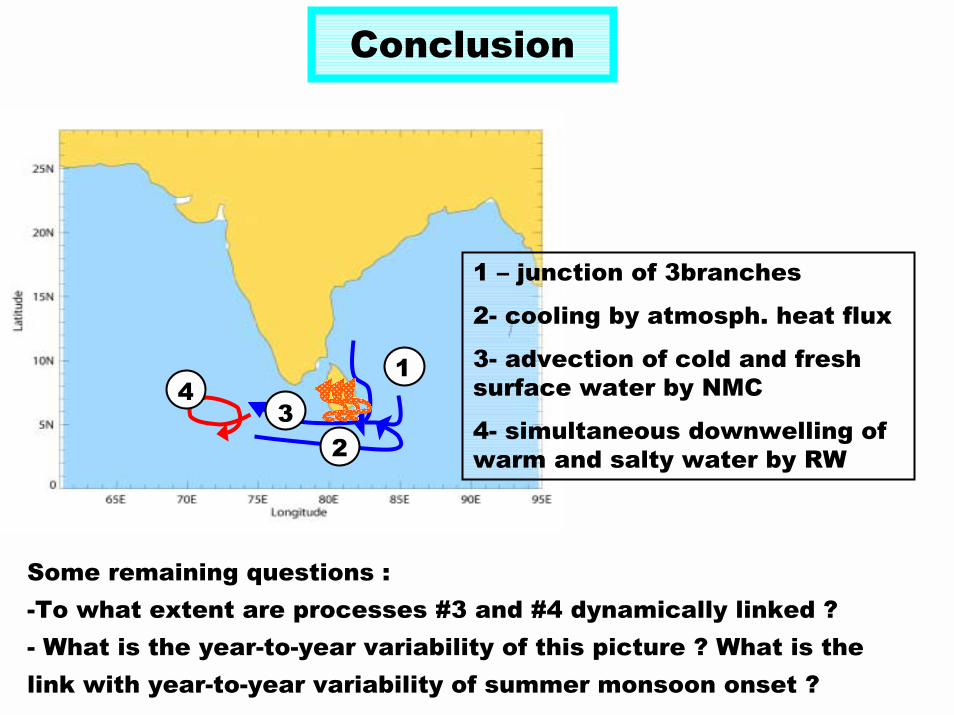
Conclusion
1
23
4
1 � junction of 3branches
2- cooling by atmosph. heat flux
3- advection of cold and fresh surface water by NMC
4- simultaneous downwelling ofwarm and salty water by RW
Some remaining questions :-To what extent are processes #3 and #4 dynamically linked ?- What is the year-to-year variability of this picture ? What is thelink with year-to-year variability of summer monsoon onset ?
Effect of switching from UNESCO to GRDC runoffs on modelled SSS