Embed Size (px)
Citation preview
Industrija, Vol.43, No.4, 2015 129
Emad Kazemzadeh 1 Azar Sheikh Zeinoddin2
JEL: F16,L11,P23 DOI: 10.5937/industrija43-8616 UDC:339.187:[338.45:629.33(55)"1996/2011" 339.13
Case research
Sales Concentration Index in the Iranian Car Market3
Article history: Received: 27 June 2015 Sent for revision: 13 July 2015 Received in revised form: 27 October 2015 Accepted: 28 October 2015 Available online: 30 December 2015
Abstract: Concentration is among the key indicators of market structure. The number of manufacturers and distribution of market between firms with different sizes can be examined using concentration index. In this paper, the concentration ratio, Herfindahl-Hirschman Index, Hall-Tiedman Index, comprehensive industrial concentration index, entropy and Hannah-Kay index were used during 1996, 2011, 2006 and 2011. The main objective of the present study is to measure concentration in the Iranian car market and show its changes during 1996-2011. The results indicated a high concentration in the Iranian automotive industry. Even with the advent of new firms to the Iranian automotive industry and increased total production, there has been a constant concentration in the automotive industry.
Keywords: Market Structure, Herfindahl, Car, Market Concentration, industrial,Iranian automotive,Hall-Tiedman
Indeks koncentracije prodaje na iranskom tržištu automobila
Apstrakt: Koncentracija je jedan od ključnih pokazatelja tržišne strukture. Broj proizvođača i tržište distribucije među firmama različitih veličina se mogu ispitivati pomoću indeksa koncentracije. U ovom radu je korišćen odnos koncentracije, Herfindal- Hiršman indeks, Hal-Tiedman indeks, sveobuhvatni indeks industrijske koncentracije, entropija i Hana-Kej indeks tokom 1996.,
1 Sistan and Baluchestan University, Iran, [email protected] 2 University of Shiraz, Iran 3 This article is taken from the master's thesis "Survey Market Structure and Evaluation
political preferences Function (PPF) in Iran's auto industry".
Kazemzadeh E., Sheikh Zeinoddin A.: Sales Concentration Index in the Iranian Car...
130 Industrija, Vol.43, No.4, 2015
2011., 2006. i 2011. godine. Glavni cilj ovog istraživanja je merenje koncentracije na iranskom tržištu automobila i prikaz promena tokom perioda 1996-2011.godine. Rezultati su pokazali visoku koncentraciju u iranskoj automobilskoj industriji. Čak i sa pojavom novih firmi u iranskoj automobilskoj industriji i povećanjem ukupne proizvodnje, došlo je do stalne koncentracije u automobilskoj industriji.
Ključne reči: struktura tržišta, Herfindal, automobili, tržišna koncentracija, iranska automobilska insdustrija, Hall-Tiedman
1. Introduction
The automotive industry is one of the most important industries creating added value in the economy of any country. Due to the former and latter loops and extensive supply chain, the automotive industry is considered as a strategic mother industry in some countries. This industry has a great potential for job creation and plays effective role in the economic, social and cultural developments. Iran's automotive industry has experienced important periods from the beginning to now. During the first period from 1957 to 1980, the focus was on car assembling by the private sectors with the collaboration of foreign companies. During the second period from 1980 to 1990, the car industry was suffering from a severe recession because of Islamic revolution and war and its complications. The third period from 1990 to 2005 was associated with development of car industry with the import substitution strategy. At this time, self-sufficiency and increased domestic production were followed so that other issues such as quality, fuel economy, emissions, and even price were somewhat neglected. During the fourth period from 2005 to 2011, car production capacity reached one million cars in 2005 and Iran was known as an automaker in the world. This trend continued until 2011 and the car production capacity reached over one million and six hundred thousand cars and Iran obtained the thirteenth place in terms of production growth in the world. But various problems and failure of some new vehicles on the market, the shock caused by discontinued Peikan production in Iran Khodro, domestic inflation and fluctuations in the provision of banking facilities, sanctions and privatization problems in various industries in this period played an important role in reducing car production in Iran.
Automotive industry includes a major part of economic activities and is linked to other sections of the economy. In many countries, the development of automotive industry has received much attention as a best ways to reach fast
Kazemzadeh E., Sheikh Zeinoddin A.: Sales Concentration Index in the Iranian Car...
Industrija, Vol.43, No.4, 2015 131
industrial growth due to its broad scope and chains. The existence and survival of this industry can be one of the most important means of achieving the desired goals due to its wide economic effects such as the relatively high potential to create jobs and value added and in some cases the leading role in the economic development of countries. Today, most developing countries are trying to have a greater presence in the automotive industry using manufacturing facilities and resources. Iran is among the countries took various measures in the automotive industry during recent years (Esmailnia, 1996, 67-68).
Due to the critical role of the automotive industry in the economic growth, the present paper examines the background of the market structure reviewing domestic and international studies. According to theoretical backgrounds, the structure of the automotive market is evaluated to determine the degree of monopoly or market competition. For this purpose, the concentration ratio, Herfindahl-Hirschman index, Hall-Tiedman index, comprehensive industrial concentration index, Hannah-Kay index and entropy are used to evaluate the market structure. The experimental results are presented and then concluding remarks are provided.
2. Literature review
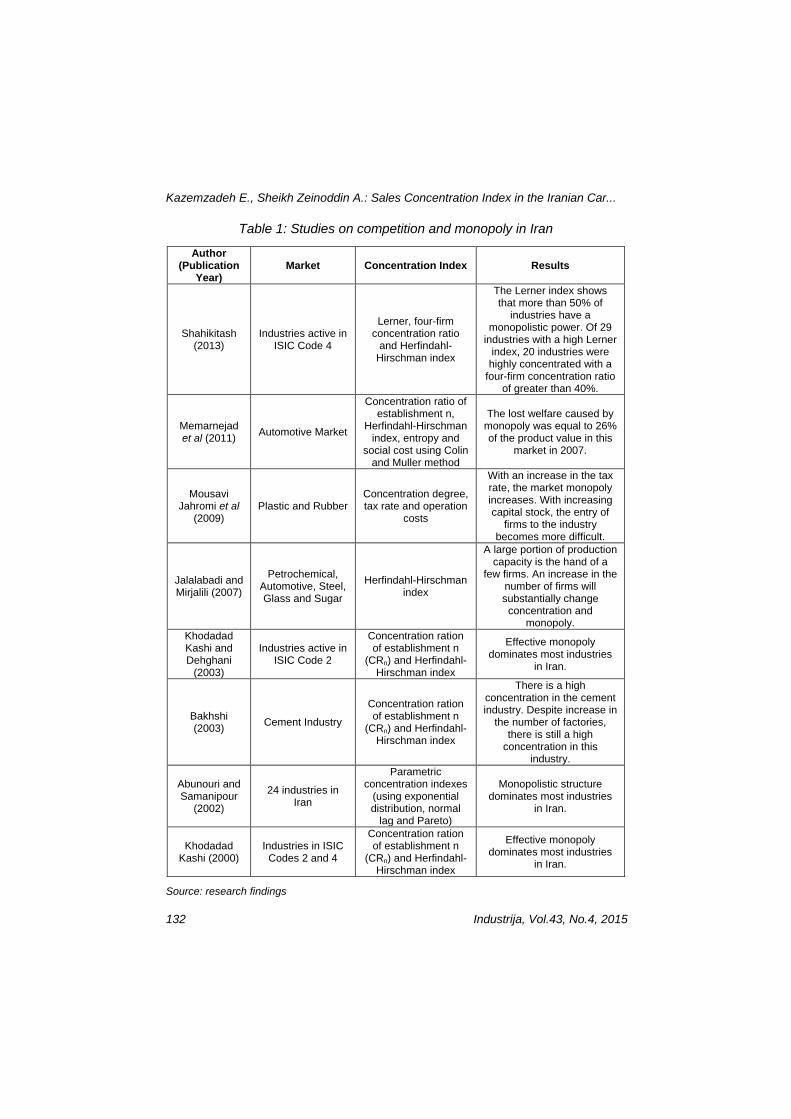
There are numerous studies on monopoly power, the degree of competition and monopoly in the markets and determination of market structure. There are substantial applied studies on the structure of markets and measuring the degree of competition and monopoly in Iran. Some domestic studies were conducted by Khodadad Kashi (2000), Abu Nouri and Samani (2002), Bakhshi (2003), Khodadad Kashi and Dehghani (2003), Jalalabadi and Mirjalili (2007), Mousavi Jahromi et al (2009), Memarnejad et al (200), Shahikitash (2013). The following table summarizes the domestic studies on the market structure.
Many economists proposed indicators and criteria to calculate the degree of competition. Here, we review some applied research.
Kazemzadeh E., Sheikh Zeinoddin A.: Sales Concentration Index in the Iranian Car...
132 Industrija, Vol.43, No.4, 2015
Table 1: Studies on competition and monopoly in Iran
Results Concentration Index Market Author
(Publication Year)
The Lerner index shows that more than 50% of
industries have a monopolistic power. Of 29
industries with a high Lerner index, 20 industries were highly concentrated with a
four-firm concentration ratio of greater than 40%.
Lerner, four-firm concentration ratio
and Herfindahl-Hirschman index
Industries active in ISIC Code 4
Shahikitash (2013)
The lost welfare caused by monopoly was equal to 26% of the product value in this
market in 2007.
Concentration ratio of establishment n,
Herfindahl-Hirschman index, entropy and
social cost using Colin and Muller method
Automotive Market Memarnejad et al (2011)
With an increase in the tax rate, the market monopoly increases. With increasing capital stock, the entry of
firms to the industry becomes more difficult.
Concentration degree, tax rate and operation
costs Plastic and Rubber
Mousavi Jahromi et al
(2009)
A large portion of production capacity is the hand of a
few firms. An increase in the number of firms will substantially change concentration and
monopoly.
Herfindahl-Hirschman index
Petrochemical, Automotive, Steel, Glass and Sugar
Jalalabadi and Mirjalili (2007)
Effective monopoly dominates most industries
in Iran.
Concentration ration of establishment n
(CRn) and Herfindahl-Hirschman index
Industries active in ISIC Code 2
Khodadad Kashi and Dehghani
(2003) There is a high
concentration in the cement industry. Despite increase in
the number of factories, there is still a high
concentration in this industry.
Concentration ration of establishment n
(CRn) and Herfindahl-Hirschman index
Cement Industry Bakhshi (2003)
Monopolistic structure dominates most industries
in Iran.
Parametric concentration indexes
(using exponential distribution, normal
lag and Pareto)
24 industries in Iran
Abunouri and Samanipour
(2002)
Effective monopoly dominates most industries
in Iran.
Concentration ration of establishment n
(CRn) and Herfindahl-Hirschman index
Industries in ISIC Codes 2 and 4
Khodadad Kashi (2000)
Source: research findings
Kazemzadeh E., Sheikh Zeinoddin A.: Sales Concentration Index in the Iranian Car...
Industrija, Vol.43, No.4, 2015 133
Miljković et al (2013) examined the market concentration in the banking sector of Serbia using the interaction parameters, concentration ratio of establishment k, Gini coefficient and Herfindahl-Hirschman index. The experimental results include property concentration, assets, loans, deposits, interest income and profit (loss) before tax, and comparative analysis with other countries in Central, Eastern and Southern Europe.
Kramaric and Tomislava (2012) analyzed the market structure and degree of concentration in the insurance market in the new EU member states using concentration ratio of establishment k, Herfindahl- Hirschman index and entropy. The results showed that the concentration level in all countries was significantly reduced with different intensities. However, a very high level of concentration remained in some countries.
Macit (2012) examined the concentration and competition in the Turkish banking sector during 2005 to 2010 using empirical evidence, concentration ratio of establishment k and Herfindahl- Hirschman index. According to Macit, the degree of concentration did to not show a significant change since 2005 so that monopolistic competition and the degree of competition declined in the Turkish banking sector during the study period.
Sharma and Bal (2010) examined the market concentration in the Indian banking sector using concentration ratio of establishment k, Herfindahl-Hirschman index, entropy, comprehensive industrial concentration index and Gini coefficient. The results showed that various concentration ratios decreased over the study period reflecting the higher degree of competition in India.
Claessens and Djankov (1999) examined privatization plans in Czech Republic. The sample consisted of 706 firms in the Czech Republic from 1992 to 1997. They found that when property concentration increases, firm profitability and productive power of labor will increase.
Feeny and Rogers (1999) conducted a study entitled "market share-concentration and diversity in firm profitability" to evaluate the performance of Australian firms. They empirically analyzed the profitability of 722 large Australian firms during 1993-1996. According to Feeny et al, the industry concentration index (CR4) has a positive impact on profitability.
Irandoust (1999) empirically examined the impact of foreign competition on the market structure and barriers to entry in business performance in the
Kazemzadeh E., Sheikh Zeinoddin A.: Sales Concentration Index in the Iranian Car...
134 Industrija, Vol.43, No.4, 2015
automotive industry. The results showed that in most countries, the market share of exporters is dependent on the relative costs of labor, differences in income levels and differences in market structure.
The results of various studies show that more than three concentration indexes (concentration ratio, Herfindahl- Hirschman and entropy) have been used to identify the market structure.
3. Methodology
The market concentration is distribution of market between different firms. In other words, market concentration implies how much of the total production in the market for a given product is assigned to the limited number of large firms. To measure the concentration in a market or a particular industry, the number of firms and their relative size should be considered. An industry with fewer firms is more concentrated. In contrast, the degree of concentration will be higher when the market is not uniformly distributed between the firms. In fact, concentration is a direct function of market distribution inequality (I) and a decreasing function of the number of firms (n), i.e. c = f (I, n) (Khodadad Kashi, 2000, 85).
The present paper examines the absolute concentration in the Iranian car market in 1996, 2001, 2006 and 2011 using concentration ratio of establishment k, Herfindahl- Hirschman index, Hall-Tiedman index, comprehensive industrial concentration index, Hanna-Kay and entropy.
3.1. Concentration Ratio of Establishment k
Due to simplicity and limited data requirements to calculate the concentration ratio of establishment k, it is one of the most widely used indexes for concentration calculations. To calculate this index, the sum of the market share of the K largest firms in the market should be calculated.
∑==
k
i ik SCR1 (1)
Where, K is the number of leading firms with the same weight. Even if small firms are active in the market, they are not included in the calculations. There are no specific rules for determining the K value. The concentration ratio can
Kazemzadeh E., Sheikh Zeinoddin A.: Sales Concentration Index in the Iranian Car...
Industrija, Vol.43, No.4, 2015 135
be regarded as a point on the concentration curve. The index ranges between zero (equal to the number of many firms) and one (the percentage share of a firm).
3.2. Herfindahl-Hirschman Index (HHI)
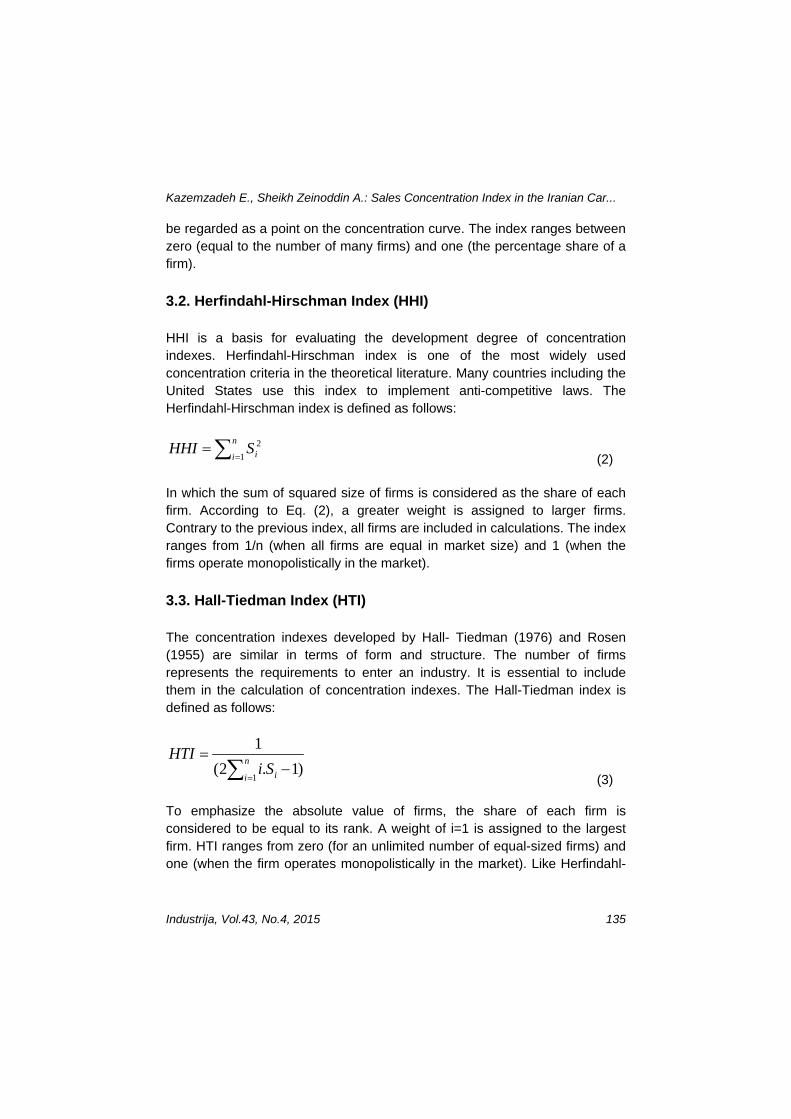
HHI is a basis for evaluating the development degree of concentration indexes. Herfindahl-Hirschman index is one of the most widely used concentration criteria in the theoretical literature. Many countries including the United States use this index to implement anti-competitive laws. The Herfindahl-Hirschman index is defined as follows:
∑==
n
i iSHHI1
2
(2)
In which the sum of squared size of firms is considered as the share of each firm. According to Eq. (2), a greater weight is assigned to larger firms. Contrary to the previous index, all firms are included in calculations. The index ranges from 1/n (when all firms are equal in market size) and 1 (when the firms operate monopolistically in the market).
3.3. Hall-Tiedman Index (HTI)
The concentration indexes developed by Hall- Tiedman (1976) and Rosen (1955) are similar in terms of form and structure. The number of firms represents the requirements to enter an industry. It is essential to include them in the calculation of concentration indexes. The Hall-Tiedman index is defined as follows:
∑=−
= n
i iSiHTI
1)1.2(
1
(3)
To emphasize the absolute value of firms, the share of each firm is considered to be equal to its rank. A weight of i=1 is assigned to the largest firm. HTI ranges from zero (for an unlimited number of equal-sized firms) and one (when the firm operates monopolistically in the market). Like Herfindahl-
Kazemzadeh E., Sheikh Zeinoddin A.: Sales Concentration Index in the Iranian Car...
136 Industrija, Vol.43, No.4, 2015
Hirschman index, the Hall-Tiedman index is equal to 1/n for an industry with n equal-sized firms.
3.4. Comprehensive Industrial Concentration Index (CCI)
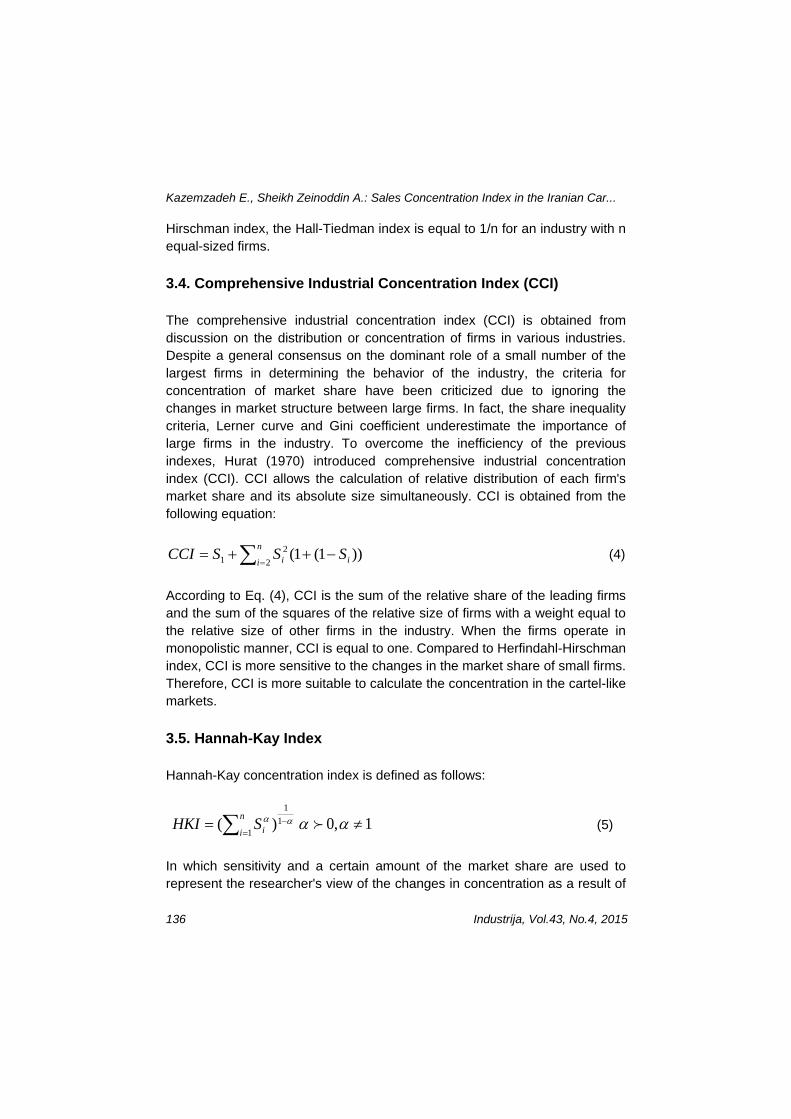
The comprehensive industrial concentration index (CCI) is obtained from discussion on the distribution or concentration of firms in various industries. Despite a general consensus on the dominant role of a small number of the largest firms in determining the behavior of the industry, the criteria for concentration of market share have been criticized due to ignoring the changes in market structure between large firms. In fact, the share inequality criteria, Lerner curve and Gini coefficient underestimate the importance of large firms in the industry. To overcome the inefficiency of the previous indexes, Hurat (1970) introduced comprehensive industrial concentration index (CCI). CCI allows the calculation of relative distribution of each firm's market share and its absolute size simultaneously. CCI is obtained from the following equation:
))1(1(2
21 i
n
i i SSSCCI −++= ∑ = (4)
According to Eq. (4), CCI is the sum of the relative share of the leading firms and the sum of the squares of the relative size of firms with a weight equal to the relative size of other firms in the industry. When the firms operate in monopolistic manner, CCI is equal to one. Compared to Herfindahl-Hirschman index, CCI is more sensitive to the changes in the market share of small firms. Therefore, CCI is more suitable to calculate the concentration in the cartel-like markets.
3.5. Hannah-Kay Index
Hannah-Kay concentration index is defined as follows:
αα −=∑= 1
1
1)( n
i iSHKI 1,0 ≠αα (5)
In which sensitivity and a certain amount of the market share are used to represent the researcher's view of the changes in concentration as a result of
Kazemzadeh E., Sheikh Zeinoddin A.: Sales Concentration Index in the Iranian Car...
Industrija, Vol.43, No.4, 2015 137
the entry and exit of firms and the contribution of facilities among different companies in the target market. The proper selection of α facilitates the selection of proper market structure to emphasize the upper and lower tails of the distribution of firm size. In addition to the distribution of firms in the market, the index is also sensitive to α. If α approaches zero, the index will be equal to the number of firms in the industry. If α approaches infinity, then HKI will converge to the market share of the largest firms. Hannah and Kay (1977) showed that the entry of a firm with a size equal to the effective average size of existing firm results in the greatest drop in the concentration index. With the entry of firms with a size larger than the effective average size of the firms in the industry, the percent reduction in the concentration index becomes smaller. The development of firms with a size larger than the effective average size will increase HKI. In contrast, the development of firms with a size smaller than the effective average size will decrease HKI.
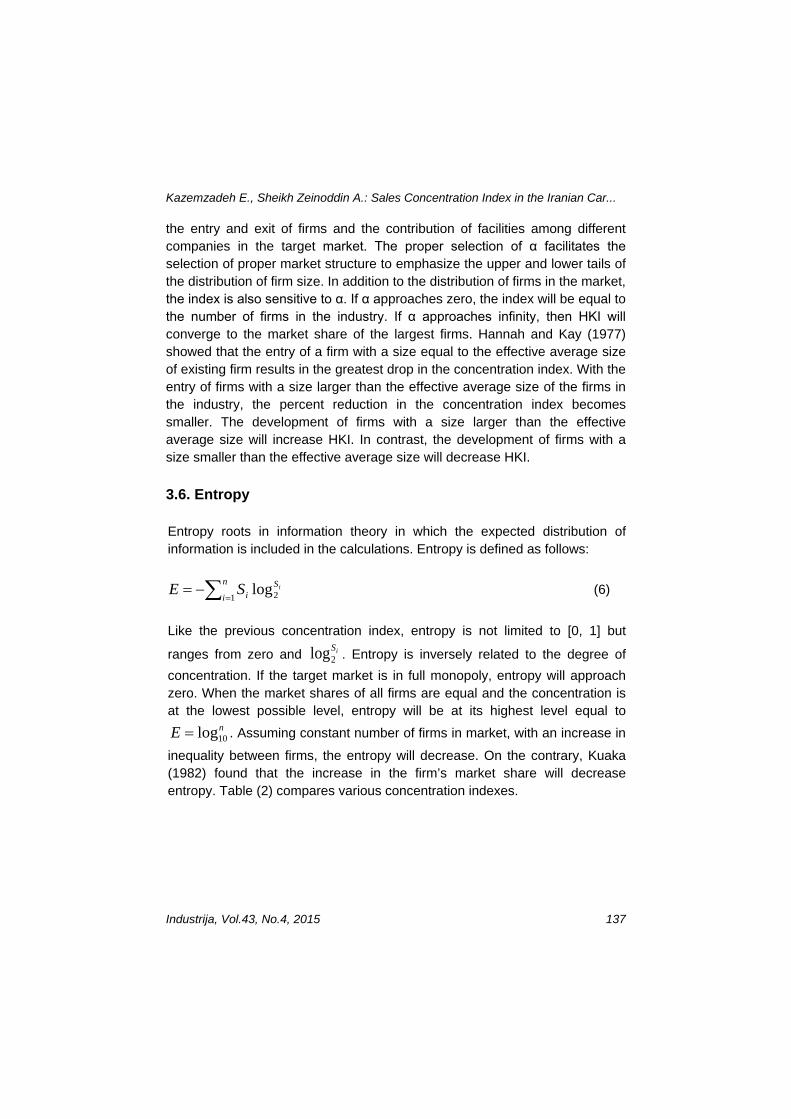
3.6. Entropy
Entropy roots in information theory in which the expected distribution of information is included in the calculations. Entropy is defined as follows:
∑=−=
n
iS
iiSE
1 2log (6)
Like the previous concentration index, entropy is not limited to [0, 1] but
ranges from zero and iS2log . Entropy is inversely related to the degree of
concentration. If the target market is in full monopoly, entropy will approach zero. When the market shares of all firms are equal and the concentration is at the lowest possible level, entropy will be at its highest level equal to
nE 10log= . Assuming constant number of firms in market, with an increase in
inequality between firms, the entropy will decrease. On the contrary, Kuaka (1982) found that the increase in the firm’s market share will decrease entropy. Table (2) compares various concentration indexes.
Kazemzadeh E., Sheikh Zeinoddin A.: Sales Concentration Index in the Iranian Car...
138 Industrija, Vol.43, No.4, 2015
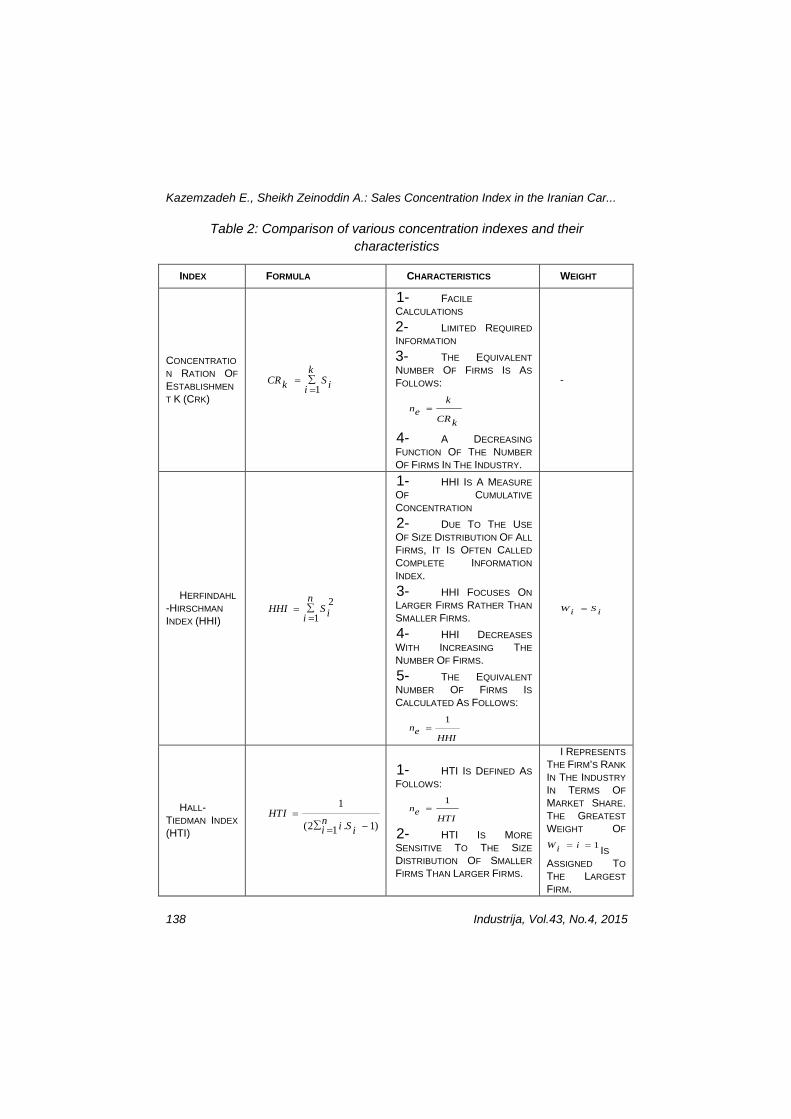
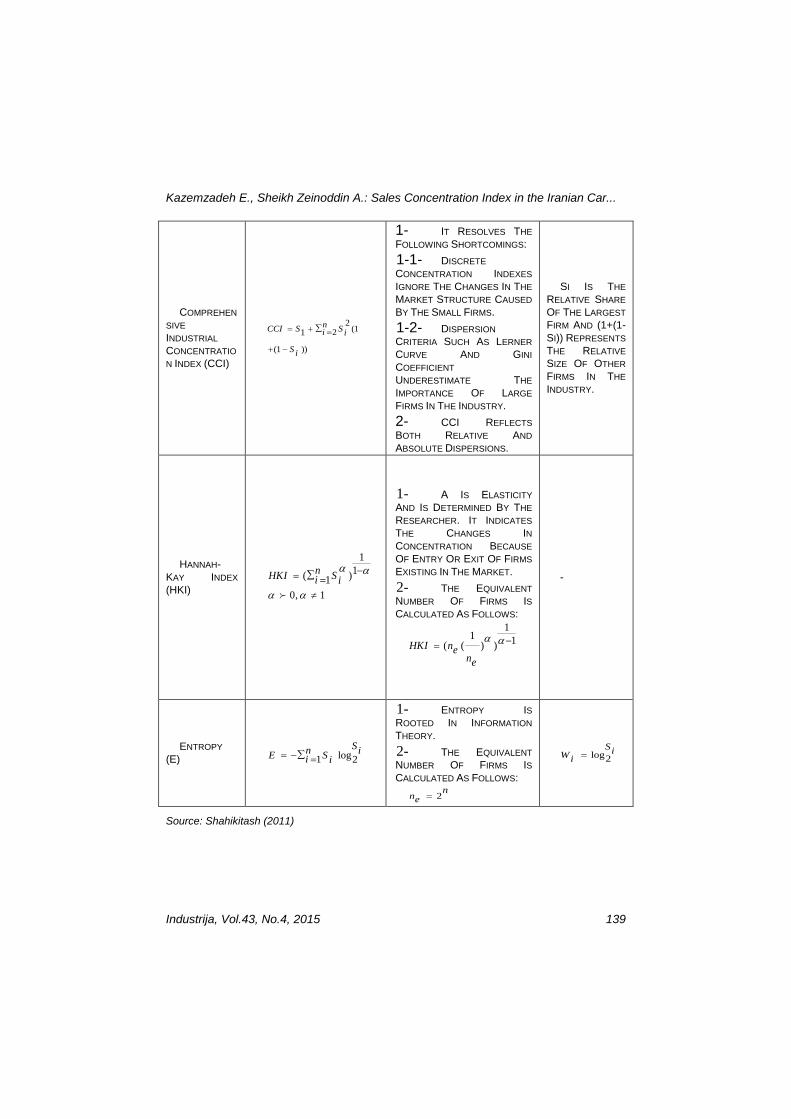
Table 2: Comparison of various concentration indexes and their characteristics
WEIGHT CHARACTERISTICS FORMULA INDEX
-
1- FACILE CALCULATIONS 2- LIMITED REQUIRED INFORMATION 3- THE EQUIVALENT NUMBER OF FIRMS IS AS FOLLOWS:
kne
CRk=
4- A DECREASING FUNCTION OF THE NUMBER OF FIRMS IN THE INDUSTRY.
1
kCR Sk ii
∑==
CONCENTRATION RATION OF ESTABLISHMENT K (CRK)
W Si i=
1- HHI IS A MEASURE OF CUMULATIVE CONCENTRATION 2- DUE TO THE USE OF SIZE DISTRIBUTION OF ALL FIRMS, IT IS OFTEN CALLED COMPLETE INFORMATION INDEX. 3- HHI FOCUSES ON LARGER FIRMS RATHER THAN SMALLER FIRMS. 4- HHI DECREASES WITH INCREASING THE NUMBER OF FIRMS. 5- THE EQUIVALENT NUMBER OF FIRMS IS CALCULATED AS FOLLOWS:
1ne
HHI=
21
nHHI S ii
∑==
HERFINDAHL
-HIRSCHMAN INDEX (HHI)
I REPRESENTS THE FIRM’S RANK IN THE INDUSTRY IN TERMS OF MARKET SHARE. THE GREATEST WEIGHT OF
1W ii = = IS ASSIGNED TO THE LARGEST FIRM.
1- HTI IS DEFINED AS FOLLOWS:
1ne
HTI=
2- HTI IS MORE SENSITIVE TO THE SIZE DISTRIBUTION OF SMALLER FIRMS THAN LARGER FIRMS.
1
(2 . 1)1HTI
n i Si i=
∑ −=
HALL-TIEDMAN INDEX (HTI)
Kazemzadeh E., Sheikh Zeinoddin A.: Sales Concentration Index in the Iranian Car...
Industrija, Vol.43, No.4, 2015 139
SI IS THE RELATIVE SHARE OF THE LARGEST FIRM AND (1+(1-SI)) REPRESENTS THE RELATIVE SIZE OF OTHER FIRMS IN THE INDUSTRY.
1- IT RESOLVES THE FOLLOWING SHORTCOMINGS: 1-1- DISCRETE CONCENTRATION INDEXES IGNORE THE CHANGES IN THE MARKET STRUCTURE CAUSED BY THE SMALL FIRMS. 1-2- DISPERSION CRITERIA SUCH AS LERNER CURVE AND GINI COEFFICIENT UNDERESTIMATE THE IMPORTANCE OF LARGE FIRMS IN THE INDUSTRY. 2- CCI REFLECTS BOTH RELATIVE AND ABSOLUTE DISPERSIONS.
2(121
(1 ))
nCCI S Si i
S i
∑= + =
+ −
COMPREHENSIVE INDUSTRIAL CONCENTRATION INDEX (CCI)
-
1- Α IS ELASTICITY AND IS DETERMINED BY THE RESEARCHER. IT INDICATES THE CHANGES IN CONCENTRATION BECAUSE OF ENTRY OR EXIT OF FIRMS EXISTING IN THE MARKET. 2- THE EQUIVALENT NUMBER OF FIRMS IS CALCULATED AS FOLLOWS:
11 1( ( ) )HKI ne
ne
α α−=
11( )1
nHKI Si iα α−∑= =
0, 1α α ≠
HANNAH-KAY INDEX (HKI)
log2SiWi =
1- ENTROPY IS ROOTED IN INFORMATION THEORY. 2- THE EQUIVALENT NUMBER OF FIRMS IS CALCULATED AS FOLLOWS:
2n
ne =
log1 2Sn iE Si i∑= − =
ENTROPY (E)
Source: Shahikitash (2011)

Kazemzadeh E., Sheikh Zeinoddin A.: Sales Concentration Index in the Iranian Car...
140 Industrija, Vol.43, No.4, 2015
4. Results and discussion
The number of active firms in the Iranian automotive industry in 1996 was six firms including Iran Khodro, Bahman Khodro, Pars Khordo, Saipa, Kerman Motors and Morattab. Iran Khodro was the leading firm in the automotive market with a market share of about 70% among other automotive companies. Saipa held the second place with a share of about 20%. The third largest producer of cars was Pars Khordo with a share of about 5.5%. Bahman Khordo was in the fourth place with a share of about 3%. Kerman Motors and Morattab had less than 1% of the automotive market share.
With the advent of Kish Khodro in 2001, the number of firms active in the automotive industry reached 7 companies indicating the entry of the new firms to the market. Despite approximately 3-fold increase in the total production rate of Iran Khodro, its market share decreased by about 8% in 2001 and reached about 62%. But, it was still the largest car seller in Iran. The market share of Saipa reached 27.5% with an increase of more than 7%. Saipa was still the second largest car manufacturer in Iran. The market share of Pars Khordo also declined and reached about 4.5% in 2001. The market share of Bahman Khordo declined and reached about 1.7%. Accordingly, Kerman Motors achieved the fourth place acquiring a market share of 3.7%. The market share of Kish Khodro and Morattab was less than 1%.
Kish Khodro did not manufacture cars in 2006. But with the entry of new firms such as Bam Khodrosazan, Rhine Khodro, Modiran Khodro and Zagros Khodro, the number of car manufacturers increased to 10 firms in 2006. The total automotive production experienced a 3-fold increase in 2006 as compared with 2001. Despite this, the market share of Iran Khodro decreased by 11% and reached 41% in 2006. However, Iran Khodro remained the largest automotive seller in Iran. The market share of Saipa as the second car manufacturer increased more than 12% and reached 40%. The market share of Pars Khordo experienced an increase of 12% and reached more than 16 % and thus achieved its third rank again. The other car manufacturers had a market share of less than 2% in 2006. This indicates that the entry of new firms was not able to break the monopoly of a few firms.
In 2011, Morattab, Bam Khodro and Zagros Khodro did not manufacture cars. Accordingly, the number of active companies declined to seven firms. With an increase of about 5.1 times in the total car production, the market share of
Kazemzadeh E., Sheikh Zeinoddin A.: Sales Concentration Index in the Iranian Car...
Industrija, Vol.43, No.4, 2015 141
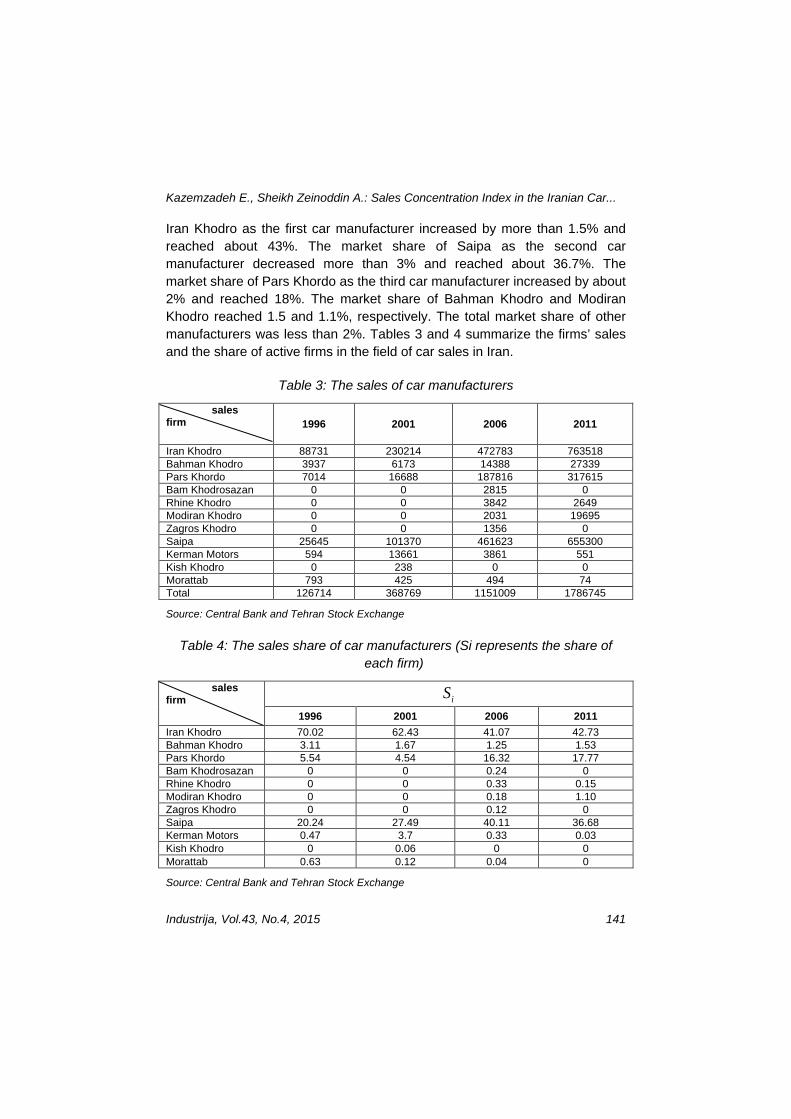
Iran Khodro as the first car manufacturer increased by more than 1.5% and reached about 43%. The market share of Saipa as the second car manufacturer decreased more than 3% and reached about 36.7%. The market share of Pars Khordo as the third car manufacturer increased by about 2% and reached 18%. The market share of Bahman Khodro and Modiran Khodro reached 1.5 and 1.1%, respectively. The total market share of other manufacturers was less than 2%. Tables 3 and 4 summarize the firms’ sales and the share of active firms in the field of car sales in Iran.
Table 3: The sales of car manufacturers
2011 2006 2001 1996 sales
firm
763518 472783 230214 88731 Iran Khodro 27339 14388 6173 3937 Bahman Khodro
317615 187816 16688 7014 Pars Khordo 0 2815 0 0 Bam Khodrosazan
2649 3842 0 0 Rhine Khodro 19695 2031 0 0 Modiran Khodro
0 1356 0 0 Zagros Khodro 655300 461623 101370 25645 Saipa
551 3861 13661 594 Kerman Motors 0 0 238 0 Kish Khodro
74 494 425 793 Morattab 1786745 1151009 368769 126714 Total
Source: Central Bank and Tehran Stock Exchange
Table 4: The sales share of car manufacturers (Si represents the share of each firm)
iS sales firm
2011 2006 2001 1996 42.73 41.07 62.43 70.02 Iran Khodro 1.53 1.25 1.67 3.11 Bahman Khodro
17.77 16.32 4.54 5.54 Pars Khordo 0 0.24 0 0 Bam Khodrosazan
0.15 0.33 0 0 Rhine Khodro 1.10 0.18 0 0 Modiran Khodro
0 0.12 0 0 Zagros Khodro 36.68 40.11 27.49 20.24 Saipa 0.03 0.33 3.7 0.47 Kerman Motors
0 0 0.06 0 Kish Khodro 0 0.04 0.12 0.63 Morattab
Source: Central Bank and Tehran Stock Exchange
Kazemzadeh E., Sheikh Zeinoddin A.: Sales Concentration Index in the Iranian Car...
142 Industrija, Vol.43, No.4, 2015
4.1. Classification of markets
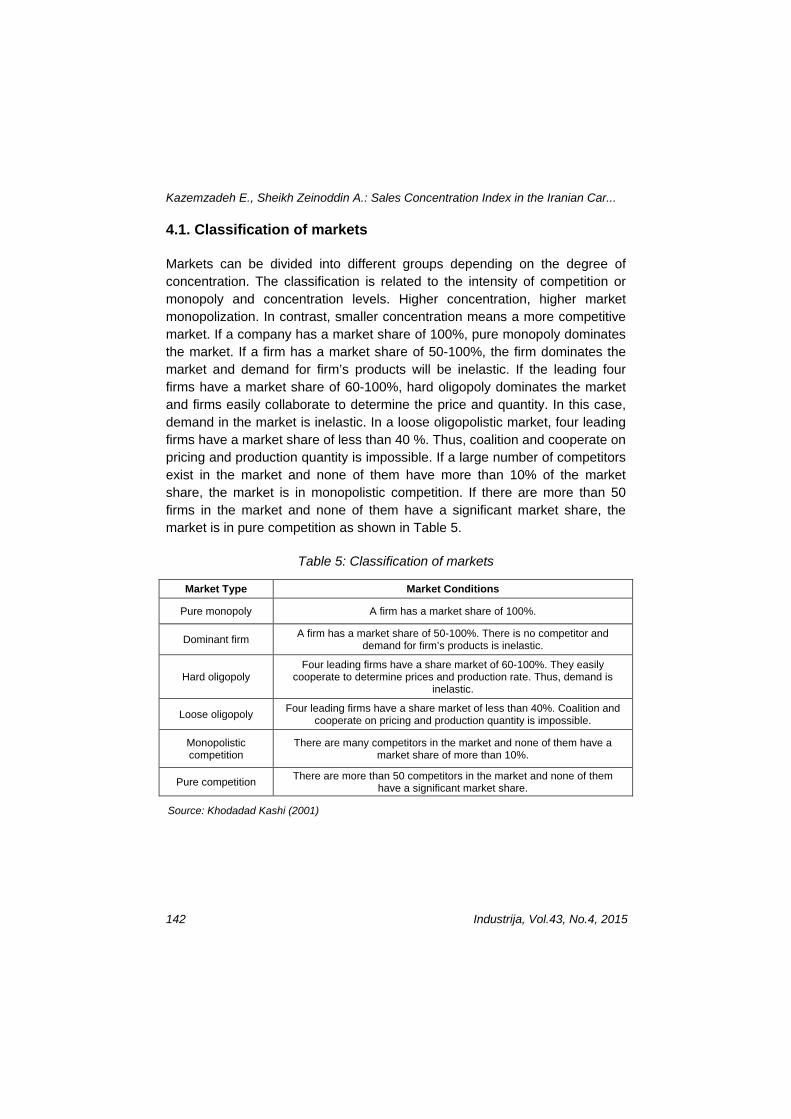
Markets can be divided into different groups depending on the degree of concentration. The classification is related to the intensity of competition or monopoly and concentration levels. Higher concentration, higher market monopolization. In contrast, smaller concentration means a more competitive market. If a company has a market share of 100%, pure monopoly dominates the market. If a firm has a market share of 50-100%, the firm dominates the market and demand for firm’s products will be inelastic. If the leading four firms have a market share of 60-100%, hard oligopoly dominates the market and firms easily collaborate to determine the price and quantity. In this case, demand in the market is inelastic. In a loose oligopolistic market, four leading firms have a market share of less than 40 %. Thus, coalition and cooperate on pricing and production quantity is impossible. If a large number of competitors exist in the market and none of them have more than 10% of the market share, the market is in monopolistic competition. If there are more than 50 firms in the market and none of them have a significant market share, the market is in pure competition as shown in Table 5.
Table 5: Classification of markets
Market Conditions Market Type
A firm has a market share of 100%. Pure monopoly
A firm has a market share of 50-100%. There is no competitor and demand for firm’s products is inelastic. Dominant firm
Four leading firms have a share market of 60-100%. They easily cooperate to determine prices and production rate. Thus, demand is
inelastic. Hard oligopoly
Four leading firms have a share market of less than 40%. Coalition and cooperate on pricing and production quantity is impossible. Loose oligopoly
There are many competitors in the market and none of them have a market share of more than 10%.
Monopolistic competition
There are more than 50 competitors in the market and none of them have a significant market share. Pure competition
Source: Khodadad Kashi (2001)
Kazemzadeh E., Sheikh Zeinoddin A.: Sales Concentration Index in the Iranian Car...
Industrija, Vol.43, No.4, 2015 143
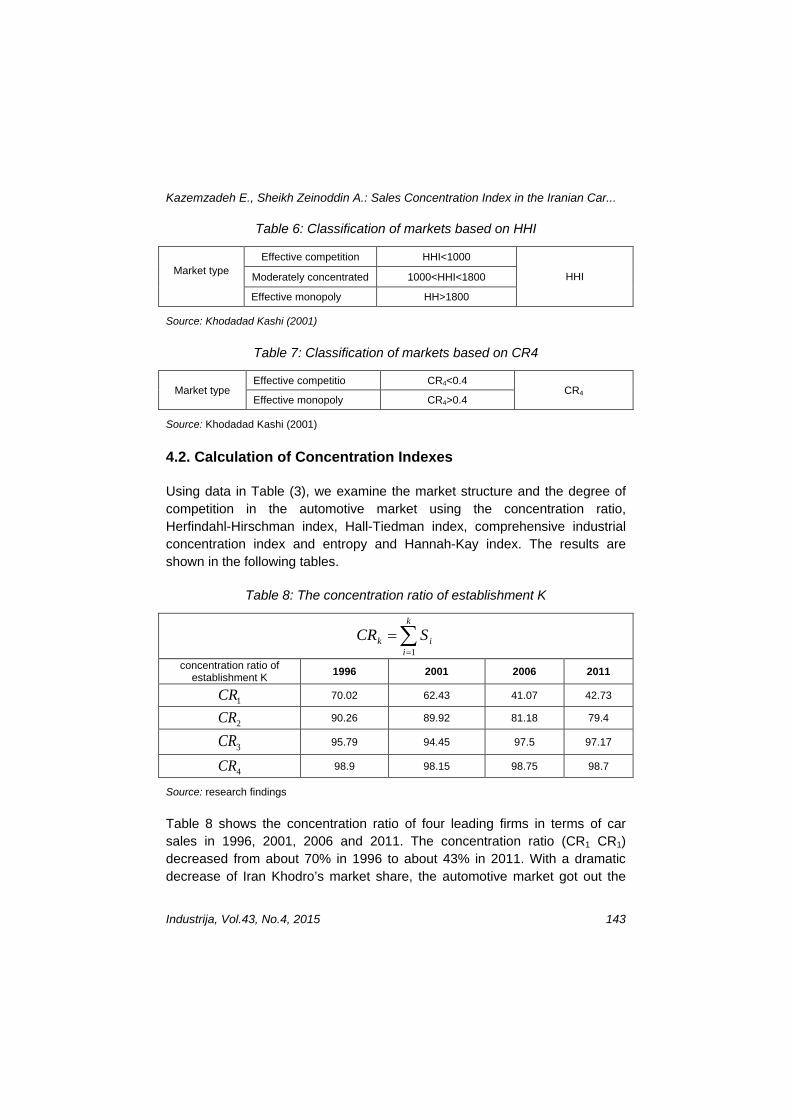
Table 6: Classification of markets based on HHI
HHI
HHI<1000 Effective competition Market type
1000<HHI<1800 Moderately concentrated
HH>1800 Effective monopoly
Source: Khodadad Kashi (2001)
Table 7: Classification of markets based on CR4
CR4 CR4<0.4 Effective competitio
Market type CR4>0.4 Effective monopoly
Source: Khodadad Kashi (2001)
4.2. Calculation of Concentration Indexes
Using data in Table (3), we examine the market structure and the degree of competition in the automotive market using the concentration ratio, Herfindahl-Hirschman index, Hall-Tiedman index, comprehensive industrial concentration index and entropy and Hannah-Kay index. The results are shown in the following tables.
Table 8: The concentration ratio of establishment K
∑=
=k
iik SCR
1
2011 2006 2001 1996 concentration ratio of establishment K
42.73 41.07 62.43 70.02 1CR
79.4 81.18 89.92 90.26 2CR
97.17 97.5 94.45 95.79 3CR
98.7 98.75 98.15 98.9 4CR
Source: research findings
Table 8 shows the concentration ratio of four leading firms in terms of car sales in 1996, 2001, 2006 and 2011. The concentration ratio (CR1 CR1) decreased from about 70% in 1996 to about 43% in 2011. With a dramatic decrease of Iran Khodro’s market share, the automotive market got out the
Kazemzadeh E., Sheikh Zeinoddin A.: Sales Concentration Index in the Iranian Car...
144 Industrija, Vol.43, No.4, 2015
dominant firm status. According to the concentration ratio of two top firms (CR2 CR2) in 1996, Iran Khodro and Saipa had a market share of 90.26% in 1996. This indicates an effective monopoly in the automotive market in 1996.
In 2001, the concentration ratio of two top firms (CR2 CR2) experienced a slight decrease and reached about 89.92%. The concentration ratio of two firms was still high. But the concentration ratio of the four top firms (CR2 CR2) experienced no significant change. With a dramatic reduction of 9% in the concentration ratio of two top firms in 2006, the index reached about 81%. Nonetheless, there was still a high concentration in the automotive market.
The concentration ratio of the two top firms decreased to about 79.4% in 2011, but the concentration was still extremely high. The concentration ratio of four top firms remained constant at about 99% indicating the dramatic decrease in the concentration ratio of two top firms in 2011. Although the market remained highly concentrated in effective monopoly status, the concentration ratio of four top firms (CR4 CR4) showed small fluctuations around 99%. Accordingly, the concentration ratio of the four top firms did not change significantly during the study period. Given the concentration ratio of more than 60%, there is a hard oligopolistic market and firms can easily determine the price and production quantity.
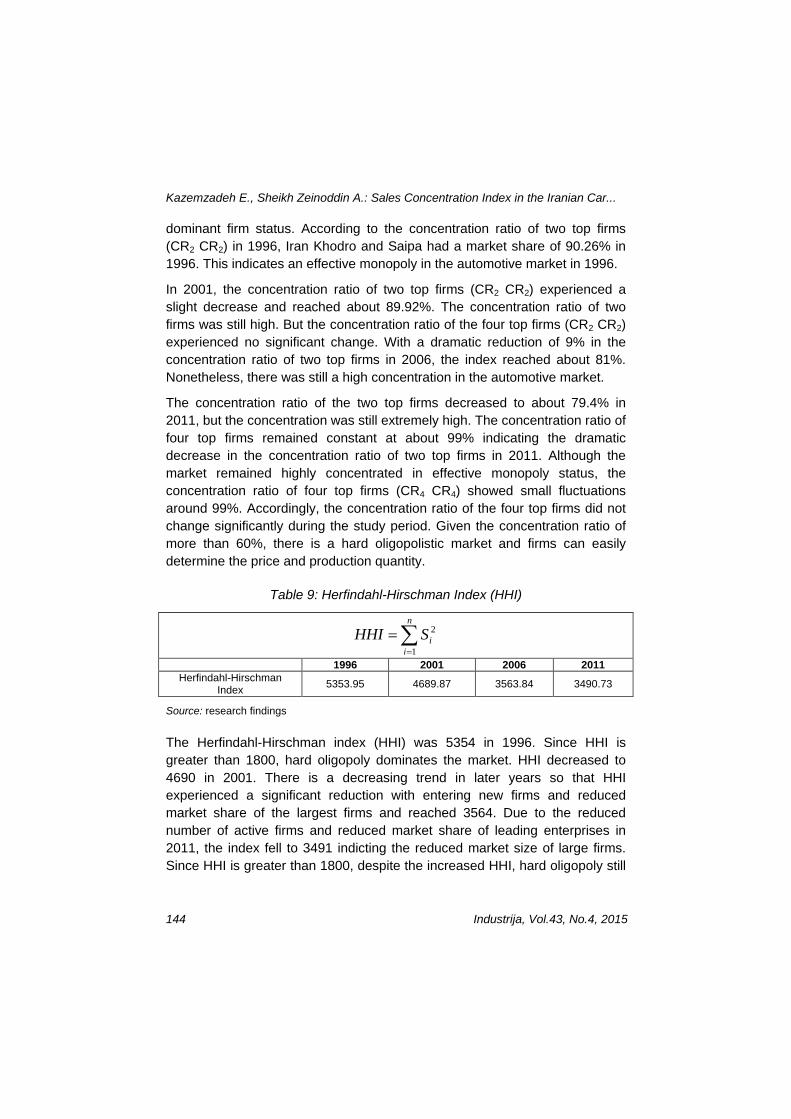
Table 9: Herfindahl-Hirschman Index (HHI)
∑=
=n
iiSHHI
1
2
2011 2006 2001 1996
3490.73 3563.84 4689.87 5353.95 Herfindahl-Hirschman Index
Source: research findings
The Herfindahl-Hirschman index (HHI) was 5354 in 1996. Since HHI is greater than 1800, hard oligopoly dominates the market. HHI decreased to 4690 in 2001. There is a decreasing trend in later years so that HHI experienced a significant reduction with entering new firms and reduced market share of the largest firms and reached 3564. Due to the reduced number of active firms and reduced market share of leading enterprises in 2011, the index fell to 3491 indicting the reduced market size of large firms. Since HHI is greater than 1800, despite the increased HHI, hard oligopoly still

Kazemzadeh E., Sheikh Zeinoddin A.: Sales Concentration Index in the Iranian Car...
Industrija, Vol.43, No.4, 2015 145
dominates the market. To get out of an effective monopoly status, HHI should be further reduced.
Table 10: Hall-Tiedman Index (HTI)
1(2 . 1)1
HTI n i Si i=
−∑ =
2011 2006 2001 1996 0.378 0374 0475 0523 Hall-Tiedman Index
Source: research findings
Hall-Tiedman Index (HTI) ranges from zero (for an unlimited number of equal-sized firms) to one (when the firm operates monopolistically in the market). HTI for the automotive market was approximately 0.52 in 1996 and reduced 0.47 in 2001. The decline continued in 2006 and HTI reached 0.37. HTI experienced a slight increase and reached 0.38 in 2011. Since HTI is more sensitive to smaller firms, the reductions in HTI indicate the reduced monopoly in larger firms and increased market share of small firms. Considering high HTI value, despite decline in HTI, the market is still monopolistic and a high degree of concentration dominates the market.
Table 11: Comprehensive industrial concentration index (CCI)
))1(1(2
21 i
n
i i SSSCCI −++= ∑ =
2011 2006 2001 1996
0.705 0.717 0.762 0.781 Comprehensive industrial concentration index
Source: research findings
Compared with Herfindahl- Hirschman index, CCI is more sensitive to the changes in the market share of small firms. CCI ranges from zero to one. The comprehensive industrial concentration for automotive market in 1996 was about 0.78. CCI was equal to 0.76, 0.72 and 0.70 in 2001, 2006 and 2011, respectively. The decline in CCI during the study period shows reduced monopoly in the market. But there is still a high monopoly in the automotive market. CCI shows a higher degree of monopoly as compared with Herfindahl-Hirschman index.
Kazemzadeh E., Sheikh Zeinoddin A.: Sales Concentration Index in the Iranian Car...
146 Industrija, Vol.43, No.4, 2015
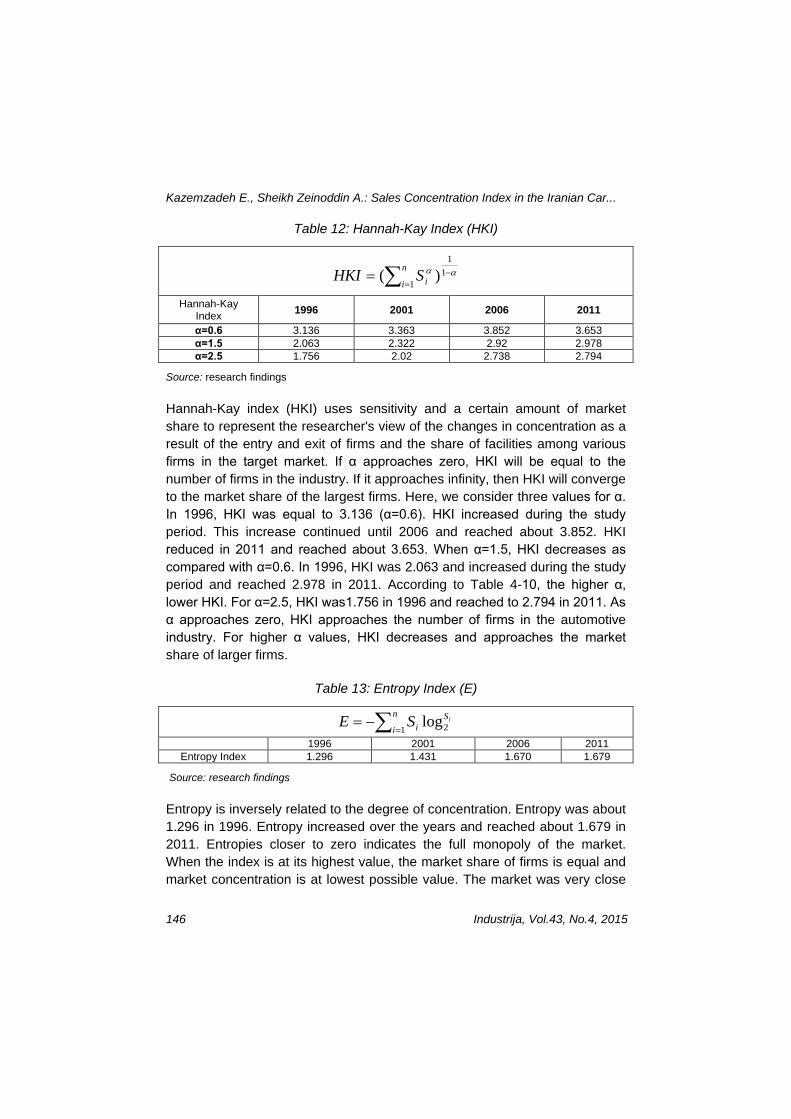
Table 12: Hannah-Kay Index (HKI)
αα −=∑= 1
1
1)( n
i iSHKI
2011 2006 2001 1996 Hannah-Kay Index
3.653 3.852 3.363 3.136 α=0.6 2.978 2.92 2.322 2.063 α=1.5 2.794 2.738 2.02 1.756 α=2.5
Source: research findings
Hannah-Kay index (HKI) uses sensitivity and a certain amount of market share to represent the researcher's view of the changes in concentration as a result of the entry and exit of firms and the share of facilities among various firms in the target market. If α approaches zero, HKI will be equal to the number of firms in the industry. If it approaches infinity, then HKI will converge to the market share of the largest firms. Here, we consider three values for α. In 1996, HKI was equal to 3.136 (α=0.6). HKI increased during the study period. This increase continued until 2006 and reached about 3.852. HKI reduced in 2011 and reached about 3.653. When α=1.5, HKI decreases as compared with α=0.6. In 1996, HKI was 2.063 and increased during the study period and reached 2.978 in 2011. According to Table 4-10, the higher α, lower HKI. For α=2.5, HKI was1.756 in 1996 and reached to 2.794 in 2011. As α approaches zero, HKI approaches the number of firms in the automotive industry. For higher α values, HKI decreases and approaches the market share of larger firms.
Table 13: Entropy Index (E)
∑=−=
n
iS
iiSE
1 2log
2011 2006 2001 1996 1.679 1.670 1.431 1.296 Entropy Index
Source: research findings
Entropy is inversely related to the degree of concentration. Entropy was about 1.296 in 1996. Entropy increased over the years and reached about 1.679 in 2011. Entropies closer to zero indicates the full monopoly of the market. When the index is at its highest value, the market share of firms is equal and market concentration is at lowest possible value. The market was very close
Kazemzadeh E., Sheikh Zeinoddin A.: Sales Concentration Index in the Iranian Car...
Industrija, Vol.43, No.4, 2015 147
to full monopoly in 1996. Monopoly was reduced over the years and thus the degree of concentration in the market reduced. But there is still a high concentration in the automotive market.
5. Conclusions
The present study examined the degree of concentration in the Iranian car market according to the company's sales in 1996, 2001, 2006 and 2011 using concentration ratio, Herfindahl-Hirschman, Hall-Tiedman, comprehensive industrial concentration index, entropy and Hannah-Kay index. Results of average periods showed that: According to the concentration ratio of the four top firms, they had a market share of about 99% during the study period. This shows a hard oligopolistic market. The concentration ratio was not significantly changed during the study period. Herfindahl-Hirschman index with a mean value of 4275 was greater than 1800 during the study period. It can be concluded that an oligopolistic structure dominates the automotive industry. The average index of Hall-Tiedman, industrial concentration comprehensive, Hannah-Kay and Entropy is 0.437, 0.741, 2.33 and 1.52, respectively; that all of them showed that there is effective monopoly in this market. Accordingly, firms are able to fix desired prices through alliances and partnerships to overcome inelastic demand. According to Hall-Tiedman index, comprehensive industrial concentration index and entropy, although calculations show a reduction of concentration inequalities among car manufacturers during the study period, the numerical values of these indexes indicate a very high concentration in the market. Finally, it can be concluded that the automotive market in Iran is highly concentrated. The main reasons for market monopoly include government support of automakers, heavily tariffs on imported vehicles and duties on imports of automotive parts. This would result in a lack of competition in the automotive market. In the following is mentioned some policy suggestions:
1- The result of concentration index showed that average of concentration coefficient and Herfindahl-Hirschman index in this industry is 99 and 4275 respectively. Therefore recommended that National Center of Competition, follow appropriate pattern for reducing the monopoly coefficient and barriers of entry to this industry.
2- The findings of this study showed that competition coefficient in auto-industry of Iran is little and lack of competition leads to technical
Kazemzadeh E., Sheikh Zeinoddin A.: Sales Concentration Index in the Iranian Car...
148 Industrija, Vol.43, No.4, 2015
inefficiency and increasing price of manufactured outputs. So, suggested that reduce tariffs to increase competition in this market with foreign firms. It should be noted that this requires comprehensive program of 5 to 10 years old.
3- Macro-investment in establishment training and research centers and use of experts “in fields of technical and management tasks” are very effective in long run.
4- Integration of auto-industry; which requires the firms be in same level based on financial situation of the clients and predominate in decision making and implementation. Although integration, leading to reducing cost of research and extension of sale market, but by creating the necessary measures and use the tariff tool by government, we can provide competitive space and will prevent from immethodical import and production of poor-quality cars in the our country.
References
Abunouri, E., & Samanipour, H. (2002). Parametric estimation of the concentration ratio of industries in Iran. Journal of Commerce, 22, 91-128.
Bakhshi, L. (2003). The concentration in the cement industry in Iran. Journal of Business Research, 26, 75- 96.
Claessens, S., & Djankov, s. (1999). Ownership Concentration and Corporate Performance in the Czech Republic. Journal of Comparative Economics, Vol. 27(3), 498- 513.
Esmailnia, A.A. (1996). Evaluation of the car market in Iran. Planning and Finance, 8, 67-92.
Feeny, S., & Rogers, M. (1999). Market Share, Concentration and Diversification in Firm Profitability. (pp. 20- 29). Melbourne: The university of Melbourne.
Irandoust, M. (1999). Market structure and market shares in the car industry. Japan and the World Economy, 11(4), 531- 544.
Jalalabadi, A., & Mirjalili, F. (2007). Monopoly and concentration in Iran's industries: Case Study: Some industries 2000-2005, Journal of Economic Research, 7, 197-232.
Khodadad Kashi, F., &Dehghani, A. (2005). Advertising and concentration in industrial markets in Iran. Economics and Management, 27, 32-51.
Khodadad Kashi, F. (2000). Monopoly, competition and concentration in industrial markets in Iran (1988-1994). Journal of Business Research, 15, 83-116.
Khodadad Kashi, F. (1998). Market Structure and Performance Theory and Its Applications in Industry in Iran. 3rd ed. Tehran: Institute of Business Studies and Research.
Memarnejad, A., Hosseini, S., & Khatabi, S. (2011). The structure and performance of car market in Iran. Journal of Economic Modeling, 4, 103-120.
Kazemzadeh E., Sheikh Zeinoddin A.: Sales Concentration Index in the Iranian Car...
Industrija, Vol.43, No.4, 2015 149
Mousavi Jahromi, Y., Khodadad Kashi, F., & Zeyarati, M. (2009). The relationship between the degree of market concentration and the effective tax rate on corporate, Case Study: rubber and plastic industries (1995-2005). Tax Journal, 7, 85-100.
Macit, F. (2012). Recent evidence on concentration and competition in Turkish banking sector. Theoretical and Applied Economics, 19(8), 19- 28. 573.
Miljković, M., Filipović, S., & Tanasković, S. (2013). Market Concentration In The Banking Sector: Evidence From Serbia. Industrija, 41(2), 7- 26.
Pavić Kramarić, T., & Kitić, M. (2012). Comparative Analysis of Concentration in Insurance Market in New Member States. (PP. 687- 691). World Academy of Science. Engineering and Technology.
Shahikitash, M.N. (2013). The market power of plant industries in Iran. Economic Research Journal, 2, 43-64.
Sharma, M.K., & Bal.K. (2010). Bank Market Concentration: A Case Study of India. International Review of Business Research Papers, 6(6), 95- 107.