Embed Size (px)
Citation preview
Industrija, Vol.44, No.3, 2016 61
Snežana Milošević Avdalović1
Branimir Kalaš2
JEL: G21, C22, C3 DOI:10.5937/industrija44-10362 UDC: 336.71:658.153(497.11)
336.713 Original Scientific Paper
Determinants of Deposit Potential as Inverse Liquidity Indicator of Commercial Banks in
Serbia Article history: Received:25 February 2016 Sent for revision:6 April 2016 Received in revised form: 29 August 2016 Accepted: 1 September 2016 Available online: 8 October 2016
Abstract: The aim of this paper is to identify determinants of liquidity of commercial banks in the Republic of Serbia, observing the macroeconomic and banking-specific indicators, or micro-economic indicators which were analyzed by descriptive statistics, correlation and regression analysis from 2008 to 2014. The correlation for the observed variables is calculated from 140 samples for internal and external independent variables of impact to the dependent variable – liquidity measured by indicator of deposits. The subject of research is the process of optimization model reducing the factors of liquidity to variables that have the most significant impact on liquidity indicator measured by deposit potential. Results of the model show that liquidity of banks is dominantly determined by the size of banks assets. With growth of the assets, banks are exposed to a greater risk of liquidity. The increase in capital adequacy ratio has a positive effect on the liquidity of banks. Net interest margin is positively correlated with the indicator of deposit potential which indicates a negative impact on the liquidity of banks as well as the ratio of operating expenses to operating income.
Keywords: Bank Liquidity, Deposits, Commercial banks of Serbia, Regression analysis, Correlation
Determinante depozitnog potencijal kao inverznog indikatora likvidnosti poslovnih banaka u Srbiji
Apstrakt: Cilj rada predstavlja identifikaciju determinanti likivdnosti komercijalnih banaka u R. Srbiji, posmatrajući makroekonomske i specifične
1 University of Novi Sad, Faculty of Economics, Subotica, [email protected]
2University of Novi Sad, Faculty of Economics, Subotica
Milošević Avdalović S., Kalaš B.: Determinants of Deposit Potential as Inverse...
62 Industrija, Vol.44, No.3, 2016
bankarske indikatore, odnosno mikroekonomske indikatore, koji su analizirani putem deskriptivne statistike, korelacije i regresione analize u periodu od 2008. do 2014. godine. Korelacija varijabli se računa na 140 uzoraka za interne I eksterne nezavisne varijable koje su od uticaja na zavisnu varijablu – likvidnost merenu depozitnim indikatorom. Predmet istraživanja predstavlja postupak optimizacije modela likvidnosti, smanjenjenjem faktora likvidnosti, na varijable koje imaju najveći uticaj na pokazatelje likvidnosti - mereno depozitnim potencijalom. Rezultati modela pokazuju da je likvidnost banaka dominantno određena veličniom bankarske aktive. Sa rastom bilansne aktive, banke se izlažu većem riziku likvidnosti. Povećanje adekvatnosti kapitala ima pozitivan efekat na likvidnost banaka. Neto kamatna marža je u pozitivnoj korelaciji sa indikatorom depozitnog potencijala koji ukazuje na negativan uticaj na likvidnost banaka, kao i racio operativnih troškova prema operativnim prihodima.
Ključne reči: Likvidnost banaka, Depoziti, Poslovne banke u Srbiji, Regresiona analiza, Korelacija
1. Introduction
Banks represent specialized institutions whose primary function is intermediation in the sphere of money with the goal of reproduction supplying by required amount of funding. Contemporary business conditions demand a new approach to managing liquidity risk for banking organizations and it’s relevant for their ability to withstand the pressure of global market. The forming of deposit potential on the level of commercial banks is strongly influenced by the macroenomic and microeconomic factors. With the realization of stable deposit growth rate it’s achieved the stability and efficiency of the banking and financial system. Increasing the volume of unstable deposits may threaten the bank’s liquidity, while a longer period of illiquidity can lead to the insolvency of a bank which is a great danger. The basis for measuring the liquidity represents a ratio analysis. The liquidity of bank is its ability to settle financial liabilities on their maturity period. Internal and external factors, where the most important factors of investment funds (own growth and development) and factors of placing funds (to bank’s clients) affects to the ability of the banks.
Research question that arises is which determinants most affect on the liquidity of commercial banks in Serbia? The importance of this work is reflected in the application of appropriate quantitative techniques to arrive at a concrete numerical value of parameters that have an impact on the liquidity of commercial banks. Paper is structured as follows: the first chapter reviews the literature about liquidity, the second chapter presents the competitiveness and
Milošević Avdalović S., Kalaš B.: Determinants of Deposit Potential as Inverse...
Industrija, Vol.44, No.3, 2016 63
concentration of Serbian banking system, the third chapter presents the data and methodology determinants and measures of the liquidity, the fourth chapter provides empirical research results and the fifth chapter induces research conclusion.
2. Literature review
Literature on the determinants of liquidity of commercial banks offer limited empirical research about internal and external factors of liquidity.
Valla and Saes-Escorbiac (2006) research the determinants of liquidity of commercial banks in England and concluded the existence of a negative correlation between bank liquidity and growth rate of real GDP and net interest margin.
Bunda and Desquilbet (2008) proved the existence of a positive relationship between level of capital adequacy and liquidity of commercial banks, as well as the positive relationship between inflation and liquidity ratios of the observed banks.
Vodova (2013) in her study of liquidity determinants of commercial banks in Hungary in the period 2001 to 2010 showed that banks are positively related to capital adequacy ratio, interest rate on loans and the interest rates and bank profitability and negatively related to the size of the bank, interest margin, monetary policy interest rates and interest rates on interbank transactions. The correlation between gross domestic product and bank liquidity is ambiguous.
Vodova (2013) in her study of liquidity determinants of commercial banks in Czech Republic and Slovakia in the period from 2001 to 2010 included four banking indicators and nine external macroecnomic indicators. Results panel data of regression analysis show that, although the Republic of Slovakia and the Czech Republic have much in common, the different factors in different countries define bank liquidity. Liquidity ratio of Czech banks is growing with the increase in capital adequacy, with the depreciation of the Czech koruna and the worsening quality of loan portfolio. Liquidity ratio of Slovak banks is decreasing with higher capital adequacy, the size of the bank and during the period of financial crisis. Also, the liquidity of Slovak banks is positively related with the economic cycle.
Vodova (2012) and her research of liquidity determinants of commercial banks in Poland in the reporting period from 2001 to 2010 proves that the liquidity of banking sector is strongly determined by economic conditions, the economic crisis and rising unemployment. Liquidity of bank decreases with increasing profitability of the bank with a higher interest margin and growth in
Milošević Avdalović S., Kalaš B.: Determinants of Deposit Potential as Inverse...
64 Industrija, Vol.44, No.3, 2016
the size of the bank as measured by assets. In contrast, bank liquidity increases with rising capital adequacy ratio, the growth of problem loans and increasing interest rates on loans and interbank transaction.
Roman and Sarqua (2014) researched the determinants of liquidity in the banking sector in period from 2003 to 2011. The research results point out that capital adequacy ratio and ratio of outstanding loans to total loans have statistically significant effect on the liquidity risk of commercial banks in Bulgaria and Romania.
3. Concept of the banking system of Serbia
Liberalization, instability of financial markets, as well as intensive international competitiveness exposes the bank to new challenges demanding permanent innovation in monitoring of their business activities. The interbank market is a source of credit potential of commercial banks and liquidity of the financial system. The development of modern interbank market requires analysis of the development banks, in order to provide for the protection of banks of all the risks involved in their business (Kundid et al, 2009). The main challenge for the banking organizations represents the relationship between the lending and deposit collection when it comes to managing liquidity.
The illiquidity problem may occur in case of withdrawal of deposits at the time of loan placements which weren’t returned and there is no the possibility of rapid cashing less liquid forms of assets (Basel Committee on Banking supervision, 2008). Banks operating in developed financial markets mainly manage liquidity using additional non-deposit funding sources. The bank can maintain liquidity through credit functions but only on condition that synchronizes with the terms of loan repayment deadlines withdrawal of deposits and to ensure greater interest on credits from the interest on the deposited funds.
Competition in the banking is reflected, mainly through price competition, but also the quality of banking services. In the fight for deposits from customers, banks often raise deposit rates and decrease lending rates. However, most customers of banking services consider that competition isn’t at a high level and that it could and should be higher, justifying it by high interest rates and fee of banking services. From the standpoint of the banking sector, this means that the higher level of concentration is more likely that banks will adopt the model of competitive behavior. The methodological tool of paper which is directly related to the introduction of evidence is the degree of linear composition indicator of competition and concentration indicator, among which traditional theory predicts an inverse relationship.
Milošević Avdalović S., Kalaš B.: Determinants of Deposit Potential as Inverse...
Industrija, Vol.44, No.3, 2016 65
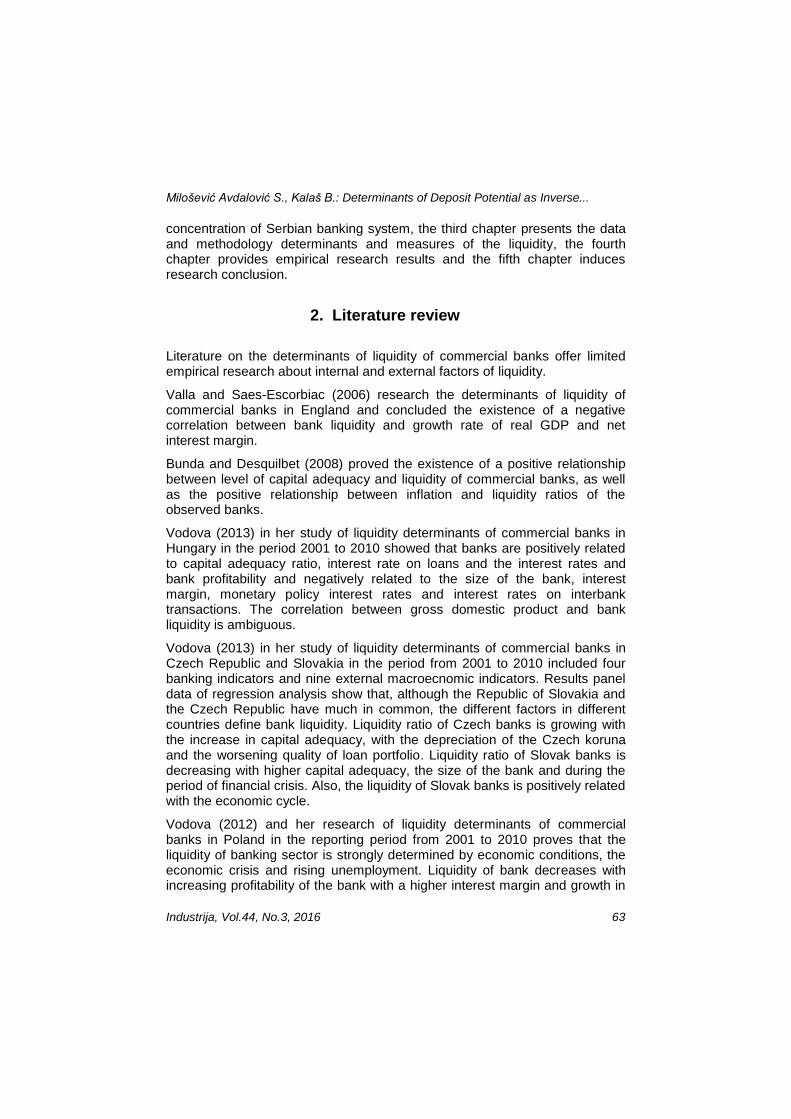
Figure 1. The concentration index of the banking sector of Serbia in period from 2008 to 2014
Source: Calculation and review of authors based on data of the banking sector of Serbia, www.nbs.rs
Hirscham-Herfindal index as a representative measure of the level of banking sector’ concentration is the sum of squares of the individual market shares of commercial banks in the total assets of the banking sector. HHI index isn’t above the 1,000 level for either category which would indicate the existence of only moderate concentration. Based on these measures can be seen that the banking sector is low concentrated because of a large number of banks, as well as a large number of banks which have a share below 2% in the assets.
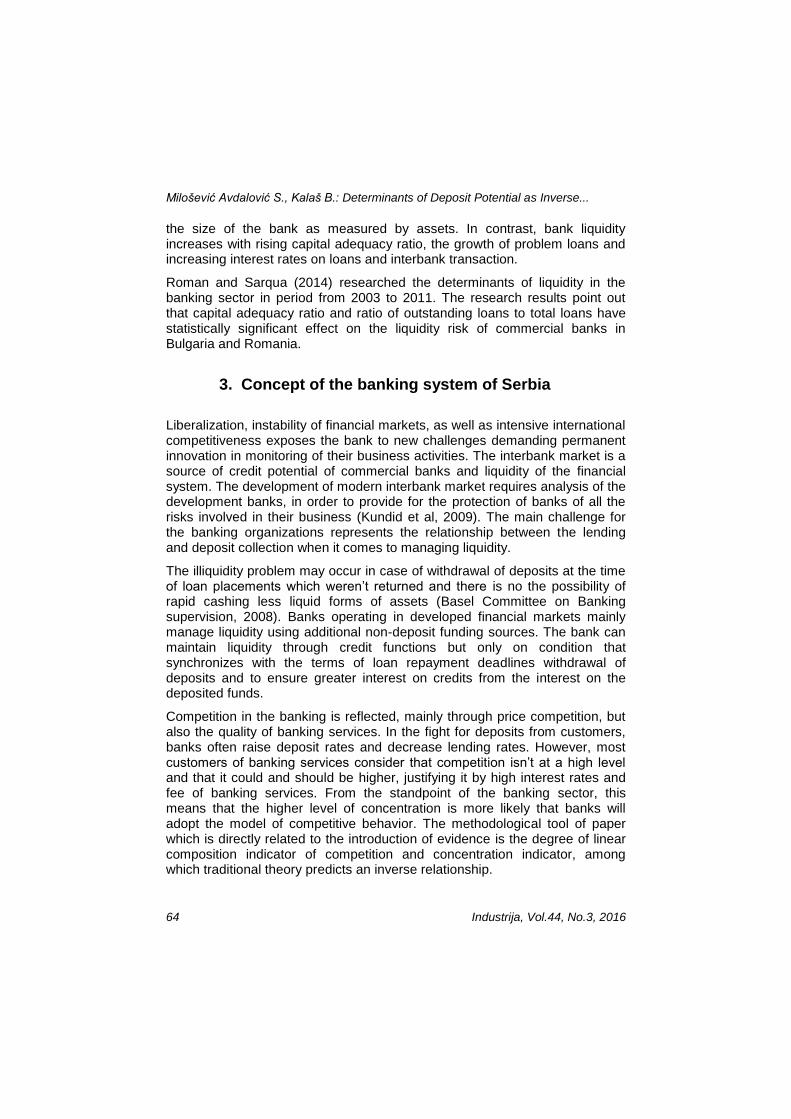
Figure 2. Structure of total deposits in period from 2008 to 2014
Source: Calculation and review of authors based on data of the banking sector of Serbia, www.nbs.rs
Milošević Avdalović S., Kalaš B.: Determinants of Deposit Potential as Inverse...
66 Industrija, Vol.44, No.3, 2016
If we look at the sector structure of deposit, the highest percentage of total deposits are deposits of customers which record growth every year, followed by deposits of companies with a share of 20%. In the reporting period it’s noted a steady growth of customer’s deposits from 45% to 60%, while the share of deposits of enterprises record a decline from 26% to 21% of total deposits.
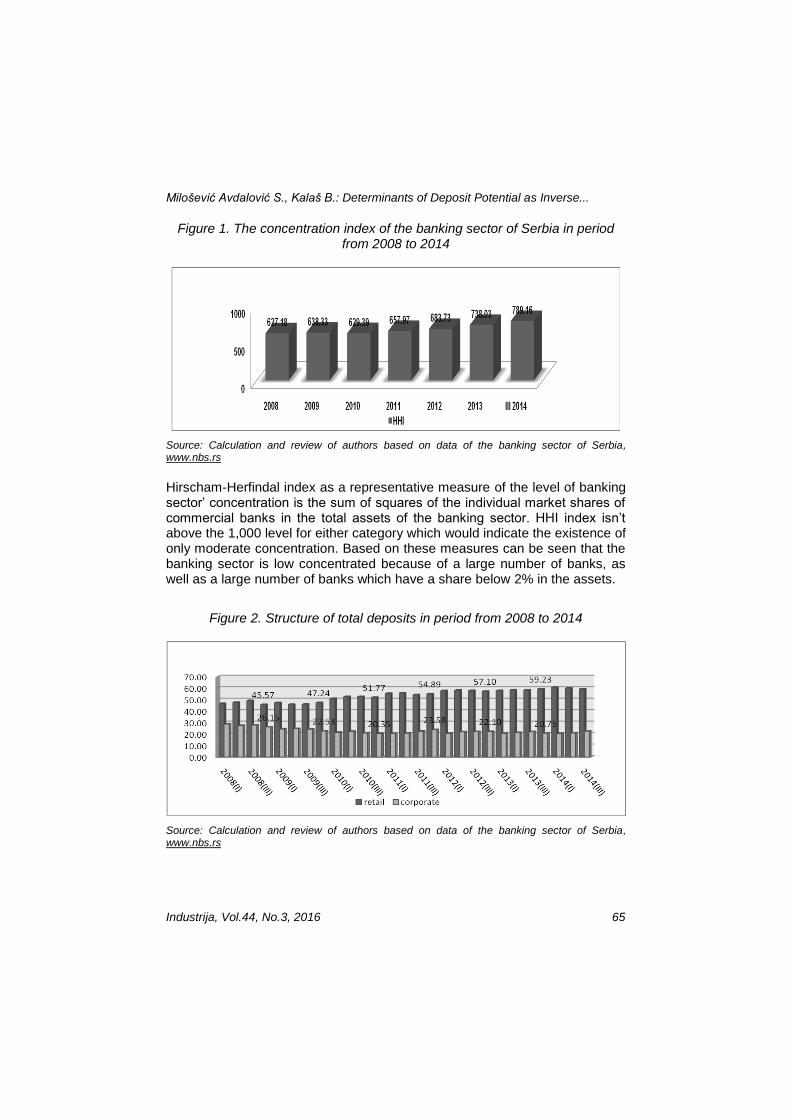
4. Methodology and Data
This segment of research shows the procedure of optimization model liquidity reducing the factors of liquidity to variables that have the most significant impact on liquidity indicator measured by deposit potential. The complexity of the optimization model liquidity stems from a complex and cross impact of certain external factors and the complex mechanism of transmission performance of banks. The table gives an overview of internal and external independent variables which affect the dependent variable – liquidity. The basis for selected independent indicators represents previously conducted research on this topic. Table 1 shows a list of variables that are used in the regression analysis.
Table 1. Variables definition
Variables Source
Expected
impact on
liquidity
CAP: the share of equity on total assets of the bank Annual reports +
ROE: return on equity: the share of net profit on banks’
equity Annual reports -
TOA: total assets of the bank Annual reports -
EOI: the share of operating costs in the operating
income Annual reports -
ERI: the share if interest expense in interest revenue Annual reports -
NOA: the share of net interest margin on banks` assets Annual reports -
GDP: gross domestic product growth as an indicator of
business cycle Central Bank -
UN: unemployment rate Central Bank -
INF: inflation rate (CPI % change) Central Bank +
IR: monetary policy interest rate Central Bank -
FDIC: dummy variable for realization of financial crisis
(1 in 2009. and 2010., rest of the period 0) Own -
Source: Review authors based on the views given by Vodova, P. in his research (2013)
Milošević Avdalović S., Kalaš B.: Determinants of Deposit Potential as Inverse...
Industrija, Vol.44, No.3, 2016 67
As it can be seen from Table 1, we expect that two factors could have positive impact on bank liquidity, the rest of factors are expected to have negative impact on bank liquidity. The positive relationship of capital adequacy and liquidity is in connection with the assumption that banks with sufficient capital adequacy should be more liquid. Bearing in mind the conflicting objectives of liquidity and profitability it’s assumed that a negative relationship between these performances. Size of banks is measured by the banking assets – if banks see themselves as too big to fail, their motivation for holding highly liquid funds in assets is limited.
In the analysis of used variables that present macroeconomic impact on liquidity: GDP, unemployment rate, inflation rate and monetary policy interest rate. GDP growth affects to favorable business climate in the country and just expansion leads to falling interest rates and higher loan placements which can reduce liquidity buffer, because the banks plan that decrease interest rates can facilitate it’s borrowing, i.e. collecting non-deposit funding sources. The unemployment rate is an indicator of general health of the economy. It’s assumed that a negative relationship between liquidity and unemployment rate. Monetary policy interest rate has a high negative effect on the bank’s liquidity. The financial crisis and bank liquidity can influence one another in both direction and therefore poor liquidity ratio of the bank or a bad bank liquidity could be due to the financial crisis.
To identify the determinants of liquidity of commercial banks in Serbia, it was used to panel data of regression analysis. For every liquidity ratio model can be represented by the following expression:
Lit = α + βXit + δi + εit (1)
Where is:
Lit – one of two liquidity ratios
Xit –vector of explanatory variables for bank i in time t
α - constant,
β – coefficient which represents the slope of variables
δ – represents fixed effects in bank i
εi - means the error term
Liquidity ratio is measured by the ratio of deposits to total assets. High value of this indicator shows a lower liquidity for banks. The next table presents selected indicators that were used in the paper.
Milošević Avdalović S., Kalaš B.: Determinants of Deposit Potential as Inverse...
68 Industrija, Vol.44, No.3, 2016
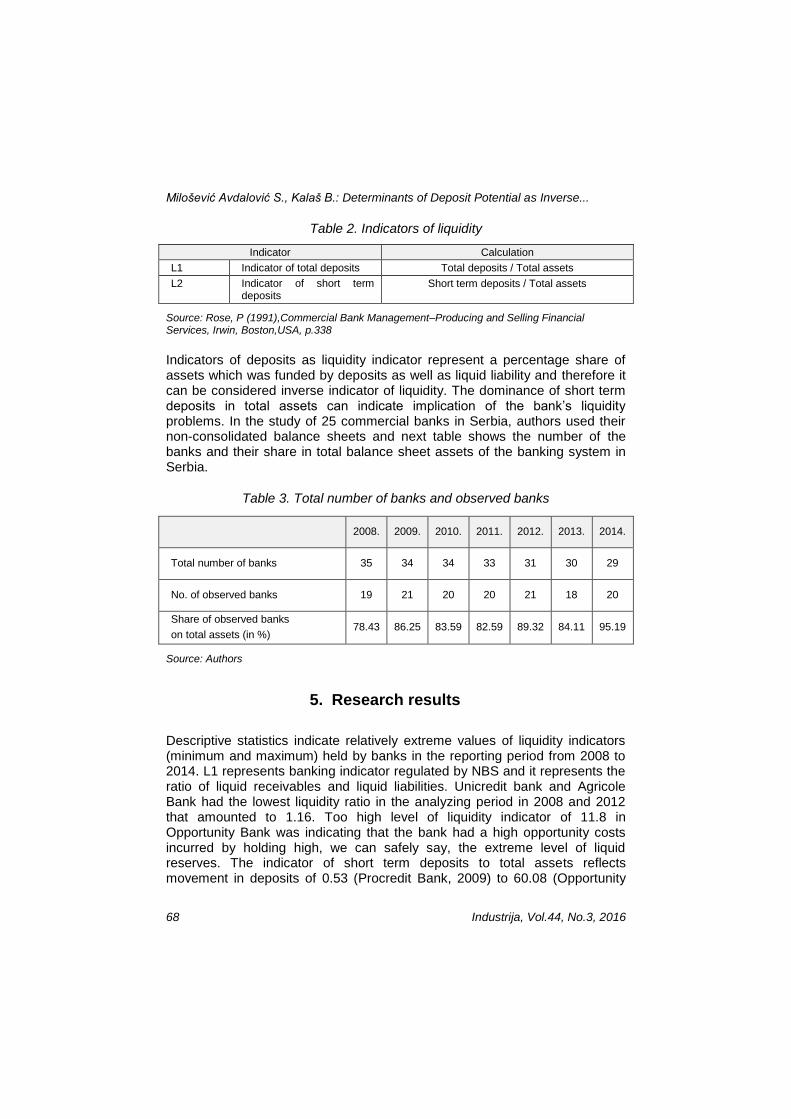
Table 2. Indicators of liquidity
Indicator Calculation
L1 Indicator of total deposits Total deposits / Total assets
L2 Indicator of short term deposits
Short term deposits / Total assets
Source: Rose, P (1991),Commercial Bank Management–Producing and Selling Financial Services, Irwin, Boston,USA, p.338
Indicators of deposits as liquidity indicator represent a percentage share of assets which was funded by deposits as well as liquid liability and therefore it can be considered inverse indicator of liquidity. The dominance of short term deposits in total assets can indicate implication of the bank’s liquidity problems. In the study of 25 commercial banks in Serbia, authors used their non-consolidated balance sheets and next table shows the number of the banks and their share in total balance sheet assets of the banking system in Serbia.
Table 3. Total number of banks and observed banks
2008. 2009. 2010. 2011. 2012. 2013. 2014.
Total number of banks 35 34 34 33 31 30 29
No. of observed banks 19 21 20 20 21 18 20
Share of observed banks
on total assets (in %) 78.43 86.25 83.59 82.59 89.32 84.11 95.19
Source: Authors
5. Research results
Descriptive statistics indicate relatively extreme values of liquidity indicators (minimum and maximum) held by banks in the reporting period from 2008 to 2014. L1 represents banking indicator regulated by NBS and it represents the ratio of liquid receivables and liquid liabilities. Unicredit bank and Agricole Bank had the lowest liquidity ratio in the analyzing period in 2008 and 2012 that amounted to 1.16. Too high level of liquidity indicator of 11.8 in Opportunity Bank was indicating that the bank had a high opportunity costs incurred by holding high, we can safely say, the extreme level of liquid reserves. The indicator of short term deposits to total assets reflects movement in deposits of 0.53 (Procredit Bank, 2009) to 60.08 (Opportunity
Milošević Avdalović S., Kalaš B.: Determinants of Deposit Potential as Inverse...
Industrija, Vol.44, No.3, 2016 69
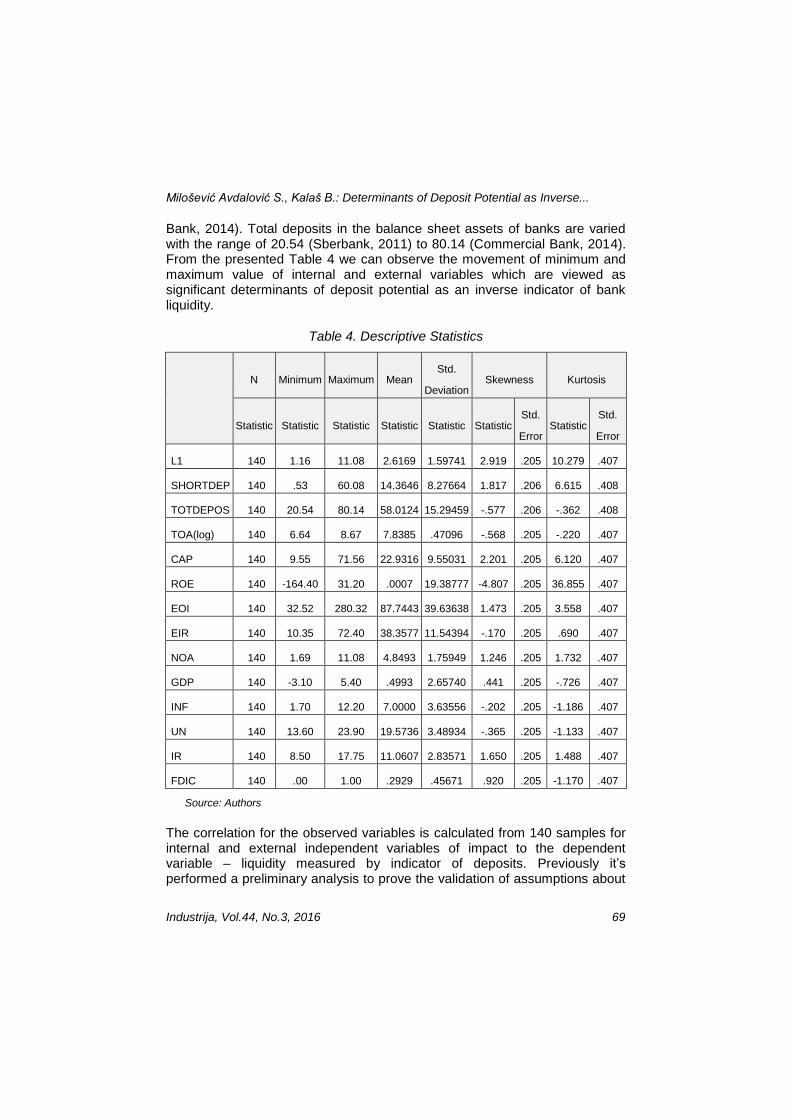
Bank, 2014). Total deposits in the balance sheet assets of banks are varied with the range of 20.54 (Sberbank, 2011) to 80.14 (Commercial Bank, 2014). From the presented Table 4 we can observe the movement of minimum and maximum value of internal and external variables which are viewed as significant determinants of deposit potential as an inverse indicator of bank liquidity.
Table 4. Descriptive Statistics
N Minimum Maximum Mean Std.
Deviation Skewness Kurtosis
Statistic Statistic Statistic Statistic Statistic Statistic Std.
Error Statistic
Std.
Error
L1 140 1.16 11.08 2.6169 1.59741 2.919 .205 10.279 .407
SHORTDEP 140 .53 60.08 14.3646 8.27664 1.817 .206 6.615 .408
TOTDEPOS 140 20.54 80.14 58.0124 15.29459 -.577 .206 -.362 .408
TOA(log) 140 6.64 8.67 7.8385 .47096 -.568 .205 -.220 .407
CAP 140 9.55 71.56 22.9316 9.55031 2.201 .205 6.120 .407
ROE 140 -164.40 31.20 .0007 19.38777 -4.807 .205 36.855 .407
EOI 140 32.52 280.32 87.7443 39.63638 1.473 .205 3.558 .407
EIR 140 10.35 72.40 38.3577 11.54394 -.170 .205 .690 .407
NOA 140 1.69 11.08 4.8493 1.75949 1.246 .205 1.732 .407
GDP 140 -3.10 5.40 .4993 2.65740 .441 .205 -.726 .407
INF 140 1.70 12.20 7.0000 3.63556 -.202 .205 -1.186 .407
UN 140 13.60 23.90 19.5736 3.48934 -.365 .205 -1.133 .407
IR 140 8.50 17.75 11.0607 2.83571 1.650 .205 1.488 .407
FDIC 140 .00 1.00 .2929 .45671 .920 .205 -1.170 .407
Source: Authors
The correlation for the observed variables is calculated from 140 samples for internal and external independent variables of impact to the dependent variable – liquidity measured by indicator of deposits. Previously it’s performed a preliminary analysis to prove the validation of assumptions about
Milošević Avdalović S., Kalaš B.: Determinants of Deposit Potential as Inverse...
70 Industrija, Vol.44, No.3, 2016
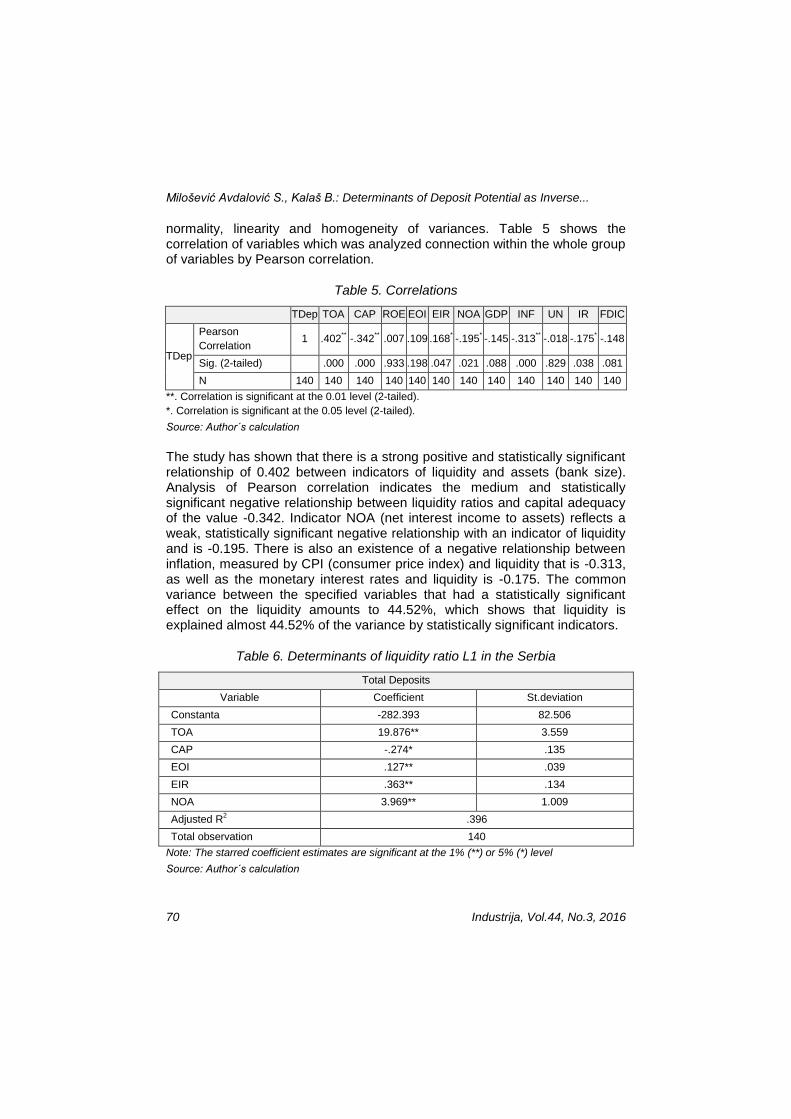
normality, linearity and homogeneity of variances. Table 5 shows the correlation of variables which was analyzed connection within the whole group of variables by Pearson correlation.
Table 5. Correlations
TDep TOA CAP ROE EOI EIR NOA GDP INF UN IR FDIC
TDep
Pearson
Correlation 1 .402
** -.342
** .007 .109 .168
* -.195
* -.145 -.313
** -.018 -.175
* -.148
Sig. (2-tailed) .000 .000 .933 .198 .047 .021 .088 .000 .829 .038 .081
N 140 140 140 140 140 140 140 140 140 140 140 140
**. Correlation is significant at the 0.01 level (2-tailed).
*. Correlation is significant at the 0.05 level (2-tailed).
Source: Author´s calculation
The study has shown that there is a strong positive and statistically significant relationship of 0.402 between indicators of liquidity and assets (bank size). Analysis of Pearson correlation indicates the medium and statistically significant negative relationship between liquidity ratios and capital adequacy of the value -0.342. Indicator NOA (net interest income to assets) reflects a weak, statistically significant negative relationship with an indicator of liquidity and is -0.195. There is also an existence of a negative relationship between inflation, measured by CPI (consumer price index) and liquidity that is -0.313, as well as the monetary interest rates and liquidity is -0.175. The common variance between the specified variables that had a statistically significant effect on the liquidity amounts to 44.52%, which shows that liquidity is explained almost 44.52% of the variance by statistically significant indicators.
Table 6. Determinants of liquidity ratio L1 in the Serbia
Total Deposits
Variable Coefficient St.deviation
Constanta -282.393 82.506
TOA 19.876** 3.559
CAP -.274* .135
EOI .127** .039
EIR .363** .134
NOA 3.969** 1.009
Adjusted R2 .396
Total observation 140
Note: The starred coefficient estimates are significant at the 1% (**) or 5% (*) level
Source: Author´s calculation
Milošević Avdalović S., Kalaš B.: Determinants of Deposit Potential as Inverse...
Industrija, Vol.44, No.3, 2016 71
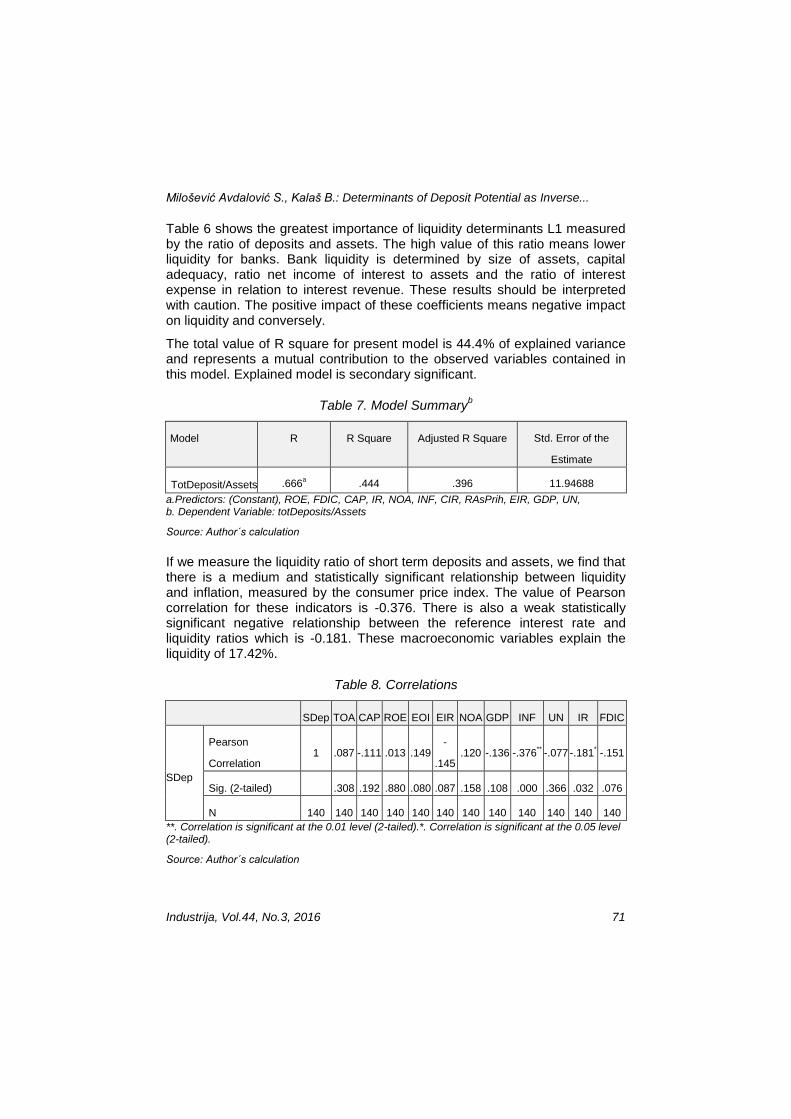
Table 6 shows the greatest importance of liquidity determinants L1 measured by the ratio of deposits and assets. The high value of this ratio means lower liquidity for banks. Bank liquidity is determined by size of assets, capital adequacy, ratio net income of interest to assets and the ratio of interest expense in relation to interest revenue. These results should be interpreted with caution. The positive impact of these coefficients means negative impact on liquidity and conversely.
The total value of R square for present model is 44.4% of explained variance and represents a mutual contribution to the observed variables contained in this model. Explained model is secondary significant.
Table 7. Model Summaryb
Model R R Square Adjusted R Square Std. Error of the
Estimate
TotDeposit/Assets .666a .444 .396 11.94688
a.Predictors: (Constant), ROE, FDIC, CAP, IR, NOA, INF, CIR, RAsPrih, EIR, GDP, UN, b. Dependent Variable: totDeposits/Assets
Source: Author´s calculation
If we measure the liquidity ratio of short term deposits and assets, we find that there is a medium and statistically significant relationship between liquidity and inflation, measured by the consumer price index. The value of Pearson correlation for these indicators is -0.376. There is also a weak statistically significant negative relationship between the reference interest rate and liquidity ratios which is -0.181. These macroeconomic variables explain the liquidity of 17.42%.
Table 8. Correlations
SDep TOA CAP ROE EOI EIR NOA GDP INF UN IR FDIC
SDep
Pearson
Correlation 1 .087 -.111 .013 .149
-
.145 .120 -.136 -.376
** -.077 -.181
* -.151
Sig. (2-tailed)
.308 .192 .880 .080 .087 .158 .108 .000 .366 .032 .076
N 140 140 140 140 140 140 140 140 140 140 140 140
**. Correlation is significant at the 0.01 level (2-tailed).*. Correlation is significant at the 0.05 level (2-tailed).
Source: Author´s calculation
Milošević Avdalović S., Kalaš B.: Determinants of Deposit Potential as Inverse...
72 Industrija, Vol.44, No.3, 2016
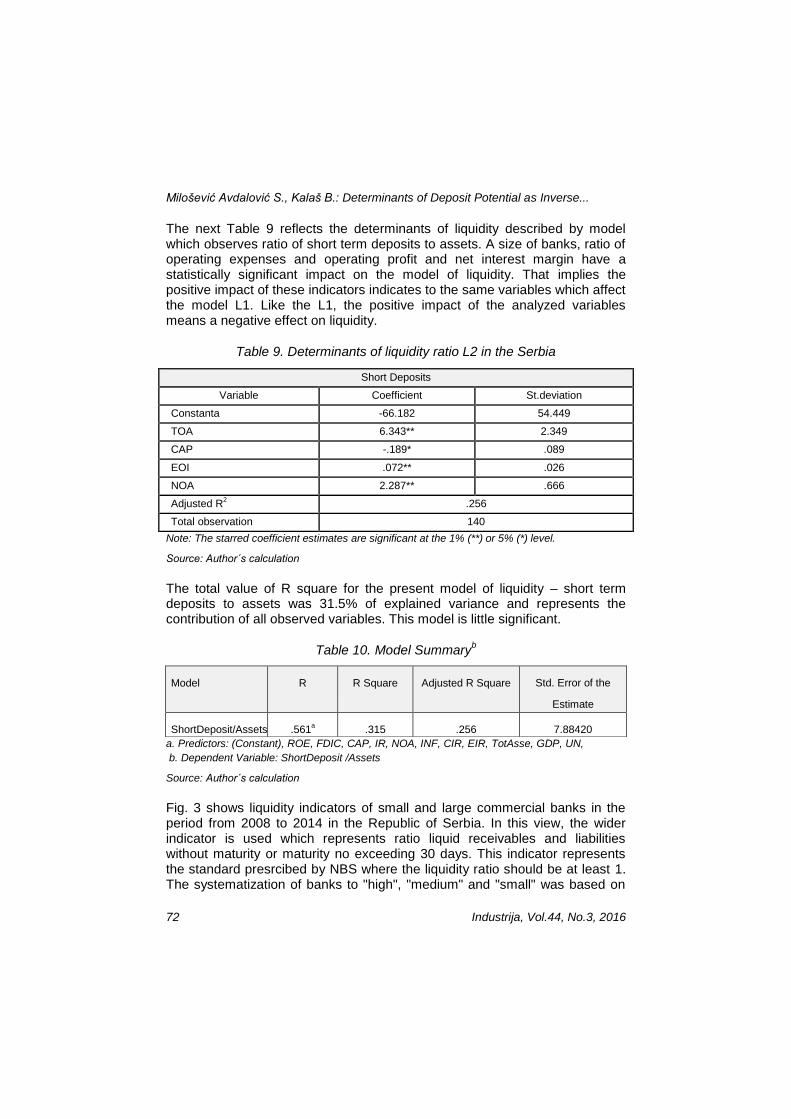
The next Table 9 reflects the determinants of liquidity described by model which observes ratio of short term deposits to assets. A size of banks, ratio of operating expenses and operating profit and net interest margin have a statistically significant impact on the model of liquidity. That implies the positive impact of these indicators indicates to the same variables which affect the model L1. Like the L1, the positive impact of the analyzed variables means a negative effect on liquidity.
Table 9. Determinants of liquidity ratio L2 in the Serbia
Note: The starred coefficient estimates are significant at the 1% (**) or 5% (*) level.
Source: Author´s calculation
The total value of R square for the present model of liquidity – short term deposits to assets was 31.5% of explained variance and represents the contribution of all observed variables. This model is little significant.
Table 10. Model Summaryb
a. Predictors: (Constant), ROE, FDIC, CAP, IR, NOA, INF, CIR, EIR, TotAsse, GDP, UN,
b. Dependent Variable: ShortDeposit /Assets
Source: Author´s calculation
Fig. 3 shows liquidity indicators of small and large commercial banks in the period from 2008 to 2014 in the Republic of Serbia. In this view, the wider indicator is used which represents ratio liquid receivables and liabilities without maturity or maturity no exceeding 30 days. This indicator represents the standard presrcibed by NBS where the liquidity ratio should be at least 1. The systematization of banks to "high", "medium" and "small" was based on
Short Deposits
Variable Coefficient St.deviation
Constanta -66.182 54.449
TOA 6.343** 2.349
CAP -.189* .089
EOI .072** .026
NOA 2.287** .666
Adjusted R2 .256
Total observation 140
Model R R Square Adjusted R Square Std. Error of the
Estimate
ShortDeposit/Assets .561a .315 .256 7.88420
Milošević Avdalović S., Kalaš B.: Determinants of Deposit Potential as Inverse...
Industrija, Vol.44, No.3, 2016 73
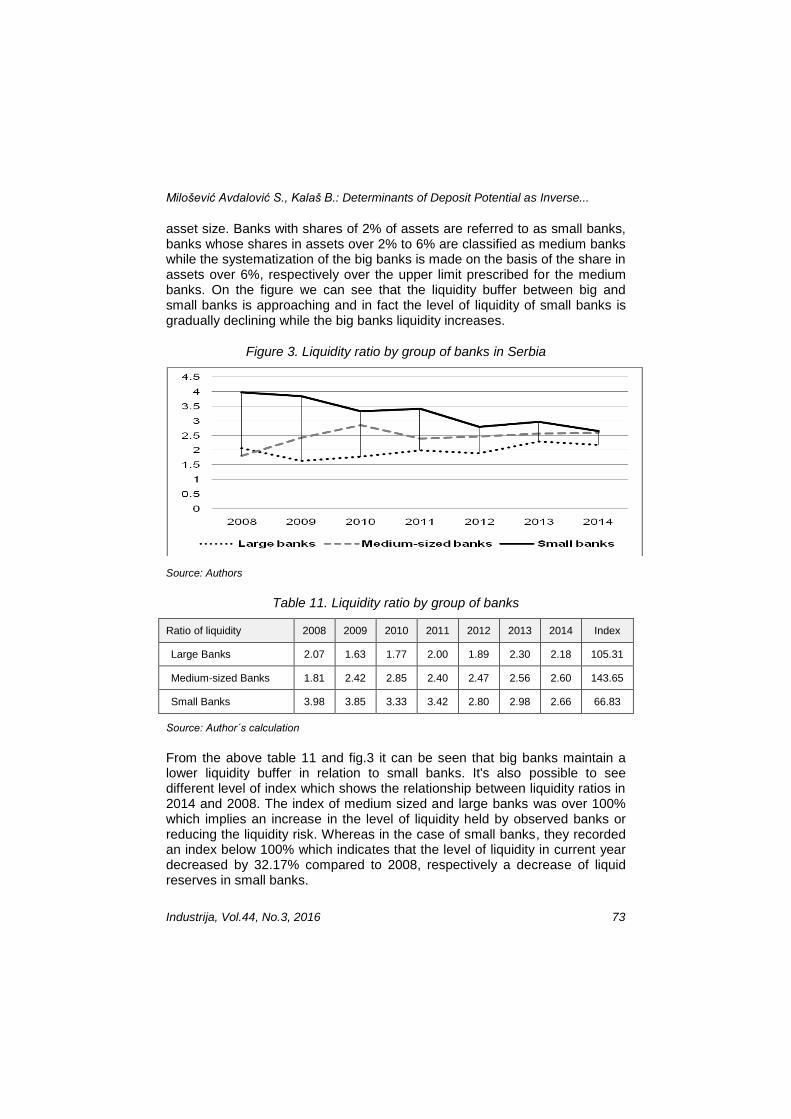
asset size. Banks with shares of 2% of assets are referred to as small banks, banks whose shares in assets over 2% to 6% are classified as medium banks while the systematization of the big banks is made on the basis of the share in assets over 6%, respectively over the upper limit prescribed for the medium banks. On the figure we can see that the liquidity buffer between big and small banks is approaching and in fact the level of liquidity of small banks is gradually declining while the big banks liquidity increases.
Figure 3. Liquidity ratio by group of banks in Serbia
Source: Authors
Table 11. Liquidity ratio by group of banks
Ratio of liquidity 2008 2009 2010 2011 2012 2013 2014 Index
Large Banks 2.07 1.63 1.77 2.00 1.89 2.30 2.18 105.31
Medium-sized Banks 1.81 2.42 2.85 2.40 2.47 2.56 2.60 143.65
Small Banks 3.98 3.85 3.33 3.42 2.80 2.98 2.66 66.83
Source: Author´s calculation
From the above table 11 and fig.3 it can be seen that big banks maintain a lower liquidity buffer in relation to small banks. It's also possible to see different level of index which shows the relationship between liquidity ratios in 2014 and 2008. The index of medium sized and large banks was over 100% which implies an increase in the level of liquidity held by observed banks or reducing the liquidity risk. Whereas in the case of small banks, they recorded an index below 100% which indicates that the level of liquidity in current year decreased by 32.17% compared to 2008, respectively a decrease of liquid reserves in small banks.
Milošević Avdalović S., Kalaš B.: Determinants of Deposit Potential as Inverse...
74 Industrija, Vol.44, No.3, 2016
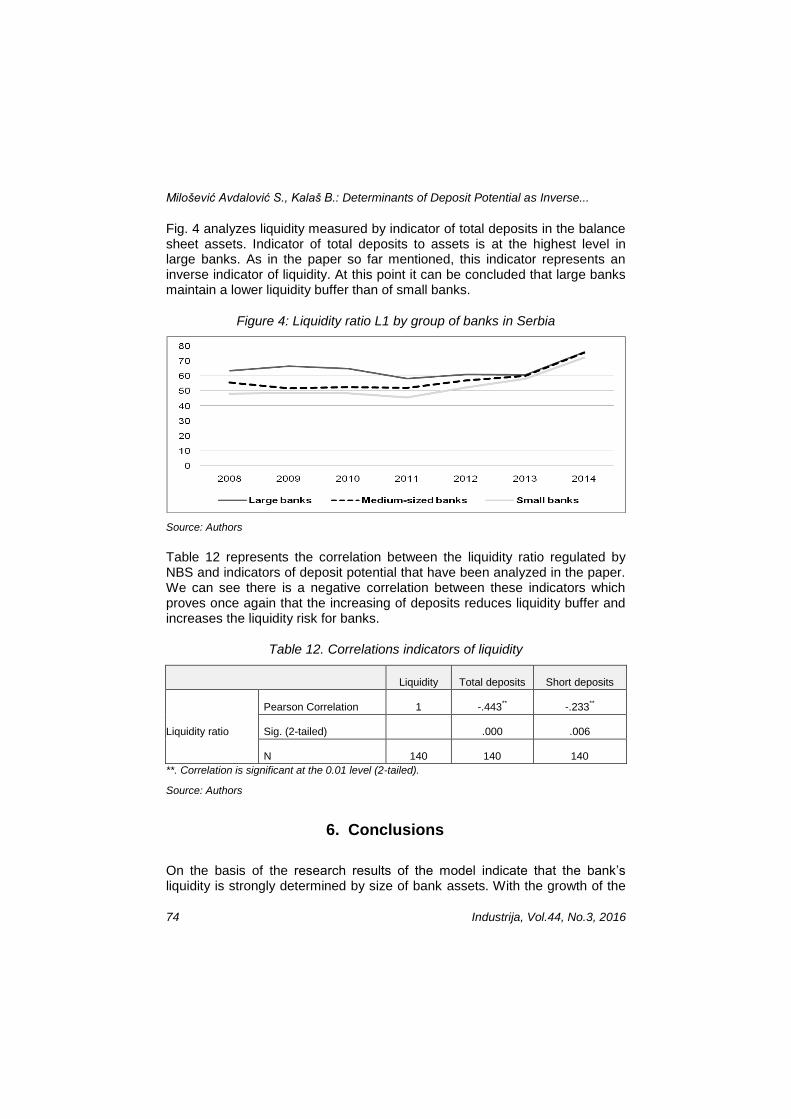
Fig. 4 analyzes liquidity measured by indicator of total deposits in the balance sheet assets. Indicator of total deposits to assets is at the highest level in large banks. As in the paper so far mentioned, this indicator represents an inverse indicator of liquidity. At this point it can be concluded that large banks maintain a lower liquidity buffer than of small banks.
Figure 4: Liquidity ratio L1 by group of banks in Serbia
Source: Authors
Table 12 represents the correlation between the liquidity ratio regulated by NBS and indicators of deposit potential that have been analyzed in the paper. We can see there is a negative correlation between these indicators which proves once again that the increasing of deposits reduces liquidity buffer and increases the liquidity risk for banks.
Table 12. Correlations indicators of liquidity
Liquidity Total deposits Short deposits
Liquidity ratio
Pearson Correlation 1 -.443** -.233
**
Sig. (2-tailed)
.000 .006
N 140 140 140
**. Correlation is significant at the 0.01 level (2-tailed).
Source: Authors
6. Conclusions
On the basis of the research results of the model indicate that the bank’s liquidity is strongly determined by size of bank assets. With the growth of the
Milošević Avdalović S., Kalaš B.: Determinants of Deposit Potential as Inverse...
Industrija, Vol.44, No.3, 2016 75
balance sheet active, banks are exposed to a greater liquidity risk which is in line with the prevailing attitude too big to fail. The increase in capital adequacy ratio has a positive effect on the liquidity banks. Net interest margin is positively correlated with the indicator of deposit potential which indicates a negative impact on the liquidity of banks as well as the ratio of operating expenses to operating income. It was also observed that there is a correlation between the indicators of liquidity and macroeconomic indicators, but not statistically significant effect on defined liquidity models of commercial banks in Serbia. Future research should include more indicators of liquidity and determination relevance for each of them and it could be extended to commercial banks in the region.
References
BIS. (2009). International framework for liquidity risk measurement, standards and monitoring. Basel: Bank for International Settlements. ISBN 92-9131-811-6.
BIS. (2011) A global regulatory framework for more resilient banks and banking systems (revisited version), Bank for International Settlements, Basel, Switzerland.
BIS.(2008). Principles for Sound Liquidity Risk Management and Supervision. Basel: Bank for International Settlements. ISBN 92-9197-767-5.
BIS.(2008). Principles for Sound Liquidity Risk Management and Supervision. Basel: Bank for International Settlements. ISBN 92-9197-767-5.
Bunda, I. and J. B. Desquilbet, (2008). The Bank Liquidity Smile Across Exchange Rate Regimes, International Economic Journal, vol. 22, no. 3, pp.361-386.
Central Bank of Serbia (2008-2014). Annual Reports. www.nbs.rs Commercial Banks (2008-2014). Annual Reports www.aikbanka.rs,
www.alphabankserbia.com,www.bancaintesa.rs, www.posted.co.rs, www.creditagricole.rs, www.cacanskabanka.co.rs, www.erstebank.rs, www.eurobank.rs, www.findomestic.rs, www.hipo-alpe-adria.rs, www.jubmes.rs, www.kombank.com, www.nlb.rs, www.obs.rs, www.otpbanka.rs, www.piraeusbank.rs, www.procreditbank.rs, www.raiffeisenbank.rs, www.sberbank.rs, www.societegenerale.rs, www.unicreditbank.rs, www.voban.co.rs, www.ubbad.rs (2008.,2009,2012.)
Kundid, A., Ercegovac, R. & Klipanac, L.(2009). Bank liquidity disress transfer toward real economy ahead of financial crisis, Global Business & Economics Anthology, Volume II, December, Business & Economics Society International
Miljkovic, M., Filipovic S. & Tanaskovic S., (2013). Market Concentration In The Banking Sector - Evidence From Serbia, Industry.
Roman, A. & Sarqua, C.A., (2014). Banks liquidity risk analysis in the new European Union member countries: evidence from Bulgaria and Romania, Procedia Economics and Finance 15, page 569-576 , download:http://ac.els-cdn.com/S2212567114005127/1-s2.0-S2212567114005127-main.pdf?_tid=88f3e492-ed06-11e4-9703-
Milošević Avdalović S., Kalaš B.: Determinants of Deposit Potential as Inverse...
76 Industrija, Vol.44, No.3, 2016
00000aab0f6c&acdnat=1430157485_fe55ffb65f52081b948fe7caa17c6d14 22.02.2015.
Rose, P., (1991), Commercial Bank Management–Producing and Selling Financial Services, Irwin, Boston,USA, p.338.
Valla, N. & B. Saes-Escorbiac, (2006). Bank liquidity and financial stability, Banque de France Financial Stability Review, pp. 89-104.
Vodová, P., (2012). Determinants of Commercial Bank’s Liquidity in Poland, Proceedings of 30th International Conference Mathematical Methods in Economics, download: http://mme2012.opf.slu.cz/proceedings/pdf/165_Vodova.pdf page 962-967, 18.04.2015.
Vodová, P., (2013). Determinants of Commercial Bank’s Liquidity in Slovakia. download: http://www.opf.slu.cz/kfi/icfb/proc2011/pdf/65_Vodova.pdf 20.02.2015.
Vodová, P., (2013). Determinants of Commercial Banks' Liquidity in the Czech Republic. ISBN: 978-1-61804-002-2, download: http://is.muni.cz/do/econ/soubory/aktivity/fai/38465793/FAI2013_01_Vodova.pdf 17.02.2015.
Vodová, P., (2013). Determinants of Commercial Banks' Liquidity in Hungary. download: http://www.slu.cz/opf/cz/informace/acta-academica-karviniensia/casopisy-aak/aak-rocnik-2013/docs-1-2013/Vodova.pdf 17.02.2015.
Vodová, P., (2013). Determinents which affect liquid assets ratio of Czech and Slovak Commercial Banks. FAI2013-1-2 No. 1/2013, download: http://e-finanse.com/artykuly_eng/257.pdf 12.04.2015.