Embed Size (px)
Citation preview

The World City Business BrandBarometerRevealing which cities get the business brand they deserve

The lifting of trade barriers, economic reform and digital communications have contributed to shifts in the absolute and relative advantages which cities can offer to businesses around the world. Cities now compete with each other to attract businesses in order to build long-term economic growth for themselves and their residents.
1. New York2. Los Angeles3. San Francisco4. Paris5. Tokyo6. Berlin7. London8. Chicago9. Amsterdam10. Barcelona11. Istanbul12. Seoul13. Miami14. Madrid15. Rome16. Shanghai17. Lisbon18. Munich19. Mexico City20. Vienna21. Dallas-Fort Worth22. Moscow23. Melbourne24. Tel Aviv25. Beijing26. Sao Paulo27. Milan28. Dublin29. Sydney30. Buenos Aires31. Prague32. Lima33. Santiago34. Houston
35. Budapest36. Stockholm37. Delhi38. Mumbai (Bombay)39. Philadelphia40. Cairo41. Warsaw42. Toronto43. Dubai44. Atlanta45. Rio de Janeiro46. Athens47. Adelaide48. Guadalajara49. Perth50. Jakarta51. Osaka52. Johannesburg53. Brisbane54. Monterrey55. Bucharest56. Bogota57. Manila58. Abu Dhabi59. Belo Horizonte60. Sofia61. Riyadh62. Amman63. Beirut64. Kinshasa65. Doha66. Karachi67. Lagos
8.98.58.48.38.18.08.08.07.87.87.67.67.67.57.57.57.27.27.07.076.96.96.86.86.76.76.76.76.66.66.56.56.5
6.46.46.46.36.26.16.06.06.06.06.06.05.95.95.85.85.85.55.55.45.35.35.25.25.05.04.84.74.54.14.04.03.8
The Contenders:
City: City:Score: Score:
32 Saffron Brand BarometerIntroduction
At Saffron, we wanted to explore which cities around the world best use their business assets and resources (infrastructure, safety, etc.) in generating a strong business brand. The result of our research is shown in a table of rankings and a scatter graph. We can identify the winners but also, perhaps more interestingly, those that are emerging or perhaps not doing as well as they should be.
54 Saffron Brand BarometerSaffron Brand BarometerIntroduction

What we looked at in the study In order to provide a fair analysis, we took a cross section of 67 of the most populated cities across all continents around the world.
What we wanted to find outWhat cities best use their assets and resources in creating a strong brand to attract and retain business in their city.
6 Saffron Brand Barometer 7Introduction

As expected, developed cities such as New York, Los Angeles, Paris and Tokyo lead the way with the highest asset and buzz score. These cities are indeed using their assets to create a strong brand for doing business.
New YorkLos Angeles
San FranciscoParis
TokyoBerlin
LondonChicago
AmsterdamBarcelona
0 1 2 3 4 5 6 7 8 9 10
Key Assets: Brand strength:
8 Saffron Brand Barometer 9The Top Ten
The Top Ten

As part of our analysis, we wanted to find out which cities will be challenging the likes of New York, Paris, LA and London as a place to do business in the near future. These ‘Challengers’ are those that have average to low average asset score, but are producing buzz that is above average.
10 Saffron Brand Barometer 11The Challengers

We found that the most developed cities in Europe dominate the number 11 to 20 spots in the ranking. These cities have a lower asset score than the Top 10 but they are generating a near equivalent amount of buzz for business. However, developing cities from South America and Asia are beginning to emerge within this category. In the near future they are likely to compete with the most established cities in world to do business in. Seoul (ranked 12), Shanghai (ranked 16) and Mexico City (ranked 19) are all cities that could be taking a top 10 position in future.
Mexico CityMoscow
MelbourneSao Paulo
SydneyBuenos Aires
PragueSantiago
BudapestDelhi
0 1 2 3 4 5 6 7 8 9 10
Key Assets: Brand strength:
13Saffron Brand Barometer12 The Challengers
The Challengers
We also wanted to find out which cities are underperforming in terms of their buzz. Cities that come under this category are those which have an above average asset score, but an average or low buzz score.
14 Saffron Brand Barometer 15The Underperformers
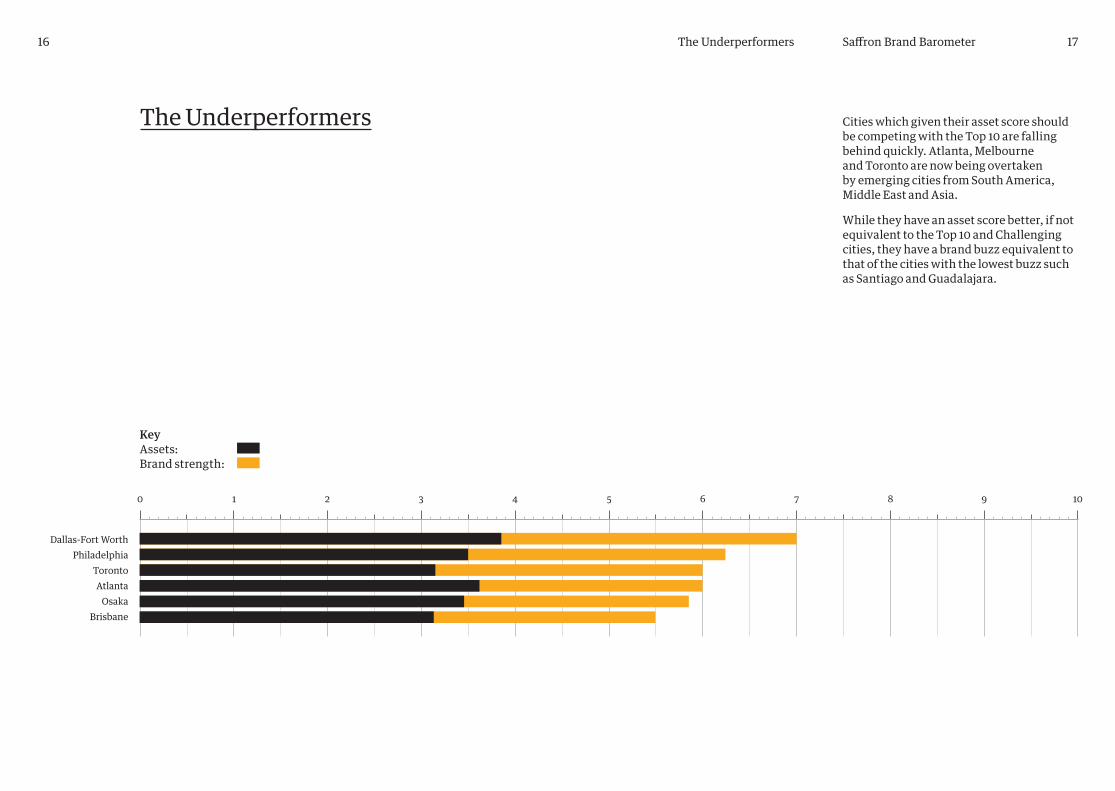
Cities which given their asset score should be competing with the Top 10 are falling behind quickly. Atlanta, Melbourne and Toronto are now being overtaken by emerging cities from South America, Middle East and Asia. While they have an asset score better, if not equivalent to the Top 10 and Challenging cities, they have a brand buzz equivalent to that of the cities with the lowest buzz such as Santiago and Guadalajara.
Dallas-Fort WorthPhiladelphia
TorontoAtlanta
OsakaBrisbane
0 1 2 3 4 5 6 7 8 9 10
Key Assets: Brand strength:
16 Saffron Brand Barometer 17The Underperformers
The Underperformers

New
Yor
kLo
s Ang
eles
San
Fran
cisc
oPa
risTo
kyo
Berli
nLo
ndon
Chic
ago
Amst
erda
mBa
rcel
ona
Ista
nbul
Seou
lM
iam
iM
adrid
Rom
eSh
angh
aiLi
sbon
Mun
ich
Mex
ico
City
Vien
naD
alla
s-Fo
rt W
orth
Mos
cow
Mel
bour
neTe
l Avi
vBe
ijing
Sao
Paul
oM
ilan
Dub
linSy
dney
Buen
os A
ires
Prag
ueLi
ma
Sant
iago
Hou
ston
Buda
pest
Stoc
khol
mD
elhi
Mum
bai (
Bom
bay)
Phila
delp
hia
Cairo
War
saw
Toro
nto
Dub
aiAt
lant
aRi
o de
Jane
iroAt
hens
Adel
aide
Guad
alaj
ara
Pert
hJa
kart
aO
saka
Joha
nnes
burg
Bris
bane
Mon
terr
eyBu
char
est
Bogo
taM
anila
Abu
Dha
biBe
lo H
oriz
onte
Sofia
Riya
dhAm
man
Beiru
tKi
nsha
saD
oha
Kara
chi
Lago
s
10
9
8
7
6
5
4
3
2
1
0
City (ranked by overall score)
Ass
ets:
Bran
d St
reng
th:
Key: The top ten: Challengers:
Underperformers:
18 Saffron Brand Barometer 19The Graph

5
4.5
4
3.5
3
2.5
2
1.5
0
1
37
9
513
33
53
3
1929
21
31
517
1535
2
18
10
614
44
4
30
12
22
42
816
26
0 1.25 1.75 2.25 2.75 3.25 3.75 4.25 4.75 5.25
23
39
11
2534
17
27
47
57
67
43
63
49
59
4161
4555
65
283848
58
24
54
64
20
40
50
60
32
52
62
36
46
56
66
Key: The top ten: Challengers:
Underperformers:
20 Saffron Brand Barometer 21The Graph

The analysis provides an interesting result for London. The city that is widely recognised as one of the major global business hub is ranked 7th in our study. Why does is rank relatively low? Looking at the data, London has an asset score to rival that of New York, for example. However, variables that bring its asset score down are ‘cost of residential living’ and ‘weather’ but these are negligible. In terms of buzz, London has a top score of 5 for all variables except for its Google Trends ranking. What this tells us is that people are not searching for London on Google as much as they might do for other cities it competes with. According to our parameters, we define this as a lower relative amount of interest in London compared to its competitors.
22 23Saffron Brand BarometerCase Study: London
Case Study: London

A major business hub in the South of the United States and home to a number of Fortune 500 companies such as Coca Cola, UPS and Delta Airlines, Atlanta surprises as it ranks 44th (below cities such as Santiago and Lima). If we look at assets such as Ease of Doing Business (5), Foreign Direct Investment (5) and High Technology Exports (4), Atlanta scores highly, but its Safety score is low (2), inevitably deterring potential businesses that wish to set up in the region. In terms of Buzz, Atlanta scores highly in Google Rankings (4.5), but a lack of positive associations with its attractions (2) and minimal conversational value (1) imply the city is not automatically a first choice destination in the minds of businesses. This suggests that Atlanta may need to reposition itself in the minds of prospects.
24 25Saffron Brand BarometerCase Study: Atlanta
Case Study: Atlanta

Developed cities such as Lisbon (ranked 17th, average asset score) may not be seen to be lucrative places to do business (as opposed to cities like Shanghai or Seoul) but still do well on buzz. The shift of investment from West to East is clear (Shanghai ranks 16th) but positive perceptions of and interest in western cities remain strong. Seoul ranks alongside Miami with matching scores for both asset and buzz strength. Its strong manufacturing base of high tech consumer goods and cars as well as a vibrant overseas diaspora have surely contributed to generating positive buzz for Southern Korea’s capital. While Seoul may not yet be able to compete with the likes of Beijing for tourism, it is rapidly closing in on our business top 10, with only 0.05 points behind Barcelona. Shanghai shows identical values to Rome for business brand strength. Rapidly having become one of Asia’s most important financial services hubs, it has driven home perceptions of China being open for foreign business. Only 0.07 points further up on our ranking is another giant of the financial markets, Chicago. While it justifies its established position with high asset scores, Shanghai has already overtaken it in terms of buzz.
2726 Saffron Brand BarometerCase Study: Seoul and Shanghai
Case Study: Seoul and Shanghai
Our Challenger cities should be joining the Top 10 in the near future as they continue to improve their asset strength and inevitably their brand buzz. We believe the Top 10 will soon have to become the Top 20 as there will be only little difference between the scores of the cities represented therein.
Similarly, developing cities are beginning to gain brand buzz for doing business and as they continue to benefit from foreign direct investment, we expect them to improve their asset strengths and consequently their buzz.
2928 Saffron Brand BarometerConclusion

Some developed and established cities such as Atlanta, Brisbane and Toronto are amongst the Underperformers because they should be competing with the Top 10 given their asset strength. However they are now being overtaken by the Challengers. These cities may consider taking appropriate action to raise the buzz that they generate internationally.
The developed cities from the West do not dominate the business world. Its cities boast higher or equal asset strengths to the Top 10 but their brand buzz is comparable to the cities with the lowest brand buzz.
3130 Saffron Brand BarometerConclusion
1
37
9
5
33
53
3
19
29
2151
7
35
2 10
6
44
4
30
22
42
8
26
23
39
31
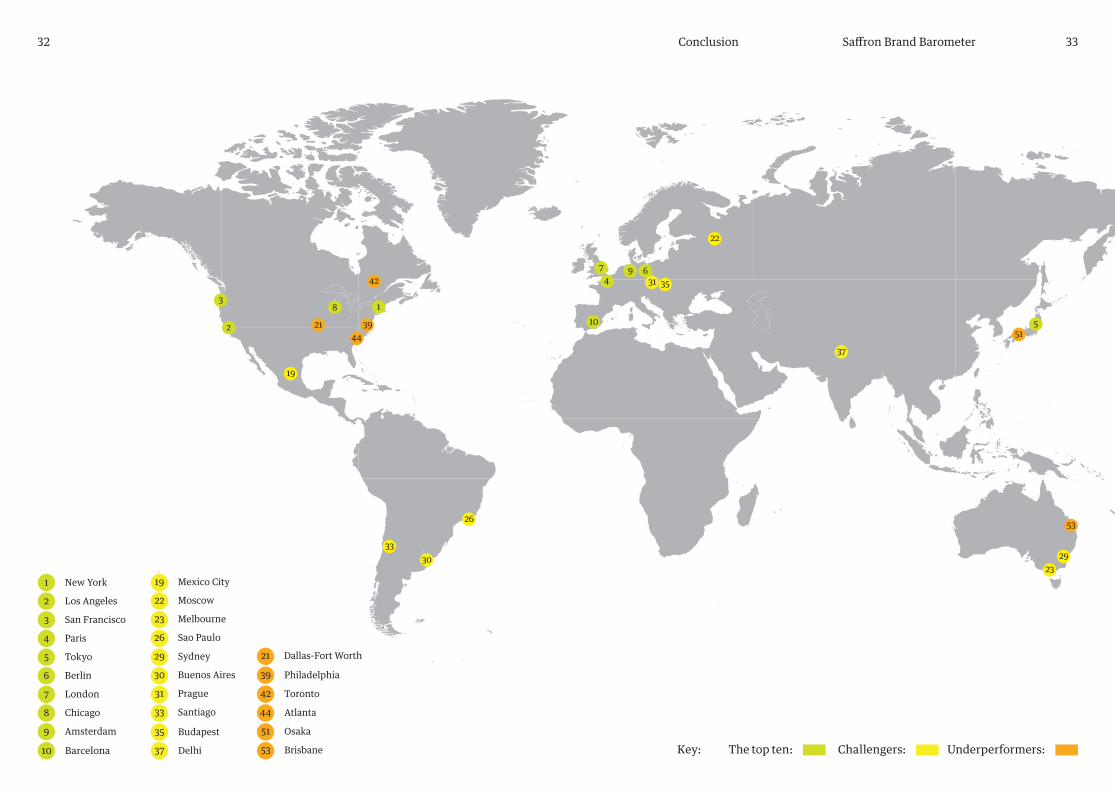
Conclusion
Key: The top ten: Challengers:
Underperformers:10 Barcelona
32 Saffron Brand Barometer 33

We scored each city on the following variables with 1 being the weakest score and 5 being the strongest:
• Quality of cuisine and restaurants
• Number of sightseeing and historical attractions
• Ease to get around on foot and public transport
• Safety
• Cost of living
• Weather
• Ease of doing business
• Foreign Direct Investment going into the city
• Whether the city invests in innovation and technology
• City GDP
Some asset variables we chose focus on residential life while others are clear business indicators. In order to calculate the total asset strength, we divided the assets into two groups:
• Assets that favour residential life (Quality of cuisine and restaurants, number of sightseeing and historical attractions, ease of getting around by foot or public transport and cost of living)
• Assets that favour business (Safety, weather, ease of doing business, foreign direct investment, investment in innovation and city gdp)
We then found the average score for each group and weighted group 2 (assets that favour business) by 75% while group 1 (assets that favour residential life) was weighted by 25%.
Naturally, buzz is a subjective measure. It calculates the general visibility of a city and whether it is held in high regard to conduct business. In order to add a quantitative element, we used Google Trends. This web analytics tool calculates how many times a city is searched for on Google. The theory being that the more times a city is searched for on Google, the more interest people have with it – the more buzz it is generating. We interpret such a high level of interest as contributing towards a strong brand.
The variables for buzz included:
– Qualitative
• Quantity and strength of historical associations
• Quantity and strength of positive/ attractive associations
• Conversational value
– Quantitative
• Google trends ranking
Data for variables 1 to 3 was gathered through an in-house Saffron poll throughout our 12 offices across the world.
The resulting scores lay between 1 to 5, with 1 being the weakest and 5 being the strongest buzz score.
How we structured our analysis
We plotted a scatter graph that examined the relationship between a city’s asset strength and the buzz it generates.
There is a direct correlation between asset strength and brand strength.
Cities with a high asset score should also have a high buzz score, implying that the city is using its assets effectively to generate a strong business brand. By contrast, cities with a low asset score should also have a low buzz score.
Cities with a combination of high asset score and high buzz score have high brand strength.
3534 Saffron Brand Barometer
How we measured asset strength
How we measured buzz strength
The Study

The following is weighted 75% to favour the analysis towards business. Data for assets 8 to 10 were found using the World Banks database.
5. Weather – We used Weatherbase.com to provide us with the average climate of each city. Weatherbase is one of the authoritative sources on finding weather records and averages for more than 41,997 cities worldwide. It collects data from a variety of public sources, including the National Climatic Data Centre.
6. Safety - We used the crime index data provided by Numbeo.com, which is the world’s largest database of user contributed data about cities and countries world wide.
7. City GDP – We used the Brookings Institution for data on a City’s GDP. The Brookings Institution is a private non-profit organization and one of the world’s oldest think-tanks, devoted to independent research and policy solutions.
8. Ease of doing business – World Bank database score.
9. Foreign Direct Investment going into the city – World Bank database score.
10. Whether the city invests innovation and technology – World Bank database score
City Business Buzz Strength – sources and explanations.
The results for the first three Buzz measurements were produced through Saffron-internal surveys. These are of course subjective but are based on informed, methodical and even-handed evaluation.
1. Quantity/strength of historical association
2. Quantity/strength of positive/attractive associations.
3. Conversational value
4. Google Trends ranking – We used Google Trends which gives an average value of the number of times a term has been searched.
Underlying methodology
Saffron’s European City Brand Barometer is the result of quantitative research, qualitative desk research, and professional judgement and experience, all of it interpreted by Saffron in way that is methodical and evenhanded.
City Business Asset Strength – weightings, sources and explanations.
The following is weighted 25% to account for residential factors:
1. Quality of cuisine and restaurants – Experience and research. We also factored in the number of Michelin star restaurants the city has.
2. Number of sightseeing and historical attractions – Experience and research. We used TripAdvisor to provide a quantitative figure as well as factoring in the physical charm of a place, since our view is that people regard this as an attraction in itself.
3. Ease to get around foot and public transport – Experience, web research and using TripAdvisor to provide a qualitative judgement.
4. Cost of residential living – Experience and research. We also used the Cost of Living index provided by Numbeo.com and Pintprice.com.
We found a correlation between asset strength and business buzz shown by slope of our graph, with a correlation coefficient (R-squared) value of 0.207, implying that 20.7% of variation in buzz can be explained by a city’s assets and visa versa. Although the correlation coefficient is relatively small, the assets do not take into account other potential significant variables such as market size for a particular industry, trade barriers, tax issues and the political stance of the city and the country in which it resides.
What we found
The Study 3736 Saffron Brand Barometer

Made by
LondonUnit 3 The Yard122 East RoadLondon N1 6FBT +44 20 7087 3460 [email protected]
Madrid Almagro 364° derecha28010 Madrid T +34 91 787 3200 [email protected]
New York 50 Lexington Avenue, Suite 4D New York, NY 10010-2928 T +1 646 568 6317 [email protected]
IstanbulBereketzade MahallesiHacı Ali SokakNo:8 D:1 34421 Galata/Beyoğlu Istanbul T +90 212 243 [email protected]
Dubai PO Box 33957, DubaiUnited Arab [email protected]
Vienna Strobelgasse 2 A-1010 Vienna T +43 1 512 18 02 [email protected]
MumbaiKohinoor Estate, 2nd Floor165, Tulsi Pipe RoadLower Parel, Mumbai – 400013T +91 22 2417 [email protected]
Miami 155 Ocean Lane DriveKey Biscayne, Miami Florida M +1 (786) 369 [email protected]

London Unit 3 The Yard122 East RoadLondon N1 6FBT +44 20 7087 3460 [email protected]
Madrid Almagro 364° derecha28010 Madrid T +34 91 787 3200 [email protected]
DubaiIstanbulLimaMiamiMumbaiNew YorkSantiagoVienna