Embed Size (px)
Citation preview

Safety IDEA Program
Safety Effects of Operator Seat Design in Large Commercial Vehicles Final Report for Safety IDEA Project 04 Prepared by: Dr. Mehdi Ahmadian and Christopher Boggs Advanced Vehicle Dynamics Laboratory Department of Mechanical Engineering Virginia Tech Blacksburg, VA May 2005

INNOVATIONS DESERVING EXPLORATORY ANALYSIS (IDEA) PROGRAMS MANAGED BY THE TRANSPORTATION RESEARCH BOARD This Safety IDEA project was funded by the Safety IDEA Program, which focuses on innovative approaches for improving railroad safety and intercity bus and truck safety. The Safety IDEA Program is funded by the Federal Motor Carrier Safety Administration (FMCSA) and the Federal Railroad Administration (FRA).
The Safety IDEA Program is one of four IDEA programs managed by TRB. The other IDEA programs are INNOVATIONS DESERVING EXPLORATORY ANALYSIS (IDEA) PROGRAMS MANAGED BY THE TRANSPORTATION RESEARCH BOARD This Safety IDEA project was funded by the Safety IDEA Program, which focuses on innovative approaches for improving railroad safety and intercity bus and truck safety. The Safety IDEA Program is funded by the Federal Motor Carrier Safety Administration (FMCSA) and the Federal Railroad Administration (FRA). • The Transit IDEA Program, which supports development and testing of innovative concepts and
methods for advancing transit practice, is funded by the Federal Transit Administration (FTA) as part of the Transit Cooperative Research Program (TCRP).
• The NCHRP Highway IDEA Program, which focuses on advances in the design, construction, and maintenance of highway systems, is funded as part of the National Cooperative Highway Research Program (NCHRP).
• The High-Speed Rail IDEA Program, which focuses on innovative methods and technology in support of the next-generation high-speed rail technology development, is funded by the FRA.
Management of the four IDEA programs is coordinated to promote the development and testing of innovative concepts, methods, and technologies for these areas of surface transportation. For information on the IDEA programs, look on the Internet at www.trb.org/idea, or contact the IDEA programs office by telephone at (202) 334-3310 or by fax at (202) 334-3471. IDEA Programs Transportation Research Board 500 Fifth Street, NW Washington, DC 20001
The project that is the subject of this contractor-authored report was a part of the Innovations Deserving Exploratory Analysis (IDEA) Programs, which are managed by the Transportation Research Board (TRB) with the approval of the Governing Board of the National Research Council. The members of the oversight committee that monitored the project and reviewed the report were chosen for their special competencies and with regard for appropriate balance. The views expressed in this report are those of the contractor who conducted the investigation documented in this report and do not necessarily reflect those of the Transportation Research Board, the National Research Council, or the sponsors of the IDEA Programs. This document has not been edited by TRB. The Transportation Research Board of the National Academies, the National Research Council, and the organizations that sponsor the IDEA Programs do not endorse products or manufacturers. Trade or manufacturers' names appear herein solely because they are considered essential to the object of the investigation.

SAFETY EFFECTS OF OPERATOR SEAT DESIGN
IN LARGE COMMERCIAL VEHICLES
Final Report
Safety IDEA Project 04
Prepared for
Safety IDEA Program
Transportation Research Board
National Research Council
Prepared by
Dr. Mehdi Ahmadian and Christopher Boggs
Advanced Vehicle Dynamics Laboratory
Department of Mechanical Engineering
Virginia Tech
Blacksburg, VA
May 2005
Acknowledgements
We would like to thank the sponsors of this project, the Transportation Research Board’s Safety IDEA Program and The ROHO Group. Special thanks are due to all the people who worked hard to make this project a success. Specifically, we would like to acknowledge the support and help of Denny Clapper of The ROHO Group; Skip Yeakel and Stefan Jansson from Volvo Trucks North America (VTNA); and Bobby Adkins, Bobby Spaugh, and the drivers from the Greensboro terminal of Averitt Express. The ROHO Group manufactured the seat cushions tested in this project We also extend our gratitude to Harvey Berlin, Senior Program Officer for the Safety IDEA Program, as well as our Expert Review Panel members Steve Jahns (PACCAR), Stefan Jannson (VTNA), Dennis Gryp, (Sears Seating), and Denny Clapper (The ROHO Group).
TABLE OF CONTENTS
Acknowledgements ..............................................................................................................................................................iv
List of Figures.......................................................................................................................................................................vi
List of Tables...................................................................................................................................................................... vii
Executive Summary...............................................................................................................................................................1
Section 1: IDEA Product .......................................................................................................................................................3 1.1 Statement of Need ........................................................................................................................................................3 1.2 Potential Impact ..........................................................................................................................................................3 1.3 Challenge.....................................................................................................................................................................4
Section 2: Concept and Innovation........................................................................................................................................4 2.1 Concept........................................................................................................................................................................4
Pressure Measurement System ......................................................................................................................................5 Area Pressure Change Rate (aPcrms) ............................................................................................................................6 Seat Pressure Distribution (SPD%) ...............................................................................................................................7 Other Pressure Measures ...............................................................................................................................................8 Hypothesis Tests............................................................................................................................................................9
2.2 Innovation..................................................................................................................................................................10
Section 3: Investigation .......................................................................................................................................................10 3.1 Test Plan....................................................................................................................................................................10 3.2 Subjective Data Analysis ...........................................................................................................................................13
Overall Driver Preference............................................................................................................................................13 Test Drive Survey........................................................................................................................................................15 Road Survey ................................................................................................................................................................17 Summary of Subjective Analysis.................................................................................................................................20
3.3 Objective Data Analysis ............................................................................................................................................21 Static Pressure Maps....................................................................................................................................................21 Dynamic Pressure Maps ..............................................................................................................................................22 Summary of Objective Analysis ..................................................................................................................................26
3.4 Combined Analysis ....................................................................................................................................................26 Question 1: Subjective Response.................................................................................................................................26 Question 2: Objective Measures to Support Subjective Response ..............................................................................27 Question 3: Relationship between Subjective Response and Objective Measures ......................................................28 Question 4: Improved Experimental Design................................................................................................................31
Section 4: Plans for Implementation....................................................................................................................................33
Section 5: Conclusion..........................................................................................................................................................33
Investigator Profile ..............................................................................................................................................................36
References ...........................................................................................................................................................................36
LIST OF FIGURES
Figure 2.1-1. Tekscan BPMS system....................................................................................................................................5
Figure 2.1-2. Tekscan BPMS software.................................................................................................................................6
Figure 2.1-3. Air-inflated seat cushion mounted on original truck seat................................................................................6
Figure 2.1-4. Top view of pressure pad in vehicle coordinate system..................................................................................8
Figure 3.1-1. Volvo VN 300 in Averitt Express dual-service fleet ....................................................................................10
Figure 3.1-2. Air-inflated seat cushion mounted on original truck seat..............................................................................11
Figure 3.2-1. Average comfort response for “test drive” surveys.......................................................................................16
Figure 3.2-2. Average support response for “test drive” surveys .......................................................................................16
Figure 3.2-3. Support score over time ................................................................................................................................19
Figure 3.2-4. Comfort score over time ...............................................................................................................................19
Figure 3.2-5. Fatigue score over time .................................................................................................................................20
Figure 3.2-6. Percent improvement for air-inflated seat cushion........................................................................................20
Figure 3.3-1. Sample static pressure distributions: (a) foam before, (b) foam after, (c) air-inflated before, (d) air-inflated after......................................................................................................................................................................................21
Figure 3.3-2. Averaged histogram of static pressure distributions .....................................................................................22
Figure 3.3-3. aPcrms over time...........................................................................................................................................24
Figure 3.3-4. Mean area over time......................................................................................................................................24
Figure 3.3-5. Mean COPx over time...................................................................................................................................25
Figure 3.3-6. Percent change for air-inflated seat cushion .................................................................................................26
Figure 3.4-1. Summary of objective and subjective data....................................................................................................28
Figure 3.4-2. Correlations of objective and subjective data: (a) absolute data correlation, (b) relative data correlation...29
Figure 3.4-3. Effect of experimental design on absolute correlation: (a) this study, (b) ideal design ...............................32
LIST OF TABLES
Table 2.1-1. Weighting factors for aPcrms...........................................................................................................................7
Table 3.1-1. Summary of test routes...................................................................................................................................11
Table 3.1-2. Summary of driver demographic information ................................................................................................12
Table 3.1-3. Driving survey for each hour..........................................................................................................................13
Table 3.2-1. Driver likes and dislikes for air-inflated seat cushion ....................................................................................14
Table 3.2-2. Exit interview question 1................................................................................................................................14
Table 3.2-3. Exit interview question 2................................................................................................................................15
Table 3.2-4. Exit interview question 3................................................................................................................................15
Table 3.2-5. Scores for “test drive” survey.........................................................................................................................17
Table 3.2-6. Summary of significant differences on hourly basis, air-inflated cushion - foam seat cushion ....................18
Table 3.2-7. Hourly scores for road tests............................................................................................................................18
Table 3.3-2. Significant differences between seat cushions ...............................................................................................23
Table 3.3-3. Correlation of difference with aPcrms............................................................................................................23
Table 3.3-4. Summary of hourly measures.........................................................................................................................25
Table 3.4-1. Summary of subjective and objective data .....................................................................................................28
Table 3.4-2. Summary of means for objective and subjective data ....................................................................................30
Table 3.4-3. Summary of correlation results ......................................................................................................................30
- 1 -
EXECUTIVE SUMMARY This final report has been prepared by the Advanced Vehicle Dynamics Lab (AVDL) at Virginia Tech for the Safety IDEA Program, as part of the completion requirements for the project entitled “Safety Effects of Operator Seat Design in Large Commercial Vehicles”. This report and the work in this project have been reviewed by the Expert Review Panel (ERP) for this project. This report documents our project accomplishments and results, as specified in the IDEA Report Guidelines. The executive summary highlights key points that are explained in detail in this report. A series of road tests were performed using commercial truck drivers in the daily operations of a revenue service fleet. Drivers were asked a series of questions to assess subjective performance of the vehicle environment, and pressure distribution measurements were collected throughout each test session. This data was then analyzed to assess the validity of two newly proposed measures to evaluate subjective ratings of driver fatigue. The results highlight the advantages of using these measures to evaluate the fatigue performance of distinct types of seat cushions – namely foam and air-inflated seat cushions. This project was conducted with the support and help of several industrial partners. The ROHO Group manufactured the air-inflated seat cushions and provided six seat cushions for testing. Volvo Trucks of North America (VTNA) helped the investigators coordinate with a suitable commercial trucking fleet for field testing. Averitt Express allowed us to use their operations to conduct this study. The overall subjective response was more favorable toward the air-inflated seat cushion. When asked “which seat would you prefer to drive on?”, 10 out of 12 drivers said they preferred the air-inflated seat cushion, while the remaining two were opinion-neutral. Overall, we see an 18% improvement in Comfort Score, a 56% improvement in Support Score, and a 14% improvement in Fatigue Score. Based on our subjective results, we find that air-inflated cushions offer advantages in terms of comfort, support, and fatigue. More detailed questioning on driver opinions highlighted some reason for the subjective ratings. The increased adjustability in an air-inflated cushion leads to an improved ability to accommodate diverse populations of drivers. This increased adjustability, however, also carries with it some difficulty, such as increased complexity and making it harder for drivers to get in and out. Even with these weaknesses, air-inflated cushions were preferred over foam cushions. Air-inflated seat cushions naturally offer advantages over foam cushions, and with some minor improvements and increased industry awareness of the benefits of air-inflated seat cushions, they should become a popular alternative to standard foam seats in the near future. Since the major physical difference between these two seat cushions is the pressure distribution at the body-seat cushion interface, it follows that any significant change in subjective rating would correspond to a significant change in the measures used to summarize the pressure distribution. We calculated 16 different measures to summarize each dynamic pressure sample. From the original set of 16 dynamic measures, we reduced the number of measures we considered to three. These three remaining measures both highlight characteristic differences between seat cushions and each measure contains unique information. The first measure we found was the Area Pressure Change Rate (aPcrms). This measure is used to evaluate the effect of a dynamic environment on driver fatigue. On average, we found that aPcrms was 18% lower for the air-inflated cushion compared to the foam cushion. This reduction corresponds to lower exposure to higher pressures critical to human response in the seated area, which constricts blood flow. This indicates that the air-inflated seat cushion would promote better blood flow to the tissue in the seated area. The second measure is Mean Area, or contact area over the seat cushion. We found the contact area to be 3% higher for the air-inflated seat cushion. A higher contact area reduces the pressure on the seat cushion. For the pressures experienced in this study, our results indicate that a higher contact area leads to improved subjective ratings. The third measure is longitudinal (forward-backward) center of pressure (COPx). This measure describes where weight is being applied to the seat cushion. Drivers sit back about 1.5 inches further back on the air-inflated seat cushion. This is perhaps due to a difference in contouring, where the body’s weight is shifted further back on the seat cushion or the driver is supported in a more reclined posture. As the driver leans backward, the driver’s weight shifts from the seat cushion to the seat back. The reduction of weight on the seat cushion will reduce mean pressure. The increased weight
- 2 -
on the seat back will change how the seat back contouring supports the driver, which may have positive or negative effects, depending on physical characteristics and preferences of the driver. We then compared the mean effect of objective and subjective data for both seat cushions. This allows us to observe the relationships between the means of this data. The air-inflated seat cushion saw an improvement in subjective rating in Comfort Score, Support Score, and Fatigue Score. While each subjective rating improved on the air-inflated seat cushion, the three measures we describe characterize the causes for this subjective improvement. We also considered the correlation of the relative objective and subjective data, but since the data was dominated by the mean effect of the seat cushion, the small changes of subjective and objective data on an individual seat cushion may show weaker results than expected. We then considered alternative experimental designs, where three or more seat cushions must be tested. This design is needed to establish a correlation with data dominated by the mean effect. The challenges involved in implementing these designs are then discussed. Despite these alternatives, we feel that our original experimental design is favorable to maintain valid relative subjective responses between seat cushions. Finally, we describe our plan for implementing the results from this study. As outlined in Section 1 of this report, the results of this investigation will have significant impact. However, the significance of these results must be communicated to a large section of the truck and bus community to realize this impact. To this end, the investigators have taken actions and are planning future action to make the results of this study relevant and available to the truck and bus community by several avenues. First, we have conducted this study in close partnership with industrial partners to ensure that their input has been included throughout this study and, more importantly, the results of the study are relevant to the end users for improving their practices. After ensuring that the results of this study are relevant to the end users, we must then actively make these results available and highlight their benefits for the transportation community. We intend to further communicate our findings to the transportation community and assist in transferring the results to those industries and trade organizations that can benefit from this work. Specifically, we intend to
• Write a series of papers at SAE technical conferences to highlight the benefits of using these measures to evaluate truck seat cushion designs for driver fatigue,
• Make presentations at industry partners, trade shows, and conferences,
• Write journal papers to create a permanent reference to this work, and
• Write a seat cushion fatigue evaluation standard as part of the SAE Human Factors Subcommittee
This work will also be directly implemented in cooperation with our sponsor and industrial partner, The ROHO Group, which manufactured the seat cushions tested in this project. First, they will use the results from this study in their technical and marketing materials to promote their product and the use of the proposed measure. Second, they will implement the results in this study by improving their future seat cushion designs and comparing different seat cushion designs.

- 3 -
SECTION 1: IDEA PRODUCT This research seeks to develop an evaluation method to compare driver fatigue between a variety of different seat cushions. Specifically, we focus on evaluating fatigue between two distinct types of seat cushions, specifically foam and air-inflated seat cushions. This work builds upon our earlier studies on finding efficient and scientific methodologies that can be used by the commercial transportation community for relating seat dynamics with driver fatigue 1,2. Whereas our previous studies used a single axis test rig for understanding some of the fundamentals of the interaction between the dynamic human-vehicle interface and human fatigue, this study conducts a series of road tests with a group of Class 8 trucks for the purpose of
• Better understanding the relationship between vehicle seat design and driver fatigue, and in particular how it can affect vehicle safety, in terms of driver alertness and attentiveness, reduced rates of accidents, frequency of near misses, and ability to perform the tasks that are commonly required while driving,
• Improving two newly proposed methods and increasing the transportation industry’s confidence in their utility for objectively assessing the fatigue effects of vehicle seats, and
• Providing design guidelines that can be used for evaluating and improving fatigue characteristics of vehicle seats since, to the best of our knowledge, most guidelines currently available are confined to comfort – an issue different from fatigue.
Throughout this document, the term “comfort” is used to define the short-term effect of a seat on the human body, which is commonly the sensation that occurs from sitting on a seat for a short period of time. In contrast, the term “fatigue” is used to define the physical effect that results from exposure to the seat dynamics for a long period of time. 1.1 STATEMENT OF NEED The need for the proposed research arises because fatigue is a major factor in commercial vehicle accidents, as shown by several investigators, including the U.S. Department of Transportation 3. The need for this study is further heightened by a number of recent legislative initiatives set forward by various government agencies. The Federal Motor Carrier Safety Administration (FMCSA) has released its Safety Action Plan, which calls for reducing fatalities in crashes involving large trucks by as much as 50% and decreasing injuries by at least 20% 4. The DOT has submitted its commercial truck driver hours-of-service (HOS) reform plan to Congress to restrict the hours that truck drivers can work 5. The Occupational Safety and Health Administration (OSHA) has proposed a set of ergonomic rules to reduce and prevent repetitive motion-related workplace injury 5. Vehicle vibrations, which commercial vehicle drivers are subjected to, would be part of the OSHA ergonomic standard. The above efforts require a better understanding of human fatigue in commercial vehicles, in particular as it relates to the vehicle design and operating environment, through efficient and scientifically based methods that can be used effectively in practice. Through the years, the transportation industry has attempted to address the issue of driver fatigue in vehicles. However, a large number of open issues regarding fatigue in general and the effect of the driver seat design in particular still remain. These must be addressed before we can create a less fatiguing and safer environment in commercial vehicles. 1.2 POTENTIAL IMPACT The potential direct impact of the proposed research to the transportation industry would be quite significant, in terms of
• Promoting seat designs and driving practices that would reduce driver fatigue and increase vehicle safety,
• Establishing more effective methods for evaluating and estimating fatigue, and
• Understanding the relationship between driver fatigue and seat designs under different driving conditions.
It is worth noting that although we have used semi-trucks for conducting this research, the findings of the study are expected to be directly applicable to other areas of commercial transportation, including railway vehicles, inter-city busses, and commuter busses. Many of the operator fatigue issues due to the vehicle seat, and the related safety issues, are common among different modes of commercial transportation.
- 4 -
In addition, based on research by the U.S. Department of Transportation (DOT) indicating that fatigue is a major factor in commercial vehicle accidents, the findings of this research will have the following potential payoffs in practice:
• Increased highway safety due to lower operator fatigue and increased task proficiency,
• Reduced incidents of health complaints due to prolonged exposure to seat dynamics,
• Increased productivity and reduced lost work time due to health issues, and
• Increased driver satisfaction and a higher rate of driver retention.
1.3 CHALLENGE While the benefit of a reliable measure to evaluate driver fatigue caused by the dynamic environment is clear, there are many obstacles that have prevented researchers in establishing such measures. The fundamental difficulty is the effect of the dynamic human-vehicle interface on human fatigue is not well known. Studies have established several validated measures that can be used to evaluate driver comfort. Validation of these measures is performed by finding some deterministic relationship between physical data and driver comfort surveys. While there have been good results in the area of comfort, many studies have shown that there is little correlation between comfort (the short-term sensation) and fatigue (the long-term physical effect) of a seat. In other words, what may feel comfortable upon initial contact with the human body will not necessarily be less fatiguing in the long run. Driver fatigue is caused by many factors, including physical (cab physical environment), physiological (driver sleep, health, diet), and psychological factors (driver motivation). The physical factors that affect driver fatigue include the pressure profile at the seat area, posture, body dynamics and vibrations, and a number of environmental factors that directly impact the physical environment in the vehicle cab. In this study, we are investigating the effect of one physical factor on driver fatigue by controlling seat cushion design in the presence of many other uncontrolled factors. Therefore, one challenge is observing the effect of a controlled change of one physical factor (seat design) on driver fatigue in the presence of other uncontrolled factors which increase the uncertainty of the fatigue measurements. Subjective testing is further complicated by subject variability, which includes physical, physiological, and psychological differences between drivers. Since this variability makes it harder to find significant trends, larger sample sizes are needed to reduce the effect of this variability. In the scope of a comfort study, a large sample size is feasible, as each subject’s evaluation may take only a few minutes. In the case of a fatigue study, however, large sample size is not practical, as it can greatly increase both cost and time, since each subject’s fatigue evaluation can take hours or even days. Therefore, the challenge facing the scientific community, original equipment manufacturers (OEM), and seat suppliers is how to evaluate fatigue based on a set of physical measurements that can be readily made in the vehicle and on the operator, and use that data to establish operator fatigue. Although a preliminary laboratory study by the Principal Investigator has attempted to address this challenge 1,2, much work still remains in terms of further validating the proposed methodologies through more realistic field tests. SECTION 2: CONCEPT AND INNOVATION This section highlights the IDEA concept and innovation, and presents the scope of this study and the methods we employed to satisfy our objectives. These concepts frame the results and discussion that will be presented in the remainder of this report. We also describe the pressure measurement system and the pressure measures that are used in this study to evaluate differences of fatigue between the foam and air-inflated seat cushions, specifically aPcrms and SPD%. These measures highlight the characteristic differences between the foam and air-inflated seat cushions. Other physical measures are also used in our analysis, which are highlighted for clarity. 2.1 CONCEPT The primary objectives of this study are to

- 5 -
1. Further validate recently developed methodologies for evaluating the effect of vehicle seats on operator fatigue,
2. Investigate the effect of vehicle seat design on operator fatigue and vehicle safety, and
3. Provide design guidelines that can be used for evaluating and improving fatigue characteristics of vehicle seats.
To achieve the first objective, this study will validate the use of two newly proposed measures to evaluate driver fatigue by conducting a field test in the daily operations of a revenue fleet service. If these measures show some relation to driver fatigue, they can be used to complete objectives 2 and 3. The following sections highlight the pressure measurement system, the newly proposed measures, and some analysis methods that will be used in this study. Pressure Measurement System Pressure distributions at the body’s interface with the seat cushion are captured using the Tekscan Body Pressure Measurement System (BPMS), shown in Figure 2.1-1. This system has 4 main components:
• Pressure Sensing Pad
• Sensor Handle
• PC Interface Board and BPMS 5.01 Software
• Calibration Unit
Figure 2.1-1. Tekscan BPMS system
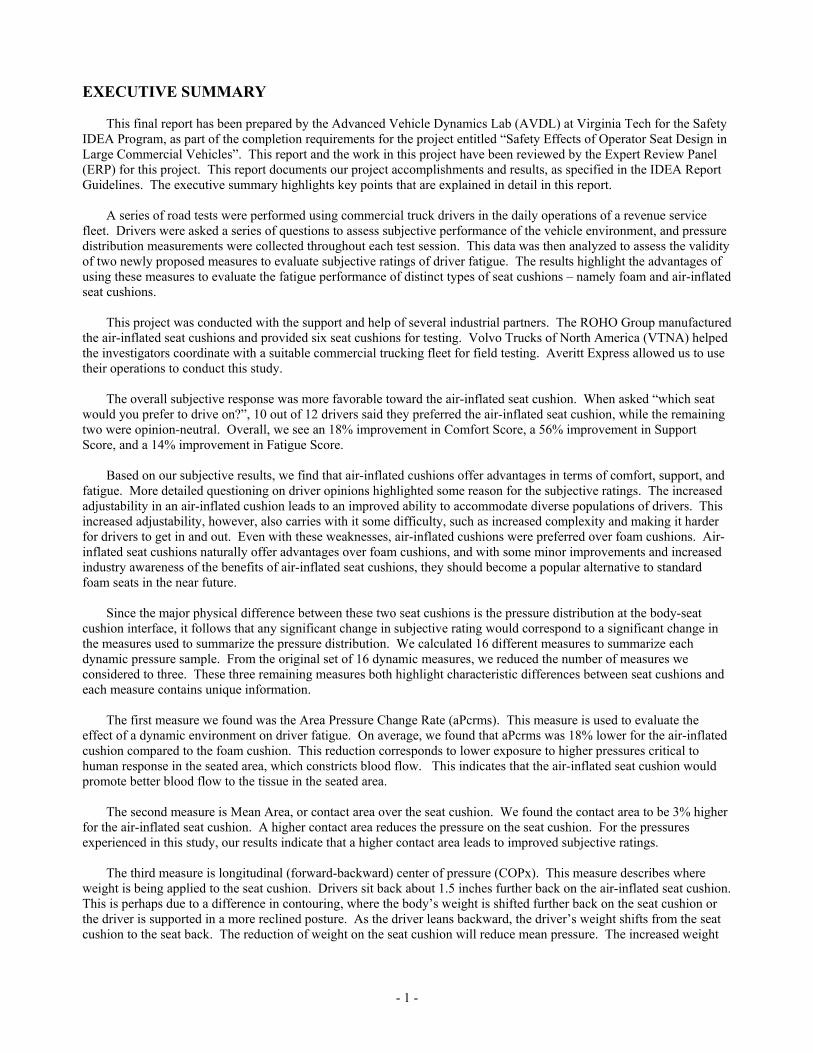
Pressure distribution mapping is performed using a thin flexible resistive-based sensor pad featuring a 42 by 48 array of individual 0.16 in2 pressure-sensing elements 6. Pressure is recorded either for a single static frame or for a series of dynamic frames on each cell into a movie file in the BPMS Software, seen in Figure 2.1-2. Static maps will be taken before and after each test session. Dynamic maps are recorded while driving once every 10 minutes for 10 seconds at 30 frames per second. These movie file are exported into ASCII format for post-processing in MATLAB.
- 6 -
Figure 2.1-2. Tekscan BPMS software
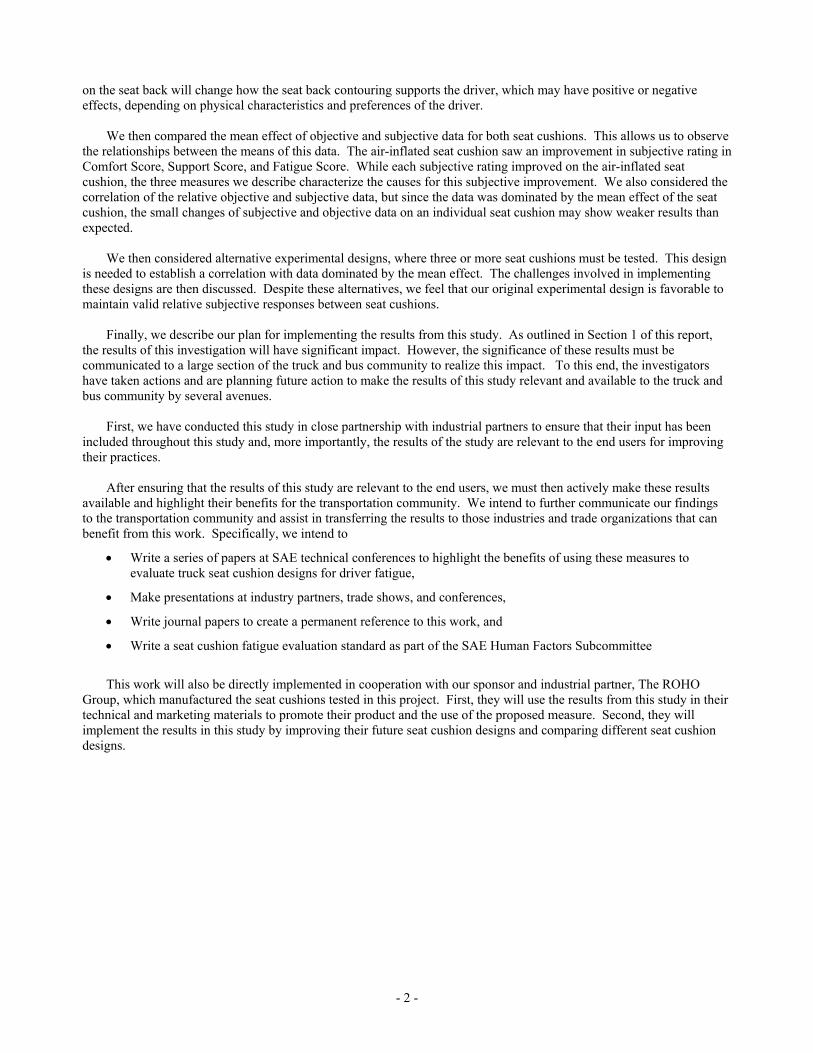
In this study, we use a pressure pad over the seat cushion to capture seat cushion pressure interfaces, as shown in Figure 2.1-3, allowing us to focus on the interface between the seat cushion and the driver. This helps us interpret our subjective results, and improve our understanding of how pressure distribution on the seat cushion is related to driver comfort and fatigue.
Figure 2.1-3. Air-inflated seat cushion mounted on original truck seat
To keep the pressure pad from sliding during each driving session, Velcro was sewn along the edges of the green pressure pad sleeve. Special care must be taken to position the pressure pad sleeves without loading the pressure pad before the driver is seated. Area Pressure Change Rate (aPcrms) When sitting on a surface, the soft tissues can be compressed and deformed by the underlying skeletal structure, particularly at the bony prominences (ischial tuberocities). At extreme pressures, this creates an obstruction of the blood supply, resulting in a deficiency of oxygen to tissue, causing discomfort and possibly fatigue. For this reason, it is

- 7 -
believed that the pressure distribution at the human-seat interface must be incorporated into any objective measurement of comfort and/or fatigue. Studies have shown relationship between comfort and the RMS value of the pressure change rate (Pcrms)7
2/1
0
21
= ∫
Tdt
dtdP
TPcrms 2-1
While this measure has been used to rate driver comfort in a dynamic environment, it is a purely physical measure with no consideration of human perception. Previous work has shown a relationship between fatigue and a weighted form of the Pcrms, known as the aPcrms. This measure is found by partitioning the pressure map into n pressure ranges, where the i th range has area Ai. Then Pressure Change Rate for each range (Pcrmsi) is weighted by the area (Ai) and some weighting factor (Wi), as shown in Equation 2-2.
∑=
=n
iiii WAPcrmsaPcrms
1 2-2
This method allows fine-tuning of Pcrms using a discrete weighting function that can be adjusted to better predict human response. The selections of the weighting factors in Table 2.1-1 are based on the physiological effect of pressure on human cells in different pressure ranges. Past studies have established that the partial pressure of oxygen (PO2) in the arterial blood is at about 95 mmHg, and the PO2 in the interstitial fluid immediately outside the capillary is approximately 40 mmHg. Therefore, a pressure difference of 55 mmHg exists and causes diffusion of oxygen into the cells. If peak pressures in the tissue exceed 95 mmHg, then the cells are deprived of oxygen. Therefore, we select a higher weighting factor for pressures exceeding 60 mmHg, and increase it every 20 mmHg to more accurately reflect the effect of higher pressures on the human tissue. The following procedure was used to calculate aPcrms in this study 2:
1. Determine the contact area (Ai) from the pressure map data for each of the pressure ranges ri in Table 2.1-1.
2. Determine cells with average pressure greater than 40 mmHg.
3. Eliminate bad pressure data by computing the average pressure reading and standard deviation for each cell over an entire data block. Eliminate any pressure reading that is greater than +3 standard deviations from the average. Recalculate average pressure reading for each cell.
4. Calculate Pcrms for each cell using Equation 2-1.
5. Calculate an Average Pcrms (Pcrmsi) for each of the pressure ranges ri in Table 2.1-1.
6. Calculate aPcrms using Equation 2-2 and the weighting factors in Table 2.1-1.
Table 2.1-1. Weighting factors for aPcrms
iPressure Range, r i
Weighting Factor, W i
1 40 to 60 mmHg 12 60 to 80 mmHg 23 80 to 100 mmHg 34 Over 100 mmHg 4
Seat Pressure Distribution (SPD%) Research in seat comfort has established a positive relationship between uniform pressure distribution and perceived comfort 8. Furthermore, lower pressures are always more desirable in terms of long-term tissue integrity. Since a uniform pressure alleviates highly concentrated pressure, it follows that a more uniform distribution may be preferable in

- 8 -
terms of comfort and fatigue. Seat Pressure Distribution (SPD%) is a measure that is used to evaluate the ability of a seat cushion to uniformly distribute pressure. This is found by
( )
%100 x 2
%100 x 4
%2
21
2
≈
−=∑= v
np
ppSPD
m
n
imi
2-3
where pi is the pressure of the i th cell, pm is the mean pressure of the active cells, and n is the number of active cells. One may note that SPD% is proportional to the squared coefficient of variation (v) for the pressure distribution. A lower percentage value describes a more uniform pressure distribution at the seat cushion. For a uniform seat pressure distribution, each pressure (pi) would be equal to the mean pressure (pm), resulting in a value of zero. Note that SPD% can be used for both static and dynamic environments. A dynamic SPD% calculation uses the SPD% for each frame of pressure data within a data block. A time trace of dynamic SPD% can be examined to determine the ability of the seat cushion to maintain uniform pressure. Other Pressure Measures Several other common pressure measures are used in this study. This section highlights these measures for clarity. One measure that is used for summarizing pressure data is the center of pressure on the seat cushion. Center of pressure can be found for a single static pressure map or for each frame within a dynamic pressure map. The center of pressure measurement is calculated using the static pressure map in the pressure pad’s local coordinate system defined by the rows and columns of the pressure pad, which follows the seat contour. This is then transferred to the SAE vehicle coordinate system. We also set the origin at the pressure cell in the corner closest to the pressure handle, which is located at the front-right corner of the seat cushion, as shown in Figure 2.1-4.
Seat Back
Pressure Pad
Seat Cushion Sensor
Handle
Y
X
Seat Back
Pressure Pad
Seat Cushion Sensor
Handle
Y
X
Figure 2.1-4. Top view of pressure pad in vehicle coordinate system
For reporting center of pressure, we assume the pressure pad’s coordinate system aligns with the vehicle coordinate system. This is an approximation, since the pressure pad may be slightly misaligned with the vehicle coordinate system and the pressure pad’s coordinate system follows the seat contour, so it does not lie in any single plane. It should be noted, however, that the center of pressure measurement is in the pressure pad’s coordinate system, which follows a surface in space, so it is only approximate in the vehicle coordinate system. In addition to the above measures, Average Contact Pressure and Contact Area can be calculated for one static frame or for each frame in a dynamic data block. Many of these measures that result in a time trace for each data block are summarized by taking means and standard deviations over time.
- 9 -
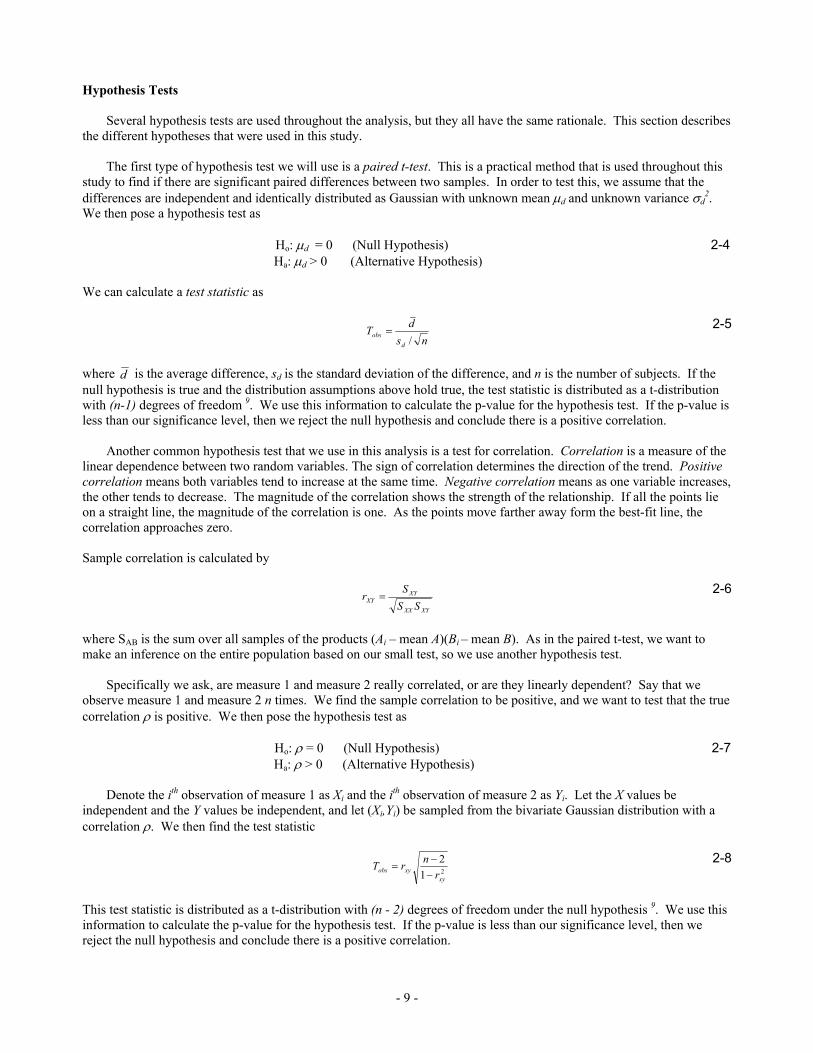
Hypothesis Tests Several hypothesis tests are used throughout the analysis, but they all have the same rationale. This section describes the different hypotheses that were used in this study. The first type of hypothesis test we will use is a paired t-test. This is a practical method that is used throughout this study to find if there are significant paired differences between two samples. In order to test this, we assume that the differences are independent and identically distributed as Gaussian with unknown mean µd and unknown variance σd
2. We then pose a hypothesis test as
Ho: µd = 0 (Null Hypothesis) 2-4 Ha: µd > 0 (Alternative Hypothesis)
We can calculate a test statistic as
nsdT
dobs /
= 2-5
where d is the average difference, sd is the standard deviation of the difference, and n is the number of subjects. If the null hypothesis is true and the distribution assumptions above hold true, the test statistic is distributed as a t-distribution with (n-1) degrees of freedom 9. We use this information to calculate the p-value for the hypothesis test. If the p-value is less than our significance level, then we reject the null hypothesis and conclude there is a positive correlation. Another common hypothesis test that we use in this analysis is a test for correlation. Correlation is a measure of the linear dependence between two random variables. The sign of correlation determines the direction of the trend. Positive correlation means both variables tend to increase at the same time. Negative correlation means as one variable increases, the other tends to decrease. The magnitude of the correlation shows the strength of the relationship. If all the points lie on a straight line, the magnitude of the correlation is one. As the points move farther away form the best-fit line, the correlation approaches zero. Sample correlation is calculated by
XYXX
XYXY SS
Sr = 2-6
where SAB is the sum over all samples of the products (Ai – mean A)(Bi – mean B). As in the paired t-test, we want to make an inference on the entire population based on our small test, so we use another hypothesis test. Specifically we ask, are measure 1 and measure 2 really correlated, or are they linearly dependent? Say that we observe measure 1 and measure 2 n times. We find the sample correlation to be positive, and we want to test that the true correlation ρ is positive. We then pose the hypothesis test as
Ho: ρ = 0 (Null Hypothesis) 2-7 Ha: ρ > 0 (Alternative Hypothesis) Denote the ith observation of measure 1 as Xi and the ith observation of measure 2 as Yi. Let the X values be independent and the Y values be independent, and let (Xi,Yi) be sampled from the bivariate Gaussian distribution with a correlation ρ. We then find the test statistic
212
xyxyobs r
nrT−−
= 2-8
This test statistic is distributed as a t-distribution with (n - 2) degrees of freedom under the null hypothesis 9. We use this information to calculate the p-value for the hypothesis test. If the p-value is less than our significance level, then we reject the null hypothesis and conclude there is a positive correlation.

- 10 -
2.2 INNOVATION This primary innovation of this study stems from the fact that
1. Very little is known about the effect of commercial vehicle seats on operator fatigue; specifically, the effect of seat cushions,
2. No studies have evaluated alternative designs and technologies to the standard foam cushions that have been used in commercial vehicle seats since nearly the inception of vehicle seats, and
3. There exists no scientifically proven and effective objective method for evaluating operator fatigue in commercial vehicles in a manner that can accurately correlate with subjective evaluation of fatigue.
SECTION 3: INVESTIGATION This section details the investigation in this study, which is used to satisfy the goals outlined in the previous two sections. We will first introduce the test procedure, and then we will analyze the experimental results in terms of subjective data, objective data, and the relationship between the two data sets. 3.1 TEST PLAN Road tests were performed using existing commercial trucks during the daily operations of Averitt Express. This fleet consists of the Volvo VN 300, as shown in Figure 3.1-1. Each of these vehicles has an air ride seat with a foam seat cushion in good or excellent condition from National Seating. This study used most of the dual-service vehicles available at the Greensboro, NC terminal of Averitt Express. These dual-service vehicles perform local delivery service during the day and shuttle service between terminals at night.
Figure 3.1-1. Volvo VN 300 in Averitt Express dual-service fleet
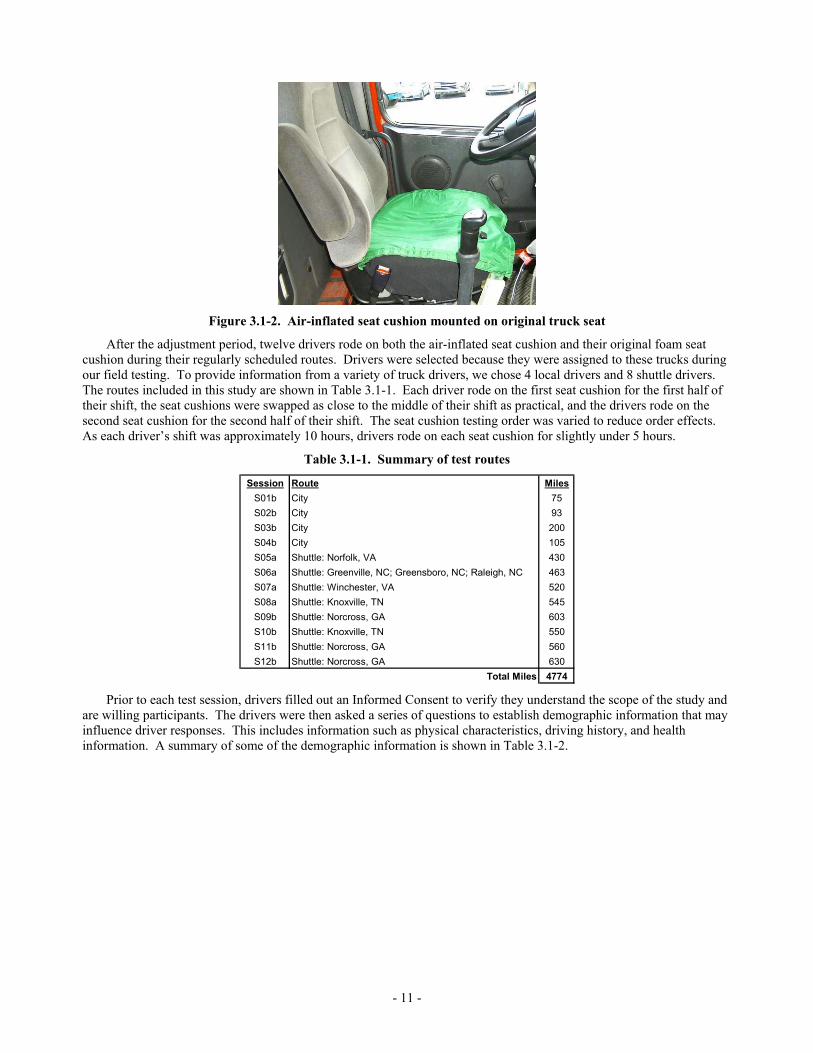
Six retrofit air-inflated seat cushions were installed in the fleet trucks as shown in Figure 3.1-2, and the drivers were allowed to become familiar with the seats during approximately two weeks. This settling time was designed to give the drivers sufficient time to find a comfortable seat adjustment and develop some long-term impressions on the seat cushion. Each driver was personally instructed on how to adjust the air-inflated seat cushion to better accommodate their preferences, and they were also given a copy of a procedure for installing and adjusting the cushion for further reference.
- 11 -
Figure 3.1-2. Air-inflated seat cushion mounted on original truck seat
After the adjustment period, twelve drivers rode on both the air-inflated seat cushion and their original foam seat cushion during their regularly scheduled routes. Drivers were selected because they were assigned to these trucks during our field testing. To provide information from a variety of truck drivers, we chose 4 local drivers and 8 shuttle drivers. The routes included in this study are shown in Table 3.1-1. Each driver rode on the first seat cushion for the first half of their shift, the seat cushions were swapped as close to the middle of their shift as practical, and the drivers rode on the second seat cushion for the second half of their shift. The seat cushion testing order was varied to reduce order effects. As each driver’s shift was approximately 10 hours, drivers rode on each seat cushion for slightly under 5 hours.
Table 3.1-1. Summary of test routes
Session Route MilesS01b City 75S02b City 93S03b City 200S04b City 105S05a Shuttle: Norfolk, VA 430S06a Shuttle: Greenville, NC; Greensboro, NC; Raleigh, NC 463S07a Shuttle: Winchester, VA 520S08a Shuttle: Knoxville, TN 545S09b Shuttle: Norcross, GA 603S10b Shuttle: Knoxville, TN 550S11b Shuttle: Norcross, GA 560S12b Shuttle: Norcross, GA 630
Total Miles 4774 Prior to each test session, drivers filled out an Informed Consent to verify they understand the scope of the study and are willing participants. The drivers were then asked a series of questions to establish demographic information that may influence driver responses. This includes information such as physical characteristics, driving history, and health information. A summary of some of the demographic information is shown in Table 3.1-2.

- 12 -
Table 3.1-2. Summary of driver demographic information
S01b M 38 220 6' 2 18S02b M 32 181 5' 8 7S03b M 39 190 6' 0 18S04b M 47 225 5' 11 30S05a M 46 175 5' 7 28S06a M 43 205 5' 8 15S07a M 35 185 5' 6 15S08a M 49 245 6' 0 31S09b M 49 195 5' 11 32S10b M 42 310 6' 1 15S11b M 47 200 5' 9 25S12b M 38 165 5' 9 10
ID Gender Age Weight HeightYears Truck Driver
While this information was not used to select participants, it is useful for establishing the relevance of the selected sample to the general truck driver population. All twelve drivers were male, ages ranged from 32 to 49, weight ranged from 165 to 310 pounds, height ranged form 66 to 74 inches, and years of truck driving experienced ranged from 7 years to 32 years. This variety in different characteristics shows that our test population is reasonably diverse, and is a suitable representation of the general truck driver population. Surveys were collected throughout each test session, both after 10 minutes and also after each hour of driving. The hourly survey is shown in Table 3.1-3. A reduced version of this survey is used at the 10 minute mark. The truck seat was fitted with a pressure sensing pad to capture physical measurements of seat pressure distribution on the driver-seat cushion interface, as shown in Figure 3.1-2. This system was used to capture both static and dynamic pressure maps throughout each test session, which are then analyzed to find the proposed metrics. At the conclusion of each testing session, drivers were asked a series of questions to rate their overall opinions of the two seat cushions. This information includes which cushion they would prefer to ride on, their likes and dislikes of the seat cushions, and more specific questions rating their overall opinions. This information is used to assess the driver’s overall preference, whereas the surveys that are collected throughout the test session provide a finer measure of subjective impressions over time.

- 13 -
Table 3.1-3. Driving survey for each hour
Comfort
1 V
ery
Unc
omfo
rtab
le
2 3 4 N
eutr
al
5 6 7 V
ery
Com
fort
able
Abs
tain
1 Lumbar2 Mid-Back3 Back Lateral4 Overall Back5 Ischial/Buttocks6 Thigh7 Cushion Lateral8 Overall Cushion9 Overall Seat
Amount of Support
1 T
oo L
ittle
2 3 4 J
ust R
ight
5 6 7 T
oo M
uch
Abs
tain
10 Lumbar11 Mid-Back12 Back Lateral13 Seat Back Firmness14 Cushion Firmness15 Cushion Hold
Fatigue Level
1 L
ow
2 3 4 M
oder
ate
5 6 7 H
igh
Abs
tain
16 Drowsy17 Eyes Tired18 Dull or Listless19 Stiff Neck20 Shoulders Stiff21 Arms Sore or Stiff22 Aching Back23 Buttocks Sore24 Thighs Sore25 Legs/Knees Sore or Stiff26 Feet/Ankles Sore or Stiff27 Whole Body Fatigue
3.2 SUBJECTIVE DATA ANALYSIS This section details some of the key subjective results from this study. First, we consider the overall driver preference, as collected in the exit interviews. Then, we compare the results from the “test drive” survey. Finally, we reduce road data from all the test sessions into a minimal data set for further comparison with the objective data. Overall Driver Preference First we consider the overall driver preference, as collected in the exit interviews. This is useful to provide an overview of the drivers’ preferences, which is important to keep in mind when considering more detailed analysis. When asked how the air-inflated seat cushion compared to their regular seat cushion, 10 out of 12 drivers said the air-inflated cushion performed much better and they would prefer to drive on it during their daily route. The other two subjects said the air-inflated cushion performed about the same for them, and they were neutral as to which one they preferred. This is a key result, because it indicates that the air-inflated cushion would be preferred by a large percentage of drivers, while the smaller percentage that does not favor the air-inflated seat cushion would not be unhappy. In terms of the distribution of overall driver preference, this suggests a distribution where the mean favors the air-inflated seat cushion, while a small
- 14 -
tail of the distribution is opinion-neutral or negative. This is preferable to a bimodal distribution, where a certain population of drivers loves the seat, while another population hates the seat. Drivers were also asked to list their likes and dislikes of the air-inflated seat cushion. These responses are summarized in Table 3.2-1. For clarity in reporting these results, responses were grouped by comfort, support, adjustability, and general feedback. We see that overall, drivers like the comfort of the air-inflated seat cushion. Additionally, they like the support in the seat cushion, but some drivers found that the seat cushion made their back support worse. Drivers also liked the ability to make adjustments to the seat cushion; however, they didn’t like the difficulty in making the adjustments. Also, drivers noted that the seat cushion was too thick and it was harder to get in and out.
Table 3.2-1. Driver likes and dislikes for air-inflated seat cushion
Likes Dislikesbetter ride
very comfortabledoesn't hurt as muchbetter back support tilts me off back support
raises me up onto back support height throws off back supportbetter buttocks and thigh support needs matching back
better holdgood firmness
cushyable to adjust needs more controls
feels good when adjusted hard to adjustneeds buttons like on seat ride height
need to adjust sections individuallynot as hot hard to get in
too thicksits high overall
Comfort
General
Adjustability
Support
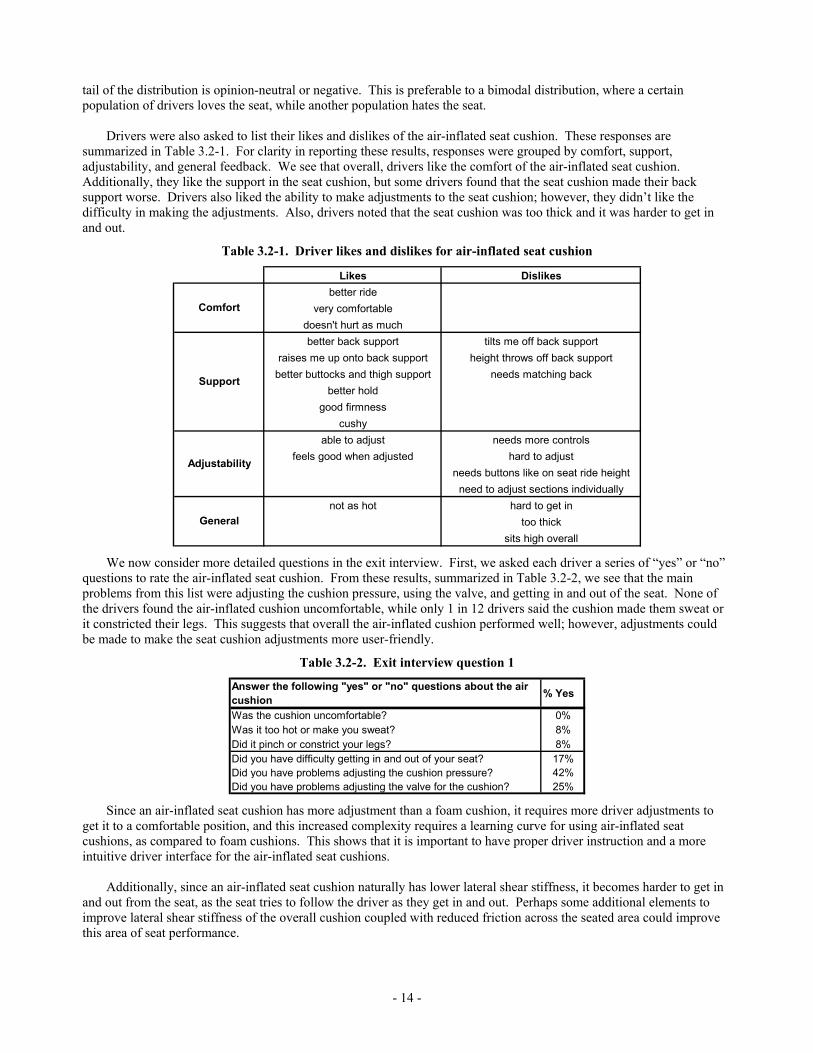
We now consider more detailed questions in the exit interview. First, we asked each driver a series of “yes” or “no” questions to rate the air-inflated seat cushion. From these results, summarized in Table 3.2-2, we see that the main problems from this list were adjusting the cushion pressure, using the valve, and getting in and out of the seat. None of the drivers found the air-inflated cushion uncomfortable, while only 1 in 12 drivers said the cushion made them sweat or it constricted their legs. This suggests that overall the air-inflated cushion performed well; however, adjustments could be made to make the seat cushion adjustments more user-friendly.
Table 3.2-2. Exit interview question 1
Answer the following "yes" or "no" questions about the air cushion % Yes
Was the cushion uncomfortable? 0%Was it too hot or make you sweat? 8%Did it pinch or constrict your legs? 8%Did you have difficulty getting in and out of your seat? 17%Did you have problems adjusting the cushion pressure? 42%Did you have problems adjusting the valve for the cushion? 25%
Since an air-inflated seat cushion has more adjustment than a foam cushion, it requires more driver adjustments to get it to a comfortable position, and this increased complexity requires a learning curve for using air-inflated seat cushions, as compared to foam cushions. This shows that it is important to have proper driver instruction and a more intuitive driver interface for the air-inflated seat cushions. Additionally, since an air-inflated seat cushion naturally has lower lateral shear stiffness, it becomes harder to get in and out from the seat, as the seat tries to follow the driver as they get in and out. Perhaps some additional elements to improve lateral shear stiffness of the overall cushion coupled with reduced friction across the seated area could improve this area of seat performance.

- 15 -
Next, we asked the drivers to rate the air-inflated cushion in comparison to their regular seat cushion on a scale of 1 to 7, where 1 is “Much Worse”, 4 is “Same”, and 7 is “Much Better”. These results are summarized in Table 3.2-3. In all cases, the average response was between 5 and 6, which says the air-inflated cushion performed better than the foam cushion in all areas questioned. Aside from one driver that rated comfort at 1, and one driver that rated lower back pain at 1, all other ratings were neutral or favorable for the air-inflated seat cushion. It should be noted that the two ratings of 1 came from the two drivers that were opinion-neutral on the seat cushion overall.
Table 3.2-3. Exit interview question 2
1 2 3 4 5 6 7 xComfort 1 0 0 1 1 4 5 0 5.75Tired feeling after driving 0 0 0 3 2 3 4 0 5.67Numbness in legs 0 0 0 6 1 1 3 1 5.09Reduced vibration and shock 0 0 0 5 2 1 4 0 5.33Lower back pain 1 0 0 3 0 2 5 1 5.45Hemmorrhoid pain 0 0 0 4 0 0 4 4 5.50Sitting pain or discomfort 0 0 0 5 1 0 5 1 5.45Alertness after driving 0 0 0 4 2 2 4 0 5.50
Rate the air-inflated cushion in comparison to your regular truck seat on a scale of 1 to 7, where 1 is “Much Worse”, 4 is “Same” and 7 is “Much Better”. Average
Response
counts
Finally, we asked the drivers to rate the air-inflated cushion on several different areas, as shown in Table 3.2-4. Four items had individual responses below 4 or “Average”: styling, using seat controls, adjusting seat, and getting in and out. Again, this suggests that a seat that is more user-friendly and has increased lateral shear stiffness would see marked improvements. Additionally, some attention should go into improving the cosmetic appearance.
Table 3.2-4. Exit interview question 3
1 2 3 4 5 6 7 xStyling of the seating unit 0 1 1 5 4 1 0 0 4.25The look/feel of the seat material 0 0 0 5 2 3 2 0 5.17How easy it is to reach/operate seat controls 0 3 1 3 2 2 1 0 4.17Ability to adjust driver's seat to comfortable position 1 2 1 3 2 1 2 0 4.17How easy it to put on seat belt 0 0 0 6 2 1 3 0 5.08How seat holds you in place during cornering 0 0 0 2 3 2 5 0 5.83Ability to get in and out of the driver's seat easily 0 1 1 2 2 3 3 0 5.17
Rate the air-inflated seat cushion on the following areas. Use a scale of 1 to 7, where 1 is “Unacceptable”, 4 is “Average”, and 7 is “Outstanding”. Average
Response
counts
Test Drive Survey Next, we consider the results of the “test drive” surveys that were administered at the 10 minute mark. This was done so that we could capture the driver’s initial perceptions of the seat before long-term effects, such as fatigue, began to set in. To reduce the test drive survey information into a more compact data set, the responses for the 14 test drive questions were correlated against the responses for the other 13 questions. On both cushions, we found strong positive correlations within groups of comfort and support questions, such as between a comfort question and a different comfort question. We also found low correlations across groups, such as correlation between a comfort question and a support question. This indicates that the drivers either were unable to differentiate within these two areas of comfort or support questions, or their responses were dominated by one factor within each group of questions. In any case, the responses within groupings of comfort and support are linearly dependent, and can be averaged into one average comfort rating and one average support rating for each subject.
- 16 -
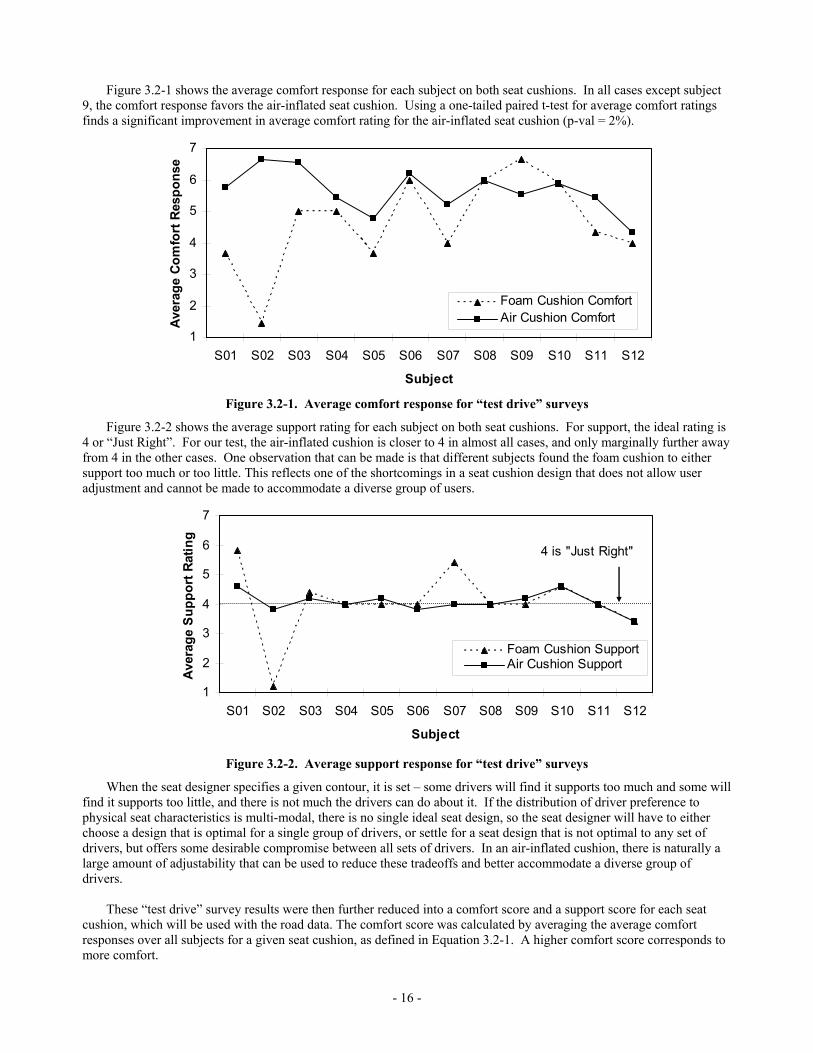
Figure 3.2-1 shows the average comfort response for each subject on both seat cushions. In all cases except subject 9, the comfort response favors the air-inflated seat cushion. Using a one-tailed paired t-test for average comfort ratings finds a significant improvement in average comfort rating for the air-inflated seat cushion (p-val = 2%).
1
2
3
4
5
6
7
S01 S02 S03 S04 S05 S06 S07 S08 S09 S10 S11 S12
Subject
Aver
age
Com
fort
Res
pons
e
Foam Cushion ComfortAir Cushion Comfort
Figure 3.2-1. Average comfort response for “test drive” surveys
Figure 3.2-2 shows the average support rating for each subject on both seat cushions. For support, the ideal rating is 4 or “Just Right”. For our test, the air-inflated cushion is closer to 4 in almost all cases, and only marginally further away from 4 in the other cases. One observation that can be made is that different subjects found the foam cushion to either support too much or too little. This reflects one of the shortcomings in a seat cushion design that does not allow user adjustment and cannot be made to accommodate a diverse group of users.
1
2
3
4
5
6
7
S01 S02 S03 S04 S05 S06 S07 S08 S09 S10 S11 S12
Subject
Aver
age
Sup
port
Ratin
g
Foam Cushion SupportAir Cushion Support
4 is "Just Right"
Figure 3.2-2. Average support response for “test drive” surveys
When the seat designer specifies a given contour, it is set – some drivers will find it supports too much and some will find it supports too little, and there is not much the drivers can do about it. If the distribution of driver preference to physical seat characteristics is multi-modal, there is no single ideal seat design, so the seat designer will have to either choose a design that is optimal for a single group of drivers, or settle for a seat design that is not optimal to any set of drivers, but offers some desirable compromise between all sets of drivers. In an air-inflated cushion, there is naturally a large amount of adjustability that can be used to reduce these tradeoffs and better accommodate a diverse group of drivers. These “test drive” survey results were then further reduced into a comfort score and a support score for each seat cushion, which will be used with the road data. The comfort score was calculated by averaging the average comfort responses over all subjects for a given seat cushion, as defined in Equation 3.2-1. A higher comfort score corresponds to more comfort.
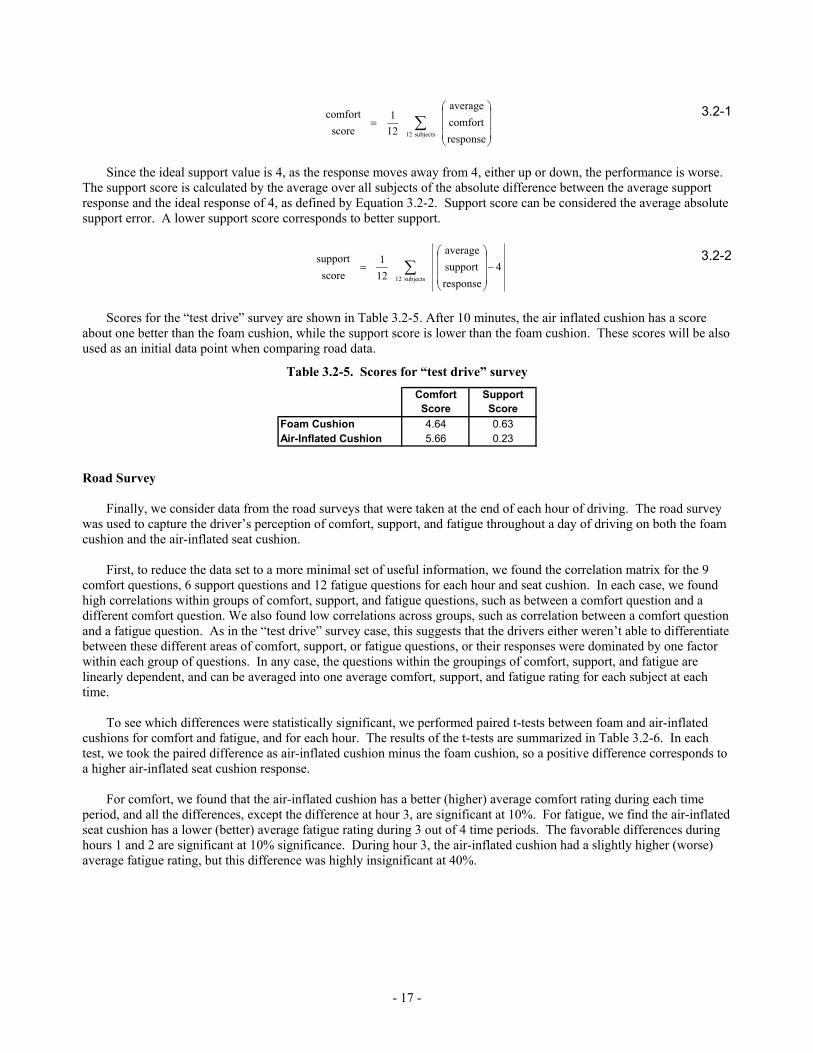
- 17 -
∑
=
subjects 12 responsecomfortaverage
121
scorecomfort 3.2-1
Since the ideal support value is 4, as the response moves away from 4, either up or down, the performance is worse. The support score is calculated by the average over all subjects of the absolute difference between the average support response and the ideal response of 4, as defined by Equation 3.2-2. Support score can be considered the average absolute support error. A lower support score corresponds to better support.
∑ −
=
subjects 12 4
responsesupportaverage
121
score
support 3.2-2
Scores for the “test drive” survey are shown in Table 3.2-5. After 10 minutes, the air inflated cushion has a score about one better than the foam cushion, while the support score is lower than the foam cushion. These scores will be also used as an initial data point when comparing road data.
Table 3.2-5. Scores for “test drive” survey
Road Survey Finally, we consider data from the road surveys that were taken at the end of each hour of driving. The road survey was used to capture the driver’s perception of comfort, support, and fatigue throughout a day of driving on both the foam cushion and the air-inflated seat cushion. First, to reduce the data set to a more minimal set of useful information, we found the correlation matrix for the 9 comfort questions, 6 support questions and 12 fatigue questions for each hour and seat cushion. In each case, we found high correlations within groups of comfort, support, and fatigue questions, such as between a comfort question and a different comfort question. We also found low correlations across groups, such as correlation between a comfort question and a fatigue question. As in the “test drive” survey case, this suggests that the drivers either weren’t able to differentiate between these different areas of comfort, support, or fatigue questions, or their responses were dominated by one factor within each group of questions. In any case, the questions within the groupings of comfort, support, and fatigue are linearly dependent, and can be averaged into one average comfort, support, and fatigue rating for each subject at each time. To see which differences were statistically significant, we performed paired t-tests between foam and air-inflated cushions for comfort and fatigue, and for each hour. The results of the t-tests are summarized in Table 3.2-6. In each test, we took the paired difference as air-inflated cushion minus the foam cushion, so a positive difference corresponds to a higher air-inflated seat cushion response. For comfort, we found that the air-inflated cushion has a better (higher) average comfort rating during each time period, and all the differences, except the difference at hour 3, are significant at 10%. For fatigue, we find the air-inflated seat cushion has a lower (better) average fatigue rating during 3 out of 4 time periods. The favorable differences during hours 1 and 2 are significant at 10% significance. During hour 3, the air-inflated cushion had a slightly higher (worse) average fatigue rating, but this difference was highly insignificant at 40%.
Comfort Score
Support Score
Foam Cushion 4.64 0.63Air-Inflated Cushion 5.66 0.23

- 18 -
Table 3.2-6. Summary of significant differences on hourly basis, air-inflated cushion - foam seat cushion
average air-foam p-val
H0 1.02 2.3%H1 1.17 1.8%H2 1.08 3.8%H3 0.22 23.1%H4 0.44 9.7%H1 -0.38 10.0%H2 -0.38 8.2%H3 0.07 39.8%H4 -0.33 21.3%
Fatigue
Comfort
For an overall summary of the road data, we created a fatigue score, by averaging over all subjects their average fatigue score during each hour, as defined in Equation 3.2-3. Combining the fatigue score with the comfort score and support score defined in Equations 3.2-1 and 3.2-2, we can summarize our subjective data by plotting these three scores over time, as shown in Table 3.2-7 and Figures 3.2-3 to 3.2-5.
∑
=
subjects 12 responsefatigueaverage
121
score
fatigue 3.2-3
Table 3.2-7. Hourly scores for road tests
H0 H1 H2 H3 H4Foam Comfort 4.6 4.4 4.3 4.5 3.9Air Comfort 5.7 5.5 5.4 4.7 4.3Foam Support 0.6 0.5 0.9 1.4 2.5Air Support 0.2 0.4 0.2 0.3 1.5Foam Fatigue 1.7 1.8 1.9 1.7Air Fatigue 1.3 1.5 1.9 1.4
First, we show the support scores in Figure 3.2-3. Recall that the support score is the average for all subjects of the support error, therefore the lower the support score is, the better the support would be. At all times, the support is better for the air-inflated seat cushion than the foam seat cushion. This is expected, as the air-inflated cushion can be adjusted by the driver to accommodate their individual support needs, where a foam cushion is fixed and cannot be individually adjusted. Additionally, the support steadily worsens for the foam cushion, while the air cushion stays relatively constant until the last hour. This indicates that the foam’s support performance drops off more quickly than an air-inflated seat cushion.
- 19 -
0.0
0.5
1.0
1.5
2.0
2.5
3.0
H0 H1 H2 H3 H4
hour
Sup
port
Sco
re
Foam SupportAir Support
Figure 3.2-3. Support score over time
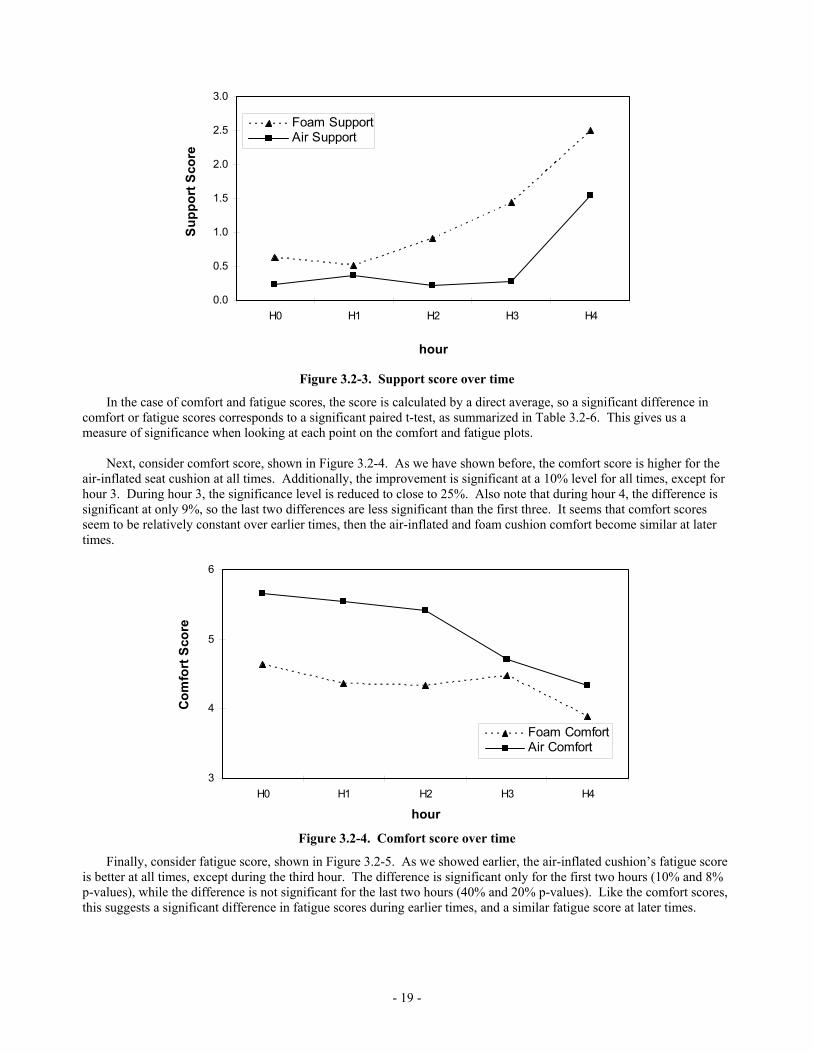
In the case of comfort and fatigue scores, the score is calculated by a direct average, so a significant difference in comfort or fatigue scores corresponds to a significant paired t-test, as summarized in Table 3.2-6. This gives us a measure of significance when looking at each point on the comfort and fatigue plots. Next, consider comfort score, shown in Figure 3.2-4. As we have shown before, the comfort score is higher for the air-inflated seat cushion at all times. Additionally, the improvement is significant at a 10% level for all times, except for hour 3. During hour 3, the significance level is reduced to close to 25%. Also note that during hour 4, the difference is significant at only 9%, so the last two differences are less significant than the first three. It seems that comfort scores seem to be relatively constant over earlier times, then the air-inflated and foam cushion comfort become similar at later times.
3
4
5
6
H0 H1 H2 H3 H4
hour
Com
fort
Sco
re
Foam ComfortAir Comfort
Figure 3.2-4. Comfort score over time
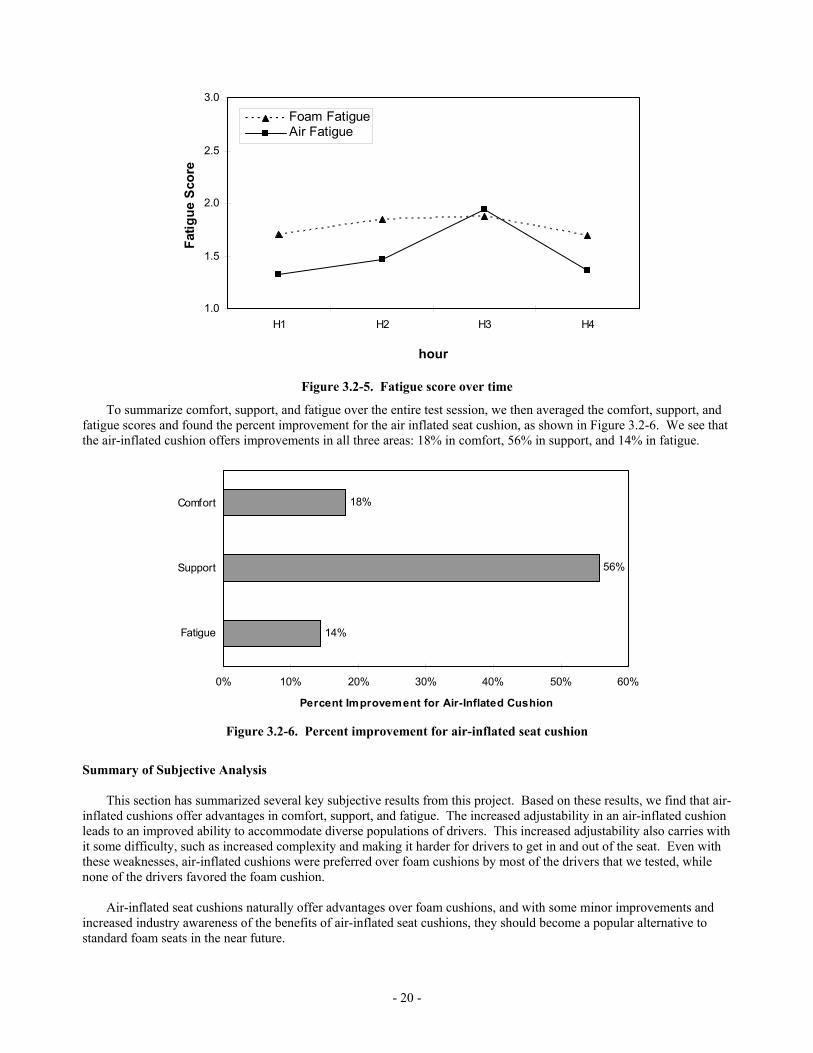
Finally, consider fatigue score, shown in Figure 3.2-5. As we showed earlier, the air-inflated cushion’s fatigue score is better at all times, except during the third hour. The difference is significant only for the first two hours (10% and 8% p-values), while the difference is not significant for the last two hours (40% and 20% p-values). Like the comfort scores, this suggests a significant difference in fatigue scores during earlier times, and a similar fatigue score at later times.
- 20 -
1.0
1.5
2.0
2.5
3.0
H1 H2 H3 H4
hour
Fatig
ue S
core
Foam FatigueAir Fatigue
Figure 3.2-5. Fatigue score over time
To summarize comfort, support, and fatigue over the entire test session, we then averaged the comfort, support, and fatigue scores and found the percent improvement for the air inflated seat cushion, as shown in Figure 3.2-6. We see that the air-inflated cushion offers improvements in all three areas: 18% in comfort, 56% in support, and 14% in fatigue.
18%
56%
14%
0% 10% 20% 30% 40% 50% 60%
Comfort
Support
Fatigue
Percent Improvement for Air-Inflated Cushion Figure 3.2-6. Percent improvement for air-inflated seat cushion
Summary of Subjective Analysis This section has summarized several key subjective results from this project. Based on these results, we find that air-inflated cushions offer advantages in comfort, support, and fatigue. The increased adjustability in an air-inflated cushion leads to an improved ability to accommodate diverse populations of drivers. This increased adjustability also carries with it some difficulty, such as increased complexity and making it harder for drivers to get in and out of the seat. Even with these weaknesses, air-inflated cushions were preferred over foam cushions by most of the drivers that we tested, while none of the drivers favored the foam cushion. Air-inflated seat cushions naturally offer advantages over foam cushions, and with some minor improvements and increased industry awareness of the benefits of air-inflated seat cushions, they should become a popular alternative to standard foam seats in the near future.
- 21 -
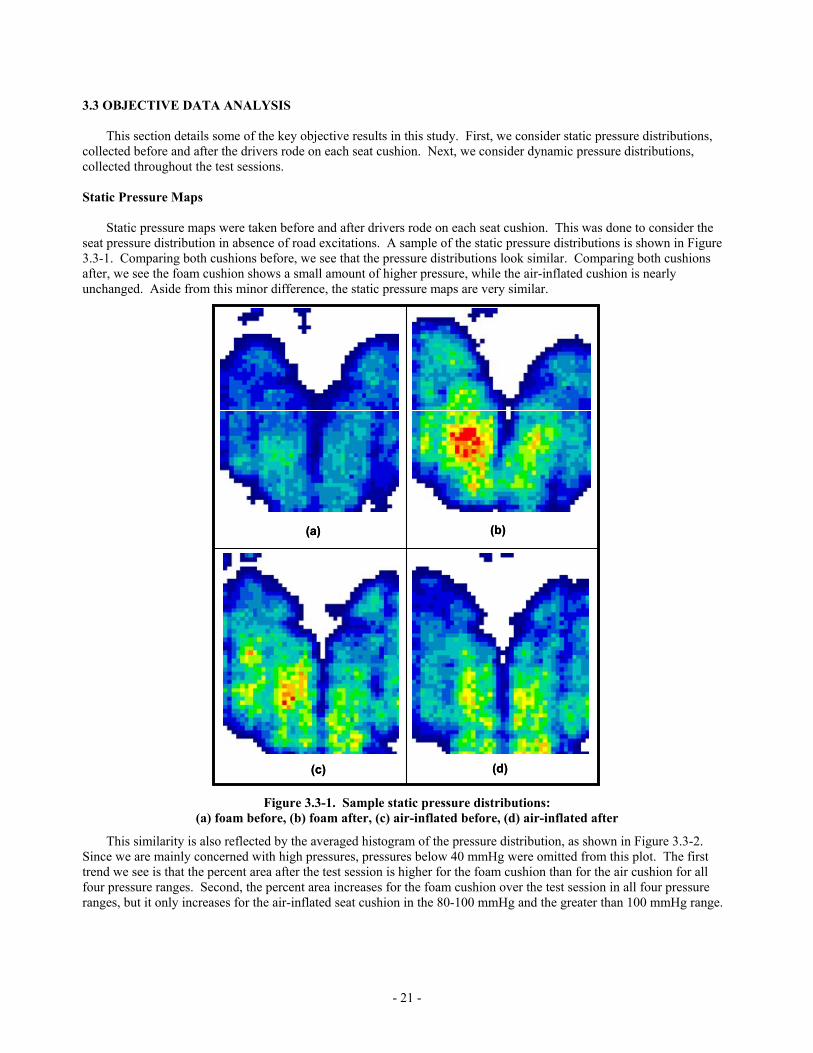
3.3 OBJECTIVE DATA ANALYSIS This section details some of the key objective results in this study. First, we consider static pressure distributions, collected before and after the drivers rode on each seat cushion. Next, we consider dynamic pressure distributions, collected throughout the test sessions. Static Pressure Maps Static pressure maps were taken before and after drivers rode on each seat cushion. This was done to consider the seat pressure distribution in absence of road excitations. A sample of the static pressure distributions is shown in Figure 3.3-1. Comparing both cushions before, we see that the pressure distributions look similar. Comparing both cushions after, we see the foam cushion shows a small amount of higher pressure, while the air-inflated cushion is nearly unchanged. Aside from this minor difference, the static pressure maps are very similar.
(a) (b)
(c) (d)
(a) (b)
(c) (d)
Figure 3.3-1. Sample static pressure distributions: (a) foam before, (b) foam after, (c) air-inflated before, (d) air-inflated after
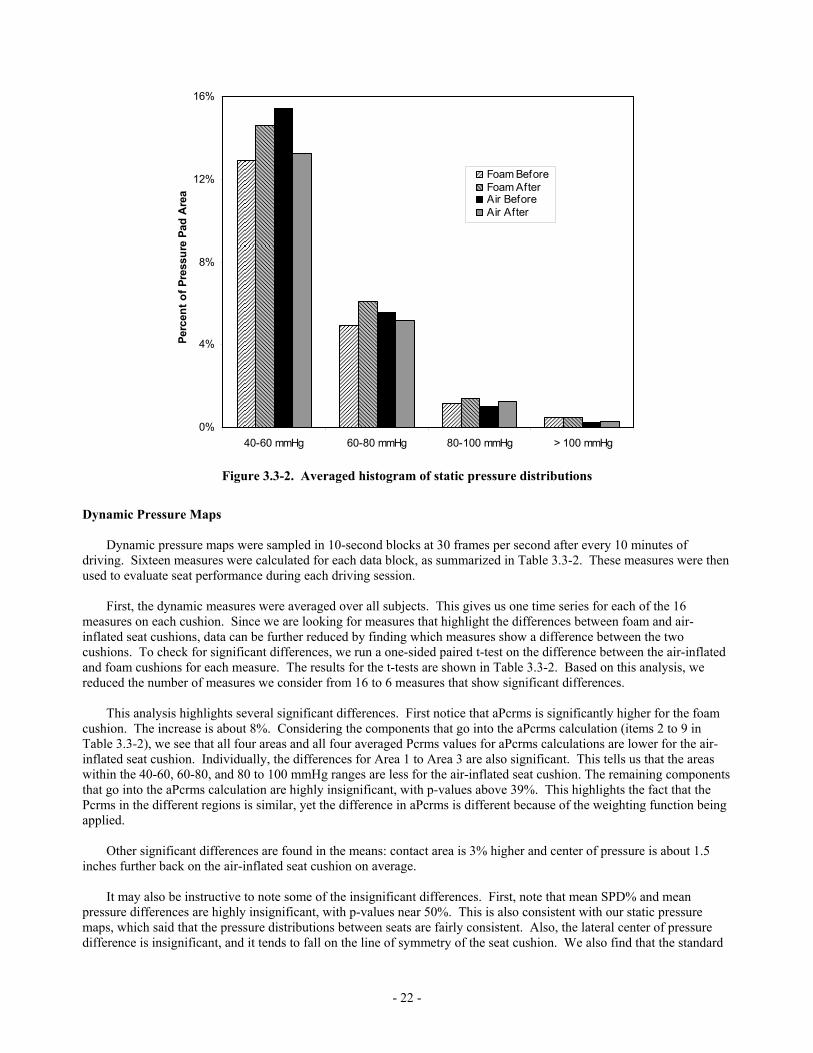
This similarity is also reflected by the averaged histogram of the pressure distribution, as shown in Figure 3.3-2. Since we are mainly concerned with high pressures, pressures below 40 mmHg were omitted from this plot. The first trend we see is that the percent area after the test session is higher for the foam cushion than for the air cushion for all four pressure ranges. Second, the percent area increases for the foam cushion over the test session in all four pressure ranges, but it only increases for the air-inflated seat cushion in the 80-100 mmHg and the greater than 100 mmHg range.
- 22 -
0%
4%
8%
12%
16%
40-60 mmHg 60-80 mmHg 80-100 mmHg > 100 mmHg
Perc
ent o
f Pre
ssur
e Pa
d A
rea
Foam BeforeFoam AfterAir BeforeAir After
Figure 3.3-2. Averaged histogram of static pressure distributions
Dynamic Pressure Maps Dynamic pressure maps were sampled in 10-second blocks at 30 frames per second after every 10 minutes of driving. Sixteen measures were calculated for each data block, as summarized in Table 3.3-2. These measures were then used to evaluate seat performance during each driving session. First, the dynamic measures were averaged over all subjects. This gives us one time series for each of the 16 measures on each cushion. Since we are looking for measures that highlight the differences between foam and air-inflated seat cushions, data can be further reduced by finding which measures show a difference between the two cushions. To check for significant differences, we run a one-sided paired t-test on the difference between the air-inflated and foam cushions for each measure. The results for the t-tests are shown in Table 3.3-2. Based on this analysis, we reduced the number of measures we consider from 16 to 6 measures that show significant differences. This analysis highlights several significant differences. First notice that aPcrms is significantly higher for the foam cushion. The increase is about 8%. Considering the components that go into the aPcrms calculation (items 2 to 9 in Table 3.3-2), we see that all four areas and all four averaged Pcrms values for aPcrms calculations are lower for the air-inflated seat cushion. Individually, the differences for Area 1 to Area 3 are also significant. This tells us that the areas within the 40-60, 60-80, and 80 to 100 mmHg ranges are less for the air-inflated seat cushion. The remaining components that go into the aPcrms calculation are highly insignificant, with p-values above 39%. This highlights the fact that the Pcrms in the different regions is similar, yet the difference in aPcrms is different because of the weighting function being applied. Other significant differences are found in the means: contact area is 3% higher and center of pressure is about 1.5 inches further back on the air-inflated seat cushion on average. It may also be instructive to note some of the insignificant differences. First, note that mean SPD% and mean pressure differences are highly insignificant, with p-values near 50%. This is also consistent with our static pressure maps, which said that the pressure distributions between seats are fairly consistent. Also, the lateral center of pressure difference is insignificant, and it tends to fall on the line of symmetry of the seat cushion. We also find that the standard

- 23 -
deviations of the center of pressure differences are insignificant, which suggests that both seats hold the center of pressure similarly and provide similar pelvis stability.
Table 3.3-2. Significant differences between seat cushions
measure difference (air - foam) p-val
1 aPcrms -7.17 0%2 Area 1 -2.53 1%3 Area 2 -2.89 0%4 Area 3 -1.45 8%5 Area 4 -0.29 39%6 Pcrms 1 0.02 49%7 Pcrms 2 -0.01 50%8 Pcrms 3 -0.16 44%9 Pcrms 4 -0.09 47%
10 Mean SPD% -0.03 49%11 Mean Pressure -0.05 48%12 Mean Area 6.36 0%13 Mean COPx 1.45 0%14 Mean COPy 0.16 35%15 St Dev COPx -0.01 49%16 St Dev COPy 0.00 50%
Time-Related
Standard Deviations
Means
Now that we have found that these 6 measures show a difference between seat cushions, data can then be further reduced by finding which measures are linearly dependent. This is done by calculating the correlation on the difference between air and foam, and running a t-test on the correlation. Since we are interested in evaluating aPcrms, we found the correlation of the remaining 6 measures with aPcrms. The results of this analysis are shown in Table 3.3-3.
Table 3.3-3. Correlation of difference with aPcrms
Correlation p-valArea 1 0.60 0.0%Area 2 0.69 0.0%Area 3 0.70 0.0%
Mean Area 0.14 23.0%Mean COPx -0.25 9.7%
Based on these results, we see that aPcrms has positive correlation to 3 of the measures at 5% significance level, meaning these measures are redundant. We also found that the remaining measures that were not dependent on aPcrms, specifically mean area and mean COPx, were not correlated at 5% significance (p-val = 11%). This leaves aPcrms, mean area, and mean COPx as three unique measures with a significant difference between cushions. The investigators realize that by deciding to correlate the remaining measures against aPcrms automatically makes aPcrms part of our reduced data set, but since at least one measure will be independent, this decision can be made arbitrarily amongst the 6 measures. These three measures are plotted over time in Figures 3.3-3 to 3.3-5. First, we see that aPcrms starts out similarly in both cushions, but over time aPcrms on the air-inflated seat cushion drops below the foam cushion after Hour 2. As shown earlier in the static histogram, there is less exposure to high pressure at later times on the air-inflated seat cushion compared to the foam cushion. As there is little difference in Pcrms values over time, the reduction in aPcrms at later times is consistent with the drop in exposure to high pressure areas at later times.

- 24 -
0
20
40
60
80
100
120
140
0 1 2 3 4time, hours
aPcr
ms,
lbf/s
Foam CushionAir Cushion
Figure 3.3-3. aPcrms over time
Next, we see that mean area for the air cushion starts out higher than the foam cushion, drops to about a similar level between Hours 1.5 and 2.5, and becomes higher again after Hour 2.5. This is significant because an increase in contact area causes a decrease in mean pressure for a constant applied force. This reduction in mean pressure will also reduce the exposure to higher pressure regions across the seated area, which also reduces aPcrms.
180
200
220
240
0 1 2 3 4time, hours
Mea
n A
rea,
in2
Foam CushionAir Cushion
Figure 3.3-4. Mean Area over time
Finally, we see that the center of pressure on the air-inflated seat cushion starts further back than the foam cushion, and continues to fall further back while the foam seat cushion falls forwards while driving. This shift backwards in the longitudinal center of pressure also reflects a decreased force on the seat cushion and an increased force on the seat back. The increased force on the seat back can have good effects or bad effects, depending on the driver’s physical composition and preferences. This mixed result was also reflected in the subjective data when some drivers indicated the seat back was better, and some indicated it was worse. The decrease in force on the seat cushion will also reduce mean pressure, which will act to reduce aPcrms.
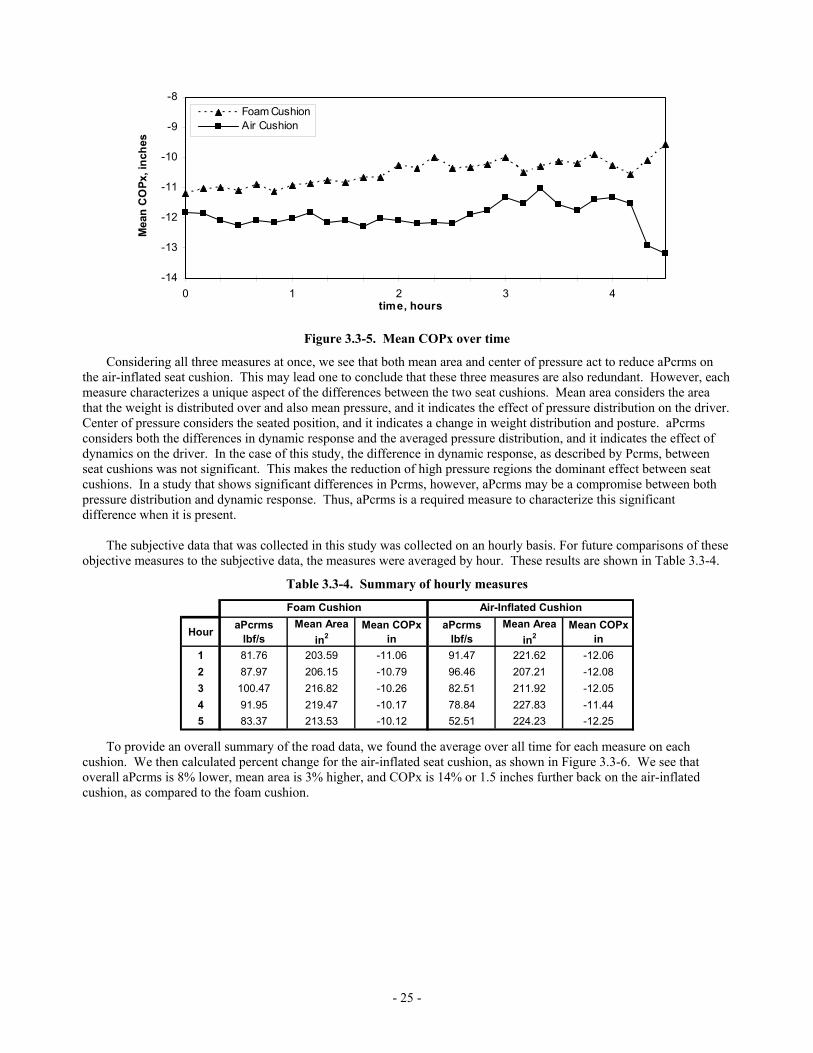
- 25 -
-14
-13
-12
-11
-10
-9
-8
0 1 2 3 4time, hours
Mea
n C
OPx
, inc
hes
Foam CushionAir Cushion
Figure 3.3-5. Mean COPx over time
Considering all three measures at once, we see that both mean area and center of pressure act to reduce aPcrms on the air-inflated seat cushion. This may lead one to conclude that these three measures are also redundant. However, each measure characterizes a unique aspect of the differences between the two seat cushions. Mean area considers the area that the weight is distributed over and also mean pressure, and it indicates the effect of pressure distribution on the driver. Center of pressure considers the seated position, and it indicates a change in weight distribution and posture. aPcrms considers both the differences in dynamic response and the averaged pressure distribution, and it indicates the effect of dynamics on the driver. In the case of this study, the difference in dynamic response, as described by Pcrms, between seat cushions was not significant. This makes the reduction of high pressure regions the dominant effect between seat cushions. In a study that shows significant differences in Pcrms, however, aPcrms may be a compromise between both pressure distribution and dynamic response. Thus, aPcrms is a required measure to characterize this significant difference when it is present. The subjective data that was collected in this study was collected on an hourly basis. For future comparisons of these objective measures to the subjective data, the measures were averaged by hour. These results are shown in Table 3.3-4.
Table 3.3-4. Summary of hourly measures
Hour aPcrms lbf/s
Mean Area in2
Mean COPx in
aPcrms lbf/s
Mean Area in2
Mean COPx in
1 81.76 203.59 -11.06 91.47 221.62 -12.062 87.97 206.15 -10.79 96.46 207.21 -12.083 100.47 216.82 -10.26 82.51 211.92 -12.054 91.95 219.47 -10.17 78.84 227.83 -11.445 83.37 213.53 -10.12 52.51 224.23 -12.25
Foam Cushion Air-Inflated Cushion
To provide an overall summary of the road data, we found the average over all time for each measure on each cushion. We then calculated percent change for the air-inflated seat cushion, as shown in Figure 3.3-6. We see that overall aPcrms is 8% lower, mean area is 3% higher, and COPx is 14% or 1.5 inches further back on the air-inflated cushion, as compared to the foam cushion.

- 26 -
13.8%
3.0%
- 8.0%
-15% -10% -5% 0% 5%
Percent Change for Air-Inflated Cushion
aPcrms
Mean Area
COPx
Figure 3.3-6. Percent change for air-inflated seat cushion
Summary of Objective Analysis This section has summarized key objective results from our field study. From our original set of 16 dynamic measures, we eliminated measures that either did not show a significant difference, or were dependent on other measures. This led us to a reduced set of measures to consider: aPcrms, mean area, and longitudinal center of pressure. On the air-inflated cushion, we found aPcrms to be 8% lower, mean area to be 3% higher, and the center of pressure to be 1.5 inches further back compared to the foam cushion on average. The next step will be to compare these objective results against the subjective results reported previously, and use this comparison to assess the capacity of the proposed measures to evaluate subjective performance. 3.4 COMBINED ANALYSIS This section highlights the relationships between subjective and objective data. The comparison proceeds by answering the following questions:
1. Subjective Response: Was the response to one seat cushion more favorable than the other? If so, do we have subjective data to support it?
2. Objective Measures to Support Subjective Response: Are there physical measures that agree with the subjective test data? If so, what data supports it?
3. Relationship Between Subjective Response and Objective Measures: Using the metrics that best agree with the subjective data, can one claim that there exists a statistical correlation between the subjective and objective data? Why?
4. Improved Experimental Design: What approach is needed to enable one to establish this statistical correlation between subjective and objective data? How should future tests be conducted? What are the challenges?
This analysis summarizes much of the analysis performed in the two previous sections on subjective and objective data analysis, where needed to answer the above questions. The analysis also uses correlation analysis between subjective ratings and relevant objective measures to establish some dependence between the objective and subjective measures and considers how one may improve experimental designs in future tests to improve results. Question 1: Subjective Response
The overall subjective response was more favorable toward the air-inflated seat cushion. When asked “which seat would you prefer to drive on?”, 10 out of 12 drivers said they preferred the air-inflated seat cushion, while the remaining

- 27 -
two were opinion-neutral. When asked to list their specific likes and dislikes of the air-inflated seat cushion, drivers said they preferred the comfort of the air-inflated seat cushion and the ability to adjust; they disliked the difficulty of making adjustments, seat height, and difficulty of getting in and out; and they were split on their opinion of back support.
When asked to compare the air-inflated seat cushion with their regular truck seat in a series of questions, all individual ratings were neutral or favorable, except for two. In addition, all the average ratings were between 5 and 6, which favors the air-inflated seat cushion. In the test drive surveys that were taken within 10 minutes of driving on each seat cushion, 11 of 12 drivers rated air-inflated seat cushion comfort favorably, and 9 of 12 drivers rated air-inflated seat cushion support favorably, while 3 drivers rated support only slightly worse. Also, the comfort and support scores for the air-inflated cushion were better than for the foam seat cushion. In the road surveys that were taken after each hour of driving, the air-inflated seat cushion offers significant improvements in comfort for all times and in fatigue for all but Hour 3. In addition, the support score on the air-inflated seat cushion is also better for all time. In addition, the average comfort, support, and fatigue scores are better for the air inflated seat cushion. Overall, we observed an 18% improvement in Comfort, a 56% improvement in Support, and a 14% improvement in Fatigue. Question 2: Objective Measures to Support Subjective Response In the previous section, we have shown that the air-inflated seat cushion shows significant improvements in terms of subjective ratings of comfort, support, and fatigue. This section highlights the objective differences between the foam seat cushion and the air-inflated seat cushion. Since the major physical difference between these two seat cushions is the pressure distribution at the body-seat cushion interface, it follows that any significant change in subjective rating would correspond to a significant change in the measures used to summarize the pressure distribution. If we assume the difference in subjective ratings is significantly influenced by the physical environment, we should see differences in pressure measures that highlight the characteristic differences between the two seat cushions, which cause the difference in subjective rating. In the static data, we see that the contact area is larger in the air-inflated seat cushion, and the center of pressure is further back. We also see that after driving, the mean pressure is lower in the air-inflated seat cushion, and the SPD% is higher. In examining the road data, we observe 6 significant differences for the air-inflated seat cushion compared to the foam seat cushion:
• aPcrms is lower
• Area 1 is lower
• Area 2 is lower
• Area 3 is lower
• Mean Area is higher
• Mean COPx further back
This shows that aPcrms is more favorable for the air-inflated seat cushion, and this difference is caused by a reduction in the areas within 40-60 mmHg, 60-80 mmHg, and 80-100 mmHg pressure ranges. This indicates that the air-inflated seat cushion would promote better blood flow to the tissue in the seated area. The reduction of area in these higher pressure regions is caused by a larger contact area, which allows for lower pressures over the seated area. There is also a significant difference for the longitudinal center of pressure, where it is further back in the air-inflated seat cushion. This is perhaps due to a difference in contouring, where the body’s weight is shifted further back on the seat cushion. It is also useful to note that the force on the seat cushion is reduced for the air-inflated seat cushion by 6 pounds on average, indicating that the weight is being shifted more into the backrest. On further consideration of the road data, we see that only 3 out of 6 of these measures are linearly independent, meaning that 3 measures carry redundant information. Since we are interested in considering aPcrms, we also consider

- 28 -
the two measures that are independent to aPcrms, specifically Mean Area and Mean COPx. For the air-inflated seat cushion, we find that aPcrms is 8% lower, Mean Area is 3% higher, and COPx is 14% further back on the seat cushion. Question 3: Relationship between Subjective Response and Objective Measures This section uses correlation analysis between subjective ratings and relevant objective measures to establish some dependence between the objective and subjective measures. First, we tabulate the reduced hourly subjective scores and objective measures, as shown in Table 3.4-1. The subjective and objective measures are then plotted against each other, as shown in Figure 3.4-1.
Table 3.4-1. Summary of subjective and objective data
Subjective Data, Foam Cushion Objective Data, Foam Cushion
H0 H1 H2 H3 H4 1 2 3 4 5Comfort 4.6 4.4 4.3 4.5 3.9 aPcrms, lbf/s 81.8 88.0 100.5 91.9 83.4Support 0.63 0.51 0.92 1.44 2.50 Mean Area, in2 204 206 217 219 214Fatigue 1.7 1.8 1.9 1.7 Mean COPx, in -10.7 -10.4 -9.9 -9.8 -9.7
Subjective Data, Air Cushion Objective Data, Air Cushion
0 1 2 3 4 1 2 3 4 5Comfort 5.7 5.5 5.4 4.7 4.3 aPcrms, lbf/s 91.5 96.5 82.5 78.8 52.5Support 0.23 0.38 0.23 0.28 1.54 Mean Area, in2 222 207 212 228 224Fatigue 1.3 1.5 1.9 1.4 Mean COPx, in -11.7 -11.7 -11.6 -11.0 -11.8
3
4
5
6
50 70 90 110aPcrms, lbf/s
Com
fort
Sco
re
Foam CushionAir Cushion
0
1
2
3
50 70 90 110aPcrms, lbf/s
Supp
ort S
core
Foam CushionAir Cushion
1.0
1.4
1.8
2.2
50 70 90 110aPcrms, lbf/s
Fatig
ue S
core
Foam CushionAir Cushion
3
4
5
6
200 210 220 230Mean Area, in2
Com
fort
Sco
re
Foam CushionAir Cushion
0
1
2
3
200 205 210 215 220 225 230Mean Area, in2
Supp
ort S
core
Foam CushionAir Cushion
1.0
1.4
1.8
2.2
200 210 220 230Mean Area, in2
Fatig
ue S
core
Foam CushionAir Cushion
3
4
5
6
-12 -11 -10 -9Mean COPx, in
Com
fort
Sco
re
Foam CushionAir Cushion
0
1
2
3
-12 -11 -10 -9Mean COPx, in
Supp
ort S
core
Foam CushionAir Cushion
1.0
1.4
1.8
2.2
-12 -11 -10 -9Mean COPx, in
Fatig
ue S
core
Foam CushionAir Cushion
Figure 3.4-1. Summary of objective and subjective data
Before performing the correlation analysis, it is important to note that the correlation analysis needs to be carried out on the relative response between the two seat cushions, and not on the absolute response. These two different types of correlations are shown in Figure 3.4-2. From a standpoint of the hypothesis test that is performed, it requires tall the X values and Y values to be independent and identically distributed. First, notice that two samples taken from the same subject will not be independent. Second, we have already shown that the means for the two seat cushions are not the same, so they are not identically distributed.
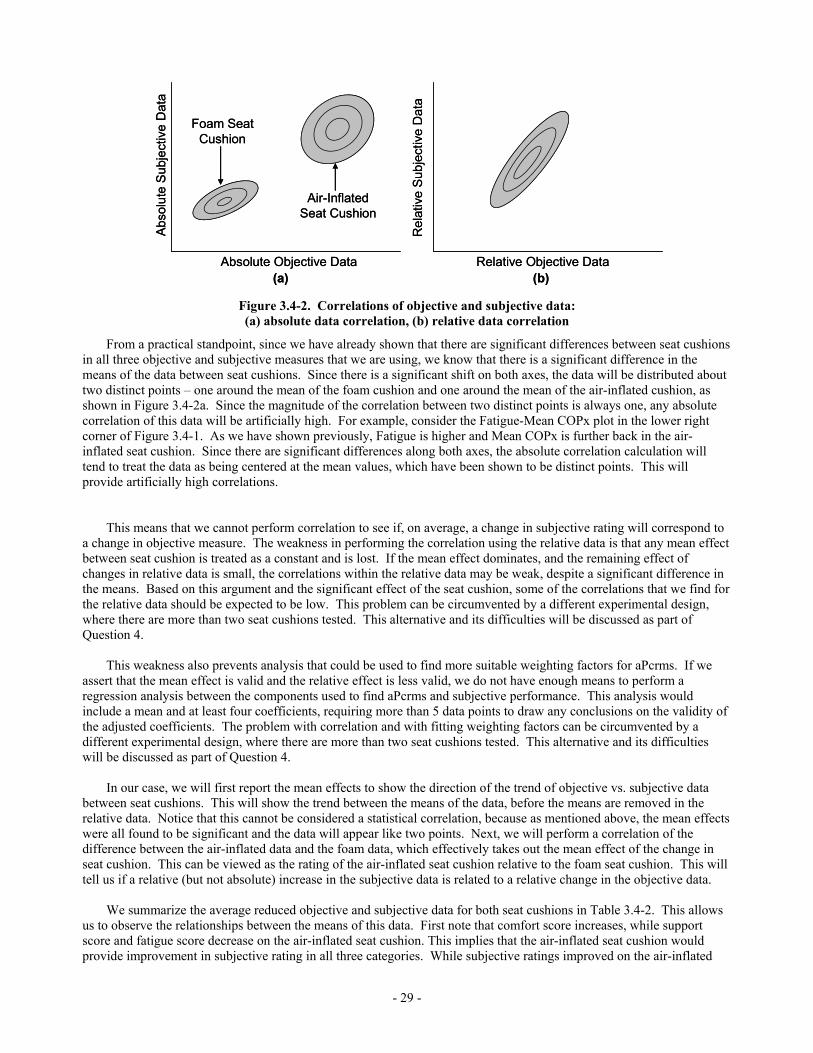
- 29 -
Absolute Objective Data
Abs
olut
e S
ubje
ctiv
e D
ata
Foam Seat Cushion
Air-Inflated Seat Cushion
Relative Objective Data
Rel
ativ
e S
ubje
ctiv
e D
ata
(a) (b)Absolute Objective Data
Abs
olut
e S
ubje
ctiv
e D
ata
Foam Seat Cushion
Air-Inflated Seat Cushion
Relative Objective Data
Rel
ativ
e S
ubje
ctiv
e D
ata
(a) (b) Figure 3.4-2. Correlations of objective and subjective data: (a) absolute data correlation, (b) relative data correlation
From a practical standpoint, since we have already shown that there are significant differences between seat cushions in all three objective and subjective measures that we are using, we know that there is a significant difference in the means of the data between seat cushions. Since there is a significant shift on both axes, the data will be distributed about two distinct points – one around the mean of the foam cushion and one around the mean of the air-inflated cushion, as shown in Figure 3.4-2a. Since the magnitude of the correlation between two distinct points is always one, any absolute correlation of this data will be artificially high. For example, consider the Fatigue-Mean COPx plot in the lower right corner of Figure 3.4-1. As we have shown previously, Fatigue is higher and Mean COPx is further back in the air-inflated seat cushion. Since there are significant differences along both axes, the absolute correlation calculation will tend to treat the data as being centered at the mean values, which have been shown to be distinct points. This will provide artificially high correlations. This means that we cannot perform correlation to see if, on average, a change in subjective rating will correspond to a change in objective measure. The weakness in performing the correlation using the relative data is that any mean effect between seat cushion is treated as a constant and is lost. If the mean effect dominates, and the remaining effect of changes in relative data is small, the correlations within the relative data may be weak, despite a significant difference in the means. Based on this argument and the significant effect of the seat cushion, some of the correlations that we find for the relative data should be expected to be low. This problem can be circumvented by a different experimental design, where there are more than two seat cushions tested. This alternative and its difficulties will be discussed as part of Question 4. This weakness also prevents analysis that could be used to find more suitable weighting factors for aPcrms. If we assert that the mean effect is valid and the relative effect is less valid, we do not have enough means to perform a regression analysis between the components used to find aPcrms and subjective performance. This analysis would include a mean and at least four coefficients, requiring more than 5 data points to draw any conclusions on the validity of the adjusted coefficients. The problem with correlation and with fitting weighting factors can be circumvented by a different experimental design, where there are more than two seat cushions tested. This alternative and its difficulties will be discussed as part of Question 4. In our case, we will first report the mean effects to show the direction of the trend of objective vs. subjective data between seat cushions. This will show the trend between the means of the data, before the means are removed in the relative data. Notice that this cannot be considered a statistical correlation, because as mentioned above, the mean effects were all found to be significant and the data will appear like two points. Next, we will perform a correlation of the difference between the air-inflated data and the foam data, which effectively takes out the mean effect of the change in seat cushion. This can be viewed as the rating of the air-inflated seat cushion relative to the foam seat cushion. This will tell us if a relative (but not absolute) increase in the subjective data is related to a relative change in the objective data. We summarize the average reduced objective and subjective data for both seat cushions in Table 3.4-2. This allows us to observe the relationships between the means of this data. First note that comfort score increases, while support score and fatigue score decrease on the air-inflated seat cushion. This implies that the air-inflated seat cushion would provide improvement in subjective rating in all three categories. While subjective ratings improved on the air-inflated

- 30 -
seat cushion, aPcrms decreased, Mean Area increased, and Longitudinal Center of Pressure fell further back on the air-inflated seat cushion.
Table 3.4-2. Summary of means for objective and subjective data
units Foam Cushion
Air Cushion
Increase for Air
Cushion
% Increase for Air
CushionaPcrms lbf/s 89.5 82.4 -7.1 -7.9%
Mean Area in 2 211.8 218.2 6.4 3.0%COPx in -10.1 -11.6 -1.44 -14.2%
Comfort - 4.3 5.1 0.8 18.6%Support - 1.2 0.5 -0.7 -58.3%Fatigue - 1.8 1.5 -0.3 -16.7%
Objective Measures
Subjective Ratings
Since the major physical difference between these two seat cushions is the pressure distribution at the body-seat cushion interface, it follows that any significant change in subjective rating would correspond to a significant change in the measures used to summarize the pressure distribution. This indicates that some of these objective measures may have a significant effect on the subjective ratings. As shown previously, the decrease in aPcrms is due to a reduction of areas in the 40-100 mmHg range. Since these pressures are critical to blood flow to the surrounding tissue, a lower area exposed to these pressure ranges indicates better blood flow. Notice that these mean effects agree with our concept that an increase in aPcrms will improve subjective performance. Similar to aPcrms, an increase in contact area would correspond to lower pressures and improved blood flow. Finally, a shift backward in the longitudinal center of pressure indicates that the seat cushion either allowed or encouraged a posture that placed more weight on the back support, which may be beneficial for this particular seat design. Next, we take the correlation over time of the difference in objective and subjective measures. At 5% significance level, we find a Support-aPcrms correlation. At 25% significance (note this is not a strong conclusion), we also find a Support-aPcrms, Fatigue-Mean Area, Support-Mean COPx, and Fatigue-Mean COPx correlation. To consider these relationships in finer detail, correlations were performed for each hour over each subject’s responses. This analysis may reveal time trends not seen in the earlier analysis of the overall time correlation. The findings of this analysis have been summarized by tabulating all results significant at 15%, as shown in Table 3.4-3. For both hours 1 and 2, we see Fatigue-Area is correlated at 10% significance level. For Hour 3, we see Comfort-COPx at 10%; and Comfort-aPcrms and Fatigue-aPcrms at 15%.
Table 3.4-3. Summary of correlation results
X
X
X
X
X
rxy = 0.79p-val = 6%
X
X
X
Overall
Fatigue – COPx
Fatigue – Area
Fatigue – aPcrms
Support – COPx
Support – Area
Support – aPcrms
Comfort – COPx
Comfort – Area
Comfort – aPcrms
Correlation
Xrxy = - 0.43p-val = 9 %
rxy = - 0.48p-val = 6 %
XXX
rxy = - 0.55p-val = 13 %
XX
XXX
XXX
XXX
rxy = - 0.75p-val = 4 %
XX
XXX
rxy = - 0.56p-val = 12 %
XX
Hour 3Hour 2Hour 1
X
X
X
X
X
rxy = 0.79p-val = 6%
X
X
X
Overall
Fatigue – COPx
Fatigue – Area
Fatigue – aPcrms
Support – COPx
Support – Area
Support – aPcrms
Comfort – COPx
Comfort – Area
Comfort – aPcrms
Correlation
Xrxy = - 0.43p-val = 9 %
rxy = - 0.48p-val = 6 %
XXX
rxy = - 0.55p-val = 13 %
XX
XXX
XXX
XXX
rxy = - 0.75p-val = 4 %
XX
XXX
rxy = - 0.56p-val = 12 %
XX
Hour 3Hour 2Hour 1
This summary suggests several relationships between these relative objective and subjective measures. First, consider Mean Area. Fatigue shows some relationship to Mean Area during hours 1 and 2. In both cases, the correlation were negative, indicating an increase in Relative Mean Area, which corresponds to improved (decreased) Relative
- 31 -
Fatigue Score. These results follow our concept that an increase in aPcrms will improve subjective performance and are consistent with the trend in the mean effects. Next, consider longitudinal center of pressure (COPx). We see a negative correlation with comfort, indicating that as Relative COPx moves further back (decreases), Relative Comfort improves (increases). Finally, consider aPcrms. Comfort, Support, and Fatigue show some relation to aPcrms. During Hour 3, Comfort and aPcrms show a negative correlation; indicating that a decrease in Relative aPcrms improves Relative Comfort Score improves (increases). On the overall correlation, Support and aPcrms are positively correlated; indicating a decrease in Relative aPcrms improves (decreases) Relative Support Score. These results are consistent with the trend for the mean effects. A potentially confusing and unexpected result occurs between Fatigue and aPcrms during Hour 3 – as Relative aPcrms increases, Relative Fatigue improves. While this is counter to our concept that decreased aPcrms improves subjective feedback, this result points out the characteristic weakness of the relative correlation mentioned earlier – it neglects the mean effects. Earlier, we had noted that the subjective fatigue rating improved (decreased) on the air-inflated seat cushion, and aPcrms also decreased. Based on this mean information alone, we would think there exists a positive correlation, which supports our motivation for using aPcrms. The relative correlation, however, is negative. This either represents a complex interaction in the relationship between human fatigue and aPcrms or it indicates that the drivers were unable to differentiate anything but the mean effect. Based on our sample size and the expected ability of the drivers to assess a fatigue rating, we would have to conclude the latter – drivers were often unable to assign a relative change in aPcrms to a relative change in Fatigue. Question 4: Improved Experimental Design While performing correlation analysis on the relative objective and subjective data is necessary to prevent overestimated correlations, it effectively neglects the mean effect of the seat cushion. If the mean effect dominates, and the remaining effect of changes in relative data is small, the correlations within the relative data may be weak, despite a significant difference in the means. Based on this argument and the significant effect of the seat cushion, some of the correlations that we found for the relative data should be expected to be low. One then may ask, “Is there a better experimental design, allowing us to find relationships between mean effects?” This would allow us to see if a change in seat cushion characteristics directly correlates to a change in subjective performance on an absolute basis, and avoid the weaker relationships formed by considering relative data. The answer is that there is an experimental design that accounts for this – testing on three or more seat cushions, as shown in 3.4-3. In fact, for the purpose of drawing conclusions on the effect of objective measures on subjective performance, this is the ideal design. This avoids the problem of doing an absolute correlation with only having two seat cushions, so we avoid the strength of relationship that can be lost using a relative correlation. By considering the mean effect of the seat cushion as part of the correlation, we strengthen the relationship and observe the trend we wish to find. As mentioned earlier, an absolute correlation with our present experimental design is not possible, because the mean seat cushion effects are significant. This causes the data to look like two points, as shown in Figure 3.4-3a, which causes an artificially high correlation. This forces us to consider a relative correlation which neglects these strong mean effects. To avoid this problem, we must alter our experimental design. For example, say we modified this experimental design to include three additional seat cushions, and we found the data to be distributed like 3.4-3b. Now, the data will center around five different means, so the data will no longer automatically look like a straight line. If we performed an absolute correlation with data that was distributed like this, we would find a strong positive correlation due to the means, and it would be more valid than in our original experimental design.
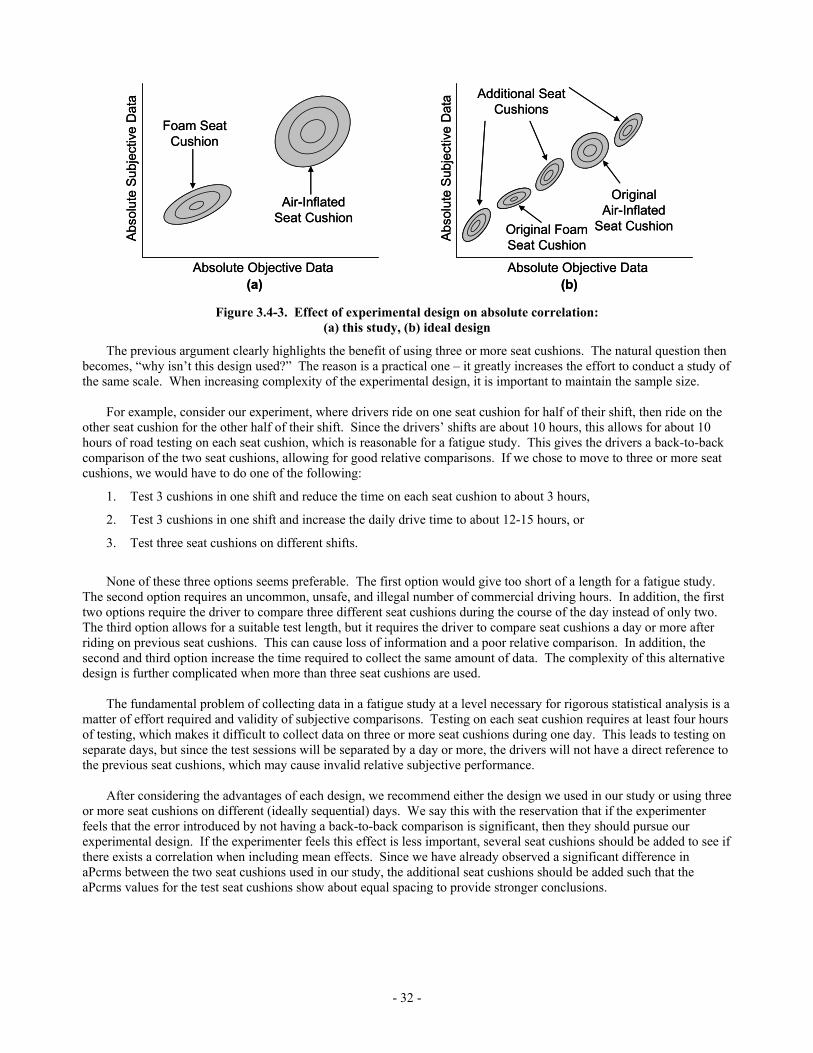
- 32 -
Absolute Objective Data
Abso
lute
Sub
ject
ive
Dat
aFoam Seat
Cushion
Air-Inflated Seat Cushion
(a)Absolute Objective Data
Abs
olut
e S
ubje
ctiv
e D
ata
Original Foam Seat Cushion
Original Air-Inflated
Seat Cushion
(b)
Additional Seat Cushions
Absolute Objective Data
Abso
lute
Sub
ject
ive
Dat
aFoam Seat
Cushion
Air-Inflated Seat Cushion
(a)Absolute Objective Data
Abs
olut
e S
ubje
ctiv
e D
ata
Original Foam Seat Cushion
Original Air-Inflated
Seat Cushion
(b)
Additional Seat Cushions
Figure 3.4-3. Effect of experimental design on absolute correlation:
(a) this study, (b) ideal design
The previous argument clearly highlights the benefit of using three or more seat cushions. The natural question then becomes, “why isn’t this design used?” The reason is a practical one – it greatly increases the effort to conduct a study of the same scale. When increasing complexity of the experimental design, it is important to maintain the sample size. For example, consider our experiment, where drivers ride on one seat cushion for half of their shift, then ride on the other seat cushion for the other half of their shift. Since the drivers’ shifts are about 10 hours, this allows for about 10 hours of road testing on each seat cushion, which is reasonable for a fatigue study. This gives the drivers a back-to-back comparison of the two seat cushions, allowing for good relative comparisons. If we chose to move to three or more seat cushions, we would have to do one of the following:
1. Test 3 cushions in one shift and reduce the time on each seat cushion to about 3 hours,
2. Test 3 cushions in one shift and increase the daily drive time to about 12-15 hours, or
3. Test three seat cushions on different shifts.
None of these three options seems preferable. The first option would give too short of a length for a fatigue study. The second option requires an uncommon, unsafe, and illegal number of commercial driving hours. In addition, the first two options require the driver to compare three different seat cushions during the course of the day instead of only two. The third option allows for a suitable test length, but it requires the driver to compare seat cushions a day or more after riding on previous seat cushions. This can cause loss of information and a poor relative comparison. In addition, the second and third option increase the time required to collect the same amount of data. The complexity of this alternative design is further complicated when more than three seat cushions are used. The fundamental problem of collecting data in a fatigue study at a level necessary for rigorous statistical analysis is a matter of effort required and validity of subjective comparisons. Testing on each seat cushion requires at least four hours of testing, which makes it difficult to collect data on three or more seat cushions during one day. This leads to testing on separate days, but since the test sessions will be separated by a day or more, the drivers will not have a direct reference to the previous seat cushions, which may cause invalid relative subjective performance. After considering the advantages of each design, we recommend either the design we used in our study or using three or more seat cushions on different (ideally sequential) days. We say this with the reservation that if the experimenter feels that the error introduced by not having a back-to-back comparison is significant, then they should pursue our experimental design. If the experimenter feels this effect is less important, several seat cushions should be added to see if there exists a correlation when including mean effects. Since we have already observed a significant difference in aPcrms between the two seat cushions used in our study, the additional seat cushions should be added such that the aPcrms values for the test seat cushions show about equal spacing to provide stronger conclusions.

- 33 -
SECTION 4: PLANS FOR IMPLEMENTATION This project has investigated the advantages of using newly proposed objective measures to highlight the differences between two distinct types of seat cushions – namely foam and air-inflated seat cushions. As outlined in Section 1 of this report, there results of this investigation will have significant impact. However, the significance of these results must be communicated to a large section of the transportation industry to realize this impact. To this end, the investigators have taken actions and are planning future action to make the results of this study relevant and available to the transportation community by several avenues. First, we have conducted this study in close partnership with original equipment manufacturers such as Volvo Trucks North America and PACCAR, seat suppliers such as Sears Seating, and seat cushion manufacturers such as The ROHO Group. This has ensured that their input has been included throughout this study and, more importantly, the results of the study are relevant to the end users for improving their practices. After ensuring that the results of this study are relevant to the end users, we must then actively make these results available and highlight their benefits for the transportation community. Through presentations of the results of this study at trade meetings and technical conferences, we intend to further communicate our findings to the transportation community and assist in transferring the results to the U.S. industries and trade organizations that can benefit from this work. Specifically, we intend to
• Write a series of papers at SAE technical conferences to highlight the benefits of using aPcrms to evaluate truck seat cushion designs for driver fatigue,
• Make presentations at industry partners, trade shows, and conferences,
• Write journal paper(s) to create a permanent reference to this work, and
• Write a seat cushion fatigue evaluation standard as part of the SAE Human Factors Subcommittee
This work will also be directly implemented in cooperation with our sponsor and industrial partner, The ROHO Group. First, they will use the results from this study in their technical and marketing materials to promote their product. Second, they will implement the results in this study by improving their future seat cushion designs and comparing different seat cushion designs. SECTION 5: CONCLUSION This report summarizes the work to complete the Safety IDEA Project “Safety Effects of Operator Seat Design in Large Commercial Vehicles”. A series of road tests were performed using commercial truck drivers in the daily operations of a revenue service fleet. Drivers were asked a series of questions to assess subjective performance of the vehicle environment, and pressure distribution measurements were collected throughout each test session. This data was then analyzed to assess the validity of two newly proposed measures to evaluate subjective ratings of driver fatigue. The results highlight the advantages of using these measures to evaluate the fatigue performance of distinct types of seat cushions – namely foam and air-inflated seat cushions. This section proceeds by addressing the three objectives stated for this project.
- 34 -
Objective 1: Investigate the effect of vehicle seat design on operator fatigue and vehicle safety The overall subjective response was favorable to the air-inflated seat cushion. When asked which seat they would prefer to drive on, 10 out of 12 drivers said they preferred the air-inflated seat cushion, while the remaining two were opinion-neutral. Overall, we see an 18% improvement in Comfort Score, a 56% improvement in Support Score, and a 14% improvement in Fatigue Score. Based on our results, we find that air-inflated cushions offer advantages in comfort, support, and fatigue. The increased adjustability in an air-inflated cushion leads to an improved ability to accommodate diverse populations of drivers. This increased adjustability also carries with it some difficulty, such as increased complexity and making it harder for drivers to get in and out. Even with these weaknesses, air-inflated cushions were preferred over foam cushions. Air-inflated seat cushions naturally offer advantages over foam cushions, and with an improved detail design and increased industry awareness of the benefits of air-inflated seat cushions, they should become a popular alternative to standard foam seats in the near future. Objective 2: Further validate recently developed methodologies for evaluating the effect of vehicle seats on operator fatigue Since the major physical difference between these two seat cushions is the pressure distribution at the body-seat cushion interface, it follows that any significant change in subjective rating would correspond to a significant change in the measures used to summarize the pressure distribution. We found only 3 out of 16 of the original pressure measures both showed a significant difference and were linearly independent. This led us to a reduced set of measures to consider: aPcrms, Mean Area, and longitudinal center of pressure. On the air-inflated cushion, we found aPcrms to be 8% lower, Mean Area to be 3% higher, and the center of pressure to be 1.5 inches further back compared to the foam cushion on average. This shows that aPcrms is favorable in the air-inflated seat cushion, and this difference is caused by a reduction in the areas in the 40-60 mmHg, 60-80 mmHg, and 80-100 mmHg ranges, ranges critical for human response. This indicates that the air-inflated seat cushion would promote better blood flow to the tissue in the seated area. The reduction of area in these higher pressure regions is caused by a larger contact area, which allows for lower pressures over the seated area. There is also a significant difference in the longitudinal center of pressure, where it is further back in the air-inflated seat cushion. This is perhaps due to a difference in contouring, where the body’s weight is shifted further back on the seat cushion. We then compared the mean effect of objective and subjective data for both seat cushions. This allows us to observe the relationships between the means of this data. As noted earlier, the air-inflated seat cushion saw an improvement in subjective rating in comfort, support, and fatigue. While subjective ratings improved on the air-inflated seat cushion, aPcrms decreased, Mean Area increased, and Longitudinal Center of Pressure fell further back on the air-inflated seat cushion. We also considered the correlation of the relative objective, and subjective data, but since the data was dominated by the mean effect of the seat cushion, the small changes of subjective and objective data on an individual seat cushion showed weaker results that were less conclusive. We then considered alternative experimental designs, where three or more seat cushions must be tested. This design is needed to establish a correlation with data dominated by the mean effect. These experiemental designs could be used in future studies to further investigate the effect of seat design on driver fatigue. The challenges involved in implementing these designs are then discussed. Despite these alternatives, we feel that our original experimental design is favorable for this study to maintain valid relative subjective responses between seat cushions. Objective 3: Provide design guidelines that can be used for evaluating and improving fatigue characteristics of vehicle seats. Finally, we describe our plan for implementing the results from this study. As outlined in Section 1 of this report, there results of this investigation will have significant impact. However, the significance of these results must be communicated to a large section of the transportation industry to realize this impact. To this end, the investigators have taken actions and are planning future action to make the results of this study relevant and available to the transportation community by several avenues.

- 35 -
First, we have conducted this study in close partnership with industrial partners to ensure that their input has been included throughout this study and, more importantly, the results of the study are relevant to the end users for improving their practices. After ensuring that the results of this study are relevant to the end users, we must then actively make these results available and highlight their benefits for the transportation community. We intend to further communicate our findings to the transportation community and assist in transferring the results to the U.S. industries and trade organizations that can benefit from this work. Specifically, we are working to
• Write a series of papers at SAE technical conferences to highlight the benefits of using aPcrms to evaluate truck seat cushion designs for driver fatigue,
• Make presentations at industry partners, trade shows, and conferences,
• Write journal paper(s) to create a permanent reference to this work, and
• Write a seat cushion fatigue evaluation standard as part of the SAE Human Factors Subcommittee
This work will also be directly implemented in cooperation with our sponsor and industrial partner, The ROHO Group. First, they will use the results from this study in their technical and marketing materials to promote their product. Second, they will implement the results in this study by improving their future seat cushion designs and comparing different seat cushion designs.

- 36 -
INVESTIGATOR PROFILE The Principal Investigator for this project is Dr. Mehdi Ahmadian who has more than seventeen years of research and industrial experience in advanced dynamic systems for vehicles, with particular emphasis on systems that contribute to human comfort in vehicles. His current research interests include the application of advanced technologies, such as magneto-rheological devices and piezoelectric systems, for improving the dynamics and safety of ground vehicles. Dr. Ahmadian’s work at Lord Corporation and GE Transportation Systems led to pioneering designs of controllable suspension systems for heavy trucks, active mounts for aircraft jet engines, and steerable bogies for freight locomotives. His university research has been sponsored by government agencies such as National Science Foundation, Federal Highway Administration, and Air Force Office of Scientific Research, as well as a variety of industries such as General Electric Company, Goodyear Tire and Rubber Company, Visteon Corporation, Volvo Trucks North America, Lord Corporation, The ROHO Group, Lear Corporation, and United Defense, L.P. In addition to advising more than thirty-five Ph.D. and masters students, he has authored in excess of eighty journal and conference papers and holds six U.S. and international patents. Dr. Ahmadian is a Fellow of the American Society of Mechanical Engineers (ASME), and a member of Society of Automotive Engineers (SAE) and American Institute for Aeronautics and Astronautics (AIAA). He served as Associate Editor for the ASME Journal of Vibration and Acoustics from 1989 to 1998 and currently serves as an Associate Editor for the AIAA Journal. Contact Information: Mehdi Ahmadian Professor and Director Advanced Vehicle Dynamics Laboratory Department of Mechanical Engineering, MC-0238 Virginia Tech Blacksburg, VA 24061 540-231-4920 / -9100(Fax) [email protected] http://www.avdl.me.vt.edu REFERENCES
1. Ahmadian, M., Seigler, M., Clapper, D., and Sprouse, A. A Comparative Analysis of Air-inflated and Foam Seat Cushions for Truck Seats. SAE Technical Paper 2002-01-3108, SAE Truck and Bus Exposition, November 2002.
2. Seigler, M., Ahmadian, M., Clapper, D., and Sprouse, A. Alternative Test Methods for Long Term Dynamic Effects of Vehicle Seats. SAE Technical Paper 2002-01-3082, SAE Truck and Bus Exposition, November 2002.
3. Surface Transportation Safety, DOT Strategic Plan 2000-2005. DOT Federal Motor Carrier Safety Administration, www.spp.fmcsa.dot.gov, January 2000.
4. 2010 Strategy – Saving Lives through Safety, Innovation and Performance. DOT Federal Motor Carrier Safety Administration, www.spp.fmcsa.dot.gov, January 2001.
5. Harrington, L. H. Federal Report – 2000 Agenda. Transportation Equipment News, March 2000.
6. Tekscan (BPMS) Body Pressure Measurement System, User’s Manual, Version 4.20, November 1999.
7. Uenishi, K., et. al. A Seat Ride Evaluation Method for Transient Vibrations. SAE Technical Paper 2001-01-0641, 2001.
8. Milivojevich, A., Stanciu, R., Russ, A., Blair, G. R., and van Heumen, J. D. Investigating Psychometric and Body Pressure Distribution Responses to Automotive Seating Comfort. SAE Technical Paper No. 2000-01-0626, March 2000.
9. R. Ott. Statistical Methods and Data Analysis. Wadsworth Group, 2001.