Embed Size (px)
Citation preview

WP-2012-021
Safe Gambles? Farmer perceptions of transactional certainty andrisk-return tradeoffs in contract farming schemes in southern India
Sudha Narayanan
Indira Gandhi Institute of Development Research, MumbaiSeptember 2012
http://www.igidr.ac.in/pdf/publication/WP-2012-021.pdf
Safe Gambles? Farmer perceptions of transactional certainty andrisk-return tradeoffs in contract farming schemes in southern India
Sudha NarayananIndira Gandhi Institute of Development Research (IGIDR)
General Arun Kumar Vaidya Marg Goregaon (E), Mumbai- 400065, INDIA
Email (corresponding author): [email protected]
Abstract
This paper examines the idea that contract farming arrangements in developing countries even while
offering farmers insurance against certain kinds of risks could simultaneously exacerbate other risks or
entail new risks of their own. If correct, farmer perceptions of risks and returns would vary
systematically across farmers with different contracting status and also across schemes. Using survey
data that elicits subjective distributions of returns and psychometric mapping of risk perceptions from
farmers, the study finds that contract farming, not unlike its alternatives, is associated with multiple
dimensions of uncertainty and sources of risk, in ways that likely influence participation.
Keywords: contract farming, subjective distributions, risk perceptions, stochastic dominance,elicitation methods
JEL Code: Q12, Q13, D84.
Acknowledgements:
The study was supported financially by the American Institute of Indian Studies's Junior Research Fellowship (2006), IFPRI-New
Delhi Office, the Borlaug-Leadership Enhancement in Agriculture Program (LEAP) Fellowship (2008), AAEA Foundation's
Chester McCorkle Scholarship (2008) and the Ithaca First Presbyterian International Student Fellowship (2007). Travis Lybbert
and David Just provided valuable advice on elicitation methods. Thanks are due to Chris Barrett, William Lesser, Stefan Klonner,
Bart Minten, an anonymous referee from IFPRI and seminar participants at Cornell University and IFPRI for comments on an
earlier draft of this paper. All remaining errors are mine.

Safe Gambles? Farmer perceptions
of transactional certainty and risk-return tradeo�s
in contract farming schemes in southern India
This paper examines the idea that contract farming arrangements in developing countries even
while o�ering farmers insurance against certain kinds of risks could simultaneously exacerbate
other risks or entail new risks of their own. If correct, farmer perceptions of risks and re-
turns would vary systematically across farmers with di�erent contracting status and also across
schemes. Using survey data that elicits subjective distributions of returns and psychometric
mapping of risk perceptions from farmers, the study �nds that contract farming, not unlike its
alternatives, is associated with multiple dimensions of uncertainty and sources of risk, in ways
that likely in�uence participation.
Key words: contract farming, subjective distributions, risk perceptions, stochastic dominance,
elicitation methods..
JEL codes: Q12, Q13, D84.
Introduction
Contract farming, an institutional arrangement between farmer and �rm to produce and transact
agricultural commodities on predetermined terms, is often regarded as possessing multiple advan-
tages for farmers in resource-poor developing countries. Speci�cally, when such an arrangement
involves production support from the �rm through the supply of inputs, credit, technical advice,
etc., it can potentially solve at once many missing market problems for participating farmers. In
addition, when buyback commitments are at pre-agreed prices, this implicitly protects farmers from
price risk. Contracting can thus bring about greater transactional certainty and reduced transactions
costs in many agrarian settings. Even as these are valid, anecdotal evidence suggests that contract-
ing in developing countries is sometimes also associated with high risks and uncertainties for farmers
involved in such arrangements. In particular, it could potentially leave a contracting farmer exposed
to certain catastrophic risks, even while simultaneously insuring farmers against certain other kinds
of risk. A �rm could, for instance, o�er a �xed price for the produce but renege on the commitment

to buyback produce. This acquires special importance when public enforcement of �rms' contractual
commitments is weak so that farmers are rendered vulnerable within the contractual relationship.
The motivation for this paper stems from this latter counterpremise, that a contract farming
arrangement in a developing country context, rather than being an insurance mechanism for the
farmer that increases transactional certainty, is instead akin to a new technology that comes with its
own attendant risks.1 This study suggests then that if contract farming arrangements mitigate many
risks but bring others in their wake, farmers must make more complex assessments and subjective
evaluations of multidimensional attributes involving multiple sources of risk and uncertainty.
From a policy perspective, this view implies that the degree to which contract farming can take
root depends signi�cantly on farmer perceptions of contract farming arrangements relative to the
alternatives available. Viewed simplistically, revealed preference theory suggests that farmers only
ever agree to participate in a contracting scheme if they expect, on an average, to bene�t from
the arrangement. A chief theoretical result that underwrites this viewpoint presumes that risk-
neutral �rms, possessing a greater capacity for risk-bearing, are able to insure risk averse farmers
through contracts, thus generating gains from transacting. Explanations for di�culties in scaling
up contracting arrangements or uptake are then assessed within this frame of reference.
The high mortality rate of contract farming schemes and farmer exit from schemes in developing
countries suggests a more complex phenomenon. In particular, it indicates that these contractual
arrangements perhaps themselves carry elements that trigger disadoption or prevent uptake, despite
perceived higher average returns, which could in�uence the trajectory of institutional evolution in
important ways.2 If this is true, it would re�ect in farmer perceptions and would di�er by a farmer's
contracting status.
A central goal of this paper is to examine if the claims implied by this viewpoint hold: Can
contracting in a developing country setting itself be a gamble pretty much like the alternative spot
market? If this is correct, to what extent is it a safe gamble relative to the alternatives available to a
farmer? How does the heterogeneity of farmer perceptions of relative risks between contracting and
its alternatives associate with contracting status (or their revealed preference)? Relatedly, can high
mean returns associated with contract farming coexist with a high risk associated with such returns,
1 For a more general view of markets themselves as technologies, see Barrett (2008).2 Empirical literature on technology adoption often assumes that a given new technology is bene�cial (Foster
and Rosenzweig 1996). Disadoption is less frequently studied. Theoretical work aligned to the property rightsapproach o�ers greater scope for incorporating technologies with ambivalent impacts, but there have been few empiricalapplications in the area of contract farming. Barrett et al. (2012) cite instances of such farmer exit from modernsupply chains, other instances of churning are reviewed in Reardon et al. (2009) and Reardon and Timmer (2005).
2

either in terms of price variance and skewness or other risks di�cult to monetize? This paper uses
unique data from a survey of 822 farmers across �ve contract farming schemes in the southern Indian
state of Tamil Nadu to examine these questions, covering gherkins, papaya, marigold, cotton and
broiler. In the context of contract farming in developing countries, this is one of the �rst e�orts
to measure directly individual farmer perceptions of net returns and risks associated with contract
farming relative to its next best alternative across multiple dimensions to demonstrate that contract
farming might be associated with ambivalent normative implications.
Following this introduction, I explore the rationale for investigating farmer expectations and
perceptions of risk. I then elaborate on the multidimensional aspects of risk with contracting in
general and discuss the structure of risks for the �ve schemes that form the basis of this study.
Thereafter, I describe the methods used in the �eld survey for eliciting farmer perceptions before
analyzing farmers' perceptions of returns and other risks associated with contracting and the next
best alternative, illustrating that contracting is no more an insurance mechanism than the alternative
arrangements it seeks to replace.
The Structure of Risks and Metrics
Traditionally, risk in agrarian contexts has been articulated in terms of risk preferences and objective
risk, with di�erences in decisions across farmers being attributed to di�erence in risk aversion or
attitudes toward risk (Binswanger 1980; Dillon and Scandizzo 1978; Moscardi 1977). More recently,
there is increasing recognition that perceptions of risk matter a great deal, so that economic decisions
involving uncertainty are shaped not just by risk preferences but by interpersonal and intertemporal
variation in subjective assessments of conditional distributions of relevant outcomes (De Weerdt
2005; Delavande, Gine, and McKenzie 2009; Gine, Townsend, and Vickery 2008; Slovic 1987; Weber
and Milliman 1997).
An old but relatively brief tradition of this in agricultural economics �nds that farmers' cropping
decisions and land allocation patterns are consistent with their yield and returns expectation (Grisley
and Kellogg 1983; Goodwin, Sanders, and de Hollanda 1980; Herath, Hardaker, and Anderson 1982;
Smith and Mandac 1995; Botha and Meiring 1999).Norris and Kramer (1990) provide a comprehen-
sive review of this tradition. There is now resurgent interest in collecting subjective probabilities and
elicitation of expectations in surveys, partly prompted by recent advances in behavioral economics.
3

Manski (2004) demonstrates that preferences and expectations are often consistent with observed
data for a whole range of applications. Nyarko and Schotter (2002) report, using experimental tech-
niques, that the beliefs they elicit from participants do a better job of explaining choices that those
that come from three common belief formation models.
To the extent that perceived risk and not actual risk determines economic behavior, risk per-
ceptions obtained through surveys have important informational content for data analysis, notwith-
standing methodological caveats (Delavande, Gine, and McKenzie 2009; De Weerdt 2005; Anderson,
Dillon, and Hardaker 1977; Dominitz and Manski 1996b,a). As Smith, Barrett, and Box (2001)
explain, subjective risk perceptions are valuable since they incorporate multiple factors, including
the individual's understanding of the objective risks, the individual's expectations about his or her
own exposure to risks, and his or her ability to mitigate (ex ante) or cope (ex post) with the adverse
events if they occur and indeed also incorporative of experience and in�uence, say, of social networks,
for example. Recent studies have used measures of risk perceptions both as explanatory factors to
analyze economic decisions and as dependent variables to investigate the formation of these per-
ceptions. A number of them use subjective expectations in the context of agriculture and livestock
(Bellemare 2009; De Mel, McKenzie, and Woodru� 2008; Delavande 2005; Delavande, Gine, and
McKenzie 2009; Doss, McPeak, and Barrett 2008; Gine and Klonner 2005; Gine, Townsend, and
Vickery 2008; Lybbert and Barrett 2007; Smith, Barrett, and Box 2001, 2000).
Assessing Risk and Uncertainty
This study draws on the tradition of eliciting subjective probabilities, claiming that expectations
regarding uncertain events can contribute to explaining economic decisions, although this study does
not seek to explain farmer participation in contract farming schemes per se. The formation of these
perceptions or explaining how farmers come to make these subjective assessments is not within the
scope of this study and is hence not addressed.
Since Knight (1921), it is common to treat risk as random events to which mathematical prob-
abilities of occurrences can be assigned and uncertainty as pertaining to random events to which
mathematical probabilities cannot be assigned, with the latter, known as Knightian uncertainty. I
assume that agents who make decisions are able to assign subjective probabilities to all random
events when making decisions or declare their inability to do so based on their lack of knowledge
that might form the basis of these assessments. The study's focus is on a collection of attributes
4

that represents aspects of uncertainty associated with contracting and not contracting. Since these
attributes are associated with uncertainties, they contribute to value assessments that farmers make
for these choices depending on whether they have a negative impact or a positive impact on their
well-being. Like Smith, Barrett, and Box (2001), this study then sees risk as denoting a conjunc-
tion of uncertainty and adversity. In other words, these attributes, representing di�erent source of
uncertainty, can be either risk exacerbating or risk mitigating.
I now lay out the architecture of these attributes of uncertainty and their potential in�uence
on risk exposure as perceived by the farmers and describe the method used in the �eld survey to
measure farmer perceptions of these.
What contract farming insures and what it does not
In general, elements of contract farming practice can contribute either to reducing risks associated
with production and marketing or to increasing them relative to the farmer's alternative to con-
tracting. It is not unusual for both phenomena to coexist, so that a contract farming arrangement
might reduce risks with respect to some aspects while simultaneously introducing or exacerbating
those on other fronts. Empirical work on contract farming demonstrate this amply.
A number of studies show that participation in these schemes holds a number of advantages for
the farmer, such as availability of inputs in a timely manner of reliable quality and technical advice
that contributes to increased and more stable yields (da Silva 2005; Eaton and Shepherd 2001; Minot
2008). Farmgate collection of produce and delivery of essential inputs reduce transactions costs and
time signi�cantly, which can otherwise be substantial in developing countries. Having an assured
buyer who will pick the produce at a pre-agreed price simpli�es selling decisions, obviating the need
to negotiate a transaction. Contract farming schemes are known to have protected farmers, with
a large part of the price risk being transferred to the �rm that might possess a greater capacity
to bear such risks (Knoeber and Thurman 1995; Bellemare 2012; Ramaswami, Birthal, and Joshi
2005; Michelson 2010, for example). Each of these aspects is typically rendered variable if the farmer
chooses to produce for the open market, although in traditional settings, the farmer might be able
to rely on a network of known traders and input dealers.
Emerging empirical evidence suggests, on the other hand, that while contracting with a �rm for
inputs/outputs mitigates some risks for the farmer, it entails its own set of risks (da Silva 2005).
From the point of view of the farmer, moral hazard arises primarily from the fact that the �rm
5

could reject their delivery on grounds of poor quality, timing, etc., attributes that are typically
left unspeci�ed in the contract or arbitrarily enforced. This is particularly the case when the �rm,
which needs a minimum procurement volume (say, to run a processing plant to its desired capacity)
might also contract more quantity than they need, as a bu�er against production risk or farmer
default. This rejection at the factory or farm gate has been cited as one of the most contentious
aspects of the farm-�rm relationship (Echanove and Ste�en 2005; Glover 1987; Mannon 2005). There
have been documented instances of �rms setting quality standards arbitrarily, becoming inexplicably
stringent if spot market prices collapsed, indicating ample supply available from alternate suppliers.
Sometimes, farmers have also had to bear the brunt of poor technical assistance, even plain cheating
and deliberate default (Glover 1987; Ramaswami, Birthal, and Joshi 2005). Additionally, the farmer
might also evaluate the risk that the �rm might not return the next season to contract. This is
important, for instance, when the farmer would not want to sever the long-term relationship (s)he
has with the village broker or trader. There could be other perhaps longer term risks as well,
such as ecological damage or adverse health impacts on account of particular production processes
and so forth (da Silva 2005; Pomareda 2006). There is also the oft-neglected issue of catastrophic
risk, when exogenous events trigger an implosion of existing schemes. These could emanate from
discrete changes in downstream markets that force contracting �rms to alter procurement practices
or production processes dramatically and often suddenly.3 Despite its enormous implications, this
aspect has been largely left out of rigorous empirical work on contract farming.
Which risks are mitigated for the farmer and which ones are exacerbated depends crucially on the
precise nature of the contract farming arrangement and is hence essentially an empirical question.4
The data for this study come from a survey of 822 farmers covering �ve commodity sectors -
cotton, gherkins, marigold, papaya, and broiler chickens - conducted in two phases between 2008
and 2010. The study area includes nine administrative districts in the southern Indian state of
Tamil Nadu and is heterogeneous in its agro-ecological conditions, physical features, and levels of
socioeconomic development. The list of contracting farmers for the year of the survey was obtained
3 For example, Fold and Gough (2008) discuss how varietal preferences of consumers in Europe impacted pineapplecontract arrangements in Ghana. Ashraf, Gine, and Karlan (2009) documents a breakdown of a contracting schemein Kenya.
4 The theoretical literature on contracting o�ers ways of understanding how existing risks are distributed in di�erentways across contracting parties, along the lines of Eswaran and Kotwal (1985), for example. There is less theoreticalwork admitting the possibility of new risks that might be borne exclusively by one party.
6

from one contracting �rm (or `subject' �rm) in each of the commodities studied. 5 Based on this
list, all the hamlets in the sample area were divided into contracting and non-contracting hamlets
and their corresponding villages into contracting villages or non-contracting villages. A similar
exercise was carried out for the larger administrative units called blocks and then districts. Starting
from the largest administrative unit for the study area, contracting districts were sampled, within
which contract and non-contract blocks were randomly sampled and then further on, within sampled
blocks, contract and non-contract villages were sampled and so too with hamlets. In the hamlets
sampled, a census of all households identi�ed four key types of farmers: those currently contracting;
those who were growing the contract crop but for the open market or contracting for other �rms;
those who had given up contracting with the subject �rm; and those who had never contracted. The
sample respondents were randomly selected from each type. If a farmer grew the contract crop for
some other �rm and quit, they were not sampled.
The schemes operate in rainfed agricultural areas and have diverse arrangements with farmers.
Gherkins are a non-traditional export crop with no domestic market. The crop is procured from
farmers and processed at small-scale plants by washing, rinsing and preserving in brine, acetic acid
or vinegar. These are either bottled and labeled for international clients or shipped out in barrels for
bottling. Cotton is a traditional cash crop in parts of the study area, with established local markets
and networks. Recent years have seen mills coordinating and integrating along the garment chain,
extending backward to contract with farmers for good quality, long staple cotton for milling. Papaya
was introduced in the region in the 1990s for extracting papain, which has wideranging industrial
uses. The variety is appropriate, but not ideal, for table consumption, and the fruit is a by-product
that is used to make candied fruit or for pureeing. Marigold contracting was initiated by �rms for
oleoresin extraction for export, mainly as coloring agent for poultry feed. Marigold has a thriving
local market, however, for fresh cut �owers that are used for a number of occasions, religious and
otherwise. The broiler industry in the study region is almost completely vertically coordinated, a
process that began in the mid-1990s. Day-old chicks are provided by the �rm and bought back by
the contracting �rm. The �rm acts as an aggregrator-intermediary, but also has its own brand of
chicken in various processed forms.
5 All �rms were approached, who were contracting for the particular commodity in the study area. The �rmsselected as the subject or sample �rms were those that were contracting that year and were willing to share thecomplete list of contract farmers. The study �rms were the �rst to share these lists.
7

All contract commodities are cash crops and involve production processes that require farmers
to respond continuously to the need to maintain quality. Firms engaged in contract farming thus
engage actively in the production process, not only providing critical inputs but also maintaining
close supervision from sowing through to harvest and post-harvest handling. The commodities and
�rms selected for study represent varying degrees of involvement by the �rm in the production process
or intensity of contractual relationship. The cotton �rm brings in a third-party input manufacturer to
monitor and advise farmers, arranging for credit from a nationalized bank and providing materials to
store the harvested cotton. The mill's role is con�ned to coordination and oversight of operations.
The gherkins �rm provides farm inputs (seeds, fertilizers and pesticides) on credit; this is later
recovered from the farmers at the time of harvest, when farmers are paid for the produce, net of
input costs. Field o�cers on the company's rolls monitor crop health and advise farmers periodically.
Broiler represents even higher relationship intensity with the �rm's o�cials visiting contract growers
every day to monitor health and status of the birds. These �rms provide day old chicks to the farm
and have detailed protocols for feed mix and vaccination schedules. For papaya, the involvement of
the �rm varies over the life cycle of the crop. In the nursery stage, �eld o�cials monitor the crop
closely with daily visits and once the plant matures into the �owering stage, there is limited oversight,
unless the situation demands it. In papaya, an interesting feature is that labor for latex extraction
is organized and trained by the �rm, with the wages being borne by the farmer. Latex extraction
requires great skill and the �rm believes it can ensure quality and supply of latex for the plant by
maintaining a pool of trained workers, who extract latex on contract farms. Marigold represents the
least participation of the �rm in the production process, related partly to fewer quality requirements
that need only modest supervision. In fact, the marigold �rm suggests that monitoring is required
more for contract enforcement rather than for production under contract. The marigold �rm thus
restricts itself to providing high quality seeds at subsidized prices and training new contract farmers
in the cultivation practice for marigold. Its �eld o�cials advise farmers periodically on pest and
disease control. Across the schemes there is heterogeneity in the way risks are distributed between
�rm and farmers, although they do share many features, such as provision of some critical inputs,
technical advice and an agreement to buy back at the end of the season.
There is a priori reason to believe that the revenue for the farmer from contracting is, by design,
a stochastic variable. This arises both from yield variability and on account of price structures.
8

A shared feature across the commodities in the study is the �rms' practice of contracting for
acreage rather than quantities, implying that the �rm takes on yield risk.6 Interviews with agribusi-
nesses suggest that contracting acreage is more acceptable to the farmer partly because the crop
is unfamiliar to farmers (like gherkins) but mostly on account of a widespread perception is that
exposing farmers to yield risk, in the absence of easy access to crop insurance, would undermine
the relationship the �rm has with farmers. Once contract acreage is agreed upon, contracting �rms
then provide farmers with as many seeds as is technically recommended for optimal yields on the
contracted area. The understanding then is that farmers sell the entire crop from the contracted
area to the �rm. While this implies that the �rm faces uncertain contractual delivery volumes from a
given contractee, equally, it implies that for farmers, revenues from contracting a particular acreage
could vary with yields. The yield is both naturally variable and related to the e�ort and ability of
the individual farmer. So this introduces some stochasticity in the revenue stream from contracting.
Further, contracted produce is accepted by the �rms only if it meets certain established though
not necessarily measurable standards. For a farmer accustomed to a less discerning buyer in the
traditional channel, this could compound the uncertainty associated with delivered volumes.
As far as the price is concerned, the belief that contract farming, by �xing a price, reduces price
risk is valid only in a limited sense. The contract price is sometimes a mark up on a reference
wholesale market price and hence �uctuates along with the market price. It is also not unusual
for price to be tied to some measure of quality or benchmark. This implies that price is rendered
dependent on farmer e�ort or on factors beyond his or her control.
While returns to contracting are potentially stochastic, there are other risks farmers might as-
sociate with contracting. Some are pre-existing risks (or risks shared across modes of operation,
contracting and not contracting) that continue to be borne by the farmer. Others are new risks
that come with contracting. Some risks are somewhat long-term, for example, the e�ects of contract
inputs on human health and soil quality, whereas others are immediate. Further, risks could be
one-o�, like losing title to land, or they could be recurring risks, risks that occur each season the
farmer contracts. For instance, in each contracting season there is a perceived possibility that the
�rm does not turn up to collect the harvest. This is potentially a critical risk when there exists
no alternative domestic market for the contract commodity. If the �rm does evacuate contracted
6 For broiler, the size of the shed sets the scale of contracting and �rms allot birds so that there is one bird for oneor 1.2 square feet of shed space.
9

produce, there is always a chance that the product is downgraded on the basis of quality checks that
are not always transparent, price might be discounted, and so on.
In the balance, only a subset of these risks is re�ected in the farmers' subjective distributions of
returns. Other risks that are more di�cult to translate into monetary terms also �gure prominently
in the farmers' `mental model' of contract farming and could potentially exert a powerful in�uence
on decision to contract. Quite apart from this, for farmers, contract farming is part of a larger set of
decisions that are made as part of the farmer's livelihood strategy, for instance, how much exposure
to have to markets and how much to provide for one's food needs.7 There are also other dimensions
that are not easily monetized, like the notion of self-respect and independence that drives farmer
decisions (Key 2005).
To be able to address the particular concerns of this work I use a combination of two approaches to
record farmers' subjective assessments of these risks. The �rst involves elicitation of entire subjective
distributions of net returns associated with contracting and not contracting and the second comprises
a psychometric mapping and measurement of other uncertainties or risks to which farmers might
�nd it di�cult to assign monetary values and hence might not incorporate in thier assessment of
returns distributions.
Eliciting Subjective Distributions
The �rst approach entails eliciting the subjective distributions of the farmer with respect to yield,
price and net pro�t, wherever possible, under contracting and for an appropriate alternative. The
appropriate alternative refers to the farmer's articulation of what (s)he considered as the next best
alternative course of action, were the contracting option not available to them. This is characterized
as either growing the contract crop for another �rm or the open market or switching to a competing
crop. For example, a contract farmer for gherkins might have a next best option that involves
contracting with a competing �rm or not growing gherkins at all to grow tomato instead. In the
former situation, the farmer is asked to name the competing �rm that seems the next best alternative
ask about the speci�c expectations with that �rm. In the lattter situation, subjective distributions
are measured for tomato. 8 For those farmers not currently contracting with the sample or subject
7 Echanove Huacuja (2003); Echanove and Ste�en (2005), for instance, provide instances where farmers in Mexicotry to minimize their risks by planting vegetables for two di�erent companies and, on occasion, cultivating producefor the national fresh market.
8 In the survey, almost all farmers named a single crop as the alternative to the contract crop. Where there weremultiple competing crops, they were able to pick one that they considered the closest substitute for the contract crop.
10

�rm (whether they grow for the open market or contract with some other �rm), the alternative was
predetermined as contracting with the sample or subject �rm.9
Farmers were therefore asked about the bene�ts associated with their actual choice and the
bene�ts from the alternative the farmer did not choose. The aim is to compare the bene�ts from the
farmer's choice (of contracting or not contracting) relative to the other option, had it been available.
This was asked of four classes of farmers, those currently contracting with the subject �rm, former
contract farmers with the subject �rm, those currently contracting for other �rms or cultivating for
open market, and those who have never contracted with any �rm and are currently not producing
the contract commodity.
For each farmer there are six subjective distributions : yield, price and net returns, each for the
contract crop under contracting and the alternative option as chosen by the farmer. The returns here
refer to net pro�t per acre per season (net pro�t per cycle for broiler) of the contract or alternate
crop and refer to the income earned minus all paid out costs. Unpaid inputs are not factored in
and �xed costs were not apportioned. Farmers were simply asked for the net income they were
left with per unit area of production at the end of the season, after paying out all production and
transactions costs for the entire season, including multiple harvests. This seemed to be a reasonable,
though admittedly not the only, basis for assessing farmers' evaluations of alternatives. Farmers
typically clari�ed that these net pro�t assessments factored in a subset of risks associated with the
marketing channel like price discounts and rejection of quality, etc., so that there is some overlap of
the attributes accounted for in the two approaches. The subjective distributions were obtained with
speci�c reference to the particular �rm sampled or the trader or �rm they were transacting with at
that time and not any representative �rm or abstract notion of contracting. This is essential if it is
to relate to participation and contracting status, given the heterogeneity of �rms and practices.10
In general, the minimum, modal and maximum value of expected outcomes were elicited through
the survey and the farmers were then asked to assign 20 stones as weights to each of these three
Only in a couple of cases, the farmers suggested that they would leave the land fallow, in which case there exists noalternative distribution. The returns distribution associated with the alternative was treated as being degenerate atzero. Given the typically small size of contracted acreage, the possibility of the contract acreage being assigned tomultiple crops contemporaneously did not arise.
9 It is possible that contracting with a �rm other than the subject �rm might be the next best alternative for thefarmer who grows for the market, but this would rule out consistent comparisons across farmer categories and washence not considered.
10 This is to suggest that a farmer's perception of contracting with �rm A need not be identical to the farmer'sperception of contracting with �rm B even if the salient aspects of contracting, price and quality are exactly alike,that there might be non-contractual elements that drive farmers to prefer contracting with one �rm rather than theother.
11

points, re�ecting the expected relative frequencies of the outcomes. These serve as the subjective
probabilities at the minimum, mode and maximum values.11
Despite the usefulness of such elicitation techniques, these are not without problems, being very
sensitive to the way questions are posed and also the context of heuristic biases, among other
things (De Weerdt 2005; Delavande, Gine, and McKenzie 2009). To illustrate, all three subjective
distributions (price, yield and net returns) were not possible for all cases. For gherkins, for instance,
because contract pricing is a schedule of prices related to size of the gherkins, farmers had di�culties
in articulating a single (average, e�ective) price. Similarly, the heuristic of availability, or rather the
lack of it, was at work for farmers who had never contracted. Having never experienced contracting
themselves, and having little vicarious knowledge of this option, the idea of contracting seemed too
remote to be able to articulate their expectations regarding returns, yield and price. This data `gap'
however itself yields insight in the sense that lack of information of options (and the related absence
of subjective assessments) might in�uence farmer choices.
Another potentially important problem is the self-con�rmation bias, where farmers articulate
expectations that a�rm the choices they have made because a�rmation is desired for its own sake.
In this study, since the farmer makes repeated decisions on whether to contract or not, the issue of
self-con�rmation bias is reduced to the extent that farmers get repeated opportunities to reassess
their choice afresh at each decision point. Indeed, if we admit that farmers learn in a dynamic
setting, the problem of self-con�rmation bias seems less of a concern. Another way I try to deal with
this is to frame the question in terms of a longer time horizon, implicitly urging farmers to `span
out' before revealing their expectations.12 Figure 1 plots the range of expectations of net pro�ts
elicited against the actual net pro�t for the most recent season and it is apparent that the most
recent outcome does not exert a disproportionate in�uence on the subjective expectiations.
I did not ask ex post about a choice they made ex ante, which would make it hard to distinguish
between regret over a stochastic outcome and regret for a poor decision. I also place this set of
11 In practice, it was not easy to implement this procedure literally and farmers frequently preferred to assignfrequencies verbally. Some even expressed their desire to assign fractions of points which the number of stones wouldnot allow them to do.
12 The question, translated from the Tamil, reads: �If you were to follow the same set of procedures, with thesame �rm and �eld o�cer, under the same contractual terms and assuming the general conditions in your family,village and weather are unchanged, out of 20 seasons growing the contract crop in a plot of your choice, which hasthe same qualities, what is the number of occasions you would attain the minimum/ the most likely / the maximumprice/yield/net income per acre of the commodity?�
12

Figure 1. Comparing expectations and outcome
questions before discussing their recent experience or the immediate plans so as not to anchor their
responses in time.13
For analysis, I use mainly the subjective distributions of returns or the net pro�t per acre. Given
that both price and yield are stochastic, the focus on the measure for net returns that have been
directly elicited presumably accounts for any potential covariance between price and yield, making it
a more reliable indicator. Data on subjective returns to contracting versus the next best alternative
for each respondent enables me to compare, at the farmer level, the moments of these distributions
as well as the comparison of the entire distribution using stochastic dominance techniques, again for
each farmer. In general, it makes more sense to compare these distributions for each farmer rather
than across farmer categories. This is owing to the signi�cant di�erences in alternatives available
13 I necessarily assume that these subjective distributions are somewhat stable over time. This is necessary to beable to relate the data on subjective distributions to contracting status in the most recent season. If the subjectivedistribution is in�uenced disproportionately by the most recent experience, then these expectations might be moreclosely related to contracting status for the season that follows rather than the season just passed. To an extent thisproblem is addressed by the question's time horizon.
13

to farmers both across regions and schemes so that the moments, say, the mean net return for
alternatives, averaged over farmers, requires careful interpretation.14
Mapping of Risks
The second component of elicitation is mapping a comprehensive list of attributes that can either
contribute to increasing or decreasing risk exposure, i.e., the risk associated with a contracting or
the farmer-de�ned next best alternative. This roster of attributes was assembled in the course of
the pilot survey as the collection of all possible attributes listed or mentioned by farmers in a series
of open-ended questions about the relative merits and demerits they saw in contracting versus not
contracting. These attributes are listed in Table 1. Each attribute could be associated with either
increasing risk exposure or decreasing it. For example, a �eld o�cial could work well for one farmer
and not the other, so that the attribute that the �eld o�cial is available at hand could work as a risk
mitigator for the former and as a risk enhancer for the latter. Further, some of these risks could be
accounted for in farmers' articulation of subjective distributions of price, yield or returns. Attempts
to focus on only those risks that are unlikely to be factored into the farmer's calculation of subjective
net returns were di�cult. For example, a farmer who felt the �rm's poor quality of inputs often
ended up factoring this into his or her response on subjective yield and net returns distributions
while also mentioning it as a valid concern in the open-ended listing of risks. In practice, therefore
it was not possible to account for these overlaps. So these are necessarily coarse measures. However,
the farmer was asked to state his/her expectations under `regular' conditions, so that catastrophic
occurrences are likely not incorporated in the net returns distributions.15
The superset of attributes formed the basis for the �nal survey of farmers in the form of a list of
risk-attenuating and risk-enhancing attributes that farmers associate with contracting and its next-
best alternative.The questions themselves were open ended, however, so that the relevant attribute
14 In general, the units and crop duration of the alternatives varies from those of the contract commodity. Inthe survey, these have been harmonized over units and time frame for each scheme to make them comparable. Forexample, for papaya, the return to contracting was expressed as income per month since it is from a crop which lastsfor three years, whereas the alternative crop would be a three month crop - the net return for which is converted tothe equivalent for a month. In general, the gestation period for crops was not considered. E�ectively, the comparisonis only for a window when the contract crop or its alternative is generating a return. The yield can in fact vary overthe life of a crop and these subjective returns are not adjusted for the age of tree crops. This is less of a concernbecause these returns were elicited from farmers for conditions that were held similar across the 20 `times'.
15 For example, some risks such as the �rm not showing up to collect the produce or a complete loss of crop onaccount of pest were not incorporated in the expectations of net returns. For instance, the minimum expected netreturn was rarely close to zero and never negative.
14

Table 1: Risk Enhancing and Risk Attenuating Attributes
Contracting Not Contracting
14 22 10 13
Risk attenuating factors as-sociated with contracting
Risk exacerbating factors as-sociated with contracting
Risk attenuating factors as-sociated with next best al-ternative
Risk exacerbating factors as-sociated with next best al-ternative
Pc Rc Pnc Rnc
Yield �uctuations Yield �uctuations Yield �uctuations Yield �uctuations
Cash advance for input pur-chase
Yield �uctuations on ac-count of weather
Transactions time and cost Yield �uctuations on ac-count of weather
Credit availability Yield �uctuation on accountof pest and disease
Food self-su�ciency Yield �uctuation on accountof pest and disease
Availability of inputs (Seed,fertilizers, pesticides)
Initial investment Credit availability Rejection or downgradingquality of produce
Quality of inputs Rejection or downgradingquality of produce
Can sell anytime, �exibility Price �uctuations
Availability of technical ad-vice
Firm might not return tocontract in the future
Rejection or downgradingquality of produce
Availability of inputs (Seed,fertilizers, pesticides)
Crop duration Group default Availability of buyer / knowntrader
Quality of inputs
Transactions time and cost Firm may not show up Self respect Availability of technical ad-vice
Farmgate collection Field o�cials are not trust-worthy
Lumspum payments Quality of technical advice
Availability ofbuyer/Assured buyer
Impact on health Timely payments Transactions time and cost
Price premia Impact on soil quality Cash advance for input pur-chase
Lumspum payments Fear of losing land Credit availability
Timely payments Availability of labor Payment delays
Sure income Labor intensity
Firm bears losses Input costs
Administer vaccines Labor costs
Transactions time and cost
Quality of technical advice
Delayed payments
1 These are assembled from the responses of all the farmers.
is checked o� on the list based on the farmer's unprompted listing of these. The roster was meant
merely to assist investigators clarify or code the responses. 16
Given the multiple nature of risks and their varying impact, the relative importance of several
sources of risk is not clear. This poses a signi�cant challenge for measurement. One way to measure
16 Occasional prompting was required for reticent farmers, who took time to be persuaded that we were not sent bythe contracting �rm. In most cases, however, no such prompting was required. Whenever the listing of these relevantattributes was sparse, investigators prompted the farmer to ensure that these attributes were truly irrelevant and nota result of a farmer's reluctance to share such information. This was necessary especially for farmers interviewed �rstin a village. Prompting, as a rule, implied o�ering a set of attributes from the roster as examples and only in the caseof soil fertility and health implications did prompting entail mentioning the risk speci�cally. In general, farmers in thestudy area were candid about deeming the prompted risks as irrelevant, if that were indeed the case. For example,in the gherkins area since many farmers voiced a perception that gherkins cultivation a�ected health, when otherfarmers who did not mention this risk were prompted, often the response was `we do not think this is a problem,though in the village many women have experienced di�culties after working on the gherkins �elds'. That said, it isdi�cult to gauge precisely the e�ect of prompting on the nature of responses and detailed information on which riskwas obtained after or before prompting for each farmer was not recorded as part of the survey.
15

risk perception is to ask people an intensity measure with regard to a speci�c risk (Kohler, Behrman,
and Watkins 2007); another is to get a ranking of the relative importance of di�erent risks(Doss,
McPeak, and Barrett 2008; Smith, Barrett, and Box 2001). Aggregating these measures into reliable
indices can however be tricky especially when one wishes to compare measures across individuals
(Smith, Barrett, and Box 2001).
To avoid this problem, the survey uses psychometric measures of perceptions on cardinal scales.
Once a farmer identi�es a particular attribute as either risk mitigating or risk enhancing, the farmer
is asked the frequency of occurrence (that is, the probability of the risk) out of ten occasions and
the importance of the risk to their personal sense of well-being on a scale of 0 to 10 (these are akin
to weights attached to the risk). These weights were meant to proxy the monetary value of loss that
farmers associate with the risk in order to capture the distinction between low probability of high
loss versus high probability of low loss.17
This approach to collecting perceptions of risk allows me to construct risk scores for individual
farmers that factor in their perceptions of the bene�ts of risk reducing attributes and costs of risk
enhancing attributes of contracting and not contracting. The primary motive for this is to be able
to see how contracting does relative to not contracting from an individual farmer's perspective and
to see if these scores relate in expected ways to contracting status. To do this, all attributes are
partitioned into four sets, each representing attributes that increase risks associated with contracting,
Rc, increase risk exposure when not contracting, Rnc, reduce risk exposure under contracting,P c,
or when not contracting, Pnc. An attribute can appear both as a risk reducing and risk enhancing
factor even for the same farmer. For example, when availability of inputs appears as an attribute,
contracting can imply assured availability, so that it would be counted as an attribute in P c, and
it could also be the case that under not contracting, farmers face the risk of not having access to
inputs, so that it falls under Rnc. A list of these attributes is presented in Table 1 and detailed
discussion of that is reserved for section 3 of this paper. Here, I outline the method for constructing
a simple metric to represent the collection of attributes.
I compute three scores for each farmer, a risk frequency score (Rfi ), a risk criticality score
(Rgi ) and a combined risk score (Rfgi ). The frequency score weighs the relevant attribute with the
frequency of occurrence as stated by the farmer. The criticality score weighs each relevant attribute
17 The pilot survey tested the possibility of eliciting monetary values of losses associated with these risks, but owingto sparse and often imprecise data, this was not retained for the �nal survey.
16

by a cardinal response of how important the attribute is to the farmers indicated as relevant to
farmer i. The combined score weighs each relevant attribute with both the frequency and criticality
scale. In this case, a high frequency, low loss risk is treated as equivalent to a low probability, high
loss risk.
Denoting I(r) as an indicator variable taking the value one if the attribute r is relevant to the
individual farmer i and zero if not, the collection of all attributes r represent the universe of such
attributes, i.e., all the possible attributes listed by sample farmers as either contributing to increasing
risks or decreasing risks associated with contracting and its alternative. The score is summed within
each set of attributes to yield the following structure of scores.
Rgi = (
Risk enhancing︷ ︸︸ ︷∑r∈Rc
I(r)gi −
Risk attenuating︷ ︸︸ ︷∑r∈P c
I(r)gi )− (∑r∈Rnc
I(r)gi −∑r∈Pnc
I(r)gi)(1)
Rfi = (∑r∈Rc
I(r)fi −∑r∈P c
I(r)fi)− (∑r∈Rnc
I(r)fi −∑r∈Pnc
I(r)fi)(2)
Rfgi = (∑r∈Rc
I(r)figi −∑r∈P c
I(r)figi)︸ ︷︷ ︸Net risk score from contracting
− (∑r∈Rnc
I(r)figi −∑r∈Pnc
I(r)figi)︸ ︷︷ ︸Net risk score from not contracting
(3)
Rgi , Rfi R
fgi are interpreted as the net incremental risk the farmer associates with contracting. The
greater the score, the greater the risks farmers believe they are taking on with contracting, relative
to their next best alternative and after factoring in the bene�ts they associate with contracting.
This score does not re�ect monetary values though some of the component attributes a�ect incomes
directly.
The score is an absolute measure but is best interpreted in its broader context. The survey
identi�ed 22 attributes as belonging to Rc, 14 factors in P c 13 in Rnc and 10 in Pnc. A farmer
treating every attribute in every set as valid ends up with a risk score of 5. In other words, when
a farmer believes that each of the attributes in each set is relevant, that each of it is extremely
important to his or her sense of well-being (and hence carry the maximum score 10) and occurs
every time the farmer chooses to contract or not contract (with a frequency of 10 out of 10), that
farmer would have component scores of 22, 14, 13 and 10 yielding a combined risk score of 5. A
farmer who sees none of these attributes as relevant has 0 for each component score and hence a
17

combined net risk score of 0.18 The greatest incremental risk comes when a farmer associates all 22
risk enhancing attributes with contracting and believes that all 10 risk mitigating attributes from
not contracting as valid. Should the farmer choose contracting the net incremental risk would be 32.
This is the maximum risk farmers take on, given the set of risks de�ned by the sample. The least
incremental risk from contracting is associated with a farmer who treats all positive attributes with
contracting as relevant and the alternative option is associated only with risk increasing attributes
and all the risk increasing attributes. In this case, the net incremental risk a farmer takes on would
be -27. This de�nes the range of possible frequency and risk mitigating scores. The combined net
risk score is higher whenever a farmer associates a particular option with either a larger number of
risks, a greater criticality of risks or a greater frequency of risks, or combinations of these, ceteris
paribus.
These risk scores are coarse measures but o�er useful tools to make select comparisons across
farmer groups distinguished by contracting status. It also o�ers a tool to map the heterogeneity
in the distribution of attributes that operate on risks and uncertainties across di�erent contracting
schemes. 19
The Stochasticity of Contract Prices and Net Returns from
Contracting
With the combination of tools described above, it is now possible to map farmer perceptions of
relative risks and returns associated with contracting. For the purpose of this analysis the sample
farmers are treated as either contract farmers (implying they could either contract with not just the
sample or subject �rm but for any other �rm) or as non-contract farmers (denoting those who do
not currently contract at all).
Subjective distributions of net returns from contracting across farmers and commodity sectors
suggest that contracting is indeed a gamble. This is an outcome of the perceived stochasticity of
both price and yield by farmers.
As far as price goes, elicitations of subjective distributions of contract price that farmers expect
con�rm that the notion of �xity of contract prices is only approximately correct. Figure 2 plots
18 The risk scores are cast as di�erences and not as ratios in order to avoid instances of component scores being 0.19 Given that a great deal of debate on smallholder participation centers on their ability to take risks, it would be
of interest to understand if farmers with small landholdings tend to have higher risk scores than the larger farmers.This is however beyond the scope of this paper.
18

the coe�cient of variation of subjective distributions of contract prices for all the farmers in the
survey illustrating the extent of variation in the contract price that farmers expect.20 It is evident
from the kernel density function that far from being a degenerate distribution which would imply
zero variation in price, farmers expect to get di�erent contract prices, on account of factors that
might be related to quality or due to complex structures of pricing linked to commodity attributes
or market price anchors to contract pricing or farmer productivity. The �gure suggests too that non-
contract farmers are more likely to expect higher variation in contract prices than contract farmers.21
Contract farmers thus associate contracting with reduced price volatility than non-contract farmers.
Figure 2. The Stochasticity of Subjective Contract Prices of Contract and Non-contract
farmers
Note: The Kolomogorov-Smirnov test for equality of distributions suggests that with a D-statistic of 0.25, and an associatedp-value of 0.00 the null that the two distributions are equal can be rejected at 1% level of signi�cance.Contract farmers refer to those who contract with any �rm, i.e., either the subject or sample �rm or any other �rm. Non-contract farmers refer to those who do not contract with any �rm, these are either farmers who grow for the spot market orare attrition farmers or those who have never contracted.
20 The coe�cient of variation is presented since this enables pooling of data for all commodities. The data onsubjective distribution of contract price are computed only for non-missing observations. Close to eight percent ofthe respondents across both phases were unable to give complete and consistent distributions for the contract price.
21 Non-contract farmers here include farmers who have never contracted, those who have ceased contracting andthose growing for the open market. Contract farmers include farmers contracting for either the subject �rm or forany other �rm.
19

In general, it makes sense to think of contract prices as representing an objective price and a
subjective price, where the objective price is agreed upon as part of the contract and is conditioned on
certain parameters for delivery. The subjective price, meanwhile, is the contract price that farmers
expect to get. These are however distinct from what might be called the actual realized contract
prices.
While individual farmers' subjective contract price suggest that they may be stochastic, it is
instructive that the subjective modal contract price that farmers expect varies widely, despite the
fact that these farmers work with the contracting �rm on the same contractual terms. In other words,
farmers have similar contracts but very di�erent expectations of modal price, perhaps re�ecting an
assessment of their own abilities and idiosyncratic experiences with the subject �rm. Figures 3 and 4
show the distribution farmers who contract with only the subject �rms in the respective commodity
sectors.
Figure 3 for gherkins contract farmers in the two phases shows for instance that the distribution
of expected subjective contract price varies widely over the range of contract prices established by
the �rm for di�erent size categories, the latter indicated by the vertical lines.
In the case of cotton (Figure 4), the contractual price is a mark up on the three-day average of
the price prevailing in the wholesale market preceding the time of delivery. Farmers' expectation of
the modal expected contract price varies widely, re�ecting perhaps their perception of the variability
in market prices that anchor the contract price.22
The case of papaya and marigold (not shown here) present a contrast in that the distribution is
virtually degenerate, since for these two, the objective contract price, as speci�ed in the contract,
and the subjective modal contract prices expected by farmers vary only marginally and coincides
for all farmers.
Figure 5 shows the distribution of prices contract broiler growers actually received at the most
recent contractual delivery ; this is the distribution of contractual prices received across broiler
growers. 23 The distribution of realized contract prices on delivery lies to the left of the distribution
of subjective modal contract prices. This implies that farmers are either optimistic so that their
expectations of the contract price run higher or that this was a disappointing season.
22 These objective prices are Rs.34/kg. and Rs.37/kg at the time of the survey and were obtained from the �rmsaccording to the contract.
23 The vertical line in the �gure represents a benchmark price per kilogram of live weight broiler for a feed conversionratio (FCR) that the �rm considers optimal.
20

Figure 3. Subjective Modal and Objective Contract Prices of Gherkins Subject Con-
tract farmers
Note:The contract farmers refers to those who contract with the subject �rm. Vertical dashed lines represents the objectiveprice obtained from the contracting �rms. For gherkins, there are �ve sizes, each with an associated price with the smallestcommanding the highest price.
These comparisons reveal that the objective contract price need not necessarily coincide with the
subjective prices that farmers expect to receive in reality, and that this is an important source of
variation in expected net returns from contracting that di�ers across farmers and potentially over
time. Moreover, both objective and subject expected prices may di�er from actual realized prices,
allowing the possibility of disappointment and regret over contracting decisions.
The actual price a farmer earns for a given contractual delivery, or realized price, can therefore
be regarded as a draw from a distribution, be it from a farmer speci�c distribution of prices or from
a distribution of prices across farmers. In short, price under contracting need not necessarily be a
degenerate distribution, much less the farmers' subjective expectations of these prices, although the
more transparent and rigorous the measures of quality employed, the more certain the price o�ered
for produce. 24
The stochasticity in farmers' perception of prices combined with yield �uctuations renders the
expected net returns from contracting stochastic as well.25
In essence, if contracting is associated with some sort of certainty, it is not in an absolute sense,
and not in the realm of net returns. The question is then, if contracting is a gamble, how safe a gamble
24 For papaya, the latex price is related to the level of papain activity as measured by the Brix meter. Contractdeliveries by farmers invite a price discount or premium for an acceptable range of parameters. In the case of papaya,the survey revealed that the modal price for farmers was exactly Rs.90/kg, and the minimum and maxiumum werede�ned at Rs.80 and Rs.110/kg. For marigold, the price is scaled according to volumes delivered, primarily to o�eran incentive to honor the contract and prevent sidesale. The base price o�ered was Rs.2.85/kg for each ton delivered,with a premium of Rs.0.50 per kg. on the entire delivery, for each extra ton delivered.
25 The issue of yield �uctuation is not addressed here since not contracting is often associated with not growingthe contract commodity making yield comparisons di�cult.
21

Figure 4. Subjective Modal and Objective Contract Prices for Cotton Subject Contract
farmers
Note:The contract farmers include farmers who contract with the subject �rm. Vertical dashed lines represents the objectiveprice of (Rs.34/kg/. and Rs.37/kg. at the time of the survey, obtained from the contracting �rm.
Figure 5. Realized Prices, Subjective Modal and Objective Contract Prices compared
for Broiler Subject Contract farmers
Note: The contract farmers include farmers who contract with the sample �rm. Vertical dashed lines represents the objectiveprice obtained from the contracting �rms.
22

Table 2: Description of Indicators of Relative Moments for an Individual Farmer
Variable Computation
Ratio of mean subjective net returns from contracting and next best al-ternative
[µcµnc
]ifor each farmer i
Ratio of coe�cient of variation of subjective net returns[σcX̄c/ σncX̄nc
]ifor each farmer i
Di�erence in skewness in subjective net returns between contracting andnext best alternative
[Skc − Sknc
]ifor each farmer i
Di�erence in kurtosis in subjective net returns between contracting andnext best alternative
[Kc −Knc
]ifor each farmer i
1 These are computed using the elicited returns distributions for each farmer. These are then averaged across farmer typesor groups to make intergroup comparisons.
is it? One way to explore this aspect is to compare, for an individual farmer, the farmer-speci�c
moments of the subjective distributions of net pro�t per unit area across possible choices. These
include mean, coe�cient of variation, skewness, kurtosis measures for the subjective distribution
from contracting as well as that for the next best alternative. These are expressed in relative terms,
i.e., as farmer-speci�c relative moments to represent the relative attractiveness between contracting
and a farmer selected next best alternative. Table 2 gives details of these measures as a prelude to
subsequent tables.
Table 3 shows measures re�ecting the farmer-speci�c relative moments of the subjective dis-
tributions of contracting versus the next best alternative averaged over farmers for the di�erent
contracting schemes and farmer types distinguished by contracting status.26
The raw measures of the ratio of relative subjective returns between contracting and the next
best alternative suggest that contracting in gherkins, cotton and papaya is associated with higher
mean returns, irrespective of farmer type, i.e., whether they are currently contracting, have exited
the arrangement or have never contracted. Tellingly, however, farmers tend to associate contracting
not only with a higher mean, but also with higher coe�cient of variation, barring cotton farmers who
do not contract. This is evident from the ratio of the coe�cient of variation in subjective returns
between contracting and the next best alternative.
26 For this part of the analysis, the farmer types are disaggregated so that there are Subject Contract Farmers(who contract with the subject �rm), Other Contract Farmers (who contract with any other �rm), Attrition Farmersand Never Contract Farmers.
23

In the case of marigold and broiler, the reverse is true, so that the subjective mean returns from
contracting are lower relative to not contracting, except for marigold farmers who do not contract
with the sample �rm. Marigold farmers however associate contracting with a higher coe�cient of
variation. Only with broiler are clear indications of contract farming serving as an insurance against
risky returns, with contracting associated with a low mean and also a low coe�cient of variation
relative to the alternative.
Furthermore, higher variability in returns to contracting relative to its alternative, which Table
3 suggests is comparable across farmers, might not in itself be a signi�cant factor. Critical is the
skewness of the distribution. Contracting protects the farmer from downside price risk by �xing a
price. However, this also prevent farmers from exploiting high prices in the next best alternative.
Table 3 shows the di�erence in skewness between the expressed returns distribution of contracting
and not contracting. Whenever this �gure is positive, not contracting allows a greater possibility
of higher returns the contracting. In the Farmer Survey, many farmers who choose not to contract
suggest that the advantages with the open market is that when prices sometimes shoot up in the
open market and by opting to go for a contract crop one loses the opportunity to take advantage of
these price spikes, even if they were infrequent occurrences. Marigold farmers, for instance, associate
the spot market net pro�t distributions with a negative skewness, which renders the di�erence in
skewness between contracting and not contracting positive (Table 3) indicating relatively larger
opportunities of a higher return in the spot market than when contracting. The t-test of di�erence
in means across farmer groups is however not signi�cant for any comparison across farmer groups for
marigold. One reason could be the porosity of contracts; owing to weak enforcement, the farmers were
often able to divert part of the contract produce on a few festival days when prices for fresh marigold
�owers spiked. This muddies the comparison of relative skewness across the farmer categories. For
gherkins (Phase 2) and papaya, the di�erence in skewness for each group of non-contracting farmers
is positive and the �gure is statistically signi�cantly less than for contract farmers, in most cases.
Similarly, the di�erence in kurtosis of subjective distributions of contracting and the next best
alternative imply that a positive �gure indicates fatter tails associated with contracting relative as
compared with not contracting. In the case of broiler and papaya, the contract farmers, with both
the sample �rm and other �rms, associate contracting with a relatively thinner tail, whereas for
those not contracting the opposite is true. This pattern is evident in the gherkins sample from
Phase 2.
24

Table3:Relative
MomentsofSubjectiveDistributionsofNet
returnsforContractingrelative
totheNextBestAlternative
CommodityandFarmer
type
Averageofthe
ratio
ofmean
subjectivenet
returns
t-statistic
for
equality
of
means
across
groups
Averageofthe
ratio
of
coe�cientof
variationof
subjective
returns
t-statistic
for
equality
of
means
across
groups
Average
di�erencein
skewnessof
subjective
returns
distributions
t-statistic
for
equality
of
means
across
groups
Average
di�erencein
kurtosisof
subjective
returns
distribution
t-statistic
for
equality
of
means
across
groups
N
Gherkins:Phase1
SubjectContractFarmers
2.11
1.49
0.01
0.01
40
OtherContractFarmers
1.33
2.96
∗∗∗
1.35
0.64
0.12
-0.61
-0.13
0.67
58
AttritionFarmers
1.76
1.04
1.53
-0.17
0.04
-0.11
0.48
-1.85
∗∗
40
NeverContractFarmers
3.61
-0.99
1.12
2.06
∗∗
-0.03
0.2
-0.03
0.16
60
Cotton
SubjectContractFarmers
1.44
1.20
-0.07
0.01
60
OtherContractFarmers
1.33
0.32
0.65
2.26∗∗
0.12
-0.9
0.25
-0.57
6
AttritionFarmers
1.10
1.29
∗1.37
-0.41
-0.49
1.68
∗∗
-0.64
1.24
32
NeverContractFarmers
1.33
0.28
1.18
0.11
-0.16
0.43
-0.30
0.65
52
Gherkins:Phase2
SubjectContractFarmers
3.39
1.46
-0.11
-0.03
54
OtherContractFarmers
2.64
0.88
1.24
1.23
0.09
-1.45
∗0.07
-2.03
∗∗
23
AttritionFarmers
2.83
0.56
1.70
-0.9
0.06
-0.88
0.20
-1.32
18
NeverContractFarmers
3.68
-0.21
1.16
1.74∗∗
0.26
-2.96∗∗∗
0.08
-1.9
∗∗
21
Marigold
SubjectContractFarmers
0.85
1.75
0.32
-0.25
59
OtherContractFarmers
1.90
-2.69∗∗∗
0.90
4.34
∗∗∗
0.12
0.73
0.15
-1.1
24
AttritionFarmers
0.76
0.52
1.61
0.55
0.50
-0.61
-0.63
0.91
18
NeverContractFarmers
0.66
1.25
1.59
0.58
0.45
-0.63
-0.36
0.35
20
Papaya
SubjectContractFarmers
1.33
1.07
-0.06
-0.04
72
NeverContractFarmers
2.72
-2.69
∗∗∗
1.35
-1.55
∗0.24
-1.38
∗0.31
-1.37
∗27
Broiler
SubjectContractFarmers
0.30
0.76
0.13
-0.24
61
OtherContractFarmers
0.26
0.98
0.79
-0.25
0.08
0.38
-0.13
-0.65
10
AttritionFarmers
0.30
0.07
0.92
-1.24
-0.28
2.05
∗∗
0.10
-1.14
10
NeverContractFarmers
0.34
-2.12
∗∗
0.89
-1.96
∗∗
-0.11
3.19
∗∗∗
0.01
-1.63∗
57
Signi�cancelevels
:∗:10%
∗∗:5%
∗∗
∗:1%
1FarmerSurvey,Phase1and2,2007-10.
2Computationsincludeonly
thoseobservationsforwhichfarmerresponseswerecomplete.
3Therelativemomentsin
ratiospertain
tothoseassociatedwithcontractingoverthenextbestalternative.Thedi�erencesin
skewnessandkurtosis
arethoseforcontractingminusthenextbest
alternative.
4Thet-statisticsareforcomparisonsofrelativemomentsbetweencontractfarmersandeachoftheotherfarmertypes.Hence,thereis
nocorrespondingstatistic
forcontractfarmers.Thenullis
that
thedi�erencein
meanbetweencontractfarmersandtheotherfarmergroupis
zero.
5All�guresareroundedo�totwodecim
alplaces.
25

Inter-group comparisons of the means of these relative moments corroborate this pattern. For
gherkins and cotton, there is a statistically signi�cant di�erence between contract and a subset of
non-contract farmers for both mean and coe�cient of variation, emphasizing that contract farmers
see contracting as a high variance option, but also one that has a higher mean return relative to not
contracting. For broiler and papaya, the di�erence between contract and non-contract farmers for
the relative mean and coe�cient of variation is statistically signi�cant. This signi�es that contract
farmers for papaya and broilers might be willing to settle for a lower mean return if it is also
associated with a lower variance.
Table 4 shows, groupwise, the percentage of farmers for whom the subjective returns distribution
from contracting stochastically dominates that from the next best alternative. Oddly enough, the
tests for a signi�cant di�erence in proportion indicates that contracting stochastically dominates not
contracting for a signi�cantly greater proportion of non-contract farmers than for contract farmers.
Where this di�erence is with respect to the Never Contract Farmers group, as it is for gherkins
and papaya, it is plausible that a large proportion of those who have never experienced contracting
tend to associate it with a returns distribution that is unambiguously better than not contracting,
in part due possibly to inaccurate perceptions in the absence of experience to contract. The weak
correspondence of contracting status and stochastic dominance also points to other possible sources
of exclusion, either by virtue of having been rationed out by the �rm or on account of other concerns
that do not readily re�ect in returns distributions. The table shows for instance that for those
farmers who do not contract but believe that returns from contracting stochastically dominates
not contracting, an overwhelming majority stated in the survey that they were unlikely to want to
contract at any time in the next three years, 72%, 90% and 93% for gherkins (Phase 1), marigold
and papaya, respectively. The relationship between contracting decisions and farmer assessments of
risk-return tradeo�s is tested for robustness using regression methods (Appendix 1)
The data on farmers' subjective returns points to two broad issues. First, farmers are attentive
to mean returns from contracting but are likely take into consideration the entire distribution of
returns including other higher order moments. Second, other attributes that enhance or mitigate
risks can perhaps exert a reinforcing or countervailing in�uence on the decision to contract.
If non-contract farmers too associate contracting with higher relative mean returns, and indeed,
where subjective returns from contracting �rst order stochastic dominates not contracting, the ques-
tion arises as to why many farmers opt not to participate. While one explanation is that they were
26

Table 4: Stochastic Dominanace of Net returns for Contracting and the Next Best Alternative forDi�erent Farmer Types
Commodity and Farmer type Proportion offarmers forwhomcontracting�rst-orderstochasticdominates thenext bestalternative
Proportion ofthese who donot want tocontract
Z-statistic forequality ofproportion forcontractfarmers witheach farmertype
Proportion offarmers forwhomcontractingsecond-orderstochasticdominates thenext bestalternative
Z-statistic forequality ofproportion forcontractfarmers witheach farmertype
N
Gherkins:Phase 1
Subject Contract Farmers 35 45 40
Other Contract Farmers 26 29% 0.97 33 1.23 58
Attrition Farmers 40 31% -0.46 45 0 40
Never Contract Farmers 60 72% -2.45 ∗∗∗ 63 -1.8 ∗∗ 60
Cotton
Subject Contract Farmers 28 30 60
Other Contract Farmers 50 100 % -1.01 50 -1 6
Attrition Farmers 22 57% 0.67 25 0.51 32
Never Contract Farmers 31 81% -0.28 35 -0.52 52
Gherkins:Phase 2
Subject Contract Farmers 56 59 54
Other Contract Farmers 65 7% -0.79 70 -0.85 23
Attrition Farmers 56 50% 0 56 0.28 18
Never Contract Farmers 62 50% -0.5 71 -0.98 21
Marigold
Subject Contract Farmers 14 19 59
Other Contract Farmers 42 90% -2.82∗∗∗ 42 -2.19 ∗∗∗ 24
Attrition Farmers 17 100% -0.33 17 0.19 18
Never Contract Farmers 5 0% 1.04 10 0.9 20
Papaya
Subject Contract Farmers 32 36 72
Never Contract Farmers 52 93% - 1.82∗∗ 56 -1.75∗∗ 27
Signi�cance levels : ∗ : 10% ∗∗ : 5% ∗ ∗ ∗ : 1%
1 Farmer Survey, Phase 1 and 2,2007-10.2 The computations include only observations for which the responses of farmers regarding subjective distributions iscomplete.
3 Broiler farmers are excluded since the proportion of farmers for whom contracting �rst order stochastically dominates notcontracting is zero for all farmer groups.
27

rationed out by the contracting �rm, this is not always the case. Indeed, when those who had never
contracted were asked whether the �rm excluded them or they opted out, the percentage of farmers
who had never wanted to contract despite an opportunity to do so was 48% for gherkins, 50% for
marigold, 55% and 30% for broiler and papaya respectively. Evidence from the survey bears out the
premise that there might exist other overriding concerns for non-participation.
To see this, it is useful to superpose risk scores with subjective returns distributions. Figure 6
compares the distributions of relative mean returns of contract farmers (irrespective of which �rm
they contract with) and non-contract farmers, wherein the distribution of the latter is only marginally
more heavily concentrated below one than that of the non-contract farmers. Whereas, the risk scores
computed for attributes indicates that non-contract farmers believe they are taking on signi�cantly
greater incremental risks with contracting than do contract farmers. Kolomogorov-Smirnov test for
equality of distributions suggests that contract and non-contract farmers do not di�er overall in
their perceptions of relative returns from contracting versus its next best alternative, but do di�er
signi�cantly in the perceptions of the relative risks they associate with contracting (Figure 7).
In order to test the robustness of the association between perceptions and contracting status, a
set of commodity-wise and pooled regression equations were estimated, where contracting status is
the dependent variable and explanatory variables represent relative moments of these distributions,
stochastic dominance as well as other risk perceptions, among others. These are presented as sup-
plementary materials. All of them show that at least a subset of these variables are statistically
signi�cant
Mapping Sources of Risk across Attributes
Anecdotal evidence suggests that regardless of farmer perception of the variation in returns to
contracting or in the skewness of these distributions, contracting decisions are often driven by the
perception of possibilities of catastrophic risk.
In general, there is much variation across commodities. Table 5 shows the average scores by
commodity and farmer type for the three measures - the Combined Risk Score, Criticality Risk
Score and the Frequency Risk Score. These three measures appear equivalent. Hence, the Combined
Risk Score is used as the main indicator of the net incremental risk associated with contracting.
Figure 8 shows the distribution of the Combined Risk Scores according to commodity and farmer
type. It is clear that of the commodities studied, marigold contracting is generally associated very
28

Figure 6. Contracting and its Alternative: Comparison of Relative Returns
Note: The Kolomogorov-Smirnov test for equality of distributions suggests that with a D-statistic of 0.254, andan associated p-value of 0.20 the null that the two distributions are equal cannot be rejected at even 10% level ofsigni�cance.
Figure 7. Net Incremental Risk from Contracting: Combined Risk Scores for Contract
and Non-contract Farmers, 2008-10
Note: The Kolomogorov-Smirnov test for equality of distributions suggests that with a D-statistic of 0.17, and anassociated p-value of 0.00 the null that the two distributions are equal can be rejected at 1% level of signi�cance.
29

low incremental net risk exposure. Papaya and broiler contracting are associated with relatively
moderate net additional risk exposure, with gherkins and cotton occupying the higher end of the
combined risk score scale.
This is consistent with the qualitative information collected from the �eld survey. Even as gherkin
is regarded as lucrative and despite the decade long embrace of gherkin, it continues to be an exotic
crop grown for the `factories'. No local market exists for gherkin and it does not �gure in local
diets. Many farmers had visited the factories as part of the company's e�orts to build con�dence
of farmers in this new crop. To most farmers the rapid growth of the gherkins crop was a wonder,
attributed to the high level of inputs. In fact, across the survey region, the Tamil name for the crop
was visha vellri, or poison cucumber, a reference to the relatively high level of chemical inputs it
required.
It is also clear that gherkin is a highly demanding crop in terms of labor inputs, especially during
harvesting. Timely harvesting of produce is critical. This has something to do with the structure of
the contract, where small gherkins command a premium over larger ones. Since the gherkins grow
rapidly in size, from day to day, in order to get the maximum returns, the farmers need to harvest
gherkins �on the day that matters�.27 Any delay could cause a profound dent in the revenues a
farmer can get. Farmers opined, for instance, that �even if there is a death in the house at harvest
time, we have to put the body aside until we �nish with the gherkins�.28 Many who chose not to
contract cite small families and lack of family labor or lack of availability of labor as reasons for not
doing so.
Also, women tend not to work on gherkins plots. There is a popular perception among the
farming families that the pesticide use in gherkins �elds is detrimental to women's reproductive
health and causes workers (especially women) to faint. While this is largely unsubstantiated in the
sense that there is no independently available scienti�c evidence on the link between morbidity and
pesticide use in the speci�c context of gherkins cultivation in the study area, the higher incidence
of women's health issues in the villages has been enough to keep the women away from working on
gherkins �elds. This appears to have an impact on the willingness to contract as well.
Another impression that was shared across villages in one part of the study area is that gherkins
cultivation led to deterioration is soil quality. Some farmers claimed that paddy, when it followed
27 Farmer Survey, Phase 1, 2008, Reddiarchatram block, Dindigul district.28 Farmer Survey, Phase 1, 2008, Natham block, Dindigul district.
30

gherkins on the same plot, yielded half of what it would otherwise. Some others claimed they
changed the top soil layer, when they switched from gherkins to another crop, in order to restore
soil quality. As a consequence of soil quality concerns, some farmers participate in episodes, growing
gherkin every other year, but not more frequently. Indeed, �eld o�cers recommend switching plots
and rotating crops to maintain soil fertility.
The riskiness associated with cotton contract farming is quite di�erent in complexion. Cotton
is a traditional cash crop in the region, and the �rm contracting is well known. Farmers associated
cotton contracting with signi�cant bene�ts. For example, a positive externality from contracting
for both cotton (and gherkins, in fact) is the advice farmers got for plant protection for other
crops. This has obvious value, against the background of a collapse in state agricultural extension
programs. According to most farmers, the �eld o�cers advised them against the indiscriminate use
of pesticides and that fertilizer application needs to take into account the type of soil. This seemed
to be a revelation for the farmers. But this advice also seemed very dependent on who the �eld
o�cer was. Despite this, the pricing in the cotton contracting scheme, which is a mark-up on the
market price, exposed farmers to the market price �uctuations the same way as the alternatives for
the farmer. The quality requirements of the �rm for staple length and cotton free from external
impurities was considered a problem. Most of all, however, many farmers believed that the �rm
did not pay on time and discounted prices somewhat arbitrarily. Collectively these rendered cotton
contracting a risky proposition relative to the alternative. Most cotton contract farmers suggested
that they would opt to grow a competing crop like tomato or chilies, or cotton for the open market.
Interestingly, the year of the survey was the last season the cotton �rm contracted. It seems that
the high risk scores re�ected farmer discontent, an important ingredient of the failure of cotton
contracting in the region.
In the case of papaya, Table 5 suggests that farmers who do not contract associate papaya
contract farming with lower risks than do contract farmers. This is likely owing to the particular
turn of events during the time of the survey. Papaya contracting had been growing popular across
swathes of the study area. Despite requiring a long gestation period, since the trees bear fruit only
in the eighth month or so, farmers were content with the arrangement. However, in June 2009, the
worldwide epidemic of papaya mealybug reached southern India and the contract papaya �elds and
farmers in the area lost entire plantations to the pest. Consequently during the survey, virtually
31

Figure 8. Net Incremental Risk from Contracting by Commodity and Contracting
Status, 2008-09
all contract farmers expressed risks of pest and consequent yield loss as the most important risk
associated with contracting.
Marigold is viewed as bringing on less incremental risk for several reasons. This crop needs low
initial investment, it is not too labor demanding and in a region that is fairly remote up in the
hills, �rms collect produce at the farmgate while delivering all the inputs to the farmer. The �rm
has been around for over two decades. In addition, unlike gherkins or papaya, there is a vibrant
alternate domestic market. In the case of marigold, therefore, the �xed price o�ered by the �rm and
the relative indi�erence to quality makes it a reliable insurance mechanism for the farmer. Indeed,
the spot market o�ers a lucrative sideselling option during festive occasions when the marigold price
spikes. For the farmer, the alternative of growing for the spot market and growing on contract are
not mutually exclusive owing to weak contract enforcement.
For broiler, there are no substantial perceived risks and those that exist have to do with the
placement of birds, administration of vaccines, quality of feed and timely lifting of birds. In general,
the broiler contracting �rms exert substantial control over wholesale market prices of live birds by
regulating the volume traded. Each growing cycle spans six weeks and �rms calibrate the volume
of chicks placed with contract farmers based on projections of market prices six weeks ahead. This
implies that whenever the �rm wants to curtail supply in the upcoming months, it cuts back on
placements of chicks with contract farmers. Alternatively, farmers who are promised �ve or six
32

Table 5: Mapping Farmer Perceptions of Net Additional Risk Exposure from Contracting with theSubject Firm
Commodity and Farmer Type Risk Scores N
Combined Risk Score Criticality Risk Score Frequency Risk Score
Range: -270 to +320
All commodities
Subject Contract Farmers -1.57 -1.85 -1.92 347
Other Contract Farmers -1.24 -1.30 -1.48 122
Attrition Farmers -0.65 -0.91 -0.84 118
Never Contract Farmers -0.61 -0.81 -0.83 241
Gherkins
Subject Contract Farmers -2.93 -0.42 -15.40 95
Other Contract Farmers -24.30 -3.64 -19.41 82
Attrition Farmers 58.91 35.19 61.29 58
Never Contract Farmers 65.85 92.15 55.51 81
Cotton
Subject Contract Farmers 0.28 0.55 0.40 60
Other Contract Farmers 0.53 1.20 0.68 6
Attrition Farmers 0.32 0.36 0.36 32
Never Contract Farmers 0.55 0.94 0.56 52
Marigold
Subject Contract Farmers -6.12 -8.71 -7.28 59
Other Contract Farmers -3.27 -4.88 -3.84 24
Attrition Farmers -3.82 -5.82 -4.61 18
Never Contract Farmers -4.61 -7.12 -5.50 21
Broiler
Subject Contract Farmers -1.94 -1.07 -2.41 61
Other Contract Farmers -3.00 -2.73 -3.87 10
Attrition Farmers -0.95 0.20 -1.17 10
Never Contract Farmers -0.29 0.30 -0.30 60
Papaya
Subject Contract Farmers -0.96 -0.51 -1.21 72
Never Contract Farmers -1.07 -1.28 -1.27 27
1 Farmer Survey, Phase 1 and 2,2007-10.2 The scores are designed to lie between -270 and +320. The former is for farmers who associate contracting with onlypositive attributes and not contracting with only negative attributes and list all attributes as relevant, and assign themaximum score of 10 to each of these. The latter is for farmers who associate contracting with only negative attributesand not contracting with only positive attributes, treat all of these attributes as relevant and assign 10 for frequency orcriticality or both.
3 The combined risk score has been divided by 10 so that all the scores have the same range.
33

poultry batches (or cycles) annually are o�ered fewer batches.29 By the same token, �rms can also
time the picking up of the birds, so as to control supply in the wholesale market. For the broiler
grower, this a�ects the price they get via the weight of the bird at the time of pickup, so that they
might end up with a sub-optimal feed conversion ratio.
In general, several risks appear important that have important implications for why contract
farming schemes are so fragile in India (Table 6). Noteworthy is the farmer perception of the risk
of losing land. Poor land titling often implies that farmers hesitate to sign contracts for fear that
it might involve con�scation of their land in case of defaults. Close to 15 % of the sample farmers
stated that they associated contracting with a �rm with the possibility of losing their land. The
qualitative information from the survey suggests that some of these farmers stated a preference for
oral contracts on account of this. Attributes that were most often cited as risk attenuating in the
context of contracting were availability of inputs, technical advice and the bene�ts of not having to
physically travel to a market to sell produce. An assured buyer who pays lumspum is also viewed
as a distinct advantage, with almost 30% valuing this as a relevant bene�t with contracting. Labor
demands also appear to occupy a big place, as the case of gherkin illustrates.
Throughout the survey villages, it was common to �nd that farmers who contracted were less
sure about the company they were contracting for than the �eld o�cer who interacted with them.
This is not surprising, since to most of the farmers the �eld o�cer was the face of the company
and took responsibility for every interaction throughout the cropping cycle. This also meant that
where farmers were aware of the identity of the contracting �rm, the �eld o�cer's competence was
projected on to that of the company. The latter did not seem to have an existence independent of
its personnel. The trustworthiness of the �eld o�cer also �nds place in the risk map.
It is evident from the discussion that the motivation to contract is driven by considerations that
interact in complex ways. Importantly, it emphasizes that it is not adequate to think of contract
participation as being driven exclusively by �rm preferences and to accord a substantive role to
farmer willingness to participate in these arrangements.
29 Some farmers are rationed out on the extensive margin by not being o�ered fewer batches per year, so that theirbird sheds are left empty. Many farmers are o�ered fewer birds per cycle, or are rationed out on the intensive margin.
34

Table 6: A Mapping of Attributes In�uencing Risk Exposure under Contract and its Alternative
Contracting Not contracting
Risk enhancing Risk reducing Risk enhancing Risk reducing
Count C F Count C F Count C F Count C F
Production related attributesYield �uctuations 317 7.7 4.9 31 8.0 6.9 70 9.3 7.2Yield �uctuations on accountof weather
18 8.8 6.0
Yield �uctuation on account ofpest and disease
103 9.2 6.5 32 8.8 6.9
Initial investment 3 8.3 10.0Cash advance for input pur-chase
50 7.6 5.0 57 6.6 9.0
Credit availability 77 7.3 5.1 52 6.4 4.9 223 7.1 2.8Availability of inputs (Seed,fertilizers, pesticides)
50 6.9 4.9 320 8.0 7.9 87 6.8 4.8
Quality of inputs 174 8.0 4.5 131 7.7 5.1Availability of labor 62 8.1 7.0 215 8.7 6.7Labor intensity 23 8.4 8.5 29 7.7 8.9Input costs 3 10.0 10.0Labor costs 88 7.2 5.3Availability of technical advice 190 6.7 6.7 246 8.1 4.3 134 9.0 8.9Qaulity of technical advice 302 8.9 6.1Crop duration 4 7.5 10.0Food self-su�ciency 30 8.9 9.8
Marketing AttributesTransactions time and cost 14 8.3 8.0 1 5.0 10.0Farmgate collection 150 8.5 7.4Availability of buyer 226 8.9 2 5.5 1.5Price �uctuations 150 8.5 7.1 340 8.8 9.2 337 9.4 5.4Price premiaRejection or downgradingquality of produce
162 7.7 5.0 117 8.1 5.3 29 6.9 7.9
Lumspum payments 245 8.7 9.9Timely payments 72 7.8 5.1 230 8.8 8.4 60 6.4 4.7Firm might not return to con-tract in the future
7 5.4 4.4
Group default 12 8.1 3.8 141 7.6 7.2Firm may not show up 86 8.6 4.5 8.4Field o�cials are not trustwor-thy
19 7.1 5.2
ImpactsImpact on health 117 8.8 8.5Impact on soil quality 54 8.6 7.1Fear of losing land 112 7.1 5.2Self respect 7 6.4 10.0Firm bears losses 10 10.0 7.0Administer vaccines 1 5.0 4.0Sure income 42 7.9 4.8 6 7.5 7.5Assured buyer 90 7.2 4.8 201 9.4 7.5
1 C: Average of responses on a scale of 0 to 10 indicated criticality of the risk. This serves as criticality weights for eachfarmer in the computation of risk scores. F:Average of responses on a scale of 0 to 10 indicated frequency of the risk.This serves as frequency weights for each farmer in the computation of risk scores.
2 Farmer Survey, Phase 1 and 2,2007-10.
35

Concluding Remarks
This paper set out to examine the idea of contract farming as an insurance mechanism for farmers,
hypothesizing that such arrangements are rather analogous to new technologies with diverse and
hence ambivalent normative implications.
Farmers seem sensitive not just to mean returns or even variance but also higher order moments
of the subjective net returns distributions. These could vary across commodities. For example,
whereas broiler contracting is associated by contract growers with a low mean for a low variance in
contract price, contract farmers for some other commodities are willing to tolerate a higher variance
of returns with a higher mean returns. The data suggest too that even farmers who do perceive
contract farming returns as being higher than their alternatives, on an average, nevertheless might
not participate if they perceive large and catastrophic risks associated with it. Further, whenever
the alternative market o�ers options for an occasional windfall, this might override considerations
of mean returns when opting out of contracts.
The evidence from the study a�rms that contract farming does mitigate some risks but poten-
tially increases others, a feature not adequately acknowledged in existing contract farming research.
Implicitly, the empirical evidence highlights the need for more careful consideration of farmer per-
ceptions of the risks and bene�ts associated with contract farming when studying participation in
contract farming arrangements. In particular, the psychometric mapping of risks points to the pres-
ence of a number of attributes that are not easily monetized and are hence di�cult to account for
through perceptions of pro�tability expressed in monetary terms. These considerations of perceived
risks and bene�ts collectively de�ne a farmer's individual rationality constraint when a �rm presents
the farmer with an option to contract.
From a policy perspective, that contracting could be a gamble in itself potentially explains non-
adoption. This implies that there could be limits to uptake, which might not be the case were contract
farming unambiguously bene�cial. This underscores the importance of having realistic expectations
about the reach of contract farming in developing countries despite its obvious advantages. It also
suggests that with expansion in contract farming arrangements in developing countries, notwith-
standing their wideranging bene�ts, there is a continuing relevance for appropriate instruments for
risk mitigation.
36

References
Anderson, J.R., J.L. Dillon, and J. Hardaker. 1977. Agricultural decision analysis. Ames: Iowa State
University Press.
Ashraf, N., X. Gine, and D.S. Karlan. 2009. Finding missing markets (and a disturbing epilogue):
Evidence from an export crop adoption and marketing intervention in Kenya. London: Centre for
Economic Policy Research.
Barrett, C., M.F. Bellemare, M. Bachke, H. Michelson, S. Narayanan, and T. Walker. 2012. �Small-
holder market participation in evolving agricultural value chains: Comparative evidence from
three continents. Mimeo.� World Development 40(4):715�730.
Barrett, C.B. 2008. �Smallholder market participation: Concept and evidence from eastern and
southern Africa.� Food Policy 33(4):299�317.
Bellemare, M.F. 2012. �As you sow, so shall you reap: The welfare impacts of contract farming.�
World Development 40(7):1418�1434.
�. 2009. �Sharecropping, insecure land rights and land titling policies: A case study of Lac Alaotra,
Madagascar.� Development Policy Review 27(1):87�106.
Binswanger, H. 1980. �Attitudes toward risk: Experimental measurement in rural India.�
Botha, P., and J. Meiring. 1999. �Evaluating Elicitation Methods for Cumulative Distribution Func-
tions of Wheat and Maize Prices.� Agrekon 38:633�644.
da Silva, C. 2005. The growing role of contract farming in agri-foodsystems development: Drivers,
theory and practice. CABI Publications.
De Mel, S., D.J. McKenzie, and C. Woodru�. 2008. �Returns to capital microenterprises: evidence
from a �eld experiment.� Quarterly Journal of Economics 123(4):1329�72.
De Weerdt, J. 2005. �Measuring Risk Perceptions: Why and How.� Working paper, World Bank.
Delavande, A. 2005. Pill, patch or shot? Subjective expectations and birth control choice. Centre for
Economic Policy Research. Discussion Paper Series, U.K.
Delavande, A., X. Gine, and D. McKenzie. 2009. �Measuring Subjective Expectations in Developing
Countries: A Critical Review and New Evidence.� Working paper.
Dillon, J.L., and P.L. Scandizzo. 1978. �Risk Attitudes of Subsistence Farmers in Northeast Brazil:
A Sampling Approach.� American Journal of Agricultural Economics 60:425�435.
37

Dominitz, J., and C.F. Manski. 1996a. �Eliciting student expectations of the returns to schooling.�
Journal of Human Resources 31(1):1�26.
�. 1996b. Perceptions of economic insecurity: Evidence from the Survey of Economic Expectations.
National Bureau of Economic Research. Working Paper Series No.5690.
Doss, C.R., J. McPeak, and C.B. Barrett. 2008. �Interpersonal, intertemporal and spatial variation
in risk perceptions: evidence from East Africa.� World Development 36(8):1453�68.
Eaton, C., and A. Shepherd. 2001. Contract farming: Partnerships for growth. Food and Agriculture
Organization, Rome.
Echanove, F., and C. Ste�en. 2005. �Agribusiness and Farmers in Mexico: The Importance of
Contractual Relations.� The Geographical Journal 171:166�177.
Echanove Huacuja, F. 2003. �Trabajo por contrato para las empresas congeladoras de hortalizas de
Guanajuato. (Work for Hire for the Vegetable-Freezing Companies in Guanajuato, Mexico. With
English summary.).� Comercio Exterior 53:139�49.
Eswaran, M., and A. Kotwal. 1985. �A theory of contractual structure in agriculture.� The American
Economic Review 75(3):352�367.
Fold, N., and K.V. Gough. 2008. �From smallholders to transnationals: The impact of changing
consumer preferences in the EU on Ghana's pineapple sector.� Geoforum 39:1687�1697.
Foster, A.D., and M.R. Rosenzweig. 1996. �Technical Change and Human-Capital Returns and
Investments: Evidence from the Green Revolution.� The American Economic Review. 86(4):931�
953.
Gine, X., and S. Klonner. 2005. Credit constraints as a barrier to technology adoption by the poor
:Lessons from South-Indian small-scale �shery . Washington, D.C.: Development Research Group,
Finance Team, World Bank.
Gine, X., R. Townsend, and J. Vickery. 2008. �Patterns of rainfall insurance participation in rural
India.� World Bank Economic Review 22(3):539�66.
Glover, D.J. 1987. �Increasing the bene�ts to smallholders from contract farming: Problems for
farmers' organizations and policy makers.� World Development 15 (4):441�448.
Goodwin, J.B., J.H. Sanders, and A.D. de Hollanda. 1980. �Ex-Ante Appraisal of New Technology:
Sorghum in Northeast Brazil.� American Journal of Agricultural Economics 62:737�741.
Grisley, W., and E.D. Kellogg. 1983. �Farmers' subjective probabilities in northern Thailand: an
elicitation analysis.� American Journal of Agricultural Economics 65:74�82.
38
Herath, H.M.G., J.B. Hardaker, and J.R. Anderson. 1982. �Choice of Varieties by Sri Lanka Rice
Farmers: Comparing Alternative Decision Models.� American Journal of Agricultural Economics
64:87�93.
Key, N. 2005. �How much do farmers value their independence?� Agricultural Economics 33:117�126.
Knight, F. 1921. Risk, Uncertainty and Pro�t . Boston and New York: Houghton Mi�in.
Knoeber, C.R., and W.N. Thurman. 1995. � �Don't Count Your Chickens...�: Risk and Risk Shifting
in the Broiler Industry.� American Journal of Agricultural Economics. 77:486�496.
Kohler, H.P., J.R. Behrman, and S.C. Watkins. 2007. �Social Networks and HIV/AIDS Risk Per-
ceptions.� Demography 44:1�33.
Lybbert, T.J., and C.B. Barrett. 2007. �Bayesian herders: updating of rainfall beliefs in response to
external forecasts.� World Development 35(3):480�97.
Mannon, S.E. 2005. �Risk Takers, Risk Makers: Small Farmers and Non-Traditional Agro-Exports
in Kenya and Costa Rica.� Human Organization 64:16�27.
Manski, C.F. 2004. �Measuring expectations.� Econometrica 72 (5):1329�76.
Michelson, H. 2010. �Small farmers, big retail: Trade-o�s and dynamics of supplying supermarkets
in Nicaragua.� PhD dissertation, Cornell University, Ithaca,N.Y.
Minot, N. 2008. �Contract Farming in Developing Countries: Patterns, Impact, and Policy Impli-
cations.� In P. Pinstrup-Andersen and F. Cheng, eds. Case studies in food policy for developing
countries. Ithaca, N.Y.: Cornell University Press, vol. 6-3.
Moscardi, A.d.J., Edgardo. 1977. �Attitudes toward Risk among Peasants: An econometric ap-
proach.� American Journal of Agricultural Economics 59:710�716.
Norris, P., and R. Kramer. 1990. �The elicitation of subjective probabilities with applications in
agricultural economics.� Review of Marketing and Agricultural Economics 58:127�147.
Nyarko, Y., and A. Schotter. 2002. �An experimental study of belief learning using elicited beliefs.�
Econometrica 70(3):971�1005.
Pomareda, C. 2006. �Contract Agriculture: Lessons from experiences in Costa Rica.� Paper prepared
as part of a series of contributions by RIMSIP-Latin American Center for Rural Development to
the preparation of the World Development Report 2008 �Agriculture for Development�.
Ramaswami, B., P.S. Birthal, and P. Joshi. 2005. �E�ciency and distribution in contract farm-
ing: The case of Indian poultry growers.� Indian Statistical Institute, Planning Unit, New Delhi
Discussion Papers, pp. .
39
Reardon, T., C.B. Barrett, J.A. Berdegue, and J.F.M. Swinnen. 2009. �Agrifood Industry Transfor-
mation and Small Farmers in Developing Countries.� World Development 37:1717�1727.
Reardon, T., and C. Timmer. 2005. �Transformation of markets for agricultural output in developing
countries since 1950: How has thinking changed?� In R. Evenson and P. Pingali, eds. Handbook of
agricultural economics: Agricultural Developmen: Farmers, Farm production and Farm markets.
Elsevier Press, vol. 3, pp. 2808�2855.
Slovic, P. 1987. �Perception of Risk.� Science 236:280�285.
Smith, J., and A.M. Mandac. 1995. �Subjective versus Objective Yield Distributions as Measures of
Production Risk.� American Journal of Agricultural Economics 77:152�161.
Smith, K., C.B. Barrett, and P.W. Box. 2001. �Not necessarily in the same boat: Heterogeneous
risk assessment among East African pastoralists.� Journal of Development Studies 37(5):1�30.
�. 2000. �Participatory risk mapping for targeting research and assistance: with an example from
East African pastoralists.� World Development 28(11):1945�59.
Weber, E.U., and R.A. Milliman. 1997. �Perceived Risk Attitudes: Relating Risk Perception to
Risky Choice.� Management Science 43:123�144.
40

Appendix
This appendix presents robustness checks for the relationship between contract participation on
the one hand and perceptions of risk and the relative moments of the subjective distributions of
contracting and its alternatives. It contains results from a pooled regression model of contracting
status with �xed e�ects for commodities followed by commodity speci�c regressions.
The dependent variable is contracting status, which takes unit value if the farmer contracts with
the subject �rm and zero otherwise, including those who may contract with other �rms, grow the
contract commodity for the spot market or not grow the contract commodity at all. Explanatory
variables capture farmer and farm characteristics, locational attributes, �rm presence in the region
indicated by the number of contract villages in the block in which the farmer is located. The
regression model is run for only those blocks where the �rm contracts. This implies that this
regression model estimates the probability that a farmer contracts with the subject �rm conditional
on the subject �rm operating in the block. The rationale for this is to net out spatial selection e�ects,
so that �rms might be choosing based on geographic attributes rather than farmer attributes.
Central to this model is a set of variables pertaining to a farmer's subjective perceptions of
contract farming including the relative moments of contracting versus the next best alternative
represented by relative mean, cooe�cient of variation, di�erence in skewness and kurtosis. A binary
variable for �rst order and second order stochastic dominance of net returns from contracting and
the next best alernative are included and it takes unit value when there is dominance. Further,
the Combine Risk Score is included to represent the overall net risk associated contracting with
the subject �rm. In addition, the model includes the farmers risk aversion coe�cient and a binary
variable that takes the value one if the farmer is ambiguity averse. 30 An explanatory variable
that interacts farmer risk aversion coe�cient with the coe�cient of variation in spot market prices
30 These were elicited through three sets of experiments. To see if farmers were risk averse, each was o�ered a choiceof accepting Rs. 150 for sure or alternatively, opt for a coin toss, such that if it is heads (s)he would get Rs.210 andif it is tails, Rs.90. The sure amount was set equal to the daily wage for a male skilled agricultural laborer prevailingat that time. For ambiguity aversion, the opportunity to win Rs.150 was o�ered. Each farmer was presented withtwo bags. Bag 1 contained four white balls and six black balls. If the ball the farmer picked was white, (s)he wouldget Rs.150. Bag 2 contained 10 balls (also with four white and six black balls). In this case, the farmer was toldthat some are white and some are black but how many of each there are not known. They would choose a color andwould win Rs.150 if they picked a ball of that color. Farmers who chose to go with the former game were consideredambiguity averse. Finally, to elicit a lottery price, farmers were asked (translated from Tamil) �Supposing you wereo�ered a lottery ticket, where the prize is decided by a coin �ip. You win Rs. 300 if Heads and 150 if Tails. Whatis the maximum you would be willing to pay for the lottery ticket?� This was used to compute the Arrow-Prattcoe�cient of risk aversion
41

is included to capture preference for some degree of price insurance with contracting. All of these
constitute elements of the farmers participation and incentive compatibility constraint.
Farmer characteristics are represented by age, education status, family size, proxies for wealth
status, including the �eld investigators' assessment of the relative poverty of the household in the
sample village. Farm size that is often a critical factor is assessing whether contract farming schemes
are inclusive of smallhodler is represented both by land owned and land leased in. Irrigation facilites
are also accounted for in the model both in terms of whether the land is irrigated or not and the
proportion of land that has irrigation. Distance of the farmer residence from the nearest road and
the nearest market representing the �rms costs of contracting with the farmer are also included.
Sunk costs and debt are included. These are codetermined with contracting status since for example
being able to contract for broiler necessarily means a one time investment in sheds. Debt might
be related to the need to make large scale investments. The coe�cients are however robust to the
exclusion of these variables.
Commodity speci�c dummies account for signi�cant di�erences across schemes. These con�ate
a large number of important attributes that deserve closer attention. For example, the degree to
which social contact plays a role in farmer identi�ciation, the di�erences in the nature of contract
and what the �rm brings to the relationship and di�erent market structures associated with both
the industry and the speci�c alternate markets available to the farmer, etc. 31 For these reasons, the
results of the regression have limited interpretative value in terms of understanding the heterogeneity
of contract farming arrangements. Similar regression models are run separately for the di�erent
contract commodities and are presented separately.
Table 7 presents summary statistics and regressions are run for the two phases separately owing to
a di�erence in the variables available. The standard errors are clustered at the village level for Phase
1.Table 8 presents results separately for Phase 1 and Phase 2. In both models, some combination of
attributes representing farmer perceptions emerge statistically signi�cant in explaining the variation
in contracting status. Notably the combined risk score is statistically signi�cant, so that higher the
net risk the farmer perceives he or she is taking on with contracting, the lower the probability that
the farmer currently contracts.
31 For both papaya and poultry, the identi�cation of farmers is primarily through social networks and contacts; 57%of papaya contract farmers and 95% of broiler growers entered into contracts based on preexisting social relationshipswith the �rm's employees. For marigold and gherkins, the �rms tend to identify a small region and then canvass inthe villages within that region for farmers who might be willing to contract. Only 8% of all gherkins contract farmersand about 12% of marigold contract farmers were selected based on social networks.
42

This is borne out strongly by regressions run separately for the di�erent contracting schemes
(Appendix Tables 9 to 14). These a�rm that farmers care about entire distributions and certainly
of higher order moments and not just mean and variance and that these matter in a relative sense
depending on the speci�c alternatives to contracting with the subject �rm that are available to the
farmer. Farmer perceptions of the risk attenuating and exacerbating factors are also associated with
contracting status, underscoring the importance of not treating farmer decisions as coming from an
expected utility framwork.
The following are tables that present results from commodity speci�c regression models of con-
tracting status on a set of explanatory variables including farmer risk perceptions, farmer and farm
characteristics, etc. These are meant as robustness checks for the statistical signi�cance of the rela-
tive moments of subjective net returns distributions and the combined risk score after controlling for
other relevant characteristics. All regressions are run for a commodity speci�c sample and regress
contract participation with reference to the subject �rm, conditioned on the subject �rm contracting
in the given block.
43

Table7:Summary
StatisticsofDependentandExplanatory
Variables
Phase1(N
=348)
Phase2(N
=474)
ExplanatoryVariable
Meanor
Proportion
Std.Dev.
Min
Max
Meanor
Proportion
Std.Dev.
Min
Max
(D)Contractingstatus(1=CurrentlycontractingwithSubject
�rm
,0=NotcurrentlycontractingwithSubject�rm
)51.9%
NA
01
28.74%
NA
01
Landowned(acres)
3.9
4.3
037.8
5.7
8.3
0106
Landleased(acres)
0.2
1.3
014
0.4
3.8
080
Percentageofoperatedlandirrigated
52.0
36.1
0100
76.7
30.3
0100
(D)Rainfedfarm
67.93%
01
94.54%
01
Age(years)
42.9
12.0
18
83
44.9
11.1
22
80
Household
size
5.1
1.7
112
4.4
1.5
212
Distancefrom
nearestsurfacedroad(kms)
1.23
1.65
018
1.39
4.64
050
Distancefrom
thenearestwholesalemarket(kms)
7.43
9.6
075
1.65
16.53
0150
Debt(Rs.`000)
42.8
78.3
0700
98.98
179.94
02000
Percentageoffoodpurchasedin
thepast365days
58.4
26.4
0100
88.2
15.7
0100
SunkCost(Rs.`000)
0.40
2.15
030
16.88
38.34
0275
(D)Familybelongsto
thebottom40%ofhouseholdsinthevillage30.75%
NA
01
31.22%
NA
01
(D)PipedWater
46.09%
NA
--
--
01
Livestock
(Cowsandbu�aloes)
1.9
2.4
030
--
--
Livestock
(Goats)
0.9
2.8
040
--
--
(D)HeatsourceisLPG
55.27%
NA
--
--
01
(D)Electricityforlight
92.36%
--
--
-0
1(D
)ScheduledCastesandTribes(SC/STs)
19.83%
NA
01
4.64%
NA
01
(D)OtherBackward
Castes
79.6%
NA
01
93.88%
NA
01
(D)Themosteducatedmem
ber
ofthefamilyisilliterate
2.87%
NA
01
6.75%
NA
01
(D)Farm
erhaspost-secondary
education
2.59%
NA
01
8.65%
NA
01
Riskaversionto
openmarketprices
--
--
3.3
2.3
013
CombinedRiskScore
42.1
100
-195
400
-184
248
-1297
455
Ratioofcoe�cientofvariation
1.3
1.3
0.1
11.8
0.2
0.1
01
Ratioofmeanreturns
1.7
3.2
0.01
50
1.6
2.8
027
Di�erencein
skewness
-0.1
1.0
-4.9
2.7
0.1
0.8
-33
Ratioofkurtosis
1.1
0.5
0.1
5.2
1.0
0.3
04
(D)FOSD
35.63%
NA
01
26.7%
NA
01
(D)SOSD
40.23%
NA
01
29.54%
NA
01
RiskAversionCoe�
cient
0.2
0.0
0.08
0.24
0.2
0.0
00
(D)AmbiguityAversion
--
--
56.54%
NA
01
(D)Gherkins
--
--
24.47%
NA
01
(D)Marigold
--
--
25.53%
NA
01
(D)Broiler
--
--
29.11%
NA
01
(D)Cotton
43.20%
NA
01
--
-Numberofmarigold
contracthamlets
--
--
46
016
Numberofgherkinscontracthamlets
89
022
612
033
Numberofbroilercontracthamlets
--
--
36
020
Numberofpapayacontract
hamlets
--
--
12
07
Numberofcottoncontracthamlets
35
011
--
-
Signi�cancelevels
:∗:10%
∗∗:5%
∗∗
∗:1%
1AMErefersto
AverageMarginalE�ects.
2(D
)refersto
dummyvariablesthatequal1ifthedescriptionisvalidand0otherwise.
3Fordetailsoncomputationofcombinedrisk
scoresseetextin
thepaper.
4FOSDisadummyvariablethatequals1ifthesubjectivenetreturnsfrom
contracting�rstorderstochasticallydominatesnotcontracting;SOSDisadummyvariablethat
equals1ifthesubjectivenetreturnsfrom
contractingsecondorderstochasticallydominatesnotcontracting.
4Riskaversionto
openmarketpricesdenotesthecoe�cientofrisk
aversioncomputedfrom
thebid
oraskingpriceofrisk
elicitedin
thesurveymultipliedbythecoe�cient
ofvariationofthealternative/spotmarketpriceofthecontractcommodityin
question.
5Thedummyonwhetherornotthehousehold
belongto
thebottom
quintileisaninvestigator-recordedperceptionofrelativestatusofthehousehold
inthehamletsurveyed.
44

Table 8: Farmer Perceptions and Contracting Status : Regression Results with Comodity FixedE�ects
Phase 2 Phase 1
Explanatory Variable Z-statistic Z-statistic
Land owned (acres) 1.10 -2.21 ∗∗
Land leased (acres) 1.19 -0.7
Percentage of operated land irrigated 0.13 1.36
(D) Rainfed farm 0.76 -0.46
Age (years) -2.35 ∗∗ -1.7 ∗
Household size 0.69 -1.48
Distance from nearest surfaced road (kms) 1.41 1.15
Distance from the nearest wholesale market (kms) 1.52 2.65 ∗∗∗
Debt (`000 Rs.) 1.64 ∗ 0.68
Percentage of food purchased in the past 365 days 1.30 -0.85
Sunk Cost (Rs. `00,000) 4.89 ∗∗∗ 0.29
(D) Family belongs to the bottom 40% of households in the village -2.30 ∗∗ -1.36
(D) Piped Water -1.51 -
Livestock (Cows and bu�aloes) - -1.78 ∗
Livestock (Goats) - 0.32
(D) Heat source is LPG -1.02 -
(D) Electricity for light -0.11 -
(D) Scheduled Castes and Tribes (SC/STs) 2.54 ∗∗ 11.75 ∗∗∗
(D) Other Backward Castes 0.09 12.04 ∗∗∗
The most educated member of the family is illiterate 0.43 0.11
Farmer has post-secondary education -1.61 ∗∗ -1.24
Risk aversion to open market prices -2.23 ∗∗ -
Combined Risk Score -1.84 ∗ -3.54 ∗∗∗
Ratio of coe�cient of variation 0.14 -0.07
Ratio of mean returns 0.98 0.6
Di�erence in skewness -0.95 0.58
Ratio of kurtosis -1.74 ∗ 0.52
(D) FOSD -1.08 1.14
(D) SOSD 0.04 -0.78
Risk Aversion Coe�cient 1.52 -0.61
(D) Ambiguity Aversion 1.18 -
(D) Gherkins -2.25 ∗∗ -
(D) Marigold -0.37 -
(D) Broiler -4.20 ∗∗∗ -
(D) Cotton - 2.02 ∗∗
Number of marigold contract hamlets -0.67 -
Number of gherkins contract hamlets -2.25 ∗∗ 0.09
Number of broiler contract hamlets -1.2 -
Number of papaya contract hamlets 0 -
Number of cotton contract hamlets - 1.19
Constant 0.63 -4.33 ∗∗∗
Log pseudolikelihood -210 -163.73
N 419 307
Proportion of observations classi�ed correctly 74.23% 72.64%
Likelihood Ratio χ232 = 156.6 χ2
29 = 60.05
p-value 0.00 ∗∗∗ 0.00 ∗∗∗
Wald Statistic χ229 = 444.20 χ2
36 = 1095.54
p-value 0.00 ∗∗∗ 0.00 ∗∗∗
Pseudo R2 0.155 0.2769
Clusters 54 5
Signi�cance levels : ∗ : 10% ∗∗ : 5% ∗ ∗ ∗ : 1%
1 Models are run separately for Phase 1 and 2. Not all variables were collected for both phases, explaining the blanks inthe table.
2 (D) refers to dummy variables that equal 1 if the description is valid and 0 otherwise.3 For details on computation of combined risk scores see text in the paper.4 FOSD is a dummy variable that equals 1 if the subjective net returns from contracting �rst order stochastically dominatesnot contracting; SOSD is a dummy variable that equals 1 if the subjective net returns from contracting second orderstochastically dominates not contracting.
4 Risk aversion to open market prices denotes the coe�cient of risk aversion computed from the bid or asking price ofrisk elicited in the survey multiplied by the coe�cient of variation of the alternative /spot market price of the contractcommodity in question.
5 The dummy on whether or not the household belong to the bottom quintile is an investigator-recorded perception ofrelative status of the household in the hamlet surveyed.
6 The total numer of observations re�ects those for which data was complete.
45
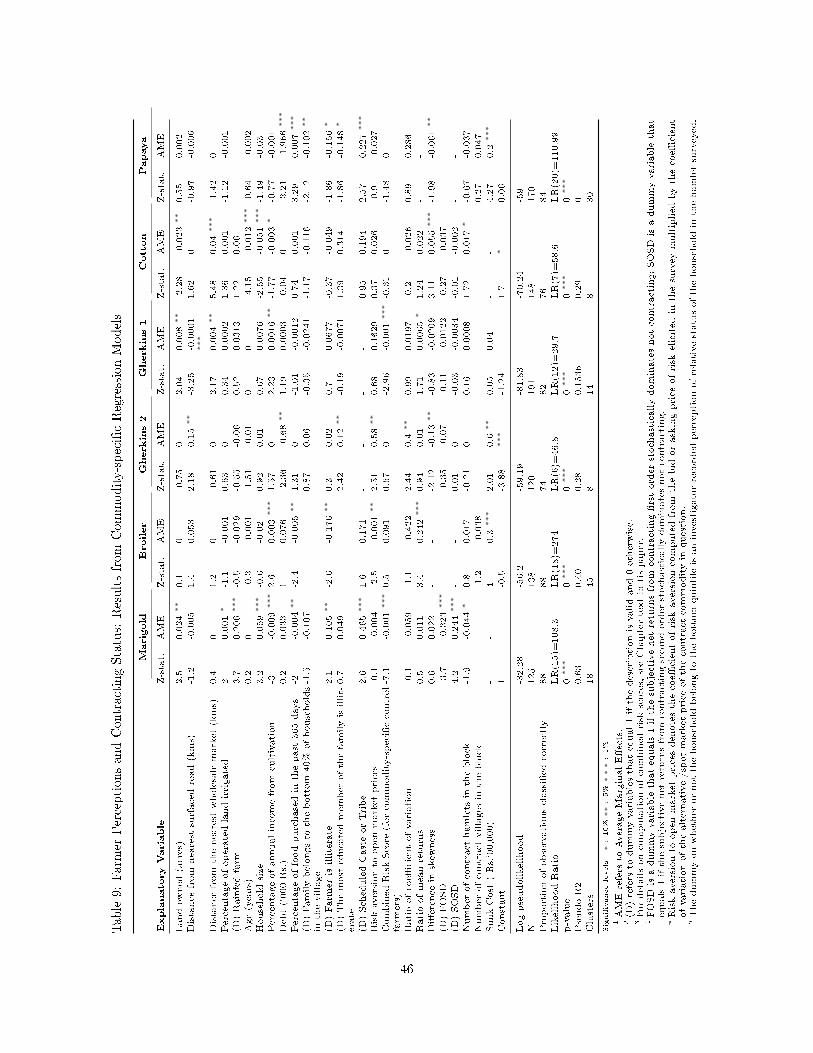
Table9:Farm
erPerceptionsandContractingStatus:Resultsfrom
Commodity-speci�cRegressionModels
Marigold
Broiler
Gherkins2
Gherkins1
Cotton
Papaya
ExplanatoryVariable
Z-stat.
AME
Z-stat.
AME
Z-stat.
AME
Z-stat.
AME
Z-stat.
AME
Z-stat.
AME
Landowned(acres)
2.5
0.024
∗∗
0.1
0-0.75
02.04
0.008
∗∗
-2.28
-0.023
∗∗
0.55
0.002
Distancefrom
nearestsurfacedroad(kms)
-1.2
-0.005
1.4
0.053
2.18
0.15
∗∗
-3.25
-0.0001
∗∗∗
1.62
0-0.97
-0.006
Distancefrom
thenearestwholesalemarket(kms)
0.4
01.2
0-0.61
02.17
0.004
∗∗
5.48
0.04
∗∗∗
-1.42
0Percentageofoperatedlandirrigated
20.001
∗-1.1
-0.001
0.63
00.34
0.0002
1.36
0.001
-1.12
-0.001
(D)Rainfedfarm
3.7
0.206
∗∗∗
-0.5
-0.029
-0.55
-0.06
0.52
0.0313
1.22
0.06
Age(years)
0.2
0-0.3
-0.001
-1.51
-0.01
00
-4.15
-0.012
∗∗∗-0.64
-0.002
Household
size
3.2
0.059
∗∗∗
-0.6
-0.02
0.92
0.01
0.67
0.0076
-2.55
-0.051
∗∗∗-1.49
-0.03
Percentageofannualincomefrom
cultivation
-3-0.009
∗∗∗2.6
0.003
∗∗∗
1.57
02.23
0.0016
∗∗
-1.77
-0.003
∗-0.77
-0.001
Debt(`000Rs.)
0.2
0.033
10.076
-2.36
-0.68
∗∗
1.19
0.0003
-0.04
0-3.21
-1.966
∗∗∗
Percentageoffoodpurchasedin
thepast365days
-2-0.004
∗∗
-2.4
-0.005
∗∗
1.31
0-1.01
-0.0012
0.74
0.001
3.29
0.007
∗∗∗
(D)Familybelongsto
thebottom
40%
ofhouseholds
inthevillage
-1.5
-0.107
0.87
0.06
-0.35
-0.0241
-1.17
-0.116
-2.12
-0.102
∗∗
(D)Farm
erisilliterate
2.1
0.105
∗∗
-2.6
-0.176
∗∗
0.3
0.02
0.7
0.0677
-0.37
-0.049
-1.86
-0.156
∗
(D)Themosteducatedmemberofthefamilyisillit-
erate
0.7
0.049
2.42
0.12
∗∗
-0.19
-0.0071
1.39
0.314
-1.86
-0.148
∗
(D)ScheduledCasteorTribe
2.6
0.465
∗∗∗
1.6
0.171
--
--
0.95
0.194
2.57
0.227
∗∗∗
Riskaversionto
openmarketprices
-0.1
-0.004
-2.5
-0.001
∗∗
2.51
0.58
∗∗
0.68
0.1629
0.37
0.026
-0.9
-0.027
CombinedRiskScore
(forcommodity-speci�ccontrol
farm
ers)
-7.1
-0.001
∗∗∗0.5
0.091
0.67
0-2.96
-0.001
∗∗∗-0.31
0-1.48
0
Ratioofcoe�cientofvariation
-0.1
-0.059
-1.1
-0.422
2.44
0.4
∗∗
0.99
0.0197
-0.2
-0.026
0.89
0.286
Ratioofmeanreturns
0.5
0.011
3.4
0.242
∗∗∗
0.94
0.01
1.71
0.0065
∗1.24
0.022
--
Di�erencein
skewness
0.6
0.022
--
-2.12
-0.13
∗∗
-0.83
-0.0209
3.11
0.055
∗∗∗
-1.98
-0.061
∗∗
(D)FOSD
-3.7
-0.323
∗∗∗-
--0.35
-0.07
-0.11
-0.0122
-0.27
-0.037
--
(D)SOSD
4.2
0.244
∗∗∗
--
0.01
0-0.03
-0.0034
-0.01
-0.002
--
Numberofcontracthamletsin
theblock
-1.9
-0.044
∗0.8
0.017
-0.21
00.16
0.0008
1.72
0.017
∗-0.67
-0.037
Numberofcontractvillagesin
theblock
--
-1.2
-0.038
--
--
--
0.27
0.047
SunkCost(Rs.`00,000)
--
40.3
∗∗∗
2.01
0.6
∗∗
0.05
0.04
--
4.27
0.2
∗∗∗
Constant
1-0.5
-3.88
∗∗∗
-1.24
1.7
∗0.06
Logpseudolikelihood
-32.28
-56.2
-59.19
-81.83
-70.24
-59
N125
138
120
191
148
170
Proportionofobservationsclassi�edcorrectly
88
88
74
82
76
84
LikelihoodRatio
LR(15)=
108.3
LR(18)=
274
LR(6)=
46.8
LR(12)=
29.7
LR(7)=
58.6
LR(20)=
110.99
p-value
0∗∗∗
0∗∗∗
0∗∗∗
0∗∗∗
0∗∗∗
0∗∗∗
PseudoR2
0.63
0.40
0.28
0.1536
0.29
0Clusters
18
45
814
830
Signi�cancelevels
:∗:10%
∗∗:5%
∗∗
∗:1%
1AMErefersto
AverageMarginalE�ects.
2(D
)refersto
dummyvariablesthatequal1ifthedescriptionisvalidand0otherwise.
3Fordetailsoncomputationofcombinedrisk
scores,seeChaptertextin
tispaper.
4FOSDisadummyvariablethatequals1ifthesubjectivenetreturnsfrom
contracting�rstorderstochasticallydominatesnotcontracting;SOSDisadummyvariablethat
equals1ifthesubjectivenetreturnsfrom
contractingsecondorderstochasticallydominatesnotcontracting.
4Riskaversionto
openmarketpricesdenotesthecoe�cientofrisk
aversioncomputedfrom
thebid
oraskingpriceofrisk
elicitedin
thesurveymultipliedbythecoe�cient
ofvariationofthealternative/spotmarketpriceofthecontractcommodityin
question.
5Thedummyonwhetherornotthehousehold
belongto
thebottom
quintileisaninvestigator-recordedperceptionofrelativestatusofthehousehold
inthehamletsurveyed.
46

Table10:Summary
StatisticsforFarm
erSelection:M
arigold
Farmersexcl.SubjectContractFarmers(n=62)
SubjectContractfarmers(n=59)
Mean
or
Propor-
tion
Standard
Deviation
Minim
um
Maxim
um
Mean
or
Propor-
tion
Standard
Deviation
Minim
um
Maxim
um
Explanatoryvariable
Landowned(acres)
4.4
2.3
115
5.2
3.8
125
Distancefrom
thenearestwholesalemarket
4.1
11.8
0.1
50
1.6
1.8
010
Distancefrom
thenearestwholesalemarket(kms.)
21.81
15.67
060
28
21
180
Percentageofoperatedlandirrigated(%
)79.8
35.8
0100
90.2
23.2
0100
(D)Farm
erswhose
main
sourceofirrigationisrain
(%)
65.0
N.A
01
53
N.A.
01
Age(years)
42.1
9.5
23
70
45.3
12.3
25
80
Household
size
4.1
1.1
210
4.4
1.8
212
Percentageofannualincomefrom
cultivation(%
)100.0
0.0
100
100
97
8.7
50
100
Debt(Rs.)
0.2
0.1
00.7
0.2
0.3
02
Percentageoffoodpurchased(%
)78.5
8.6
60
100
78.1
13.6
095
(D)Familybelongsto
thebotton40%
ofhouseholdsin
thevillage(%
)52
N.A
01
44
N.A.
01
(D)Farm
erisilliterate
(%)
29.0
N.A
01
44
N.A.
01
(D)Themost
educatedmemberofthefamilyhascompletedprimary
school(%
)27.0
N.A
01
46
N.A.
01
(D)Themosteducatedmemberofthefamilyisilliterate
(%)
2.0
N.A
00
0N.A.
00
(D)ScheduledCasteorTribe(%
)2.0
N.A
01
27
N.A.
01
Riskaversionto
openmarketprices
6.7
0.9
58
6.4
1.3
213
Combinedrisk
score
forcommodity-speci�ccontrolfarm
ers
-393.4
126.9
-668
-72
-601.7
169.1
-1297
0
Ratioofmeanreturnsfrom
contractingovernextbestalternative
1.2
1.4
07
0.8
0.7
03
Ratioofcoe�cientofvariationin
returnsfrom
contractingandnextbest
alternative
0.2
0.1
00
0.2
0.1
01
Di�erencein
Skewnessin
returnsfrom
contractingandnextbestalterna-
tive
0.3
1.0
-33
0.3
1-2
3
(D)Contracting�rstorderstochasticdominatesnextbestalternative(%
)23
N.A
14
N.A.
01
(D)Contractingsecondorderstochasticdominatesnextbest
alternative
(%)
25
N.A
19
N.A.
01
Thenumberofvillagesin
theblock
the�rm
contractsin
3.2
1.3
05
4.3
13
5
Thenumberofhamletssample�rm
procuresfrom
intheblock
13.1
5.0
016
12
2.9
10
16
SunkCost(Rs.)
0.0
0.0
00
719
5402
041500
1(D
)refersto
binary
variablesthattakethevalueof0or1.Thepercentageofresponsesare
reportedforthese
insteadofthemean.N.A.meansNotApplicable.
2SubjectContractfarm
ers
referto
those
whocontractwiththesubject�rm
foraparticularcommodity.AllFarm
ers
excludingSubjectContractFarm
ers
referto
those
who
wereselectedfromamongthose
whodonotcontractwiththeSubject�rm
andincludefarm
erswhocontractthesamecommoditywithanother,growthecontractcommodity
fortheopenmarket,haveceasedcontractingwiththesubject�rm
andthose
whonevercontractedwiththesubject�rm
.
47

Table11:Summary
StatisticsforFarm
erSelection:Broiler
Farmersexcl.SubjectContractFarmers(n=77)
SubjectContractfarmers(n=61)
Mean
or
Propor-
tion
Standard
Deviation
Minim
um
Maxim
um
Mean
or
Propor-
tion
Standard
Deviation
Minim
um
Maxim
um
Explanatoryvariable
Landowned(acres)
11.5
16.4
0106
7.4
6.8
045
Distancefrom
nearestsurfacedroad(m
eters)
0.1
0.4
03
0.3
0.8
05
Distancefrom
thenearestwholesalemarket(kms.)
17.20
17.69
2.5
150
20.2
20.6
3150
Percentageofoperatedlandirrigated(%
)77.9
29.6
0100
56.4
32.6
0100
(D)Farm
erswhose
main
sourceofirrigationisrain
(%)
0N.A
01
38
N.A.
01
Age(years)
50.8
10.5
31
75
46.4
11.7
29
75
Household
size
3.6
0.8
27
3.6
0.8
25
Percentageofannualincomefrom
cultivation(%
)88.0
21.3
50
100
93.4
17
25
100
Debt(Rs.)
0.1
0.1
00.6
0.2
0.3
02
Percentageoffoodpurchased(%
)100.0
0.0
100
100
98
10.9
30
100
(D)Familybelongsto
thebotton40%
ofhouseholdsin
thevillage(%
)0
N.A
00
0N.A.
00
(D)Farm
erisilliterate
(%)
18
N.A
01
3N.A.
01
(D)Themost
educatedmemberofthefamilyhascompletedprimary
school(%
)50
N.A
01
49
N.A.
01
(D)Themosteducatedmember
ofthefamilyisilliterate
(%)
0N.A
00
0N.A.
00
(D)ScheduledCasteorTribe(%
)0
N.A
00
2N.A.
01
Riskaversionto
openmarketprices
1.7
0.3
0.7
2.0
1.6
0.4
02
Combinedrisk
score
forcommodity-speci�ccontrolfarm
ers
-71.6
131.1
-379
175
-193.7
78.4
-367.5
-23
Ratioofmeanreturnsfrom
contractingovernextbestalternative
0.3
0.2
00.8
0.2
0.2
00.5
Ratioofcoe�cientofvariationin
returnsfrom
contractingandnextbest
alternative
0.1
0.1
00.4
0.1
0.1
00.3
Di�erencein
Skewnessin
returnsfrom
contractingandnextbestalterna-
tive
-0.1
0.3
-1.3
0.7
0.1
0.3
-0.5
1
Thenumberofvillagesin
theblock
the�rm
contractsin
6.3
3.4
012
6.9
3.9
012
Thenumberofhamletssample�rm
procuresfrom
intheblock
9.6
5.4
020
10.5
6.1
020
SunkCost(Rs.)
22184.7
42207.8
0160800
82700
39411
25500
211580
1(D
)refersto
binary
variablesthattakethevalueof0or1.Thepercentageofresponsesare
reportedforthese
insteadofthemean.N.A.meansNotApplicable.
2SubjectContractfarm
ers
referto
those
whocontractwiththesubject�rm
foraparticularcommodity.AllFarm
ers
excludingSubjectContractFarm
ers
referto
those
who
wereselectedfromamongthose
whodonotcontractwiththeSubject�rm
andincludefarm
erswhocontractthesamecommoditywithanother,growthecontractcommodity
fortheopenmarket,haveceasedcontractingwiththesubject�rm
andthose
whonevercontractedwiththesubject�rm
.
48

Table12:Summary
StatisticsforFarm
erSelection:GherkinsPhase
2
Farmersexcl.SubjectContractFarmers(n=62)SubjectContractfarmers(n=54)
Mean
or
Propor-
tion
Standard
Deviation
Minim
um
Maxim
um
Mean
or
Propor-
tion
Standard
Deviation
Minim
um
Maxim
um
Explanatoryvariable
Landowned(acres)
2.3
1.8
0.3
7.5
2.4
5.4
040
Distancefrom
thenearestwholesalemarket
0.3
0.3
0.02
1.5
0.4
0.6
03
Distancefrom
thenearestwholesalemarket(kms.)
12.3
14.9
060
12.4
7.9
040
Percentageofoperatedlandirrigated(%
)64.3
29.5
0100
74.1
28.6
17
100
(D)Farm
erswhose
main
sourceofirrigationisrain
(%)
100
N.A.
01
98
N.A.
01
Age(years)
43.6
10.9
27
79
37.4
8.9
22
70
Household
size
5.4
1.6
210
5.5
1.9
312
Percentageofannualincomefrom
cultivation(%
)73.1
28.9
0100
79.1
20.9
20
100
Debt(Rs.)
0.1
0.1
00.6
00
00
Percentageoffoodpurchased(%
)76.4
17.7
40
100
83.7
17.4
30
100
(D)Familybelongsto
thebotton40%ofhouseholdsin
thevillage(%
)48.4
N.A.
01
57
N.A.
01
(D)Farm
erisilliterate
(%)
22.6
N.A.
01
20
N.A.
01
(D)Themosteducatedmemberofthefamilyhascompletedprimary
school(%
)33.9
N.A.
01
30
N.A.
01
(D)Themosteducatedmemberofthefamilyisilliterate
(%)
0.0
N.A.
00
0N.A.
00
ScheduledCasteorTribe(%
)0.0
0.0
00
00
00
Riskaversionto
openmarketprices
1.3
0.1
1.1
1.5
1.3
0.1
11
Combinedrisk
score
forcommodity-speci�ccontrolfarm
ers
5.6
141.1
-325
337.5
-5.6
182
-400
350
Ratioofmeanreturnsfrom
contractingovernextbestalternative
3.0
3.8
0.35
26.7
3.4
5.2
025
Ratioofcoe�cientofvariationin
returnsfrom
contractingandnext
bestalternative
0.3
0.1
0.1
0.7
0.3
0.2
01
Di�erencein
Skewness
inreturnsfrom
contractingandnextbest
al-
ternative
0.1
0.6
-1.7
1.7
-0.1
0.6
-12
(D)Contracting�rstorderstochasticdominatesnextbestalternative
(%)
61.3
N.A.
01
56
N.A.
01
(D)Contractingsecondorderstochasticdominatesnextbestalterna-
tive(%
)66.1
N.A.
01
59
N.A.
01
Thenumberofvillagesin
theblock
the�rm
contractsin
8.6
3.8
211
7.9
42
11
Thenumberofhamletssample�rm
procuresfrom
intheblock
25.2
12.4
633
22.5
13.3
633
SunkCost(Rs.)2354.8
7292.7
028000
10685
38757
0275000
1(D
)refersto
binary
variablesthattakethevalueof0or1.Thepercentageofresponsesare
reportedforthese
insteadofthemean.N.A.meansNotApplicable.
2SubjectContractfarm
ers
referto
those
whocontractwiththesubject�rm
foraparticularcommodity.AllFarm
ers
excludingSubjectContractFarm
ers
referto
those
who
wereselectedfromamongthose
whodonotcontractwiththeSubject�rm
andincludefarm
erswhocontractthesamecommoditywithanother,growthecontractcommodity
fortheopenmarket,haveceasedcontractingwiththesubject�rm
andthose
whonevercontractedwiththesubject�rm
.
49

Table13:Summary
StatisticsforFarm
erSelection:GherkinsPhase
1
Farmersexcl.SubjectContractFarmers(n=158)
SubjectContractfarmers(n=40)
Mean
or
Propor-
tion
Standard
Deviation
Minim
um
Maxim
um
Mean
or
Propor-
tion
Standard
Deviation
Minim
um
Maxim
um
Explanatoryvariable
Landowned(acres)
2.4
3.2
037.8
2.5
2.1
010
Distancefrom
nearestsurfacedroad(m
eters)
1073.0
1536.6
016000
775
735.1
20
3000
Distancefrom
thenearestwholesalemarket(kms.)
9.36
10.43
075
14.3
14.8
060
Percentageofoperatedlandirrigated(%
)52.5
33.9
0100
57.3
40.6
0100
(D)Farm
erswhose
main
sourceofirrigationisrain
(%)
95.0
N.A
01
93
N.A
01
Age(years)
39.6
12.5
183
40.2
11.9
18
60
Household
size
5.4
1.7
110
5.4
1.6
311
Percentageofannualincomefrom
cultivation(%
)64.7
28.9
5100
70.3
27.2
10
100
Debt(Rs.)
40.5
77.8
0700
55.3
80.7
0400
Percentageoffoodpurchased(%
)54.3
27.0
0100
51.7
30.4
0100
(D)Familybelongsto
thebotton40%
ofhouseholdsin
thevillage(%
)44.0
N.A
01
38
N.A
01
(D)Farm
erisilliterate
(%)
15.0
N.A
01
18
N.A
01
(D)Themost
educatedmemberofthefamilyhascompletedprimary
school(%
)44.0
N.A
01
40
N.A
01
(D)Themosteducatedmember
ofthefamilyisilliterate
(%)
0.0
N.A
00
0N.A
00
(D)ScheduledCasteorTribe(%
)31.0
N.A
01
28
N.A
01
Riskaversionto
openmarketprices
1.2
0.1
12
1.2
0.1
11
Combinedrisk
score
forcommodity-speci�ccontrolfarm
ers
55.5
99.8
-150
375
-0.4
103.7
-195
289
Ratioofmeanreturnsfrom
contractingovernextbestalternative
1.7
4.2
050
2.1
1.4
06
Ratioofcoe�cientofvariationin
returnsfrom
contractingandnextbest
alternative
1.1
1.1
09
1.5
0.9
05
Di�erencein
Skewnessin
returnsfrom
contractingandnextbestalterna-
tive
0.0
0.8
-42
00.9
-32
(D)Contracting�rstorderstochasticdominatesnextbestalternative(%
)48.0
N.A
01
35
N.A
01
(D)Contractingsecondorderstochasticdominatesnextbest
alternative
(%)
48.0
N.A
045
N.A
01
Thenumberofvillagesin
theblock
the�rm
contractsin
4.8
3.0
11
5.1
2.9
18
Thenumberofhamletssample�rm
procuresfrom
intheblock
13.3
8.2
222
14.1
7.9
222
SunkCost(Rs.)
512.7
3030.1
030000
640
1303
05000
1(D
)refersto
binary
variablesthattakethevalueof0or1.Thepercentageofresponsesare
reportedforthese
insteadofthemean.N.A.meansNotApplicable.
2SubjectContractfarm
ers
referto
those
whocontractwiththesubject�rm
foraparticularcommodity.AllFarm
ers
excludingSubjectContractFarm
ers
referto
those
who
wereselectedfromamongthose
whodonotcontractwiththeSubject�rm
andincludefarm
erswhocontractthesamecommoditywithanother,growthecontractcommodity
fortheopenmarket,haveceasedcontractingwiththesubject�rm
andthose
whonevercontractedwiththesubject�rm
.
50

Table14:Summary
StatisticsforFarm
erSelection:Cotton
Farmersexcl.SubjectContractFarmers(n=90)
SubjectContractfarmers(n=60)
Mean
or
Propor-
tion
Standard
Deviation
Minim
um
Maxim
um
Mean
or
Propor-
tion
Standard
Deviation
Minim
um
Maxim
um
Explanatoryvariable
Landowned(acres)
6.8
5.9
030
4.5
2.4
012
Distancefrom
nearestsurfacedroad(m
eters)
1304.5
1175.5
1.5
6000
1843.8
2602.2
55
18000
Distancefrom
thenearestwholesalemarket(kms.)
3.04
2.73
112
4.3
3.2
0.2
12
Percentageofoperatedlandirrigated(%
)47.8
39.5
0100
53.6
33.2
0100
(D)Farm
erswhose
main
sourceofirrigationisrain
(%)
94
N.A
01
95
N.A
01
Age(years)
49.2
10.2
19
72
43.9
9.1
25
70
Household
size
4.9
1.9
212
4.2
1.2
28
Percentageofannualincomefrom
cultivation(%
)72.9
33.6
5100
62
35.7
10
100
Debt(Rs.)
45.4
86.1
0500
37
65.4
0300
Percentageoffoodpurchased(%
)64.3
23.1
5100
64.9
24.3
0100
(D)Familybelongsto
thebotton40%
ofhouseholdsin
thevillage(%
)17
N.A
01
12
N.A
01
(D)Farm
erisilliterate
(%)
17
N.A
01
8N.A
01
(D)Themost
educatedmemberofthefamilyhascompletedprimary
school(%
)49
N.A
01
57
N.A
01
(D)Themosteducatedmember
ofthefamilyisilliterate
(%)
0N.A
01
0N.A
00
(D)ScheduledCasteorTribe(%
)3
N.A
01
10
N.A
01
Riskaversionto
openmarketprices
3.2
0.5
14
3.2
0.4
14
Combinedrisk
score
forcommodity-speci�ccontrolfarm
ers
46.5
101.8
-150
309
28.2
84.7
-130
400
Ratioofmeanreturnsfrom
contractingovernextbestalternative
1.1
1.6
013
1.4
1.6
08
Ratioofcoe�cientofvariationin
returnsfrom
contractingandnextbest
alternative
0.2
0.3
02
0.2
0.2
01
Di�erencein
Skewnessin
returnsfrom
contractingandnextbestalterna-
tive
-0.2
1.1
-52
-0.1
1-3
3
(D)Contracting�rstorderstochasticdominatesnextbestalternative(%
)29.0
N.A
28
N.A
(D)Contractingsecondorderstochasticdominatesnextbest
alternative
(%)
32.0
N.A
30
N.A
Thenumberofvillagesin
theblock
the�rm
contractsin
3.1
1.0
24
3.3
12
4
Thenumberofhamletssample�rm
procuresfrom
intheblock
7.5
4.0
311
8.3
3.8
311
SunkCost(Rs.)
175
672.963
04000
303
935
05000
1(D
)refersto
binary
variablesthattakethevalueof0or1.Thepercentageofresponsesare
reportedforthese
insteadofthemean.N.A.meansNotApplicable.
2SubjectContractfarm
ers
referto
those
whocontractwiththesubject�rm
foraparticularcommodity.AllFarm
ers
excludingSubjectContractFarm
ers
referto
those
who
wereselectedfromamongthose
whodonotcontractwiththeSubject�rm
andincludefarm
erswhocontractthesamecommoditywithanother,growthecontractcommodity
fortheopenmarket,haveceasedcontractingwiththesubject�rm
andthose
whonevercontractedwiththesubject�rm
.
51
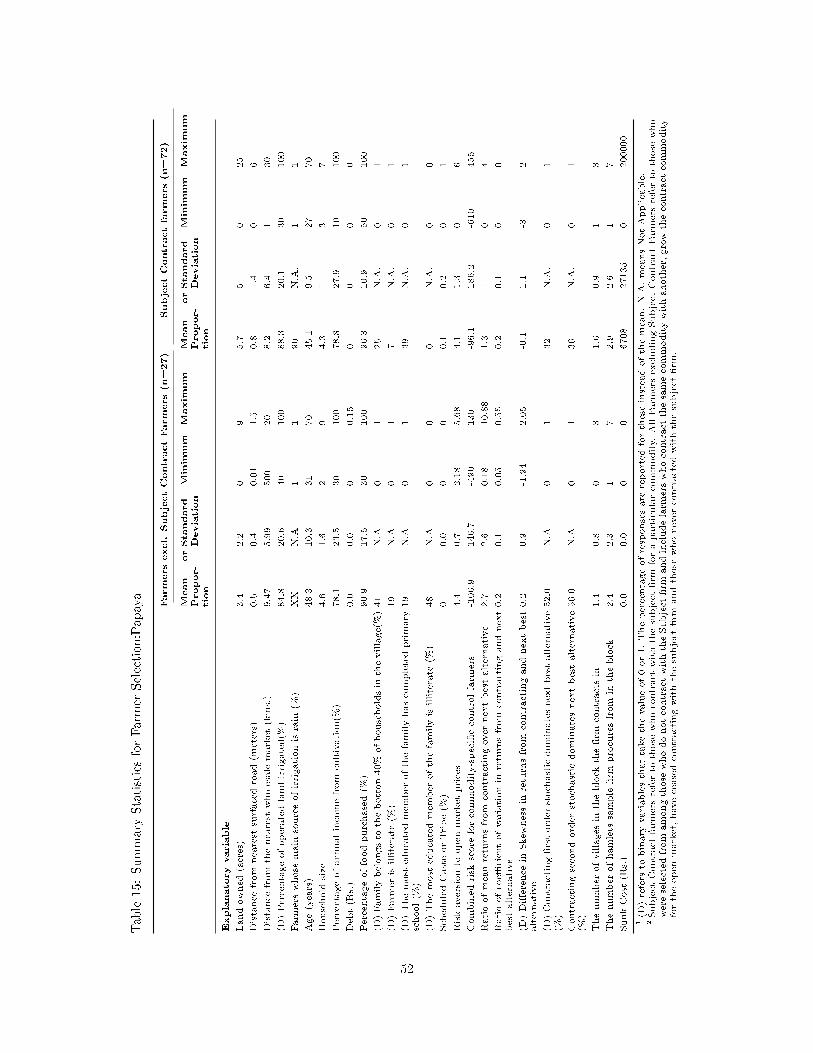
Table15:Summary
StatisticsforFarm
erSelection:Papaya
Farmersexcl.SubjectContractFarmers(n=27)
SubjectContractfarmers(n=72)
Mean
or
Propor-
tion
Standard
Deviation
Minim
um
Maxim
um
Mean
or
Propor-
tion
Standard
Deviation
Minim
um
Maxim
um
Explanatoryvariable
Landowned(acres)
3.4
2.2
09
5.7
50
25
Distancefrom
nearestsurfacedroad(m
eters)
0.5
0.4
0.01
1.5
0.8
1.4
06
Distancefrom
thenearestwholesalemarket(kms.)
9.47
5.99
500
20
8.2
6.4
130
(D)Percentageofoperatedlandirrigated(%
)84.8
20.6
40
100
88.3
20.1
30
100
Farm
erswhose
main
sourceofirrigationisrain
(%)
XX
N.A
11
90
N.A.
11
Age(years)
48.3
10.3
31
70
45.1
9.5
27
70
Household
size
4.6
1.6
29
4.3
13
7
Percentageofannualincomefrom
cultivation(%
)78.1
23.5
30
100
78.8
27.9
10
100
Debt(Rs.)
0.0
0.0
00.15
00
00
Percentageoffoodpurchased(%
)90.9
17.5
30
100
96.3
10.9
50
100
(D)Familybelongsto
thebotton40%ofhouseholdsin
thevillage(%
)41
N.A
01
25
N.A.
01
(D)Farm
erisilliterate
(%)
19
N.A
01
7N.A.
01
(D)Themosteducatedmemberofthefamilyhascompletedprimary
school(%
)19
N.A
01
39
N.A.
01
(D)Themosteducatedmemberofthefamilyisilliterate
(%)
48
N.A
00
0N.A.
00
ScheduledCasteorTribe(%
)0
0.0
00
0.1
0.2
01
Riskaversionto
openmarketprices
4.4
0.7
2.18
5.68
4.1
1.3
06
Combinedrisk
score
forcommodity-speci�ccontrolfarm
ers
-106.9
146.7
-490
130
-96.1
186.2
-610
455
Ratioofmeanreturnsfrom
contractingovernextbestalternative
2.7
2.6
0.18
10.88
1.3
10
4
Ratioofcoe�cientofvariationin
returnsfrom
contractingandnext
bestalternative
0.2
0.1
0.05
0.55
0.2
0.1
00
(D)Di�erencein
Skewnessin
returnsfrom
contractingandnextbest
alternative
0.2
0.9
-1.94
2.05
-0.1
1.1
-32
(D)Contracting�rstorderstochasticdominatesnextbestalternative
(%)
52.0
N.A
01
32
N.A.
01
Contractingsecondorderstochasticdominatesnextbest
alternative
(%)
56.0
N.A
01
36
N.A.
01
Thenumberofvillagesin
theblock
the�rm
contractsin
1.4
0.8
03
1.6
0.9
13
Thenumberofhamletssample�rm
procuresfrom
intheblock
2.4
2.3
17
2.9
2.6
17
SunkCost(Rs.)
0.0
0.0
00
6708
27135
0200000
1(D
)refersto
binary
variablesthattakethevalueof0or1.Thepercentageofresponsesare
reportedforthese
insteadofthemean.N.A.meansNotApplicable.
2SubjectContractfarm
ers
referto
those
whocontractwiththesubject�rm
foraparticularcommodity.AllFarm
ers
excludingSubjectContractFarm
ers
referto
those
who
wereselectedfromamongthose
whodonotcontractwiththeSubject�rm
andincludefarm
erswhocontractthesamecommoditywithanother,growthecontractcommodity
fortheopenmarket,haveceasedcontractingwiththesubject�rm
andthose
whonevercontractedwiththesubject�rm
.
52