Embed Size (px)
Citation preview

Final Report
Demonstration of a Novel, Integrated, Multi- Scale Procedure for High-Resolution 3D Reservoir Characterization and Improved CO2- EOR/Sequestration Management, SACROC Unit Performed by: Scott R. Reeves Advanced Resources International, Inc. 11490 Westheimer Rd., Suite 520 Houston, TX 77077 Prepared for: U.S. Department of Energy DE-FC26-04NT15514
March, 2008

FINAL SP030508
i
Disclaimers
U.S. Department of Energy This report was prepared as an account of work sponsored by an agency of the United States Government. Neither the United States Government nor any agency thereof, nor any of their employees, makes any warranty, express or implied, or assumes any legal liability or responsibility for the accuracy, completeness, or usefulness of any information, apparatus, product, or process disclosed, or represents that its use would not infringe privately owned rights. Reference herein to any specific commercial product, process, or service by trade name, trademark, manufacturer, or otherwise does not necessarily constitute or imply its endorsement, recommendation, or favoring by the United States Government or any agency thereof. The views and opinions of authors expressed herein do not necessarily state or reflect those of the United States Government or any agency thereof.
Advanced Resources International, Inc.
The material in this Report is intended for general information only. Any use of this material in relation to any specific application should be based on independent examination and verification of its unrestricted applicability for such use and on a determination of suitability for the application by professionally qualified personnel. No license under any Advanced Resources International, Inc., patents or other proprietary interest is implied by the publication of this Report. Those making use of or relying upon the material assume all risks and liability arising from such use or reliance.

FINAL SP030508
ii
Executive Summary
The primary goal of this project was to demonstrate a new and novel approach for high
resolution, 3D reservoir characterization that can enable better management of CO2 enhanced oil
recovery (EOR) projects and, looking to the future, carbon sequestration projects. The approach adopted
has been the subject of previous research by the DOE and others, and relies primarily upon data-mining
and advanced pattern recognition approaches. This approach honors all reservoir characterization data
collected, but accepts that our understanding of how these measurements relate to the information of
most interest, such as how porosity and permeability vary over a reservoir volume, is imperfect. Ideally
the data needed for such an approach includes surface seismic to provide the greatest amount of data
over the entire reservoir volume of interest, crosswell seismic to fill the resolution gap between surface
seismic and wellbore-scale measurements, geophysical well logs to provide the vertical resolution
sought, and core data to provide the tie to the information of most interest. These data are combined via
a series of one or more relational models to enable, in its most successful application, the prediction of
porosity and permeability on a vertical resolution similar to logs at each surface seismic trace location.
In this project, the procedure was applied to the giant (and highly complex) SACROC unit of the
Permian basin in West Texas, one of the world’s largest CO2-EOR projects and a potentially world-class
geologic sequestration site. Due to operational scheduling considerations on the part of the operator of
the field, the crosswell data was not obtained during the period of project performance (it is currently
being collected however as part of another DOE project). This compromised the utility of the surface
seismic data for the project due to the resolution gap between it and the geophysical well logs. An
alternative approach was adopted that utilized a relational model to predict porosity and permeability
profiles from well logs at each well location, and a 3D geostatistical variogram to generate the reservoir
characterization over the reservoir volume of interest. A reservoir simulation model was built based
upon this characterization and history-matched without making significant changes to it, thus validating
the procedure. While not the same procedure as originally planned, the procedure ultimately employed
proved successful and demonstrated that the general concepts proposed (i.e., data mining and advanced
pattern recognition methods) have the flexibility to achieve the reservoir characterization objectives
sought even with imperfect or incomplete data.

FINAL SP030508
iii
Table of Contents Disclaimers ........................................................................................................................................... i
Executive Summary ........................................................................................................................... ii
List of Tables ...................................................................................................................................... iv
List of Figures ..................................................................................................................................... v
1.0 Introduction ............................................................................................................................ 1
2.0 Description of Reservoir Characterization Procedure ....................................................... 8
3.0 Proposed Work Plan ............................................................................................................ 10
4.0 Deviations from Proposed Work Plan ................................................................................ 14
4.1 Core Wells .......................................................................................................................... 14
4.2 Crosswell Seismic Surveys and Injection Test ................................................................... 14
4.3 Deliverables ....................................................................................................................... 15
4.4 Schedule ............................................................................................................................. 16
5.0 Conclusions ........................................................................................................................... 18
Appendix A: Topical Report –Optimized Reservoir History Matching Simulation of Canyon
Formation, SACROC Unit, Permian Basin ................................................................................. A-1
Appendix B: Topical Report – Geostatistical Reservoir Characterization of the Canyon
Formation, SACROC Unit, Permian Basin ................................................................................. B-1
Appendix C: Topical Report – Predicting Porosity and Permeability for the Canyon
Formation, SACROC Unit (Kelly-Snyder Field), Using the Geologic Analysis via Maximum
Likelihood System .......................................................................................................................... C-1

FINAL SP030508
iv
List of Tables
Table 1: Case Share Associated With Three Cored Wells ............................................................................... 17

FINAL SP030508
v
List of Figures
Figure 1: U.S. CO2-EOR Production ............................................................................................................ 1
Figure 2: Location of the SACROC Unit, Permian Basin ............................................................................ 2
Figure 3: Stratigraphic Column of the Permian Basin, Canyon/Cisco Formations Noted ............................ 4
Figure 4: Top of Canyon Structure Map, SACROC Unit ............................................................................. 5
Figure 5: General Lithologic Setting of SACROC Unit ............................................................................... 6
Figure 6: SACROC Unit Production Since Discovery ................................................................................. 7
Figure 7: Pathway to 3D High-Resolution Reservoir Characterization ........................................................ 9
Figure 8: Project Schedule .......................................................................................................................... 13

.
FINAL SP030508
1
1.0 Introduction Enhanced oil recovery (EOR) via CO2 injection is a growing component of domestic oil
supply (Figure 1), and is one of the few bright spots in an otherwise precipitous decline in
national oil production. CO2-EOR is also a near-term, value-adding means to reduce carbon
emissions via geologic sequestration. For both of these reasons, more widespread application of
CO2-EOR is in the national interests of the U.S.
Figure 1: U.S. CO2-EOR Production
However, despite considerable experience with the technology (mostly in the Permian
Basin of West Texas and Southeast New Mexico), the efficiency of the process, on average, is
still low. Recovery factors on the order of 10-20% of the original oil in place (OOIP) are typical,
compared to 90%+ displacement efficiency under miscible, laboratory conditions – i.e., slim-
tube experiments. This is largely because the mobility difference between low-viscosity CO2 and
(relatively) high-viscosity reservoir oil, as well as reservoir heterogeneity, result in poor
CO
2C
O2

.
FINAL SP030508
2
volumetric sweep efficiency. One of the major challenges for improving oil recovery with CO2-
EOR, and thus facilitating its more widespread application, therefore is to reduce the amount of
oil bypassed due to the poor volumetric sweep efficiency of CO2 (or, for that matter, other
injectants such as N2 or flue gas). It is this important industry challenge that this project
addressed, by demonstrating a novel, integrated, multi-scale procedure for 3D high-resolution
reservoir characterization. This leads to a better understanding of small-scale (vertical)
heterogeneity in oil reservoirs (on the order of +/- 2 foot resolution), enabling optimized CO2
injection strategies for improved sweep efficiency and oil recovery. This procedure was
demonstrated at the Scurry Area Canyon Reef Operators Committee (SACROC) Unit CO2-EOR
project in the giant Kelly-Snyder field located on the eastern edge of the Horshoe Atoll of the
Midland Basin (Figure 2), operated by Kinder Morgan CO2 Company LP (KMCO2).
Figure 2: Location of the SACROC Unit, Permian Basin
The Kelly-Snyder field is located in Scurry County, Texas, and is the largest of many prolific
oilfields within the Horseshoe Atoll, which is in the eastern half of the greater Permian Basin.
Discovered in 1948, the field covers an area of approximately 50,000 acres with an estimated
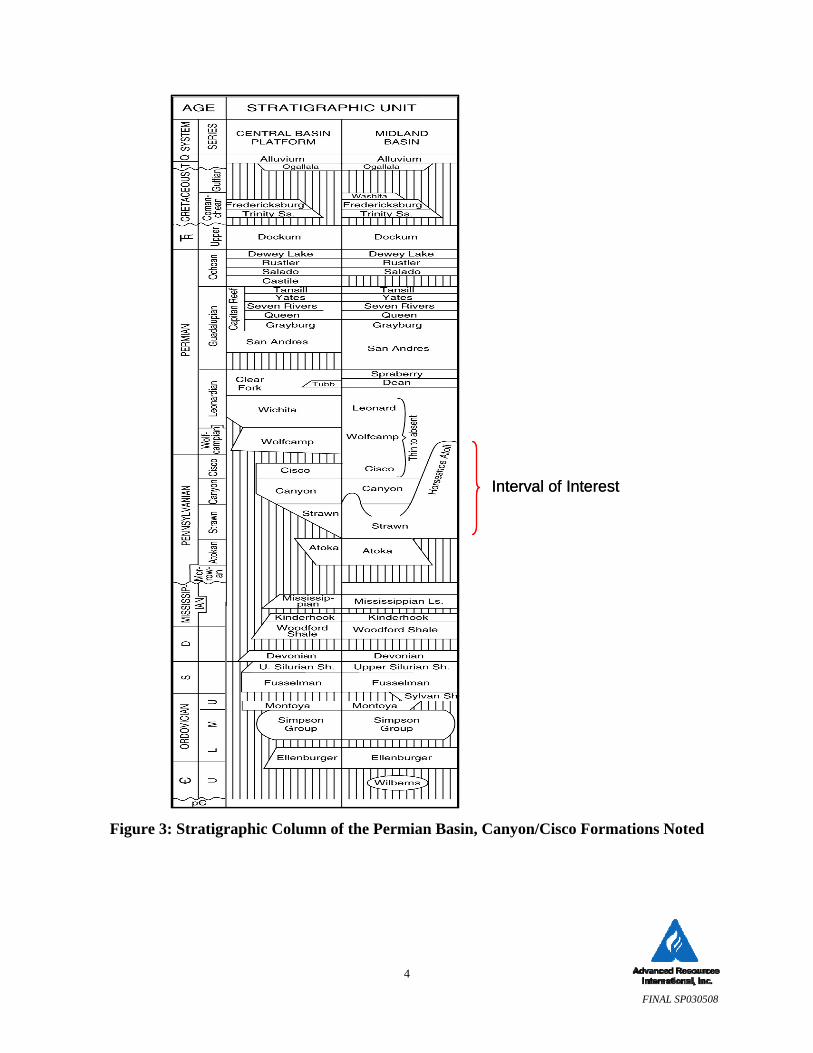
original oil in place (OOIP) of 2.8 billion barrels. It produces oil from the Pennsylvanian-aged
Canyon and Cisco formations (Figure 3). The reservoir is a north-south trending carbonate
buildup with a slight dog-leg to the west (Figure 4). The carbonate complex that makes up the
Hockley Lubbock Crosby Dickens
HowardHoward
TerryTerry LynnLynn GarzaGarza KentKent
GainesGaines
ScurryScurryDawsonDawsonBordenBorden
WellmanWellmanFieldField
WellmanWellmanFieldField
Adair FieldAdair FieldAdair FieldAdair Field
Hobo Hobo FldFld
OceanicOceanicFieldField
OceanicOceanicFieldField
VealmoorVealmoorFieldField
VealmoorVealmoorFieldField
CogdellCogdellFieldField
CogdellCogdellFieldField
S. BrownfieldS. BrownfieldFieldField
S. BrownfieldS. BrownfieldFieldField
MungervilleMungerville FldFldMungervilleMungerville FldFld
Von Roeder Von Roeder FldFld
Good Good FldFldGood Good FldFldReineckeReinecke FieldField
500'500'
500'500'
Sharon Ridge UnitSharon Ridge Unit
Diamond M Diamond M FldFld
KellyKelly--Snyder Snyder FldFldKellyKelly--Snyder Snyder FldFld
SACROC UnitSACROC Unit
Oklahoma
Texas
Mid
land
Basin
S. Von Roeder S. Von Roeder FldFld
E. E. VealmoorVealmoorFldFld
Salt CreekSalt CreekFieldField
Salt CreekSalt CreekFieldField
Horseshoe AtollHorseshoe Atoll
Delaw
are Basin
Hockley Lubbock Crosby Dickens
HowardHoward
TerryTerry LynnLynn GarzaGarza KentKent
GainesGaines
ScurryScurryDawsonDawsonBordenBorden
WellmanWellmanFieldField
WellmanWellmanFieldField
Adair FieldAdair FieldAdair FieldAdair Field
Hobo Hobo FldFld
OceanicOceanicFieldField
OceanicOceanicFieldField
OceanicOceanicFieldField
OceanicOceanicFieldField
VealmoorVealmoorFieldField
VealmoorVealmoorFieldField
VealmoorVealmoorFieldField
VealmoorVealmoorFieldField
CogdellCogdellFieldField
CogdellCogdellFieldField
S. BrownfieldS. BrownfieldFieldField
S. BrownfieldS. BrownfieldFieldField
MungervilleMungerville FldFldMungervilleMungerville FldFld
Von Roeder Von Roeder FldFld
Good Good FldFldGood Good FldFldReineckeReinecke FieldField
500'500'
500'500'
Sharon Ridge UnitSharon Ridge Unit
Diamond M Diamond M FldFld
KellyKelly--Snyder Snyder FldFldKellyKelly--Snyder Snyder FldFld
SACROC UnitSACROC Unit
Oklahoma
Texas
Mid
land
Basin
S. Von Roeder S. Von Roeder FldFld
E. E. VealmoorVealmoorFldFld
Salt CreekSalt CreekFieldField
Salt CreekSalt CreekFieldField
Horseshoe AtollHorseshoe Atoll
Delaw
are Basin

.
FINAL SP030508
3
productive portion of SACROC can be divided into three broad geographic regions, which are
here referred to as the Northern Platform, Central Plain, and the Southwestern Region. The
Platform area contains the thickest overall interval (Figure 5). Across the three mile width of
this area, the gross thickness of section above the water-free oil production contact (OWC)
ranges from 80 feet at the periphery of the field, to more than 750 feet at the center of the
Platform. Additionally, a portion of this area exhibits complex geometry, with
compartmentalization caused by changes in depositional environments, erosion, and possible
faulting and karsting. Production data from this area displays strong evidence of vertical
migration pathways that bypass low permeability barriers. Carbonate debris flows and Cisco-
aged, in-place flank bioherm mounds lend further complexity on the western and eastern margins
of the Platform.
The primary feature of the Central Plain is a broad, gently arching plain, which is broken by
steep-sided pinnacles, gentler mounds, intermittent sinuous lows, and localized depressions.
This region is the focus of current CO2 flooding efforts. The Southwestern Region of SACROC
contains the most structurally complex portion of the Unit and has the lowest net pay. It is not
currently under consideration for tertiary flooding efforts. Overlying the Canyon is a thick
sequence of dark black, organic-rich shale. This thick sequence of shale forms both an effective
seal and may have served as the source for the hydrocarbons trapped in the reservoir.
.
FINAL SP030508
4
Figure 3: Stratigraphic Column of the Permian Basin, Canyon/Cisco Formations Noted
Interval of InterestInterval of Interest

.
FINAL SP030508
5
Figure 4: Top of Canyon Structure Map, SACROC Unit
1 Mile
SubseaElevationTo Top of Reef
North
Current CO2 Areas
Ultimate CO2 Target Area
Southwes
tern
Southwes
tern
Centra
l Plain
Centra
l Plain
Pla
tfo
rmP
latf
ormProposed Test Site
1 Mile
SubseaElevationTo Top of Reef
North
Current CO2 Areas
Ultimate CO2 Target Area
Southwes
tern
Southwes
tern
Centra
l Plain
Centra
l Plain
Pla
tfo
rmP
latf
orm
1 Mile
SubseaElevationTo Top of Reef
North
Current CO2 Areas
Ultimate CO2 Target Area
Southwes
tern
Southwes
tern
Centra
l Plain
Centra
l Plain
Pla
tfo
rmP
latf
orm
1 Mile
SubseaElevationTo Top of Reef
North
Current CO2 Areas
Ultimate CO2 Target Area
Southwes
tern
Southwes
tern
Centra
l Plain
Centra
l Plain
Pla
tfo
rmP
latf
orm
1 Mile
SubseaElevationTo Top of Reef
North
Current CO2 Areas
Ultimate CO2 Target Area
Southwes
tern
Southwes
tern
Centra
l Plain
Centra
l Plain
Pla
tfo
rmP
latf
ormProposed Test SiteProposed Test Site
1 Mile
SubseaElevationTo Top of Reef
North
Current CO2 Areas
Ultimate CO2 Target Area
Southwes
tern
Southwes
tern
Centra
l Plain
Centra
l Plain
Pla
tfo
rmP
latf
orm
1 Mile
SubseaElevationTo Top of Reef
North
Current CO2 Areas
Ultimate CO2 Target Area
Southwes
tern
Southwes
tern
Centra
l Plain
Centra
l Plain
Pla
tfo
rmP
latf
orm
.
FINAL SP030508
6
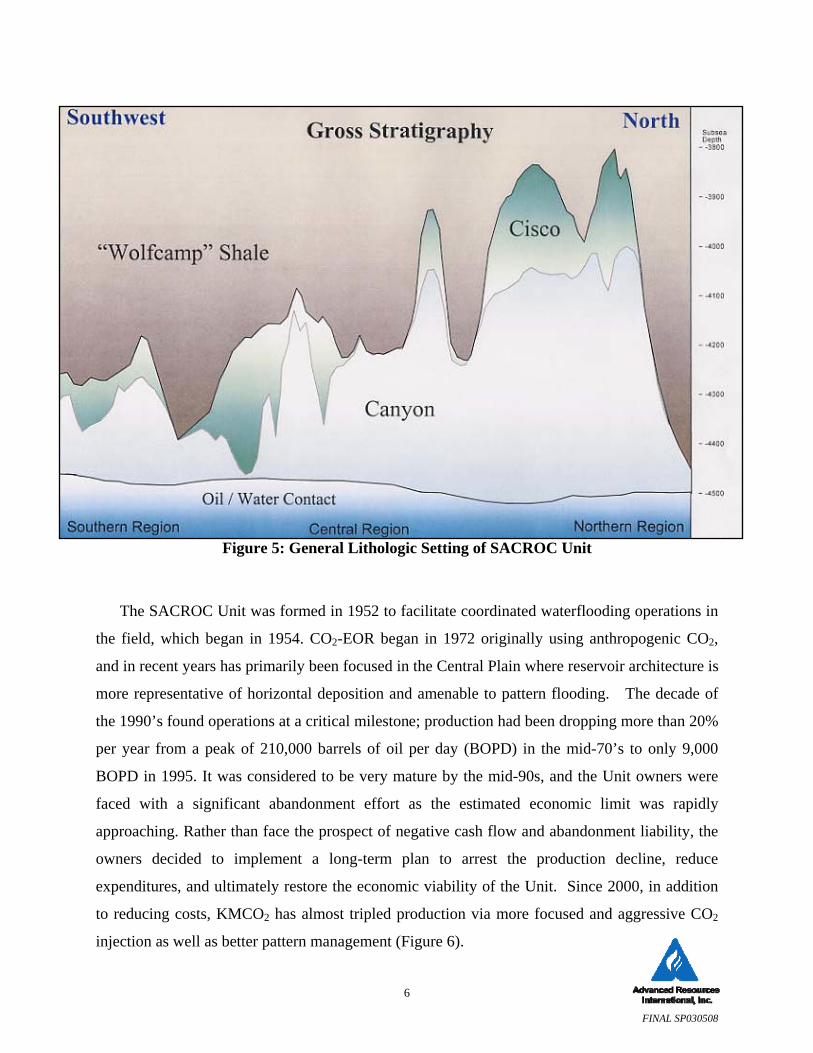
Figure 5: General Lithologic Setting of SACROC Unit
The SACROC Unit was formed in 1952 to facilitate coordinated waterflooding operations in
the field, which began in 1954. CO2-EOR began in 1972 originally using anthropogenic CO2,
and in recent years has primarily been focused in the Central Plain where reservoir architecture is
more representative of horizontal deposition and amenable to pattern flooding. The decade of
the 1990’s found operations at a critical milestone; production had been dropping more than 20%
per year from a peak of 210,000 barrels of oil per day (BOPD) in the mid-70’s to only 9,000
BOPD in 1995. It was considered to be very mature by the mid-90s, and the Unit owners were
faced with a significant abandonment effort as the estimated economic limit was rapidly
approaching. Rather than face the prospect of negative cash flow and abandonment liability, the
owners decided to implement a long-term plan to arrest the production decline, reduce
expenditures, and ultimately restore the economic viability of the Unit. Since 2000, in addition
to reducing costs, KMCO2 has almost tripled production via more focused and aggressive CO2
injection as well as better pattern management (Figure 6).

.
FINAL SP030508
7
Figure 6: SACROC Unit Production Since Discovery
KMCO2 is now considering its options regarding CO2-EOR for the Northern Platform. It
appears to have the necessary characteristics to host a CO2-EOR flood of some form. However,
this area may be at a pressure below the MMP since operations here had mostly ceased by the
1990’s. Therefore, aggressive CO2 injection and pressure control efforts will be needed. At the
same time, it is paramount to avoid the detrimental effects associated with poor mobility ratio,
specifically gravity override, which could be an issue with pattern flooding in the thick net pays
that exist in this area. As such, KMCO2 has established an important corporate objective to
evaluate the feasibility of CO2-EOR flooding in selected zones of the SACROC Unit Platform
area. This project represented one important component of that overall effort.
Oil Production
100
1,000
10,000
100,000
1,000,000
1958
1960
1962
1964
1966
1968
1970
1972
1974
1976
1978
1980
1982
1984
1986
1988
1990
1992
1994
1996
1998
2000
2002
2004
2006
2008
Oil
Rat
e (
bb
l/d
)

.
FINAL SP030508
8
2.0 Description of Reservoir Characterization Procedure
The reservoir characterization procedure is one that has been a topic of research for several
years by Advanced Resources International (ARI), under DOE sponsorship, and with
increasingly encouraging results.1,2. Essentially it utilizes advanced pattern recognition
technology to establish relationships between data of different scales and types, ultimately
leading to a core-type reservoir description (i.e., porosity (Ø) and permeability (k)), at a high
vertical resolution, and in 3D space. A fundamental requirement of the proposed technique is the
acquisition/availability of data at various scales of measurement to bridge the (vertical)
resolution gap between the extremes represented by surface seismic and core-scale data. In it’s
ideal application, the technique requires the following data:
1) surface seismic, which provides the full 3D data cube for the reservoir (at the lowest cost
per unit of reservoir volume surveyed),
2) crosswell seismic, which provides an important bridge in terms of both data type and
resolution between surface seismic and well logs,
3) wireline well logs and,
4) standard whole core analysis which provides the link to the reservoir engineering
parameters of permeability and porosity.
Each of these four data types are explored and conditioned, individually and in combination,
using clustering techniques, a form of self organizing maps (SOM’s). These are unsupervised
artificial neural networks (ANN’s) that can identify patterns and commonalities in data. In this
case, the analysis provides insights into lithofacies and depositional environments.
1 Reeves, S. R., Mohaghegh, S. D., Fairborn, J. W., and Luca, G.: “Feasibility Assessment of a New Approach for Integrating Multiscale Data for High-Resolution Reservoir Characterization”, SPE 77759, presented at the SPE Annual Technical Conference and Exhibition held in San Antonio, Texas, September 29 – October, 2, 2002. 2 Reeves, S.R.; “Development of an Advanced Approach for Next-Generation Integrated Reservoir Characterization”, Final Report prepared for the U.S. Department of Energy, Award No. DE-FC26-01BC15357, April, 2005.

.
FINAL SP030508
9
The heart of the procedure is to create several ANN’s that utilize the raw data, as well as the
clustering information, to relate 1) surface to crosswell seismic (specifically seismic attributes to
crosswell traces), 2) crosswell attributes (computed from crosswell traces) to geophysical log
responses, and 3) geophysical log responses to core permeability and porosity. With these three
models, any surface seismic trace can be deconvolved from a low resolution elastic waveform to
a high-resolution representation of permeability and porosity (Figure 7).
As mentioned earlier, this approach can be distinguished from the conventional approaches
because it:
is based purely on pattern recognition, yet still honors the underlying geology and rock
physics,
improves resolution via direct relationships of data at different scales,
provides estimates of permeability in addition to porosity,
can be performed relatively quickly and with readily available and inexpensive software.
Figure 7: Pathway to 3D High-Resolution Reservoir Characterization
Borehole Seismic
(X - Well, VSP)
Conventional Well Logs
3 - D Surface Seismic
High - Resolution
Reservoir Description
(Core, MRI, etc.)
Objective
Relationship #3
Relationship #2
Relationship #1
Borehole Seismic
(X - Well, VSP)
Conventional Well Logs
3 -D Surface Seismic
High - Resolution
Reservoir Description
(Core, MRI, etc.)
Objective
Relationship #3
Relationship #2
Relationship #1
Borehole Seismic
(X - Well, VSP)
Conventional Well Logs
3 - D Surface Seismic
High - Resolution
Reservoir Description
(Core, MRI, etc.)
Objective
Relationship #3
Relationship #2
Relationship #1
Borehole Seismic
(X - Well, VSP)
Conventional Well Logs
3 -D Surface Seismic
High - Resolution
Reservoir Description
(Core, MRI, etc.)
Objective
Relationship #3
Relationship #2
Relationship #1

.
FINAL SP030508
10
3.0 Proposed Work Plan
The work plan originally proposed for the project is summarized below.
Task 1.0 – Obtain and Analyze Whole Core, Geophysical Well Logs
The first task was to obtain fresh whole core for the entire Canyon interval. Four new
wells were to be drilled in different parts of the main Northern Platform area. Oriented core was
to be obtained over the entire Canyon formation, which at this location is approximately 800 feet
thick. After description and cataloging, the core analysis program consisted of 1) on each foot of
core, 3D permeability to air in two azimuthal horizontal and one vertical orientation, porosity,
fluid saturations, and grain density, 2) core plug analysis (permeability and porosity) on 50 core
plugs from selected locations, and 3) thin section analysis was to be performed on each of the 50
plug samples. In addition, a modern well log suite was to be run in each cored well, to consist of
spectral gamma ray, neutron porosity, lithodensity, sonic, and laterlog.
Task 2.0 – Collect and Process Pre-Injection Data
The first subtask was to involve identifying and collecting all the reservoir descriptive
and performance data available for the area in which an injection test was to be performed. This
was expected to be near to one of the cored wells, and was to include geophysical well logs,
preexisting core data, fluid property data (including CO2-oil tests), pressure transient and
reservoir pressure data, and historical well production/injection volumes.
The next subtask was to involve acquiring crosswell seismic surveys. Crosswell surveys
were proposed between at least one cored well and an offset well. For the purposes of planning,
it was assumed that four well-pairs will be surveyed. Processing of the seismic data was also to
be performed as part of this task.

.
FINAL SP030508
11
Task 3.0 – Perform Reservoir Characterization and Predictive Modeling
The next task was to be to utilize all the data collected in Task 2 to develop the reservoir
characterization itself, and to forecast injection and CO2 movement pathways via reservoir
simulation. The first step of the reservoir characterization was to develop a virtual intelligence
model to relate surface seismic attributes to the crosswell traces, at the collocated (crosswell)
positions. This would likely involve the use of up to 12 surface seismic attributes as inputs, and
the crosswell traces as the outputs.
The next subtask was to train, test and validate the crosswell-to-log model. The first step
in developing this model was to compute the seismic attributes from the synthetic crosswell
traces developed in the previous subtask. A virtual intelligence model was to then be built with
up to 12 crosswell attributes as inputs, and up to 6 geophysical well logs as outputs. The dataset
would include several crosswell traces in each direction from the well in which the modern log
suite will be acquired.
The final virtual intelligence model was to relate the geophysical well logs to core data.
Similar to the previous subtasks, a model was to be developed with up to six logs as the inputs
and the two core measurements as the outputs.
Assuming satisfactory models were developed, the next step was be to apply it to
generate estimates of permeability and porosity on 1 foot intervals for each synthetic log suite for
the test area. At the conclusion of this subtask, permeability and porosity was to exist on 1 foot
intervals at each surface seismic trace location in the injection test area, thus creating the high
resolution reservoir characterization.
Based on the resulting high-resolution reservoir characterization, a reservoir model was
to be constructed. The model would strictly honor the results of the reservoir characterization.
The history of the test area would then be matched. Only the most uncertain parameters would
be allowed to vary. If a successful match is achieved, this would provide some validation to the
reservoir characterization.

.
FINAL SP030508
12
Task 4.0 – Perform Injection Test
The next task was to perform an injection test. A primary purpose of the test (or series of
tests) was to measure vertical connectivity throughout the entire Canyon interval, which will be
critical for performing a CO2-EOR flood. Specifically, sections of the wellbore were to be
isolated while other sections were injected into. The observance of pressure between isolated
sections was to provide some indication of vertical pressure communication and, thus, vertical
permeability. The use of tracers was to be considered.
Task 5.0 – Validate Predictions
Following the injection tests, the actual reservoir responses to injection were to be
compared to those predicted via simulation using the reservoir characterization developed in
Task 3. An assessment was to be made as to the accuracy of the reservoir characterization based
on these data. If successful, a high-resolution reservoir characterization was to be generated for
each seismic trace in the entire Northern Dome. This was to provide KMCO2 the reservoir
characterization needed for planning and managing full-scale implementation of the CO2-EOR
flood.

.
FINAL SP030508
13
The original project schedule is provided in Figure 8.
Figure 8: Project Schedule
Tech Trans
Task 6
Post CO2 Xwell
Task 5
CO2 Injection
Task 4
Res. Char/Modelling
Task 3
Data Collection
Task 2
Coring/Logging
Task 1
1st4th3rd2nd1st4th3rd2nd1st4th
2007200620052004
Tech Trans
Task 6
Post CO2 Xwell
Task 5
CO2 Injection
Task 4
Res. Char/Modelling
Task 3
Data Collection
Task 2
Coring/Logging
Task 1
1st4th3rd2nd1st4th3rd2nd1st4th
2007200620052004

.
FINAL SP030508
14
4.0 Deviations from Proposed Work Plan
Despite considerable efforts to perform the project as originally proposed, business and
operational considerations on the part of the operator created delays in implementation of the
crosswell surveys and injection test, so much so that alternative approaches had to be sought to
meet the project objectives. These are described below. We should note, however, that the
operator is proceeding with these activities, at their own cost, in coordination with the DOE’s
Southwestern Partnership for Carbon Sequestration. They are simply being performed too late
for inclusion in this project.
4.1 Core Wells Only three wells were ultimately cored over the entire Canyon interval, as opposed to the
originally planned four. The fourth well was eliminated from the program by KMCO2, but did
not impact the project results. The wealth of data collected from the three wells was sufficient
for the purposes of the project. The cost share associated with these three wells is shown in
Table 1.
4.2 Crosswell Seismic Surveys and Injection Test
As mentioned above, due to scheduling differences and shifting priorities, the operator
delayed the acquisition of cross-well survey data and CO2-EOR pilot testing in the platform area
until after this project was over. DOE declined to extend the project to wait for these activities to
be completed. As a result, our approach to the reservoir characterization procedure itself, as well
as its validation, had to be modified, which was done in the following manner:
In the absence of crosswell seismic data, core and log data could not be directly
related to surface seismic data (despite appending considerable efforts to do so). The
alternative approach was therefore to utilize the log-to-core model to predict
permeability and porosity for all wells in a focused area of the Northern Platform, and
create a three-dimensional geostatistical variogram to estimate these properties
throughout the area.
.
FINAL SP030508
15
The resulting reservoir characterization was validated by building a reservoir
simulation model of the study area and history-matching the historical production
performance without significantly modifying the reservoir characterization.
These two steps were successfully performed, the technical details of which are described
in the project deliverables. Copies of the Topical Reports are provided in the Appendices.
4.3 Deliverables
The deliverables from the project included:
4.3.1 Conference Papers
Gonzalez, R., Schepers, K., Reeves, S.R., Eslinger, E. and Back, T. ;
“Integrated Clustering/Geostatistical/Evolutionary Strategies Approach for 3D Reservoir Characterization and Assisted History-Matching in a Complex Carbonate Reservoir, SACROC Unit, Permian Basin”, SPE 113978-PP, prepared for presentation at the 2008 SPE Improved Oil Recovery Symposium held in Tulsa, OK, April 19-23, 2008.
González, R.J., Reeves, S.R., Eslinger, E. and García, G.: “Development and Application of an Integrated Clustering/Geostatistical Approach for 3D Reservoir Characterization, SACROC Unit, Permian Basin”, Paper 111453-MS presented at the 2007 SPE/EAGE Reservoir Characterization and Simulation Conference, Abu Dhabi, 28-31 October, 2007.
4.3.2 Topical Reports
Schepers, K., Gonzalez, R.J., and Reeves, S.R.; “Optimized Reservoir History
Matching Simulation of Canyon Formation, SACROC Unit, Permian Basin”, Topical Report, prepared for U.S. Department of Energy, DE-FC26-04NT15514, November, 2007.
González, R.J., Reeves, S.R., and Eslinger, E.; “Geostatistical Reservoir
Characterization of the Canyon Formation, SACROC Unit, Permain Basin”, Topical Report for U. S. Department of Energy, Contract Number DE-FC26-04NT15514, September, 2007.

.
FINAL SP030508
16
González, R.J., Reeves, S.R., and Eslinger, E.; “Predicting Porosity and Permeability for the Canyon Formation, SACROC Unit (Kelly-Snyder Field), Using the Geologic Analysis via Maximum Likelihood System”, Topical Report prepared for U. S. Department of Energy, Contract Number DE-FC26-04NT15514, September, 2007.
4.4 Schedule
The project was completed by September 30, 2007, six months later than originally
proposed. The delay was primarily a result of providing (limited) additional time for KMCO2 to
obtain the cross-well seismic surveys.

.
FINAL SP030508
17
Table 1: Case Share Associated With Three Cored Wells
Sum of Tran_Amt Year
Property_Id Desc 2004 2005 2006 Grand Total11-15 Bits 7,262.20 7,262.20
Casing and Other Tangible Crews 8,421.00 8,421.00 Cementing Services 42,875.40 42,875.40 Conductor/Surface Casing 24,156.71 24,156.71 Contract Labor 4,176.00 4,176.00 Coring and Analysis 184,740.20 889.61 185,629.81 Damages 6,500.00 6,500.00 Dirtwork/Roads 1,321.00 1,321.00 Drilling - Daywork 338,294.68 338,294.68 Electric and Other Logging 11,846.20 11,846.20 Fuel, Power, and Water 3,639.85 43,954.77 47,594.62 Intermediate Casing 196,719.35 196,719.35 Miscellaneous Supplies 200.00 200.00 Miscellaneous Supply and Services 4,427.08 4,427.08 Miscellaneous Tangibles 19,846.00 19,846.00 Move In and Move Out 14,500.00 14,500.00 Mud and Chemicals 56,793.62 56,793.62 Mud Logging/MWD 12,772.00 12,772.00 Other Subsurface Casing 18,954.25 18,954.25 Professional Services and Consultants 250.00 25,329.00 25,579.00 Regulatory Permitting Fees 425.00 425.00 Rental -Tools and Equipment 7,350.95 7,350.95 Seismic Acquisition 2,480.94 2,480.94 Site Preparation and Cleanup 91,885.58 12,066.50 103,952.08 Transportation 4,151.12 4,151.12 Tubular Inspection and Testing 1,310.00 1,310.00 Well Surveys and Testing 583.00 583.00 Wellhead Equipment 1,699.27 3,294.19 4,993.46
11-15 Total 104,736.90 1,047,488.96 889.61 1,153,115.4719-12 Bits 5,675.00 5,675.00
Casing and Other Tangible Crews 15,475.00 15,475.00 Cementing Services 29,160.15 29,160.15 Conductor/Surface Casing (4,328.57) (4,328.57) Contract Labor 6,490.50 6,490.50 Coring and Analysis 152,222.90 35,291.11 187,514.01 Damages 6,500.00 6,500.00 Drilling - Daywork 380,874.97 380,874.97 Electric and Other Logging 18,750.03 18,750.03 Fuel, Power, and Water 164,688.50 164,688.50 Intermediate Casing 18,009.93 332.84 18,342.77 Miscellaneous Supply and Services 4,029.42 4,029.42 Miscellaneous Tangibles 19,639.03 19,639.03 Move In and Move Out 27,500.00 27,500.00 Mud and Chemicals 4,223.75 4,223.75 Mud Logging/MWD 11,124.00 11,124.00 Other Subsurface Casing 112,636.48 112,636.48 Professional Services and Consultants 26,175.00 26,175.00 Regulatory Permitting Fees 500.00 500.00 Rental -Tools and Equipment 63,359.32 63,359.32 Site Preparation and Cleanup 2,009.00 62,212.34 64,221.34 Supervision 396.00 396.00 Transportation 13,002.05 13,002.05 Tubular Inspection and Testing 3,353.50 43.78 3,397.28 Various Transportation 884.00 884.00 Welding 366.80 366.80 Wellhead Equipment 6,317.71 6,317.71
19-12 Total 2,009.00 1,149,237.81 35,667.73 1,186,914.5437-11 Bits 12,961.70 66,493.15 79,454.85
Casing and Other Tangible Crews 11,377.25 11,377.25 Cementing Services 43,132.80 43,132.80 Conductor/Surface Casing 23,519.71 23,519.71 Contract Labor 1,769.00 1,769.00 Coring and Analysis 106,400.00 104,184.94 210,584.94 Damages 8,000.00 500.00 8,500.00 Drilling - Daywork 305,991.70 305,991.70 Electric and Other Logging 20,779.47 20,779.47 Fuel, Power, and Water 55,536.42 55,536.42 Intermediate Casing 205,080.68 205,080.68 Miscellaneous Supply and Services 5,313.00 1,890.00 7,203.00 Miscellaneous Tangibles 19,996.00 19,996.00 Move In and Move Out 14,500.00 14,500.00 Mud and Chemicals 5,511.25 65,289.56 70,800.81 Mud Logging/MWD 11,948.00 11,948.00 Other Subsurface Casing 21,503.95 21,503.95 Professional Services and Consultants 8,400.00 20,500.00 28,900.00 Regulatory Permitting Fees 425.00 425.00 Rental -Tools and Equipment 30,847.23 250.00 31,097.23 Site Preparation and Cleanup 23,182.00 9,752.40 32,934.40 Transportation 5,664.93 871.16 6,536.09 Tubular Inspection and Testing 2,833.00 2,833.00 Wellhead Equipment 10,509.94 10,509.94
37-11 Total 954,758.03 270,156.21 1,224,914.24Grand Total 1,061,503.93 2,466,882.98 36,557.34 3,564,944.25

.
FINAL SP030508
18
5.0 Conclusions
Due to operational scheduling considerations on the part of the operator of the field, the
crosswell data was not obtained during the period of project performance (it is currently being
collected however as part of another DOE project). This compromised the utility of the surface
seismic data for the project due to the resolution gap between it and the geophysical well logs.
An alternative approach was adopted that utilized a relational model to predict porosity and
permeability profiles from well logs at each well location, and a 3D geostatistical variogram to
generate the reservoir characterization over the reservoir volume of interest. A reservoir
simulation model was built based upon this characterization and history-matched without making
significant changes to it, thus validating the procedure. While not the same procedure as
originally planned, the procedure ultimately employed proved successful and demonstrated that
the general concepts proposed (i.e., data mining and advanced pattern recognition methods) have
the flexibility to achieve the reservoir characterization objectives sought even with imperfect or
incomplete data.

.
FINAL SP030508
1
Appendix A: Topical Report –Optimized Reservoir History
Matching Simulation of Canyon Formation, SACROC Unit,
Permian Basin
A -

.
FINAL SP030508
1
Appendix B: Topical Report – Geostatistical Reservoir
Characterization of the Canyon Formation, SACROC Unit,
Permian Basin
B -

.
FINAL SP030508
1
Appendix C: Topical Report – Predicting Porosity and Permeability
for the Canyon Formation, SACROC Unit (Kelly-Snyder Field),
Using the Geologic Analysis via Maximum Likelihood System
C -