Embed Size (px)
Citation preview
TTHHEE AALLAASSKKAA SSPPEECCIIEESS RRAANNKKIINNGG SSYYSSTTEEMM::
SSEETTTTIINNGG PPRRIIOORRIITTIIEESS FFOORR WWIILLDDLLIIFFEE CCOONNSSEERRVVAATTIIOONN
Tamara L. Fields and Tracey A. Gotthardt
THE ALASKA SPECIES RANKING SYSTEM:
SETTING PRIORITIES FOR WILDLIFE CONSERVATION
Prepared for: The Alaska Department of Fish and Game
Division of Wildlife Conservation Nongame Program P.O. Box 115526
Juneau, AK 99811-5526
By: Tamara L. Fields and Tracey A. Gotthardt
Alaska Natural Heritage Program University of Alaska Anchorage
707 A Street Anchorage, AK 99501
August 2009
File Name ASRS_Species_Ranking_System_2009.pdf Recommended Citation Fields, T.L. and T.A. Gotthardt. 2009. The Alaska Species Ranking System: Setting
Priorities for Wildlife Conservation. Prepared for the Alaska Department of Fish and Game, Nongame Program. Alaska Natural Heritage Program, ENRI, University of Alaska Anchorage, Anchorage, Alaska. 108 pp.
Keywords Alaska, vertebrate, wildlife, conservation, prioritization, ranking, ranking system, population status, biological vulnerability, current knowledge, mammals, birds, amphibians Acronyms ADF&G Alaska Department of Fish and Game AKNHP Alaska Natural Heritage Program ASRS Alaska Species Ranking System BBS Breeding Bird Survey CWCS Alaska’s Comprehensive Wildlife Conservation Strategy FGFWFC Florida Game and Fresh Water Fish Commission LE Federally-listed Endangered LT Federally-listed Threatened SGCN Species of Greatest Conservation Need SSC State-listed Species of Special Concern SWG State Wildlife Grants USFWS U.S. Fish and Wildlife Service
The Alaska Species Ranking System i
EXECUTIVE SUMMARY To identify and prioritize projects that address the conservation needs of wildlife species in Alaska, the Alaska Department of Fish and Game’s (ADF&G) Nongame Program recognized the importance of a systematic approach for evaluating and quantitatively analyzing species information. The goal of this project was to develop a logical, consistent and transparent ranking system for wildlife species with conservation needs identified in Alaska’s Comprehensive Wildlife Conservation Strategy (CWCS) (ADF&G 2006). The ranking system will help provide more specific programmatic guidance by prioritizing conservation efforts across taxa and suggesting knowledge gaps that could be addressed by a variety of partners. The Alaska Natural Heritage Program (AKNHP), working in concert with the ADF&G Nongame Program, reviewed different approaches, and ultimately selected a prioritization ranking system developed for the Florida Game and Fresh Water Fish Commission (FGFWFC), and first described by Millsap et al. (1990), as a model for Alaska’s species ranking effort. Within the Millsap et al. (1990) ranking system, vertebrate species are ranked based on biological vulnerability and extent of knowledge of population status and management needs. Advantages of this approach include scores that are explicit and traceable, the ability to update ranks as better information becomes available, and flexibility in setting priorities as a result of separate subscores and sorting mechanisms. The Alaska Species Ranking System (ASRS) closely follows the ranking scheme developed by Millsap et al. (1990), although modifications were made to improve its applicability to Alaska. The ranking system is divided into three component parts: 1) Biological Scores are the sum of eight variables that reflect different aspects of a taxon’s distribution, abundance and life history; high biological scores indicate greater vulnerability to extirpation; 2) Action Scores are the sum of individual scores for four variables that reflect the current state of knowledge or extent of conservation efforts directed toward a given taxon within Alaska; high action scores denote poorly known, unmanaged taxa; and 3) four Supplemental Variables are used to sort taxa to answer specific questions in relation to taxonomic significance, season of occurrence, level of harvest and whether or not a taxon is peripheral. The ASRS provides a biological score and an action score for each taxon evaluated. The use of multiple variables allows for flexibility in the ranking system so that it can be queried in a myriad of ways to provide answers to specific conservation questions. We ranked a total of 341 species, subspecies, or populations including 6 amphibians, 213 birds, and 122 mammals. A major two year effort was required to complete the ranking process. System development included a pilot project to rank and evaluate a subset of the nominee taxa, an internal review by ADF&G Nongame staff after all taxa were ranked, an expert review for taxa with missing information, and a consistency check across all variables. We examined the results to assess the ability of the ranking system to adequately evaluate biological vulnerability and the current state of scientific knowledge. We conducted analyses to explore the interrelationships among variables, compared scores to other existing agency listing designations, and assessed whether there were taxonomic biases within the system. To better
The Alaska Species Ranking System ii
assist with interpretation of biological and action scores, we also devised categories to group taxa according to biological vulnerability and action need. Statistical analyses revealed no strong correlations among the biological variables or the action variables. Principal components analysis revealed that both population status and life history variables were important in explaining the variance in biological scores. When comparing biological scores to Federal and State status designations, no differences were observed between unlisted and listed species. This was attributed to the high proportion of Federally-listed species that occur primarily outside of Alaska and the obsolete nature of the State species of special concern list. A more meaningful comparison was made with NatureServe conservation status ranks, a nationally recognized ranking protocol that ranks the global and state status of all taxa from critically imperiled to secure. This comparison revealed an increase in median biological scores from secure to critically imperiled indicating that the ASRS follows a similar pattern observed in a well known and accepted ranking system and accurately represents the relative status of taxa across a wide range of status conditions. Comparison of scores among vertebrate classes revealed higher biological and action scores for mammals compared to birds. The higher biological and action scores received by mammals were primarily due to a high proportion of endemic mammal taxa included in the ranking. We also compared individual action scores among classes with and without endemic taxa. The only observable differences for both these analyses were higher management scores for mammals compared to birds. Due to the observed lack of between class differences and the associated large amount of within class variation, we found that evaluation of action scores at the class level was too coarse to reveal any significant relationships. A comparison of action scores below the class level (i.e. within or between Order or Family) may be more meaningful, but was not conducted for this project. We did not use the results from the variable analysis to adjust the ranking system. Instead, they are presented here to alert users of the potential biases and limitations of the system. In order to fairly evaluate the system, we feel that all vertebrate taxa in Alaska need to be included in the ranking. The current system provides biological and action scores based on the best available knowledge. To fully interpret and use the scores to guide decisions regarding wildlife conservation in Alaska, users of the system should read the criteria justification provided in the database and acknowledge the extent of the expert review prior to drawing conclusions. Furthermore, we encourage users of the ASRS to utilize the supplemental variables to sort taxa based on taxonomic significance, seasonal occurrence, level of harvest, and peripheral status. We acknowledge that the ASRS is a complex ranking system that requires the user to have a fair amount of prior knowledge about the ranking criteria and the scoring system to be able to interpret results correctly and use them prescriptively for wildlife conservation. Furthermore, this report was developed to address all facets of the ASRS, from development to analyses through implementation, and is therefore quite lengthy. Owing to the length and breadth of the report, we have included a “Frequently Asked Questions” section (see Appendix I) as a quick reference for users.
The Alaska Species Ranking System iii
TABLE OF CONTENTS
EXECUTIVE SUMMARY ............................................................................................................. i TABLE OF CONTENTS ............................................................................................................... iii LIST OF TABLES ......................................................................................................................... iv LIST OF FIGURES ........................................................................................................................ v LIST OF APPENDICES ................................................................................................................ vi INTRODUCTION .......................................................................................................................... 1 METHODS ..................................................................................................................................... 2
Development of the Ranking System ......................................................................................... 2 Selection of Taxa ........................................................................................................................ 3
Criteria for Inclusion .............................................................................................................. 3 Inclusion of Subspecies and Populations ................................................................................ 3
Description of the Ranking Variables ......................................................................................... 4 Biological Variables. .............................................................................................................. 6 Action Variables...................................................................................................................... 9 Supplemental Variables ........................................................................................................ 11
Modifications from Millsap et al. (1990) .................................................................................. 12 Ranking Criteria ................................................................................................................... 12 Scoring System ...................................................................................................................... 13
Evaluation Process .................................................................................................................... 14 Analyses .................................................................................................................................... 14
RESULTS and DISCUSSION ...................................................................................................... 15 Evaluation Process .................................................................................................................... 15 Interrelationships among Variables .......................................................................................... 15 Accuracy of Biological and Action Scores ............................................................................... 17
Biological Scores .................................................................................................................. 17 Action Scores ........................................................................................................................ 19
Comparisons among Taxa......................................................................................................... 20 Biological Scores .................................................................................................................. 20 Action Scores ........................................................................................................................ 22
Criteria Considerations and Suggestions .................................................................................. 25 Productivity, Survival and Longevity .................................................................................... 25 Peripheral Designation ......................................................................................................... 25
Using the ASRS as a Conservation Decision Support Tool ..................................................... 26 Implications for Management ................................................................................................... 40
Systematic Status ................................................................................................................... 40 Using Action Scores to Make Recommendations for Conservation Action .......................... 40
CONCLUSIONS AND RECOMMENDATIONS ....................................................................... 57 ACKNOWLEDGEMENTS………………………………………………………………… ….58 LITERATURE CITED ................................................................................................................. 59

The Alaska Species Ranking System iv
LIST OF TABLES Table 1. Biological variables, categories within variables and scores used to rank
taxa………………………………..…………………………………………………8 Table 2. Action variables, categories within variables and scores used to rank
taxa……………………………….…………………………………………….......10 Table 3. Supplemental variables and categories within variables used to sort
taxa……................................................................................................................…12 Table 4. Spearman’s rank correlations between biological variables……………………….16 Table 5. Spearman’s rank correlations between action variables...........................................16 Table 6. Unrotated factor loadings of biological variables based on R-type principal
components analysis of the correlation matrix…………………………………….17 Table 7. Category classification for all taxa………………………….……...……………...27 Table 8. Category classification for species only…………………………...………………35 Table 9. Candidate taxa in need of increased survey efforts in Alaska ………………….....43 Table 10. Candidate taxa in need of increased monitoring efforts in Alaska…………….......47 Table 11. Candidate taxa in need of increased research efforts in Alaska ………………...…55

The Alaska Species Ranking System v
LIST OF FIGURES Figure 1. Structural schematic of the Alaska Species Ranking System (ASRS)……………...5 Figure 2. Histogram of median biological scores for Federal- and State-listed taxa….…......18 Figure 3. Histogram of median biological scores for NatureServe’s global and state ranks
from G1 to G5 and S1 to S5………………………………………………………..19 Figure 4. Histogram of median action scores for Federal- and State-listed taxa………….....20 Figure 5. Histogram of median biological scores for all birds, all amphibians, all
mammals, nonendemic birds, nonendemic amphibians, nonendemic mammals, endemic birds, and endemic mammals…………..……………………..21
Figure 6. Histogram of biological scores and adjusted biological scores for nonendemic
birds, amphibians, and mammals…………………..………………………..……..22 Figure 7. Histogram of median action scores for all birds, all amphibians, all mammals,
nonendemic birds, nonendemic amphibians, nonendemic mammals, endemic birds, and endemic mammals……...……………………………………..23
Figure 8. Histogram of median scores for individual action scores of amphibians, birds,
and mammals…………………….……………………………………..………….24 Figure 9. Histogram of median scores for individual action scores of nonendemic
amphibians, birds, and mammals…………………………..…………………...….24
The Alaska Species Ranking System vi
LIST OF APPENDICES Appendix I. The Alaska Species Ranking System: Frequently Asked Questions…………….61 Appendix II. List of 26 species used in pilot testing to assess the accuracy and consistency
of the Alaska ranking criteria…...................……………...…………………...…65 Appendix III. Nominee taxa ranked (n=341) in order of descending biological score ………..66 Appendix IV. Nominee taxa ranked (n=341) in order of descending action score. ……….......87 Appendix V. NatureServe/Heritage Program conservation status rank definitions………….108
The Alaska Species Ranking System 1
INTRODUCTION Resources (e.g. time and money) available for biodiversity conservation are invariably in short supply relative to the needs for those resources (Master 1991, Regan et al. 2004). Not surprisingly, methods for prioritizing potential target species in terms of their conservation status are integral components of the conservation planning process (Knapp et al. 2003). Many states in the U.S. have developed their own systems in order to prioritize conservation actions and/or to appoint “official” state designations such as “endangered,” “threatened” and “species of special concern”. To make the best use of federal funds provided through the Wildlife Conservation and Restoration and the State Wildlife Grant (SWG) programs, Congress directed each state to develop a Comprehensive Wildlife Conservation Strategy (CWCS). As a primary objective, Congress further directed each state to identify and focus on species of greatest conservation need (SGCN). With the completion and approval of Alaska’s CWCS in 2005, the Alaska Department of Fish and Game (ADF&G) became eligible for congressional SWG appropriations. To identify and prioritize projects that address the species of greatest conservation need in Alaska, ADF&G recognized the importance of a systematic approach for evaluating and quantitatively analyzing species information. About 600 species or subspecies of vertebrate animals regularly occupy Alaska’s terrestrial habitats. With such a large array of taxa it is difficult to objectively allocate limited resources to those most in need of active conservation. Initially, the Alaska CWCS compiled a list of nominee species that contained 400 species of greatest conservation need (ADFG 2006). This list was derived from conservation plans, lists from conservation organizations, and expert and public comments. Although a number of evaluation criteria were considered to develop the nominee list, no criteria were used to objectively score species. This approach, along with the sizeable number of species, has limitations for guiding future project and funding decisions. To help remedy this, the CWCS identified the need for an objective ranking process and suggested that a key requirement was to complete a systematic statewide species ranking process as part of the state’s initial implementation effort. To meet this need, the Alaska Natural Heritage Program (AKNHP), working in concert with the ADF&G Nongame Program, reviewed a variety of options for systematically ranking and evaluating the conservation status of species, including a number of basic approaches that were described in other states’ conservation strategies. After extensive consultation and discussion with other programs, the approach used by the Florida Game and Fresh Water Fish Commission (FGFWFC), and first described by Millsap et al. (1990), was selected as a model for Alaska’s species ranking effort. Within the Millsap et al. (1990) ranking system, vertebrate taxa are ranked based on biological vulnerability and extent of knowledge of population status and management. Advantages of the Millsap et al. (1990) approach include scores that are explicit and traceable, the ability to update ranks as better information becomes available, and flexibility in setting priorities as a result of separate subscores and sorting mechanisms. Since the publication of Millsap et al. (1990) Wildlife Monograph, this procedure has been adjusted and employed as a tool to guide conservation decision making in a number of states,
The Alaska Species Ranking System 2
other countries, and also within the National Park system. At the state level, a modified Millsap approach was used to set priorities for species ranking in Indiana (Knapp et al. 2003) and for identifying species of concern in Maine (Ritchie et al. 2005). Baldi et al. (2001) adapted the Millsap system to set priorities for the conservation of terrestrial vertebrates in Hungary and Lunney et al. (1996) customized the Millsap et al. (1990) ranking system to identify and prioritize endangered fauna in New South Wales, Australia. At a finer scale, Garret and Wright (2000) used a modified Millsap approach to prioritize research and monitoring needs for terrestrial mammals within the U.S. National Parks system. Over a two-year period from 2006 to 2008, ADF&G’s Nongame Program entered into a partnership with AKNHP to research and develop a consistent and transparent priority ranking system for wildlife taxa in Alaska. The project objective was to provide a logical ranking of all vertebrate taxa with respect to biological vulnerability and current state of knowledge in order to prioritize conservation efforts across taxa and suggest knowledge gaps. Results of the ranking exercise would be used to provide up-to-date species level information for strategic decision making, better-inform cooperators, allow for better inter-divisional coordination, and increase public support for wildlife conservation expenditures. Here, we describe the Alaska Species Ranking System (ASRS) and present ranks of taxa according to specific sets of criteria. We summarize the methods that were employed to develop the priority ranking system, including modifications made to the Millsap et al. (1990) ranking and scoring system to improve its efficacy in Alaska. We also illustrate ways that ranks can be used to prioritize wildlife conservation decisions across taxa in Alaska.
METHODS
Development of the Ranking System
System development began in January 2006. ADF&G, AKNHP and U.S. Fish and Wildlife Service (USFWS) staff participated in a teleconference with Thomas Eason and Jeff Gore from the Florida Fish and Wildlife Conservation Commission (FF&WCC). Jeff Gore was a co-author on the Millsap et al. (1990) Wildlife Monograph and the FF&WCC has been using the Millsap ranking system to guide wildlife conservation decisions in Florida for almost two decades. The Florida team advised us of the strengths and weaknesses of their system and made suggestions for modifications that would improve the applicability of a similar ranking system for Alaska. They also provided us with a copy of their project database, which they currently use to house and update all project data. Based on discussions with the FF&WCC team and after a thorough review of the ranking literature, we decided to implement a three-pronged ranking system similar to Millsap et al. (1990), which considers biological, action, and supplemental variables. We specifically selected this three-pronged approach because variables are designed to be applicable to all vertebrate taxa, the system yields independent measures of biological vulnerability and state of knowledge for each taxon, and the system is flexible enough to allow sorting of taxa based on any combination of variables (Millsap et al. 1990). Categories were adopted from Millsap et al. (1990) and adjusted when deemed necessary to describe the range of variation within each
The Alaska Species Ranking System 3
variable. Variable descriptions and modifications made to the Millsap et al. (1990) ranking and scoring system for Alaska are described later in the methods section. To test the initial system, a pilot evaluation was conducted using a subset of 26 taxa from the CWCS nominee species list (ADF&G 2006). Pilot taxa were selected by ADF&G and AKNHP staff to represent a sample of potentially data deficient, common, and rare taxa across all vertebrate taxonomic groups, including birds, fishes, mammals, and amphibians (Appendix II). Pilot study results were reviewed by ADF&G Nongame and AKNHP staff to assess the consistency and accuracy of the ranking system. Criteria were then refined to assign more accurate weights, to maximize consistency and to reduce taxonomic bias. In the first year of the project, AKNHP ranked 200 taxa and presented these preliminary results to ADF&G Nongame Program staff for further evaluation. With a much larger sample, reviewers were able to better identify ambiguities in the evaluation criteria and scores. Once again, the criteria were modified based on reviewer comments. Using the now refined ranking system in year two of the project, we: 1) updated any pertinent information for the previously ranked 200 taxa as a result of changes to the ranking criteria and 2) completed ranking for all remaining taxa.
Selection of Taxa Criteria for Inclusion The list of nominee species included in the Alaska CWCS (ADF&G 2006) was derived from existing conservation plans, lists from conservation organizations, and expert and public comments. The list included 400 taxa represented by five classes: birds, mammals, amphibians, fishes and invertebrates. The CWCS nominee species list was considered representative of the species of greatest conservation need in Alaska, but also subject to change depending on updates in conservation plans and by organizations. Prior to implementing the ASRS, we refined the nominee species list to reflect any recent changes to conservation status, taxonomic status, and occurrence in Alaska. Taxa considered accidental and casual in their occurrence were excluded. Although two fish species were included in the pilot testing to insure that the system worked across all taxa, fishes and invertebrates were excluded from the remainder of the ranking process. Overall, a total of 341 species, subspecies, or populations were ranked for this project, including: 213 birds, 122 mammals, and 6 amphibians. Inclusion of Subspecies and Populations In addition to ranking taxa at the species level, we also ranked subspecies and populations (e.g. Cook Inlet Beluga whale) that were included in the CWCS nominee list, although this was sometimes problematic. In Alaska, the systematic status of many subspecies is not well understood or researched. Many subspecific designations were made more than 50 years ago and were based on morphological measurements from often times very small sample sizes. The authors of the Millsap et al (1990) monograph were also concerned that by using all described subspecies they risked ranking a taxon highly that might later be found identical to more wide-spread, secure populations of the same species. We elected to rank all subspecies that were included in the nominee list, cognizant of the fact that many of the subspecies that we treated separately may not be highly differentiated and may no longer warrant subspecific status. To

The Alaska Species Ranking System 4
that end, we encourage end-users of the ASRS to consider the taxonomic status of high-ranking taxa when setting conservation priorities. This is facilitated by using the supplemental variable “Systematic Significance of the Taxon” (described below) as a sorting mechanism. Populations were ranked in a similar manner and can also be identified through the “Systematic Significance of the Taxon” supplemental variable. The Marine Mammal Protection Act establishes “stocks” or “population stocks” as the appropriate conservation/management unit for marine mammals. Marine mammal species often consist of multiple stocks within separate spatial arrangements that interbreed when mature (Cottington 2005). Many marine mammal ‘stocks” in Alaska are inclusive of the entire population of the species that occurs in the state (e.g., there are four recognized “stocks” of Fin whales in North America of which the Northeast “stock” is representative of the entire Fin whale population that occurs in Alaska). Consequently, most marine mammal stocks were categorized at the “species” level and ranked accordingly. Exceptions to this rule included the Steller sea lion (Eumetopias jubatus), for which there are two population stocks in Alaska (Eastern and Western) and was therefore ranked as two separate “populations”, and the Northern sea otter (Enhydra lutris kenyoni), which was ranked at the species level (inclusive of all three stocks that occur in Alaska) and also at the population level for the declining Southwest stock.
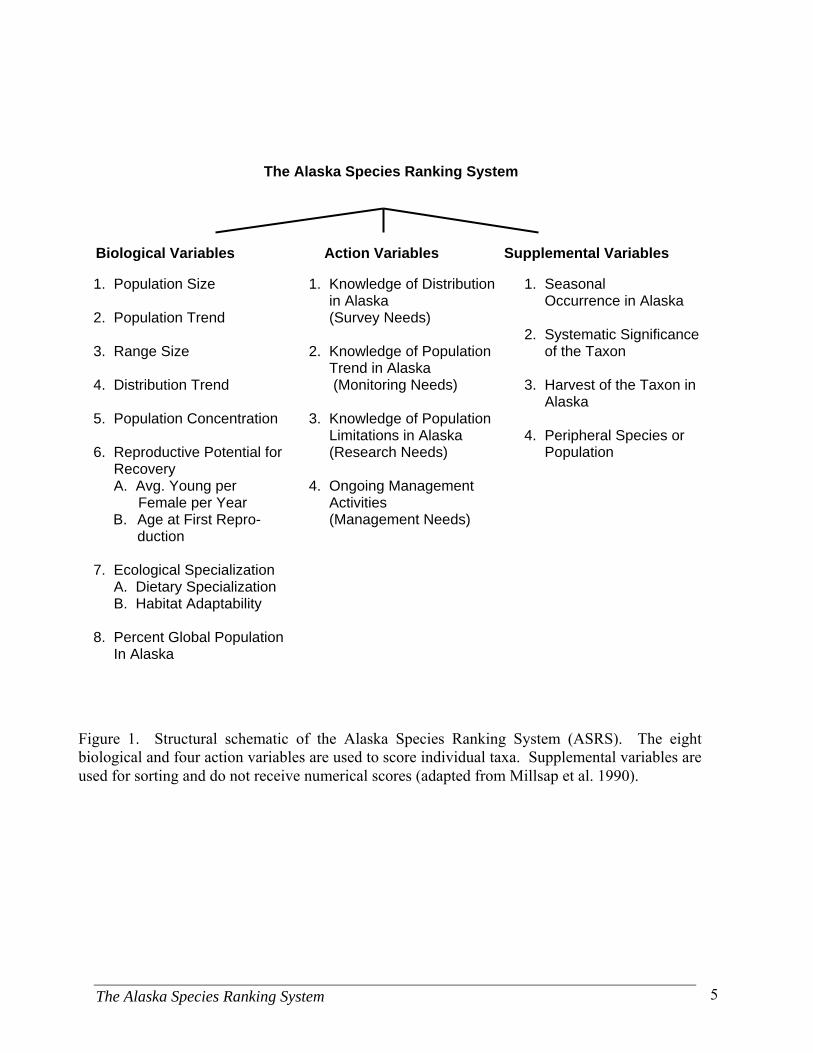
Description of the Ranking Variables As previously noted, we adopted the basic structure of the Millsap et al. (1990) ranking system, which uses three groups of variables to rank taxa (Figure 1). The first group consists of eight biological variables that measure aspects of a taxon’s distribution, abundance and life history. Scores for these eight variables are summed to yield a biological score for each taxon, with higher biological scores suggesting greater vulnerability to extirpation. The second group consists of four action variables that measure the current state of knowledge or extent of conservation efforts directed toward a given taxon within Alaska. The sum of scores for the four action variables yields an action score, with higher action scores denoting greater information needs due of lack of knowledge or conservation action. The third group contains four supplemental variables that are used to sort taxa in relation to taxonomic significance, season of occurrence, harvest and whether or not the taxon is peripheral in its range. Each taxon is evaluated for each of the 16 total variables. The use of multiple variables allows for flexibility in the ranking system so that it can be queried in myriad ways to provide answers to specific conservation questions.
The Alaska Species Ranking System 5
The Alaska Species Ranking System
Biological Variables Action Variables Supplemental Variables 1. Population Size 2. Population Trend 3. Range Size 4. Distribution Trend 5. Population Concentration 6. Reproductive Potential for Recovery A. Avg. Young per Female per Year
B. Age at First Repro- duction
7. Ecological Specialization A. Dietary Specialization B. Habitat Adaptability 8. Percent Global Population In Alaska
1. Knowledge of Distribution in Alaska (Survey Needs) 2. Knowledge of Population Trend in Alaska (Monitoring Needs) 3. Knowledge of Population Limitations in Alaska (Research Needs) 4. Ongoing Management Activities (Management Needs)
1. Seasonal Occurrence in Alaska 2. Systematic Significance of the Taxon 3. Harvest of the Taxon in Alaska 4. Peripheral Species or Population
Figure 1. Structural schematic of the Alaska Species Ranking System (ASRS). The eight biological and four action variables are used to score individual taxa. Supplemental variables are used for sorting and do not receive numerical scores (adapted from Millsap et al. 1990).
The Alaska Species Ranking System 6
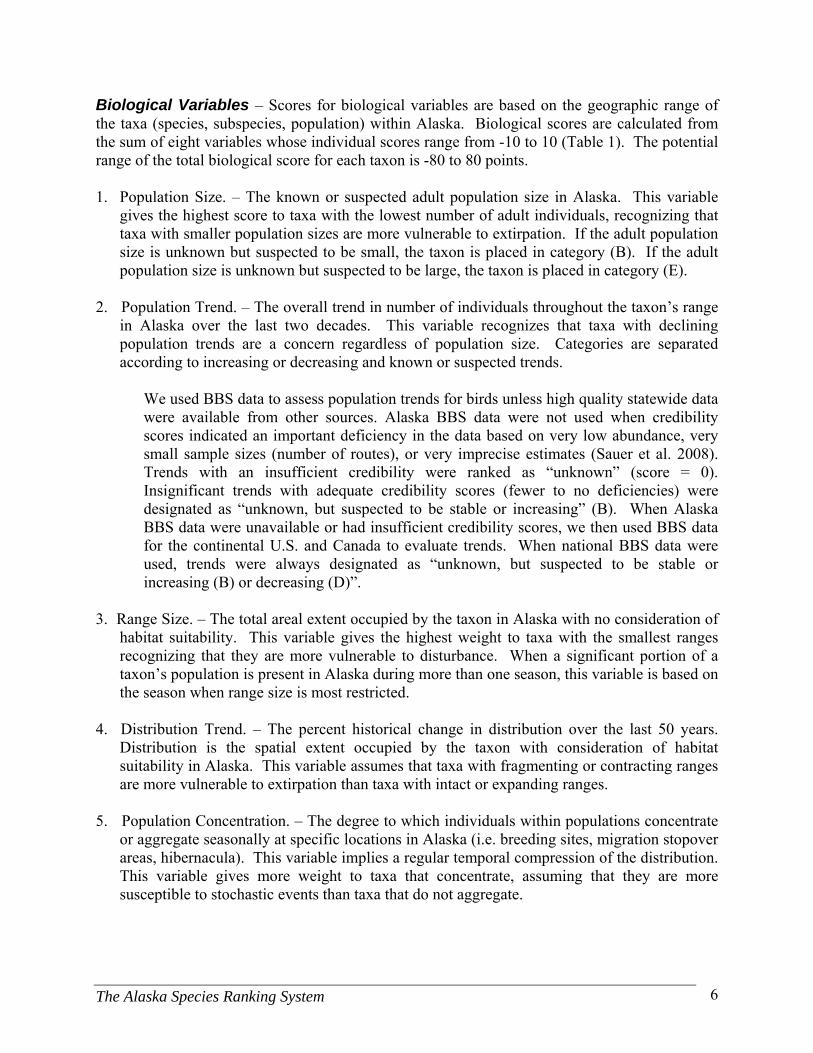
Biological Variables – Scores for biological variables are based on the geographic range of the taxa (species, subspecies, population) within Alaska. Biological scores are calculated from the sum of eight variables whose individual scores range from -10 to 10 (Table 1). The potential range of the total biological score for each taxon is -80 to 80 points. 1. Population Size. – The known or suspected adult population size in Alaska. This variable
gives the highest score to taxa with the lowest number of adult individuals, recognizing that taxa with smaller population sizes are more vulnerable to extirpation. If the adult population size is unknown but suspected to be small, the taxon is placed in category (B). If the adult population size is unknown but suspected to be large, the taxon is placed in category (E).
2. Population Trend. – The overall trend in number of individuals throughout the taxon’s range
in Alaska over the last two decades. This variable recognizes that taxa with declining population trends are a concern regardless of population size. Categories are separated according to increasing or decreasing and known or suspected trends.
We used BBS data to assess population trends for birds unless high quality statewide data were available from other sources. Alaska BBS data were not used when credibility scores indicated an important deficiency in the data based on very low abundance, very small sample sizes (number of routes), or very imprecise estimates (Sauer et al. 2008). Trends with an insufficient credibility were ranked as “unknown” (score = 0). Insignificant trends with adequate credibility scores (fewer to no deficiencies) were designated as “unknown, but suspected to be stable or increasing” (B). When Alaska BBS data were unavailable or had insufficient credibility scores, we then used BBS data for the continental U.S. and Canada to evaluate trends. When national BBS data were used, trends were always designated as “unknown, but suspected to be stable or increasing (B) or decreasing (D)”.
3. Range Size. – The total areal extent occupied by the taxon in Alaska with no consideration of
habitat suitability. This variable gives the highest weight to taxa with the smallest ranges recognizing that they are more vulnerable to disturbance. When a significant portion of a taxon’s population is present in Alaska during more than one season, this variable is based on the season when range size is most restricted.
4. Distribution Trend. – The percent historical change in distribution over the last 50 years.
Distribution is the spatial extent occupied by the taxon with consideration of habitat suitability in Alaska. This variable assumes that taxa with fragmenting or contracting ranges are more vulnerable to extirpation than taxa with intact or expanding ranges.
5. Population Concentration. – The degree to which individuals within populations concentrate
or aggregate seasonally at specific locations in Alaska (i.e. breeding sites, migration stopover areas, hibernacula). This variable implies a regular temporal compression of the distribution. This variable gives more weight to taxa that concentrate, assuming that they are more susceptible to stochastic events than taxa that do not aggregate.
The Alaska Species Ranking System 7
6. Reproductive Potential for Recovery. – This variable is a surrogate for a taxon’s ability to recover from population declines or respond to management actions. The variable consists of two parts and gives the most weight to taxa that produce fewer offspring at a later age, assuming that they will take longer to recover from or respond to environmental changes.
(A) The average number of eggs or live young produced per adult female per year. (B) The minimum age at which a female first reproduces.
7. Ecological Adaptability. – This variable consists of two parts and considers the ecological
specialization of a taxon. This variable gives the most weight to dietary and/or habitat specialists that depend on scarce resources, assuming that they are less capable of adapting to environmental changes. (A) Dietary specialization recognizes that taxa that have specific dietary niches are more
vulnerable to environmental changes than taxa with wide feeding tolerances. (B) Habitat adaptability considers habitat use within the season when taxa are the most
specialized.
8. Percent of Global Population in Alaska. – This variable reflects Alaska’s stewardship responsibility to the conservation of a taxon. More weight is given to taxa that have a higher percentage of their global population occurring within Alaska. This variable assumes that the higher the percentage, the greater the impact status and management actions within the state will have on the persistence of the taxa at the global scale.
The Alaska Species Ranking System 8
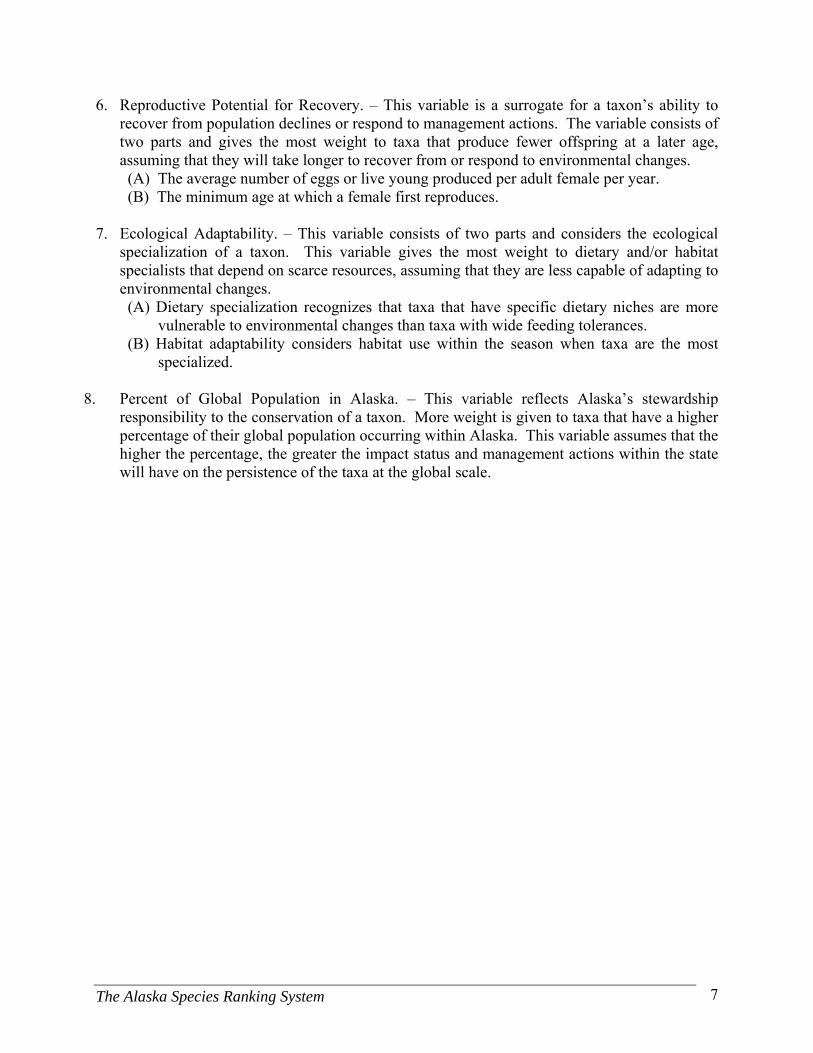
Table 1. Biological variables, categories within variables and scores used to rank taxa.
Biological variables and categories Score Population size: known or suspected adult population size in Alaska A. 0-500 10 B. 501-1000, or population is unknown but suspected small 6 C. 1001-3000 2 D. 3001-10000 -2 E. 10001-25000, or population is unknown, but suspected to be large -6 F. >25000 -10 Population trend: overall trend in Alaska over the last 2 decades A. Population size known to be decreasing 10 B. Trend unknown, but population size suspected to be decreasing 6 C. Population formerly experienced serious declines, but is presently stable or increasing 2 D. Population size stable or suspected to be stable or increasing -6 E. Population size known to be increasing -10 Overall range size: size of the range within Alaska (total areal extent occupied with no consideration of habitat suitability) during the season when range is most restricted A. < 100 km2 (<1 township, St. Paul Island) 10 B. 100 km2 to 1,000 km2 (1-10 township, St. Paul Island to Etolin Island) 8 C. 1,001 km2 to 10,000 km2 (~1/1500 to 1/150 size of Alaska, Etolin Island to Kodiak Island) 4 D. 10,001 km2 to 100,000 km2 (~1/150 to 1/15 size of Alaska, Kodiak Island to Arctic National Wildlife Refuge) -2 E. 100,001 km2 to 400,000 km2 (~1/15 to 1/4 size of Alaska, Arctic National Wildlife Refuge to Brooks Range + North Slope) -8 F. >400,000 km2 (>1/4 size of Alaska, Brooks Range + North Slope) -10
Distribution trend: % historical change in distribution (spatial extent occupied with consideration of habitat suitability) over the last 50 years in area occupied within Alaska A. Area occupied has declined by >50% 10 B. Area occupied has declined by 25-49% 6 C. Area occupied has declined by 10-24% 2
Biological variables and categories Score D. Area occupied has declined by 1-9% -5 E. Area occupied is stable or has
increased -10 Population concentration: degree to which populations aggregate at sites seasonally in Alaska (within season when aggregate the most) A. Population concentrates or occurs at
single site 10 B. Population concentrates or occurs at 2-25 sites 2 C. Population concentrates or occurs > 25
sites -6 D. Population concentrates or occurs at > 250 sites or does not concentrate -10 Reproductive potential for recovery A. Average number of eggs or live young produced/adult female/yr a. <1 offspring 5 b. 1-2 offspring 3 c. 3-9 offspring 1 d. 10-100 offspring -3 e. >100 offspring -5 B. Minimum age at which females typically first reproduce a. >8 years 5 b. 4-8 years 1 c. 2-3 years -3 d. <2 years -5 Ecological adaptability: degree to which population is dependent on environmental factors A. Dietary specialization
a. Not adaptable; dietary specialist with key requirements scarce 5 b. Moderately adaptable; dietary specialist with key requirements fairly common 1 c. Highly adaptable; opportunistic feeder -5
B. Habitat adaptability; refers to the habitat used within the season that is most limiting in Alaska
a. Not adaptable; habitat specialist with key requirements scarce 5 b. Moderately adaptable; habitat specialist with key requirements fairly common 1 c. Highly adaptable; habitat generalist -5
The Alaska Species Ranking System 9
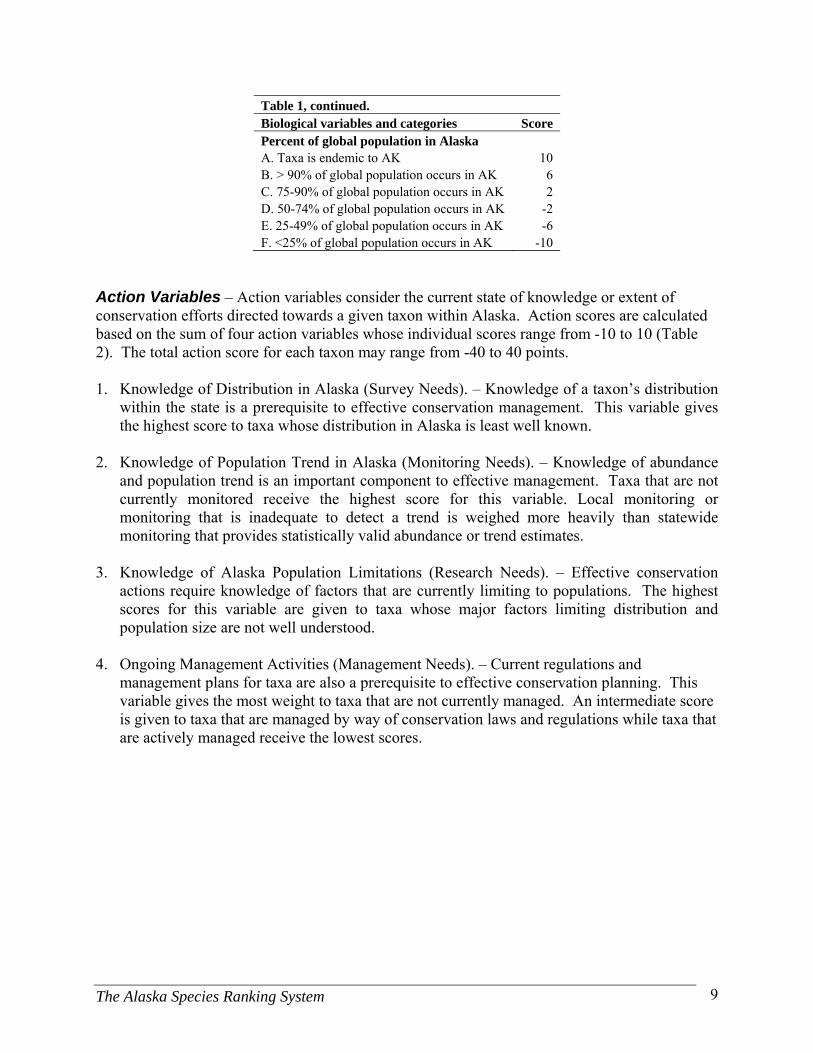
Table 1, continued. Biological variables and categories Score Percent of global population in Alaska A. Taxa is endemic to AK 10 B. > 90% of global population occurs in AK 6 C. 75-90% of global population occurs in AK 2 D. 50-74% of global population occurs in AK -2 E. 25-49% of global population occurs in AK -6 F. <25% of global population occurs in AK -10
Action Variables – Action variables consider the current state of knowledge or extent of conservation efforts directed towards a given taxon within Alaska. Action scores are calculated based on the sum of four action variables whose individual scores range from -10 to 10 (Table 2). The total action score for each taxon may range from -40 to 40 points. 1. Knowledge of Distribution in Alaska (Survey Needs). – Knowledge of a taxon’s distribution
within the state is a prerequisite to effective conservation management. This variable gives the highest score to taxa whose distribution in Alaska is least well known.
2. Knowledge of Population Trend in Alaska (Monitoring Needs). – Knowledge of abundance
and population trend is an important component to effective management. Taxa that are not currently monitored receive the highest score for this variable. Local monitoring or monitoring that is inadequate to detect a trend is weighed more heavily than statewide monitoring that provides statistically valid abundance or trend estimates.
3. Knowledge of Alaska Population Limitations (Research Needs). – Effective conservation
actions require knowledge of factors that are currently limiting to populations. The highest scores for this variable are given to taxa whose major factors limiting distribution and population size are not well understood.
4. Ongoing Management Activities (Management Needs). – Current regulations and
management plans for taxa are also a prerequisite to effective conservation planning. This variable gives the most weight to taxa that are not currently managed. An intermediate score is given to taxa that are managed by way of conservation laws and regulations while taxa that are actively managed receive the lowest scores.

The Alaska Species Ranking System 10
Table 2. Action variables, categories within variables and scores used to rank taxa.
Action variables and categories Score Knowledge of distribution in Alaska (Survey needs) A. Distribution is extrapolated from few
locations or knowledge limited to general range maps 10
B. Broad range limits or habitat associations somewhat known, but distribution is not well understood throughout range in Alaska 2
C. Distribution is well known throughout range in Alaska with knowledge of habitat associations -10
Knowledge of population trend in Alaska (Monitoring needs) A. Not currently monitored 10 B. Monitored locally or statewide monitoring
inadequate to detect trend 2 C. Statewide monitoring adequate to detect
population trend -2
D. Statewide monitoring based on population estimates, or nearly complete censuses -10
Knowledge of Alaska population limitations (Research needs) A. Factors potentially affecting population
size and distribution are speculative, with little awareness about which are limiting 10
B. Factors potentially affecting the population are known, with some agreement on which 2 or 3 are likely limiting 2
C. Factors limiting populations are known, and there is broad consensus about which are limiting -10
Ongoing management activities (Management needs)
A. None directed primarily at the taxon 10 B. Management mostly related to enforcement
of conservation laws 2 C. Some direct management activities in place
to benefit this taxon -10
The Alaska Species Ranking System 11
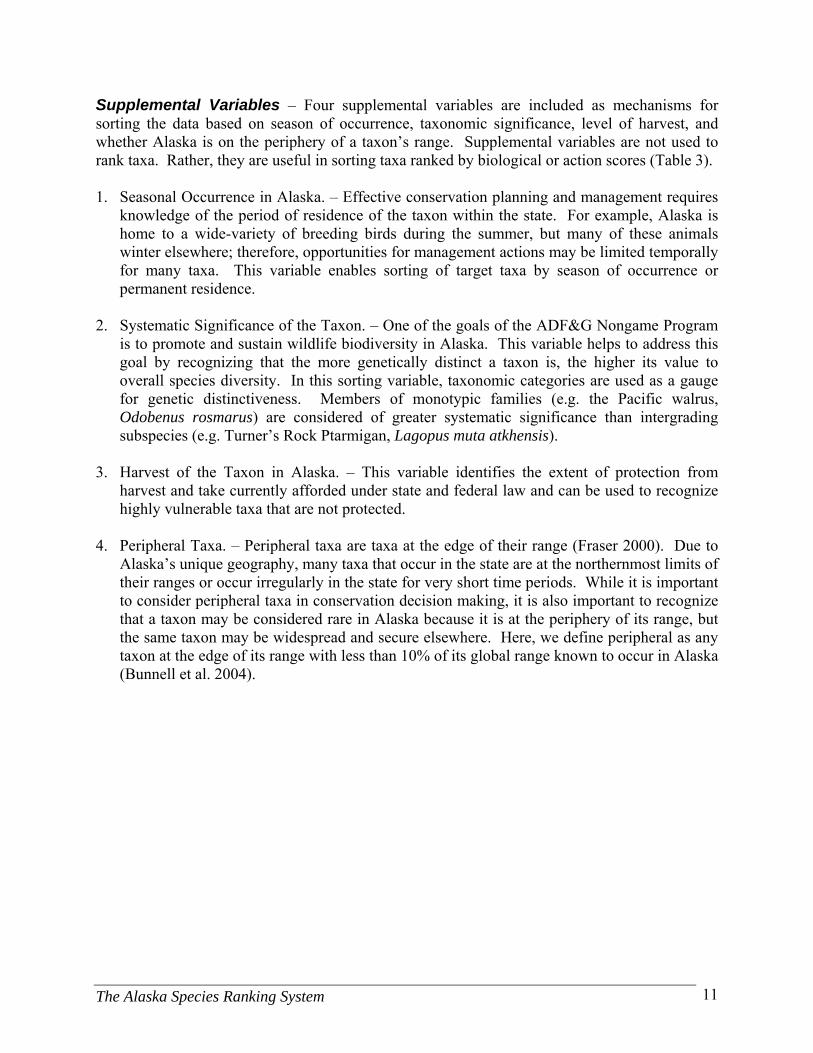
Supplemental Variables – Four supplemental variables are included as mechanisms for sorting the data based on season of occurrence, taxonomic significance, level of harvest, and whether Alaska is on the periphery of a taxon’s range. Supplemental variables are not used to rank taxa. Rather, they are useful in sorting taxa ranked by biological or action scores (Table 3). 1. Seasonal Occurrence in Alaska. – Effective conservation planning and management requires
knowledge of the period of residence of the taxon within the state. For example, Alaska is home to a wide-variety of breeding birds during the summer, but many of these animals winter elsewhere; therefore, opportunities for management actions may be limited temporally for many taxa. This variable enables sorting of target taxa by season of occurrence or permanent residence.
2. Systematic Significance of the Taxon. – One of the goals of the ADF&G Nongame Program
is to promote and sustain wildlife biodiversity in Alaska. This variable helps to address this goal by recognizing that the more genetically distinct a taxon is, the higher its value to overall species diversity. In this sorting variable, taxonomic categories are used as a gauge for genetic distinctiveness. Members of monotypic families (e.g. the Pacific walrus, Odobenus rosmarus) are considered of greater systematic significance than intergrading subspecies (e.g. Turner’s Rock Ptarmigan, Lagopus muta atkhensis).
3. Harvest of the Taxon in Alaska. – This variable identifies the extent of protection from
harvest and take currently afforded under state and federal law and can be used to recognize highly vulnerable taxa that are not protected.
4. Peripheral Taxa. – Peripheral taxa are taxa at the edge of their range (Fraser 2000). Due to
Alaska’s unique geography, many taxa that occur in the state are at the northernmost limits of their ranges or occur irregularly in the state for very short time periods. While it is important to consider peripheral taxa in conservation decision making, it is also important to recognize that a taxon may be considered rare in Alaska because it is at the periphery of its range, but the same taxon may be widespread and secure elsewhere. Here, we define peripheral as any taxon at the edge of its range with less than 10% of its global range known to occur in Alaska (Bunnell et al. 2004).
The Alaska Species Ranking System 12
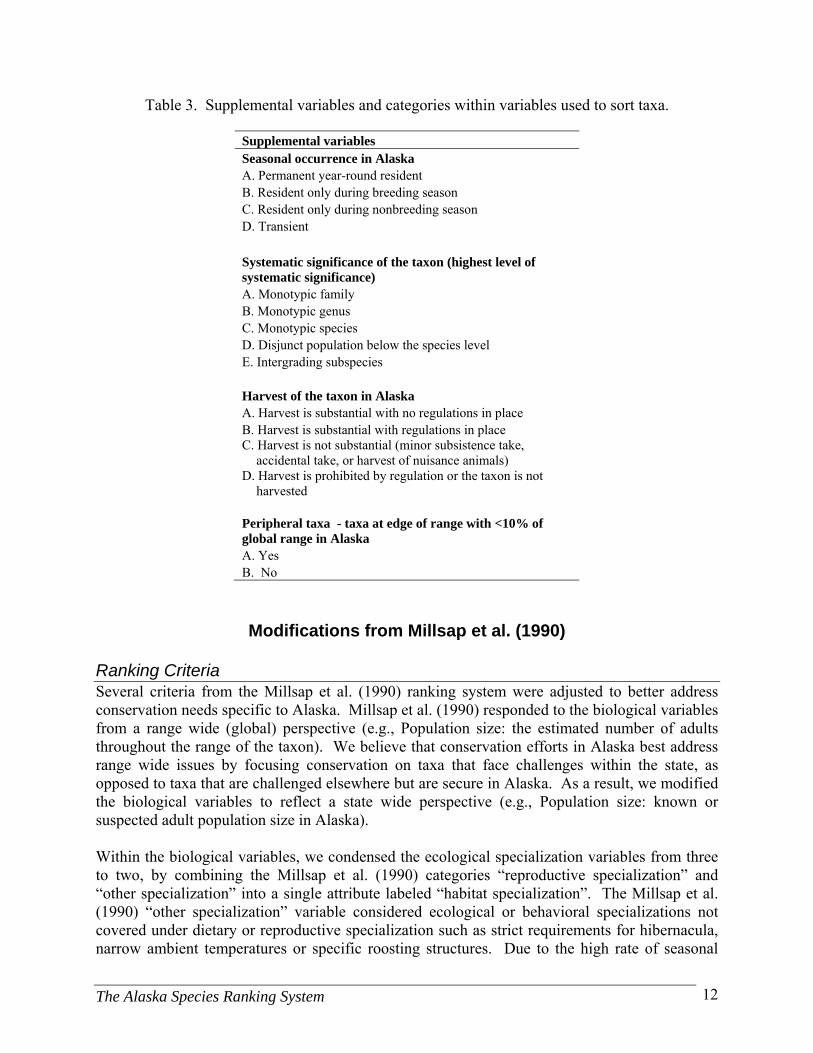
Table 3. Supplemental variables and categories within variables used to sort taxa.
Supplemental variables Seasonal occurrence in Alaska A. Permanent year-round resident B. Resident only during breeding season C. Resident only during nonbreeding season D. Transient
Systematic significance of the taxon (highest level of systematic significance) A. Monotypic family B. Monotypic genus C. Monotypic species D. Disjunct population below the species level E. Intergrading subspecies Harvest of the taxon in Alaska A. Harvest is substantial with no regulations in place B. Harvest is substantial with regulations in place C. Harvest is not substantial (minor subsistence take,
accidental take, or harvest of nuisance animals) D. Harvest is prohibited by regulation or the taxon is not
harvested Peripheral taxa - taxa at edge of range with <10% of global range in Alaska A. Yes B. No
Modifications from Millsap et al. (1990)
Ranking Criteria Several criteria from the Millsap et al. (1990) ranking system were adjusted to better address conservation needs specific to Alaska. Millsap et al. (1990) responded to the biological variables from a range wide (global) perspective (e.g., Population size: the estimated number of adults throughout the range of the taxon). We believe that conservation efforts in Alaska best address range wide issues by focusing conservation on taxa that face challenges within the state, as opposed to taxa that are challenged elsewhere but are secure in Alaska. As a result, we modified the biological variables to reflect a state wide perspective (e.g., Population size: known or suspected adult population size in Alaska). Within the biological variables, we condensed the ecological specialization variables from three to two, by combining the Millsap et al. (1990) categories “reproductive specialization” and “other specialization” into a single attribute labeled “habitat specialization”. The Millsap et al. (1990) “other specialization” variable considered ecological or behavioral specializations not covered under dietary or reproductive specialization such as strict requirements for hibernacula, narrow ambient temperatures or specific roosting structures. Due to the high rate of seasonal
The Alaska Species Ranking System 13
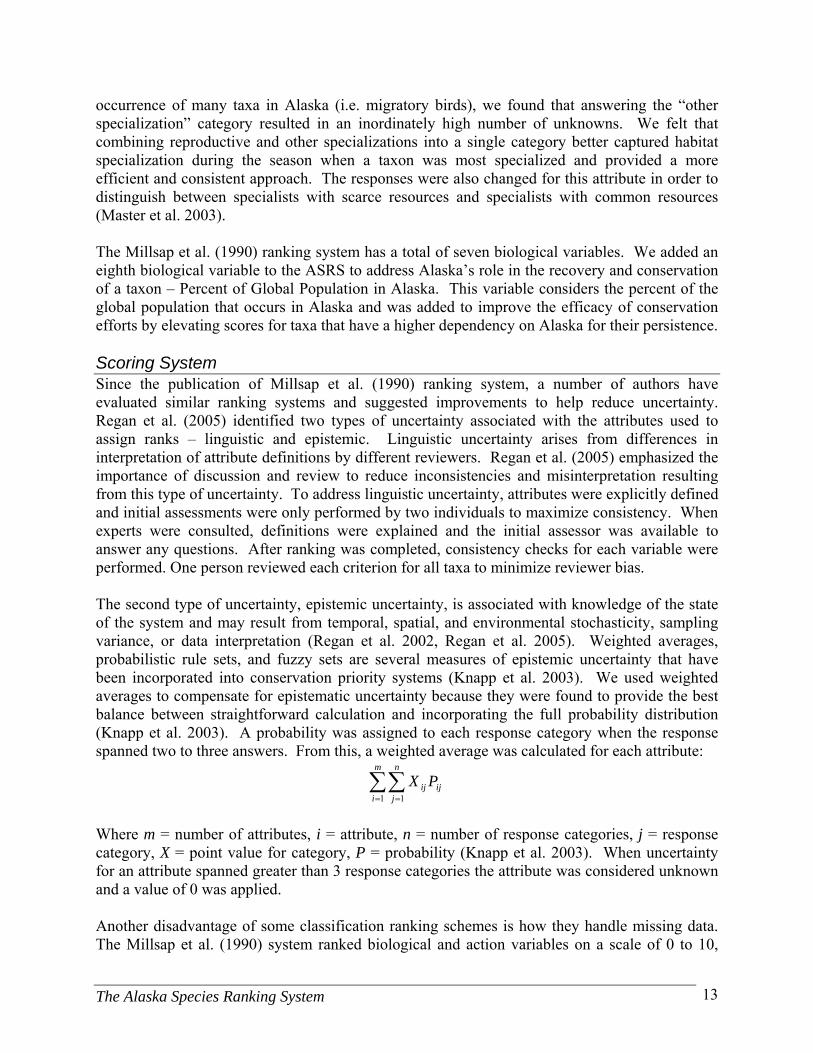
occurrence of many taxa in Alaska (i.e. migratory birds), we found that answering the “other specialization” category resulted in an inordinately high number of unknowns. We felt that combining reproductive and other specializations into a single category better captured habitat specialization during the season when a taxon was most specialized and provided a more efficient and consistent approach. The responses were also changed for this attribute in order to distinguish between specialists with scarce resources and specialists with common resources (Master et al. 2003). The Millsap et al. (1990) ranking system has a total of seven biological variables. We added an eighth biological variable to the ASRS to address Alaska’s role in the recovery and conservation of a taxon – Percent of Global Population in Alaska. This variable considers the percent of the global population that occurs in Alaska and was added to improve the efficacy of conservation efforts by elevating scores for taxa that have a higher dependency on Alaska for their persistence. Scoring System Since the publication of Millsap et al. (1990) ranking system, a number of authors have evaluated similar ranking systems and suggested improvements to help reduce uncertainty. Regan et al. (2005) identified two types of uncertainty associated with the attributes used to assign ranks – linguistic and epistemic. Linguistic uncertainty arises from differences in interpretation of attribute definitions by different reviewers. Regan et al. (2005) emphasized the importance of discussion and review to reduce inconsistencies and misinterpretation resulting from this type of uncertainty. To address linguistic uncertainty, attributes were explicitly defined and initial assessments were only performed by two individuals to maximize consistency. When experts were consulted, definitions were explained and the initial assessor was available to answer any questions. After ranking was completed, consistency checks for each variable were performed. One person reviewed each criterion for all taxa to minimize reviewer bias. The second type of uncertainty, epistemic uncertainty, is associated with knowledge of the state of the system and may result from temporal, spatial, and environmental stochasticity, sampling variance, or data interpretation (Regan et al. 2002, Regan et al. 2005). Weighted averages, probabilistic rule sets, and fuzzy sets are several measures of epistemic uncertainty that have been incorporated into conservation priority systems (Knapp et al. 2003). We used weighted averages to compensate for epistematic uncertainty because they were found to provide the best balance between straightforward calculation and incorporating the full probability distribution (Knapp et al. 2003). A probability was assigned to each response category when the response spanned two to three answers. From this, a weighted average was calculated for each attribute:
m
i
n
jijij PX
1 1
Where m = number of attributes, i = attribute, n = number of response categories, j = response category, X = point value for category, P = probability (Knapp et al. 2003). When uncertainty for an attribute spanned greater than 3 response categories the attribute was considered unknown and a value of 0 was applied. Another disadvantage of some classification ranking schemes is how they handle missing data. The Millsap et al. (1990) system ranked biological and action variables on a scale of 0 to 10,
The Alaska Species Ranking System 14
with higher scores indicating greater vulnerability (biological) or lack of knowledge (action). When reviewers were unable to answer a question using available data or information from the literature, Millsap et al. (1990) substituted expert opinion for missing data. When data were unavailable and expert opinion was lacking, the question was answered as unknown and received the lowest possible score (i.e. unknowns were assigned a value of zero). Consequently, taxa that were less known tended to be classified as less threatened (Regan et al. 2005). In order to better address the problem of missing data and to avoid scoring less known taxa as less threatened, we modified the ASRS scoring system so that scores for an individual variable ranged from 10 (highest) to -10 (lowest). In this positive to negative scoring system, missing data were assigned a value of 0, thereby receiving the middle score as opposed to the lowest score.
Evaluation Process
AKNHP zoology program staff was responsible for evaluating and scoring all taxa included in the priority ranking based on literature review and information gleaned from the Heritage Program’s Biotics and NatureServe databases. All answers and sources of information used to categorize each taxon for each variable were entered into a project specific Access database. In 2007, experts were consulted to evaluate only those variables that the initial reviewer had answered as “unknown”. In 2008, the review process was modified and experts were asked to evaluate the entire suite of criteria, including the answers to variables already completed by the initial reviewer. Experts were given explicit instructions and were asked to evaluate only taxa they were familiar with. Adequate justification and supportive data were required to make changes to the ranks.
Analyses
We examined the results of the ranking process to assess the ability of the system to adequately evaluate biological vulnerability and the state of current knowledge. We conducted analyses to explore the interrelationships among variables, compare scores to other existing agency listing designations, and to assess taxonomic biases on the ranking system. Because the scoring system for most variables was non-linear (successive intervals between the scores were not equal), the median was the most appropriate statistic for describing the central tendency of the results. To examine the interrelationships among biological and action variables, we calculated Spearman’s rank correlations. We used R-type principal components analysis without rotation to further investigate the interrelationships among biological variables and to understand how each variable contributed to the overall ranking. To assess the accuracy of the ranking system we looked at biological and action scores of taxa of known status. Taxa of known status included 1) taxa designated as threatened or endangered by the USFWS or the State of Alaska, or a species of special concern (SSC) by the State of Alaska, and 2) taxa ranked by AKNHP using NatureServe’s numerical ranking process. We used a Kruskal-Wallis rank sum test for among status comparisons (Federally endangered, Federally threatened, and unlisted) due to the nonparametric nature of the data (α = 0.05) and a Mann-Whitney rank sum test to compare state-listed SSC to unlisted taxa (α = 0.05). While there are a

The Alaska Species Ranking System 15
total of 17 SSC in Alaska, the sample size for this analysis was 18 due to the separate ranking of the western and eastern stock of Steller sea lion. To determine if the ranking system was taxonomically biased we compared biological and action scores among the three classes of vertebrates that were represented in the ranking system: Amphibia, Aves, and Mammalia. We predicted that biological and action scores for mammals would be higher than scores for birds and amphibians due to the large number of endemic mammals on the nominee list. To test this hypothesis, we examined differences in scores among classes for all taxa and then repeated this analysis with endemic taxa excluded. We also predicted that if there was a taxonomic bias in the ranking system it would likely be attributable to two biological variables, population size and reproductive potential. Millsap et al. (1990) found these two variables were of questionable comparability among classes. To determine how these variables influenced biological scores, we then compared biological scores that excluded population size and reproductive potential. We used a Kruskal-Wallis rank sum test for among class comparisons (α = 0.05) and a Mann-Whitney rank sum test with a Bonferroni correction for pairwise comparisons (α = 0.017).
RESULTS and DISCUSSION
Evaluation Process
For each taxon evaluated we calculated the total biological and action score (Appendix III and IV, respectively). Biological and action scores are calculated separately and never summed to maintain independent measures of biological vulnerability and current state of knowledge. In total, we ranked 341 taxa including 6 amphibians, 213 birds, and 122 mammals. Of the 341 taxa ranked, 82 were subspecies and 8 were ranked at the population level. Biological scores ranged from 42.0 to -72.0 (scale 80.0 to -80.0) while action scores ranged from 40.0 to -40.0 (scale 40.0 to -40.0). The expert review process was not consistent for the full duration of the project nor was it complete upon the delivery of this report. Our initial goal was to have experts help answer criteria for which the response was unknown. As the process evolved, we found that it was more straightforward to provide reviewers with all of the questions as well as the full response(s) already recorded by the initial reviewer. Overall, expert reviews were completed for 127 taxa, and reviews for 59 taxa were pending at the time this report was developed. Reviews were requested for an additional 115 taxa with no response from the expert(s) contacted and reviews for 40 taxa were not requested at all due to time constraints and/or the evaluation by the initial assessor was deemed complete.
Interrelationships among Variables
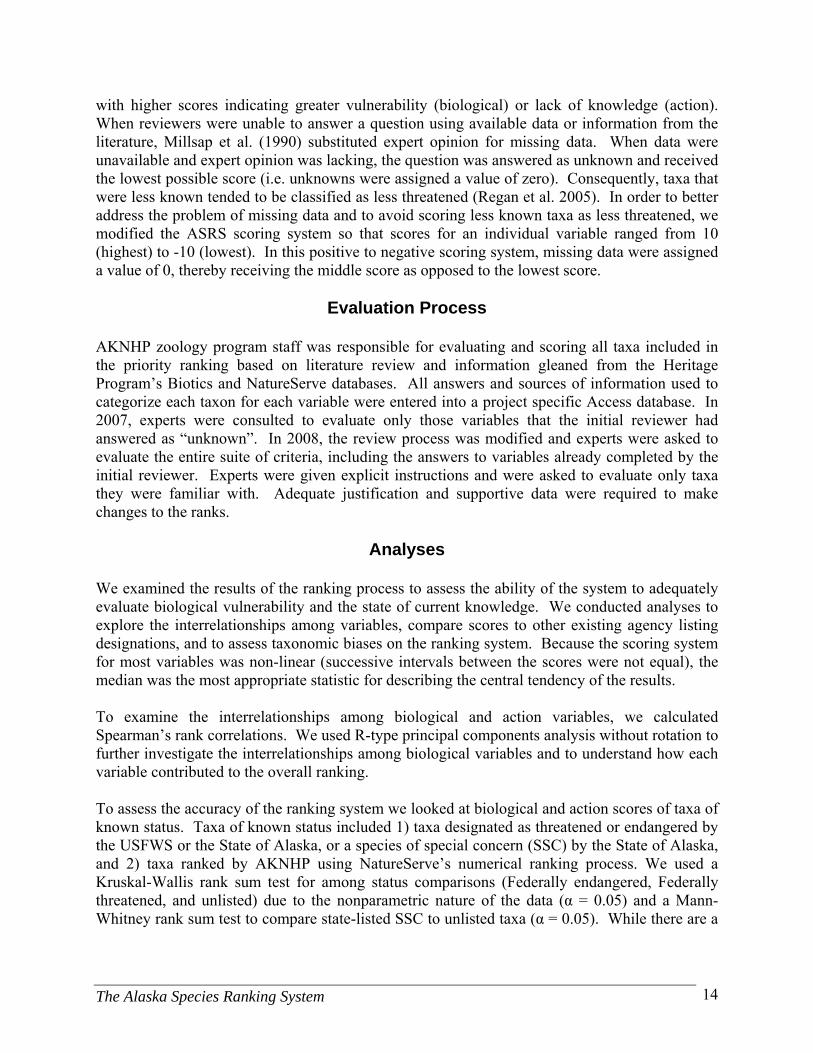
To examine the degree of association among variables, we computed Spearman’s rank correlations for both biological and action variables. We found no strong correlations among the biological variables (r > 0.50; Table 4) or the action variables (r > 0.50; Table 5). However, there were moderately strong associations between population size and range size for the biological scores (r = 0.47; Table 4) and survey and monitoring action scores (r = 0.42; Table 5).
The Alaska Species Ranking System 16
Table 4. Spearman’s rank correlations between biological variables.
Population size
Population trend
Range size Distribution trend
Population concentration
Reproductive potential
Ecological specialization
Percent global
Population size 1.00 0.01 0.47** 0.14** 0.03 0.00 -0.07 0.13*Population trend 1.00 -0.05 0.18** 0.22** 0.15** 0.04 0.04Range size 1.00 0.14* 0.15** -0.21** -0.04 0.39**Distribution trend 1.00 -0.03 -0.07 0.08 0.12*Population concentration 1.00 0.36** 0.18** 0.02Reproductive potential 1.00 0.24** -0.23**Ecological specialization 1.00 -0.01Percent global 1.00**. Correlation is significant at the 0.01 level (2-tailed).*. Correlation is significant at the 0.05 level (2-tailed).
Biological variables
Table 5. Spearman’s rank correlations between action variables.
Survey Monitoring Reseach Management
Survey 1.00 0.42** 0.20** 0.21**Monitoring 1.00 0.21** 0.37**Research 1.00 0.31**Management 1.00**. Correlation is significant at the 0.01 level (2-tailed).*. Correlation is significant at the 0.05 level (2-tailed).
Action variables
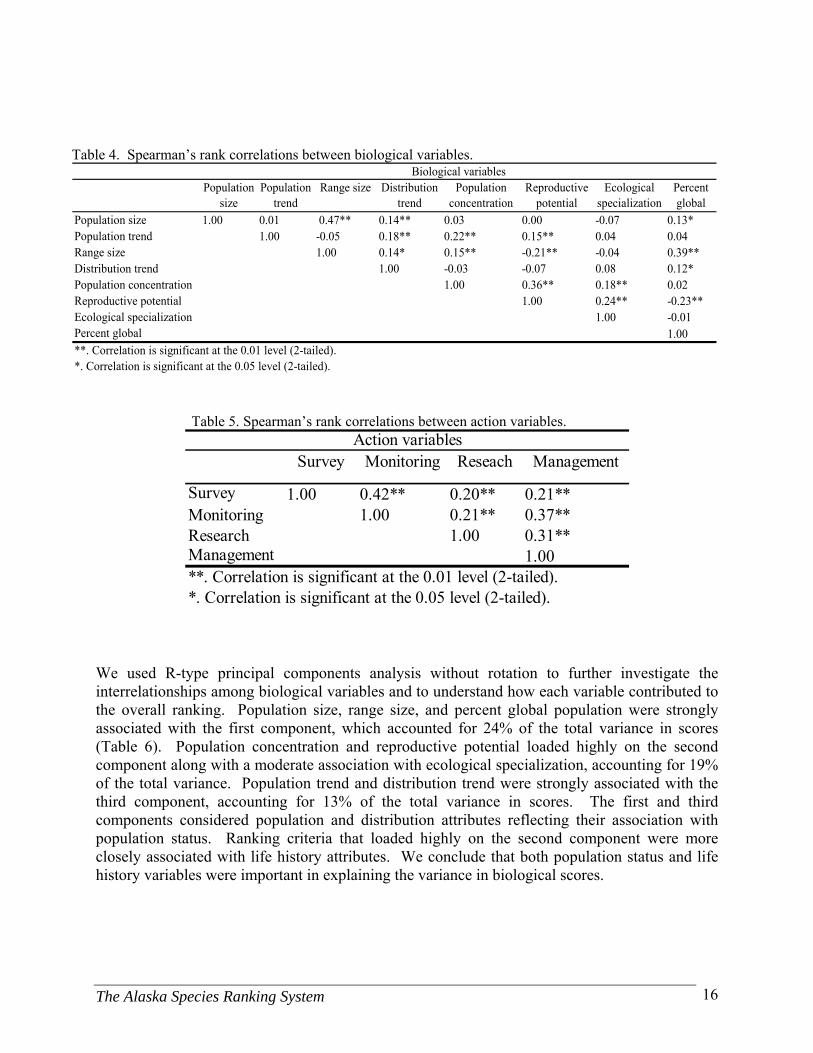
We used R-type principal components analysis without rotation to further investigate the interrelationships among biological variables and to understand how each variable contributed to the overall ranking. Population size, range size, and percent global population were strongly associated with the first component, which accounted for 24% of the total variance in scores (Table 6). Population concentration and reproductive potential loaded highly on the second component along with a moderate association with ecological specialization, accounting for 19% of the total variance. Population trend and distribution trend were strongly associated with the third component, accounting for 13% of the total variance in scores. The first and third components considered population and distribution attributes reflecting their association with population status. Ranking criteria that loaded highly on the second component were more closely associated with life history attributes. We conclude that both population status and life history variables were important in explaining the variance in biological scores.
The Alaska Species Ranking System 17
Table 6. Unrotated factor loadings of biological variables based on R-type principal components analysis of the correlation matrix. Shaded cells indicate which component the factor was most associated with.
I II IIIEigenvalue: 1.9 1.6 1.1% variance: 24.3 19.4 13.3
Population size 0.63 0.20 -0.30Population trend 0.06 0.51 0.59Range size 0.87 0.03 -0.23Distribution trend 0.34 0.25 0.67Population concentration 0.09 0.75 -0.28Reproductive potential -0.36 0.65 -0.26Ecological specialization -0.14 0.47 -0.05Percent global 0.72 -0.04 0.06
Component
Millsap et al. (1990) observed similar divisions between population status and life history components. However, in their analyses, population trend and distribution trend were associated with the first component and accounted for a higher percent of the variance than for the same variables in the ASRS. In our study, population status variables were separated into two components with population and distribution trend associated with the third component. The separation of these two variables into a third component was attributed to the high number of “unknowns” for the categories distribution trend and population trend (distribution trend “unknowns” = 218, population trend “unknowns” = 146). With improved knowledge of population and distribution trends in Alaska, we would expect to see a rise in the percent of the total variance attributed to these two variables. We also suspect that analyses of biological variables may have been affected by a taxonomic imbalance in the nominee species list, which was skewed towards birds and endemic small mammals.
Accuracy of Biological and Action Scores
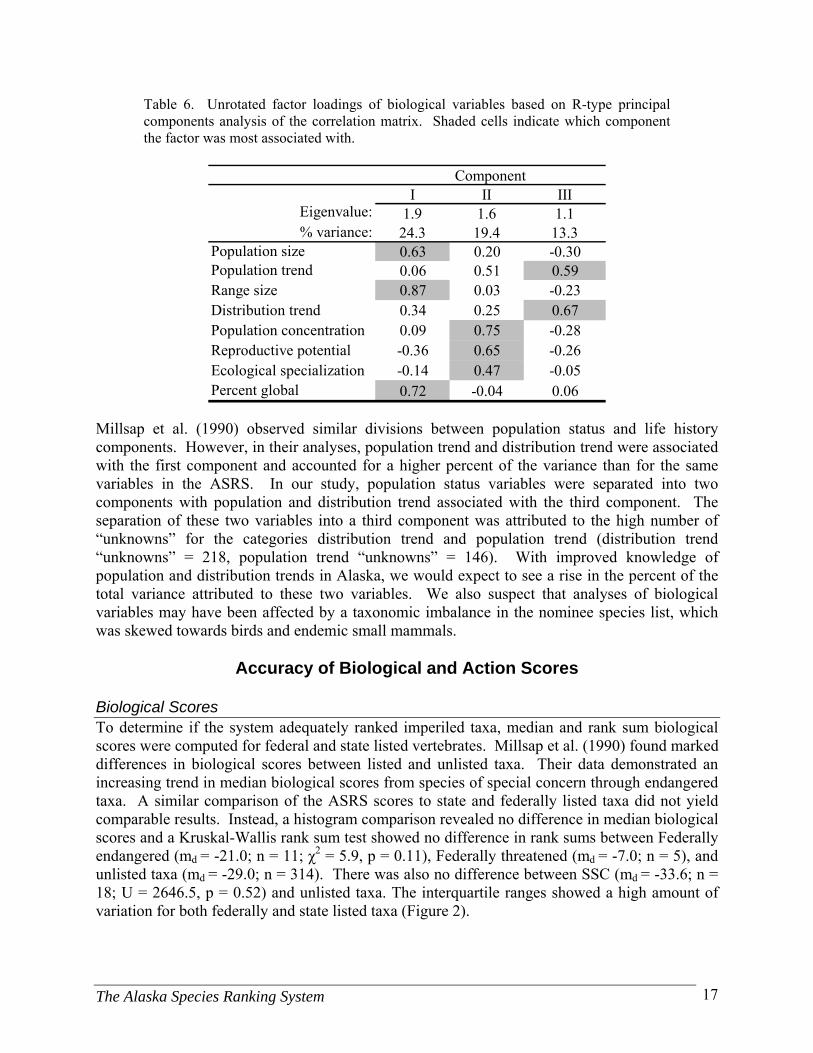
Biological Scores To determine if the system adequately ranked imperiled taxa, median and rank sum biological scores were computed for federal and state listed vertebrates. Millsap et al. (1990) found marked differences in biological scores between listed and unlisted taxa. Their data demonstrated an increasing trend in median biological scores from species of special concern through endangered taxa. A similar comparison of the ASRS scores to state and federally listed taxa did not yield comparable results. Instead, a histogram comparison revealed no difference in median biological scores and a Kruskal-Wallis rank sum test showed no difference in rank sums between Federally endangered (md = -21.0; n = 11; χ2 = 5.9, p = 0.11), Federally threatened (md = -7.0; n = 5), and unlisted taxa (md = -29.0; n = 314). There was also no difference between SSC (md = -33.6; n = 18; U = 2646.5, p = 0.52) and unlisted taxa. The interquartile ranges showed a high amount of variation for both federally and state listed taxa (Figure 2).
The Alaska Species Ranking System 18
The lack of a difference in biological scores between federally listed and unlisted taxa was attributed to the large portion of federally listed taxa that principally occur outside of Alaska (e.g. 8 of the 16 federally listed taxa in the state have less than 25% of their global population in the state). Compared to Florida, Alaska likely has a higher probability of having federally listed taxa that are not necessarily imperiled in the state, but face challenges elsewhere in their range. The lack of a difference in biological scores between unlisted and SSC was attributed to the fact that the state list has not been updated since 1998. Development of this ranking system was partially motivated by the need for an objective state listing process in Alaska. The large number of unlisted biologically vulnerable endemics on the ranking list and small sample sizes also likely contributed to the lack of a difference between listed and unlisted taxa.
Figure 2. Histogram of median biological scores for federal and state listed taxa. Error bars are interquartile ranges. LE = Federally-listed endangered (n = 11), LT = Federally- listed threatened (n = 5), SSC = State listed species of special concern (n = 18), unlisted (n = 314).
A more meaningful evaluation of the ASRS to adequately identify taxa of concern was a comparison of median biological scores to NatureServe’s conservation status ranking system. The NatureServe ranking system designates the conservation status of a taxon by a number ranging from 1 to 5 (1 = critically imperiled to 5 = demonstrably widespread, abundant, and secure), preceded by a letter reflecting the appropriate geographic scale of the assessment (G = Global, S = Subnational; see Appendix V for full definitions of the categories). G ranks consider the relative imperilment of a taxon across its global range, while S ranks consider the status of the taxa only within the state. In contrast to state and federal threatened, endangered and SSC designations, G and S ranks allow for comparisons among a range of status designations and conditions (i.e. critically imperiled to vulnerable to secure). S ranks are based on status only within Alaska, avoiding a comparison with designations that are based on status at the global
The Alaska Species Ranking System 19
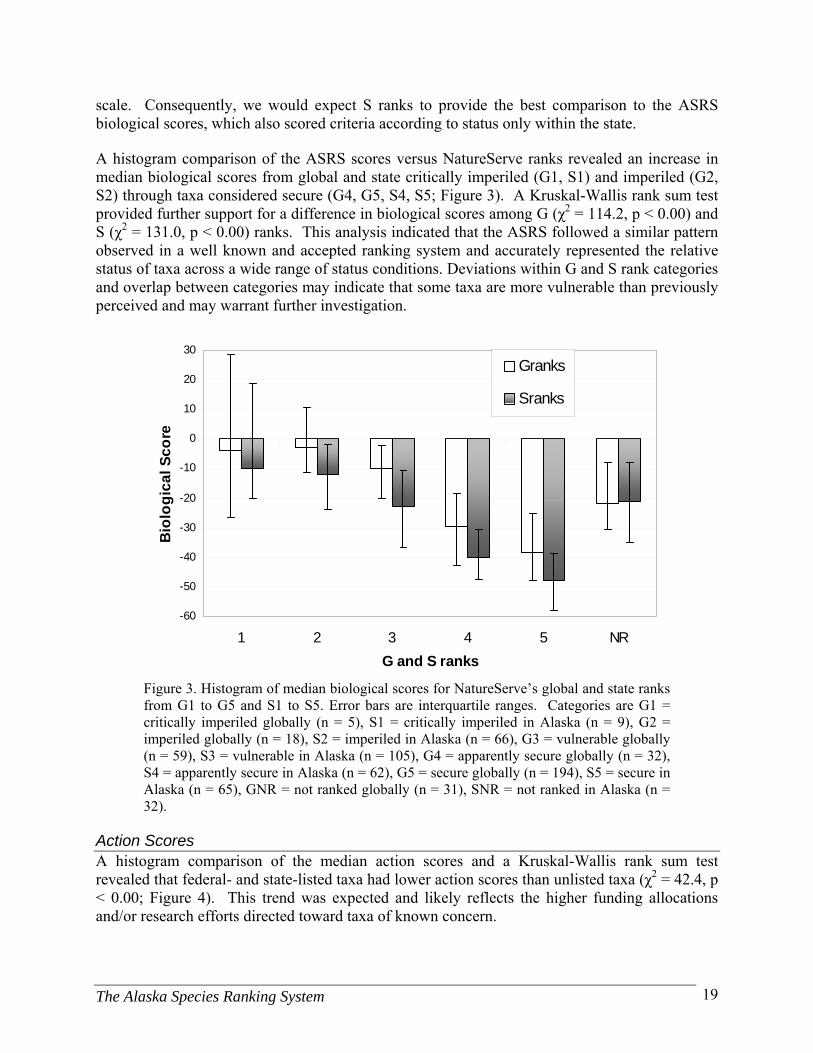
scale. Consequently, we would expect S ranks to provide the best comparison to the ASRS biological scores, which also scored criteria according to status only within the state.
A histogram comparison of the ASRS scores versus NatureServe ranks revealed an increase in median biological scores from global and state critically imperiled (G1, S1) and imperiled (G2, S2) through taxa considered secure (G4, G5, S4, S5; Figure 3). A Kruskal-Wallis rank sum test provided further support for a difference in biological scores among G (χ2 = 114.2, p < 0.00) and S (χ2 = 131.0, p < 0.00) ranks. This analysis indicated that the ASRS followed a similar pattern observed in a well known and accepted ranking system and accurately represented the relative status of taxa across a wide range of status conditions. Deviations within G and S rank categories and overlap between categories may indicate that some taxa are more vulnerable than previously perceived and may warrant further investigation.
Figure 3. Histogram of median biological scores for NatureServe’s global and state ranks from G1 to G5 and S1 to S5. Error bars are interquartile ranges. Categories are G1 = critically imperiled globally (n = 5), S1 = critically imperiled in Alaska (n = 9), G2 = imperiled globally (n = 18), S2 = imperiled in Alaska (n = 66), G3 = vulnerable globally (n = 59), S3 = vulnerable in Alaska (n = 105), G4 = apparently secure globally (n = 32), S4 = apparently secure in Alaska (n = 62), G5 = secure globally (n = 194), S5 = secure in Alaska (n = 65), GNR = not ranked globally (n = 31), SNR = not ranked in Alaska (n = 32).
Action Scores A histogram comparison of the median action scores and a Kruskal-Wallis rank sum test revealed that federal- and state-listed taxa had lower action scores than unlisted taxa (χ2 = 42.4, p < 0.00; Figure 4). This trend was expected and likely reflects the higher funding allocations and/or research efforts directed toward taxa of known concern.
-60
-50
-40
-30
-20
-10
0
10
20
30
1 2 3 4 5 NR
G and S ranks
Bio
log
ica
l S
co
re
Granks
Sranks

The Alaska Species Ranking System 20
Figure 4. Histogram of median action scores for federal- and state-listed taxa. Error bars are interquartile ranges. LE = Federally-listed endangered (n = 11), LT = Federally-listed threatened (n = 5), SSC = State-listed species of special concern (n = 18), unlisted (n = 314).
Comparisons among Taxa
To assess whether there were trends in scores among higher taxonomic categories, we compared biological and action scores among the three classes: birds, mammals and amphibians. It is important to note that within the nominee list, there were likely preexisting taxonomic biases which may have affected these results. For example, the mammal nominee list was heavily weighted towards small endemic and marine mammals while large terrestrial mammals were under-represented. Most orders and families of birds were well represented, with the exception of waterfowl (family Anatidae). Biological Scores Overall, median biological scores ranged from -15.0 to -35.0 for all taxa (Figure 5). Within class variation is represented by the broad overlap of interquartile ranges. Biological scores were higher for mammals (md = -15.0; range = -64.0, 42.0; n = 122; U = 8381.0, p < 0.00) compared to birds (md = -35.0; range = -72.0, 27.0; n = 213). While median biological scores were also lower for amphibians (md = -30.5; range = -70.2, -9.0; n = 6), a small sample size likely precluded a significant Mann-Whitney rank sum test (U = 624.5, p = 0.93). We attributed the higher biological scores for mammals to a high proportion of endemic mammal species and subspecies included in the ranking (46% of mammals compared to 7% of birds and 0% of amphibians). Because of this apparent disparity, we wanted to test the assumption that differences in biological scores were influenced by the high proportion of endemic mammals on the nominee species list. To do so, we removed all endemic taxa from the analysis and then
The Alaska Species Ranking System 21
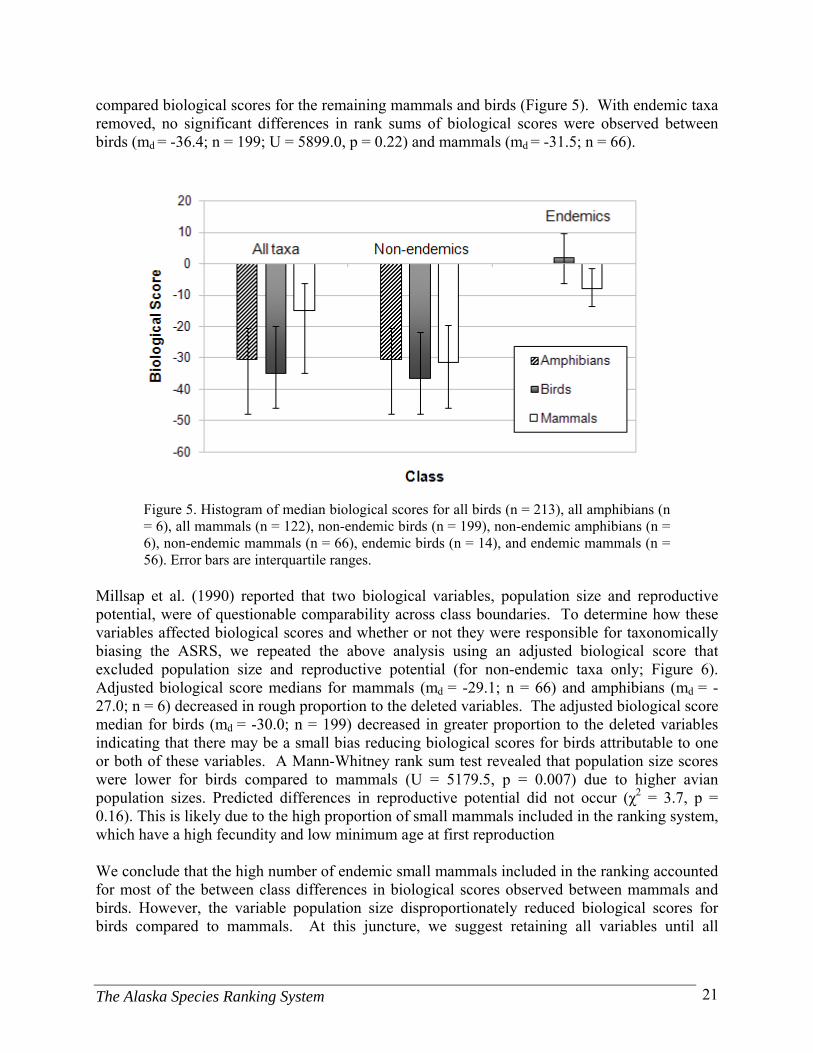
compared biological scores for the remaining mammals and birds (Figure 5). With endemic taxa removed, no significant differences in rank sums of biological scores were observed between birds (md = -36.4; n = 199; U = 5899.0, p = 0.22) and mammals (md = -31.5; n = 66).
Figure 5. Histogram of median biological scores for all birds (n = 213), all amphibians (n = 6), all mammals (n = 122), non-endemic birds (n = 199), non-endemic amphibians (n = 6), non-endemic mammals (n = 66), endemic birds (n = 14), and endemic mammals (n = 56). Error bars are interquartile ranges.
Millsap et al. (1990) reported that two biological variables, population size and reproductive potential, were of questionable comparability across class boundaries. To determine how these variables affected biological scores and whether or not they were responsible for taxonomically biasing the ASRS, we repeated the above analysis using an adjusted biological score that excluded population size and reproductive potential (for non-endemic taxa only; Figure 6). Adjusted biological score medians for mammals (md = -29.1; n = 66) and amphibians (md = -27.0; n = 6) decreased in rough proportion to the deleted variables. The adjusted biological score median for birds (md = -30.0; n = 199) decreased in greater proportion to the deleted variables indicating that there may be a small bias reducing biological scores for birds attributable to one or both of these variables. A Mann-Whitney rank sum test revealed that population size scores were lower for birds compared to mammals (U = 5179.5, p = 0.007) due to higher avian population sizes. Predicted differences in reproductive potential did not occur (χ2 = 3.7, p = 0.16). This is likely due to the high proportion of small mammals included in the ranking system, which have a high fecundity and low minimum age at first reproduction We conclude that the high number of endemic small mammals included in the ranking accounted for most of the between class differences in biological scores observed between mammals and birds. However, the variable population size disproportionately reduced biological scores for birds compared to mammals. At this juncture, we suggest retaining all variables until all

The Alaska Species Ranking System 22
vertebrate taxa can be scored and included in the analysis and a fair assessment of taxonomic bias can be conducted.
Figure 6. Histogram of biological scores and adjusted biological scores for non-endemic birds (n = 199), amphibians (n = 6), and mammals (n = 66).
Action Scores Median action scores for all classes ranged from 10.0 to 22.0. By class, birds had the lowest action scores (md = 10.0; range = -32.0, 34.0; n = 213; χ2 = 23.45, p < 0.00) due to the abundance of information available on many species and the legal protection afforded by the Migratory Bird Treaty Act (1918). Action scores for mammals (md = 22.0; range = -40.0, 40.0; n = 122; U = 8946.5, p < 0.00) were higher. While medians action scores for amphibians (md = 20.0; range = -2.0, 32.0; n = 6) were also higher, a small sample size likely precluded a significant Mann-Whitney rank sum test (U = 429.5, p = 0.170). Within class variation is represented by the broad overlap of interquartile ranges (Figure 7). To test the assumption that differences in action scores were due to the high proportion of endemic mammals in the ranking system, we compared action scores of mammals and birds excluding endemic taxa (Figure 7). By removing endemic taxa from the comparison, differences in action scores between birds (md = 12.0; n = 199; U = 0.633, p = 0.41) and mammals (md = 12.0; n = 66) were eliminated.

The Alaska Species Ranking System 23
EndemicsNon-endemicsAll taxa-10
-5
0
5
10
15
20
25
30
35
40
Class
Act
ion
sco
reAmphibiansBirdsMammals
Figure 7. Histogram of median action scores for all birds (n = 213), all amphibians (n = 6), all mammals (n = 122), non-endemic birds (n = 199), non-endemic amphibians (n = 6), non-endemic mammals (n = 66), endemic birds (n = 14), and endemic mammals (n = 56). Error bars are interquartile ranges.
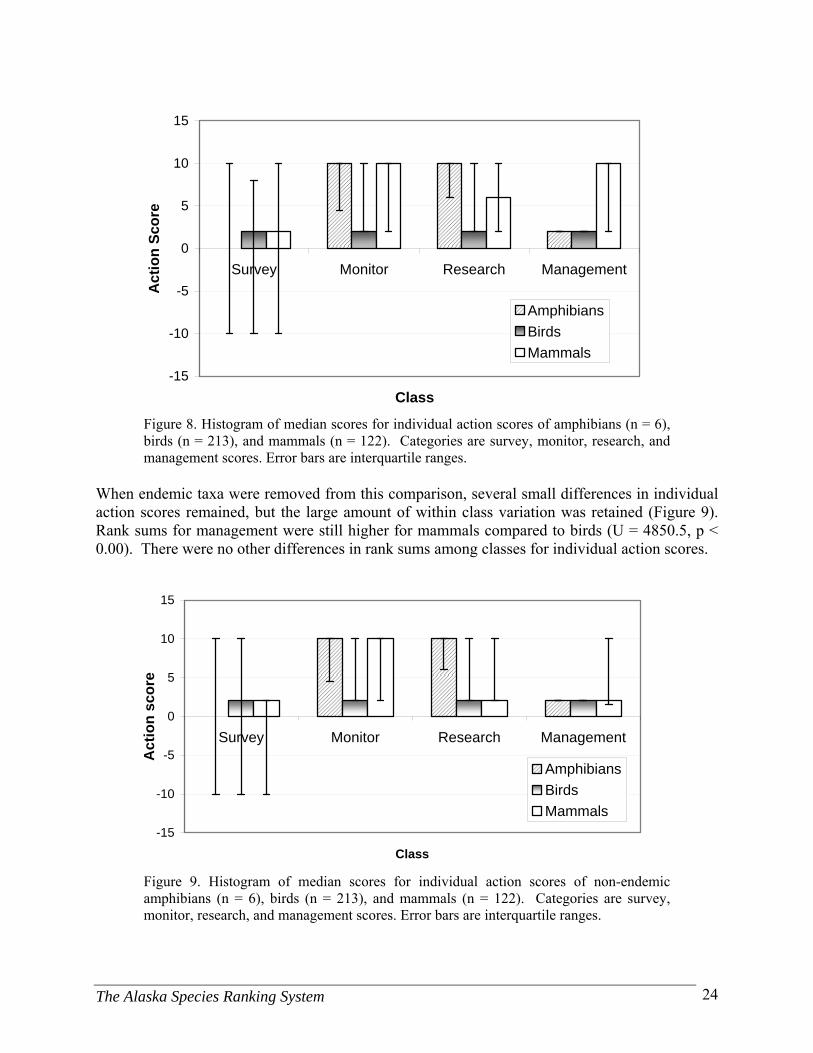
Within action scores, a histogram comparison revealed small differences among classes for the individual action criteria (Figure 8). However, large interquartile ranges demonstrated high within class variation suggesting that evaluation of action scores at the class level was too coarse to reveal any significant relationships. A comparison of action scores below the class level (i.e. within or between Order or Family) may be more meaningful. When analyzed using Mann-Whitney rank sum tests, the only statistically significant difference among classes for individual action scores was a higher management score for mammals compared to birds (U = 4850.5, p < 0.00). Again, this difference was likely due to the high degree of legal protection afforded to most birds by the Migratory Bird Treaty Act.
The Alaska Species Ranking System 24
-15
-10
-5
0
5
10
15
Survey Monitor Research Management
Class
Ac
tio
n S
core
Amphibians
Birds
Mammals
Figure 8. Histogram of median scores for individual action scores of amphibians (n = 6), birds (n = 213), and mammals (n = 122). Categories are survey, monitor, research, and management scores. Error bars are interquartile ranges.
When endemic taxa were removed from this comparison, several small differences in individual action scores remained, but the large amount of within class variation was retained (Figure 9). Rank sums for management were still higher for mammals compared to birds (U = 4850.5, p < 0.00). There were no other differences in rank sums among classes for individual action scores.
-15
-10
-5
0
5
10
15
Survey Monitor Research Management
Class
Act
ion
sco
re
Amphibians
Birds
Mammals
Figure 9. Histogram of median scores for individual action scores of non-endemic amphibians (n = 6), birds (n = 213), and mammals (n = 122). Categories are survey, monitor, research, and management scores. Error bars are interquartile ranges.

The Alaska Species Ranking System 25
Criteria Considerations and Suggestions
Productivity, Survival and Longevity During the review of the ranking criteria, there was some concern that average number of eggs or live young produced annually and age at first breeding did not adequately reflect reproductive potential because it did not capture offspring survival. Despite some resistance from reviewers, we elected to use the same reproductive potential criteria as employed by Millsap et al. (1990) and others (Lunney et al. 1996, Garrett and Wright 2000, Baldi et al. 2001). Millsap et al. (1990) acknowledged that reproductive potential would be better represented by including a productivity variable, but recognized that this type information was not consistently available across taxa. Instead, reproductive potential, as defined by Millsap et al. (1990), was used as an indicator of a taxon’s ability to rebound following a decline. For example, an amphibian that produces several hundred offspring will likely rebound much faster than a mammal that produces one or two offspring every other year. The biological criteria also failed to reflect adult survival and longevity. These important life history attributes contribute to differences in biological vulnerability among taxa and are relevant to the interpretation of population size. While we acknowledge that the inclusion of a variable to score survival and longevity could potentially improve the ranking system, longevity and survival are largely unknown for most taxa. We felt that trying to answer questions about survival and longevity would do little to improve upon the ability to distinguish fine differences in status. Peripheral Designation The category “Peripheral taxa” was included as a sorting variable to safeguard against producing misleading results by using straight biological and action scores for management decision making. As expected, peripheral populations of globally widespread and secure species received some of the highest biological and action scores. High biological scores were often due to restricted range sizes and small population sizes and the high action scores were often due to the lack of survey, monitoring, research, and/or management efforts. In contrast, conservation and research efforts for some taxa designated as peripheral may be unequivocally warranted. Such cases may arise when: 1) taxa are rare or endangered in the core of their range, but secure at the periphery; 2) environmental changes result in range shifts from periphery to core; 3) inventories reveal that a taxa is more widespread than previously perceived; 4) taxa on the periphery of their range are numerically significant; or 5) the peripheral population contributes to the genetic diversity of the taxa. To determine the importance of peripheral populations to the long-term survival of the taxa and to make well-informed management decisions, it is imperative to consider population size, status elsewhere, changing environmental conditions, knowledge regarding distribution, and evolutionary significance (Fraser 2000).
The Alaska Species Ranking System 26
Using the ASRS as a Conservation Decision Support Tool
To provide ADF&G with an alternative mechanism for evaluating top candidates for conservation action other than just straight biological or action scores (as presented in Appendix III and IV, respectively), we devised a categorical approach that used action and biological scores and supplemental variables to answer a variety of questions regarding the conservation of Alaska’s wildlife. Although the categorical approach used a combination of biological and action scores to identify candidate taxa for conservation action, biological and action scores remained independent and were not summed. Biological and action scores were designated as low (1/3 lowest scores), moderate (1/3 middle scores), or high (1/3 highest scores), then used in combination to satisfy the following criteria:
Category I - High need. Taxa in this category have moderate to high biological vulnerability and are in moderate to high action need. Alaska also has high global stewardship responsibility to these taxa with greater than 25% of the global population occurring in the state.
Category II - High biological vulnerability. Taxa in this category have moderate to high biological vulnerability, but low action scores. Alaska also has high global stewardship responsibility to these taxa with greater than 25% of the global population occurring in the state. Category III - High action need. Taxa in this category have moderate to high action scores, but low biological scores. Alaska also has high global stewardship responsibility to these taxa with greater than 25% of the global population occurring in the state. Category IV - Low need. Taxa in this category have low biological and low action scores denoting low biological vulnerability and low need for action. Category V - Peripheral. Taxa in this category are regarded as peripheral. Peripheral taxa are defined as taxa that are on the edge of their range with less than 10% of their global range known to occur in Alaska. Category VI - Migrants with small population sizes. Taxa that migrate through Alaska in very small numbers (< 1,000) and have less than 25% of global population in Alaska.
Category classifications were calculated for all taxa (Table 7) and also for taxa at the species level only (Table 8).
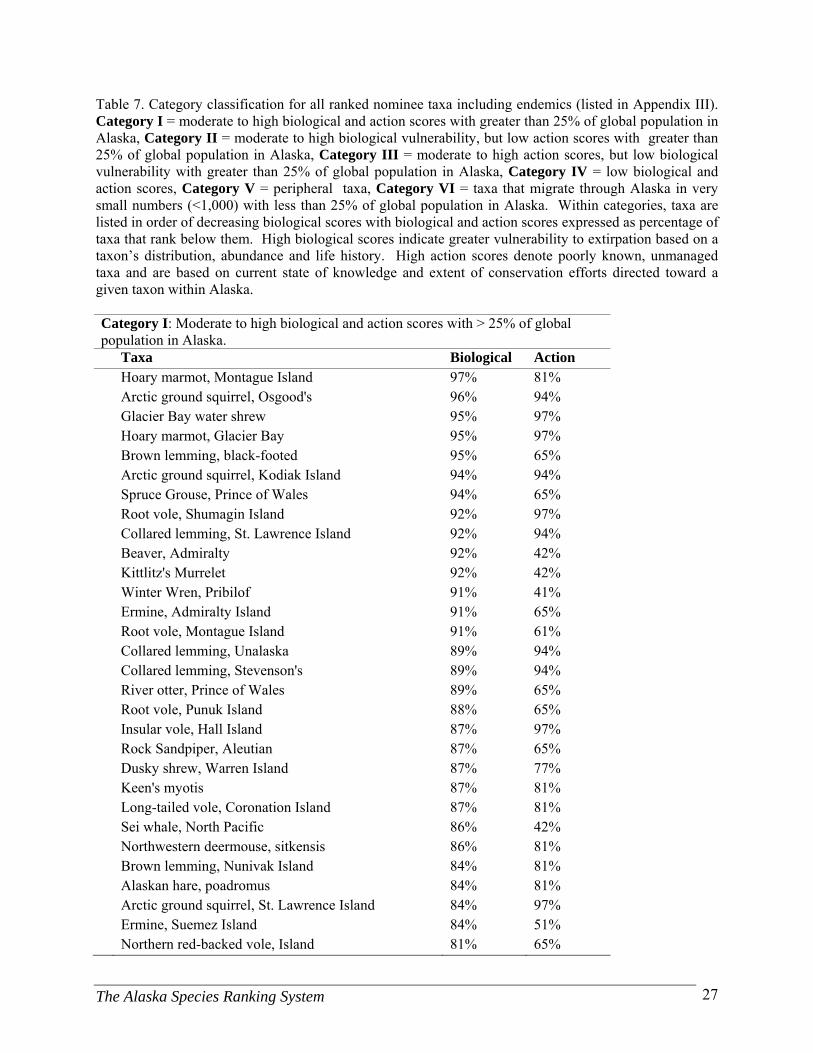
The Alaska Species Ranking System 27
Table 7. Category classification for all ranked nominee taxa including endemics (listed in Appendix III). Category I = moderate to high biological and action scores with greater than 25% of global population in Alaska, Category II = moderate to high biological vulnerability, but low action scores with greater than 25% of global population in Alaska, Category III = moderate to high action scores, but low biological vulnerability with greater than 25% of global population in Alaska, Category IV = low biological and action scores, Category V = peripheral taxa, Category VI = taxa that migrate through Alaska in very small numbers (<1,000) with less than 25% of global population in Alaska. Within categories, taxa are listed in order of decreasing biological scores with biological and action scores expressed as percentage of taxa that rank below them. High biological scores indicate greater vulnerability to extirpation based on a taxon’s distribution, abundance and life history. High action scores denote poorly known, unmanaged taxa and are based on current state of knowledge and extent of conservation efforts directed toward a given taxon within Alaska. Category I: Moderate to high biological and action scores with > 25% of global population in Alaska. Taxa Biological Action Hoary marmot, Montague Island 97% 81% Arctic ground squirrel, Osgood's 96% 94% Glacier Bay water shrew 95% 97% Hoary marmot, Glacier Bay 95% 97% Brown lemming, black-footed 95% 65% Arctic ground squirrel, Kodiak Island 94% 94% Spruce Grouse, Prince of Wales 94% 65% Root vole, Shumagin Island 92% 97% Collared lemming, St. Lawrence Island 92% 94% Beaver, Admiralty 92% 42% Kittlitz's Murrelet 92% 42% Winter Wren, Pribilof 91% 41% Ermine, Admiralty Island 91% 65% Root vole, Montague Island 91% 61% Collared lemming, Unalaska 89% 94% Collared lemming, Stevenson's 89% 94% River otter, Prince of Wales 89% 65% Root vole, Punuk Island 88% 65% Insular vole, Hall Island 87% 97% Rock Sandpiper, Aleutian 87% 65% Dusky shrew, Warren Island 87% 77% Keen's myotis 87% 81% Long-tailed vole, Coronation Island 87% 81% Sei whale, North Pacific 86% 42% Northwestern deermouse, sitkensis 86% 81% Brown lemming, Nunivak Island 84% 81% Alaskan hare, poadromus 84% 81% Arctic ground squirrel, St. Lawrence Island 84% 97% Ermine, Suemez Island 84% 51% Northern red-backed vole, Island 81% 65%
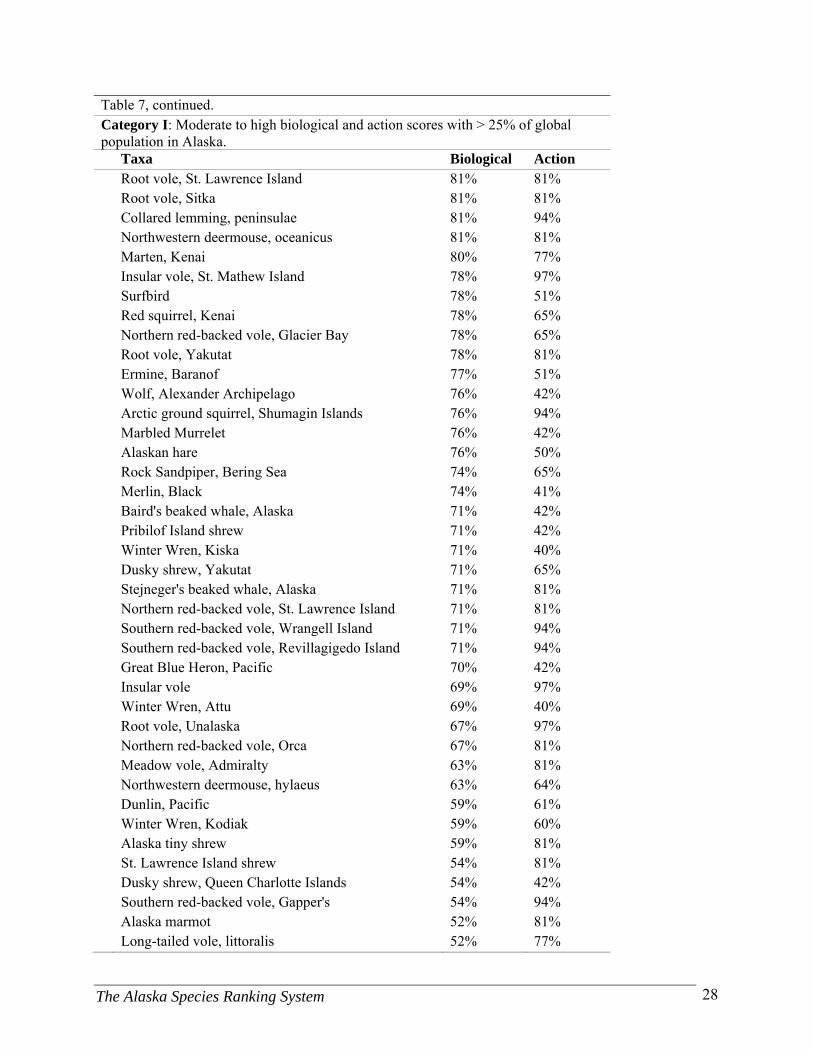
The Alaska Species Ranking System 28
Table 7, continued. Category I: Moderate to high biological and action scores with > 25% of global population in Alaska. Taxa Biological Action Root vole, St. Lawrence Island 81% 81% Root vole, Sitka 81% 81% Collared lemming, peninsulae 81% 94% Northwestern deermouse, oceanicus 81% 81% Marten, Kenai 80% 77% Insular vole, St. Mathew Island 78% 97% Surfbird 78% 51% Red squirrel, Kenai 78% 65% Northern red-backed vole, Glacier Bay 78% 65% Root vole, Yakutat 78% 81% Ermine, Baranof 77% 51% Wolf, Alexander Archipelago 76% 42% Arctic ground squirrel, Shumagin Islands 76% 94% Marbled Murrelet 76% 42% Alaskan hare 76% 50% Rock Sandpiper, Bering Sea 74% 65% Merlin, Black 74% 41% Baird's beaked whale, Alaska 71% 42% Pribilof Island shrew 71% 42% Winter Wren, Kiska 71% 40% Dusky shrew, Yakutat 71% 65% Stejneger's beaked whale, Alaska 71% 81% Northern red-backed vole, St. Lawrence Island 71% 81% Southern red-backed vole, Wrangell Island 71% 94% Southern red-backed vole, Revillagigedo Island 71% 94% Great Blue Heron, Pacific 70% 42% Insular vole 69% 97% Winter Wren, Attu 69% 40% Root vole, Unalaska 67% 97% Northern red-backed vole, Orca 67% 81% Meadow vole, Admiralty 63% 81% Northwestern deermouse, hylaeus 63% 64% Dunlin, Pacific 59% 61% Winter Wren, Kodiak 59% 60% Alaska tiny shrew 59% 81% St. Lawrence Island shrew 54% 81% Dusky shrew, Queen Charlotte Islands 54% 42% Southern red-backed vole, Gapper's 54% 94% Alaska marmot 52% 81% Long-tailed vole, littoralis 52% 77%
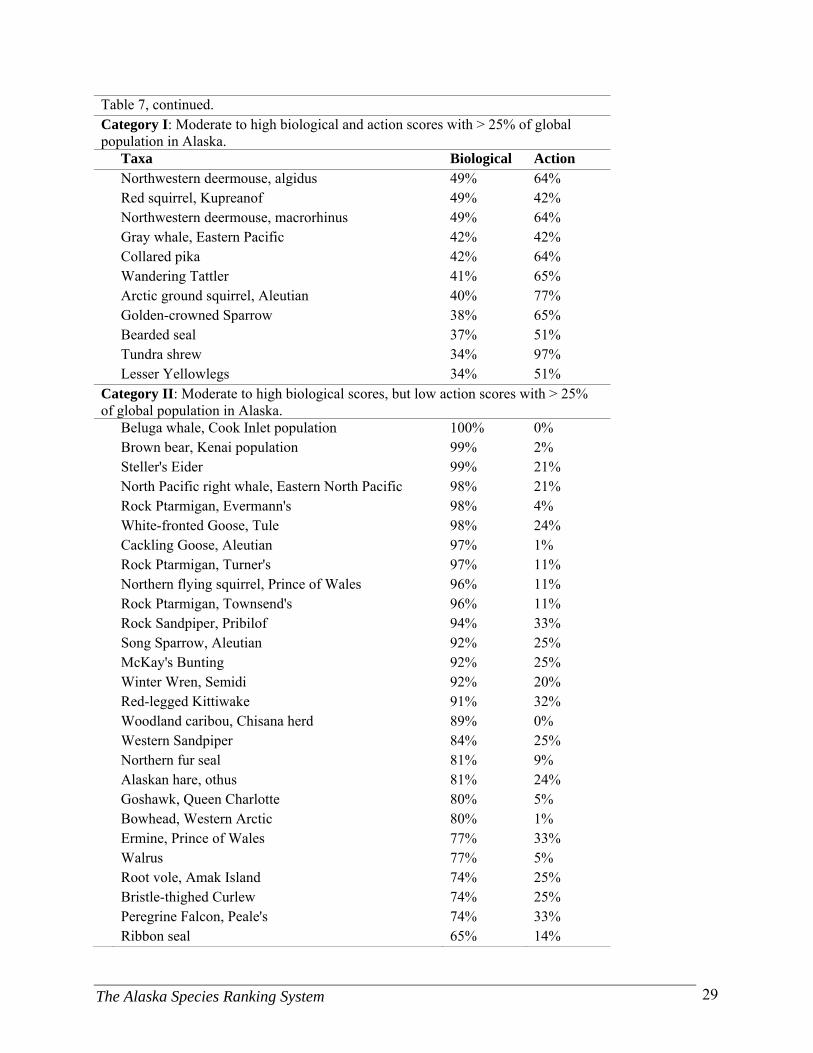
The Alaska Species Ranking System 29
Table 7, continued. Category I: Moderate to high biological and action scores with > 25% of global population in Alaska. Taxa Biological Action Northwestern deermouse, algidus 49% 64% Red squirrel, Kupreanof 49% 42% Northwestern deermouse, macrorhinus 49% 64% Gray whale, Eastern Pacific 42% 42% Collared pika 42% 64% Wandering Tattler 41% 65% Arctic ground squirrel, Aleutian 40% 77% Golden-crowned Sparrow 38% 65% Bearded seal 37% 51% Tundra shrew 34% 97% Lesser Yellowlegs 34% 51%
Category II: Moderate to high biological scores, but low action scores with > 25% of global population in Alaska. Beluga whale, Cook Inlet population 100% 0% Brown bear, Kenai population 99% 2% Steller's Eider 99% 21% North Pacific right whale, Eastern North Pacific 98% 21% Rock Ptarmigan, Evermann's 98% 4% White-fronted Goose, Tule 98% 24% Cackling Goose, Aleutian 97% 1% Rock Ptarmigan, Turner's 97% 11% Northern flying squirrel, Prince of Wales 96% 11% Rock Ptarmigan, Townsend's 96% 11% Rock Sandpiper, Pribilof 94% 33% Song Sparrow, Aleutian 92% 25% McKay's Bunting 92% 25% Winter Wren, Semidi 92% 20% Red-legged Kittiwake 91% 32% Woodland caribou, Chisana herd 89% 0% Western Sandpiper 84% 25% Northern fur seal 81% 9% Alaskan hare, othus 81% 24% Goshawk, Queen Charlotte 80% 5% Bowhead, Western Arctic 80% 1% Ermine, Prince of Wales 77% 33% Walrus 77% 5% Root vole, Amak Island 74% 25% Bristle-thighed Curlew 74% 25% Peregrine Falcon, Peale's 74% 33% Ribbon seal 65% 14%
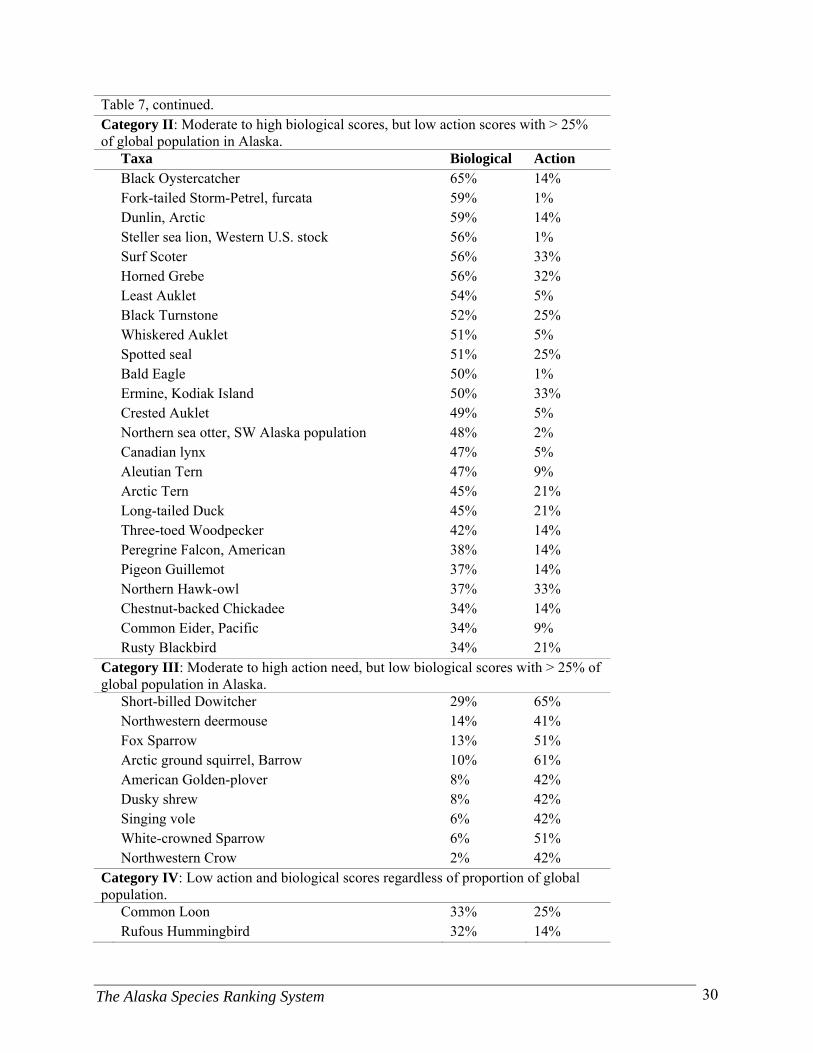
The Alaska Species Ranking System 30
Table 7, continued. Category II: Moderate to high biological scores, but low action scores with > 25% of global population in Alaska. Taxa Biological Action Black Oystercatcher 65% 14% Fork-tailed Storm-Petrel, furcata 59% 1% Dunlin, Arctic 59% 14% Steller sea lion, Western U.S. stock 56% 1% Surf Scoter 56% 33% Horned Grebe 56% 32% Least Auklet 54% 5% Black Turnstone 52% 25% Whiskered Auklet 51% 5% Spotted seal 51% 25% Bald Eagle 50% 1% Ermine, Kodiak Island 50% 33% Crested Auklet 49% 5% Northern sea otter, SW Alaska population 48% 2% Canadian lynx 47% 5% Aleutian Tern 47% 9% Arctic Tern 45% 21% Long-tailed Duck 45% 21% Three-toed Woodpecker 42% 14% Peregrine Falcon, American 38% 14% Pigeon Guillemot 37% 14% Northern Hawk-owl 37% 33% Chestnut-backed Chickadee 34% 14% Common Eider, Pacific 34% 9% Rusty Blackbird 34% 21%
Category III: Moderate to high action need, but low biological scores with > 25% of global population in Alaska. Short-billed Dowitcher 29% 65% Northwestern deermouse 14% 41% Fox Sparrow 13% 51% Arctic ground squirrel, Barrow 10% 61% American Golden-plover 8% 42% Dusky shrew 8% 42% Singing vole 6% 42% White-crowned Sparrow 6% 51% Northwestern Crow 2% 42%
Category IV: Low action and biological scores regardless of proportion of global population. Common Loon 33% 25% Rufous Hummingbird 32% 14%
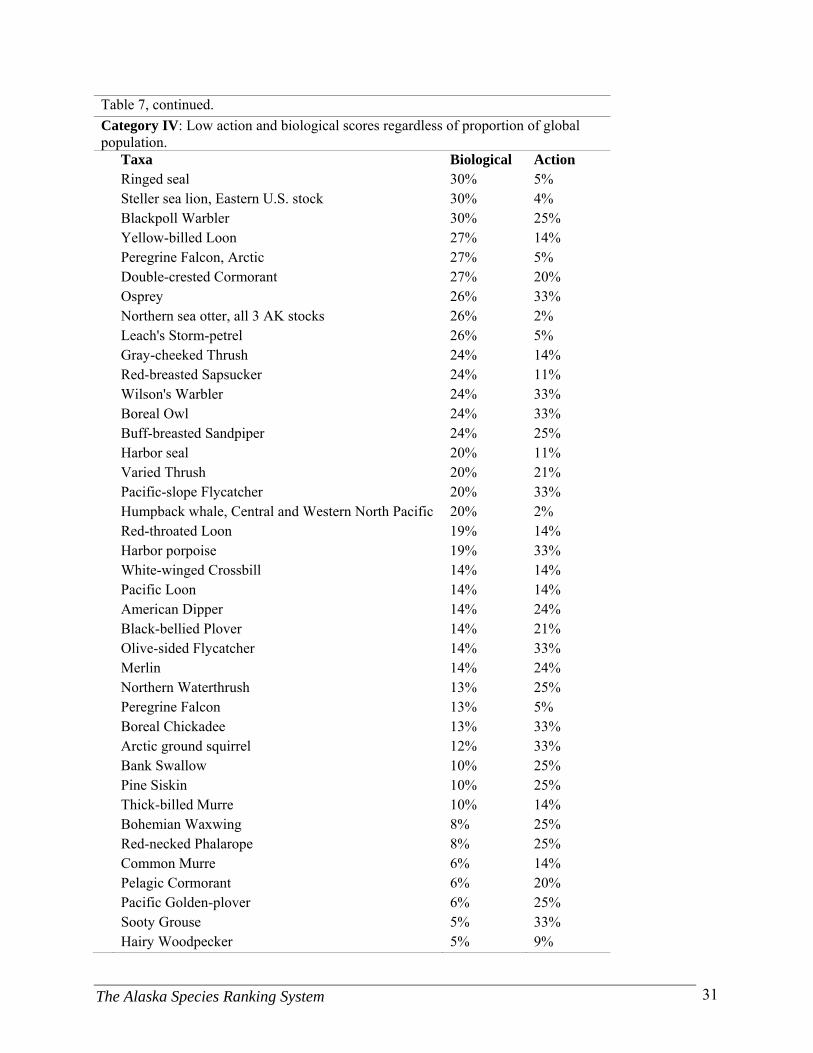
The Alaska Species Ranking System 31
Table 7, continued.
Category IV: Low action and biological scores regardless of proportion of global population. Taxa Biological Action Ringed seal 30% 5% Steller sea lion, Eastern U.S. stock 30% 4% Blackpoll Warbler 30% 25% Yellow-billed Loon 27% 14% Peregrine Falcon, Arctic 27% 5% Double-crested Cormorant 27% 20% Osprey 26% 33% Northern sea otter, all 3 AK stocks 26% 2% Leach's Storm-petrel 26% 5% Gray-cheeked Thrush 24% 14% Red-breasted Sapsucker 24% 11% Wilson's Warbler 24% 33% Boreal Owl 24% 33% Buff-breasted Sandpiper 24% 25% Harbor seal 20% 11% Varied Thrush 20% 21% Pacific-slope Flycatcher 20% 33% Humpback whale, Central and Western North Pacific 20% 2% Red-throated Loon 19% 14% Harbor porpoise 19% 33% White-winged Crossbill 14% 14% Pacific Loon 14% 14% American Dipper 14% 24% Black-bellied Plover 14% 21% Olive-sided Flycatcher 14% 33% Merlin 14% 24% Northern Waterthrush 13% 25% Peregrine Falcon 13% 5% Boreal Chickadee 13% 33% Arctic ground squirrel 12% 33% Bank Swallow 10% 25% Pine Siskin 10% 25% Thick-billed Murre 10% 14% Bohemian Waxwing 8% 25% Red-necked Phalarope 8% 25% Common Murre 6% 14% Pelagic Cormorant 6% 20% Pacific Golden-plover 6% 25% Sooty Grouse 5% 33% Hairy Woodpecker 5% 9%
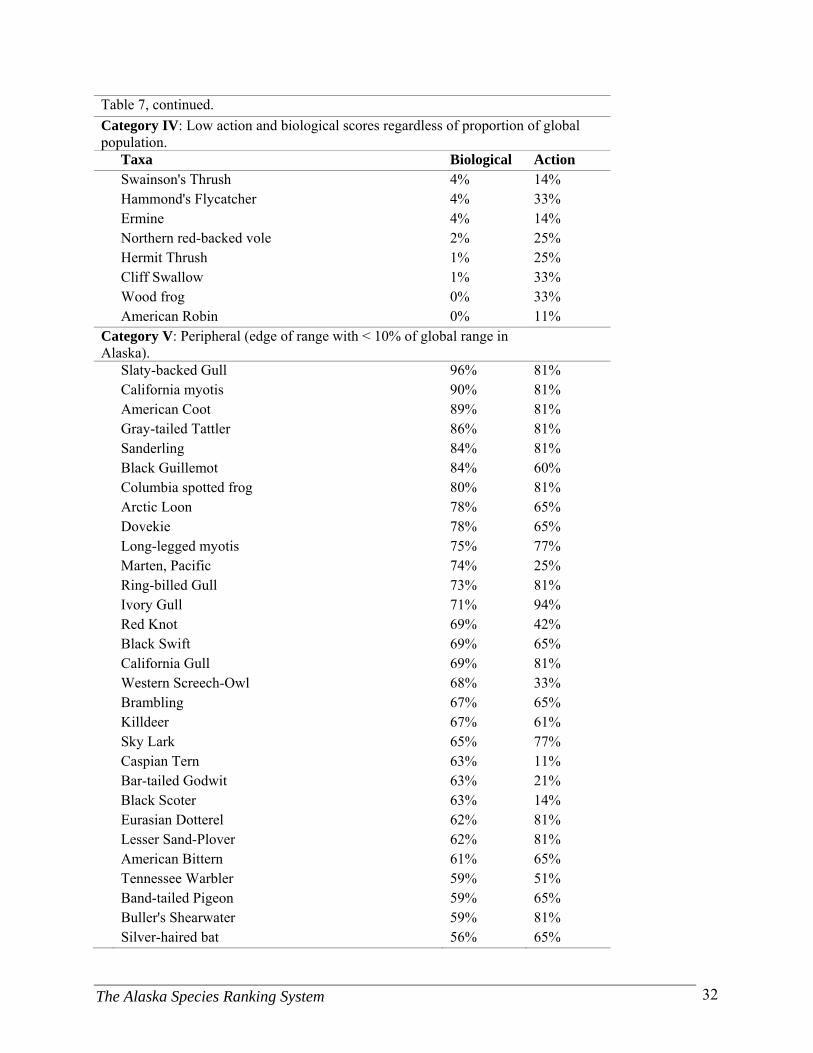
The Alaska Species Ranking System 32
Table 7, continued.
Category IV: Low action and biological scores regardless of proportion of global population. Taxa Biological Action Swainson's Thrush 4% 14% Hammond's Flycatcher 4% 33% Ermine 4% 14% Northern red-backed vole 2% 25% Hermit Thrush 1% 25% Cliff Swallow 1% 33% Wood frog 0% 33% American Robin 0% 11%
Category V: Peripheral (edge of range with < 10% of global range in Alaska).
Slaty-backed Gull 96% 81% California myotis 90% 81% American Coot 89% 81% Gray-tailed Tattler 86% 81% Sanderling 84% 81% Black Guillemot 84% 60% Columbia spotted frog 80% 81% Arctic Loon 78% 65% Dovekie 78% 65% Long-legged myotis 75% 77% Marten, Pacific 74% 25% Ring-billed Gull 73% 81% Ivory Gull 71% 94% Red Knot 69% 42% Black Swift 69% 65% California Gull 69% 81% Western Screech-Owl 68% 33% Brambling 67% 65% Killdeer 67% 61% Sky Lark 65% 77% Caspian Tern 63% 11% Bar-tailed Godwit 63% 21% Black Scoter 63% 14% Eurasian Dotterel 62% 81% Lesser Sand-Plover 62% 81% American Bittern 61% 65% Tennessee Warbler 59% 51% Band-tailed Pigeon 59% 65% Buller's Shearwater 59% 81% Silver-haired bat 56% 65%

The Alaska Species Ranking System 33
Table 7, continued.
Category V: Peripheral (edge of range with < 10% of global range in Alaska).
Taxa Biological Action Long-toed salamander 56% 77% Northwestern salamander 51% 81% Northern Saw-whet Owl 50% 33% Northern Pygmy-owl 50% 51% Red-winged Blackbird 50% 65% Red-eyed Vireo 47% 65% Upland Sandpiper 45% 81% Sora 44% 81% Roughskin newt 44% 42% Vaux's Swift 44% 51% Red Crossbill 42% 33% Yellow-bellied Sapsucker 42% 65% American Crow 42% 77% White-rumped Sandpiper 40% 51% Ross's Gull 40% 81% Swainson's Hawk 40% 77% Barred Owl 38% 50% Brown-headed Cowbird 36% 65% Barn Swallow 34% 51% Pied-billed Grebe 33% 81% American Redstart 30% 51% Southern red-backed vole 30% 77% Western toad 29% 20% Red-breasted Nuthatch 27% 33% White Wagtail 27% 81% Brown Creeper 24% 9% Northern Rough-winged Swallow 24% 77% Western Wood-pewee 23% 25% Anna's Hummingbird 23% 65% Golden-crowned Kinglet 20% 9% Water shrew 18% 81% Townsend's Warbler 14% 33% Arctic Warbler 14% 42% Mountain Bluebird 14% 60% Western Tanager 14% 81% Bluethroat 10% 81% Townsend's Solitaire 10% 65% Long-tailed vole 8% 61% Sharp-tailed Sandpiper 5% 81% Steller's Jay 4% 51%
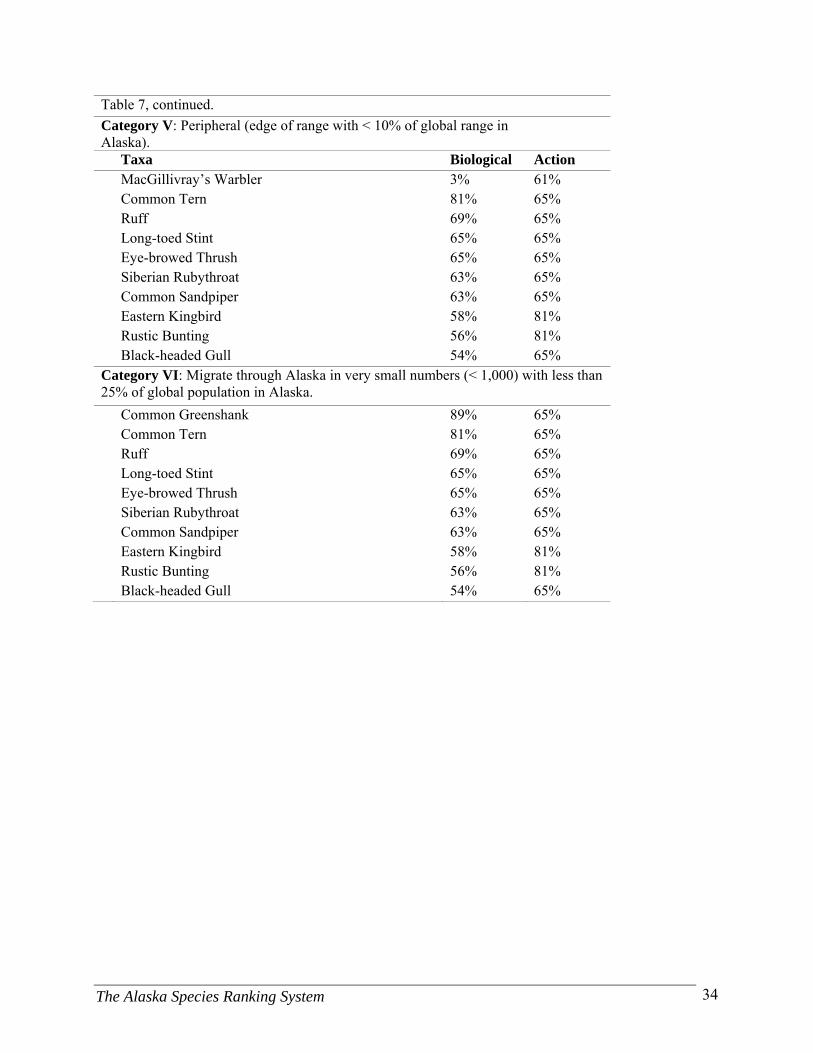
The Alaska Species Ranking System 34
Table 7, continued.
Category V: Peripheral (edge of range with < 10% of global range in Alaska).
Taxa Biological Action MacGillivray’s Warbler 3% 61% Common Tern 81% 65% Ruff 69% 65% Long-toed Stint 65% 65% Eye-browed Thrush 65% 65% Siberian Rubythroat 63% 65% Common Sandpiper 63% 65% Eastern Kingbird 58% 81% Rustic Bunting 56% 81% Black-headed Gull 54% 65%
Category VI: Migrate through Alaska in very small numbers (< 1,000) with less than 25% of global population in Alaska.
Common Greenshank 89% 65% Common Tern 81% 65% Ruff 69% 65% Long-toed Stint 65% 65% Eye-browed Thrush 65% 65% Siberian Rubythroat 63% 65% Common Sandpiper 63% 65% Eastern Kingbird 58% 81% Rustic Bunting 56% 81% Black-headed Gull 54% 65%
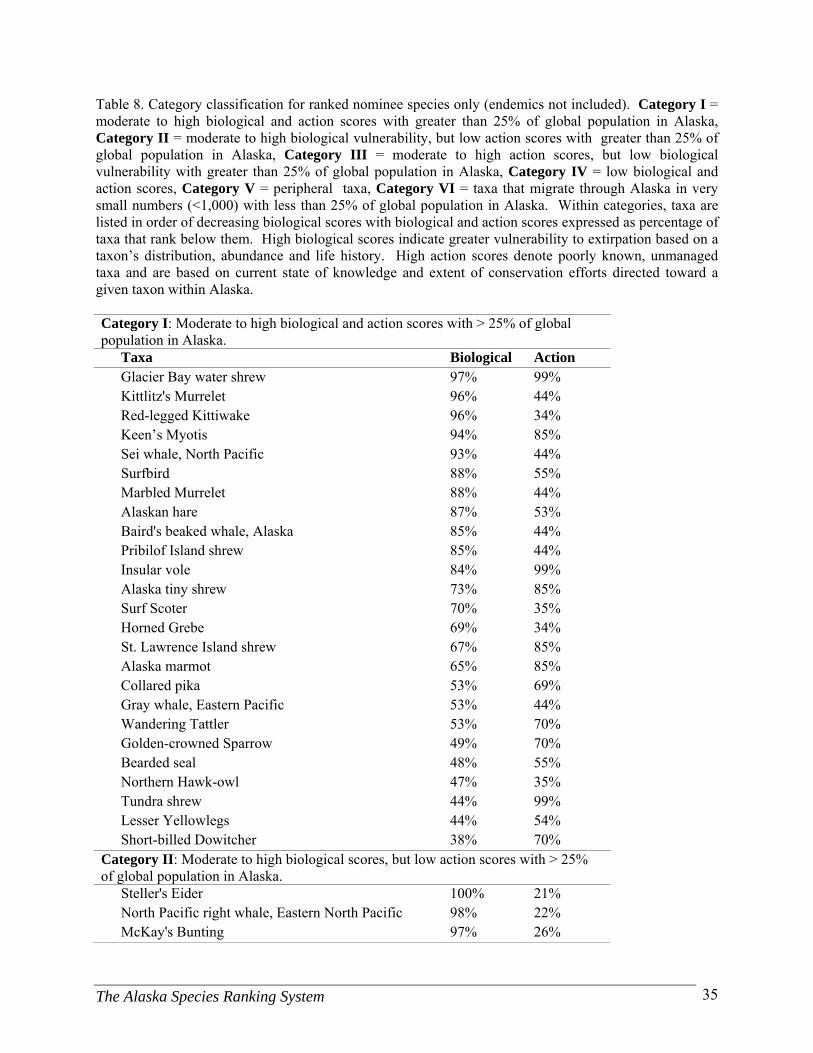
The Alaska Species Ranking System 35
Table 8. Category classification for ranked nominee species only (endemics not included). Category I = moderate to high biological and action scores with greater than 25% of global population in Alaska, Category II = moderate to high biological vulnerability, but low action scores with greater than 25% of global population in Alaska, Category III = moderate to high action scores, but low biological vulnerability with greater than 25% of global population in Alaska, Category IV = low biological and action scores, Category V = peripheral taxa, Category VI = taxa that migrate through Alaska in very small numbers (<1,000) with less than 25% of global population in Alaska. Within categories, taxa are listed in order of decreasing biological scores with biological and action scores expressed as percentage of taxa that rank below them. High biological scores indicate greater vulnerability to extirpation based on a taxon’s distribution, abundance and life history. High action scores denote poorly known, unmanaged taxa and are based on current state of knowledge and extent of conservation efforts directed toward a given taxon within Alaska. Category I: Moderate to high biological and action scores with > 25% of global population in Alaska. Taxa Biological Action Glacier Bay water shrew 97% 99% Kittlitz's Murrelet 96% 44% Red-legged Kittiwake 96% 34% Keen’s Myotis 94% 85% Sei whale, North Pacific 93% 44% Surfbird 88% 55% Marbled Murrelet 88% 44% Alaskan hare 87% 53% Baird's beaked whale, Alaska 85% 44% Pribilof Island shrew 85% 44% Insular vole 84% 99% Alaska tiny shrew 73% 85% Surf Scoter 70% 35% Horned Grebe 69% 34% St. Lawrence Island shrew 67% 85% Alaska marmot 65% 85% Collared pika 53% 69% Gray whale, Eastern Pacific 53% 44% Wandering Tattler 53% 70% Golden-crowned Sparrow 49% 70% Bearded seal 48% 55% Northern Hawk-owl 47% 35% Tundra shrew 44% 99% Lesser Yellowlegs 44% 54% Short-billed Dowitcher 38% 70%
Category II: Moderate to high biological scores, but low action scores with > 25% of global population in Alaska. Steller's Eider 100% 21% North Pacific right whale, Eastern North Pacific 98% 22% McKay's Bunting 97% 26%
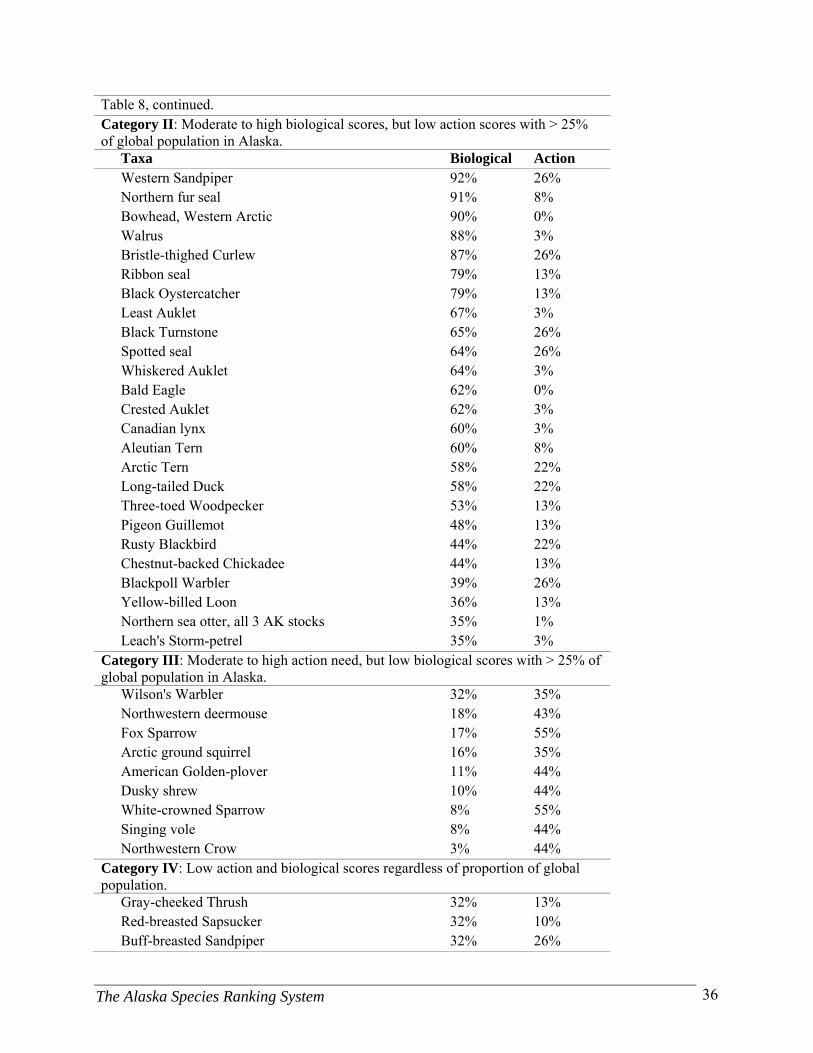
The Alaska Species Ranking System 36
Table 8, continued. Category II: Moderate to high biological scores, but low action scores with > 25% of global population in Alaska. Taxa Biological Action Western Sandpiper 92% 26% Northern fur seal 91% 8% Bowhead, Western Arctic 90% 0% Walrus 88% 3% Bristle-thighed Curlew 87% 26% Ribbon seal 79% 13% Black Oystercatcher 79% 13% Least Auklet 67% 3% Black Turnstone 65% 26% Spotted seal 64% 26% Whiskered Auklet 64% 3% Bald Eagle 62% 0% Crested Auklet 62% 3% Canadian lynx 60% 3% Aleutian Tern 60% 8% Arctic Tern 58% 22% Long-tailed Duck 58% 22% Three-toed Woodpecker 53% 13% Pigeon Guillemot 48% 13% Rusty Blackbird 44% 22% Chestnut-backed Chickadee 44% 13% Blackpoll Warbler 39% 26% Yellow-billed Loon 36% 13% Northern sea otter, all 3 AK stocks 35% 1% Leach's Storm-petrel 35% 3%
Category III: Moderate to high action need, but low biological scores with > 25% of global population in Alaska. Wilson's Warbler 32% 35% Northwestern deermouse 18% 43% Fox Sparrow 17% 55% Arctic ground squirrel 16% 35% American Golden-plover 11% 44% Dusky shrew 10% 44% White-crowned Sparrow 8% 55% Singing vole 8% 44% Northwestern Crow 3% 44%
Category IV: Low action and biological scores regardless of proportion of global population. Gray-cheeked Thrush 32% 13% Red-breasted Sapsucker 32% 10% Buff-breasted Sandpiper 32% 26%
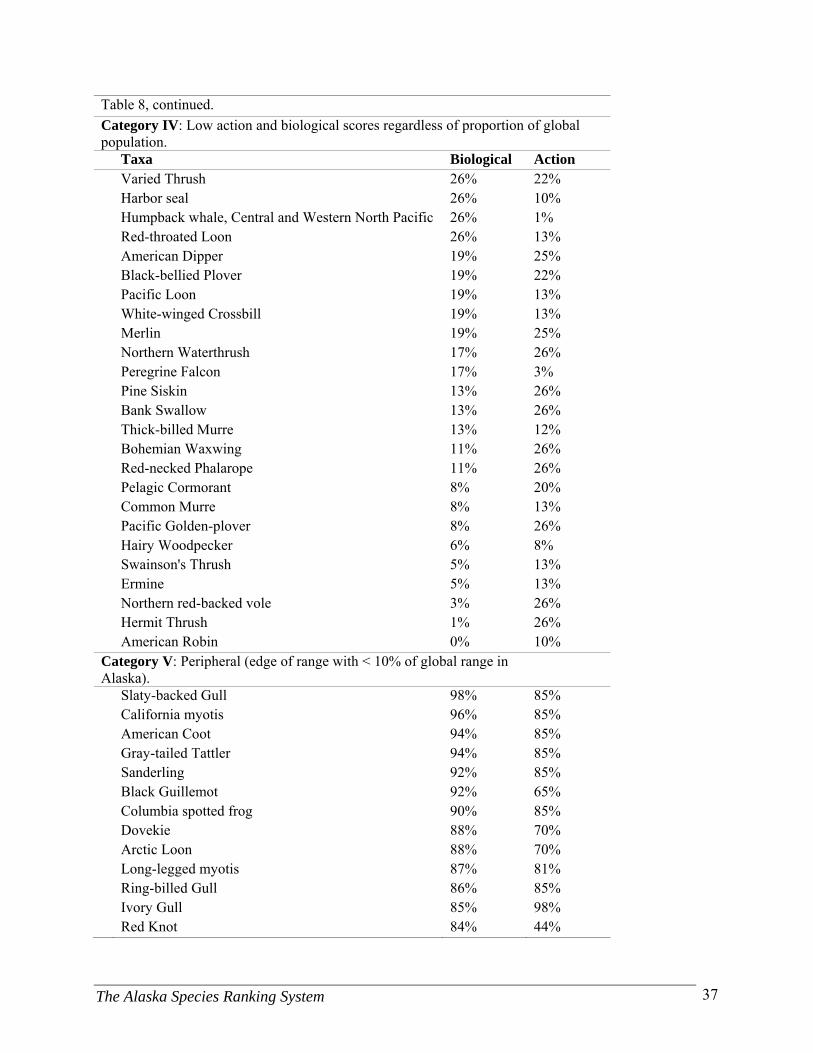
The Alaska Species Ranking System 37
Table 8, continued.
Category IV: Low action and biological scores regardless of proportion of global population. Taxa Biological Action Varied Thrush 26% 22% Harbor seal 26% 10% Humpback whale, Central and Western North Pacific 26% 1% Red-throated Loon 26% 13% American Dipper 19% 25% Black-bellied Plover 19% 22% Pacific Loon 19% 13% White-winged Crossbill 19% 13% Merlin 19% 25% Northern Waterthrush 17% 26% Peregrine Falcon 17% 3% Pine Siskin 13% 26% Bank Swallow 13% 26% Thick-billed Murre 13% 12% Bohemian Waxwing 11% 26% Red-necked Phalarope 11% 26% Pelagic Cormorant 8% 20% Common Murre 8% 13% Pacific Golden-plover 8% 26% Hairy Woodpecker 6% 8% Swainson's Thrush 5% 13% Ermine 5% 13% Northern red-backed vole 3% 26% Hermit Thrush 1% 26% American Robin 0% 10%
Category V: Peripheral (edge of range with < 10% of global range in Alaska).
Slaty-backed Gull 98% 85% California myotis 96% 85% American Coot 94% 85% Gray-tailed Tattler 94% 85% Sanderling 92% 85% Black Guillemot 92% 65% Columbia spotted frog 90% 85% Dovekie 88% 70% Arctic Loon 88% 70% Long-legged myotis 87% 81% Ring-billed Gull 86% 85% Ivory Gull 85% 98% Red Knot 84% 44%
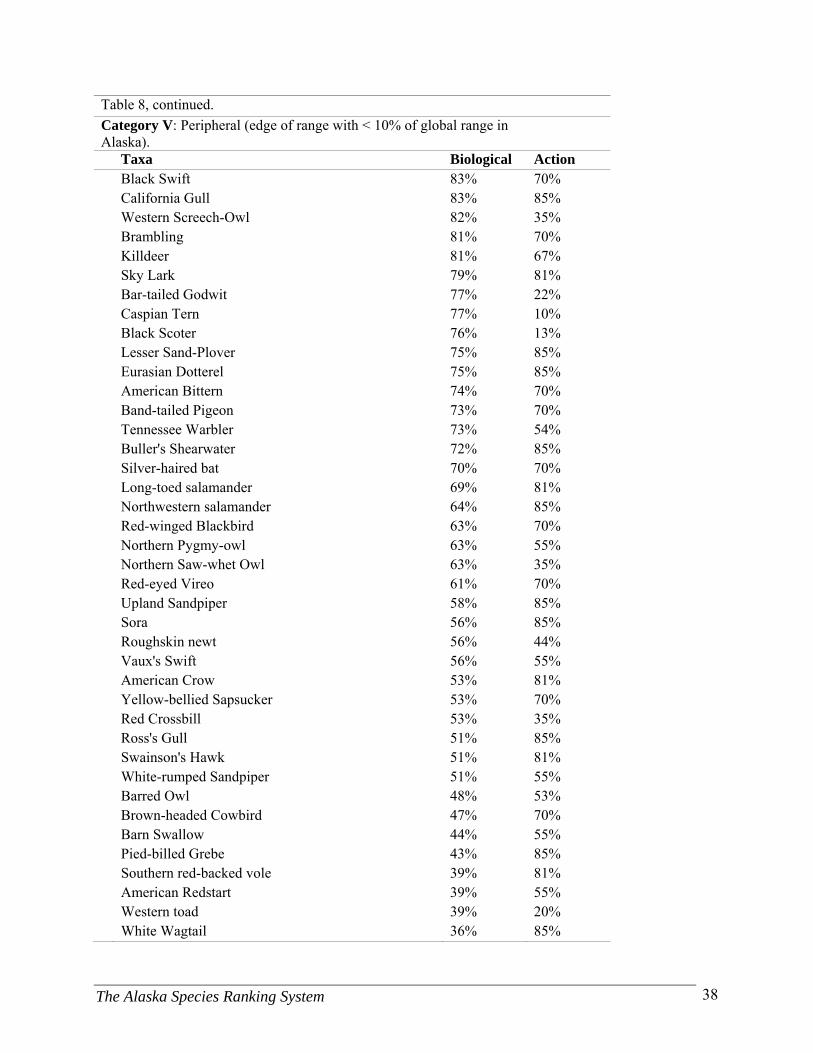
The Alaska Species Ranking System 38
Table 8, continued.
Category V: Peripheral (edge of range with < 10% of global range in Alaska).
Taxa Biological Action Black Swift 83% 70% California Gull 83% 85% Western Screech-Owl 82% 35% Brambling 81% 70% Killdeer 81% 67% Sky Lark 79% 81% Bar-tailed Godwit 77% 22% Caspian Tern 77% 10% Black Scoter 76% 13% Lesser Sand-Plover 75% 85% Eurasian Dotterel 75% 85% American Bittern 74% 70% Band-tailed Pigeon 73% 70% Tennessee Warbler 73% 54% Buller's Shearwater 72% 85% Silver-haired bat 70% 70% Long-toed salamander 69% 81% Northwestern salamander 64% 85% Red-winged Blackbird 63% 70% Northern Pygmy-owl 63% 55% Northern Saw-whet Owl 63% 35% Red-eyed Vireo 61% 70% Upland Sandpiper 58% 85% Sora 56% 85% Roughskin newt 56% 44% Vaux's Swift 56% 55% American Crow 53% 81% Yellow-bellied Sapsucker 53% 70% Red Crossbill 53% 35% Ross's Gull 51% 85% Swainson's Hawk 51% 81% White-rumped Sandpiper 51% 55% Barred Owl 48% 53% Brown-headed Cowbird 47% 70% Barn Swallow 44% 55% Pied-billed Grebe 43% 85% Southern red-backed vole 39% 81% American Redstart 39% 55% Western toad 39% 20% White Wagtail 36% 85%

The Alaska Species Ranking System 39
Table 8, continued.
Category V: Peripheral (edge of range with < 10% of global range in Alaska).
Taxa Biological Action Red-breasted Nuthatch 36% 35% Northern Rough-winged Swallow 32% 81% Brown Creeper 32% 8% Anna's Hummingbird 31% 70% Western Wood-pewee 31% 26% Golden-crowned Kinglet 26% 8% Water shrew 24% 85% Western Tanager 19% 85% Mountain Bluebird 19% 65% Arctic Warbler 19% 44% Townsend's Warbler 19% 35% Bluethroat 13% 85% Townsend's Solitaire 13% 70% Long-tailed vole 11% 67% Sharp-tailed Sandpiper 7% 85% Steller's Jay 6% 55% MacGillivray’s Warbler 4% 67% Common Tern 90% 70% Ruff 83% 70% Eye-browed Thrush 79% 70% Long-toed Stint 79% 70% Common Sandpiper 77% 70% Siberian Rubythroat 77% 70% Eastern Kingbird 72% 85% Rustic Bunting 70% 85% Black-headed Gull 67% 70%
Category VI: Migrate through Alaska in very small numbers (< 1,000) with less than 25% of global population in Alaska. Common Greenshank 94% 70% Common Tern 90% 70% Ruff 83% 70% Eye-browed Thrush 79% 70% Long-toed Stint 79% 70% Common Sandpiper 77% 70% Siberian Rubythroat 77% 70% Eastern Kingbird 72% 85% Rustic Bunting 70% 85% Black-headed Gull 67% 70%
The Alaska Species Ranking System 40
Implications for Management
The combination of biological and action scores permit identification of taxa in greatest need of conservation in Alaska. Some of the conservation actions available to ADF&G include providing funding for and/or implementing survey, monitoring and research projects, directing management, and protecting from take or harvest. Results of the ASRS also illustrate the need for additional research on the systematic significance of the many insular endemic subspecies. Here we discuss the implications of rank results on systematic significance and provide examples of how the ASRS can be used to guide conservation decisions in regards to survey, monitoring, research and management. Systematic Status Consistent with the findings of Millsap et al. (1990), geographically restricted subspecies received some of the highest biological scores. These high scores were largely driven by restricted ranges and small population sizes. While we acknowledge that subspecies are an integral component of the overall diversity of the Alaska fauna, we believe that the observed trends in the biological data are meaningful but should be interpreted with some caution. In many cases, subspecific designations were based on slight morphological differences from a small number of specimens, many of which have not been revisited for examination since first described. While recent molecular techniques have elucidated some of these taxonomic uncertainties for small mammals in Southeast Alaska (see Conroy and Cook 2000, Bidlack and Cook 2001, Cook and MacDonald 2001, Cook et al. 2001, MacDonald and Cook 1999, 2007), the majority of small mammal subspecific designations in the state remain questionable. The systematic status of these populations has implications for assessing their management priority. The results of our analyses strongly highlight the need for more comprehensive systematic studies on the endemic/subspecific taxa of Alaska using modern molecular techniques. Using Action Scores to Make Recommendations for Conservation Action Revealing trends in relative state of knowledge can be useful for planning purposes and can be used to determine what aspects of research may be needed in the future. To demonstrate different ways that the ASRS can be utilized for conservation planning, we produced separate lists of taxa in need of investigation based on the individual action criteria: survey, monitoring, and research needs.
1. Taxa in need of increased survey efforts in Alaska was devised based on taxa with poorly known distributions (survey score = 10; Table 9).
2. Taxa in need of increased monitoring efforts in Alaska was developed for taxa with
moderately understood distributions (survey score < 10) but that currently do not have adequate monitoring strategies in place (monitoring score > 2; Table 10).
3. Taxa in need of increased research efforts in Alaska was formulated for taxa whose
limiting factors are not well known (research score = 10) and are also known or suspected to be declining in Alaska (population trend > 2; Table 11).
The Alaska Species Ranking System 41
Survey and Monitoring In Alaska, field inventories are unusually expensive due to the logistics associated with a vast, inaccessible, and rugged landscape. As a result, baseline studies and distributional information are lacking and population trends are poorly known for many vertebrate taxa. Survey and monitoring scores can be used to delineate inventory and monitoring priorities for individual taxa or suites of taxa. This will allow for more efficient use of field time and funds by state and federal wildlife management agencies and their partners. If used in combination with the biological variable "range size" (which provides a complete description of the taxon’s geographic range) and/or the biological variable "habitat specialization" (which contains detailed habitat descriptions for individual taxa), results could help determine where to target field work instead of selecting survey areas randomly or with little guidance. Scores for the survey variable revealed that distributions were poorly known for 94 taxa (28%; Table 9). The survey variable indicated that distributional surveys are needed for 3 amphibians (50%), 37 mammals (30%) and 52 birds (24%). Of the 94 total taxa, approximately 30 percent were subspecies, indicating large gaps in our knowledge of small, endemic mammals. Eighteen of the 94 taxa have very small ranges in Alaska (<100 km2) and ranges for five taxa were unknown. Monitoring usually follows survey efforts because monitoring requires more thorough knowledge of distributions in the state (Millsap et al. 1990). We identified 226 taxa in need of population monitoring efforts including: 3 amphibians (50%), 74 mammals (61%) and 149 birds (70%; Table 10). This translates to 66 percent of all taxa ranked, highlighting the fact that current monitoring efforts for vertebrate taxa in Alaska are lacking. The monitoring needs list (Table 10) can be further refined to prioritize candidate taxa for monitoring programs. For example, a subset of taxa from the monitoring needs list (n = 33) received survey scores of -10 (distribution is well known throughout range in Alaska with knowledge of habitat associations) and monitoring scores of 10 (not currently monitored). We suggest that many of these taxa may be beyond the need for general distributional surveys and are ready for implementation of a monitoring program (Millsap et al. 1990). Research Taxa with populations that are known or suspected to be declining are generally considered priority taxa for management actions. However, before management actions can be successful, something must be known about factors that are limiting the size of the population and whether those factors can be managed or manipulated. If limiting factors are not known, then research about limiting factors should precede management activities (Millsap et al. 1990). We considered strong candidates for research to be taxa known or suspected to be declining in Alaska and for which limiting factors were not well known. This yielded a list of 28 potentially declining taxa with high research need scores, of which 3 were mammals, 23 were birds, and 2 were amphibians. Of the 23 avian research candidates, 10 (43%) were landbirds and eight (35%) were shorebirds. Overall, it appears that landbirds and shorebirds, in particular, need basic research to identify limiting factors responsible for current or suspected population declines. For taxa that are known or suspected to be declining and have limiting factors that are relatively well

The Alaska Species Ranking System 42
known, the research needs score and justification can be used to guide management aimed at reversing these declines.
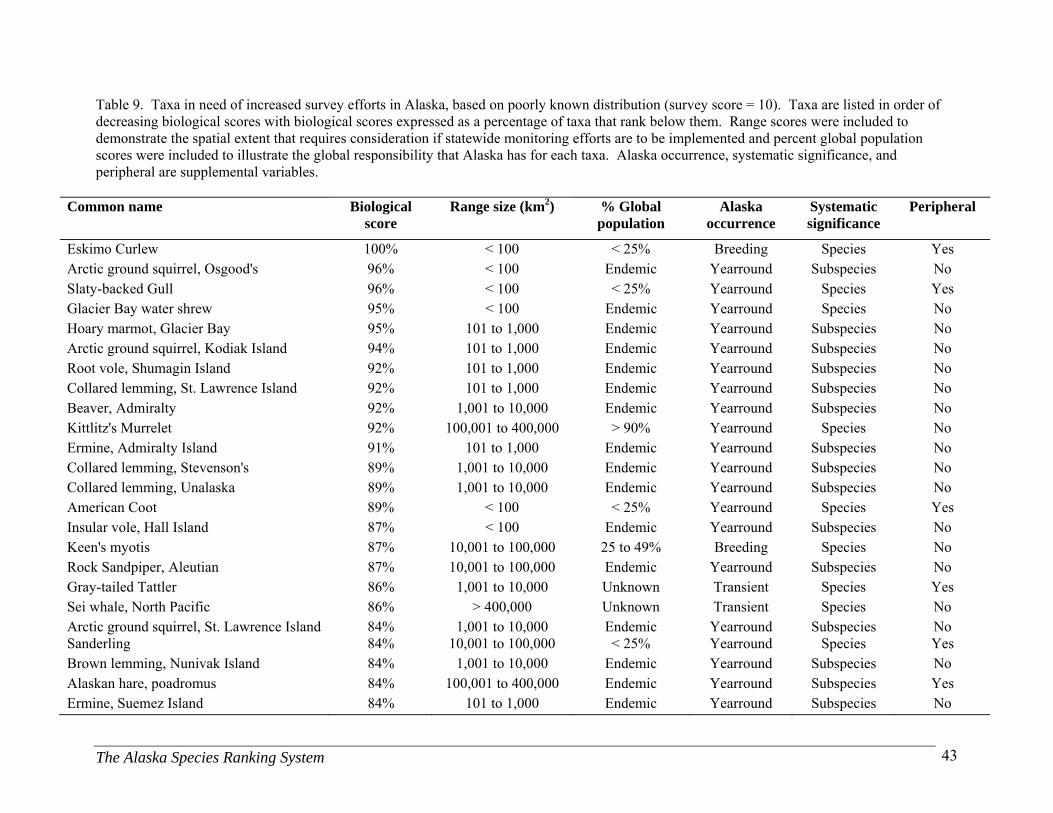
The Alaska Species Ranking System 43
Table 9. Taxa in need of increased survey efforts in Alaska, based on poorly known distribution (survey score = 10). Taxa are listed in order of decreasing biological scores with biological scores expressed as a percentage of taxa that rank below them. Range scores were included to demonstrate the spatial extent that requires consideration if statewide monitoring efforts are to be implemented and percent global population scores were included to illustrate the global responsibility that Alaska has for each taxa. Alaska occurrence, systematic significance, and peripheral are supplemental variables.
Common name Biological
score Range size (km2) % Global
population Alaska
occurrence Systematic significance
Peripheral
Eskimo Curlew 100% < 100 < 25% Breeding Species Yes Arctic ground squirrel, Osgood's 96% < 100 Endemic Yearround Subspecies No Slaty-backed Gull 96% < 100 < 25% Yearround Species Yes Glacier Bay water shrew 95% < 100 Endemic Yearround Species No Hoary marmot, Glacier Bay 95% 101 to 1,000 Endemic Yearround Subspecies No Arctic ground squirrel, Kodiak Island 94% 101 to 1,000 Endemic Yearround Subspecies No Root vole, Shumagin Island 92% 101 to 1,000 Endemic Yearround Subspecies No Collared lemming, St. Lawrence Island 92% 101 to 1,000 Endemic Yearround Subspecies No Beaver, Admiralty 92% 1,001 to 10,000 Endemic Yearround Subspecies No Kittlitz's Murrelet 92% 100,001 to 400,000 > 90% Yearround Species No Ermine, Admiralty Island 91% 101 to 1,000 Endemic Yearround Subspecies No Collared lemming, Stevenson's 89% 1,001 to 10,000 Endemic Yearround Subspecies No Collared lemming, Unalaska 89% 1,001 to 10,000 Endemic Yearround Subspecies No American Coot 89% < 100 < 25% Yearround Species Yes Insular vole, Hall Island 87% < 100 Endemic Yearround Subspecies No Keen's myotis 87% 10,001 to 100,000 25 to 49% Breeding Species No Rock Sandpiper, Aleutian 87% 10,001 to 100,000 Endemic Yearround Subspecies No Gray-tailed Tattler 86% 1,001 to 10,000 Unknown Transient Species Yes Sei whale, North Pacific 86% > 400,000 Unknown Transient Species No Arctic ground squirrel, St. Lawrence Island 84% 1,001 to 10,000 Endemic Yearround Subspecies No Sanderling 84% 10,001 to 100,000 < 25% Yearround Species Yes Brown lemming, Nunivak Island 84% 1,001 to 10,000 Endemic Yearround Subspecies No Alaskan hare, poadromus 84% 100,001 to 400,000 Endemic Yearround Subspecies Yes Ermine, Suemez Island 84% 101 to 1,000 Endemic Yearround Subspecies No

The Alaska Species Ranking System 44
Table 9, continued.
Common name Biological Range size (km2) % Global Alaska Systematic Peripheral
score population occurrence significance
Collared lemming, peninsulae 81% 10,001 to 100,000 Endemic Yearround Subspecies No Common Tern 81% 1,001 to 10,000 < 25% Transient Species Yes Columbia spotted frog 80% 1,001 to 10,000 < 25% Yearround Species Yes Marten, Kenai 80% 10,001 to 100,000 Endemic Yearround Subspecies Yes Insular vole, St. Mathew Island 78% 101 to 1,000 Endemic Yearround Subspecies No Dovekie 78% 1,001 to 10,000 < 25% Yearround Genus Yes Ermine, Baranof 77% 1,001 to 10,000 Endemic Yearround Subspecies No Arctic ground squirrel, Shumagin Islands 76% 101 to 1,000 Endemic Yearround Subspecies No Marbled Murrelet 76% 100,001 to 400,000 75 to 89% Yearround Species No Rock Sandpiper, Bering Sea 74% 100,001 to 400,000 75 to 89% Yearround Subspecies No Merlin, Black 74% 10,001 to 100,000 50 to 74% Yearround Subspecies No Ring-billed Gull 73% Unknown < 25% Yearround Species Yes Southern red-backed vole, Revillagigedo Island
71% 1,001 to 10,000 Endemic Yearround Subspecies No
Southern red-backed vole, Wrangell Island 71% 1,001 to 10,000 Endemic Yearround Subspecies No
Ivory Gull 71% 10,001 to 100,000 < 25% Nonbreeding Genus Yes Stejneger's beaked whale, Alaska 71% > 400,000 25 to 49% Yearround Species No Northern red-backed vole, St. Lawrence Island
71% 1,001 to 10,000 Endemic Yearround Subspecies No
Insular vole 69% 101 to 1,000 Endemic Yearround Species No California Gull 69% 10,001 to 100,000 < 25% Yearround Species Yes Root vole, Unalaska 67% Unknown Endemic Yearround Subspecies No Northern red-backed vole, Orca 67% Unknown Endemic Yearround Subspecies No Killdeer 67% 10,001 to 100,000 < 25% Yearround Species Yes Sky Lark 65% 1,001 to 10,000 < 25% Breeding Genus Yes Cuvier's beaked whale, Alaska 63% > 400,000 < 25% Yearround Species No Blue whale, North Pacific 63% > 400,000 < 25% Transient Species No
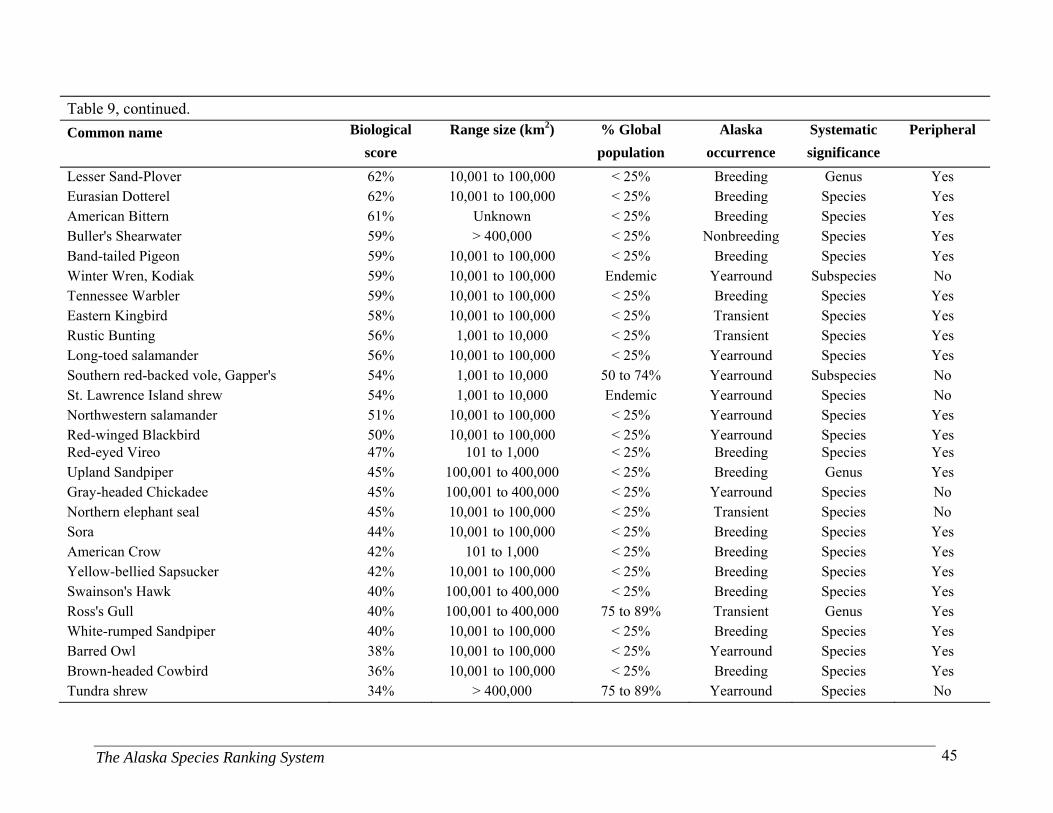
The Alaska Species Ranking System 45
Table 9, continued.
Common name Biological Range size (km2) % Global Alaska Systematic Peripheral
score population occurrence significance
Lesser Sand-Plover 62% 10,001 to 100,000 < 25% Breeding Genus Yes Eurasian Dotterel 62% 10,001 to 100,000 < 25% Breeding Species Yes American Bittern 61% Unknown < 25% Breeding Species Yes Buller's Shearwater 59% > 400,000 < 25% Nonbreeding Species Yes Band-tailed Pigeon 59% 10,001 to 100,000 < 25% Breeding Species Yes Winter Wren, Kodiak 59% 10,001 to 100,000 Endemic Yearround Subspecies No Tennessee Warbler 59% 10,001 to 100,000 < 25% Breeding Species Yes Eastern Kingbird 58% 10,001 to 100,000 < 25% Transient Species Yes Rustic Bunting 56% 1,001 to 10,000 < 25% Transient Species Yes Long-toed salamander 56% 10,001 to 100,000 < 25% Yearround Species Yes Southern red-backed vole, Gapper's 54% 1,001 to 10,000 50 to 74% Yearround Subspecies No St. Lawrence Island shrew 54% 1,001 to 10,000 Endemic Yearround Species No Northwestern salamander 51% 10,001 to 100,000 < 25% Yearround Species Yes Red-winged Blackbird 50% 10,001 to 100,000 < 25% Yearround Species Yes Red-eyed Vireo 47% 101 to 1,000 < 25% Breeding Species Yes Upland Sandpiper 45% 100,001 to 400,000 < 25% Breeding Genus Yes Gray-headed Chickadee 45% 100,001 to 400,000 < 25% Yearround Species No Northern elephant seal 45% 10,001 to 100,000 < 25% Transient Species No Sora 44% 10,001 to 100,000 < 25% Breeding Species Yes American Crow 42% 101 to 1,000 < 25% Breeding Species Yes Yellow-bellied Sapsucker 42% 10,001 to 100,000 < 25% Breeding Species Yes Swainson's Hawk 40% 100,001 to 400,000 < 25% Breeding Species Yes Ross's Gull 40% 100,001 to 400,000 75 to 89% Transient Genus Yes White-rumped Sandpiper 40% 10,001 to 100,000 < 25% Breeding Species Yes Barred Owl 38% 10,001 to 100,000 < 25% Yearround Species Yes Brown-headed Cowbird 36% 10,001 to 100,000 < 25% Breeding Species Yes Tundra shrew 34% > 400,000 75 to 89% Yearround Species No
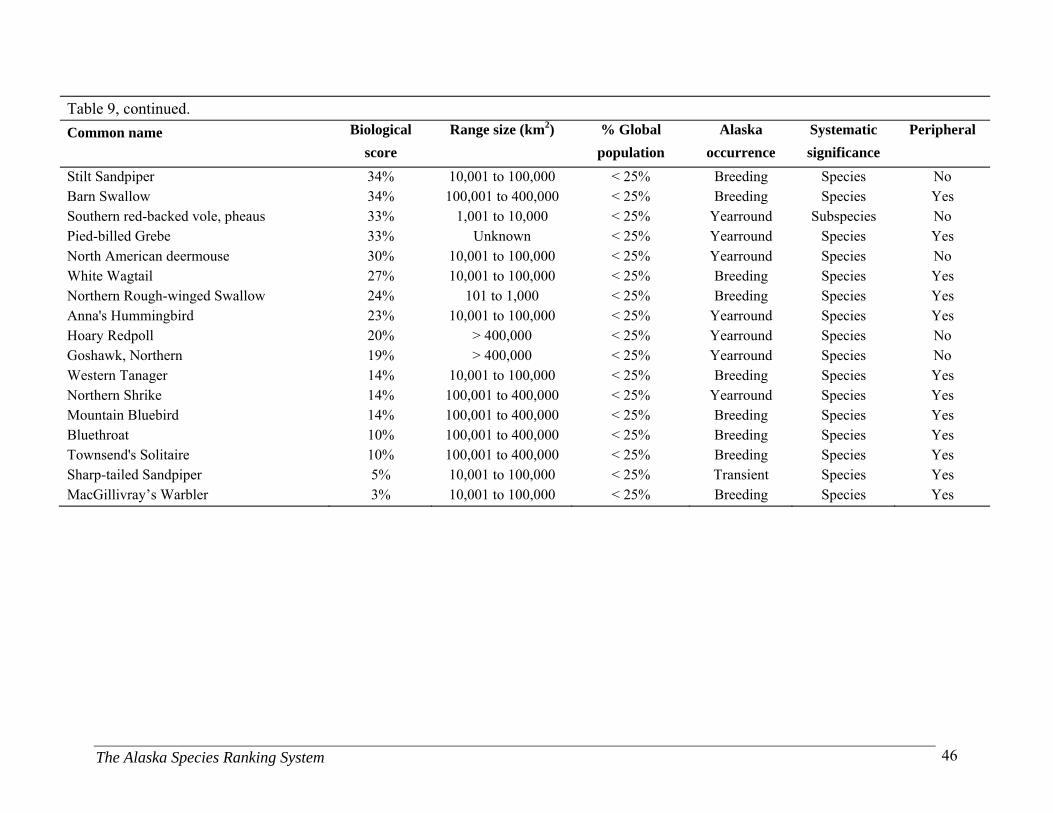
The Alaska Species Ranking System 46
Table 9, continued.
Common name Biological Range size (km2) % Global Alaska Systematic Peripheral
score population occurrence significance
Stilt Sandpiper 34% 10,001 to 100,000 < 25% Breeding Species No Barn Swallow 34% 100,001 to 400,000 < 25% Breeding Species Yes Southern red-backed vole, pheaus 33% 1,001 to 10,000 < 25% Yearround Subspecies No Pied-billed Grebe 33% Unknown < 25% Yearround Species Yes North American deermouse 30% 10,001 to 100,000 < 25% Yearround Species No White Wagtail 27% 10,001 to 100,000 < 25% Breeding Species Yes Northern Rough-winged Swallow 24% 101 to 1,000 < 25% Breeding Species Yes Anna's Hummingbird 23% 10,001 to 100,000 < 25% Yearround Species Yes Hoary Redpoll 20% > 400,000 < 25% Yearround Species No Goshawk, Northern 19% > 400,000 < 25% Yearround Species No Western Tanager 14% 10,001 to 100,000 < 25% Breeding Species Yes Northern Shrike 14% 100,001 to 400,000 < 25% Yearround Species Yes Mountain Bluebird 14% 100,001 to 400,000 < 25% Breeding Species Yes Bluethroat 10% 100,001 to 400,000 < 25% Breeding Species Yes Townsend's Solitaire 10% 100,001 to 400,000 < 25% Breeding Species Yes Sharp-tailed Sandpiper 5% 10,001 to 100,000 < 25% Transient Species Yes MacGillivray’s Warbler 3% 10,001 to 100,000 < 25% Breeding Species Yes
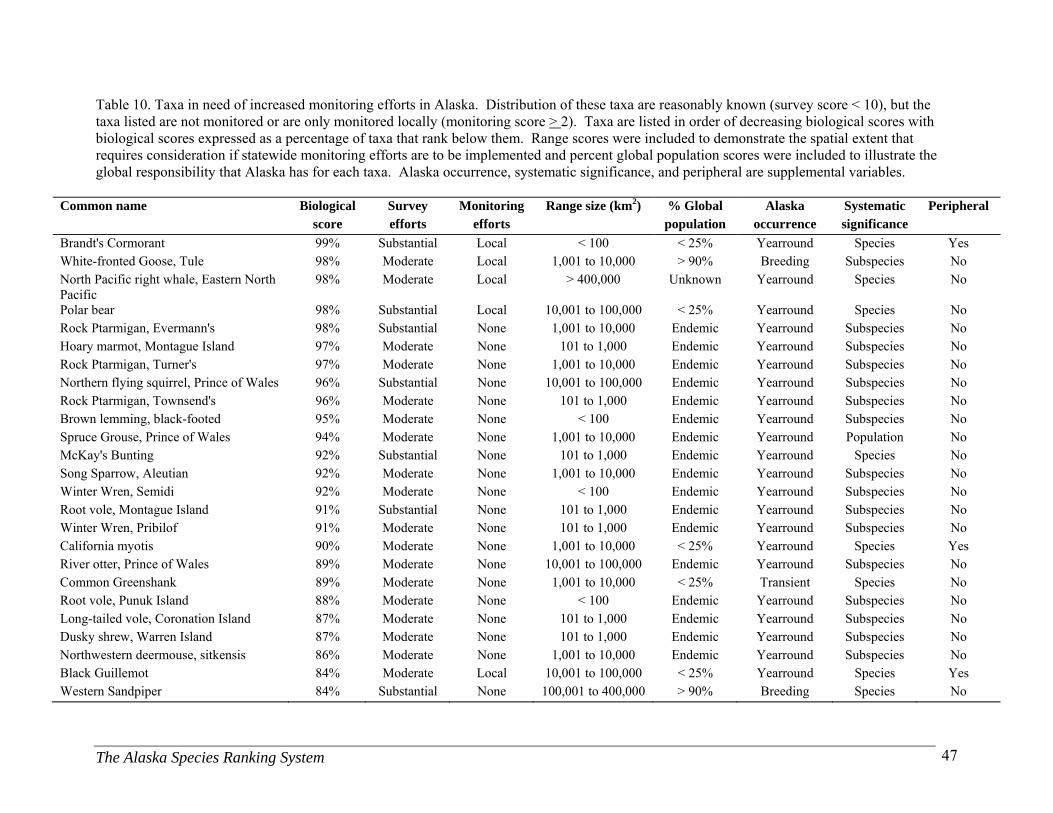
The Alaska Species Ranking System 47
Table 10. Taxa in need of increased monitoring efforts in Alaska. Distribution of these taxa are reasonably known (survey score < 10), but the taxa listed are not monitored or are only monitored locally (monitoring score > 2). Taxa are listed in order of decreasing biological scores with biological scores expressed as a percentage of taxa that rank below them. Range scores were included to demonstrate the spatial extent that requires consideration if statewide monitoring efforts are to be implemented and percent global population scores were included to illustrate the global responsibility that Alaska has for each taxa. Alaska occurrence, systematic significance, and peripheral are supplemental variables.
Common name Biological Survey Monitoring Range size (km2) % Global Alaska Systematic Peripheral score efforts efforts population occurrence significance
Brandt's Cormorant 99% Substantial Local < 100 < 25% Yearround Species Yes White-fronted Goose, Tule 98% Moderate Local 1,001 to 10,000 > 90% Breeding Subspecies No North Pacific right whale, Eastern North Pacific
98% Moderate Local > 400,000 Unknown Yearround Species No
Polar bear 98% Substantial Local 10,001 to 100,000 < 25% Yearround Species No Rock Ptarmigan, Evermann's 98% Substantial None 1,001 to 10,000 Endemic Yearround Subspecies No Hoary marmot, Montague Island 97% Moderate None 101 to 1,000 Endemic Yearround Subspecies No Rock Ptarmigan, Turner's 97% Moderate None 1,001 to 10,000 Endemic Yearround Subspecies No Northern flying squirrel, Prince of Wales 96% Substantial None 10,001 to 100,000 Endemic Yearround Subspecies No Rock Ptarmigan, Townsend's 96% Moderate None 101 to 1,000 Endemic Yearround Subspecies No Brown lemming, black-footed 95% Moderate None < 100 Endemic Yearround Subspecies No Spruce Grouse, Prince of Wales 94% Moderate None 1,001 to 10,000 Endemic Yearround Population No McKay's Bunting 92% Substantial None 101 to 1,000 Endemic Yearround Species No Song Sparrow, Aleutian 92% Moderate None 1,001 to 10,000 Endemic Yearround Subspecies No Winter Wren, Semidi 92% Moderate None < 100 Endemic Yearround Subspecies No Root vole, Montague Island 91% Substantial None 101 to 1,000 Endemic Yearround Subspecies No Winter Wren, Pribilof 91% Moderate None 101 to 1,000 Endemic Yearround Subspecies No California myotis 90% Moderate None 1,001 to 10,000 < 25% Yearround Species Yes River otter, Prince of Wales 89% Moderate None 10,001 to 100,000 Endemic Yearround Subspecies No Common Greenshank 89% Moderate None 1,001 to 10,000 < 25% Transient Species No Root vole, Punuk Island 88% Moderate None < 100 Endemic Yearround Subspecies No Long-tailed vole, Coronation Island 87% Moderate None 101 to 1,000 Endemic Yearround Subspecies No Dusky shrew, Warren Island 87% Moderate None 101 to 1,000 Endemic Yearround Subspecies No Northwestern deermouse, sitkensis 86% Moderate None 1,001 to 10,000 Endemic Yearround Subspecies No Black Guillemot 84% Moderate Local 10,001 to 100,000 < 25% Yearround Species Yes Western Sandpiper 84% Substantial None 100,001 to 400,000 > 90% Breeding Species No

The Alaska Species Ranking System 48
Table 10, continued.
Common name Biological Survey Monitoring Range size (km2) % Global Alaska Systematic Peripheral score efforts efforts population occurrence significance
Northwestern deermouse, oceanicus 81% Moderate None < 100 Endemic Yearround Subspecies No Root vole, Sitka 81% Moderate None 1,001 to 10,000 Endemic Yearround Subspecies No Root vole, St. Lawrence Island 81% Moderate None 1,001 to 10,000 Endemic Yearround Subspecies No Northern red-backed vole, Island 81% Moderate None < 100 Endemic Yearround Subspecies No Marbled Godwit 81% Substantial None 1,001 to 10,000 < 25% Breeding Species No Alaskan hare, othus 81% Substantial None 100,001 to 400,000 Endemic Yearround Subspecies No Goshawk, Queen Charlotte 80% Substantial Local 10,001 to 100,000 25 to 49% Yearround Subspecies No Root vole, Yakutat 78% Moderate None 101 to 1,000 Endemic Yearround Subspecies No Arctic Loon 78% Moderate None 10,001 to 100,000 < 25% Breeding Species Yes Northern red-backed vole, Glacier Bay 78% Moderate None 101 to 1,000 Endemic Yearround Subspecies No Red squirrel, Kenai 78% Moderate None 10,001 to 100,000 Endemic Yearround Subspecies No Surfbird 78% Moderate Local 100,001 to 400,000 75 to 89% Yearround Genus No Ermine, Prince of Wales 77% Moderate Local 1,001 to 10,000 Endemic Yearround Subspecies No Walrus 77% Substantial Local > 400,000 75 to 89% Yearround Family No Alaskan hare 76% Moderate None 100,001 to 400,000 Endemic Yearround Species No Wolf, Alexander Archipelago 76% Moderate None 101 to 1,000 Endemic Yearround Population No Long-legged myotis 75% Moderate None 100,001 to 400,000 < 25% Yearround Species Yes Peregrine Falcon, Peale's 74% Moderate Local 100,001 to 400,000 > 90% Yearround Subspecies No Bristle-thighed Curlew 74% Substantial Local 10,001 to 100,000 > 90% Breeding Species No Root vole, Amak Island 74% Substantial None < 100 Endemic Yearround Subspecies No Marten, Pacific 74% Moderate None 1,001 to 10,000 25 to 49% Yearround Subspecies Yes Dusky shrew, Yakutat 71% Moderate None 10,001 to 100,000 Endemic Yearround Subspecies No Baird's beaked whale, Alaska 71% Moderate Local > 400,000 Unknown Transient Species No Pribilof Island shrew 71% Substantial None < 100 Endemic Yearround Species No Winter Wren, Kiska 71% Moderate None 10,001 to 100,000 Endemic Yearround Subspecies No Great Blue Heron, Pacific 70% Moderate Local 10,001 to 100,000 > 90% Yearround Subspecies No Black Swift 69% Moderate None 10,001 to 100,000 < 25% Yearround Genus Yes Ruff 69% Moderate None 1,001 to 10,000 < 25% Transient Genus Yes Red Knot 69% Moderate Local 10,001 to 100,000 < 25% Breeding Species Yes Winter Wren, Attu 69% Moderate None 1,001 to 10,000 Endemic Yearround Subspecies No Western Screech-Owl 68% Moderate Local 100,001 to 400,000 < 25% Yearround Species Yes

The Alaska Species Ranking System 49
Table 10, continued.
Common name Biological Survey Monitoring Range size (km2) % Global Alaska Systematic Peripheral score efforts efforts population occurrence significance
Brambling 67% Moderate None 1,001 to 10,000 < 25% Breeding Species Yes Killer whale 67% Substantial Local > 400,000 < 25% Yearround Species No Eye-browed Thrush 65% Moderate None 1,001 to 10,000 < 25% Transient Species Yes Long-toed Stint 65% Moderate None 1,001 to 10,000 < 25% Transient Species Yes Ribbon seal 65% Moderate Local 100,001 to 400,000 50 to 74% Yearround Genus No Black Oystercatcher 65% Substantial Local 10,001 to 100,000 50 to 74% Yearround Species No Meadow vole, Admiralty 63% Moderate None 101 to 1,000 Endemic Yearround Subspecies No Common Sandpiper 63% Moderate None 1,001 to 10,000 < 25% Transient Species Yes Siberian Rubythroat 63% Moderate None 1,001 to 10,000 < 25% Transient Species Yes Northwestern deermouse, hylaeus 63% Moderate None 10,001 to 100,000 Endemic Yearround Subspecies No Bar-tailed Godwit 63% Substantial Local 1,001 to 10,000 < 25% Breeding Species Yes Black Scoter 63% Substantial Local 100,001 to 400,000 < 25% Yearround Species Yes Caspian Tern 63% Substantial None 1,001 to 10,000 < 25% Breeding Species Yes Pink-footed Shearwater 62% Substantial None > 400,000 < 25% Nonbreeding Species No Fin whale, Northeast Pacific 61% Moderate Local > 400,000 < 25% Transient Species No Alaska tiny shrew 59% Moderate None 100,001 to 400,000 Endemic Yearround Species No Dunlin, Pacific 59% Moderate None 100,001 to 400,000 > 90% Yearround Subspecies No Dunlin, Arctic 59% Substantial Local 100,001 to 400,000 > 90% Yearround Subspecies No Sperm whale, North Pacific 59% Substantial None > 400,000 < 25% Transient Species No Fork-tailed Storm-Petrel, furcata 59% Substantial Local > 400,000 > 90% Yearround Subspecies No Silver-haired bat 56% Moderate None 10,001 to 100,000 < 25% Yearround Species Yes Northern flying squirrel 56% Moderate None > 400,000 < 25% Yearround Species No Northern Harrier 56% Moderate Local 10,001 to 100,000 < 25% Yearround Genus No Hudsonian Godwit 56% Moderate None 10,001 to 100,000 < 25% Breeding Species No Surf Scoter 56% Moderate Local 10,001 to 100,000 Unknown Yearround Species No Horned Grebe 56% Substantial Local 100,001 to 400,000 Unknown Yearround Species No Black-headed Gull 54% Moderate None 10,001 to 100,000 < 25% Transient Species Yes Dusky shrew, Queen Charlotte Islands 54% Substantial None 10,001 to 100,000 50 to 74% Yearround Subspecies No Laysan Albatross 54% Substantial None > 400,000 < 25% Nonbreeding Species No Least Auklet 54% Substantial Local 10,001 to 100,000 50 to 74% Yearround Species No Alaska marmot 52% Moderate None 100,001 to 400,000 Endemic Yearround Species No

The Alaska Species Ranking System 50
Table 10, continued.
Common name Biological Survey Monitoring Range size (km2) % Global Alaska Systematic Peripheral score efforts efforts population occurrence significance
Long-tailed vole, littoralis 52% Substantial None 10,001 to 100,000 50 to 74% Yearround Subspecies No Red-faced Cormorant 52% Substantial Local > 400,000 < 25% Yearround Species No Black-footed Albatross 52% Substantial None > 400,000 < 25% Nonbreeding Species No Spotted seal 51% Substantial None > 400,000 25 to 49% Yearround Species No Whiskered Auklet 51% Substantial Local 10,001 to 100,000 75 to 89% Yearround Species No Northern Pygmy-owl 50% Moderate Local 10,001 to 100,000 < 25% Yearround Species Yes Northern Saw-whet Owl 50% Moderate Local 100,001 to 400,000 < 25% Yearround Species Yes Ermine, Kodiak Island 50% Moderate Local 10,001 to 100,000 Endemic Yearround Subspecies No Bald Eagle 50% Substantial Local 100,001 to 400,000 50 to 74% Yearround Species No Northwestern deermouse, macrorhinus 49% Moderate None 10,001 to 100,000 Unknown Yearround Subspecies No Northwestern deermouse, algidus 49% Moderate None 1,001 to 10,000 50 to 74% Yearround Subspecies No Red squirrel, Kupreanof 49% Substantial None 10,001 to 100,000 50 to 74% Yearround Subspecies No Crested Auklet 49% Substantial Local 10,001 to 100,000 50 to 74% Yearround Species No Little brown myotis 48% Substantial None > 400,000 < 25% Yearround Species No Black-backed Woodpecker 47% Moderate None > 400,000 < 25% Yearround Species No Aleutian Tern 47% Substantial Local > 400,000 25 to 49% Breeding Species No Canadian lynx 47% Moderate Local > 400,000 25 to 49% Yearround Species No Northern Flicker 45% Moderate Local > 400,000 < 25% Breeding Species No Long-tailed Duck 45% Substantial Local 100,001 to 400,000 25 to 49% Yearround Genus No Arctic Tern 45% Moderate Local > 400,000 > 90% Breeding Species No Short-tailed Albatross 45% Substantial None > 400,000 < 25% Nonbreeding Species No Vaux's Swift 44% Moderate None 10,001 to 100,000 < 25% Breeding Species Yes Roughskin newt 44% Substantial None 10,001 to 100,000 < 25% Yearround Species Yes Black-legged Kittiwake 44% Substantial Local 100,001 to 400,000 < 25% Yearround Species No Collared pika 42% Moderate None > 400,000 25 to 49% Yearround Species No Red Crossbill 42% Moderate Local 100,001 to 400,000 < 25% Yearround Species Yes Three-toed Woodpecker 42% Substantial Local > 400,000 25 to 49% Yearround Species No Wandering Tattler 41% Moderate None > 400,000 50 to 74% Breeding Species No Common minke whale, Alaska 41% Moderate Local > 400,000 < 25% Transient Species No Arctic ground squirrel, Aleutian 40% Moderate None 100,001 to 400,000 Endemic Yearround Subspecies No Red-necked Grebe 40% Substantial Local 100,001 to 400,000 < 25% Yearround Species No
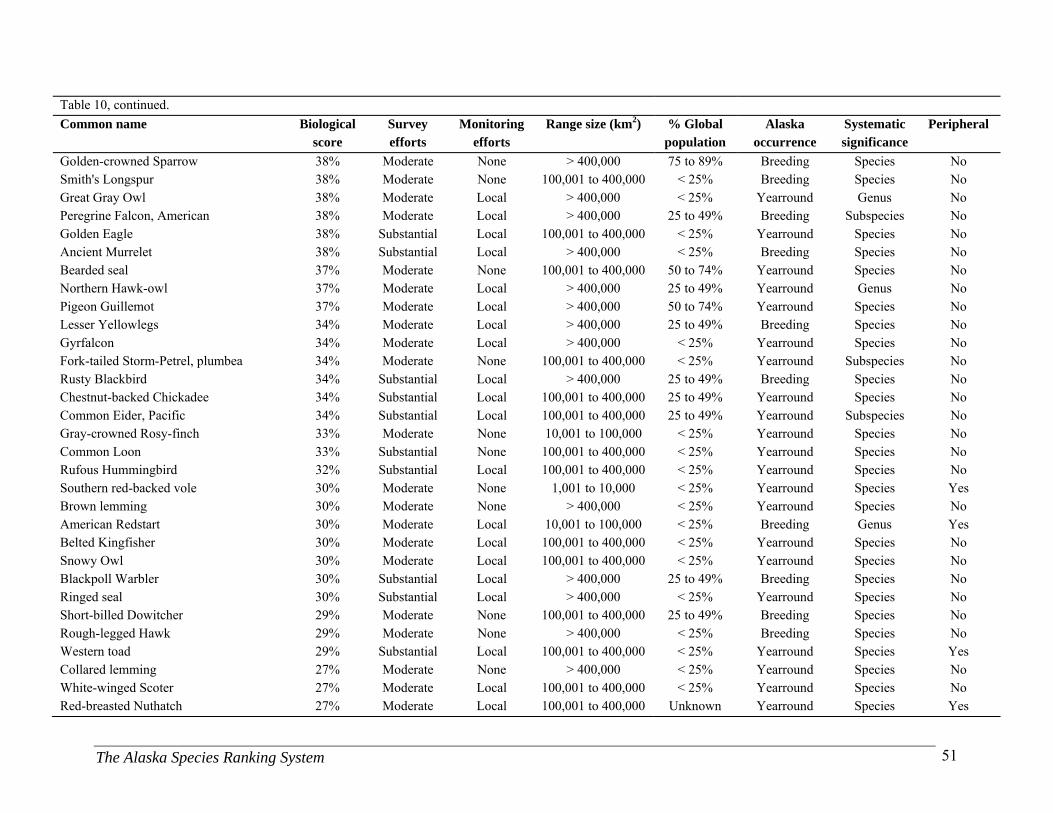
The Alaska Species Ranking System 51
Table 10, continued.
Common name Biological Survey Monitoring Range size (km2) % Global Alaska Systematic Peripheral score efforts efforts population occurrence significance
Golden-crowned Sparrow 38% Moderate None > 400,000 75 to 89% Breeding Species No Smith's Longspur 38% Moderate None 100,001 to 400,000 < 25% Breeding Species No Great Gray Owl 38% Moderate Local > 400,000 < 25% Yearround Genus No Peregrine Falcon, American 38% Moderate Local > 400,000 25 to 49% Breeding Subspecies No Golden Eagle 38% Substantial Local 100,001 to 400,000 < 25% Yearround Species No Ancient Murrelet 38% Substantial Local > 400,000 < 25% Breeding Species No Bearded seal 37% Moderate None 100,001 to 400,000 50 to 74% Yearround Species No Northern Hawk-owl 37% Moderate Local > 400,000 25 to 49% Yearround Genus No Pigeon Guillemot 37% Moderate Local > 400,000 50 to 74% Yearround Species No Lesser Yellowlegs 34% Moderate Local > 400,000 25 to 49% Breeding Species No Gyrfalcon 34% Moderate Local > 400,000 < 25% Yearround Species No Fork-tailed Storm-Petrel, plumbea 34% Moderate None 100,001 to 400,000 < 25% Yearround Subspecies No Rusty Blackbird 34% Substantial Local > 400,000 25 to 49% Breeding Species No Chestnut-backed Chickadee 34% Substantial Local 100,001 to 400,000 25 to 49% Yearround Species No Common Eider, Pacific 34% Substantial Local 100,001 to 400,000 25 to 49% Yearround Subspecies No Gray-crowned Rosy-finch 33% Moderate None 10,001 to 100,000 < 25% Yearround Species No Common Loon 33% Substantial None 100,001 to 400,000 < 25% Yearround Species No Rufous Hummingbird 32% Substantial Local 100,001 to 400,000 < 25% Yearround Species No Southern red-backed vole 30% Moderate None 1,001 to 10,000 < 25% Yearround Species Yes Brown lemming 30% Moderate None > 400,000 < 25% Yearround Species No American Redstart 30% Moderate Local 10,001 to 100,000 < 25% Breeding Genus Yes Belted Kingfisher 30% Moderate Local 100,001 to 400,000 < 25% Yearround Species No Snowy Owl 30% Moderate Local 100,001 to 400,000 < 25% Yearround Species No Blackpoll Warbler 30% Substantial Local > 400,000 25 to 49% Breeding Species No Ringed seal 30% Substantial Local > 400,000 < 25% Yearround Species No Short-billed Dowitcher 29% Moderate None 100,001 to 400,000 25 to 49% Breeding Species No Rough-legged Hawk 29% Moderate None > 400,000 < 25% Breeding Species No Western toad 29% Substantial Local 100,001 to 400,000 < 25% Yearround Species Yes Collared lemming 27% Moderate None > 400,000 < 25% Yearround Species No White-winged Scoter 27% Moderate Local 100,001 to 400,000 < 25% Yearround Species No Red-breasted Nuthatch 27% Moderate Local 100,001 to 400,000 Unknown Yearround Species Yes
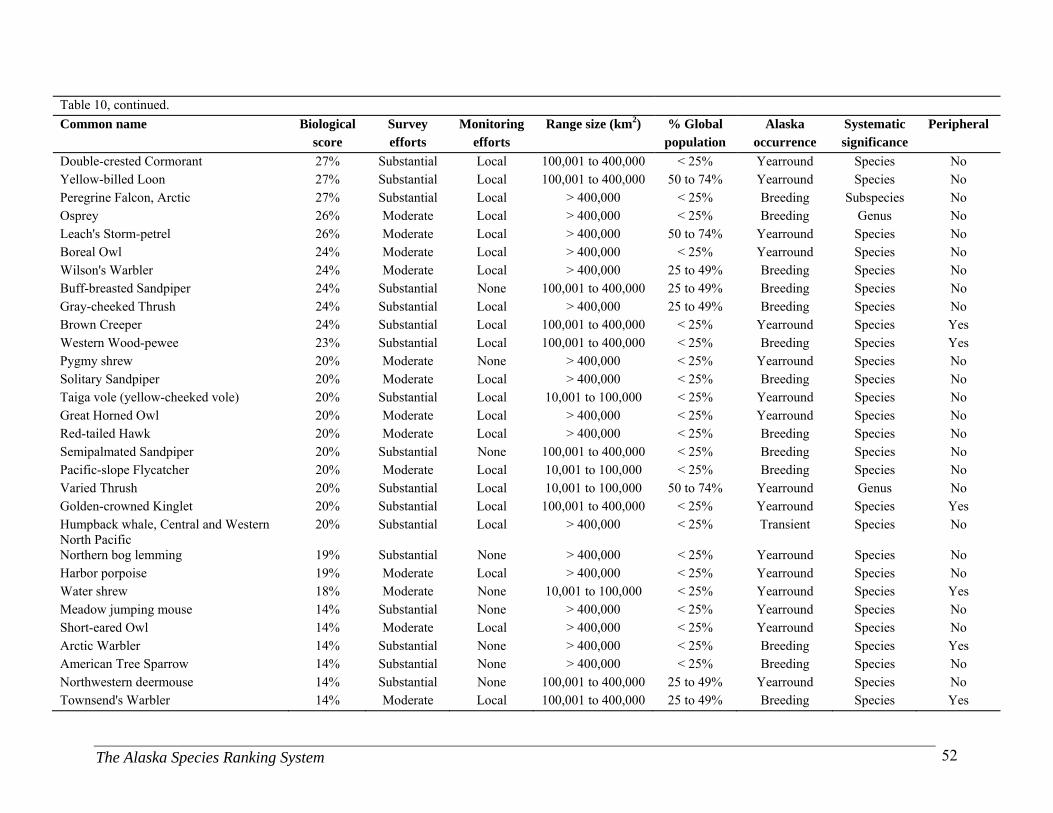
The Alaska Species Ranking System 52
Table 10, continued.
Common name Biological Survey Monitoring Range size (km2) % Global Alaska Systematic Peripheral score efforts efforts population occurrence significance
Double-crested Cormorant 27% Substantial Local 100,001 to 400,000 < 25% Yearround Species No Yellow-billed Loon 27% Substantial Local 100,001 to 400,000 50 to 74% Yearround Species No Peregrine Falcon, Arctic 27% Substantial Local > 400,000 < 25% Breeding Subspecies No Osprey 26% Moderate Local > 400,000 < 25% Breeding Genus No Leach's Storm-petrel 26% Moderate Local > 400,000 50 to 74% Yearround Species No Boreal Owl 24% Moderate Local > 400,000 < 25% Yearround Species No Wilson's Warbler 24% Moderate Local > 400,000 25 to 49% Breeding Species No Buff-breasted Sandpiper 24% Substantial None 100,001 to 400,000 25 to 49% Breeding Species No Gray-cheeked Thrush 24% Substantial Local > 400,000 25 to 49% Breeding Species No Brown Creeper 24% Substantial Local 100,001 to 400,000 < 25% Yearround Species Yes Western Wood-pewee 23% Substantial Local 100,001 to 400,000 < 25% Breeding Species Yes Pygmy shrew 20% Moderate None > 400,000 < 25% Yearround Species No Solitary Sandpiper 20% Moderate Local > 400,000 < 25% Breeding Species No Taiga vole (yellow-cheeked vole) 20% Substantial Local 10,001 to 100,000 < 25% Yearround Species No Great Horned Owl 20% Moderate Local > 400,000 < 25% Yearround Species No Red-tailed Hawk 20% Moderate Local > 400,000 < 25% Breeding Species No Semipalmated Sandpiper 20% Substantial None 100,001 to 400,000 < 25% Breeding Species No Pacific-slope Flycatcher 20% Moderate Local 10,001 to 100,000 < 25% Breeding Species No Varied Thrush 20% Substantial Local 10,001 to 100,000 50 to 74% Yearround Genus No Golden-crowned Kinglet 20% Substantial Local 100,001 to 400,000 < 25% Yearround Species Yes Humpback whale, Central and Western North Pacific
20% Substantial Local > 400,000 < 25% Transient Species No
Northern bog lemming 19% Substantial None > 400,000 < 25% Yearround Species No Harbor porpoise 19% Moderate Local > 400,000 < 25% Yearround Species No Water shrew 18% Moderate None 10,001 to 100,000 < 25% Yearround Species Yes Meadow jumping mouse 14% Substantial None > 400,000 < 25% Yearround Species No Short-eared Owl 14% Moderate Local > 400,000 < 25% Yearround Species No Arctic Warbler 14% Substantial None > 400,000 < 25% Breeding Species Yes American Tree Sparrow 14% Substantial None > 400,000 < 25% Breeding Species No Northwestern deermouse 14% Substantial None 100,001 to 400,000 25 to 49% Yearround Species No Townsend's Warbler 14% Moderate Local 100,001 to 400,000 25 to 49% Breeding Species Yes
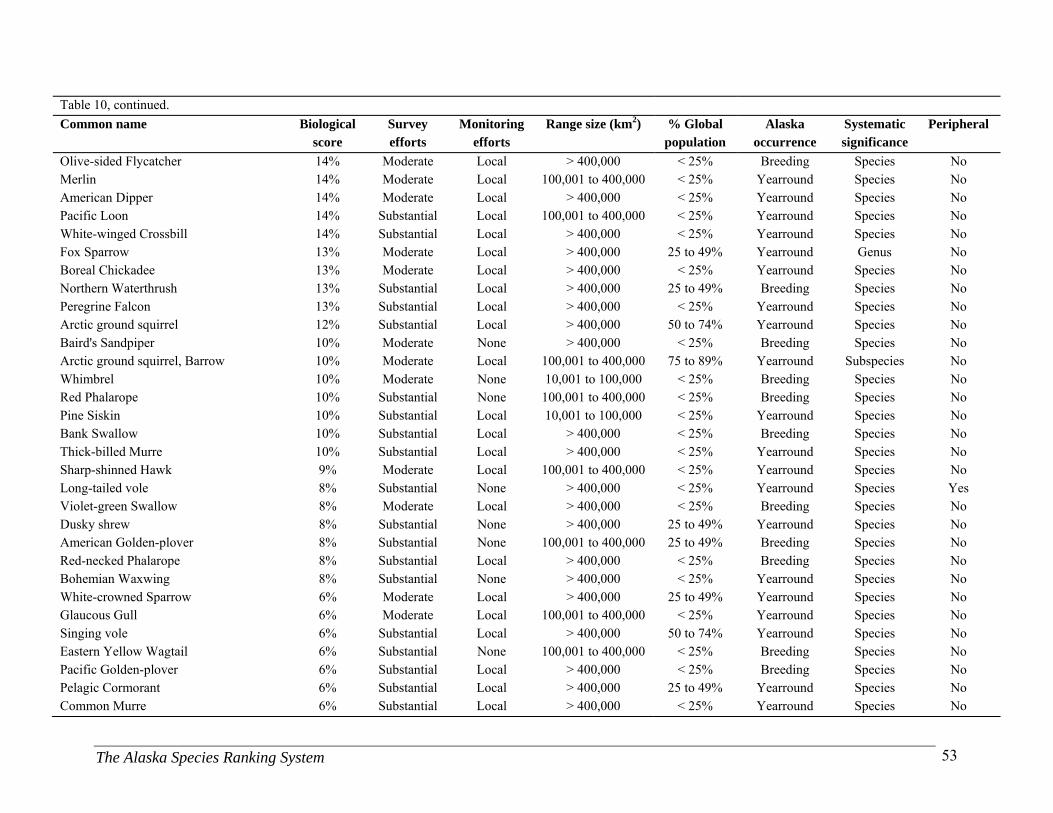
The Alaska Species Ranking System 53
Table 10, continued.
Common name Biological Survey Monitoring Range size (km2) % Global Alaska Systematic Peripheral score efforts efforts population occurrence significance
Olive-sided Flycatcher 14% Moderate Local > 400,000 < 25% Breeding Species No Merlin 14% Moderate Local 100,001 to 400,000 < 25% Yearround Species No American Dipper 14% Moderate Local > 400,000 < 25% Yearround Species No Pacific Loon 14% Substantial Local 100,001 to 400,000 < 25% Yearround Species No White-winged Crossbill 14% Substantial Local > 400,000 < 25% Yearround Species No Fox Sparrow 13% Moderate Local > 400,000 25 to 49% Yearround Genus No Boreal Chickadee 13% Moderate Local > 400,000 < 25% Yearround Species No Northern Waterthrush 13% Substantial Local > 400,000 25 to 49% Breeding Species No Peregrine Falcon 13% Substantial Local > 400,000 < 25% Yearround Species No Arctic ground squirrel 12% Substantial Local > 400,000 50 to 74% Yearround Species No Baird's Sandpiper 10% Moderate None > 400,000 < 25% Breeding Species No Arctic ground squirrel, Barrow 10% Moderate Local 100,001 to 400,000 75 to 89% Yearround Subspecies No Whimbrel 10% Moderate None 10,001 to 100,000 < 25% Breeding Species No Red Phalarope 10% Substantial None 100,001 to 400,000 < 25% Breeding Species No Pine Siskin 10% Substantial Local 10,001 to 100,000 < 25% Yearround Species No Bank Swallow 10% Substantial Local > 400,000 < 25% Breeding Species No Thick-billed Murre 10% Substantial Local > 400,000 < 25% Yearround Species No Sharp-shinned Hawk 9% Moderate Local 100,001 to 400,000 < 25% Yearround Species No Long-tailed vole 8% Substantial None > 400,000 < 25% Yearround Species Yes Violet-green Swallow 8% Moderate Local > 400,000 < 25% Breeding Species No Dusky shrew 8% Substantial None > 400,000 25 to 49% Yearround Species No American Golden-plover 8% Substantial None 100,001 to 400,000 25 to 49% Breeding Species No Red-necked Phalarope 8% Substantial Local > 400,000 < 25% Breeding Species No Bohemian Waxwing 8% Substantial None > 400,000 < 25% Yearround Species No White-crowned Sparrow 6% Moderate Local > 400,000 25 to 49% Yearround Species No Glaucous Gull 6% Moderate Local 100,001 to 400,000 < 25% Yearround Species No Singing vole 6% Substantial Local > 400,000 50 to 74% Yearround Species No Eastern Yellow Wagtail 6% Substantial None 100,001 to 400,000 < 25% Breeding Species No Pacific Golden-plover 6% Substantial Local > 400,000 < 25% Breeding Species No Pelagic Cormorant 6% Substantial Local > 400,000 25 to 49% Yearround Species No Common Murre 6% Substantial Local > 400,000 < 25% Yearround Species No

The Alaska Species Ranking System 54
Table 10, continued.
Common name Biological Survey Monitoring Range size (km2) % Global Alaska Systematic Peripheral score efforts efforts population occurrence significance
Sooty Grouse 5% Substantial Local 100,001 to 400,000 < 25% Yearround Species No Hairy Woodpecker 5% Substantial Local > 400,000 < 25% Yearround Species No Steller's Jay 4% Moderate Local > 400,000 < 25% Yearround Species Yes Hammond's Flycatcher 4% Moderate Local 100,001 to 400,000 < 25% Breeding Species No Ermine 4% Substantial Local > 400,000 < 25% Yearround Species No Swainson's Thrush 4% Substantial Local > 400,000 < 25% Breeding Species No Meadow vole 3% Substantial Local 100,001 to 400,000 < 25% Yearround Species No Root vole 2% Substantial None > 400,000 < 25% Yearround Species No Wilson's Snipe 2% Moderate Local 100,001 to 400,000 < 25% Yearround Species No Northwestern Crow 2% Moderate Local > 400,000 25 to 49% Yearround Species No Northern red-backed vole 2% Substantial Local > 400,000 < 25% Yearround Species No Pine Grosbeak 1% Moderate Local > 400,000 < 25% Yearround Genus No Dark-eyed Junco 1% Moderate Local 100,001 to 400,000 < 25% Yearround Species No Cliff Swallow 1% Moderate Local > 400,000 < 25% Breeding Species No Hermit Thrush 1% Substantial Local > 400,000 < 25% Breeding Species No Wood frog 0% Substantial Local > 400,000 < 25% Yearround Species No
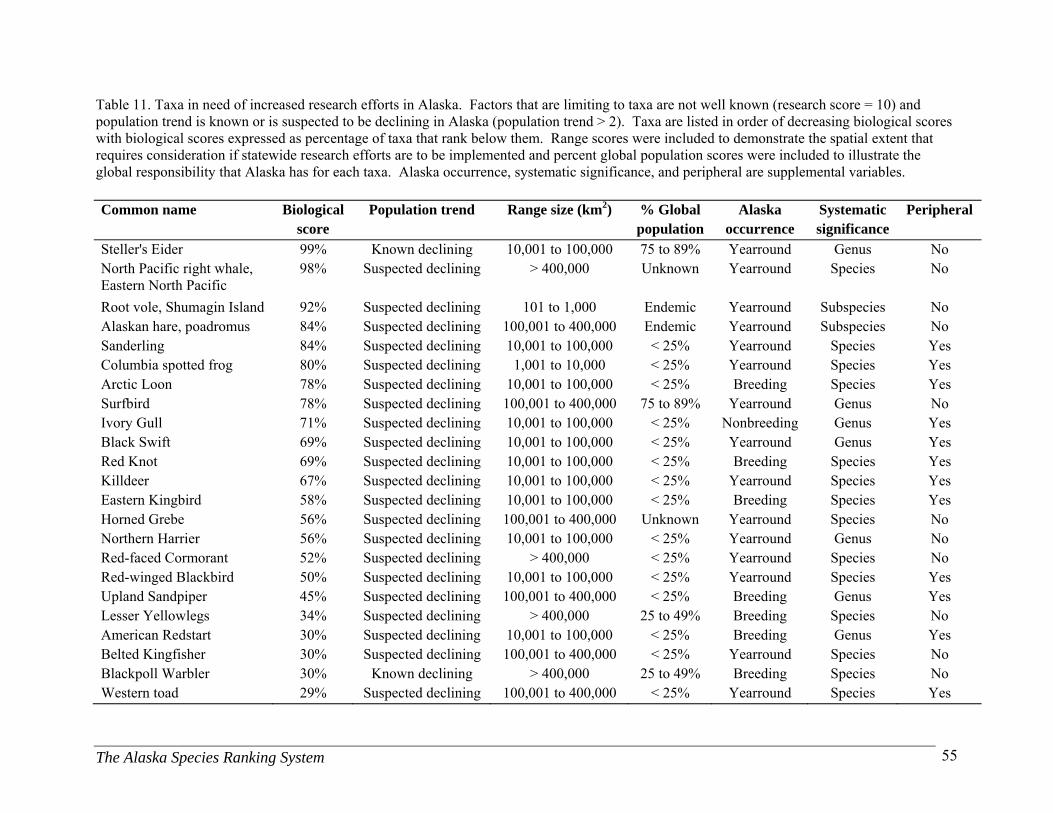
The Alaska Species Ranking System 55
Table 11. Taxa in need of increased research efforts in Alaska. Factors that are limiting to taxa are not well known (research score = 10) and population trend is known or is suspected to be declining in Alaska (population trend > 2). Taxa are listed in order of decreasing biological scores with biological scores expressed as percentage of taxa that rank below them. Range scores were included to demonstrate the spatial extent that requires consideration if statewide research efforts are to be implemented and percent global population scores were included to illustrate the global responsibility that Alaska has for each taxa. Alaska occurrence, systematic significance, and peripheral are supplemental variables. Common name Biological Population trend Range size (km2) % Global Alaska Systematic Peripheral score population occurrence significance
Steller's Eider 99% Known declining 10,001 to 100,000 75 to 89% Yearround Genus No North Pacific right whale, Eastern North Pacific
98% Suspected declining > 400,000 Unknown Yearround Species No
Root vole, Shumagin Island 92% Suspected declining 101 to 1,000 Endemic Yearround Subspecies No Alaskan hare, poadromus 84% Suspected declining 100,001 to 400,000 Endemic Yearround Subspecies No Sanderling 84% Suspected declining 10,001 to 100,000 < 25% Yearround Species Yes Columbia spotted frog 80% Suspected declining 1,001 to 10,000 < 25% Yearround Species Yes Arctic Loon 78% Suspected declining 10,001 to 100,000 < 25% Breeding Species Yes Surfbird 78% Suspected declining 100,001 to 400,000 75 to 89% Yearround Genus No Ivory Gull 71% Suspected declining 10,001 to 100,000 < 25% Nonbreeding Genus Yes Black Swift 69% Suspected declining 10,001 to 100,000 < 25% Yearround Genus Yes Red Knot 69% Suspected declining 10,001 to 100,000 < 25% Breeding Species Yes Killdeer 67% Suspected declining 10,001 to 100,000 < 25% Yearround Species Yes Eastern Kingbird 58% Suspected declining 10,001 to 100,000 < 25% Breeding Species Yes Horned Grebe 56% Suspected declining 100,001 to 400,000 Unknown Yearround Species No Northern Harrier 56% Suspected declining 10,001 to 100,000 < 25% Yearround Genus No Red-faced Cormorant 52% Suspected declining > 400,000 < 25% Yearround Species No Red-winged Blackbird 50% Suspected declining 10,001 to 100,000 < 25% Yearround Species Yes Upland Sandpiper 45% Suspected declining 100,001 to 400,000 < 25% Breeding Genus Yes Lesser Yellowlegs 34% Suspected declining > 400,000 25 to 49% Breeding Species No American Redstart 30% Suspected declining 10,001 to 100,000 < 25% Breeding Genus Yes Belted Kingfisher 30% Suspected declining 100,001 to 400,000 < 25% Yearround Species No Blackpoll Warbler 30% Known declining > 400,000 25 to 49% Breeding Species No Western toad 29% Suspected declining 100,001 to 400,000 < 25% Yearround Species Yes
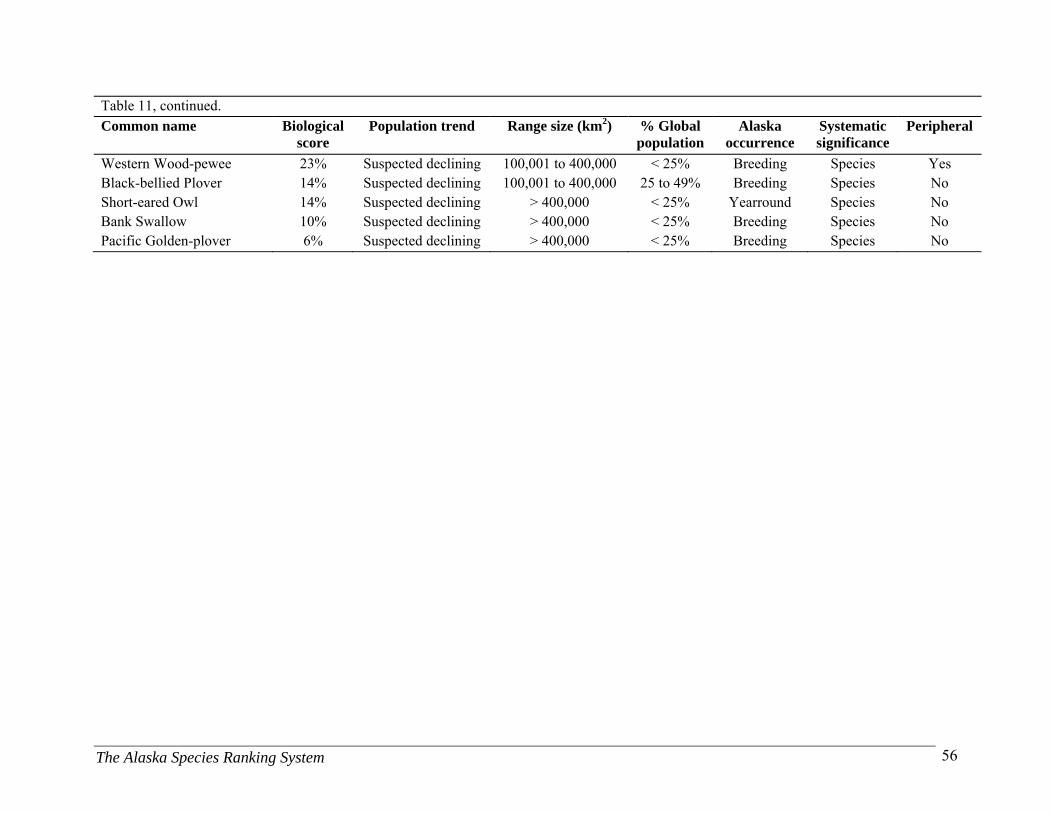
The Alaska Species Ranking System 56
Table 11, continued.
Common name Biological score
Population trend Range size (km2) % Global population
Alaska occurrence
Systematic significance
Peripheral
Western Wood-pewee 23% Suspected declining 100,001 to 400,000 < 25% Breeding Species Yes Black-bellied Plover 14% Suspected declining 100,001 to 400,000 25 to 49% Breeding Species No Short-eared Owl 14% Suspected declining > 400,000 < 25% Yearround Species No Bank Swallow 10% Suspected declining > 400,000 < 25% Breeding Species No Pacific Golden-plover 6% Suspected declining > 400,000 < 25% Breeding Species No
The Alaska Species Ranking System 57
CONCLUSIONS AND RECOMMENDATIONS Our goal was to develop a ranking system that would assist the ADF&G Nongame Program with setting priorities for wildlife conservation. The approach presented here provides an objective procedure for evaluating the status of vertebrate taxa in Alaska. The strengths of the ASRS include: answers to criteria are transparent and repeatable, ranks can be updated as better information becomes available, consistent criteria are used for all taxa, and there is flexibility in setting priorities as a result of separate subscores and sorting mechanisms. Results of the ASRS can now be used as a decision support tool to identify priority taxa for conservation and suggest gaps in our current knowledge that could be addressed by a variety of partners/organizations. Although we used the Millsap et al. (1990) classification system to guide development of the ASRS, it still took considerable time to modify the ranking and scoring system so that it was Alaska specific and better suited to ADF&G’s needs. This included two reviews by ADF&G staff, one after completion of the pilot project and another after all the taxa had been ranked, but not reviewed. Each review resulted in modifications to the ranking and scoring system. It is likely that further modifications may be warranted as ADF&G begins to use the system to address specific conservation issues in Alaska. Our knowledge of the ecology of vertebrate taxa in Alaska is far from complete; therefore any ranking system will be imperfect. Prioritization accuracy depends highly on the availability and quality of data (Baldi et al. 2001). Expert evaluation of unknown criteria could greatly improve the strength of the ranking system and subsequent results. Due to time and budgetary constraints, only a partial expert review of the criteria was completed. We recommend a full review for the remaining taxa as well as a peer review of the ranking system itself. Results from the variable analyses were not used to adjust the ranking system. Instead, they were included to alert users of the potential biases and limitations of the ASRS. In order to address the full array of wildlife-related issues in the state and fairly evaluate the system, a comprehensive assessment of all taxa is desirable. Millsap et al. (1990) ranked all vertebrate taxa in the state of Florida (including fishes) and found that the objective view provided by taxa ranks steered the Florida Nongame Wildlife Program into areas that were not intuitively obvious beforehand. Similar to Florida, we recommend a full ranking for all terrestrial vertebrate taxa in Alaska. The scope and uses of the ASRS exceed the results contained within this report. An Access database was developed to house all the species information gathered during this effort. The database provides biological and action scores based on the best available knowledge. To fully interpret and use the scores to guide decisions regarding conservation, users of the system should read the criteria justification provided in the database and acknowledge the extent of the expert review prior to drawing conclusions. We encourage users of the system to familiarize themselves with the ranking criteria and develop queries that are specific to the question(s) being asked. It is our hope that this database will continue to be updated as new information becomes available and will become a dynamic tool to help guide decision making by ADF&G for years to come.

The Alaska Species Ranking System 58
We hope that the results of this report and the corresponding ASRS database will be used by the ADF&G Nongame Program and others to guide conservation decisions regarding Alaska’s wildlife. However, we would like to emphasize that this report should be viewed as a living document. AKNHP is currently working with the ADF&G Nongame Program to initiate the final phase of this project. During the next three years we intend to: 1) complete ranking all remaining birds and mammals in Alaska; 2) update nomenclature and Heritage status ranks for previously ranked taxa; 3) update biological and action information for ASRS high ranking species; 4) make the ASRS database web accessible and automate the review process; 5) conduct a comprehensive expert review and incorporate those comments; and lastly, 6) conduct a project roll-out to present the database to potential users.
ACKNOWLEDGEMENTS Funding for this study was provided by Alaska Department of Fish and Game (ADF&G) and the Alaska Natural Heritage Program (AKNHP), University of Alaska Anchorage. We are especially grateful to Mary Rabe for her support and involvement in the project from its inception. We thank Dave Tessler, Matt Kirchoff, Jack Whitman, Sadie Wright, and Karen Blejwas for their help with the review process and their valuable comments. We would also like to thank Jodi McClory and Susan Klein for their assistance with consistency checks and editing. Lastly, we are especially grateful to Layne Adams, Greg Balogh, Gwen Baluss, Jay Barlow, Brett Barnes, Dee Boersma, Julia Boland, Douglas Burn, Vernon Byrd, Marilyn Dahlheim, Natalie Dawson, Bob Day, George Divoky, Kathy Frost, Bob Gill, Howard Golden, Chris Harwood, Chad Jay, Wally Johnson, Ian Jones, Steve Kendall, Matt Kirchoff, Michelle Kissling, Joanne Klima, Kathy Kuletz, Ellen Lance, Rick Lanctot, Bill Larned, Joe Liebezeit, Steve Lewis, Steve Matsuoka, Tamara Mills, Sue Moore, Guy Morrison, Laura Payne, Dave Person, Sanjay Pyare, Bill Pyle, Lori Quakenbush, Dale Rabe, Dan Roseneau, Dave Rugh, Dan Ruthrauff, Scott Schliebe, Stan Senner, Kim Sheldon, Paul Smith, Winston Smith, Iain Stenhouse, Rob Suryan, Bill Taylor, Dave Tessler, Diane Tracy, Mary Willson, Heather Wilson, Briana Witteveen, Denny Zweifelhofer for their time and energy spent on expert review, which greatly contributed to improving the accuracy and usefulness of the project.
The Alaska Species Ranking System 59
LITERATURE CITED Alaska Department of Fish and Game. 2006. Our wealth maintained: a strategy for conserving
Alaska’s diverse wildlife and fish resources. Alaska Department of Fish and Game, Juneau, Alaska. xviii + 824 pages.
Baldi, A., G. Csorba, and Z. Korsos. 2001. Setting priorities for the conservation of terrestrial
vertebrates in Hungary. Biodiversity and Conservation 10: 1283-1296. Bidlack, A. L. and J. A. Cook. 2001. Reduced genetic variation in insular northern flying
squirrels (Glaucomys sabrinus) along the North Pacific Coast. Animal Conservation 4:283-290.
Bunnell, F. L., R. W. Campbell, and K. A. Squires. 2004. Conservation priorities for peripheral
species: the example of British Columbia. Canadian Journal of Forest Research 34: 2240-2247.
Conroy, C. J., and J. A. Cook. 2000. Molecular systematics of a Holarctic rodent (Microtus:
Muridae). Journal of Mammalogy 81:344-359. Cook, J.A. and S.O. MacDonald. 2001. Should endemism be the focus of conservation efforts
along the North Pacific Coast of North America? Biological Conservation 97:207-213. Cook, J.A., A.L. Bidlack, C.J. Conroy, J.R. Demboski, M.A. Fleming, A.M. Runck, K.D. Stone
and S.O. MacDonald. 2001. A phylogeographic perspective on endemism in the Alexander Archipelago of southeast Alaska. Biological Conservation 97:215-227.
Cottingham. D., 2005. Letter to M. Oayne, Chief of the Marine Mammal Conservation Division,
NMFS regarding definition of “stock”. Bethesda, Maryland. Fraser, D.F. 2000. Species at the edge: the case for listing of “Peripheral” species. Pages 49-54
In: Proceedings of a Conference on the Biology and Management of Species and Habitats at Risk, Kamloops, B.C., 15 - 19 Feb.,1999. Volume One. B.C. Ministry of Environment, Lands and Parks, Victoria, B.C. and University College of the Cariboo, Kamloops, B.C.
Garrett, L. K. and R. G. Wright. 2000. Prioritizing the research and monitoring needs of
terrestrial mammals in national parks. George Wright Forum 17: 80-92. Knapp, S. M., R. E. Russell, and R. K. Swihart. 2003. Setting priorities for conservation: the
influence of uncertainty on species rankings of Indiana mammals. Biological Conservation 111: 223-234.
Lunney, D., A. Curtin, D. Ayers, H. G. Cogger, and C. R. Dickman. 1996. An ecological
approach to identifying the endangered fauna of New South Wales. Pacific Conservation Biology 2:212-231.
The Alaska Species Ranking System 60
MacDonald, S.O. and J.A. Cook. 1999. The mammal fauna of southeast Alaska. Univ. Alaska Museum. 145 pp.
MacDonald, S.O. and J.A. Cook. 2007. Mammals and amphibians of Southeast Alaska. The
Museum of Southwestern Biology, Special Publication 8:1-191. Master, L. L. 1991. Assessing threats and setting priorities for conservation. Conservation
Biology 5: 559-563. Master, L. L., L. E. Morse, A. S. Weakley, G. A. Hammerson, and D. Faber-Langendoen. 2003.
NatureServe conservation status criteria. NatureServe, Arlington, VA. Millsap, B. A., J. A. Gore, D. E. Runde, and S. I. Cerulean. 1990. Setting priorities for the
conservation of fish and wildlife in Florida. Wildlife Monograph No. 111. 57 pages. Regan, H. M., M. Colyvan, and M. A. Burgman. 2002. A taxonomy and treatment of uncertainty
for ecology and conservation biology. Ecological Applications 12: 618-628. Regan, T. J., L. L. Master, G. A. Hammerson. 2004. Capturing expert knowledge for threatened
species assessments: a case study using NatureServe conservation status ranks. Acta Oecologica 26: 95-107.
Regan, T. J., M. A. Burgman, M. A. McCarthy, L. L. Master, D. A. Keith, G. M. Mace, and S. J.
Andelman. 2005. The consistency of extinction risk classification protocols. Conservation Biology 19: 1969-1977.
Ritchie, S., G. Matula, and M. Stadler. 2005. Maine’s Comprehensive Wildlife Conservation
Strategy. Maine Department of Inland Fisheries and Wildlife. Augusta, ME. Sauer, J. R., J. E. Hines, and J. Fallon. 2008. The North American Breeding Bird Survey, Results
and Analysis 1966 - 2007. Version 5.15.2008. USGS Patuxent Wildlife Research Center, Laurel, MD.

The Alaska Species Ranking System 61
Appendix I. The Alaska Species Ranking System: Frequently Asked Questions. What is the objective of the Alaska Species Ranking System (ASRS)?
The goal of ASRS is to develop and implement a logical, consistent and transparent ranking system for wildlife species with conservation needs identified in Alaska’s Comprehensive Wildlife Conservation Strategy (CWCS).
What is the CWCS and how can I find out more about it?
Between 2003 and 2005, the Alaska Department of Fish and Game (ADF&G) led an effort to develop a comprehensive state wildlife conservation strategy for Alaska. With the completion and approval of Alaska’s CWCS in 2005, the ADF&G became eligible for congressional State Wildlife Grant (SWG) appropriations. The SWG program provides federal funds to states for the development and implementation of programs that benefit the full array of a state's wildlife (including birds, mammals, reptiles, amphibians, fish and aquatic and terrestrial invertebrates) and their habitats, especially species that have been underrepresented by traditional funding sources. For more information please visit: http://www.sf.adfg.state.ak.us/statewide/ngplan/index.cfm
Is ASRS a directive of the CWCS? The goal of Alaska’s CWCS (or “Strategy”) is to conserve the diversity of Alaska’s wildlife resources, focusing on those species with the greatest conservation need. Initially, the Alaska CWCS compiled a list of nominee taxa that contained 400 species of greatest conservation need. Although a number of evaluation criteria were considered to develop the nominee list, no criteria were used to objectively score species. This approach, along with the sizeable number of species, has limitations for guiding future project and funding decisions. To help remedy this, the CWCS identified the need for an objective ranking process and suggested that a key requirement was to complete a systematic statewide species ranking process as part of the state’s initial implementation effort. The ASRS was developed to meet this need. Results of the ASRS will be used to provide up-to-date species level information for strategic decision making, better-inform cooperators, allow for better inter-divisional coordination, and increase public support for wildlife conservation expenditures.
What are the advantages of the ASRS?
Advantages of the ASRS include scores that are explicit and traceable, the ability to update ranks as better information becomes available, and flexibility in setting priorities as a result of separate subscores and sorting mechanisms.
What criteria were used to rank taxa and how were these selected?
The ASRS closely follows the ranking scheme developed by Millsap et al. (1990) for the Florida Fish and Wildlife Conservation Commission (FF&WCC), although modifications (highlighted below) were made to improve its applicability to Alaska. Taxa are ranked based on two components: 1) Biological Scores represent biological vulnerability and are the sum of

The Alaska Species Ranking System 62
eight variables that reflect different aspects of a taxon’s distribution, abundance and life history; 2) Action Scores are the sum of individual scores for four variables that reflect the current state of knowledge regarding population status and the extent of conservation efforts directed toward a given taxon within Alaska. The ASRS also includes four Supplemental Variables, which are used to sort taxa to answer specific questions in relation to taxonomic significance, season of occurrence, harvest and whether or not a taxon is peripheral.
Where did the information for scoring come from?
Information on individual species biology and conservation status came from the Alaska Natural Heritage Program’s (AKNHP) database, peer-reviewed and gray literature, larger compilations (i.e. Birds of North America, marine mammal stock assessments), research data (i.e. BBS data, smaller agency datasets), and expert opinion.
What does it mean when a species has a high biological score?
A high biological score indicates that the species is more vulnerable to extirpation based on the best available population and life history information.
What is the possible range of biological scores?
Biological scores range from -80 (least vulnerable) to 80 (most vulnerable). What does it mean when a species has a high action score?
High action scores denote taxa with greater information needs due of lack of knowledge or conservation action.
What is the possible range of action scores?
Action scores range from -40 (fewer information needs) to 40 (more information needs). Why are some scores negative?
The Millsap et al. (1990) system, which served as the model for the ASRS, ranked biological and action variables on a scale of 0 to 10. When data were unavailable and expert opinion was lacking, the variable was considered unknown and received the lowest possible score (i.e. unknowns are assigned a value of zero). Consequently, taxa that were less known tended to be classified as less threatened. To better address the problem of missing data and to avoid scoring lesser known taxa as less threatened, we modified the ASRS scoring system so that scores for an individual variable range from 10 (highest) to -10 (lowest). In this positive to negative scoring system, missing data are assigned a value of 0, thereby receiving the middle score as opposed to the lowest score.
How did the ASRS incorporate unknown or missing information?
When an answer to a variable was deemed “unknown” we attempted to find species experts that could provide the needed information. If expert opinion was unavailable and the answer remained “unknown”, it was assigned a value of 0 (the middle score). See previous question for more details regarding the scoring system.
The Alaska Species Ranking System 63
How does ASRS deal with uncertainty? Within ranking systems such as the ASRS, uncertainty in scoring may arise from temporal, spatial, and environmental stochasticity, sampling variance, or data interpretation. One way to deal with uncertainty is to use weighted averages, because they provide the best balance between straightforward calculation and incorporating the full probability distribution. To account for uncertainty within the ASRS, the assessor is able to assign a probability to each response category when the response spanned two to three answers. From this, a weighted average is calculated for each attribute.
Are all wildlife species in Alaska included in the current ranking system?
No. Species selection for inclusion in the ASRS was driven by the CWCS Nominee Species List (Appendix 7 of the CWCS), which contained approximately 400 species of greatest conservation need in the state. We modified the Nominee Species List to reflect any recent changes to conservation status, taxonomic status, and occurrence in Alaska and excluded any taxa considered accidental and casual in their occurrence. Although two fish species were included during the pilot testing to insure that the ASRS worked across all taxa, fishes and invertebrates were excluded from the remainder of the ranking process. Overall, a total of 341 species, subspecies, or populations were included in the ranking including: 213 birds, 122 mammals, and 6 amphibians.
Are scores based on range wide information or restricted to information about the species in Alaska?
Both biological and action scores are based on a state wide perspective. This differs from the Millsap et al. (1990) system, which responded to the biological variables from a range wide (global) perspective (e.g., Population size: the estimated number of adults throughout the range of the taxon). We believe that conservation efforts in Alaska best address range wide issues by focusing conservation on taxa that face challenges within the state, as opposed to taxa that are challenged elsewhere but are secure in Alaska. However, range wide information was sometimes used to answer questions when state specific information was not available (e.g, range wide habitat requirements were often used when state level information was unavailable).
Are subspecies, populations, and marine mammal “stocks” included in the ASRS?
Yes, subspecies, populations, and marine mammal “stocks” identified in CWCS are included in ASRS. To enable users of the ASRS to query the system based on systematic significance of the taxon, we included a supplemental variable that allows for sorting based on whether a taxon is a monotypic family, monotypic genus, monotypic species, disjunct population below the species level, or an intergrading subspecies.
How was ASRS reviewed?
System development included a pilot project to rank a subset of the nominee taxa and evaluate the ranking system, an internal review by ADF&G Nongame staff after all taxa were ranked, an expert review for taxa with missing or uncertain information, and a consistency check across all variables.
The Alaska Species Ranking System 64
What constitutes a peripheral taxon? We define peripheral as any taxon at the edge of its range with less than 10% of its global range known to occur in Alaska. Due to Alaska’s unique geography, many taxa that occur in the state are at the northernmost limits of their ranges or occur irregularly in the state for very short time periods. While it is important to consider peripheral taxa in conservation decision making, it is also important to recognize that a taxon may be considered rare in Alaska because it is at the periphery of its range, but the same taxon may be widespread elsewhere. To assist resource managers in distinguishing those taxa for which Alaska bears significant global stewardship responsibility, we included a sorting variable in the ASRS to indicate “peripheral taxa.”
What are some ways the ASRS can be used?
The information contained within the ASRS project database can be queried in a myriad of ways to answer specific questions and set priorities regarding the conservation of Alaska’s wildlife. High biological scores can be used to identify taxa that are biologically vulnerable, while high action scores can be used to recognize taxa with greater information needs in regards to survey, monitoring, research and management. In addition to using straight biological and action scores to identify priority conservation targets, we also devised a categorical approach that combined the results of biological and action scores to assign taxa to different groups including those with high conservation needs, high biological vulnerability, high action needs, low conservation needs, peripheral taxa, and migrant taxa with small populations. We felt that the categorical approach was able to capture taxa that are priorities for conservation, while providing more insight into the specific reasons why. To help managers make more informed decisions in regards to conservation status, we also developed separate lists for each of the action criteria and provided explanations of how the lists could be sorted to identify priorities for surveys, monitoring and research.
Although we have provided several examples of how the results of the ASRS may be used to set priorities for conservation, they are by no means complete and we encourage users of the system to familiarize themselves with the ranking criteria and develop queries that are specific to the question(s) being asked.
Will the ASRS ever be expanded?
AKNHP is currently working with ADF&G to initiate the final phase of this project. The remainder of the project will include: 1) Completing ranking for all the remaining birds and mammals in Alaska; 2) Updating nomenclature and Heritage ranks for previously ranked taxa; 3) Updating ASRS ranks for high ranking species; 4) Making the ASRS database web accessible and automating the review process; 5) Conducting and incorporating expert reviews; 6) Conducting a project rollout to present the database to users.
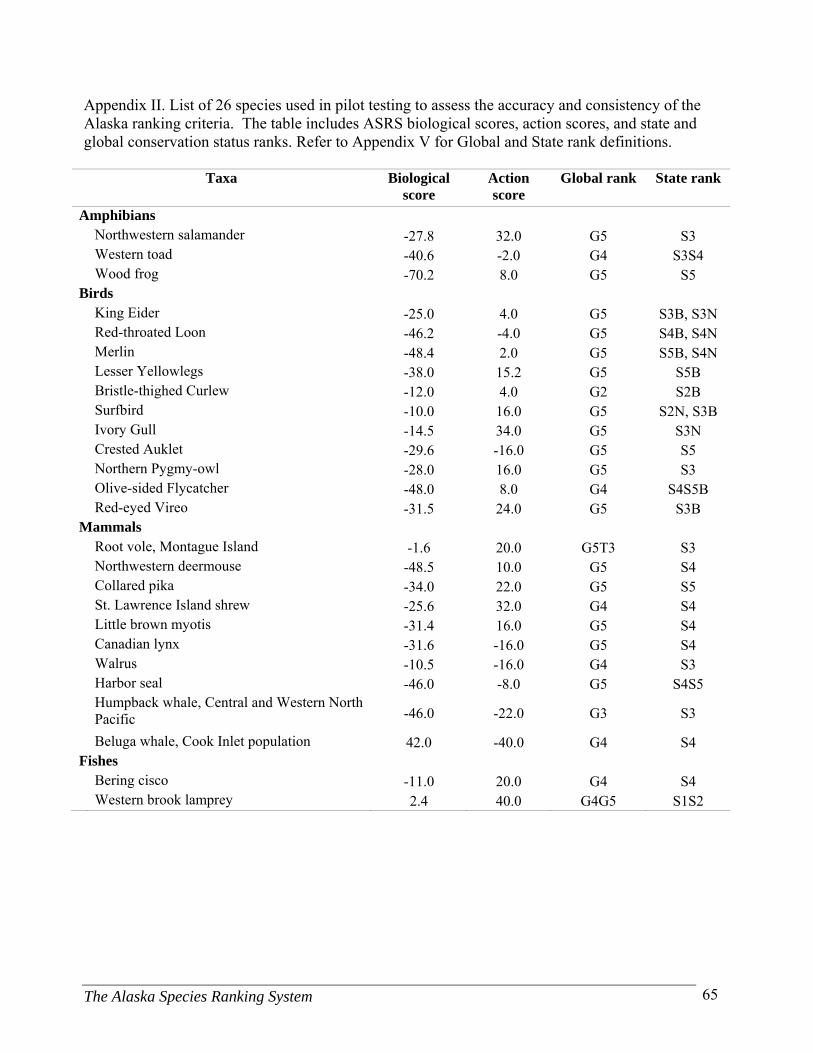
The Alaska Species Ranking System 65
Appendix II. List of 26 species used in pilot testing to assess the accuracy and consistency of the Alaska ranking criteria. The table includes ASRS biological scores, action scores, and state and global conservation status ranks. Refer to Appendix V for Global and State rank definitions.
Taxa Biological
score Action score
Global rank State rank
Amphibians Northwestern salamander -27.8 32.0 G5 S3 Western toad -40.6 -2.0 G4 S3S4 Wood frog -70.2 8.0 G5 S5 Birds King Eider -25.0 4.0 G5 S3B, S3N Red-throated Loon -46.2 -4.0 G5 S4B, S4N Merlin -48.4 2.0 G5 S5B, S4N Lesser Yellowlegs -38.0 15.2 G5 S5B Bristle-thighed Curlew -12.0 4.0 G2 S2B Surfbird -10.0 16.0 G5 S2N, S3B Ivory Gull -14.5 34.0 G5 S3N Crested Auklet -29.6 -16.0 G5 S5 Northern Pygmy-owl -28.0 16.0 G5 S3 Olive-sided Flycatcher -48.0 8.0 G4 S4S5B Red-eyed Vireo -31.5 24.0 G5 S3B Mammals Root vole, Montague Island -1.6 20.0 G5T3 S3 Northwestern deermouse -48.5 10.0 G5 S4 Collared pika -34.0 22.0 G5 S5 St. Lawrence Island shrew -25.6 32.0 G4 S4 Little brown myotis -31.4 16.0 G5 S4 Canadian lynx -31.6 -16.0 G5 S4 Walrus -10.5 -16.0 G4 S3 Harbor seal -46.0 -8.0 G5 S4S5 Humpback whale, Central and Western North
Pacific -46.0 -22.0 G3 S3
Beluga whale, Cook Inlet population 42.0 -40.0 G4 S4 Fishes Bering cisco -11.0 20.0 G4 S4 Western brook lamprey 2.4 40.0 G4G5 S1S2
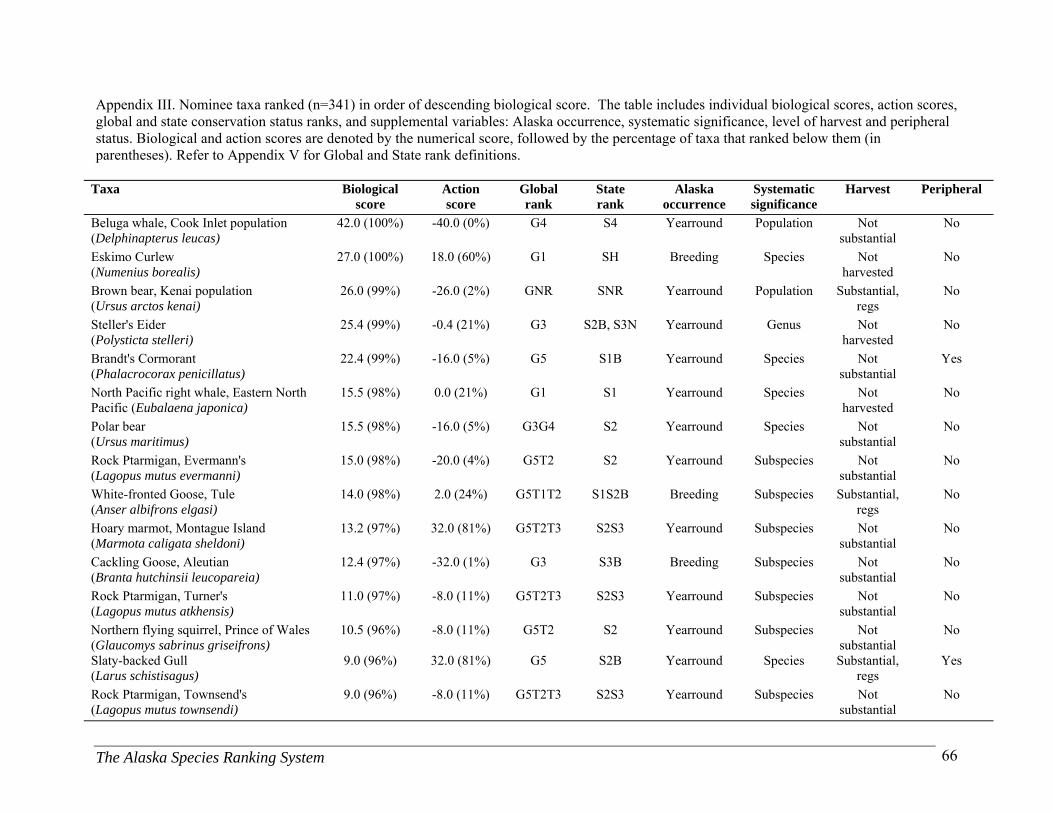
The Alaska Species Ranking System 66
Appendix III. Nominee taxa ranked (n=341) in order of descending biological score. The table includes individual biological scores, action scores, global and state conservation status ranks, and supplemental variables: Alaska occurrence, systematic significance, level of harvest and peripheral status. Biological and action scores are denoted by the numerical score, followed by the percentage of taxa that ranked below them (in parentheses). Refer to Appendix V for Global and State rank definitions.
Taxa Biological
score Action score
Global rank
State rank
Alaska occurrence
Systematic significance
Harvest Peripheral
Beluga whale, Cook Inlet population (Delphinapterus leucas)
42.0 (100%) -40.0 (0%) G4 S4 Yearround Population Not substantial
No
Eskimo Curlew (Numenius borealis)
27.0 (100%) 18.0 (60%) G1 SH Breeding Species Not harvested
No
Brown bear, Kenai population (Ursus arctos kenai)
26.0 (99%) -26.0 (2%) GNR SNR Yearround Population Substantial, regs
No
Steller's Eider (Polysticta stelleri)
25.4 (99%) -0.4 (21%) G3 S2B, S3N Yearround Genus Not harvested
No
Brandt's Cormorant (Phalacrocorax penicillatus)
22.4 (99%) -16.0 (5%) G5 S1B Yearround Species Not substantial
Yes
North Pacific right whale, Eastern North Pacific (Eubalaena japonica)
15.5 (98%) 0.0 (21%) G1 S1 Yearround Species Not harvested
No
Polar bear (Ursus maritimus)
15.5 (98%) -16.0 (5%) G3G4 S2 Yearround Species Not substantial
No
Rock Ptarmigan, Evermann's (Lagopus mutus evermanni)
15.0 (98%) -20.0 (4%) G5T2 S2 Yearround Subspecies Not substantial
No
White-fronted Goose, Tule (Anser albifrons elgasi)
14.0 (98%) 2.0 (24%) G5T1T2 S1S2B Breeding Subspecies Substantial, regs
No
Hoary marmot, Montague Island (Marmota caligata sheldoni)
13.2 (97%) 32.0 (81%) G5T2T3 S2S3 Yearround Subspecies Not substantial
No
Cackling Goose, Aleutian (Branta hutchinsii leucopareia)
12.4 (97%) -32.0 (1%) G3 S3B Breeding Subspecies Not substantial
No
Rock Ptarmigan, Turner's (Lagopus mutus atkhensis)
11.0 (97%) -8.0 (11%) G5T2T3 S2S3 Yearround Subspecies Not substantial
No
Northern flying squirrel, Prince of Wales (Glaucomys sabrinus griseifrons)
10.5 (96%) -8.0 (11%) G5T2 S2 Yearround Subspecies Not substantial
No
Slaty-backed Gull (Larus schistisagus)
9.0 (96%) 32.0 (81%) G5 S2B Yearround Species Substantial, regs
Yes
Rock Ptarmigan, Townsend's (Lagopus mutus townsendi)
9.0 (96%) -8.0 (11%) G5T2T3 S2S3 Yearround Subspecies Not substantial
No

The Alaska Species Ranking System 67
Appendix III, continued.
Taxa Biological score
Action score
Global rank
State rank
Alaska occurrence
Systematic significance
Harvest Peripheral
Arctic ground squirrel, Osgood's (Spermophilus parryii osgoodi)
8.1 (96%) 36.0 (94%) G5T3 S3 Yearround Subspecies Not substantial
No
Glacier Bay water shrew (Sorex alaskanus)
7.0 (95%) 40.0 (97%) GH SH Yearround Species Not substantial
No
Hoary marmot, Glacier Bay (Marmota caligata vigilis)
6.0 (95%) 40.0 (97%) G5T3 S3 Yearround Subspecies Not substantial
No
Brown lemming, black-footed (Lemmus trimucronatus nigripes)
6.0 (95%) 24.0 (65%) G5T2 S2 Yearround Subspecies Not substantial
No
Rock Sandpiper, Pribilof (Calidris ptilocnemis ptilocnemis)
4.0 (94%) 8.0 (33%) G5T3 S3B, S2N Yearround Subspecies Not harvested
No
Arctic ground squirrel, Kodiak Island (Spermophilus parryii kodiacensis)
2.6 (94%) 36.0 (94%) G5T3 S3 Yearround Subspecies Not substantial
No
Spruce Grouse, Prince of Wales (Falcipennis canadensis isleibi)
2.3 (94%) 24.0 (65%) GNR SNR Yearround Population Substantial, regs
No
Root vole, Shumagin Island (Microtus oeconomus popofensis)
2.0 (92%) 40.0 (97%) G5T2 S2 Yearround Subspecies Not substantial
No
Collared lemming, St. Lawrence Island (Dicrostonyx groenlandicus exsul)
2.0 (92%) 36.0 (94%) G5T3 S3 Yearround Subspecies Not substantial
No
McKay's Bunting (Plectrophenax hyperboreus)
2.0 (92%) 4.0 (25%) G3 S3 Yearround Species Not harvested
No
Song Sparrow, Aleutian (Melospiza melodia maxima)
2.0 (92%) 4.0 (25%) G5T4 S3 Yearround Subspecies Not harvested
No
Winter Wren, Semidi (Troglodytes troglodytes semidiensis)
2.0 (92%) -2.0 (20%) G5T2T3 S2S3 Yearround Subspecies Not harvested
No
Beaver, Admiralty (Castor canadensis phaeus)
1.0 (92%) 12.0 (42%) G5T3 S3 Yearround Subspecies Not harvested
No
Kittlitz's Murrelet (Brachyramphus brevirostris)
0.8 (92%) 10.4 (42%) G2 S2B,S2N Yearround Species Not substantial
No
Red-legged Kittiwake (Rissa brevirostris)
0.4 (91%) 5.0 (32%) G2G3 S2S3B, S2N
Yearround Species Not substantial
No
Winter Wren, Pribilof (Troglodytes troglodytes alascensis)
0.0 (91%) 10.0 (41%) G5T2 S2 Yearround Subspecies Not harvested
No
Ermine, Admiralty Island (Mustela erminea salva)
-0.4 (91%) 24.0 (65%) G5T2T3 S2S3 Yearround Subspecies Substantial, regs
No
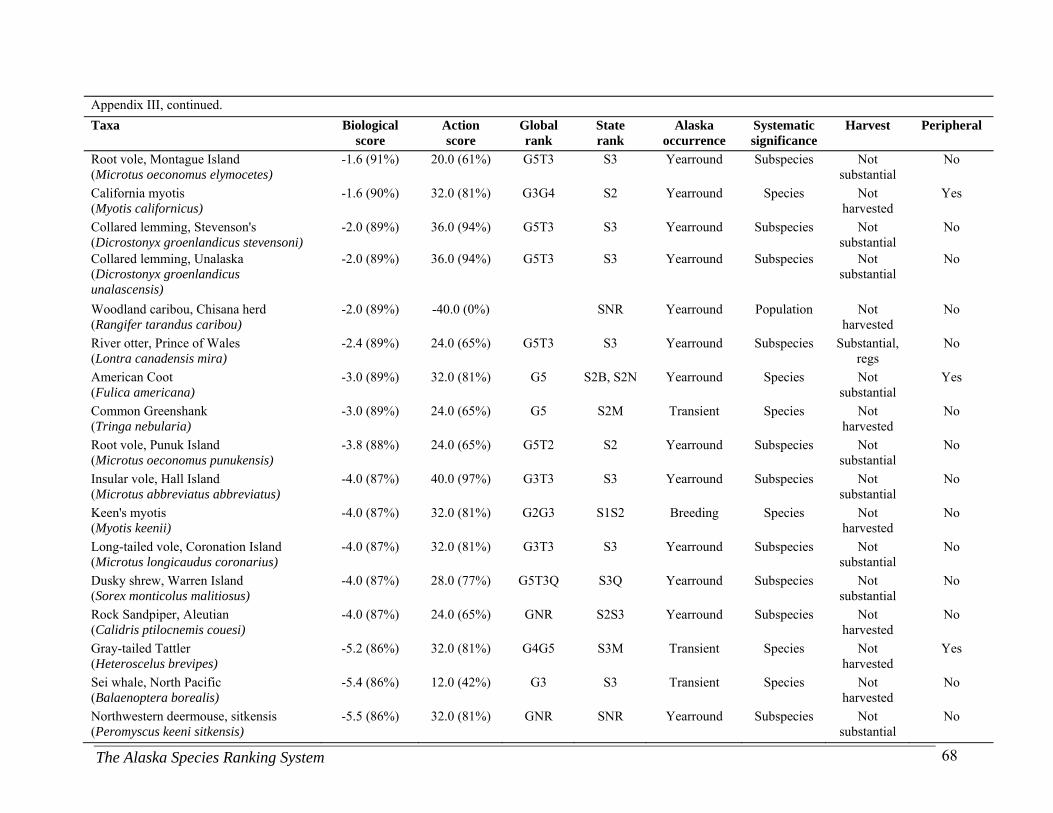
The Alaska Species Ranking System 68
Appendix III, continued.
Taxa Biological score
Action score
Global rank
State rank
Alaska occurrence
Systematic significance
Harvest Peripheral
Root vole, Montague Island (Microtus oeconomus elymocetes)
-1.6 (91%) 20.0 (61%) G5T3 S3 Yearround Subspecies Not substantial
No
California myotis (Myotis californicus)
-1.6 (90%) 32.0 (81%) G3G4 S2 Yearround Species Not harvested
Yes
Collared lemming, Stevenson's (Dicrostonyx groenlandicus stevensoni)
-2.0 (89%) 36.0 (94%) G5T3 S3 Yearround Subspecies Not substantial
No
Collared lemming, Unalaska (Dicrostonyx groenlandicus unalascensis)
-2.0 (89%) 36.0 (94%) G5T3 S3 Yearround Subspecies Not substantial
No
Woodland caribou, Chisana herd (Rangifer tarandus caribou)
-2.0 (89%) -40.0 (0%) SNR Yearround Population Not harvested
No
River otter, Prince of Wales (Lontra canadensis mira)
-2.4 (89%) 24.0 (65%) G5T3 S3 Yearround Subspecies Substantial, regs
No
American Coot (Fulica americana)
-3.0 (89%) 32.0 (81%) G5 S2B, S2N Yearround Species Not substantial
Yes
Common Greenshank (Tringa nebularia)
-3.0 (89%) 24.0 (65%) G5 S2M Transient Species Not harvested
No
Root vole, Punuk Island (Microtus oeconomus punukensis)
-3.8 (88%) 24.0 (65%) G5T2 S2 Yearround Subspecies Not substantial
No
Insular vole, Hall Island (Microtus abbreviatus abbreviatus)
-4.0 (87%) 40.0 (97%) G3T3 S3 Yearround Subspecies Not substantial
No
Keen's myotis (Myotis keenii)
-4.0 (87%) 32.0 (81%) G2G3 S1S2 Breeding Species Not harvested
No
Long-tailed vole, Coronation Island (Microtus longicaudus coronarius)
-4.0 (87%) 32.0 (81%) G3T3 S3 Yearround Subspecies Not substantial
No
Dusky shrew, Warren Island (Sorex monticolus malitiosus)
-4.0 (87%) 28.0 (77%) G5T3Q S3Q Yearround Subspecies Not substantial
No
Rock Sandpiper, Aleutian (Calidris ptilocnemis couesi)
-4.0 (87%) 24.0 (65%) GNR S2S3 Yearround Subspecies Not harvested
No
Gray-tailed Tattler (Heteroscelus brevipes)
-5.2 (86%) 32.0 (81%) G4G5 S3M Transient Species Not harvested
Yes
Sei whale, North Pacific (Balaenoptera borealis)
-5.4 (86%) 12.0 (42%) G3 S3 Transient Species Not harvested
No
Northwestern deermouse, sitkensis (Peromyscus keeni sitkensis)
-5.5 (86%) 32.0 (81%) GNR SNR Yearround Subspecies Not substantial
No
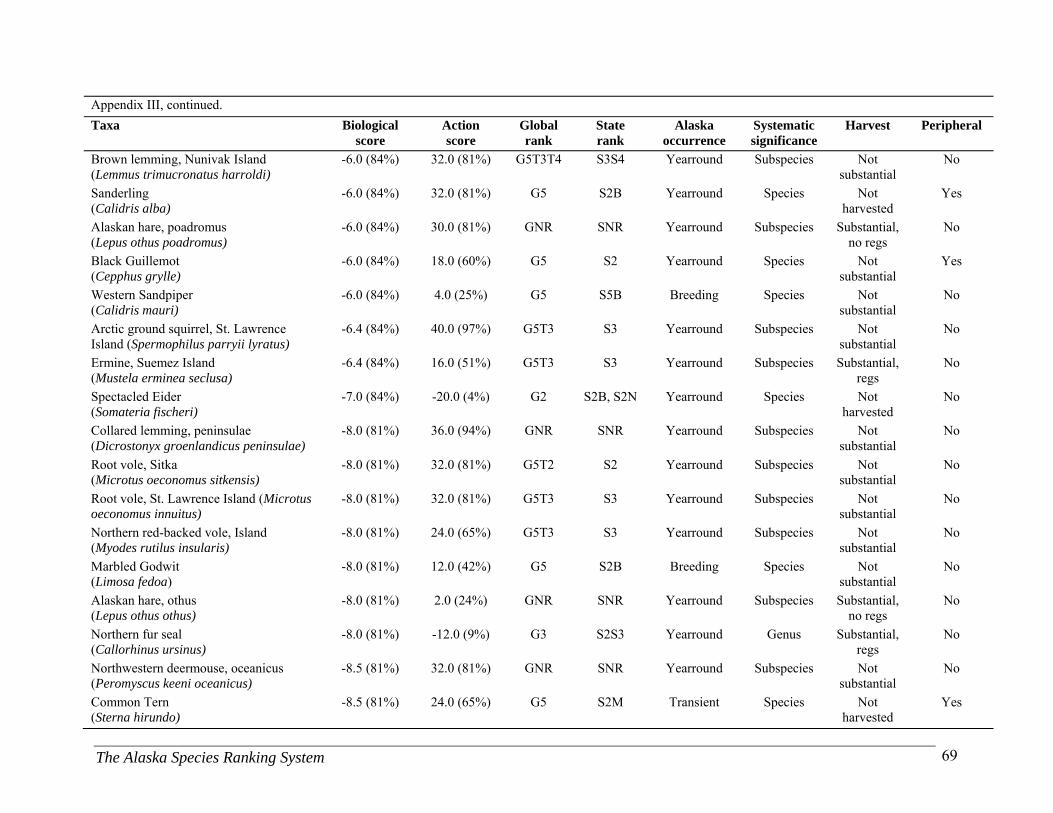
The Alaska Species Ranking System 69
Appendix III, continued.
Taxa Biological score
Action score
Global rank
State rank
Alaska occurrence
Systematic significance
Harvest Peripheral
Brown lemming, Nunivak Island (Lemmus trimucronatus harroldi)
-6.0 (84%) 32.0 (81%) G5T3T4 S3S4 Yearround Subspecies Not substantial
No
Sanderling (Calidris alba)
-6.0 (84%) 32.0 (81%) G5 S2B Yearround Species Not harvested
Yes
Alaskan hare, poadromus (Lepus othus poadromus)
-6.0 (84%) 30.0 (81%) GNR SNR Yearround Subspecies Substantial, no regs
No
Black Guillemot (Cepphus grylle)
-6.0 (84%) 18.0 (60%) G5 S2 Yearround Species Not substantial
Yes
Western Sandpiper (Calidris mauri)
-6.0 (84%) 4.0 (25%) G5 S5B Breeding Species Not substantial
No
Arctic ground squirrel, St. Lawrence Island (Spermophilus parryii lyratus)
-6.4 (84%) 40.0 (97%) G5T3 S3 Yearround Subspecies Not substantial
No
Ermine, Suemez Island (Mustela erminea seclusa)
-6.4 (84%) 16.0 (51%) G5T3 S3 Yearround Subspecies Substantial, regs
No
Spectacled Eider (Somateria fischeri)
-7.0 (84%) -20.0 (4%) G2 S2B, S2N Yearround Species Not harvested
No
Collared lemming, peninsulae (Dicrostonyx groenlandicus peninsulae)
-8.0 (81%) 36.0 (94%) GNR SNR Yearround Subspecies Not substantial
No
Root vole, Sitka (Microtus oeconomus sitkensis)
-8.0 (81%) 32.0 (81%) G5T2 S2 Yearround Subspecies Not substantial
No
Root vole, St. Lawrence Island (Microtus oeconomus innuitus)
-8.0 (81%) 32.0 (81%) G5T3 S3 Yearround Subspecies Not substantial
No
Northern red-backed vole, Island (Myodes rutilus insularis)
-8.0 (81%) 24.0 (65%) G5T3 S3 Yearround Subspecies Not substantial
No
Marbled Godwit (Limosa fedoa)
-8.0 (81%) 12.0 (42%) G5 S2B Breeding Species Not substantial
No
Alaskan hare, othus (Lepus othus othus)
-8.0 (81%) 2.0 (24%) GNR SNR Yearround Subspecies Substantial, no regs
No
Northern fur seal (Callorhinus ursinus)
-8.0 (81%) -12.0 (9%) G3 S2S3 Yearround Genus Substantial, regs
No
Northwestern deermouse, oceanicus (Peromyscus keeni oceanicus)
-8.5 (81%) 32.0 (81%) GNR SNR Yearround Subspecies Not substantial
No
Common Tern (Sterna hirundo)
-8.5 (81%) 24.0 (65%) G5 S2M Transient Species Not harvested
Yes
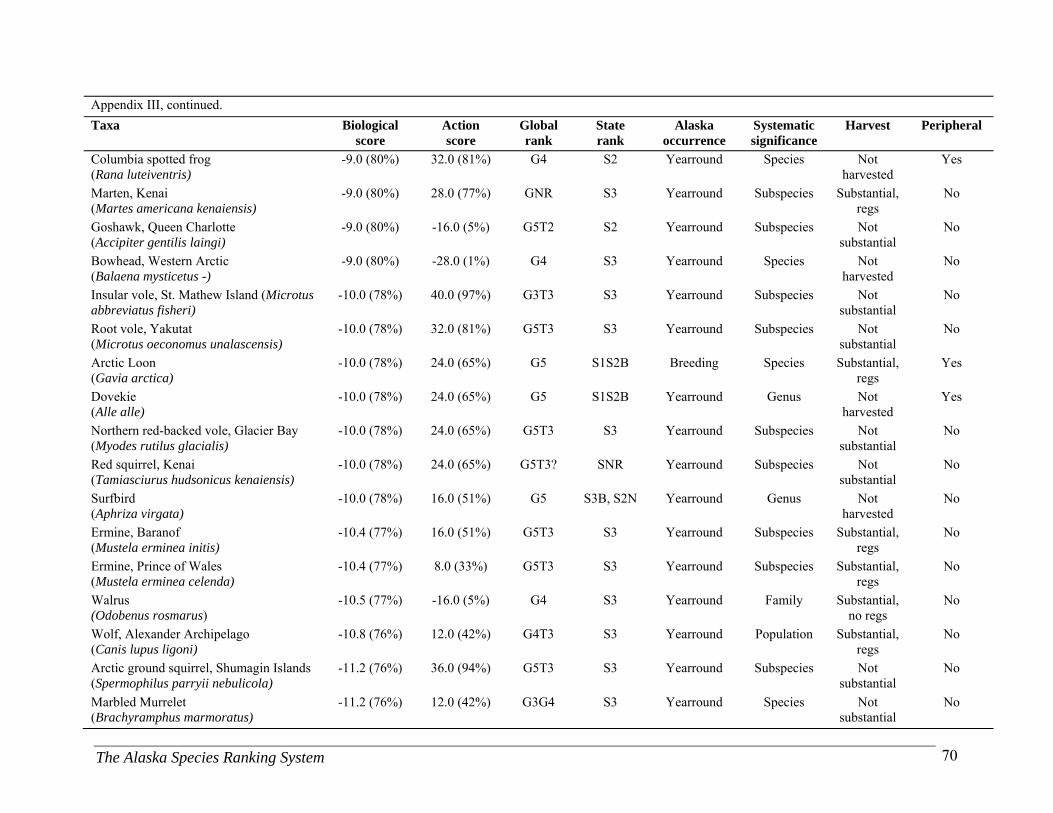
The Alaska Species Ranking System 70
Appendix III, continued.
Taxa Biological score
Action score
Global rank
State rank
Alaska occurrence
Systematic significance
Harvest Peripheral
Columbia spotted frog (Rana luteiventris)
-9.0 (80%) 32.0 (81%) G4 S2 Yearround Species Not harvested
Yes
Marten, Kenai (Martes americana kenaiensis)
-9.0 (80%) 28.0 (77%) GNR S3 Yearround Subspecies Substantial, regs
No
Goshawk, Queen Charlotte (Accipiter gentilis laingi)
-9.0 (80%) -16.0 (5%) G5T2 S2 Yearround Subspecies Not substantial
No
Bowhead, Western Arctic (Balaena mysticetus -)
-9.0 (80%) -28.0 (1%) G4 S3 Yearround Species Not harvested
No
Insular vole, St. Mathew Island (Microtus abbreviatus fisheri)
-10.0 (78%) 40.0 (97%) G3T3 S3 Yearround Subspecies Not substantial
No
Root vole, Yakutat (Microtus oeconomus unalascensis)
-10.0 (78%) 32.0 (81%) G5T3 S3 Yearround Subspecies Not substantial
No
Arctic Loon (Gavia arctica)
-10.0 (78%) 24.0 (65%) G5 S1S2B Breeding Species Substantial, regs
Yes
Dovekie (Alle alle)
-10.0 (78%) 24.0 (65%) G5 S1S2B Yearround Genus Not harvested
Yes
Northern red-backed vole, Glacier Bay (Myodes rutilus glacialis)
-10.0 (78%) 24.0 (65%) G5T3 S3 Yearround Subspecies Not substantial
No
Red squirrel, Kenai (Tamiasciurus hudsonicus kenaiensis)
-10.0 (78%) 24.0 (65%) G5T3? SNR Yearround Subspecies Not substantial
No
Surfbird (Aphriza virgata)
-10.0 (78%) 16.0 (51%) G5 S3B, S2N Yearround Genus Not harvested
No
Ermine, Baranof (Mustela erminea initis)
-10.4 (77%) 16.0 (51%) G5T3 S3 Yearround Subspecies Substantial, regs
No
Ermine, Prince of Wales (Mustela erminea celenda)
-10.4 (77%) 8.0 (33%) G5T3 S3 Yearround Subspecies Substantial, regs
No
Walrus (Odobenus rosmarus)
-10.5 (77%) -16.0 (5%) G4 S3 Yearround Family Substantial, no regs
No
Wolf, Alexander Archipelago (Canis lupus ligoni)
-10.8 (76%) 12.0 (42%) G4T3 S3 Yearround Population Substantial, regs
No
Arctic ground squirrel, Shumagin Islands (Spermophilus parryii nebulicola)
-11.2 (76%) 36.0 (94%) G5T3 S3 Yearround Subspecies Not substantial
No
Marbled Murrelet (Brachyramphus marmoratus)
-11.2 (76%) 12.0 (42%) G3G4 S3 Yearround Species Not substantial
No
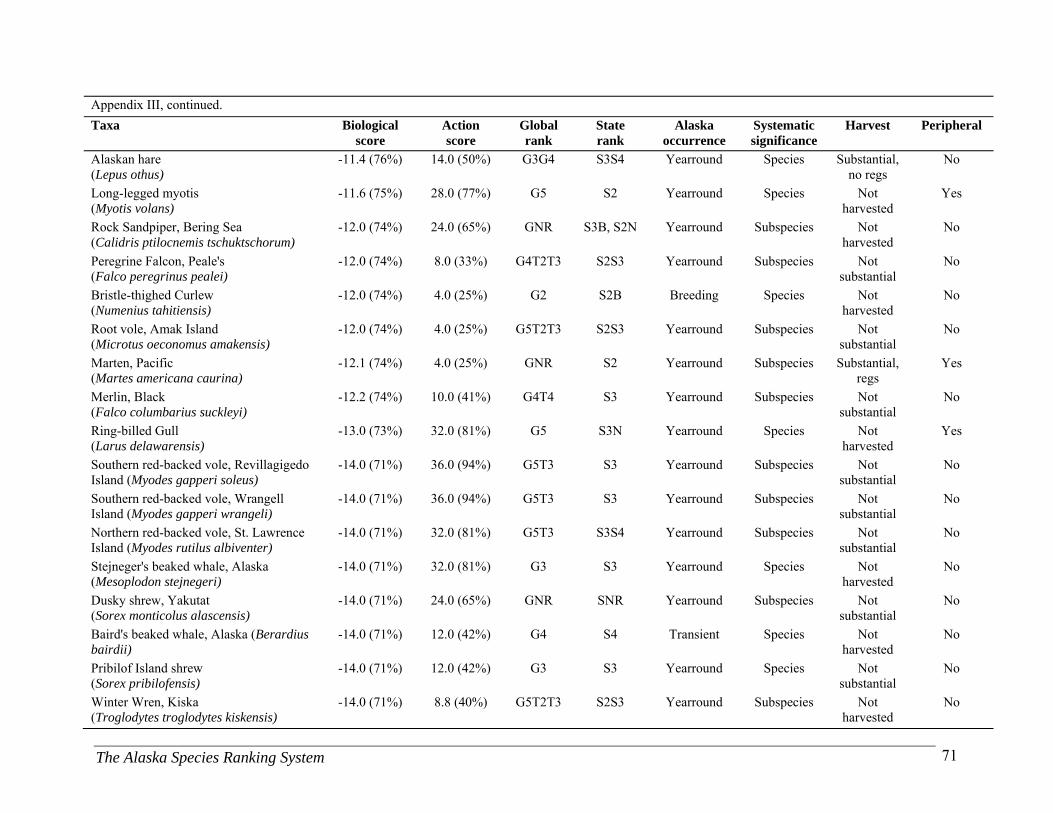
The Alaska Species Ranking System 71
Appendix III, continued.
Taxa Biological score
Action score
Global rank
State rank
Alaska occurrence
Systematic significance
Harvest Peripheral
Alaskan hare (Lepus othus)
-11.4 (76%) 14.0 (50%) G3G4 S3S4 Yearround Species Substantial, no regs
No
Long-legged myotis (Myotis volans)
-11.6 (75%) 28.0 (77%) G5 S2 Yearround Species Not harvested
Yes
Rock Sandpiper, Bering Sea (Calidris ptilocnemis tschuktschorum)
-12.0 (74%) 24.0 (65%) GNR S3B, S2N Yearround Subspecies Not harvested
No
Peregrine Falcon, Peale's (Falco peregrinus pealei)
-12.0 (74%) 8.0 (33%) G4T2T3 S2S3 Yearround Subspecies Not substantial
No
Bristle-thighed Curlew (Numenius tahitiensis)
-12.0 (74%) 4.0 (25%) G2 S2B Breeding Species Not harvested
No
Root vole, Amak Island (Microtus oeconomus amakensis)
-12.0 (74%) 4.0 (25%) G5T2T3 S2S3 Yearround Subspecies Not substantial
No
Marten, Pacific (Martes americana caurina)
-12.1 (74%) 4.0 (25%) GNR S2 Yearround Subspecies Substantial, regs
Yes
Merlin, Black (Falco columbarius suckleyi)
-12.2 (74%) 10.0 (41%) G4T4 S3 Yearround Subspecies Not substantial
No
Ring-billed Gull (Larus delawarensis)
-13.0 (73%) 32.0 (81%) G5 S3N Yearround Species Not harvested
Yes
Southern red-backed vole, Revillagigedo Island (Myodes gapperi soleus)
-14.0 (71%) 36.0 (94%) G5T3 S3 Yearround Subspecies Not substantial
No
Southern red-backed vole, Wrangell Island (Myodes gapperi wrangeli)
-14.0 (71%) 36.0 (94%) G5T3 S3 Yearround Subspecies Not substantial
No
Northern red-backed vole, St. Lawrence Island (Myodes rutilus albiventer)
-14.0 (71%) 32.0 (81%) G5T3 S3S4 Yearround Subspecies Not substantial
No
Stejneger's beaked whale, Alaska (Mesoplodon stejnegeri)
-14.0 (71%) 32.0 (81%) G3 S3 Yearround Species Not harvested
No
Dusky shrew, Yakutat (Sorex monticolus alascensis)
-14.0 (71%) 24.0 (65%) GNR SNR Yearround Subspecies Not substantial
No
Baird's beaked whale, Alaska (Berardius bairdii)
-14.0 (71%) 12.0 (42%) G4 S4 Transient Species Not harvested
No
Pribilof Island shrew (Sorex pribilofensis)
-14.0 (71%) 12.0 (42%) G3 S3 Yearround Species Not substantial
No
Winter Wren, Kiska (Troglodytes troglodytes kiskensis)
-14.0 (71%) 8.8 (40%) G5T2T3 S2S3 Yearround Subspecies Not harvested
No
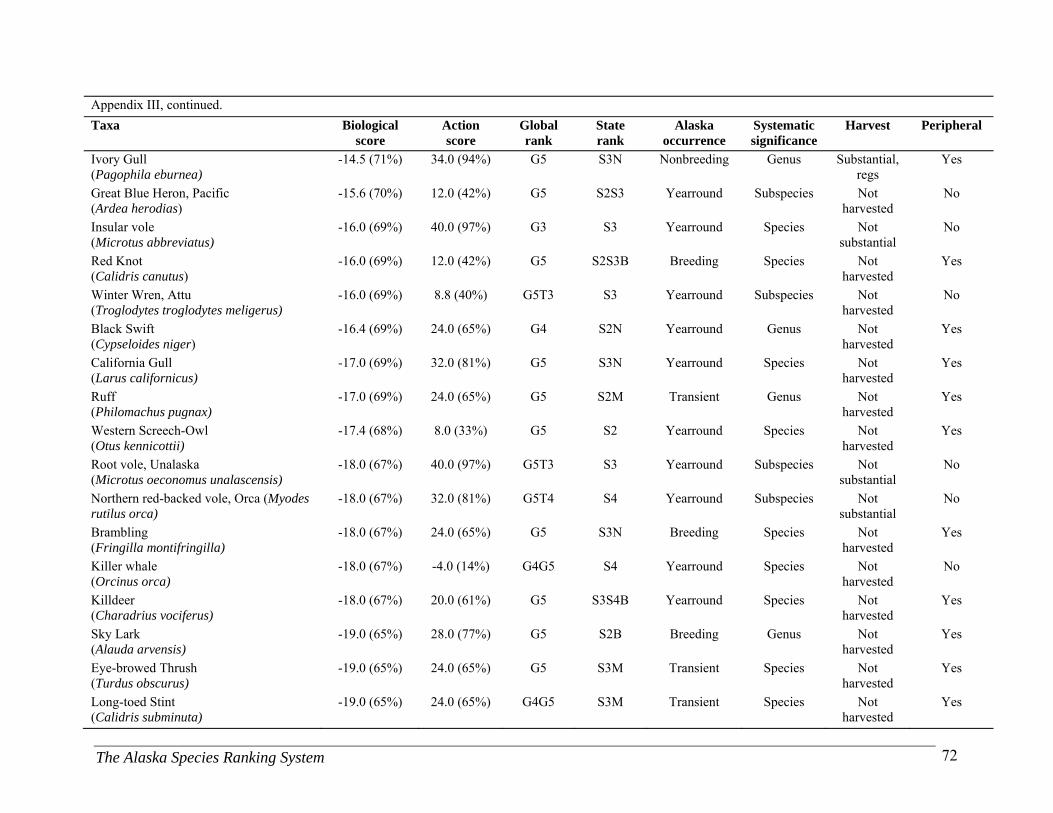
The Alaska Species Ranking System 72
Appendix III, continued.
Taxa Biological score
Action score
Global rank
State rank
Alaska occurrence
Systematic significance
Harvest Peripheral
Ivory Gull (Pagophila eburnea)
-14.5 (71%) 34.0 (94%) G5 S3N Nonbreeding Genus Substantial, regs
Yes
Great Blue Heron, Pacific (Ardea herodias)
-15.6 (70%) 12.0 (42%) G5 S2S3 Yearround Subspecies Not harvested
No
Insular vole (Microtus abbreviatus)
-16.0 (69%) 40.0 (97%) G3 S3 Yearround Species Not substantial
No
Red Knot (Calidris canutus)
-16.0 (69%) 12.0 (42%) G5 S2S3B Breeding Species Not harvested
Yes
Winter Wren, Attu (Troglodytes troglodytes meligerus)
-16.0 (69%) 8.8 (40%) G5T3 S3 Yearround Subspecies Not harvested
No
Black Swift (Cypseloides niger)
-16.4 (69%) 24.0 (65%) G4 S2N Yearround Genus Not harvested
Yes
California Gull (Larus californicus)
-17.0 (69%) 32.0 (81%) G5 S3N Yearround Species Not harvested
Yes
Ruff (Philomachus pugnax)
-17.0 (69%) 24.0 (65%) G5 S2M Transient Genus Not harvested
Yes
Western Screech-Owl (Otus kennicottii)
-17.4 (68%) 8.0 (33%) G5 S2 Yearround Species Not harvested
Yes
Root vole, Unalaska (Microtus oeconomus unalascensis)
-18.0 (67%) 40.0 (97%) G5T3 S3 Yearround Subspecies Not substantial
No
Northern red-backed vole, Orca (Myodes rutilus orca)
-18.0 (67%) 32.0 (81%) G5T4 S4 Yearround Subspecies Not substantial
No
Brambling (Fringilla montifringilla)
-18.0 (67%) 24.0 (65%) G5 S3N Breeding Species Not harvested
Yes
Killer whale (Orcinus orca)
-18.0 (67%) -4.0 (14%) G4G5 S4 Yearround Species Not harvested
No
Killdeer (Charadrius vociferus)
-18.0 (67%) 20.0 (61%) G5 S3S4B Yearround Species Not harvested
Yes
Sky Lark (Alauda arvensis)
-19.0 (65%) 28.0 (77%) G5 S2B Breeding Genus Not harvested
Yes
Eye-browed Thrush (Turdus obscurus)
-19.0 (65%) 24.0 (65%) G5 S3M Transient Species Not harvested
Yes
Long-toed Stint (Calidris subminuta)
-19.0 (65%) 24.0 (65%) G4G5 S3M Transient Species Not harvested
Yes
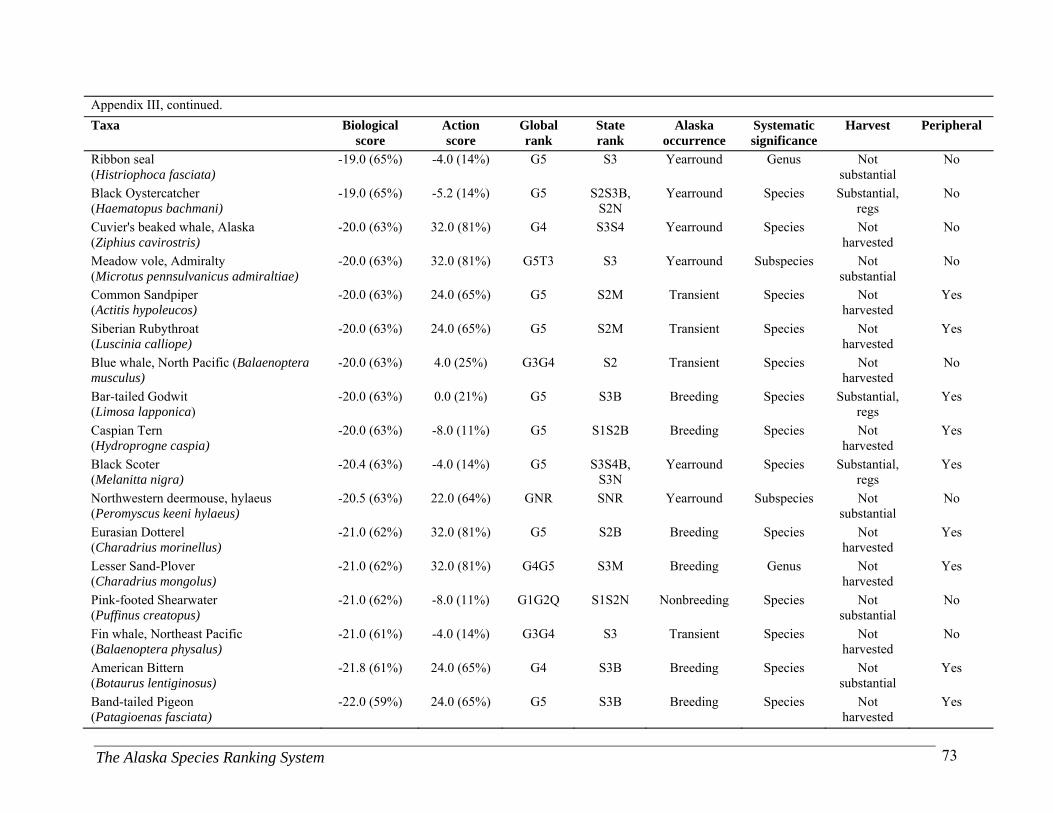
The Alaska Species Ranking System 73
Appendix III, continued.
Taxa Biological score
Action score
Global rank
State rank
Alaska occurrence
Systematic significance
Harvest Peripheral
Ribbon seal (Histriophoca fasciata)
-19.0 (65%) -4.0 (14%) G5 S3 Yearround Genus Not substantial
No
Black Oystercatcher (Haematopus bachmani)
-19.0 (65%) -5.2 (14%) G5 S2S3B, S2N
Yearround Species Substantial, regs
No
Cuvier's beaked whale, Alaska (Ziphius cavirostris)
-20.0 (63%) 32.0 (81%) G4 S3S4 Yearround Species Not harvested
No
Meadow vole, Admiralty (Microtus pennsulvanicus admiraltiae)
-20.0 (63%) 32.0 (81%) G5T3 S3 Yearround Subspecies Not substantial
No
Common Sandpiper (Actitis hypoleucos)
-20.0 (63%) 24.0 (65%) G5 S2M Transient Species Not harvested
Yes
Siberian Rubythroat (Luscinia calliope)
-20.0 (63%) 24.0 (65%) G5 S2M Transient Species Not harvested
Yes
Blue whale, North Pacific (Balaenoptera musculus)
-20.0 (63%) 4.0 (25%) G3G4 S2 Transient Species Not harvested
No
Bar-tailed Godwit (Limosa lapponica)
-20.0 (63%) 0.0 (21%) G5 S3B Breeding Species Substantial, regs
Yes
Caspian Tern (Hydroprogne caspia)
-20.0 (63%) -8.0 (11%) G5 S1S2B Breeding Species Not harvested
Yes
Black Scoter (Melanitta nigra)
-20.4 (63%) -4.0 (14%) G5 S3S4B, S3N
Yearround Species Substantial, regs
Yes
Northwestern deermouse, hylaeus (Peromyscus keeni hylaeus)
-20.5 (63%) 22.0 (64%) GNR SNR Yearround Subspecies Not substantial
No
Eurasian Dotterel (Charadrius morinellus)
-21.0 (62%) 32.0 (81%) G5 S2B Breeding Species Not harvested
Yes
Lesser Sand-Plover (Charadrius mongolus)
-21.0 (62%) 32.0 (81%) G4G5 S3M Breeding Genus Not harvested
Yes
Pink-footed Shearwater (Puffinus creatopus)
-21.0 (62%) -8.0 (11%) G1G2Q S1S2N Nonbreeding Species Not substantial
No
Fin whale, Northeast Pacific (Balaenoptera physalus)
-21.0 (61%) -4.0 (14%) G3G4 S3 Transient Species Not harvested
No
American Bittern (Botaurus lentiginosus)
-21.8 (61%) 24.0 (65%) G4 S3B Breeding Species Not substantial
Yes
Band-tailed Pigeon (Patagioenas fasciata)
-22.0 (59%) 24.0 (65%) G5 S3B Breeding Species Not harvested
Yes
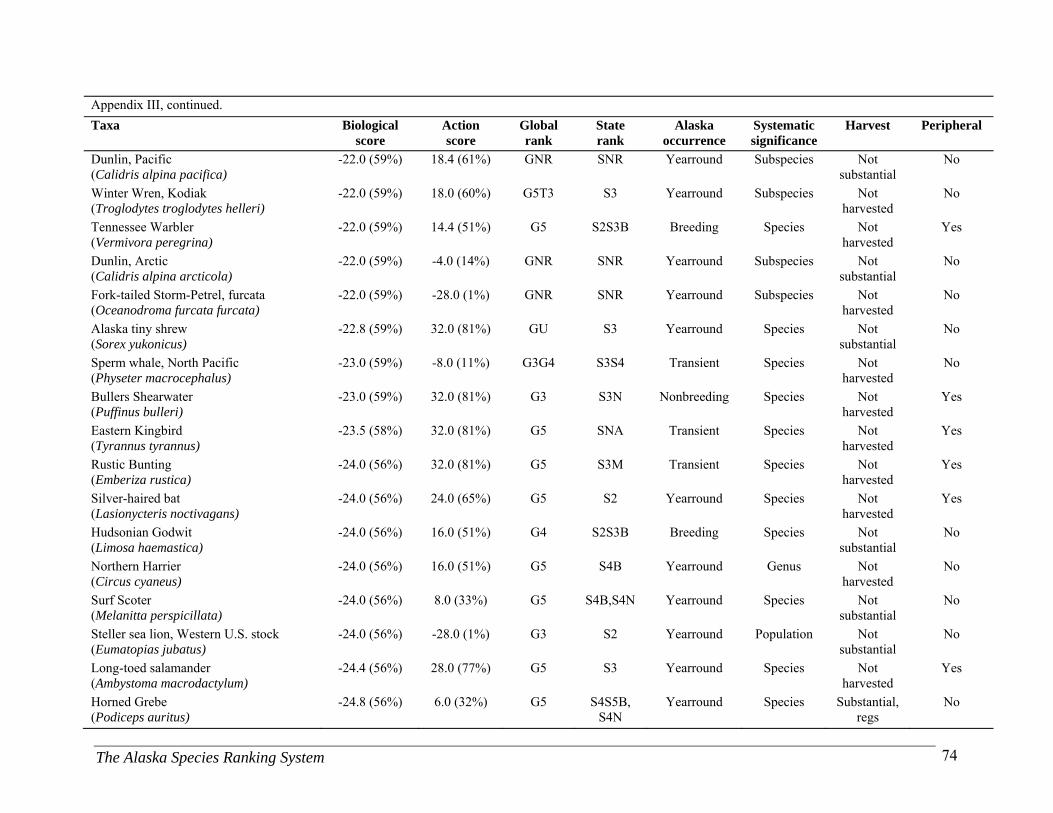
The Alaska Species Ranking System 74
Appendix III, continued.
Taxa Biological score
Action score
Global rank
State rank
Alaska occurrence
Systematic significance
Harvest Peripheral
Dunlin, Pacific (Calidris alpina pacifica)
-22.0 (59%) 18.4 (61%) GNR SNR Yearround Subspecies Not substantial
No
Winter Wren, Kodiak (Troglodytes troglodytes helleri)
-22.0 (59%) 18.0 (60%) G5T3 S3 Yearround Subspecies Not harvested
No
Tennessee Warbler (Vermivora peregrina)
-22.0 (59%) 14.4 (51%) G5 S2S3B Breeding Species Not harvested
Yes
Dunlin, Arctic (Calidris alpina arcticola)
-22.0 (59%) -4.0 (14%) GNR SNR Yearround Subspecies Not substantial
No
Fork-tailed Storm-Petrel, furcata (Oceanodroma furcata furcata)
-22.0 (59%) -28.0 (1%) GNR SNR Yearround Subspecies Not harvested
No
Alaska tiny shrew (Sorex yukonicus)
-22.8 (59%) 32.0 (81%) GU S3 Yearround Species Not substantial
No
Sperm whale, North Pacific (Physeter macrocephalus)
-23.0 (59%) -8.0 (11%) G3G4 S3S4 Transient Species Not harvested
No
Bullers Shearwater (Puffinus bulleri)
-23.0 (59%) 32.0 (81%) G3 S3N Nonbreeding Species Not harvested
Yes
Eastern Kingbird (Tyrannus tyrannus)
-23.5 (58%) 32.0 (81%) G5 SNA Transient Species Not harvested
Yes
Rustic Bunting (Emberiza rustica)
-24.0 (56%) 32.0 (81%) G5 S3M Transient Species Not harvested
Yes
Silver-haired bat (Lasionycteris noctivagans)
-24.0 (56%) 24.0 (65%) G5 S2 Yearround Species Not harvested
Yes
Hudsonian Godwit (Limosa haemastica)
-24.0 (56%) 16.0 (51%) G4 S2S3B Breeding Species Not substantial
No
Northern Harrier (Circus cyaneus)
-24.0 (56%) 16.0 (51%) G5 S4B Yearround Genus Not harvested
No
Surf Scoter (Melanitta perspicillata)
-24.0 (56%) 8.0 (33%) G5 S4B,S4N Yearround Species Not substantial
No
Steller sea lion, Western U.S. stock (Eumatopias jubatus)
-24.0 (56%) -28.0 (1%) G3 S2 Yearround Population Not substantial
No
Long-toed salamander (Ambystoma macrodactylum)
-24.4 (56%) 28.0 (77%) G5 S3 Yearround Species Not harvested
Yes
Horned Grebe (Podiceps auritus)
-24.8 (56%) 6.0 (32%) G5 S4S5B, S4N
Yearround Species Substantial, regs
No
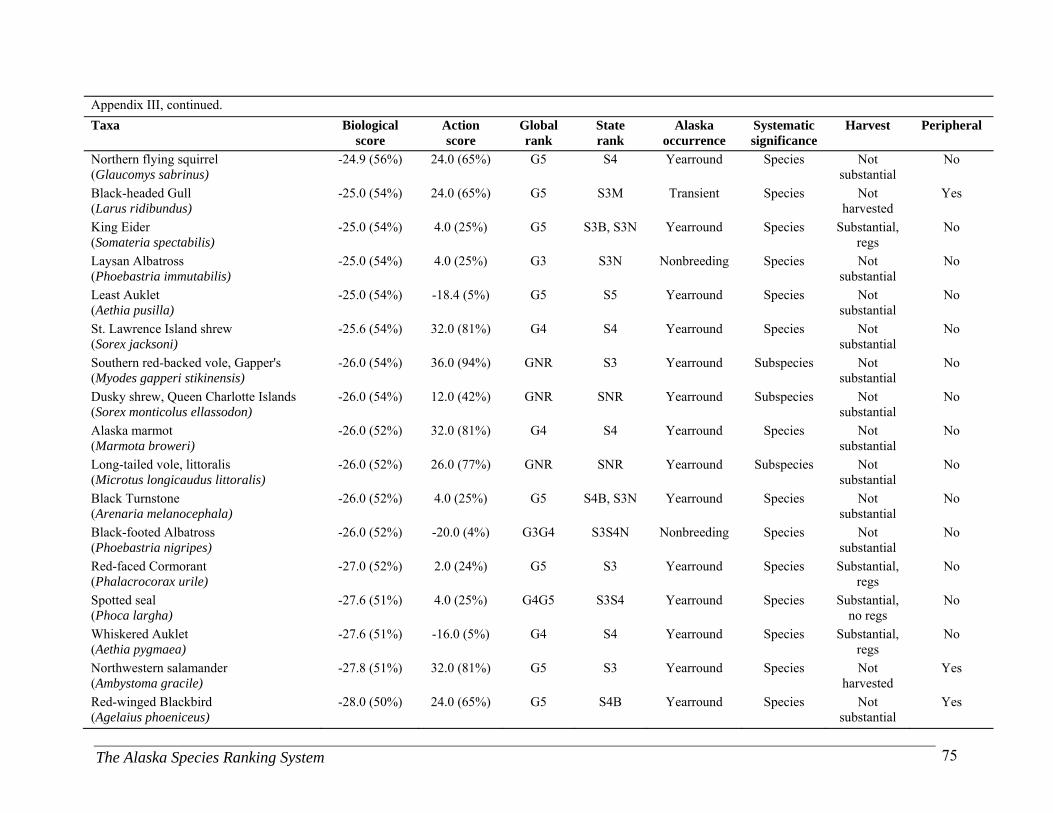
The Alaska Species Ranking System 75
Appendix III, continued.
Taxa Biological score
Action score
Global rank
State rank
Alaska occurrence
Systematic significance
Harvest Peripheral
Northern flying squirrel (Glaucomys sabrinus)
-24.9 (56%) 24.0 (65%) G5 S4 Yearround Species Not substantial
No
Black-headed Gull (Larus ridibundus)
-25.0 (54%) 24.0 (65%) G5 S3M Transient Species Not harvested
Yes
King Eider (Somateria spectabilis)
-25.0 (54%) 4.0 (25%) G5 S3B, S3N Yearround Species Substantial, regs
No
Laysan Albatross (Phoebastria immutabilis)
-25.0 (54%) 4.0 (25%) G3 S3N Nonbreeding Species Not substantial
No
Least Auklet (Aethia pusilla)
-25.0 (54%) -18.4 (5%) G5 S5 Yearround Species Not substantial
No
St. Lawrence Island shrew (Sorex jacksoni)
-25.6 (54%) 32.0 (81%) G4 S4 Yearround Species Not substantial
No
Southern red-backed vole, Gapper's (Myodes gapperi stikinensis)
-26.0 (54%) 36.0 (94%) GNR S3 Yearround Subspecies Not substantial
No
Dusky shrew, Queen Charlotte Islands (Sorex monticolus ellassodon)
-26.0 (54%) 12.0 (42%) GNR SNR Yearround Subspecies Not substantial
No
Alaska marmot (Marmota broweri)
-26.0 (52%) 32.0 (81%) G4 S4 Yearround Species Not substantial
No
Long-tailed vole, littoralis (Microtus longicaudus littoralis)
-26.0 (52%) 26.0 (77%) GNR SNR Yearround Subspecies Not substantial
No
Black Turnstone (Arenaria melanocephala)
-26.0 (52%) 4.0 (25%) G5 S4B, S3N Yearround Species Not substantial
No
Black-footed Albatross (Phoebastria nigripes)
-26.0 (52%) -20.0 (4%) G3G4 S3S4N Nonbreeding Species Not substantial
No
Red-faced Cormorant (Phalacrocorax urile)
-27.0 (52%) 2.0 (24%) G5 S3 Yearround Species Substantial, regs
No
Spotted seal (Phoca largha)
-27.6 (51%) 4.0 (25%) G4G5 S3S4 Yearround Species Substantial, no regs
No
Whiskered Auklet (Aethia pygmaea)
-27.6 (51%) -16.0 (5%) G4 S4 Yearround Species Substantial, regs
No
Northwestern salamander (Ambystoma gracile)
-27.8 (51%) 32.0 (81%) G5 S3 Yearround Species Not harvested
Yes
Red-winged Blackbird (Agelaius phoeniceus)
-28.0 (50%) 24.0 (65%) G5 S4B Yearround Species Not substantial
Yes
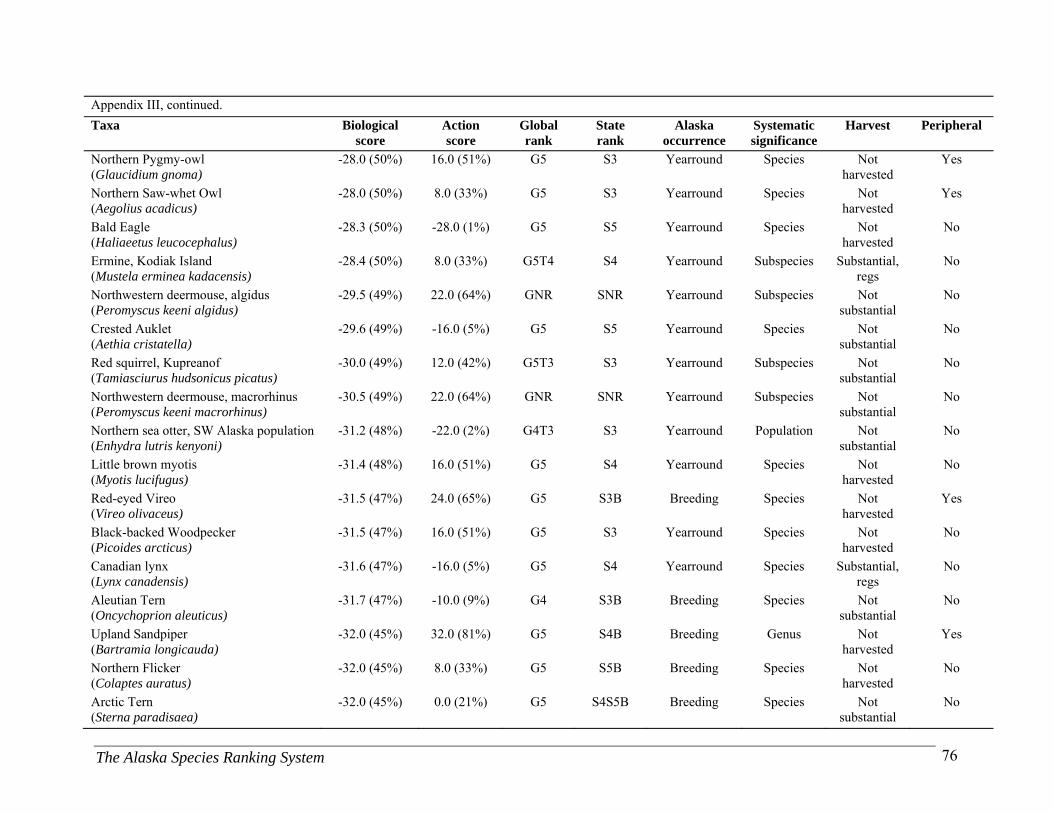
The Alaska Species Ranking System 76
Appendix III, continued.
Taxa Biological score
Action score
Global rank
State rank
Alaska occurrence
Systematic significance
Harvest Peripheral
Northern Pygmy-owl (Glaucidium gnoma)
-28.0 (50%) 16.0 (51%) G5 S3 Yearround Species Not harvested
Yes
Northern Saw-whet Owl (Aegolius acadicus)
-28.0 (50%) 8.0 (33%) G5 S3 Yearround Species Not harvested
Yes
Bald Eagle (Haliaeetus leucocephalus)
-28.3 (50%) -28.0 (1%) G5 S5 Yearround Species Not harvested
No
Ermine, Kodiak Island (Mustela erminea kadacensis)
-28.4 (50%) 8.0 (33%) G5T4 S4 Yearround Subspecies Substantial, regs
No
Northwestern deermouse, algidus (Peromyscus keeni algidus)
-29.5 (49%) 22.0 (64%) GNR SNR Yearround Subspecies Not substantial
No
Crested Auklet (Aethia cristatella)
-29.6 (49%) -16.0 (5%) G5 S5 Yearround Species Not substantial
No
Red squirrel, Kupreanof (Tamiasciurus hudsonicus picatus)
-30.0 (49%) 12.0 (42%) G5T3 S3 Yearround Subspecies Not substantial
No
Northwestern deermouse, macrorhinus (Peromyscus keeni macrorhinus)
-30.5 (49%) 22.0 (64%) GNR SNR Yearround Subspecies Not substantial
No
Northern sea otter, SW Alaska population (Enhydra lutris kenyoni)
-31.2 (48%) -22.0 (2%) G4T3 S3 Yearround Population Not substantial
No
Little brown myotis (Myotis lucifugus)
-31.4 (48%) 16.0 (51%) G5 S4 Yearround Species Not harvested
No
Red-eyed Vireo (Vireo olivaceus)
-31.5 (47%) 24.0 (65%) G5 S3B Breeding Species Not harvested
Yes
Black-backed Woodpecker (Picoides arcticus)
-31.5 (47%) 16.0 (51%) G5 S3 Yearround Species Not harvested
No
Canadian lynx (Lynx canadensis)
-31.6 (47%) -16.0 (5%) G5 S4 Yearround Species Substantial, regs
No
Aleutian Tern (Oncychoprion aleuticus)
-31.7 (47%) -10.0 (9%) G4 S3B Breeding Species Not substantial
No
Upland Sandpiper (Bartramia longicauda)
-32.0 (45%) 32.0 (81%) G5 S4B Breeding Genus Not harvested
Yes
Northern Flicker (Colaptes auratus)
-32.0 (45%) 8.0 (33%) G5 S5B Breeding Species Not harvested
No
Arctic Tern (Sterna paradisaea)
-32.0 (45%) 0.0 (21%) G5 S4S5B Breeding Species Not substantial
No
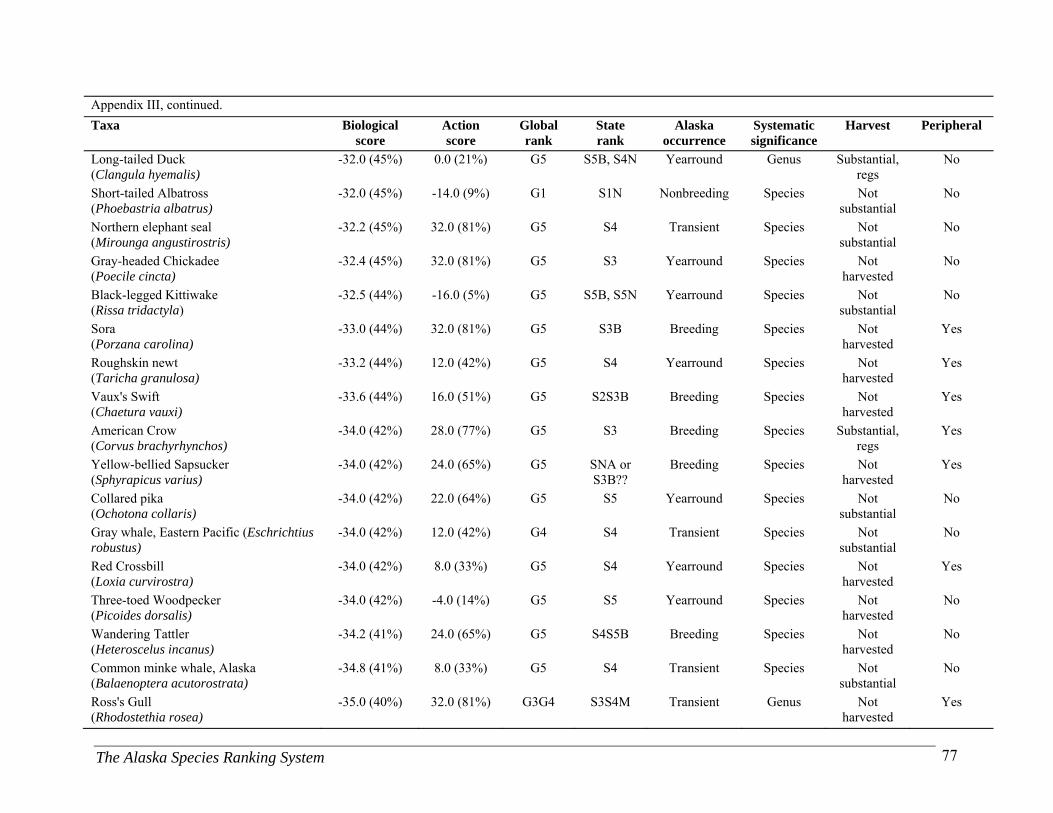
The Alaska Species Ranking System 77
Appendix III, continued.
Taxa Biological score
Action score
Global rank
State rank
Alaska occurrence
Systematic significance
Harvest Peripheral
Long-tailed Duck (Clangula hyemalis)
-32.0 (45%) 0.0 (21%) G5 S5B, S4N Yearround Genus Substantial, regs
No
Short-tailed Albatross (Phoebastria albatrus)
-32.0 (45%) -14.0 (9%) G1 S1N Nonbreeding Species Not substantial
No
Northern elephant seal (Mirounga angustirostris)
-32.2 (45%) 32.0 (81%) G5 S4 Transient Species Not substantial
No
Gray-headed Chickadee (Poecile cincta)
-32.4 (45%) 32.0 (81%) G5 S3 Yearround Species Not harvested
No
Black-legged Kittiwake (Rissa tridactyla)
-32.5 (44%) -16.0 (5%) G5 S5B, S5N Yearround Species Not substantial
No
Sora (Porzana carolina)
-33.0 (44%) 32.0 (81%) G5 S3B Breeding Species Not harvested
Yes
Roughskin newt (Taricha granulosa)
-33.2 (44%) 12.0 (42%) G5 S4 Yearround Species Not harvested
Yes
Vaux's Swift (Chaetura vauxi)
-33.6 (44%) 16.0 (51%) G5 S2S3B Breeding Species Not harvested
Yes
American Crow (Corvus brachyrhynchos)
-34.0 (42%) 28.0 (77%) G5 S3 Breeding Species Substantial, regs
Yes
Yellow-bellied Sapsucker (Sphyrapicus varius)
-34.0 (42%) 24.0 (65%) G5 SNA or S3B??
Breeding Species Not harvested
Yes
Collared pika (Ochotona collaris)
-34.0 (42%) 22.0 (64%) G5 S5 Yearround Species Not substantial
No
Gray whale, Eastern Pacific (Eschrichtius robustus)
-34.0 (42%) 12.0 (42%) G4 S4 Transient Species Not substantial
No
Red Crossbill (Loxia curvirostra)
-34.0 (42%) 8.0 (33%) G5 S4 Yearround Species Not harvested
Yes
Three-toed Woodpecker (Picoides dorsalis)
-34.0 (42%) -4.0 (14%) G5 S5 Yearround Species Not harvested
No
Wandering Tattler (Heteroscelus incanus)
-34.2 (41%) 24.0 (65%) G5 S4S5B Breeding Species Not harvested
No
Common minke whale, Alaska (Balaenoptera acutorostrata)
-34.8 (41%) 8.0 (33%) G5 S4 Transient Species Not substantial
No
Ross's Gull (Rhodostethia rosea)
-35.0 (40%) 32.0 (81%) G3G4 S3S4M Transient Genus Not harvested
Yes
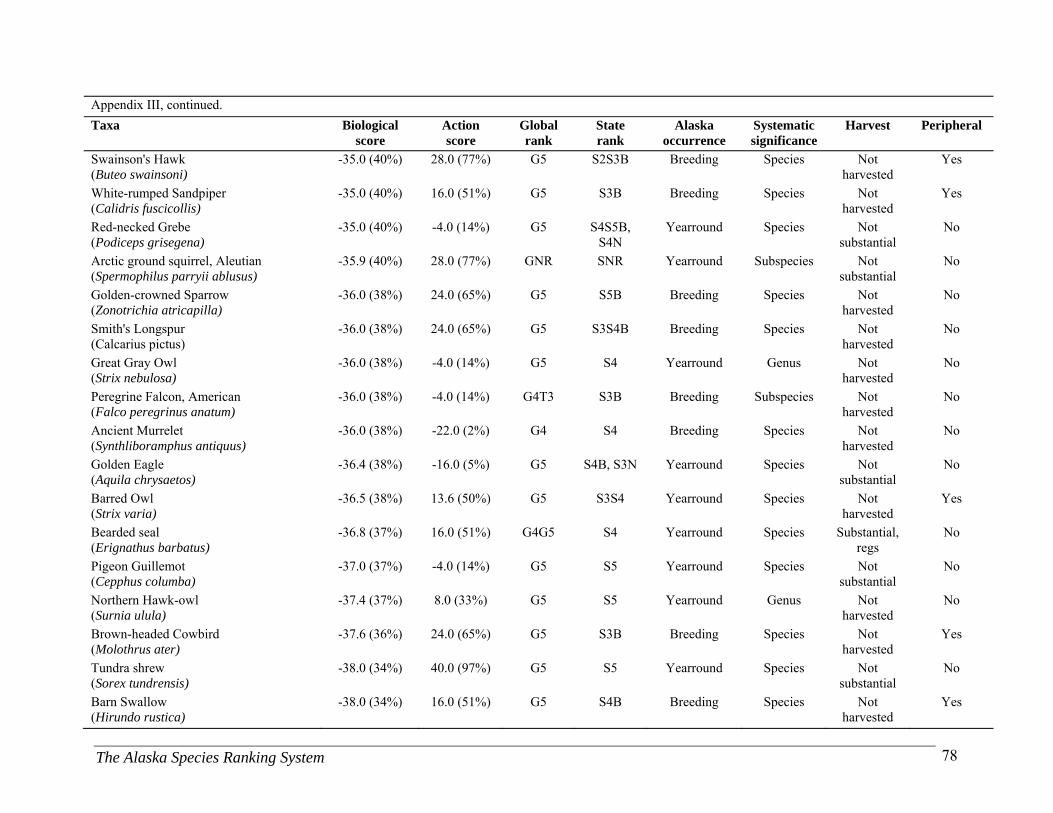
The Alaska Species Ranking System 78
Appendix III, continued.
Taxa Biological score
Action score
Global rank
State rank
Alaska occurrence
Systematic significance
Harvest Peripheral
Swainson's Hawk (Buteo swainsoni)
-35.0 (40%) 28.0 (77%) G5 S2S3B Breeding Species Not harvested
Yes
White-rumped Sandpiper (Calidris fuscicollis)
-35.0 (40%) 16.0 (51%) G5 S3B Breeding Species Not harvested
Yes
Red-necked Grebe (Podiceps grisegena)
-35.0 (40%) -4.0 (14%) G5 S4S5B, S4N
Yearround Species Not substantial
No
Arctic ground squirrel, Aleutian (Spermophilus parryii ablusus)
-35.9 (40%) 28.0 (77%) GNR SNR Yearround Subspecies Not substantial
No
Golden-crowned Sparrow (Zonotrichia atricapilla)
-36.0 (38%) 24.0 (65%) G5 S5B Breeding Species Not harvested
No
Smith's Longspur (Calcarius pictus)
-36.0 (38%) 24.0 (65%) G5 S3S4B Breeding Species Not harvested
No
Great Gray Owl (Strix nebulosa)
-36.0 (38%) -4.0 (14%) G5 S4 Yearround Genus Not harvested
No
Peregrine Falcon, American (Falco peregrinus anatum)
-36.0 (38%) -4.0 (14%) G4T3 S3B Breeding Subspecies Not harvested
No
Ancient Murrelet (Synthliboramphus antiquus)
-36.0 (38%) -22.0 (2%) G4 S4 Breeding Species Not harvested
No
Golden Eagle (Aquila chrysaetos)
-36.4 (38%) -16.0 (5%) G5 S4B, S3N Yearround Species Not substantial
No
Barred Owl (Strix varia)
-36.5 (38%) 13.6 (50%) G5 S3S4 Yearround Species Not harvested
Yes
Bearded seal (Erignathus barbatus)
-36.8 (37%) 16.0 (51%) G4G5 S4 Yearround Species Substantial, regs
No
Pigeon Guillemot (Cepphus columba)
-37.0 (37%) -4.0 (14%) G5 S5 Yearround Species Not substantial
No
Northern Hawk-owl (Surnia ulula)
-37.4 (37%) 8.0 (33%) G5 S5 Yearround Genus Not harvested
No
Brown-headed Cowbird (Molothrus ater)
-37.6 (36%) 24.0 (65%) G5 S3B Breeding Species Not harvested
Yes
Tundra shrew (Sorex tundrensis)
-38.0 (34%) 40.0 (97%) G5 S5 Yearround Species Not substantial
No
Barn Swallow (Hirundo rustica)
-38.0 (34%) 16.0 (51%) G5 S4B Breeding Species Not harvested
Yes
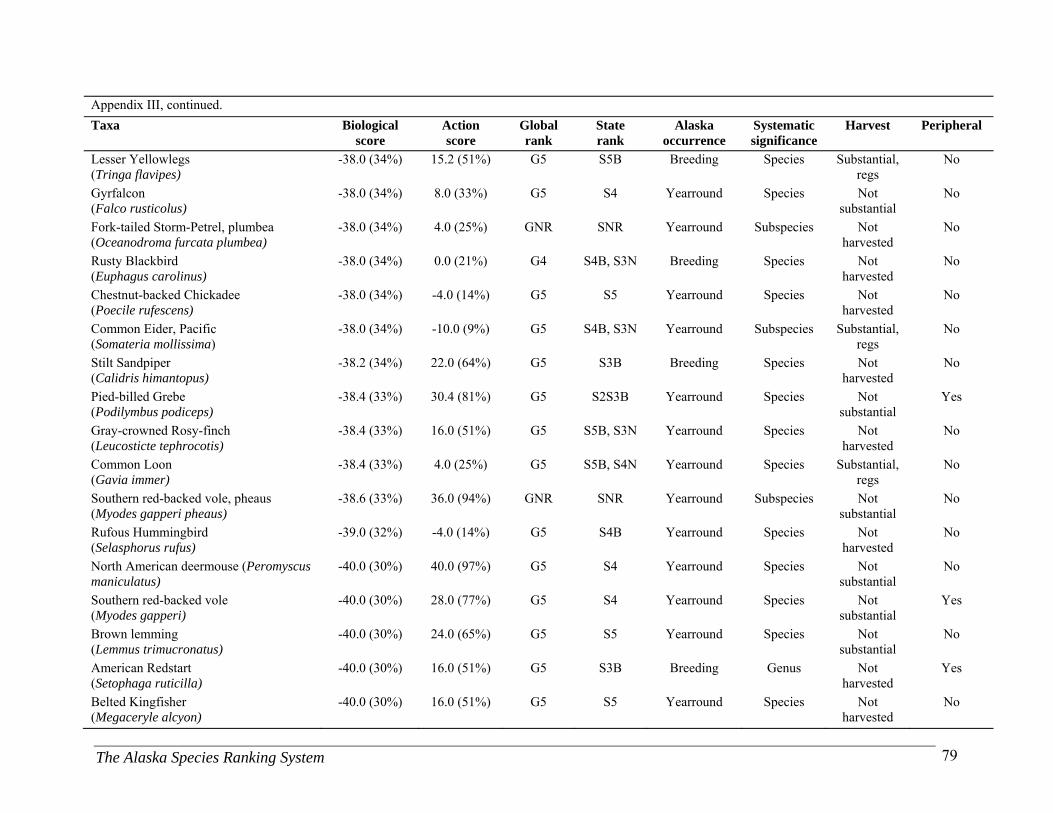
The Alaska Species Ranking System 79
Appendix III, continued.
Taxa Biological score
Action score
Global rank
State rank
Alaska occurrence
Systematic significance
Harvest Peripheral
Lesser Yellowlegs (Tringa flavipes)
-38.0 (34%) 15.2 (51%) G5 S5B Breeding Species Substantial, regs
No
Gyrfalcon (Falco rusticolus)
-38.0 (34%) 8.0 (33%) G5 S4 Yearround Species Not substantial
No
Fork-tailed Storm-Petrel, plumbea (Oceanodroma furcata plumbea)
-38.0 (34%) 4.0 (25%) GNR SNR Yearround Subspecies Not harvested
No
Rusty Blackbird (Euphagus carolinus)
-38.0 (34%) 0.0 (21%) G4 S4B, S3N Breeding Species Not harvested
No
Chestnut-backed Chickadee (Poecile rufescens)
-38.0 (34%) -4.0 (14%) G5 S5 Yearround Species Not harvested
No
Common Eider, Pacific (Somateria mollissima)
-38.0 (34%) -10.0 (9%) G5 S4B, S3N Yearround Subspecies Substantial, regs
No
Stilt Sandpiper (Calidris himantopus)
-38.2 (34%) 22.0 (64%) G5 S3B Breeding Species Not harvested
No
Pied-billed Grebe (Podilymbus podiceps)
-38.4 (33%) 30.4 (81%) G5 S2S3B Yearround Species Not substantial
Yes
Gray-crowned Rosy-finch (Leucosticte tephrocotis)
-38.4 (33%) 16.0 (51%) G5 S5B, S3N Yearround Species Not harvested
No
Common Loon (Gavia immer)
-38.4 (33%) 4.0 (25%) G5 S5B, S4N Yearround Species Substantial, regs
No
Southern red-backed vole, pheaus (Myodes gapperi pheaus)
-38.6 (33%) 36.0 (94%) GNR SNR Yearround Subspecies Not substantial
No
Rufous Hummingbird (Selasphorus rufus)
-39.0 (32%) -4.0 (14%) G5 S4B Yearround Species Not harvested
No
North American deermouse (Peromyscus maniculatus)
-40.0 (30%) 40.0 (97%) G5 S4 Yearround Species Not substantial
No
Southern red-backed vole (Myodes gapperi)
-40.0 (30%) 28.0 (77%) G5 S4 Yearround Species Not substantial
Yes
Brown lemming (Lemmus trimucronatus)
-40.0 (30%) 24.0 (65%) G5 S5 Yearround Species Not substantial
No
American Redstart (Setophaga ruticilla)
-40.0 (30%) 16.0 (51%) G5 S3B Breeding Genus Not harvested
Yes
Belted Kingfisher (Megaceryle alcyon)
-40.0 (30%) 16.0 (51%) G5 S5 Yearround Species Not harvested
No
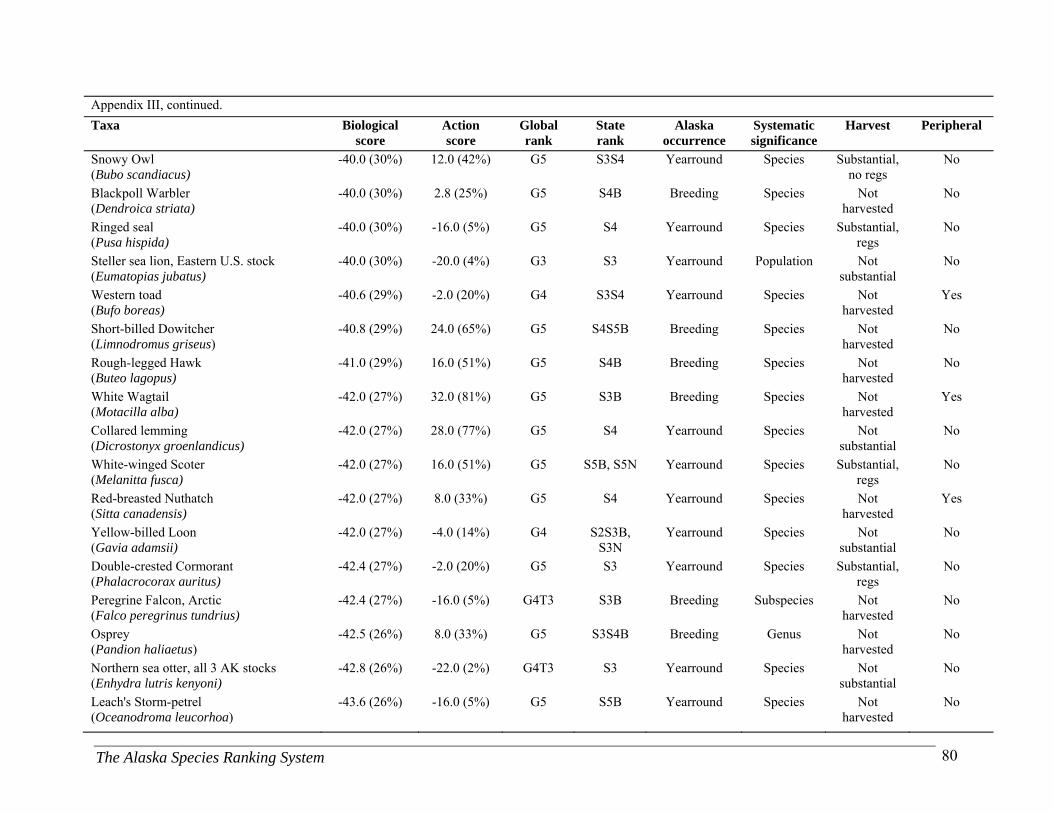
The Alaska Species Ranking System 80
Appendix III, continued.
Taxa Biological score
Action score
Global rank
State rank
Alaska occurrence
Systematic significance
Harvest Peripheral
Snowy Owl (Bubo scandiacus)
-40.0 (30%) 12.0 (42%) G5 S3S4 Yearround Species Substantial, no regs
No
Blackpoll Warbler (Dendroica striata)
-40.0 (30%) 2.8 (25%) G5 S4B Breeding Species Not harvested
No
Ringed seal (Pusa hispida)
-40.0 (30%) -16.0 (5%) G5 S4 Yearround Species Substantial, regs
No
Steller sea lion, Eastern U.S. stock (Eumatopias jubatus)
-40.0 (30%) -20.0 (4%) G3 S3 Yearround Population Not substantial
No
Western toad (Bufo boreas)
-40.6 (29%) -2.0 (20%) G4 S3S4 Yearround Species Not harvested
Yes
Short-billed Dowitcher (Limnodromus griseus)
-40.8 (29%) 24.0 (65%) G5 S4S5B Breeding Species Not harvested
No
Rough-legged Hawk (Buteo lagopus)
-41.0 (29%) 16.0 (51%) G5 S4B Breeding Species Not harvested
No
White Wagtail (Motacilla alba)
-42.0 (27%) 32.0 (81%) G5 S3B Breeding Species Not harvested
Yes
Collared lemming (Dicrostonyx groenlandicus)
-42.0 (27%) 28.0 (77%) G5 S4 Yearround Species Not substantial
No
White-winged Scoter (Melanitta fusca)
-42.0 (27%) 16.0 (51%) G5 S5B, S5N Yearround Species Substantial, regs
No
Red-breasted Nuthatch (Sitta canadensis)
-42.0 (27%) 8.0 (33%) G5 S4 Yearround Species Not harvested
Yes
Yellow-billed Loon (Gavia adamsii)
-42.0 (27%) -4.0 (14%) G4 S2S3B, S3N
Yearround Species Not substantial
No
Double-crested Cormorant (Phalacrocorax auritus)
-42.4 (27%) -2.0 (20%) G5 S3 Yearround Species Substantial, regs
No
Peregrine Falcon, Arctic (Falco peregrinus tundrius)
-42.4 (27%) -16.0 (5%) G4T3 S3B Breeding Subspecies Not harvested
No
Osprey (Pandion haliaetus)
-42.5 (26%) 8.0 (33%) G5 S3S4B Breeding Genus Not harvested
No
Northern sea otter, all 3 AK stocks (Enhydra lutris kenyoni)
-42.8 (26%) -22.0 (2%) G4T3 S3 Yearround Species Not substantial
No
Leach's Storm-petrel (Oceanodroma leucorhoa)
-43.6 (26%) -16.0 (5%) G5 S5B Yearround Species Not harvested
No
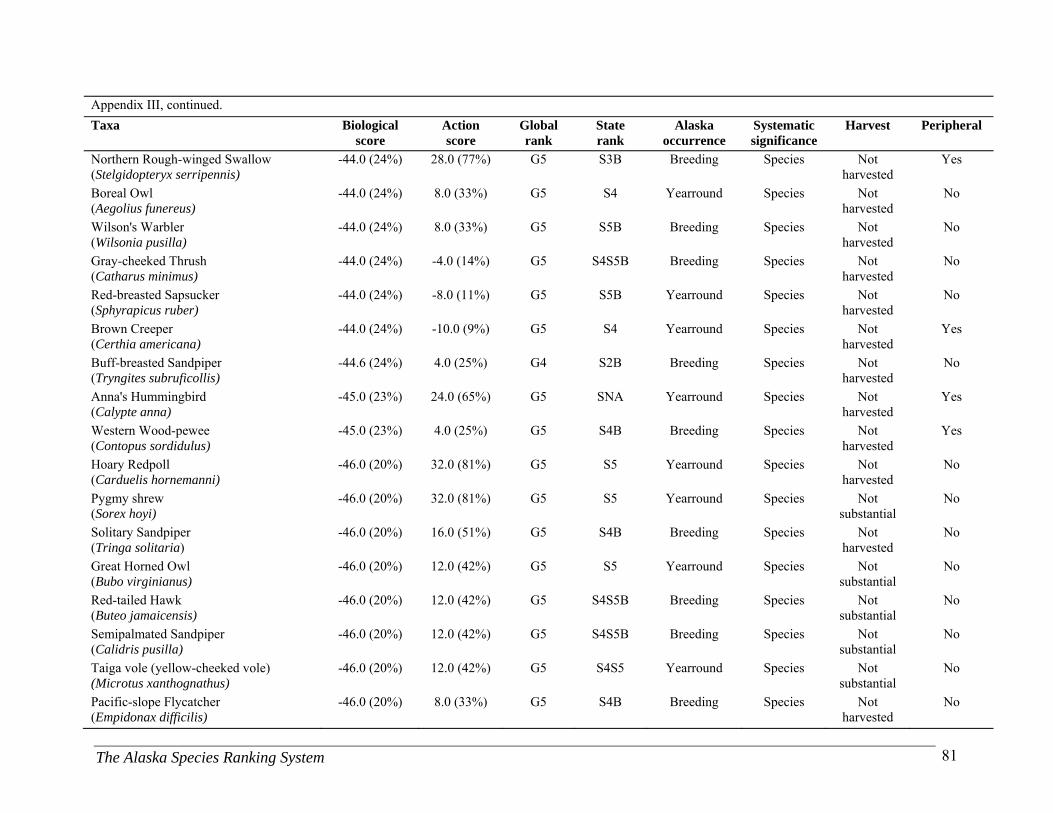
The Alaska Species Ranking System 81
Appendix III, continued.
Taxa Biological score
Action score
Global rank
State rank
Alaska occurrence
Systematic significance
Harvest Peripheral
Northern Rough-winged Swallow (Stelgidopteryx serripennis)
-44.0 (24%) 28.0 (77%) G5 S3B Breeding Species Not harvested
Yes
Boreal Owl (Aegolius funereus)
-44.0 (24%) 8.0 (33%) G5 S4 Yearround Species Not harvested
No
Wilson's Warbler (Wilsonia pusilla)
-44.0 (24%) 8.0 (33%) G5 S5B Breeding Species Not harvested
No
Gray-cheeked Thrush (Catharus minimus)
-44.0 (24%) -4.0 (14%) G5 S4S5B Breeding Species Not harvested
No
Red-breasted Sapsucker (Sphyrapicus ruber)
-44.0 (24%) -8.0 (11%) G5 S5B Yearround Species Not harvested
No
Brown Creeper (Certhia americana)
-44.0 (24%) -10.0 (9%) G5 S4 Yearround Species Not harvested
Yes
Buff-breasted Sandpiper (Tryngites subruficollis)
-44.6 (24%) 4.0 (25%) G4 S2B Breeding Species Not harvested
No
Anna's Hummingbird (Calypte anna)
-45.0 (23%) 24.0 (65%) G5 SNA Yearround Species Not harvested
Yes
Western Wood-pewee (Contopus sordidulus)
-45.0 (23%) 4.0 (25%) G5 S4B Breeding Species Not harvested
Yes
Hoary Redpoll (Carduelis hornemanni)
-46.0 (20%) 32.0 (81%) G5 S5 Yearround Species Not harvested
No
Pygmy shrew (Sorex hoyi)
-46.0 (20%) 32.0 (81%) G5 S5 Yearround Species Not substantial
No
Solitary Sandpiper (Tringa solitaria)
-46.0 (20%) 16.0 (51%) G5 S4B Breeding Species Not harvested
No
Great Horned Owl (Bubo virginianus)
-46.0 (20%) 12.0 (42%) G5 S5 Yearround Species Not substantial
No
Red-tailed Hawk (Buteo jamaicensis)
-46.0 (20%) 12.0 (42%) G5 S4S5B Breeding Species Not substantial
No
Semipalmated Sandpiper (Calidris pusilla)
-46.0 (20%) 12.0 (42%) G5 S4S5B Breeding Species Not substantial
No
Taiga vole (yellow-cheeked vole) (Microtus xanthognathus)
-46.0 (20%) 12.0 (42%) G5 S4S5 Yearround Species Not substantial
No
Pacific-slope Flycatcher (Empidonax difficilis)
-46.0 (20%) 8.0 (33%) G5 S4B Breeding Species Not harvested
No

The Alaska Species Ranking System 82
Appendix III, continued.
Taxa Biological score
Action score
Global rank
State rank
Alaska occurrence
Systematic significance
Harvest Peripheral
Varied Thrush (Ixoreus naevius)
-46.0 (20%) 0.0 (21%) G5 S5B Yearround Genus Not harvested
No
Harbor seal (Phoca vitulina)
-46.0 (20%) -8.0 (11%) G5 S4S5 Yearround Species Substantial, no regs
No
Golden-crowned Kinglet (Regulus satrapa)
-46.0 (20%) -10.0 (9%) G5 S4S5 Yearround Species Not harvested
Yes
Humpback whale, Central and Western North Pacific (Megaptera novaeangliae)
-46.0 (20%) -22.0 (2%) G3 S3 Transient Species Not harvested
No
Red-throated Loon (Gavia stellata)
-46.2 (19%) -4.0 (14%) G5 S4B, S4N Yearround Species Not substantial
No
Harbor porpoise (Phocoena phocoena)
-46.8 (19%) 8.0 (33%) G4G5 S4S5 Yearround Species Not substantial
No
Goshawk, Northern (Accipiter gentilis)
-47.0 (19%) 16.0 (51%) G5 S4 Yearround Species Not substantial
No
Northern bog lemming (Synaptomys borealis)
-47.2 (19%) 20.0 (61%) G4 S4S5 Yearround Species Not substantial
No
Water shrew (Sorex palustris)
-47.6 (18%) 32.0 (81%) G5 S4 Yearround Species Not substantial
Yes
Western Tanager (Piranga ludoviciana)
-48.0 (14%) 32.0 (81%) G5 S4B Breeding Species Not harvested
Yes
Northern Shrike (Lanius excubitor)
-48.0 (14%) 28.0 (77%) G5 S4B,S4N Yearround Species Not harvested
No
Meadow jumping mouse (Zapus hudsonius)
-48.0 (14%) 20.0 (61%) G5 S5 Yearround Species Not harvested
No
Mountain Bluebird (Sialia currucoides)
-48.0 (14%) 18.0 (60%) G5 S3B Breeding Species Not harvested
Yes
Short-eared Owl (Asio flammeus)
-48.0 (14%) 14.4 (51%) G5 S4B Yearround Species Not harvested
No
American Tree Sparrow (Spizella arborea)
-48.0 (14%) 12.0 (42%) G5 S5B Breeding Species Not harvested
No
Arctic Warbler (Phylloscopus borealis)
-48.0 (14%) 12.0 (42%) G5 S5B Breeding Species Not harvested
Yes
Olive-sided Flycatcher (Contopus cooperi)
-48.0 (14%) 8.0 (33%) G4 S4S5B Breeding Species Not harvested
No

The Alaska Species Ranking System 83
Appendix III, continued.
Taxa Biological score
Action score
Global rank
State rank
Alaska occurrence
Systematic significance
Harvest Peripheral
Townsend's Warbler (Dendroica townsendi)
-48.0 (14%) 8.0 (33%) G5 S4B Breeding Species Not harvested
Yes
American Dipper (Cinclus mexicanus)
-48.0 (14%) 2.0 (24%) G5 S5 Yearround Species Not harvested
No
Black-bellied Plover (Pluvialis squatarola)
-48.0 (14%) 0.0 (21%) G5 S4B Breeding Species Not substantial
No
Pacific Loon (Gavia pacifica)
-48.0 (14%) -4.0 (14%) G5 S5B, S4N Yearround Species Substantial, regs
No
White-winged Crossbill (Loxia leucoptera)
-48.0 (14%) -4.0 (14%) G5 S5 Yearround Species Not harvested
No
Merlin (Falco columbarius)
-48.4 (14%) 2.0 (24%) G5 S5B, S4N Yearround Species Not substantial
No
Northwestern deermouse (Peromyscus keeni)
-48.5 (14%) 10.0 (41%) G5 S4 Yearround Species Not substantial
No
Fox Sparrow (Passerella iliaca)
-50.0 (13%) 16.0 (51%) G5 S5B, S3N Yearround Genus Not harvested
No
Boreal Chickadee (Poecile hudsonica)
-50.0 (13%) 8.0 (33%) G5 S5 Yearround Species Not harvested
No
Northern Waterthrush (Seiurus noveboracensis)
-50.0 (13%) 4.0 (25%) G5 S4S5B Breeding Species Not harvested
No
Peregrine Falcon (Falco peregrinus)
-50.0 (13%) -16.0 (5%) G4 S3B, S3N Yearround Species Not harvested
No
Arctic ground squirrel (Spermophilus parryii)
-51.2 (12%) 8.0 (33%) G5 S5 Yearround Species Not substantial
No
Bluethroat (Luscinia svecica)
-52.0 (10%) 32.0 (81%) G5 S4B Breeding Species Not harvested
Yes
Baird's Sandpiper (Calidris bairdii)
-52.0 (10%) 24.0 (65%) G5 S4B Breeding Species Not substantial
No
Townsend's Solitaire (Myadestes townsendi)
-52.0 (10%) 24.0 (65%) G5 S4B Breeding Species Not harvested
Yes
Whimbrel (Numenius phaeopus)
-52.0 (10%) 16.0 (51%) G5 S3S4B Breeding Species Not harvested
No
Red Phalarope (Phalaropus fulicarius)
-52.0 (10%) 12.0 (42%) G5 S4S5B Breeding Species Not substantial
No
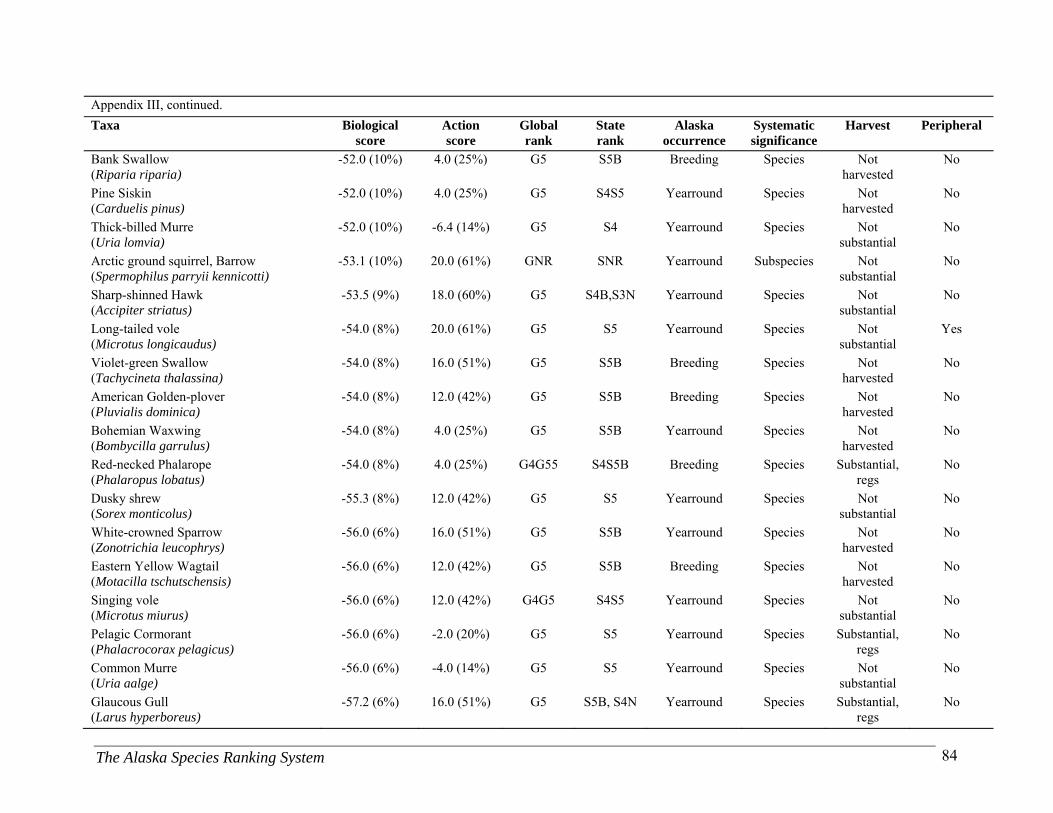
The Alaska Species Ranking System 84
Appendix III, continued.
Taxa Biological score
Action score
Global rank
State rank
Alaska occurrence
Systematic significance
Harvest Peripheral
Bank Swallow (Riparia riparia)
-52.0 (10%) 4.0 (25%) G5 S5B Breeding Species Not harvested
No
Pine Siskin (Carduelis pinus)
-52.0 (10%) 4.0 (25%) G5 S4S5 Yearround Species Not harvested
No
Thick-billed Murre (Uria lomvia)
-52.0 (10%) -6.4 (14%) G5 S4 Yearround Species Not substantial
No
Arctic ground squirrel, Barrow (Spermophilus parryii kennicotti)
-53.1 (10%) 20.0 (61%) GNR SNR Yearround Subspecies Not substantial
No
Sharp-shinned Hawk (Accipiter striatus)
-53.5 (9%) 18.0 (60%) G5 S4B,S3N Yearround Species Not substantial
No
Long-tailed vole (Microtus longicaudus)
-54.0 (8%) 20.0 (61%) G5 S5 Yearround Species Not substantial
Yes
Violet-green Swallow (Tachycineta thalassina)
-54.0 (8%) 16.0 (51%) G5 S5B Breeding Species Not harvested
No
American Golden-plover (Pluvialis dominica)
-54.0 (8%) 12.0 (42%) G5 S5B Breeding Species Not harvested
No
Bohemian Waxwing (Bombycilla garrulus)
-54.0 (8%) 4.0 (25%) G5 S5B Yearround Species Not harvested
No
Red-necked Phalarope (Phalaropus lobatus)
-54.0 (8%) 4.0 (25%) G4G55 S4S5B Breeding Species Substantial, regs
No
Dusky shrew (Sorex monticolus)
-55.3 (8%) 12.0 (42%) G5 S5 Yearround Species Not substantial
No
White-crowned Sparrow (Zonotrichia leucophrys)
-56.0 (6%) 16.0 (51%) G5 S5B Yearround Species Not harvested
No
Eastern Yellow Wagtail (Motacilla tschutschensis)
-56.0 (6%) 12.0 (42%) G5 S5B Breeding Species Not harvested
No
Singing vole (Microtus miurus)
-56.0 (6%) 12.0 (42%) G4G5 S4S5 Yearround Species Not substantial
No
Pelagic Cormorant (Phalacrocorax pelagicus)
-56.0 (6%) -2.0 (20%) G5 S5 Yearround Species Substantial, regs
No
Common Murre (Uria aalge)
-56.0 (6%) -4.0 (14%) G5 S5 Yearround Species Not substantial
No
Glaucous Gull (Larus hyperboreus)
-57.2 (6%) 16.0 (51%) G5 S5B, S4N Yearround Species Substantial, regs
No
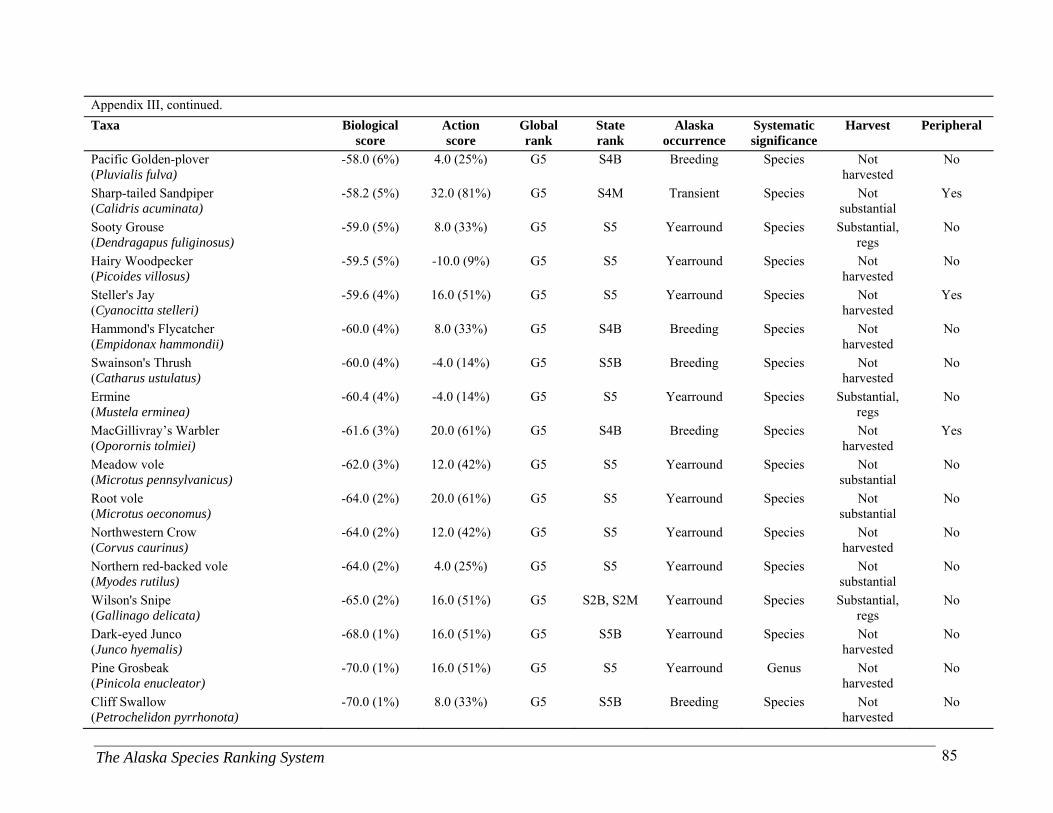
The Alaska Species Ranking System 85
Appendix III, continued.
Taxa Biological score
Action score
Global rank
State rank
Alaska occurrence
Systematic significance
Harvest Peripheral
Pacific Golden-plover (Pluvialis fulva)
-58.0 (6%) 4.0 (25%) G5 S4B Breeding Species Not harvested
No
Sharp-tailed Sandpiper (Calidris acuminata)
-58.2 (5%) 32.0 (81%) G5 S4M Transient Species Not substantial
Yes
Sooty Grouse (Dendragapus fuliginosus)
-59.0 (5%) 8.0 (33%) G5 S5 Yearround Species Substantial, regs
No
Hairy Woodpecker (Picoides villosus)
-59.5 (5%) -10.0 (9%) G5 S5 Yearround Species Not harvested
No
Steller's Jay (Cyanocitta stelleri)
-59.6 (4%) 16.0 (51%) G5 S5 Yearround Species Not harvested
Yes
Hammond's Flycatcher (Empidonax hammondii)
-60.0 (4%) 8.0 (33%) G5 S4B Breeding Species Not harvested
No
Swainson's Thrush (Catharus ustulatus)
-60.0 (4%) -4.0 (14%) G5 S5B Breeding Species Not harvested
No
Ermine (Mustela erminea)
-60.4 (4%) -4.0 (14%) G5 S5 Yearround Species Substantial, regs
No
MacGillivray’s Warbler (Oporornis tolmiei)
-61.6 (3%) 20.0 (61%) G5 S4B Breeding Species Not harvested
Yes
Meadow vole (Microtus pennsylvanicus)
-62.0 (3%) 12.0 (42%) G5 S5 Yearround Species Not substantial
No
Root vole (Microtus oeconomus)
-64.0 (2%) 20.0 (61%) G5 S5 Yearround Species Not substantial
No
Northwestern Crow (Corvus caurinus)
-64.0 (2%) 12.0 (42%) G5 S5 Yearround Species Not harvested
No
Northern red-backed vole (Myodes rutilus)
-64.0 (2%) 4.0 (25%) G5 S5 Yearround Species Not substantial
No
Wilson's Snipe (Gallinago delicata)
-65.0 (2%) 16.0 (51%) G5 S2B, S2M Yearround Species Substantial, regs
No
Dark-eyed Junco (Junco hyemalis)
-68.0 (1%) 16.0 (51%) G5 S5B Yearround Species Not harvested
No
Pine Grosbeak (Pinicola enucleator)
-70.0 (1%) 16.0 (51%) G5 S5 Yearround Genus Not harvested
No
Cliff Swallow (Petrochelidon pyrrhonota)
-70.0 (1%) 8.0 (33%) G5 S5B Breeding Species Not harvested
No
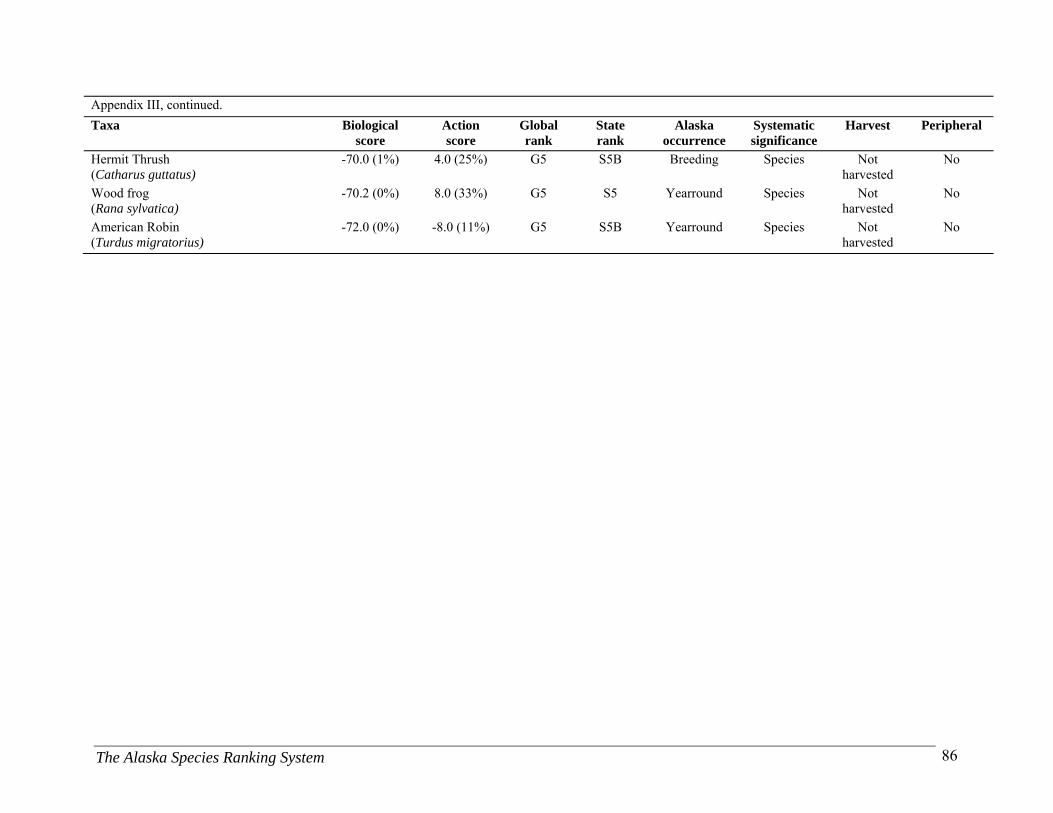
The Alaska Species Ranking System 86
Appendix III, continued.
Taxa Biological score
Action score
Global rank
State rank
Alaska occurrence
Systematic significance
Harvest Peripheral
Hermit Thrush (Catharus guttatus)
-70.0 (1%) 4.0 (25%) G5 S5B Breeding Species Not harvested
No
Wood frog (Rana sylvatica)
-70.2 (0%) 8.0 (33%) G5 S5 Yearround Species Not harvested
No
American Robin (Turdus migratorius)
-72.0 (0%) -8.0 (11%) G5 S5B Yearround Species Not harvested
No

The Alaska Species Ranking System 87
Appendix IV. Nominee taxa ranked (n=341) in order of descending action score. The table includes individual biological scores, action scores, global and state conservation status ranks, and supplemental variables: Alaska occurrence, systematic significance, level of harvest and peripheral status. Biological and action scores are denoted by the numerical score, followed by the percentage of taxa that ranked below them (in parentheses). Refer to Appendix V for Global and State rank definitions. Taxa Biological
score Action score
Global rank
State rank Alaska occurrence
Systematic significance
Harvest Peripheral
Glacier Bay water shrew (Sorex alaskanus)
7.0 (95%) 40.0 (97%) GH SH Yearround Species Not substantial
No
Hoary marmot, Glacier Bay (Marmota caligata vigilis)
6.0 (95%) 40.0 (97%) G5T3 S3 Yearround Subspecies Not substantial
No
Root vole, Shumagin Island (Microtus oeconomus popofensis)
2.0 (92%) 40.0 (97%) G5T2 S2 Yearround Subspecies Not substantial
No
Insular vole, Hall Island (Microtus abbreviatus abbreviatus)
-4.0 (87%) 40.0 (97%) G3T3 S3 Yearround Subspecies Not substantial
No
Arctic ground squirrel, St. Lawrence Island (Spermophilus parryii lyratus)
-6.4 (84%) 40.0 (97%) G5T3 S3 Yearround Subspecies Not substantial
No
Insular vole, St. Mathew Island (Microtus abbreviatus fisheri)
-10.0 (78%) 40.0 (97%) G3T3 S3 Yearround Subspecies Not substantial
No
Insular vole (Microtus abbreviatus)
-16.0 (69%) 40.0 (97%) G3 S3 Yearround Species Not substantial
No
Root vole, Unalaska (Microtus oeconomus unalascensis)
-18.0 (67%) 40.0 (97%) G5T3 S3 Yearround Subspecies Not substantial
No
Tundra shrew (Sorex tundrensis)
-38.0 (34%) 40.0 (97%) G5 S5 Yearround Species Not substantial
No
North American deermouse (Peromyscus maniculatus)
-40.0 (30%) 40.0 (97%) G5 S4 Yearround Species Not substantial
No
Arctic ground squirrel, Osgood's (Spermophilus parryii osgoodi)
8.1 (96%) 36.0 (94%) G5T3 S3 Yearround Subspecies Not substantial
No
Arctic ground squirrel, Kodiak Island (Spermophilus parryii kodiacensis)
2.6 (94%) 36.0 (94%) G5T3 S3 Yearround Subspecies Not substantial
No
Collared lemming, St. Lawrence Island (Dicrostonyx groenlandicus exsul)
2.0 (92%) 36.0 (94%) G5T3 S3 Yearround Subspecies Not substantial
No
Collared lemming, Stevenson's (Dicrostonyx groenlandicus stevensoni)
-2.0 (89%) 36.0 (94%) G5T3 S3 Yearround Subspecies Not substantial
No
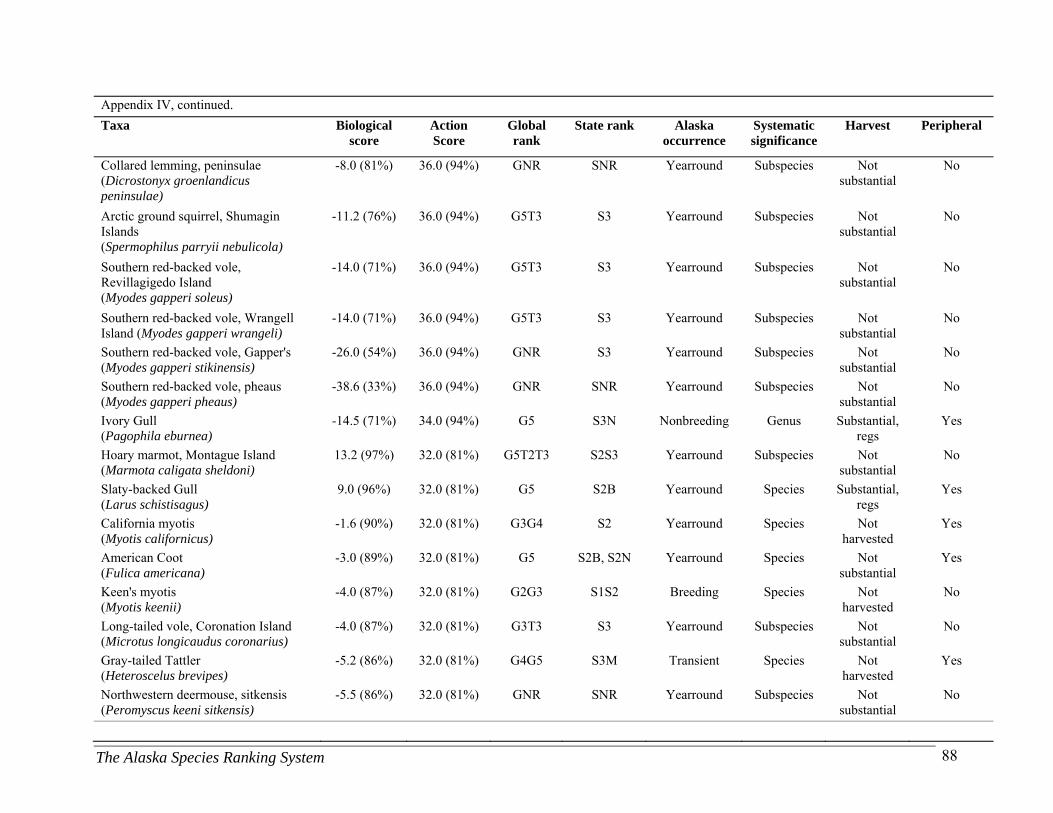
The Alaska Species Ranking System 88
Appendix IV, continued.
Taxa Biological score
Action Score
Global rank
State rank Alaska occurrence
Systematic significance
Harvest Peripheral
Collared lemming, peninsulae (Dicrostonyx groenlandicus peninsulae)
-8.0 (81%) 36.0 (94%) GNR SNR Yearround Subspecies Not substantial
No
Arctic ground squirrel, Shumagin Islands (Spermophilus parryii nebulicola)
-11.2 (76%) 36.0 (94%) G5T3 S3 Yearround Subspecies Not substantial
No
Southern red-backed vole, Revillagigedo Island (Myodes gapperi soleus)
-14.0 (71%) 36.0 (94%) G5T3 S3 Yearround Subspecies Not substantial
No
Southern red-backed vole, Wrangell Island (Myodes gapperi wrangeli)
-14.0 (71%) 36.0 (94%) G5T3 S3 Yearround Subspecies Not substantial
No
Southern red-backed vole, Gapper's (Myodes gapperi stikinensis)
-26.0 (54%) 36.0 (94%) GNR S3 Yearround Subspecies Not substantial
No
Southern red-backed vole, pheaus (Myodes gapperi pheaus)
-38.6 (33%) 36.0 (94%) GNR SNR Yearround Subspecies Not substantial
No
Ivory Gull (Pagophila eburnea)
-14.5 (71%) 34.0 (94%) G5 S3N Nonbreeding Genus Substantial, regs
Yes
Hoary marmot, Montague Island (Marmota caligata sheldoni)
13.2 (97%) 32.0 (81%) G5T2T3 S2S3 Yearround Subspecies Not substantial
No
Slaty-backed Gull (Larus schistisagus)
9.0 (96%) 32.0 (81%) G5 S2B Yearround Species Substantial, regs
Yes
California myotis (Myotis californicus)
-1.6 (90%) 32.0 (81%) G3G4 S2 Yearround Species Not harvested
Yes
American Coot (Fulica americana)
-3.0 (89%) 32.0 (81%) G5 S2B, S2N Yearround Species Not substantial
Yes
Keen's myotis (Myotis keenii)
-4.0 (87%) 32.0 (81%) G2G3 S1S2 Breeding Species Not harvested
No
Long-tailed vole, Coronation Island (Microtus longicaudus coronarius)
-4.0 (87%) 32.0 (81%) G3T3 S3 Yearround Subspecies Not substantial
No
Gray-tailed Tattler (Heteroscelus brevipes)
-5.2 (86%) 32.0 (81%) G4G5 S3M Transient Species Not harvested
Yes
Northwestern deermouse, sitkensis (Peromyscus keeni sitkensis)
-5.5 (86%) 32.0 (81%) GNR SNR Yearround Subspecies Not substantial
No
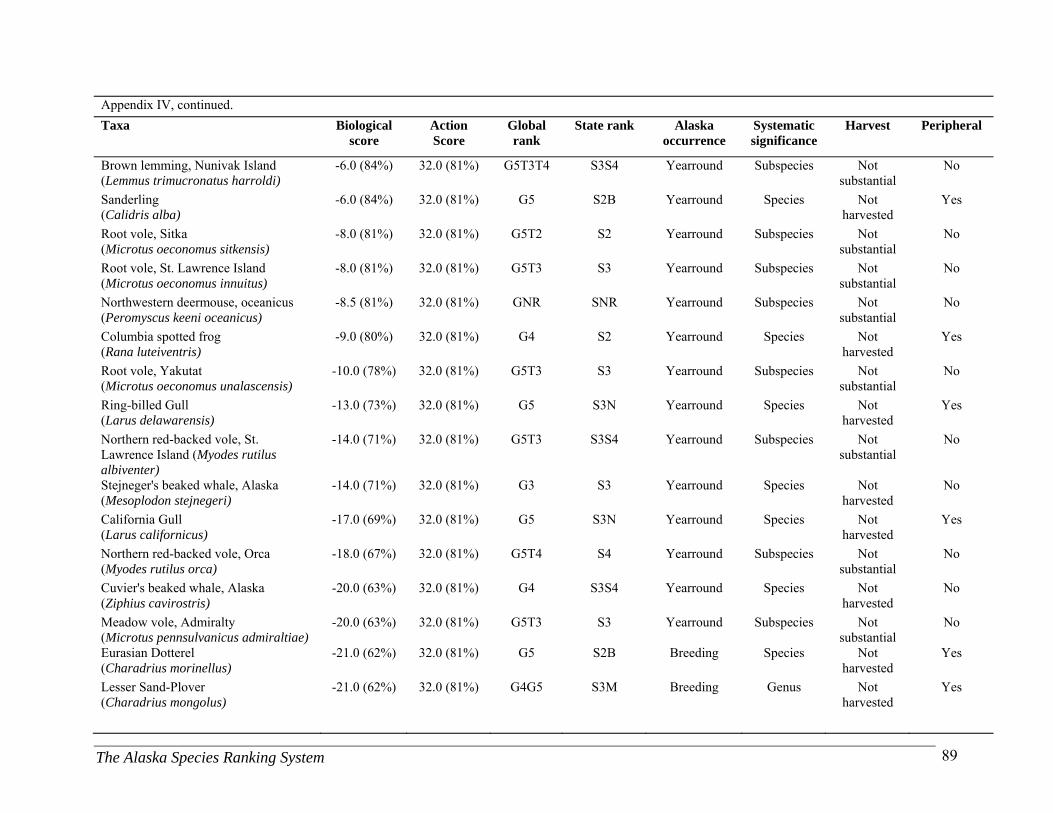
The Alaska Species Ranking System 89
Appendix IV, continued.
Taxa Biological score
Action Score
Global rank
State rank Alaska occurrence
Systematic significance
Harvest Peripheral
Brown lemming, Nunivak Island (Lemmus trimucronatus harroldi)
-6.0 (84%) 32.0 (81%) G5T3T4 S3S4 Yearround Subspecies Not substantial
No
Sanderling (Calidris alba)
-6.0 (84%) 32.0 (81%) G5 S2B Yearround Species Not harvested
Yes
Root vole, Sitka (Microtus oeconomus sitkensis)
-8.0 (81%) 32.0 (81%) G5T2 S2 Yearround Subspecies Not substantial
No
Root vole, St. Lawrence Island (Microtus oeconomus innuitus)
-8.0 (81%) 32.0 (81%) G5T3 S3 Yearround Subspecies Not substantial
No
Northwestern deermouse, oceanicus (Peromyscus keeni oceanicus)
-8.5 (81%) 32.0 (81%) GNR SNR Yearround Subspecies Not substantial
No
Columbia spotted frog (Rana luteiventris)
-9.0 (80%) 32.0 (81%) G4 S2 Yearround Species Not harvested
Yes
Root vole, Yakutat (Microtus oeconomus unalascensis)
-10.0 (78%) 32.0 (81%) G5T3 S3 Yearround Subspecies Not substantial
No
Ring-billed Gull (Larus delawarensis)
-13.0 (73%) 32.0 (81%) G5 S3N Yearround Species Not harvested
Yes
Northern red-backed vole, St. Lawrence Island (Myodes rutilus albiventer)
-14.0 (71%) 32.0 (81%) G5T3 S3S4 Yearround Subspecies Not substantial
No
Stejneger's beaked whale, Alaska (Mesoplodon stejnegeri)
-14.0 (71%) 32.0 (81%) G3 S3 Yearround Species Not harvested
No
California Gull (Larus californicus)
-17.0 (69%) 32.0 (81%) G5 S3N Yearround Species Not harvested
Yes
Northern red-backed vole, Orca (Myodes rutilus orca)
-18.0 (67%) 32.0 (81%) G5T4 S4 Yearround Subspecies Not substantial
No
Cuvier's beaked whale, Alaska (Ziphius cavirostris)
-20.0 (63%) 32.0 (81%) G4 S3S4 Yearround Species Not harvested
No
Meadow vole, Admiralty (Microtus pennsulvanicus admiraltiae)
-20.0 (63%) 32.0 (81%) G5T3 S3 Yearround Subspecies Not substantial
No
Eurasian Dotterel (Charadrius morinellus)
-21.0 (62%) 32.0 (81%) G5 S2B Breeding Species Not harvested
Yes
Lesser Sand-Plover (Charadrius mongolus)
-21.0 (62%) 32.0 (81%) G4G5 S3M Breeding Genus Not harvested
Yes
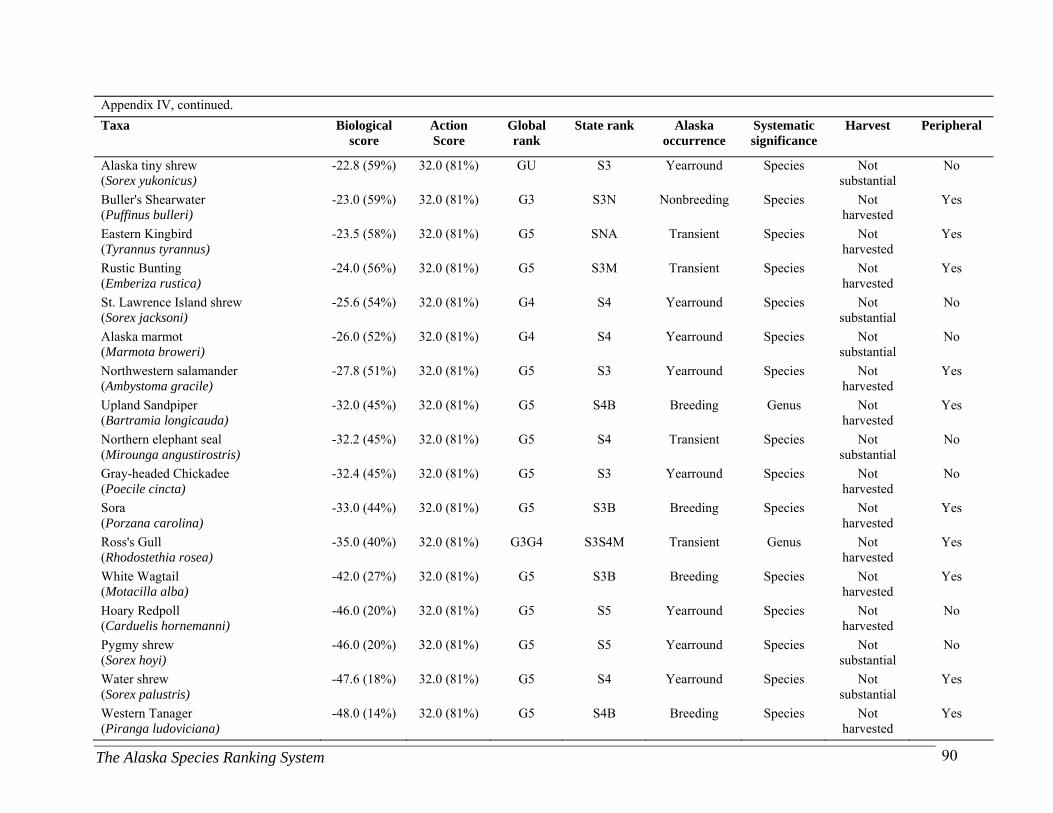
The Alaska Species Ranking System 90
Appendix IV, continued.
Taxa Biological score
Action Score
Global rank
State rank Alaska occurrence
Systematic significance
Harvest Peripheral
Alaska tiny shrew (Sorex yukonicus)
-22.8 (59%) 32.0 (81%) GU S3 Yearround Species Not substantial
No
Buller's Shearwater (Puffinus bulleri)
-23.0 (59%) 32.0 (81%) G3 S3N Nonbreeding Species Not harvested
Yes
Eastern Kingbird (Tyrannus tyrannus)
-23.5 (58%) 32.0 (81%) G5 SNA Transient Species Not harvested
Yes
Rustic Bunting (Emberiza rustica)
-24.0 (56%) 32.0 (81%) G5 S3M Transient Species Not harvested
Yes
St. Lawrence Island shrew (Sorex jacksoni)
-25.6 (54%) 32.0 (81%) G4 S4 Yearround Species Not substantial
No
Alaska marmot (Marmota broweri)
-26.0 (52%) 32.0 (81%) G4 S4 Yearround Species Not substantial
No
Northwestern salamander (Ambystoma gracile)
-27.8 (51%) 32.0 (81%) G5 S3 Yearround Species Not harvested
Yes
Upland Sandpiper (Bartramia longicauda)
-32.0 (45%) 32.0 (81%) G5 S4B Breeding Genus Not harvested
Yes
Northern elephant seal (Mirounga angustirostris)
-32.2 (45%) 32.0 (81%) G5 S4 Transient Species Not substantial
No
Gray-headed Chickadee (Poecile cincta)
-32.4 (45%) 32.0 (81%) G5 S3 Yearround Species Not harvested
No
Sora (Porzana carolina)
-33.0 (44%) 32.0 (81%) G5 S3B Breeding Species Not harvested
Yes
Ross's Gull (Rhodostethia rosea)
-35.0 (40%) 32.0 (81%) G3G4 S3S4M Transient Genus Not harvested
Yes
White Wagtail (Motacilla alba)
-42.0 (27%) 32.0 (81%) G5 S3B Breeding Species Not harvested
Yes
Hoary Redpoll (Carduelis hornemanni)
-46.0 (20%) 32.0 (81%) G5 S5 Yearround Species Not harvested
No
Pygmy shrew (Sorex hoyi)
-46.0 (20%) 32.0 (81%) G5 S5 Yearround Species Not substantial
No
Water shrew (Sorex palustris)
-47.6 (18%) 32.0 (81%) G5 S4 Yearround Species Not substantial
Yes
Western Tanager (Piranga ludoviciana)
-48.0 (14%) 32.0 (81%) G5 S4B Breeding Species Not harvested
Yes
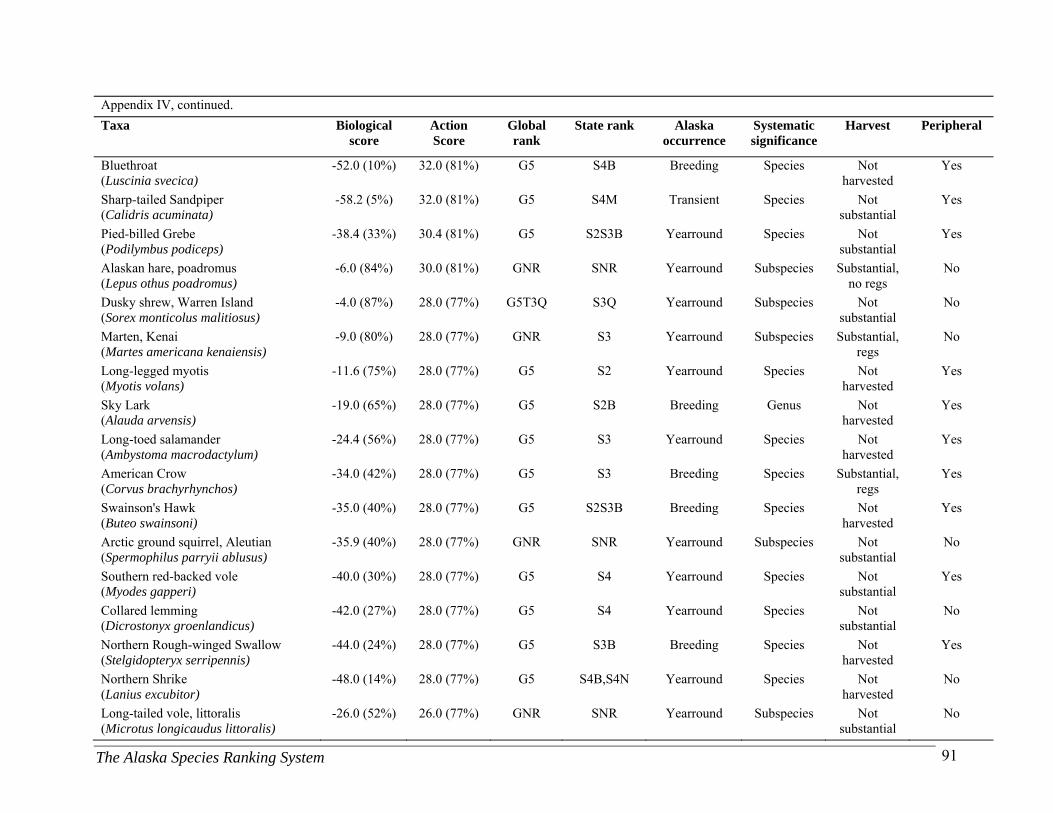
The Alaska Species Ranking System 91
Appendix IV, continued.
Taxa Biological score
Action Score
Global rank
State rank Alaska occurrence
Systematic significance
Harvest Peripheral
Bluethroat (Luscinia svecica)
-52.0 (10%) 32.0 (81%) G5 S4B Breeding Species Not harvested
Yes
Sharp-tailed Sandpiper (Calidris acuminata)
-58.2 (5%) 32.0 (81%) G5 S4M Transient Species Not substantial
Yes
Pied-billed Grebe (Podilymbus podiceps)
-38.4 (33%) 30.4 (81%) G5 S2S3B Yearround Species Not substantial
Yes
Alaskan hare, poadromus (Lepus othus poadromus)
-6.0 (84%) 30.0 (81%) GNR SNR Yearround Subspecies Substantial, no regs
No
Dusky shrew, Warren Island (Sorex monticolus malitiosus)
-4.0 (87%) 28.0 (77%) G5T3Q S3Q Yearround Subspecies Not substantial
No
Marten, Kenai (Martes americana kenaiensis)
-9.0 (80%) 28.0 (77%) GNR S3 Yearround Subspecies Substantial, regs
No
Long-legged myotis (Myotis volans)
-11.6 (75%) 28.0 (77%) G5 S2 Yearround Species Not harvested
Yes
Sky Lark (Alauda arvensis)
-19.0 (65%) 28.0 (77%) G5 S2B Breeding Genus Not harvested
Yes
Long-toed salamander (Ambystoma macrodactylum)
-24.4 (56%) 28.0 (77%) G5 S3 Yearround Species Not harvested
Yes
American Crow (Corvus brachyrhynchos)
-34.0 (42%) 28.0 (77%) G5 S3 Breeding Species Substantial, regs
Yes
Swainson's Hawk (Buteo swainsoni)
-35.0 (40%) 28.0 (77%) G5 S2S3B Breeding Species Not harvested
Yes
Arctic ground squirrel, Aleutian (Spermophilus parryii ablusus)
-35.9 (40%) 28.0 (77%) GNR SNR Yearround Subspecies Not substantial
No
Southern red-backed vole (Myodes gapperi)
-40.0 (30%) 28.0 (77%) G5 S4 Yearround Species Not substantial
Yes
Collared lemming (Dicrostonyx groenlandicus)
-42.0 (27%) 28.0 (77%) G5 S4 Yearround Species Not substantial
No
Northern Rough-winged Swallow (Stelgidopteryx serripennis)
-44.0 (24%) 28.0 (77%) G5 S3B Breeding Species Not harvested
Yes
Northern Shrike (Lanius excubitor)
-48.0 (14%) 28.0 (77%) G5 S4B,S4N Yearround Species Not harvested
No
Long-tailed vole, littoralis (Microtus longicaudus littoralis)
-26.0 (52%) 26.0 (77%) GNR SNR Yearround Subspecies Not substantial
No
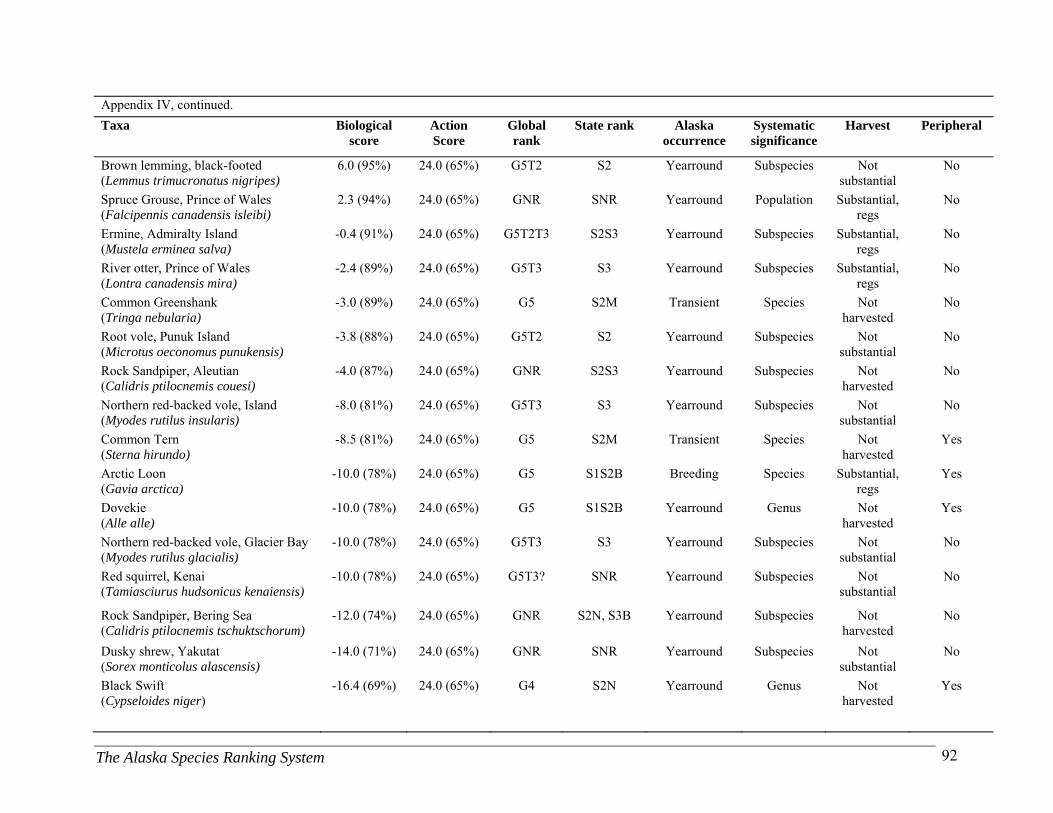
The Alaska Species Ranking System 92
Appendix IV, continued.
Taxa Biological score
Action Score
Global rank
State rank Alaska occurrence
Systematic significance
Harvest Peripheral
Brown lemming, black-footed (Lemmus trimucronatus nigripes)
6.0 (95%) 24.0 (65%) G5T2 S2 Yearround Subspecies Not substantial
No
Spruce Grouse, Prince of Wales (Falcipennis canadensis isleibi)
2.3 (94%) 24.0 (65%) GNR SNR Yearround Population Substantial, regs
No
Ermine, Admiralty Island (Mustela erminea salva)
-0.4 (91%) 24.0 (65%) G5T2T3 S2S3 Yearround Subspecies Substantial, regs
No
River otter, Prince of Wales (Lontra canadensis mira)
-2.4 (89%) 24.0 (65%) G5T3 S3 Yearround Subspecies Substantial, regs
No
Common Greenshank (Tringa nebularia)
-3.0 (89%) 24.0 (65%) G5 S2M Transient Species Not harvested
No
Root vole, Punuk Island (Microtus oeconomus punukensis)
-3.8 (88%) 24.0 (65%) G5T2 S2 Yearround Subspecies Not substantial
No
Rock Sandpiper, Aleutian (Calidris ptilocnemis couesi)
-4.0 (87%) 24.0 (65%) GNR S2S3 Yearround Subspecies Not harvested
No
Northern red-backed vole, Island (Myodes rutilus insularis)
-8.0 (81%) 24.0 (65%) G5T3 S3 Yearround Subspecies Not substantial
No
Common Tern (Sterna hirundo)
-8.5 (81%) 24.0 (65%) G5 S2M Transient Species Not harvested
Yes
Arctic Loon (Gavia arctica)
-10.0 (78%) 24.0 (65%) G5 S1S2B Breeding Species Substantial, regs
Yes
Dovekie (Alle alle)
-10.0 (78%) 24.0 (65%) G5 S1S2B Yearround Genus Not harvested
Yes
Northern red-backed vole, Glacier Bay (Myodes rutilus glacialis)
-10.0 (78%) 24.0 (65%) G5T3 S3 Yearround Subspecies Not substantial
No
Red squirrel, Kenai (Tamiasciurus hudsonicus kenaiensis)
-10.0 (78%) 24.0 (65%) G5T3? SNR Yearround Subspecies Not substantial
No
Rock Sandpiper, Bering Sea (Calidris ptilocnemis tschuktschorum)
-12.0 (74%) 24.0 (65%) GNR S2N, S3B Yearround Subspecies Not harvested
No
Dusky shrew, Yakutat (Sorex monticolus alascensis)
-14.0 (71%) 24.0 (65%) GNR SNR Yearround Subspecies Not substantial
No
Black Swift (Cypseloides niger)
-16.4 (69%) 24.0 (65%) G4 S2N Yearround Genus Not harvested
Yes
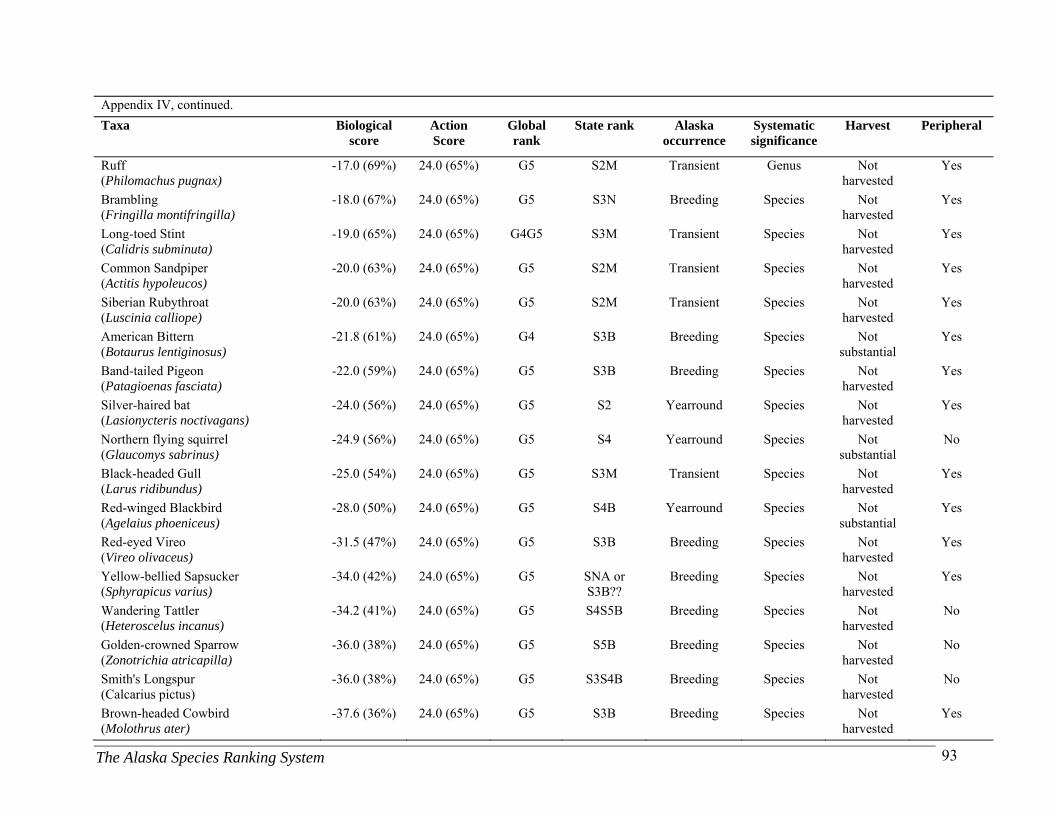
The Alaska Species Ranking System 93
Appendix IV, continued.
Taxa Biological score
Action Score
Global rank
State rank Alaska occurrence
Systematic significance
Harvest Peripheral
Ruff (Philomachus pugnax)
-17.0 (69%) 24.0 (65%) G5 S2M Transient Genus Not harvested
Yes
Brambling (Fringilla montifringilla)
-18.0 (67%) 24.0 (65%) G5 S3N Breeding Species Not harvested
Yes
Long-toed Stint (Calidris subminuta)
-19.0 (65%) 24.0 (65%) G4G5 S3M Transient Species Not harvested
Yes
Common Sandpiper (Actitis hypoleucos)
-20.0 (63%) 24.0 (65%) G5 S2M Transient Species Not harvested
Yes
Siberian Rubythroat (Luscinia calliope)
-20.0 (63%) 24.0 (65%) G5 S2M Transient Species Not harvested
Yes
American Bittern (Botaurus lentiginosus)
-21.8 (61%) 24.0 (65%) G4 S3B Breeding Species Not substantial
Yes
Band-tailed Pigeon (Patagioenas fasciata)
-22.0 (59%) 24.0 (65%) G5 S3B Breeding Species Not harvested
Yes
Silver-haired bat (Lasionycteris noctivagans)
-24.0 (56%) 24.0 (65%) G5 S2 Yearround Species Not harvested
Yes
Northern flying squirrel (Glaucomys sabrinus)
-24.9 (56%) 24.0 (65%) G5 S4 Yearround Species Not substantial
No
Black-headed Gull (Larus ridibundus)
-25.0 (54%) 24.0 (65%) G5 S3M Transient Species Not harvested
Yes
Red-winged Blackbird (Agelaius phoeniceus)
-28.0 (50%) 24.0 (65%) G5 S4B Yearround Species Not substantial
Yes
Red-eyed Vireo (Vireo olivaceus)
-31.5 (47%) 24.0 (65%) G5 S3B Breeding Species Not harvested
Yes
Yellow-bellied Sapsucker (Sphyrapicus varius)
-34.0 (42%) 24.0 (65%) G5 SNA or S3B??
Breeding Species Not harvested
Yes
Wandering Tattler (Heteroscelus incanus)
-34.2 (41%) 24.0 (65%) G5 S4S5B Breeding Species Not harvested
No
Golden-crowned Sparrow (Zonotrichia atricapilla)
-36.0 (38%) 24.0 (65%) G5 S5B Breeding Species Not harvested
No
Smith's Longspur (Calcarius pictus)
-36.0 (38%) 24.0 (65%) G5 S3S4B Breeding Species Not harvested
No
Brown-headed Cowbird (Molothrus ater)
-37.6 (36%) 24.0 (65%) G5 S3B Breeding Species Not harvested
Yes
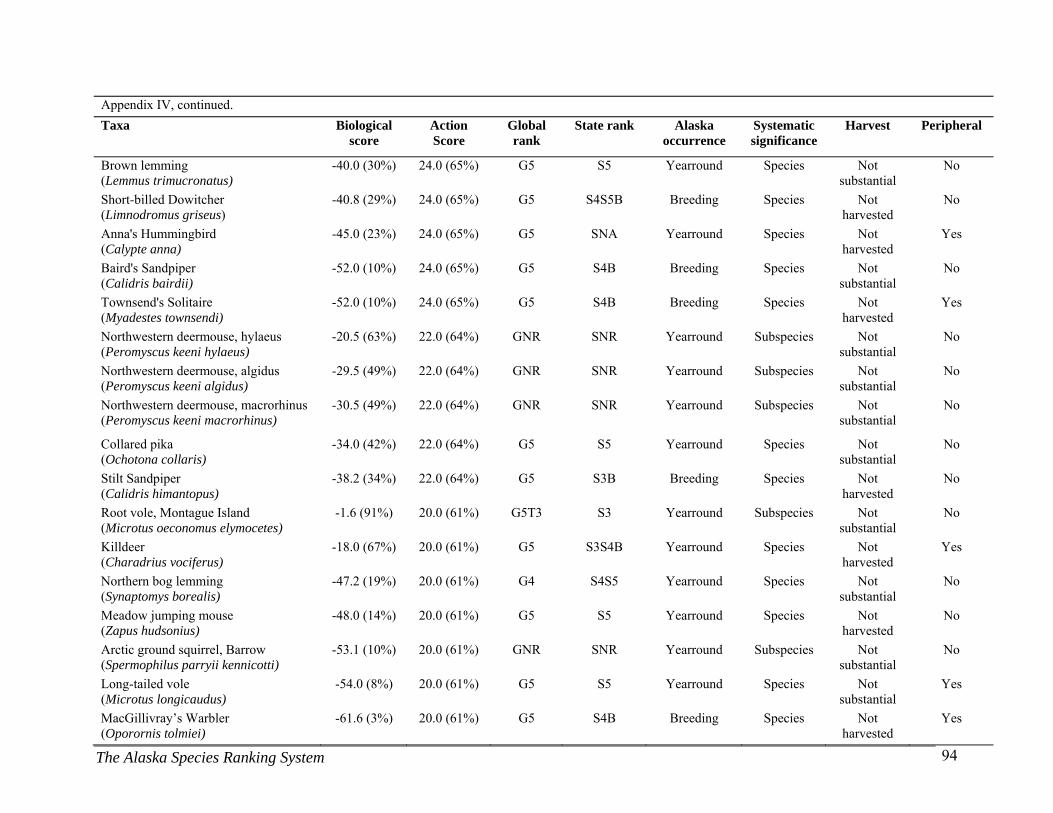
The Alaska Species Ranking System 94
Appendix IV, continued.
Taxa Biological score
Action Score
Global rank
State rank Alaska occurrence
Systematic significance
Harvest Peripheral
Brown lemming (Lemmus trimucronatus)
-40.0 (30%) 24.0 (65%) G5 S5 Yearround Species Not substantial
No
Short-billed Dowitcher (Limnodromus griseus)
-40.8 (29%) 24.0 (65%) G5 S4S5B Breeding Species Not harvested
No
Anna's Hummingbird (Calypte anna)
-45.0 (23%) 24.0 (65%) G5 SNA Yearround Species Not harvested
Yes
Baird's Sandpiper (Calidris bairdii)
-52.0 (10%) 24.0 (65%) G5 S4B Breeding Species Not substantial
No
Townsend's Solitaire (Myadestes townsendi)
-52.0 (10%) 24.0 (65%) G5 S4B Breeding Species Not harvested
Yes
Northwestern deermouse, hylaeus (Peromyscus keeni hylaeus)
-20.5 (63%) 22.0 (64%) GNR SNR Yearround Subspecies Not substantial
No
Northwestern deermouse, algidus (Peromyscus keeni algidus)
-29.5 (49%) 22.0 (64%) GNR SNR Yearround Subspecies Not substantial
No
Northwestern deermouse, macrorhinus (Peromyscus keeni macrorhinus)
-30.5 (49%) 22.0 (64%) GNR SNR Yearround Subspecies Not substantial
No
Collared pika (Ochotona collaris)
-34.0 (42%) 22.0 (64%) G5 S5 Yearround Species Not substantial
No
Stilt Sandpiper (Calidris himantopus)
-38.2 (34%) 22.0 (64%) G5 S3B Breeding Species Not harvested
No
Root vole, Montague Island (Microtus oeconomus elymocetes)
-1.6 (91%) 20.0 (61%) G5T3 S3 Yearround Subspecies Not substantial
No
Killdeer (Charadrius vociferus)
-18.0 (67%) 20.0 (61%) G5 S3S4B Yearround Species Not harvested
Yes
Northern bog lemming (Synaptomys borealis)
-47.2 (19%) 20.0 (61%) G4 S4S5 Yearround Species Not substantial
No
Meadow jumping mouse (Zapus hudsonius)
-48.0 (14%) 20.0 (61%) G5 S5 Yearround Species Not harvested
No
Arctic ground squirrel, Barrow (Spermophilus parryii kennicotti)
-53.1 (10%) 20.0 (61%) GNR SNR Yearround Subspecies Not substantial
No
Long-tailed vole (Microtus longicaudus)
-54.0 (8%) 20.0 (61%) G5 S5 Yearround Species Not substantial
Yes
MacGillivray’s Warbler (Oporornis tolmiei)
-61.6 (3%) 20.0 (61%) G5 S4B Breeding Species Not harvested
Yes
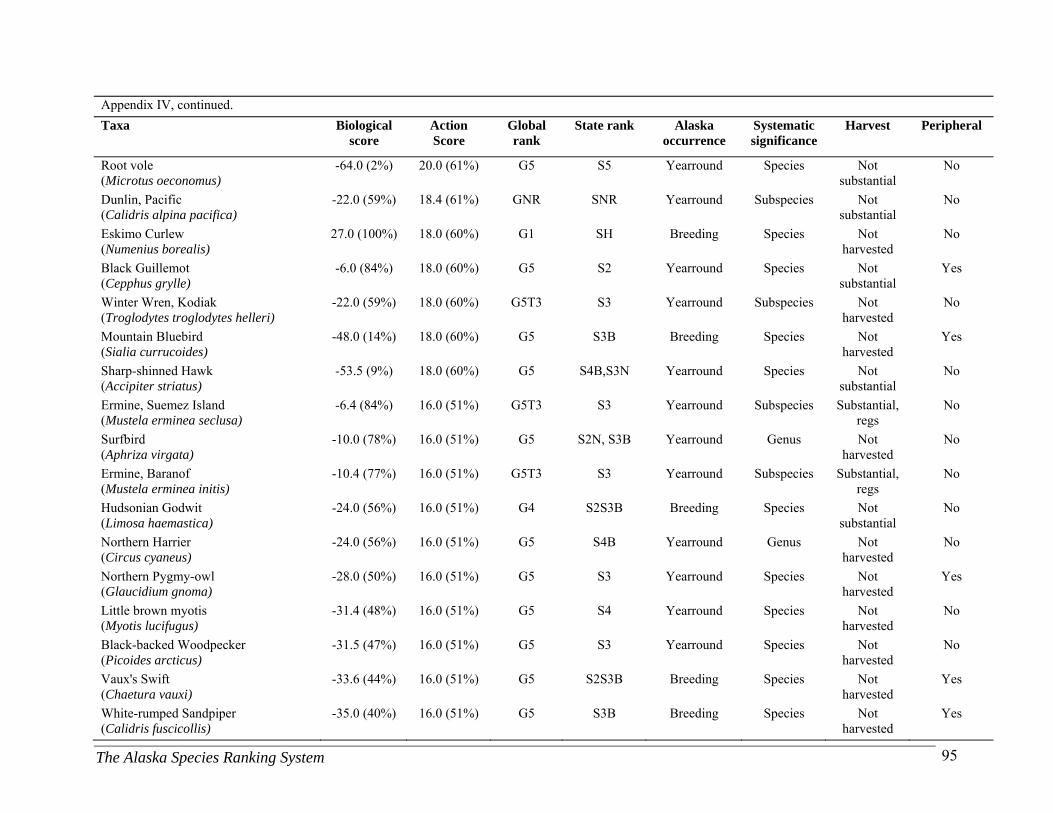
The Alaska Species Ranking System 95
Appendix IV, continued.
Taxa Biological score
Action Score
Global rank
State rank Alaska occurrence
Systematic significance
Harvest Peripheral
Root vole (Microtus oeconomus)
-64.0 (2%) 20.0 (61%) G5 S5 Yearround Species Not substantial
No
Dunlin, Pacific (Calidris alpina pacifica)
-22.0 (59%) 18.4 (61%) GNR SNR Yearround Subspecies Not substantial
No
Eskimo Curlew (Numenius borealis)
27.0 (100%) 18.0 (60%) G1 SH Breeding Species Not harvested
No
Black Guillemot (Cepphus grylle)
-6.0 (84%) 18.0 (60%) G5 S2 Yearround Species Not substantial
Yes
Winter Wren, Kodiak (Troglodytes troglodytes helleri)
-22.0 (59%) 18.0 (60%) G5T3 S3 Yearround Subspecies Not harvested
No
Mountain Bluebird (Sialia currucoides)
-48.0 (14%) 18.0 (60%) G5 S3B Breeding Species Not harvested
Yes
Sharp-shinned Hawk (Accipiter striatus)
-53.5 (9%) 18.0 (60%) G5 S4B,S3N Yearround Species Not substantial
No
Ermine, Suemez Island (Mustela erminea seclusa)
-6.4 (84%) 16.0 (51%) G5T3 S3 Yearround Subspecies Substantial, regs
No
Surfbird (Aphriza virgata)
-10.0 (78%) 16.0 (51%) G5 S2N, S3B Yearround Genus Not harvested
No
Ermine, Baranof (Mustela erminea initis)
-10.4 (77%) 16.0 (51%) G5T3 S3 Yearround Subspecies Substantial, regs
No
Hudsonian Godwit (Limosa haemastica)
-24.0 (56%) 16.0 (51%) G4 S2S3B Breeding Species Not substantial
No
Northern Harrier (Circus cyaneus)
-24.0 (56%) 16.0 (51%) G5 S4B Yearround Genus Not harvested
No
Northern Pygmy-owl (Glaucidium gnoma)
-28.0 (50%) 16.0 (51%) G5 S3 Yearround Species Not harvested
Yes
Little brown myotis (Myotis lucifugus)
-31.4 (48%) 16.0 (51%) G5 S4 Yearround Species Not harvested
No
Black-backed Woodpecker (Picoides arcticus)
-31.5 (47%) 16.0 (51%) G5 S3 Yearround Species Not harvested
No
Vaux's Swift (Chaetura vauxi)
-33.6 (44%) 16.0 (51%) G5 S2S3B Breeding Species Not harvested
Yes
White-rumped Sandpiper (Calidris fuscicollis)
-35.0 (40%) 16.0 (51%) G5 S3B Breeding Species Not harvested
Yes
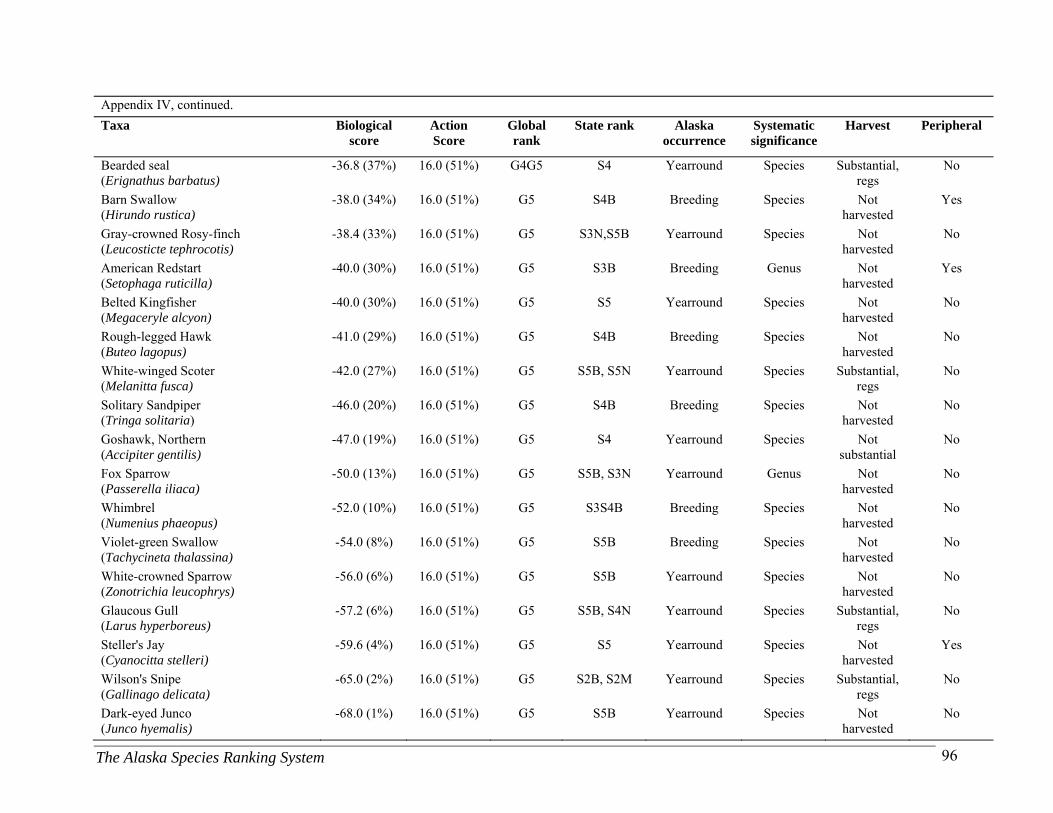
The Alaska Species Ranking System 96
Appendix IV, continued.
Taxa Biological score
Action Score
Global rank
State rank Alaska occurrence
Systematic significance
Harvest Peripheral
Bearded seal (Erignathus barbatus)
-36.8 (37%) 16.0 (51%) G4G5 S4 Yearround Species Substantial, regs
No
Barn Swallow (Hirundo rustica)
-38.0 (34%) 16.0 (51%) G5 S4B Breeding Species Not harvested
Yes
Gray-crowned Rosy-finch (Leucosticte tephrocotis)
-38.4 (33%) 16.0 (51%) G5 S3N,S5B Yearround Species Not harvested
No
American Redstart (Setophaga ruticilla)
-40.0 (30%) 16.0 (51%) G5 S3B Breeding Genus Not harvested
Yes
Belted Kingfisher (Megaceryle alcyon)
-40.0 (30%) 16.0 (51%) G5 S5 Yearround Species Not harvested
No
Rough-legged Hawk (Buteo lagopus)
-41.0 (29%) 16.0 (51%) G5 S4B Breeding Species Not harvested
No
White-winged Scoter (Melanitta fusca)
-42.0 (27%) 16.0 (51%) G5 S5B, S5N Yearround Species Substantial, regs
No
Solitary Sandpiper (Tringa solitaria)
-46.0 (20%) 16.0 (51%) G5 S4B Breeding Species Not harvested
No
Goshawk, Northern (Accipiter gentilis)
-47.0 (19%) 16.0 (51%) G5 S4 Yearround Species Not substantial
No
Fox Sparrow (Passerella iliaca)
-50.0 (13%) 16.0 (51%) G5 S5B, S3N Yearround Genus Not harvested
No
Whimbrel (Numenius phaeopus)
-52.0 (10%) 16.0 (51%) G5 S3S4B Breeding Species Not harvested
No
Violet-green Swallow (Tachycineta thalassina)
-54.0 (8%) 16.0 (51%) G5 S5B Breeding Species Not harvested
No
White-crowned Sparrow (Zonotrichia leucophrys)
-56.0 (6%) 16.0 (51%) G5 S5B Yearround Species Not harvested
No
Glaucous Gull (Larus hyperboreus)
-57.2 (6%) 16.0 (51%) G5 S5B, S4N Yearround Species Substantial, regs
No
Steller's Jay (Cyanocitta stelleri)
-59.6 (4%) 16.0 (51%) G5 S5 Yearround Species Not harvested
Yes
Wilson's Snipe (Gallinago delicata)
-65.0 (2%) 16.0 (51%) G5 S2B, S2M Yearround Species Substantial, regs
No
Dark-eyed Junco (Junco hyemalis)
-68.0 (1%) 16.0 (51%) G5 S5B Yearround Species Not harvested
No
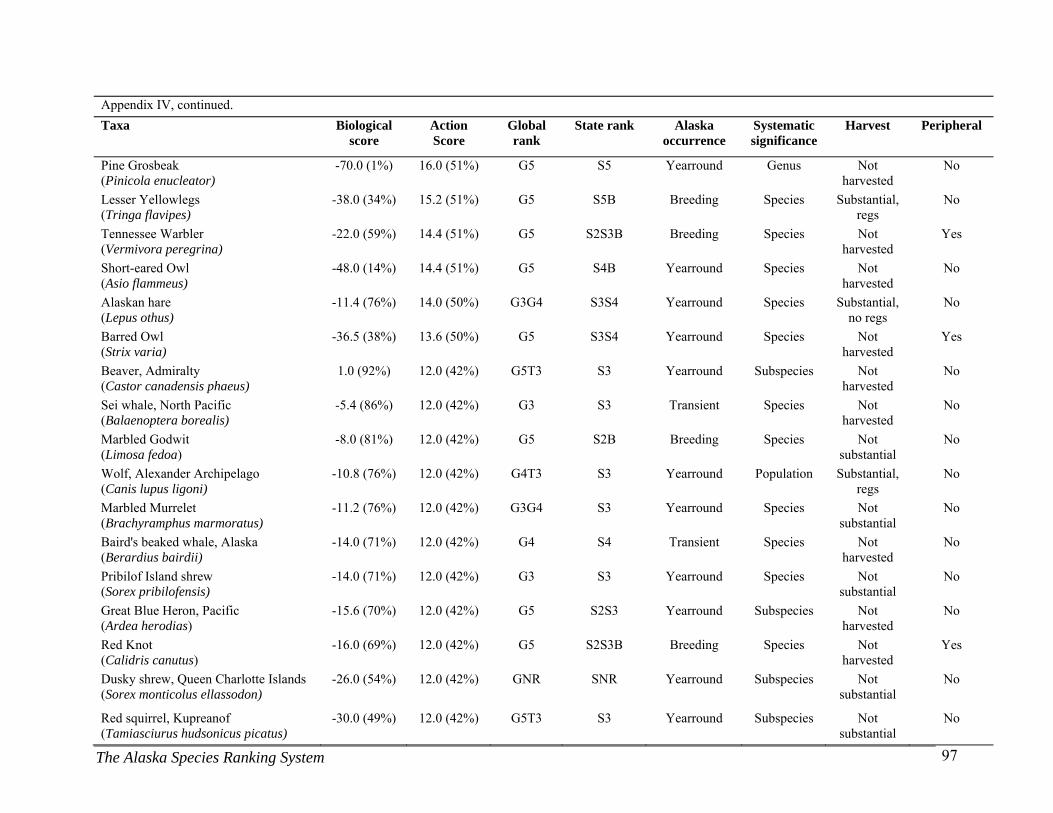
The Alaska Species Ranking System 97
Appendix IV, continued.
Taxa Biological score
Action Score
Global rank
State rank Alaska occurrence
Systematic significance
Harvest Peripheral
Pine Grosbeak (Pinicola enucleator)
-70.0 (1%) 16.0 (51%) G5 S5 Yearround Genus Not harvested
No
Lesser Yellowlegs (Tringa flavipes)
-38.0 (34%) 15.2 (51%) G5 S5B Breeding Species Substantial, regs
No
Tennessee Warbler (Vermivora peregrina)
-22.0 (59%) 14.4 (51%) G5 S2S3B Breeding Species Not harvested
Yes
Short-eared Owl (Asio flammeus)
-48.0 (14%) 14.4 (51%) G5 S4B Yearround Species Not harvested
No
Alaskan hare (Lepus othus)
-11.4 (76%) 14.0 (50%) G3G4 S3S4 Yearround Species Substantial, no regs
No
Barred Owl (Strix varia)
-36.5 (38%) 13.6 (50%) G5 S3S4 Yearround Species Not harvested
Yes
Beaver, Admiralty (Castor canadensis phaeus)
1.0 (92%) 12.0 (42%) G5T3 S3 Yearround Subspecies Not harvested
No
Sei whale, North Pacific (Balaenoptera borealis)
-5.4 (86%) 12.0 (42%) G3 S3 Transient Species Not harvested
No
Marbled Godwit (Limosa fedoa)
-8.0 (81%) 12.0 (42%) G5 S2B Breeding Species Not substantial
No
Wolf, Alexander Archipelago (Canis lupus ligoni)
-10.8 (76%) 12.0 (42%) G4T3 S3 Yearround Population Substantial, regs
No
Marbled Murrelet (Brachyramphus marmoratus)
-11.2 (76%) 12.0 (42%) G3G4 S3 Yearround Species Not substantial
No
Baird's beaked whale, Alaska (Berardius bairdii)
-14.0 (71%) 12.0 (42%) G4 S4 Transient Species Not harvested
No
Pribilof Island shrew (Sorex pribilofensis)
-14.0 (71%) 12.0 (42%) G3 S3 Yearround Species Not substantial
No
Great Blue Heron, Pacific (Ardea herodias)
-15.6 (70%) 12.0 (42%) G5 S2S3 Yearround Subspecies Not harvested
No
Red Knot (Calidris canutus)
-16.0 (69%) 12.0 (42%) G5 S2S3B Breeding Species Not harvested
Yes
Dusky shrew, Queen Charlotte Islands (Sorex monticolus ellassodon)
-26.0 (54%) 12.0 (42%) GNR SNR Yearround Subspecies Not substantial
No
Red squirrel, Kupreanof (Tamiasciurus hudsonicus picatus)
-30.0 (49%) 12.0 (42%) G5T3 S3 Yearround Subspecies Not substantial
No

The Alaska Species Ranking System 98
Appendix IV, continued.
Taxa Biological score
Action Score
Global rank
State rank Alaska occurrence
Systematic significance
Harvest Peripheral
Roughskin newt (Taricha granulosa)
-33.2 (44%) 12.0 (42%) G5 S4 Yearround Species Not harvested
Yes
Gray whale, Eastern Pacific (Eschrichtius robustus)
-34.0 (42%) 12.0 (42%) G4 S4 Transient Species Not substantial
No
Snowy Owl (Bubo scandiacus)
-40.0 (30%) 12.0 (42%) G5 S3S4 Yearround Species Substantial, no regs
No
Great Horned Owl (Bubo virginianus)
-46.0 (20%) 12.0 (42%) G5 S5 Yearround Species Not substantial
No
Red-tailed Hawk (Buteo jamaicensis)
-46.0 (20%) 12.0 (42%) G5 S4S5B Breeding Species Not substantial
No
Semipalmated Sandpiper (Calidris pusilla)
-46.0 (20%) 12.0 (42%) G5 S4S5B Breeding Species Not substantial
No
Taiga vole (yellow-cheeked vole) (Microtus xanthognathus)
-46.0 (20%) 12.0 (42%) G5 S4S5 Yearround Species Not substantial
No
American Tree Sparrow (Spizella arborea)
-48.0 (14%) 12.0 (42%) G5 S5B Breeding Species Not harvested
No
Arctic Warbler (Phylloscopus borealis)
-48.0 (14%) 12.0 (42%) G5 S5B Breeding Species Not harvested
Yes
Red Phalarope (Phalaropus fulicarius)
-52.0 (10%) 12.0 (42%) G5 S4S5B Breeding Species Not substantial
No
American Golden-plover (Pluvialis dominica)
-54.0 (8%) 12.0 (42%) G5 S5B Breeding Species Not harvested
No
Dusky shrew (Sorex monticolus)
-55.3 (8%) 12.0 (42%) G5 S5 Yearround Species Not substantial
No
Eastern Yellow Wagtail (Motacilla tschutschensis)
-56.0 (6%) 12.0 (42%) G5 S5B Breeding Species Not harvested
No
Singing vole (Microtus miurus)
-56.0 (6%) 12.0 (42%) G4G5 S4S5 Yearround Species Not substantial
No
Meadow vole (Microtus pennsylvanicus)
-62.0 (3%) 12.0 (42%) G5 S5 Yearround Species Not substantial
No
Northwestern Crow (Corvus caurinus)
-64.0 (2%) 12.0 (42%) G5 S5 Yearround Species Not harvested
No
Kittlitz's Murrelet (Brachyramphus brevirostris)
0.8 (92%) 10.4 (42%) G2 S2B,S2N Yearround Species Not substantial
No
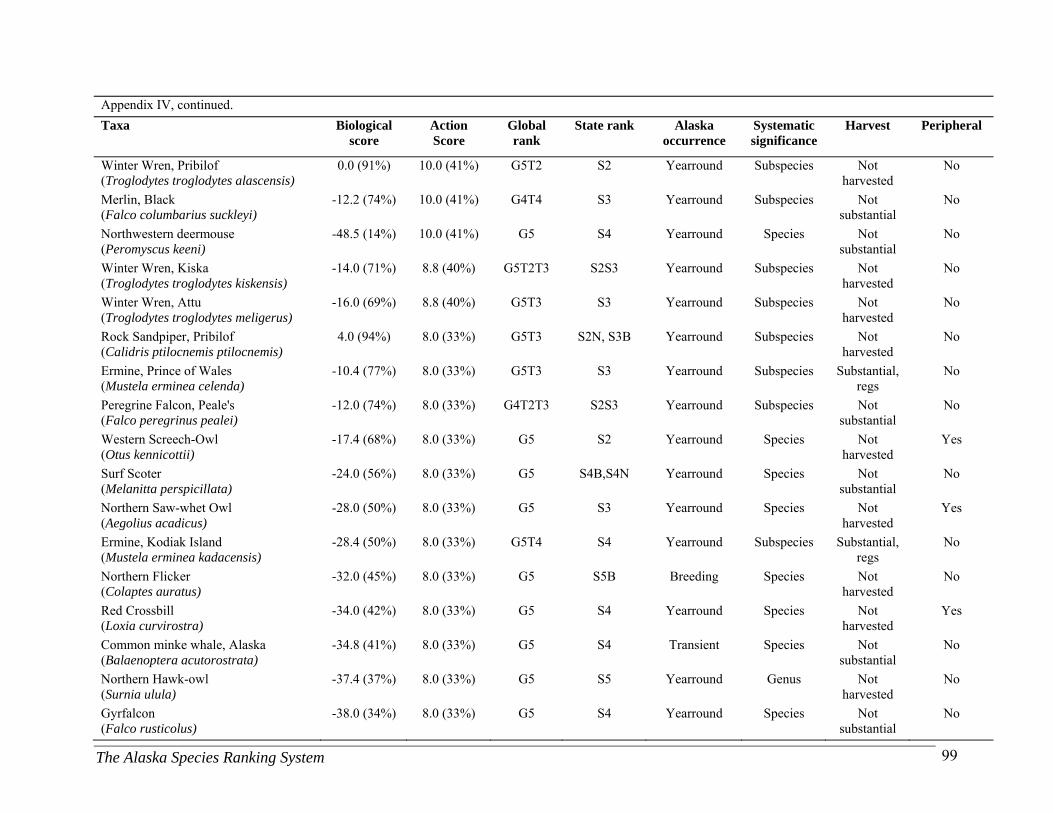
The Alaska Species Ranking System 99
Appendix IV, continued.
Taxa Biological score
Action Score
Global rank
State rank Alaska occurrence
Systematic significance
Harvest Peripheral
Winter Wren, Pribilof (Troglodytes troglodytes alascensis)
0.0 (91%) 10.0 (41%) G5T2 S2 Yearround Subspecies Not harvested
No
Merlin, Black (Falco columbarius suckleyi)
-12.2 (74%) 10.0 (41%) G4T4 S3 Yearround Subspecies Not substantial
No
Northwestern deermouse (Peromyscus keeni)
-48.5 (14%) 10.0 (41%) G5 S4 Yearround Species Not substantial
No
Winter Wren, Kiska (Troglodytes troglodytes kiskensis)
-14.0 (71%) 8.8 (40%) G5T2T3 S2S3 Yearround Subspecies Not harvested
No
Winter Wren, Attu (Troglodytes troglodytes meligerus)
-16.0 (69%) 8.8 (40%) G5T3 S3 Yearround Subspecies Not harvested
No
Rock Sandpiper, Pribilof (Calidris ptilocnemis ptilocnemis)
4.0 (94%) 8.0 (33%) G5T3 S2N, S3B Yearround Subspecies Not harvested
No
Ermine, Prince of Wales (Mustela erminea celenda)
-10.4 (77%) 8.0 (33%) G5T3 S3 Yearround Subspecies Substantial, regs
No
Peregrine Falcon, Peale's (Falco peregrinus pealei)
-12.0 (74%) 8.0 (33%) G4T2T3 S2S3 Yearround Subspecies Not substantial
No
Western Screech-Owl (Otus kennicottii)
-17.4 (68%) 8.0 (33%) G5 S2 Yearround Species Not harvested
Yes
Surf Scoter (Melanitta perspicillata)
-24.0 (56%) 8.0 (33%) G5 S4B,S4N Yearround Species Not substantial
No
Northern Saw-whet Owl (Aegolius acadicus)
-28.0 (50%) 8.0 (33%) G5 S3 Yearround Species Not harvested
Yes
Ermine, Kodiak Island (Mustela erminea kadacensis)
-28.4 (50%) 8.0 (33%) G5T4 S4 Yearround Subspecies Substantial, regs
No
Northern Flicker (Colaptes auratus)
-32.0 (45%) 8.0 (33%) G5 S5B Breeding Species Not harvested
No
Red Crossbill (Loxia curvirostra)
-34.0 (42%) 8.0 (33%) G5 S4 Yearround Species Not harvested
Yes
Common minke whale, Alaska (Balaenoptera acutorostrata)
-34.8 (41%) 8.0 (33%) G5 S4 Transient Species Not substantial
No
Northern Hawk-owl (Surnia ulula)
-37.4 (37%) 8.0 (33%) G5 S5 Yearround Genus Not harvested
No
Gyrfalcon (Falco rusticolus)
-38.0 (34%) 8.0 (33%) G5 S4 Yearround Species Not substantial
No
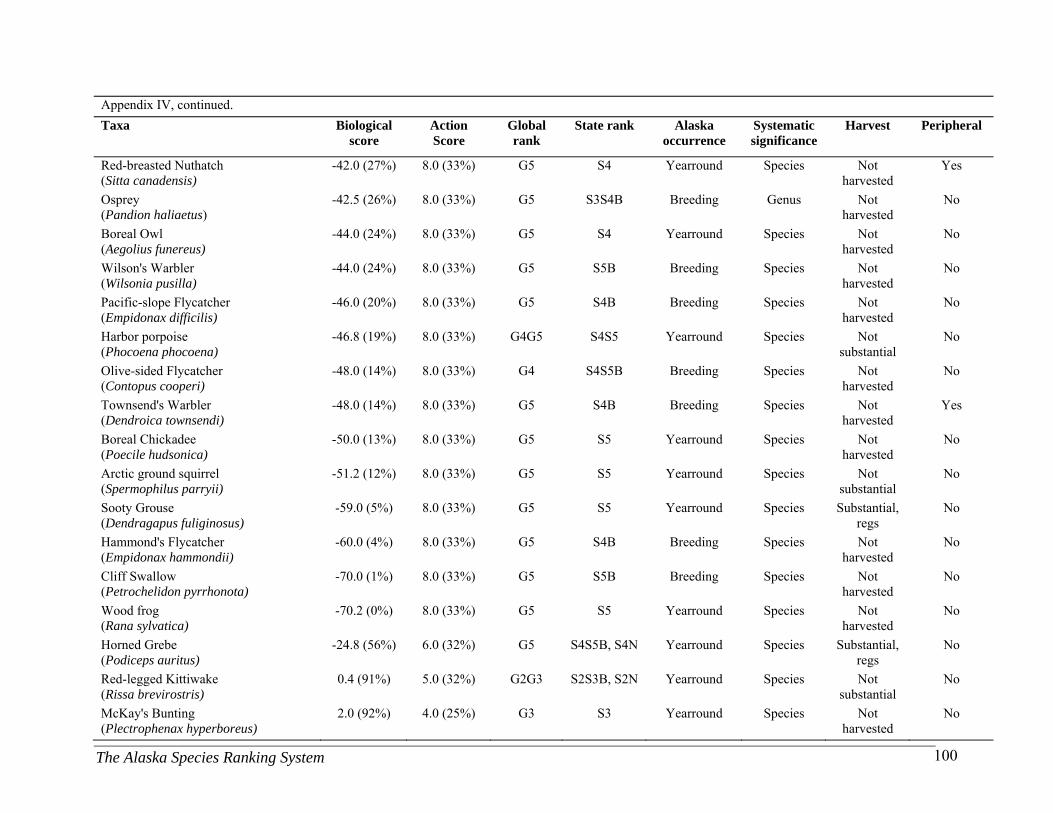
The Alaska Species Ranking System 100
Appendix IV, continued.
Taxa Biological score
Action Score
Global rank
State rank Alaska occurrence
Systematic significance
Harvest Peripheral
Red-breasted Nuthatch (Sitta canadensis)
-42.0 (27%) 8.0 (33%) G5 S4 Yearround Species Not harvested
Yes
Osprey (Pandion haliaetus)
-42.5 (26%) 8.0 (33%) G5 S3S4B Breeding Genus Not harvested
No
Boreal Owl (Aegolius funereus)
-44.0 (24%) 8.0 (33%) G5 S4 Yearround Species Not harvested
No
Wilson's Warbler (Wilsonia pusilla)
-44.0 (24%) 8.0 (33%) G5 S5B Breeding Species Not harvested
No
Pacific-slope Flycatcher (Empidonax difficilis)
-46.0 (20%) 8.0 (33%) G5 S4B Breeding Species Not harvested
No
Harbor porpoise (Phocoena phocoena)
-46.8 (19%) 8.0 (33%) G4G5 S4S5 Yearround Species Not substantial
No
Olive-sided Flycatcher (Contopus cooperi)
-48.0 (14%) 8.0 (33%) G4 S4S5B Breeding Species Not harvested
No
Townsend's Warbler (Dendroica townsendi)
-48.0 (14%) 8.0 (33%) G5 S4B Breeding Species Not harvested
Yes
Boreal Chickadee (Poecile hudsonica)
-50.0 (13%) 8.0 (33%) G5 S5 Yearround Species Not harvested
No
Arctic ground squirrel (Spermophilus parryii)
-51.2 (12%) 8.0 (33%) G5 S5 Yearround Species Not substantial
No
Sooty Grouse (Dendragapus fuliginosus)
-59.0 (5%) 8.0 (33%) G5 S5 Yearround Species Substantial, regs
No
Hammond's Flycatcher (Empidonax hammondii)
-60.0 (4%) 8.0 (33%) G5 S4B Breeding Species Not harvested
No
Cliff Swallow (Petrochelidon pyrrhonota)
-70.0 (1%) 8.0 (33%) G5 S5B Breeding Species Not harvested
No
Wood frog (Rana sylvatica)
-70.2 (0%) 8.0 (33%) G5 S5 Yearround Species Not harvested
No
Horned Grebe (Podiceps auritus)
-24.8 (56%) 6.0 (32%) G5 S4S5B, S4N Yearround Species Substantial, regs
No
Red-legged Kittiwake (Rissa brevirostris)
0.4 (91%) 5.0 (32%) G2G3 S2S3B, S2N Yearround Species Not substantial
No
McKay's Bunting (Plectrophenax hyperboreus)
2.0 (92%) 4.0 (25%) G3 S3 Yearround Species Not harvested
No

The Alaska Species Ranking System 101
Appendix IV, continued.
Taxa Biological score
Action Score
Global rank
State rank Alaska occurrence
Systematic significance
Harvest Peripheral
Song Sparrow, Aleutian (Melospiza melodia maxima)
2.0 (92%) 4.0 (25%) G5T4 S3 Yearround Subspecies Not harvested
No
Western Sandpiper (Calidris mauri)
-6.0 (84%) 4.0 (25%) G5 S5B Breeding Species Not substantial
No
Bristle-thighed Curlew (Numenius tahitiensis)
-12.0 (74%) 4.0 (25%) G2 S2B Breeding Species Not harvested
No
Root vole, Amak Island (Microtus oeconomus amakensis)
-12.0 (74%) 4.0 (25%) G5T2T3 S2S3 Yearround Subspecies Not substantial
No
Marten, Pacific (Martes americana caurina)
-12.1 (74%) 4.0 (25%) GNR S2 Yearround Subspecies Substantial, regs
Yes
Blue whale, North Pacific (Balaenoptera musculus)
-20.0 (63%) 4.0 (25%) G3G4 S2 Transient Species Not harvested
No
King Eider (Somateria spectabilis)
-25.0 (54%) 4.0 (25%) G5 S3B, S3N Yearround Species Substantial, regs
No
Laysan Albatross (Phoebastria immutabilis)
-25.0 (54%) 4.0 (25%) G3 S3N Nonbreeding Species Not substantial
No
Black Turnstone (Arenaria melanocephala)
-26.0 (52%) 4.0 (25%) G5 S3N, S4B Yearround Species Not substantial
No
Spotted seal (Phoca largha)
-27.6 (51%) 4.0 (25%) G4G5 S3S4 Yearround Species Substantial, no regs
No
Fork-tailed Storm-Petrel, plumbea (Oceanodroma furcata plumbea)
-38.0 (34%) 4.0 (25%) GNR SNR Yearround Subspecies Not harvested
No
Common Loon (Gavia immer)
-38.4 (33%) 4.0 (25%) G5 S5B, S4N Yearround Species Substantial, regs
No
Buff-breasted Sandpiper (Tryngites subruficollis)
-44.6 (24%) 4.0 (25%) G4 S2B Breeding Species Not harvested
No
Western Wood-pewee (Contopus sordidulus)
-45.0 (23%) 4.0 (25%) G5 S4B Breeding Species Not harvested
Yes
Northern Waterthrush (Seiurus noveboracensis)
-50.0 (13%) 4.0 (25%) G5 S4S5B Breeding Species Not harvested
No
Bank Swallow (Riparia riparia)
-52.0 (10%) 4.0 (25%) G5 S5B Breeding Species Not harvested
No
Pine Siskin (Carduelis pinus)
-52.0 (10%) 4.0 (25%) G5 S4S5 Yearround Species Not harvested
No
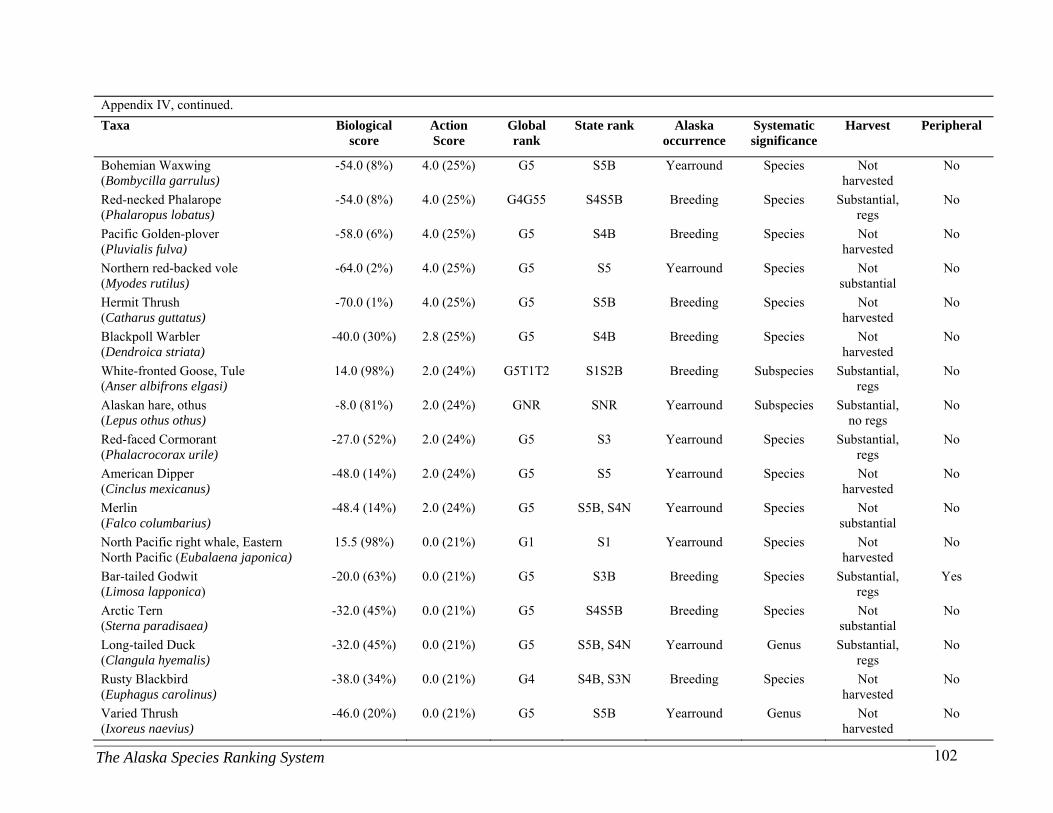
The Alaska Species Ranking System 102
Appendix IV, continued.
Taxa Biological score
Action Score
Global rank
State rank Alaska occurrence
Systematic significance
Harvest Peripheral
Bohemian Waxwing (Bombycilla garrulus)
-54.0 (8%) 4.0 (25%) G5 S5B Yearround Species Not harvested
No
Red-necked Phalarope (Phalaropus lobatus)
-54.0 (8%) 4.0 (25%) G4G55 S4S5B Breeding Species Substantial, regs
No
Pacific Golden-plover (Pluvialis fulva)
-58.0 (6%) 4.0 (25%) G5 S4B Breeding Species Not harvested
No
Northern red-backed vole (Myodes rutilus)
-64.0 (2%) 4.0 (25%) G5 S5 Yearround Species Not substantial
No
Hermit Thrush (Catharus guttatus)
-70.0 (1%) 4.0 (25%) G5 S5B Breeding Species Not harvested
No
Blackpoll Warbler (Dendroica striata)
-40.0 (30%) 2.8 (25%) G5 S4B Breeding Species Not harvested
No
White-fronted Goose, Tule (Anser albifrons elgasi)
14.0 (98%) 2.0 (24%) G5T1T2 S1S2B Breeding Subspecies Substantial, regs
No
Alaskan hare, othus (Lepus othus othus)
-8.0 (81%) 2.0 (24%) GNR SNR Yearround Subspecies Substantial, no regs
No
Red-faced Cormorant (Phalacrocorax urile)
-27.0 (52%) 2.0 (24%) G5 S3 Yearround Species Substantial, regs
No
American Dipper (Cinclus mexicanus)
-48.0 (14%) 2.0 (24%) G5 S5 Yearround Species Not harvested
No
Merlin (Falco columbarius)
-48.4 (14%) 2.0 (24%) G5 S5B, S4N Yearround Species Not substantial
No
North Pacific right whale, Eastern North Pacific (Eubalaena japonica)
15.5 (98%) 0.0 (21%) G1 S1 Yearround Species Not harvested
No
Bar-tailed Godwit (Limosa lapponica)
-20.0 (63%) 0.0 (21%) G5 S3B Breeding Species Substantial, regs
Yes
Arctic Tern (Sterna paradisaea)
-32.0 (45%) 0.0 (21%) G5 S4S5B Breeding Species Not substantial
No
Long-tailed Duck (Clangula hyemalis)
-32.0 (45%) 0.0 (21%) G5 S5B, S4N Yearround Genus Substantial, regs
No
Rusty Blackbird (Euphagus carolinus)
-38.0 (34%) 0.0 (21%) G4 S4B, S3N Breeding Species Not harvested
No
Varied Thrush (Ixoreus naevius)
-46.0 (20%) 0.0 (21%) G5 S5B Yearround Genus Not harvested
No
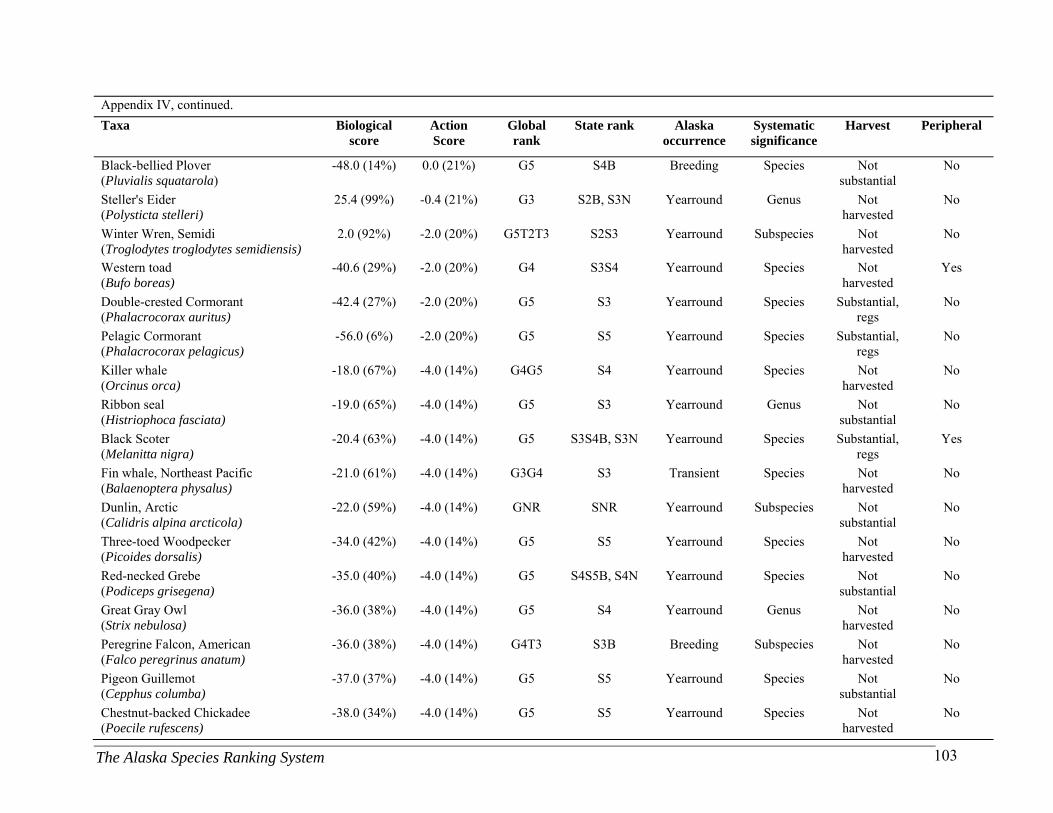
The Alaska Species Ranking System 103
Appendix IV, continued.
Taxa Biological score
Action Score
Global rank
State rank Alaska occurrence
Systematic significance
Harvest Peripheral
Black-bellied Plover (Pluvialis squatarola)
-48.0 (14%) 0.0 (21%) G5 S4B Breeding Species Not substantial
No
Steller's Eider (Polysticta stelleri)
25.4 (99%) -0.4 (21%) G3 S2B, S3N Yearround Genus Not harvested
No
Winter Wren, Semidi (Troglodytes troglodytes semidiensis)
2.0 (92%) -2.0 (20%) G5T2T3 S2S3 Yearround Subspecies Not harvested
No
Western toad (Bufo boreas)
-40.6 (29%) -2.0 (20%) G4 S3S4 Yearround Species Not harvested
Yes
Double-crested Cormorant (Phalacrocorax auritus)
-42.4 (27%) -2.0 (20%) G5 S3 Yearround Species Substantial, regs
No
Pelagic Cormorant (Phalacrocorax pelagicus)
-56.0 (6%) -2.0 (20%) G5 S5 Yearround Species Substantial, regs
No
Killer whale (Orcinus orca)
-18.0 (67%) -4.0 (14%) G4G5 S4 Yearround Species Not harvested
No
Ribbon seal (Histriophoca fasciata)
-19.0 (65%) -4.0 (14%) G5 S3 Yearround Genus Not substantial
No
Black Scoter (Melanitta nigra)
-20.4 (63%) -4.0 (14%) G5 S3S4B, S3N Yearround Species Substantial, regs
Yes
Fin whale, Northeast Pacific (Balaenoptera physalus)
-21.0 (61%) -4.0 (14%) G3G4 S3 Transient Species Not harvested
No
Dunlin, Arctic (Calidris alpina arcticola)
-22.0 (59%) -4.0 (14%) GNR SNR Yearround Subspecies Not substantial
No
Three-toed Woodpecker (Picoides dorsalis)
-34.0 (42%) -4.0 (14%) G5 S5 Yearround Species Not harvested
No
Red-necked Grebe (Podiceps grisegena)
-35.0 (40%) -4.0 (14%) G5 S4S5B, S4N Yearround Species Not substantial
No
Great Gray Owl (Strix nebulosa)
-36.0 (38%) -4.0 (14%) G5 S4 Yearround Genus Not harvested
No
Peregrine Falcon, American (Falco peregrinus anatum)
-36.0 (38%) -4.0 (14%) G4T3 S3B Breeding Subspecies Not harvested
No
Pigeon Guillemot (Cepphus columba)
-37.0 (37%) -4.0 (14%) G5 S5 Yearround Species Not substantial
No
Chestnut-backed Chickadee (Poecile rufescens)
-38.0 (34%) -4.0 (14%) G5 S5 Yearround Species Not harvested
No
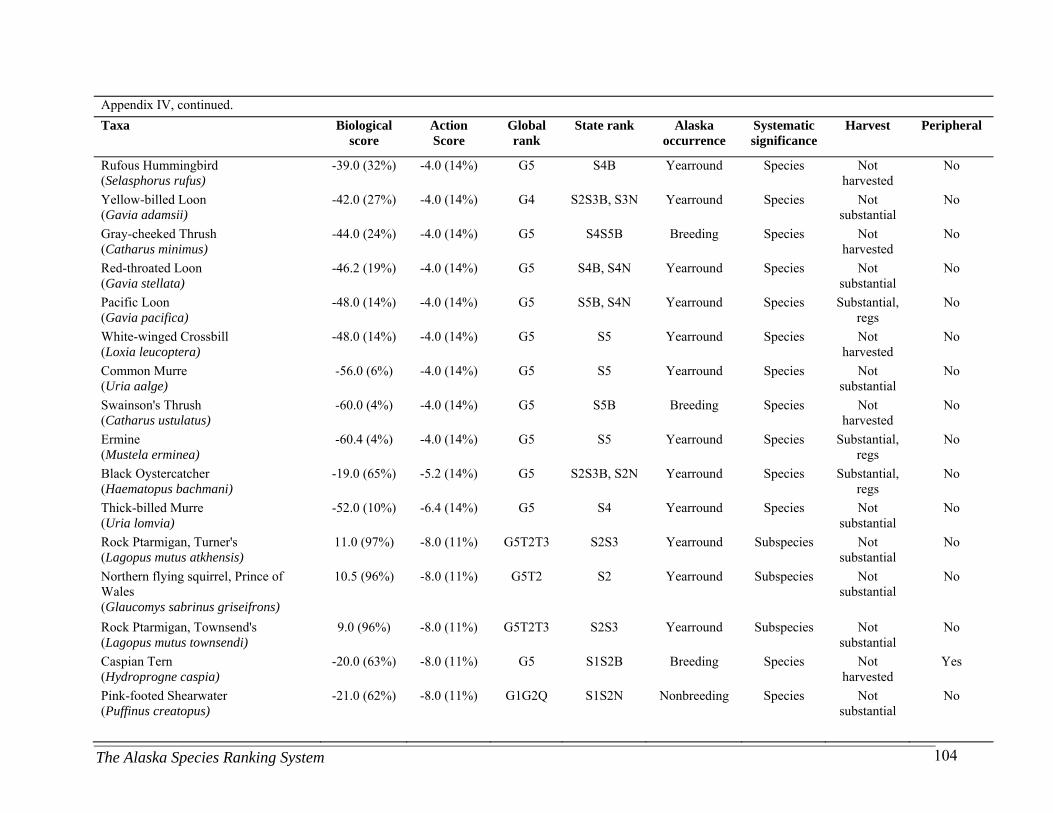
The Alaska Species Ranking System 104
Appendix IV, continued.
Taxa Biological score
Action Score
Global rank
State rank Alaska occurrence
Systematic significance
Harvest Peripheral
Rufous Hummingbird (Selasphorus rufus)
-39.0 (32%) -4.0 (14%) G5 S4B Yearround Species Not harvested
No
Yellow-billed Loon (Gavia adamsii)
-42.0 (27%) -4.0 (14%) G4 S2S3B, S3N Yearround Species Not substantial
No
Gray-cheeked Thrush (Catharus minimus)
-44.0 (24%) -4.0 (14%) G5 S4S5B Breeding Species Not harvested
No
Red-throated Loon (Gavia stellata)
-46.2 (19%) -4.0 (14%) G5 S4B, S4N Yearround Species Not substantial
No
Pacific Loon (Gavia pacifica)
-48.0 (14%) -4.0 (14%) G5 S5B, S4N Yearround Species Substantial, regs
No
White-winged Crossbill (Loxia leucoptera)
-48.0 (14%) -4.0 (14%) G5 S5 Yearround Species Not harvested
No
Common Murre (Uria aalge)
-56.0 (6%) -4.0 (14%) G5 S5 Yearround Species Not substantial
No
Swainson's Thrush (Catharus ustulatus)
-60.0 (4%) -4.0 (14%) G5 S5B Breeding Species Not harvested
No
Ermine (Mustela erminea)
-60.4 (4%) -4.0 (14%) G5 S5 Yearround Species Substantial, regs
No
Black Oystercatcher (Haematopus bachmani)
-19.0 (65%) -5.2 (14%) G5 S2S3B, S2N Yearround Species Substantial, regs
No
Thick-billed Murre (Uria lomvia)
-52.0 (10%) -6.4 (14%) G5 S4 Yearround Species Not substantial
No
Rock Ptarmigan, Turner's (Lagopus mutus atkhensis)
11.0 (97%) -8.0 (11%) G5T2T3 S2S3 Yearround Subspecies Not substantial
No
Northern flying squirrel, Prince of Wales (Glaucomys sabrinus griseifrons)
10.5 (96%) -8.0 (11%) G5T2 S2 Yearround Subspecies Not substantial
No
Rock Ptarmigan, Townsend's (Lagopus mutus townsendi)
9.0 (96%) -8.0 (11%) G5T2T3 S2S3 Yearround Subspecies Not substantial
No
Caspian Tern (Hydroprogne caspia)
-20.0 (63%) -8.0 (11%) G5 S1S2B Breeding Species Not harvested
Yes
Pink-footed Shearwater (Puffinus creatopus)
-21.0 (62%) -8.0 (11%) G1G2Q S1S2N Nonbreeding Species Not substantial
No
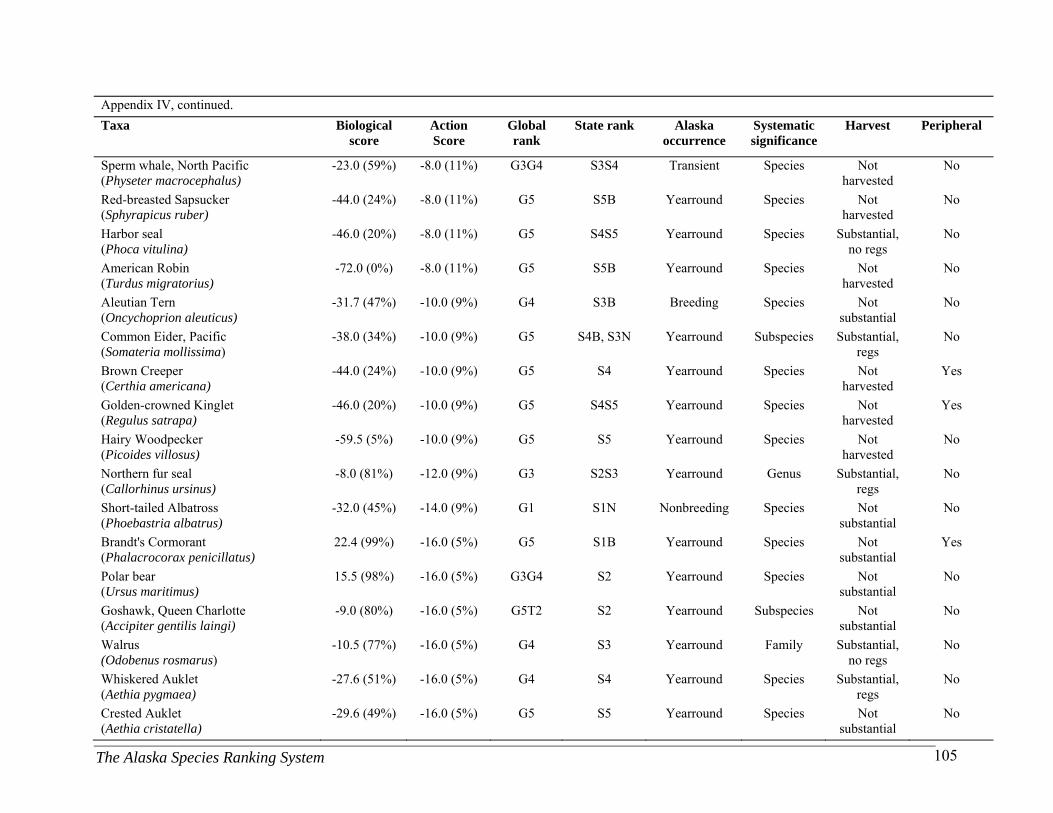
The Alaska Species Ranking System 105
Appendix IV, continued.
Taxa Biological score
Action Score
Global rank
State rank Alaska occurrence
Systematic significance
Harvest Peripheral
Sperm whale, North Pacific (Physeter macrocephalus)
-23.0 (59%) -8.0 (11%) G3G4 S3S4 Transient Species Not harvested
No
Red-breasted Sapsucker (Sphyrapicus ruber)
-44.0 (24%) -8.0 (11%) G5 S5B Yearround Species Not harvested
No
Harbor seal (Phoca vitulina)
-46.0 (20%) -8.0 (11%) G5 S4S5 Yearround Species Substantial, no regs
No
American Robin (Turdus migratorius)
-72.0 (0%) -8.0 (11%) G5 S5B Yearround Species Not harvested
No
Aleutian Tern (Oncychoprion aleuticus)
-31.7 (47%) -10.0 (9%) G4 S3B Breeding Species Not substantial
No
Common Eider, Pacific (Somateria mollissima)
-38.0 (34%) -10.0 (9%) G5 S4B, S3N Yearround Subspecies Substantial, regs
No
Brown Creeper (Certhia americana)
-44.0 (24%) -10.0 (9%) G5 S4 Yearround Species Not harvested
Yes
Golden-crowned Kinglet (Regulus satrapa)
-46.0 (20%) -10.0 (9%) G5 S4S5 Yearround Species Not harvested
Yes
Hairy Woodpecker (Picoides villosus)
-59.5 (5%) -10.0 (9%) G5 S5 Yearround Species Not harvested
No
Northern fur seal (Callorhinus ursinus)
-8.0 (81%) -12.0 (9%) G3 S2S3 Yearround Genus Substantial, regs
No
Short-tailed Albatross (Phoebastria albatrus)
-32.0 (45%) -14.0 (9%) G1 S1N Nonbreeding Species Not substantial
No
Brandt's Cormorant (Phalacrocorax penicillatus)
22.4 (99%) -16.0 (5%) G5 S1B Yearround Species Not substantial
Yes
Polar bear (Ursus maritimus)
15.5 (98%) -16.0 (5%) G3G4 S2 Yearround Species Not substantial
No
Goshawk, Queen Charlotte (Accipiter gentilis laingi)
-9.0 (80%) -16.0 (5%) G5T2 S2 Yearround Subspecies Not substantial
No
Walrus (Odobenus rosmarus)
-10.5 (77%) -16.0 (5%) G4 S3 Yearround Family Substantial, no regs
No
Whiskered Auklet (Aethia pygmaea)
-27.6 (51%) -16.0 (5%) G4 S4 Yearround Species Substantial, regs
No
Crested Auklet (Aethia cristatella)
-29.6 (49%) -16.0 (5%) G5 S5 Yearround Species Not substantial
No
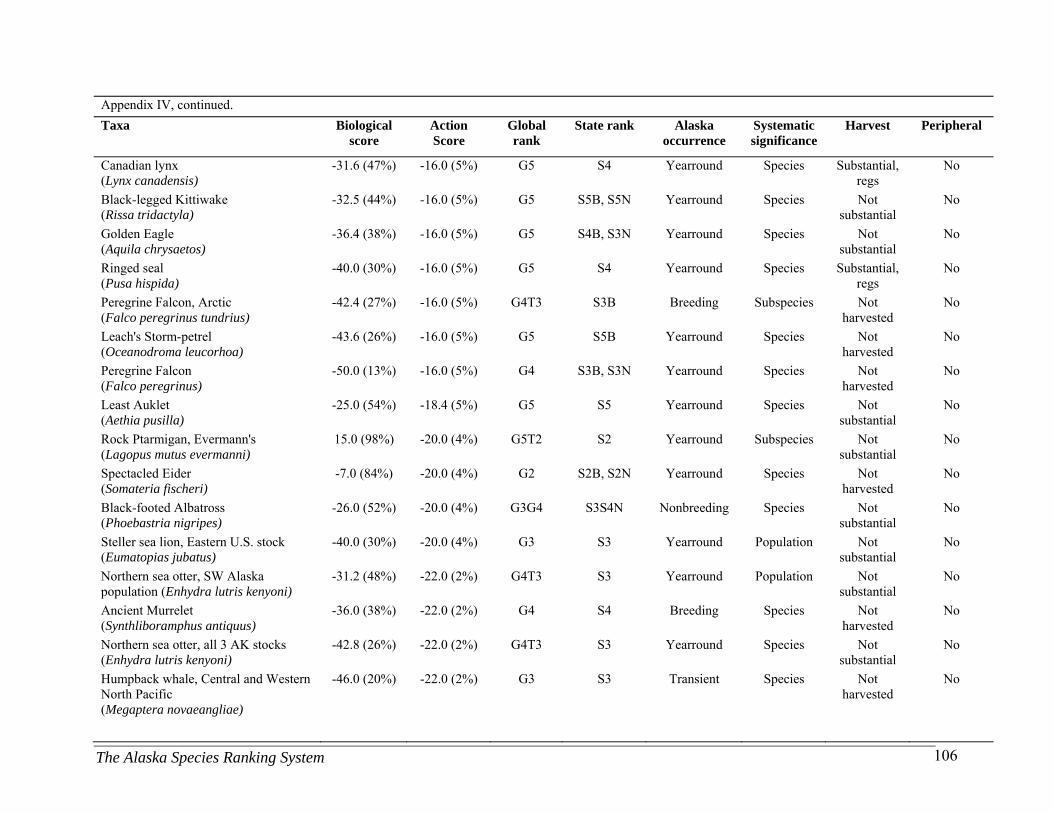
The Alaska Species Ranking System 106
Appendix IV, continued.
Taxa Biological score
Action Score
Global rank
State rank Alaska occurrence
Systematic significance
Harvest Peripheral
Canadian lynx (Lynx canadensis)
-31.6 (47%) -16.0 (5%) G5 S4 Yearround Species Substantial, regs
No
Black-legged Kittiwake (Rissa tridactyla)
-32.5 (44%) -16.0 (5%) G5 S5B, S5N Yearround Species Not substantial
No
Golden Eagle (Aquila chrysaetos)
-36.4 (38%) -16.0 (5%) G5 S4B, S3N Yearround Species Not substantial
No
Ringed seal (Pusa hispida)
-40.0 (30%) -16.0 (5%) G5 S4 Yearround Species Substantial, regs
No
Peregrine Falcon, Arctic (Falco peregrinus tundrius)
-42.4 (27%) -16.0 (5%) G4T3 S3B Breeding Subspecies Not harvested
No
Leach's Storm-petrel (Oceanodroma leucorhoa)
-43.6 (26%) -16.0 (5%) G5 S5B Yearround Species Not harvested
No
Peregrine Falcon (Falco peregrinus)
-50.0 (13%) -16.0 (5%) G4 S3B, S3N Yearround Species Not harvested
No
Least Auklet (Aethia pusilla)
-25.0 (54%) -18.4 (5%) G5 S5 Yearround Species Not substantial
No
Rock Ptarmigan, Evermann's (Lagopus mutus evermanni)
15.0 (98%) -20.0 (4%) G5T2 S2 Yearround Subspecies Not substantial
No
Spectacled Eider (Somateria fischeri)
-7.0 (84%) -20.0 (4%) G2 S2B, S2N Yearround Species Not harvested
No
Black-footed Albatross (Phoebastria nigripes)
-26.0 (52%) -20.0 (4%) G3G4 S3S4N Nonbreeding Species Not substantial
No
Steller sea lion, Eastern U.S. stock (Eumatopias jubatus)
-40.0 (30%) -20.0 (4%) G3 S3 Yearround Population Not substantial
No
Northern sea otter, SW Alaska population (Enhydra lutris kenyoni)
-31.2 (48%) -22.0 (2%) G4T3 S3 Yearround Population Not substantial
No
Ancient Murrelet (Synthliboramphus antiquus)
-36.0 (38%) -22.0 (2%) G4 S4 Breeding Species Not harvested
No
Northern sea otter, all 3 AK stocks (Enhydra lutris kenyoni)
-42.8 (26%) -22.0 (2%) G4T3 S3 Yearround Species Not substantial
No
Humpback whale, Central and Western North Pacific (Megaptera novaeangliae)
-46.0 (20%) -22.0 (2%) G3 S3 Transient Species Not harvested
No

The Alaska Species Ranking System 107
Appendix IV, continued.
Taxa Biological score
Action Score
Global rank
State rank Alaska occurrence
Systematic significance
Harvest Peripheral
Brown bear, Kenai population (Ursus arctos kenai)
26.0 (99%) -26.0 (2%) GNR SNR Yearround Population Substantial, regs
No
Bowhead, Western Arctic (Balaena mysticetus)
-9.0 (80%) -28.0 (1%) G4 S3 Yearround Species Not harvested
No
Fork-tailed Storm-Petrel, furcata (Oceanodroma furcata furcata)
-22.0 (59%) -28.0 (1%) GNR SNR Yearround Subspecies Not harvested
No
Steller sea lion, Western U.S. stock (Eumatopias jubatus)
-24.0 (56%) -28.0 (1%) G3 S2 Yearround Population Not substantial
No
Bald Eagle (Haliaeetus leucocephalus)
-28.3 (50%) -28.0 (1%) G5 S5 Yearround Species Not harvested
No
Cackling Goose, Aleutian (Branta hutchinsii leucopareia)
12.4 (97%) -32.0 (1%) G3 S3B Breeding Subspecies Not substantial
No
Beluga whale, Cook Inlet population (Delphinapterus leucas)
42.0 (100%) -40.0 (0%) G4 S4 Yearround Population Not substantial
No
Woodland caribou, Chisana herd (Rangifer tarandus caribou)
-2.0 (89%) -40.0 (0%) SNR Yearround Population Not harvested
No
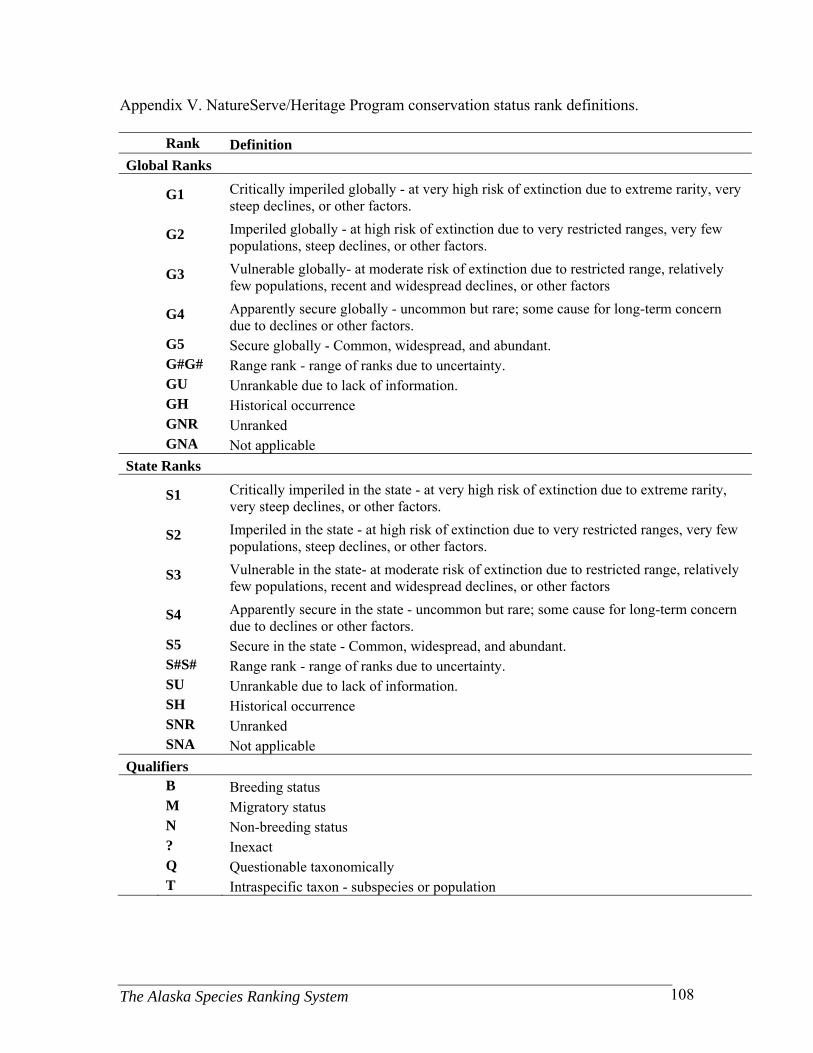
The Alaska Species Ranking System 108
Appendix V. NatureServe/Heritage Program conservation status rank definitions. Rank Definition
Global Ranks
G1 Critically imperiled globally - at very high risk of extinction due to extreme rarity, very
steep declines, or other factors.
G2 Imperiled globally - at high risk of extinction due to very restricted ranges, very few
populations, steep declines, or other factors.
G3 Vulnerable globally- at moderate risk of extinction due to restricted range, relatively
few populations, recent and widespread declines, or other factors
G4 Apparently secure globally - uncommon but rare; some cause for long-term concern
due to declines or other factors. G5 Secure globally - Common, widespread, and abundant. G#G# Range rank - range of ranks due to uncertainty. GU Unrankable due to lack of information. GH Historical occurrence GNR Unranked GNA Not applicable
State Ranks
S1 Critically imperiled in the state - at very high risk of extinction due to extreme rarity,
very steep declines, or other factors.
S2 Imperiled in the state - at high risk of extinction due to very restricted ranges, very few
populations, steep declines, or other factors.
S3 Vulnerable in the state- at moderate risk of extinction due to restricted range, relatively
few populations, recent and widespread declines, or other factors
S4 Apparently secure in the state - uncommon but rare; some cause for long-term concern
due to declines or other factors. S5 Secure in the state - Common, widespread, and abundant. S#S# Range rank - range of ranks due to uncertainty. SU Unrankable due to lack of information. SH Historical occurrence SNR Unranked SNA Not applicable
Qualifiers
B Breeding status M Migratory status N Non-breeding status ? Inexact Q Questionable taxonomically T Intraspecific taxon - subspecies or population