Embed Size (px)
Citation preview
arX
iv:p
hysi
cs/0
6120
63v1
[ph
ysic
s.op
tics]
6 D
ec 2
006
Ultrashort filaments of light in weakly-ionized, optically-transparent media
L. Berge,∗ S. Skupin, and R. Nuter
Departement de Physique Theorique et Appliquee, CEA-DAM/Ile de France, B.P. 12, 91680 Bruyeres-le-Chatel,France
J. Kasparian
Laboratoire de Spectroscopie Ionique et Moleculaire, Universite Claude Bernard Lyon 1, 43 bd du 11 Novembre,69622 Villeurbanne Cedex, France
J.-P. Wolf
GAP-Biophotonics, Universite de Geneve, 20 Rue de l’Ecole de Medecine, 1211 Geneve 4, Switzerland
(Dated: February 9, 2008)
Modern laser sources nowadays deliver ultrashort light pulses reaching few cycles in duration, highenergies beyond the Joule level and peak powers exceeding several terawatt (TW). When suchpulses propagate through optically-transparent media, they first self-focus in space and grow inintensity, until they generate a tenuous plasma by photo-ionization. For free electron densities andbeam intensities below their breakdown limits, these pulses evolve as self-guided objects, result-ing from successive equilibria between the Kerr focusing process, the chromatic dispersion of themedium, and the defocusing action of the electron plasma. Discovered one decade ago, this self-channeling mechanism reveals a new physics, widely extending the frontiers of nonlinear optics.Implications include long-distance propagation of TW beams in the atmosphere, supercontinuumemission, pulse shortening as well as high-order harmonic generation. This review presents thelandmarks of the 10-odd-year progress in this field. Particular emphasis is laid to the theoreticalmodeling of the propagation equations, whose physical ingredients are discussed from numericalsimulations. The dynamics of single filaments created over laboratory scales in various materialssuch as noble gases, liquids and dielectrics reveal new perspectives in pulse shortening techniques.Differences between femtosecond pulses propagating in gaseous or condensed materials are un-derlined. Attention is also paid to the multifilamentation instability of broad, powerful beams,breaking up the energy distribution into small-scale cells along the optical path. The robustnessof the resulting filaments in adverse weathers, their large conical emission exploited for multipol-lutant remote sensing, nonlinear spectroscopy, and the possibility to guide electric discharges inair are finally addressed on the basis of experimental results.
PACS numbers: 42.65.Tg, 42.65.-k,52.38.Hb,42.68.Ay
Contents
I. Introduction 2
II. Propagation equations 3
A. Helmoltz equation 3
1. From vectorial to scalar description 4
2. Weak backscattering 4
3. Unidirectional pulse propagation 4
4. Envelope description 5
B. Nonlinear optical responses 6
C. Plasma generation for singly-charged ionization 7
III. Optical Ultrashort filaments: A few tools for
their analytical description 10
A. Kerr focusing and wave collapse 10
1. Principles of wave self-focusing 11
2. Variational approaches 12
B. Saturation by temporal dispersion 13
C. Saturation by plasma defocusing 14
D. Saturation by optical nonlinearities 15
∗Electronic address: [email protected]
E. Self-phase modulation and supercontinuumgeneration 16
F. Modulational instabilities: The route to multiplefilamentation 17
IV. Universal features of femtosecond filamentation 19A. Radial self-focusing and temporal splittings 19B. Robustness and multifilamentation 21C. White light generation and Conical emission 23D. Role of the laser wavelength 24
V. Ultrashort filaments in gases 26A. Novel perspectives for pulse shortening 26B. High-order harmonic generation 28
VI. Ultrashort filaments in dense media 29A. Pulse propagation in dielectrics and damages 29B. Pulse propagation in liquids and applications 30
VII. Filaments in the atmosphere: Conveying intense
structures over kilometers 32A. Long-distance propagation and white-light
supercontinuum 321. Temporal chirping and spatial lensing 322. Plasma and optical field measurements 333. Multifilamentation 344. White-light generation 36
2
B. Remote sensing (LIDAR) applications 371. Principle of LIDAR: Towards ”Femtolidars” 372. Remote filament-induced breakdown
spectroscopy 38C. Towards a laser lightning rod 39
VIII. Outlook 40
Acknowledgments 40
A. Ionization rates for atoms and molecules 411. Ionization in gases 41
a. The Keldysh theory 41b. The PPT theory 42c. The ADK molecular theory 42
2. Ionization in dense media 43
B. Atomic dipole for High-Harmonic Generation 43
C. The Teramobile laser 44
References 45
I. INTRODUCTION
Over the past two decades, ultrafast laser sources pro-ducing ultrashort pulses have come of age. Technologicaladvances in this field have permitted the generation oflight wave packets comprising only a few oscillation cy-cles of the electric field. In space, the extent of the pulsesbecomes focusable to a spot size comparable to the laserwavelength. In time, mode-locking and chirped-pulseamplification (CPA) technologies allow to access smallerand smaller durations and optical intensities locally ex-ceeding hundreds of terawatt (TW) per cm2 at moderate(sub-mJ) energies. Power levels nowadays approach thepetawatt range with femtosecond pulse durations (1 fs= 10−15 sec.). Ultrashort light pulses enable researchersto probe ultrafast relaxation processes on never-before-accessed time scales and study light-matter interactionsat unprecedented intensity levels. Due to extreme tem-poral and spatial confinements, the pulse strength ex-ceeds that of the Coulomb field which binds electronsat their nucleus. It becomes strong enough to overcomethe Coulomb barrier and triggers optical-field ionization.Pushed to ultrahigh intensities > 1018 cm2, the availabil-ity of CPA lasers has extended the horizon of laser physicsfrom atomic and optics studies to relativistic plasmas,nuclear and high-energy physics (Mourou et al., 2006).
Before reaching such extreme intensities, progress inultrashort laser systems has led to the ability to ob-serve tunnel or multiphoton ionization in several spectralranges, before the ionization process reaches saturation.In this regime, an intriguing phenomenon was discoveredby Braun et al. (Braun et al., 1995) in the middle of thenineties. By launching infrared pulses with femtoseconddurations and gigawatt (GW) powers in the atmosphere,the beam became confined to a long-living, self-confinedtube of light capable of covering several tens of meters,i.e., many linear diffraction lengths, along the propaga-tion axis. The mechanism supporting this ”light bullet”
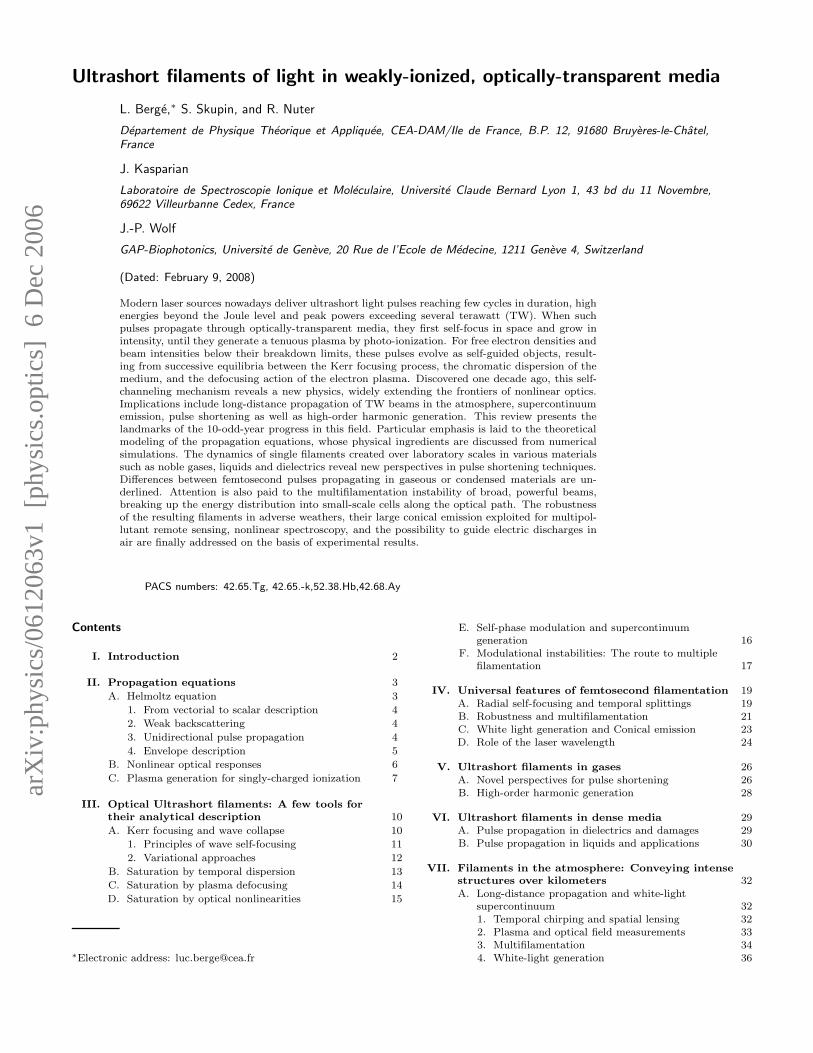
FIG. 1 Principle of producing femtosecond filaments in air atthe laser wavelength of 800 nm. Photograph at the right-handside shows a transverse cut of the filament profile.
results from the balance between Kerr focusing, whichincreases the local optical index with the wave intensity,and self-induced ionization. When an ultrashort pulseself-focuses and couples with a self-induced plasma chan-nel, its spatial profile exhibits a narrow extent along theoptical path. Spectra broaden due to self-phase modu-lation (SPM), which is sustained by the mechanism ofhigh-intensity clamping. This picture classically refersto what is commonly called a ”femtosecond filament”.In the diffraction plane, this filament is characterized bya white-light spot, surrounded by concentric ”rainbows”with colors ranging from red to green. The high nonlin-earities competing through the filamentation process pro-duce an impressive supercontinuum leading to white-lightemission. They also affect the beam divergence throughan apparent conical emission, as illustrated in Fig. 1
Femtosecond filaments have, for the last decade,opened the route to a fascinating physics. Their highlynonlinear dynamics sparked broad interest, first becauseof the capability of femtosecond pulses to convey highintensities over spectacular distances, second because ofthe white light emitted by the filaments transforming in-frared lasers into ”white-light lasers” (Chin et al., 1999b;Kasparian et al., 2003). For appropriate beam configu-rations, long fs filaments can be created not only in theatmosphere, but also in noble gases, liquids and dielec-tric solids, as long as the pulse intensity does not reachthe limit of optical breakdown, which implies the electronplasma density to remain at subdense levels. These opti-cal structures are subject to strong modifications of theirtemporal profile, triggered by SPM together with the ion-ization front and the chromatic dispersion of the medium.The dynamical balance between nonlinear focusing andionization can result in a drastic shortening of the pulseduration, down to the optical cycle limit. This prop-erty opens quite promising ways to generically deliverlight with durations of a few fs only, which should fur-ther impact the fields of high-order harmonic generationand sub-fs pulse production. Besides, femtosecond pulseswith broad spatial extents create several filaments, whosemutual interactions support the self-guiding of the beamenvelope and can preserve a confined state upon severalkilometers. This recently led to develop ultrashort LIghtDetection And Ranging (Lidar) facilities, that exploit thewhite light emitted by these filaments, in order to detectand identify several pollutants within a single laser shot.
Many applications have been inspired by this ultra-fast ”light bullet”, which justifies the present review.Before commenting on these, an accurate understand-
3
ing of the filamentation phenomenon requires a rigorousderivation of the propagation equations together with ba-sic tools for capturing the underlying physics. For thispurpose, Section II addresses the model describing thelong range propagation of ultrashort laser pulses in anyoptically-transparent medium. Section III reviews thebasic phenomenon of wave self-focusing and its limita-tion by potential players such as plasma generation, chro-matic dispersion and optical nonlinearities. Emphasis isgiven to semi-analytic (e.g., variational) methods provid-ing qualitative information about these effects. SectionIV lists the major phenomena driving femtosecond fila-ments, whatever the propagation medium may be. Sec-tion V is devoted to pulse shortening that can be achievedby letting femtosecond pulses ionize atom gases at ap-propriate pressures and to high-order harmonic genera-tion. Section VI addresses different propagation regimesin condensed materials (water, silica glasses), from thelaser-induced breakdown limit to X-shaped nonlinearwaves self-guided with no plasma generation. SectionVII concentrates on the atmospheric applications of thewhite-light supercontinuum emitted by ultrashort fila-ments. Current techniques for changing their onset dis-tance and self-channeling length are discussed, togetherwith the diagnostics used for plasma and optical-fieldmeasurements. Attention is paid to novel ultrashortLIDAR-based setups and their use in remotely analyzingaerosols, biological agents, dense targets through remotefilament-induced breakdown spectroscopy. Their abilityto trigger and guide electric discharges over several me-ters is also discussed. Section VIII finally summarizesthe principal aspects of this review and presents futureprospects.
II. PROPAGATION EQUATIONS
To start with, we derive the model describing the prop-agation of ultrashort optical pulses in transparent me-dia. Using conventional description of nonlinear optics,straightforward combination of the Maxwell’s equationsyields (Agrawal, 2001; He and Liu, 1999; Shen, 1984)
∇2 ~E − ~∇(~∇ · ~E) − c−2∂2t~E = µ0(∂
2t~P + ∂t ~J), (1a)
~∇ · ~E = (ρ− ~∇ · ~P )/ǫ0, (1b)
where ǫ0, µ0 and c denote the electric permittivity, mag-netic permeability and the speed of light in vacuum, re-
spectively. The optical electric field ~E, the polarization
vector ~P , the carrier density ρ and the current density~J are real valued. For further convenience, we intro-duce standard Fourier transforms applied to the fields
( ~E, ~P , ~J)† as
( ~E, ~P , ~J)†(~r, ω) ≡ 1
2π
∫( ~E, ~P , ~J)†(~r, t)eiωtdt. (2)
The current density ~J describes the motions of the freeelectrons created by ionization of the ambient atoms,
for which ion dynamics is discarded. The polarization
vector ~P describes the bounded electron response drivenby the laser radiation. It is usually decomposed into a
linear part ~PL ≡ ~P (1) related to the first-order suscep-
tibility tensor↔χ(1) and a nonlinear one ~PNL satisfying
|~P (1)| ≫ |~PNL|. For isotropic, homogeneous, non magne-tizable media and spectral ranges far from any material
resonance, ~P can be expressed as a power series in ~E:
~P = ~P (1)(~r, ω) + ~P (3)(~r, ω) + ~P (5)(~r, ω) + . . . (3)
with scalar components
P (j)µ = ǫ0
∑
α1...αj
∫...
∫χ(j)µα1...αj
(−ωσ;ω1, . . . , ωj)
× Eα1(~r, ω1) . . . Eαj(~r, ωj)δ(ω − ωσ)dω1 . . . dωj ,
(4)
where ωσ = ω1 + . . .+ωj . All susceptibility tensors↔χ(j)
with even index j vanish due to inversion symmetry. Thesubscript µ indicates the field vector component in Carte-sian coordinates and the indices αj have to be summed
up over x, y, and z. The tensor↔χ (1) is diagonal with
χ(1)µα = χ(1)δµα, so that
~P (1)(~r, ω) = ǫ0χ(1)(ω) ~E(~r, ω), (5)
and the scalar dielectric function, defined by
ǫ(ω) = 1 + χ(1)(ω), (6)
enters the wave number of the electromagnetic fieldk(ω) =
√ǫ(ω)ω/c. Since χ(1) is complex-valued, the
dielectric function ǫ(ω) contains every information notonly about the material dispersion, but also about thelinear losses given by the imaginary part of χ(1)(ω).When losses are negligible, ǫ(ω) is real and reduces toǫ(ω) = n2(ω), where n(ω) here denotes the linear re-fractive index of the medium, which can be described incertain frequency ranges (far from resonances) by, e.g.,a Sellmeier formula. By convention, n0 ≡ n(ω0) for thecentral frequency ω0 = 2πc/λ0 of a laser operating at thewavelength λ0 and k0 ≡ k(ω0). Without any specifica-tion, ω = 2πc/λ, w⊥ = 2π/k⊥ is the waist of the opticalwave packet in the plane (x, y) and k⊥ is the correspond-ing extent in the transverse Fourier space.
A. Helmoltz equation
By taking its Fourier transform, Eqs. (1a) expresses asthe Helmoltz equation
[∂2z + k2(ω) + ∇2
⊥]~E = −µ0ω
2 ~FNL + ~∇(~∇ · ~E), (7a)
~∇ · ~E = (ǫ0ǫ)−1(ρ− ~∇ · ~PNL), (7b)
4
where ∇2⊥ ≡ ∂2
x+∂2y stands for transverse diffraction and
~FNL ≡ ~PNL + i ~J/ω ≡ F ⊗ ~E, (8)
gathers all nonlinear contributions through the function
F that depends on ~E and can be viewed as the effec-tive nonlinear refractive index change of the medium (⊗is the convolution operator). Because Eqs. (7) are usu-ally difficult to integrate in the full space-time domain,assumptions are requested to simplify them into moretractable form. The most fundamental of those consistsin supposing that the wavefield keeps a transverse exten-sion always fulfilling
k2⊥/k
2(ω) ≪ 1, (9)
i.e., for k(ω) located around ω0, the transverse waist ofthe beam has dimensions larger than the central wave-length. The second one assumes small nonlinearities, i.e.,
F
ǫ0ǫ(ω)≪ 1. (10)
1. From vectorial to scalar description
The previous conditions make vectorial effects negli-gible for, e.g, a transversally-polarized light field E⊥ =(Ex, Ey). Indeed, Eqs. (7) can be combined, with the
help of the continuity equation ∂tρ+ ~∇· ~J = 0 expressedin Fourier variable, into the form
[∂2z + k2(ω) + ∇2
⊥]~E = −µ0ω
2
~FNL +~∇(~∇ · ~FNL)
k2(ω)
,
(11)whose last term scrambles nonlinear vectorial compo-
nents. When we project the vectors ~E = ( ~E⊥, Ez)†,~PNL = (~P⊥
NL, PzNL)†, ~J = ( ~J⊥, Jz)†, ~∇ = (~∇⊥, ∂z)†
onto the transverse and longitudinal axis with unit vec-
tors ~e⊥ and ~ez, respectively, Ez is found to scale asO(k⊥/k). This follows from a direct Fourier trans-form of Eq. (7b) for weak nonlinearities [Eq. (10)].Expressed in Fourier space, the nonlinear coupling oftransverse/longitudinal components described by thescrambling term behave as O(k2
⊥/k2) (Fibich and Ilan,
2001a,b; Milsted Jr. and Cantrell, 1996). So, these ef-fects become important in the limit k⊥ → k(ω) only.Reversely, if we postpone to further demonstrations thatnonlinear compression processes are stopped before k⊥becomes comparable with k (by, e.g., chromatic dis-persion or plasma generation), the last term in theright-hand side (RHS) of (11) is close to zero, implyingthereby Ez ≃ 0. The field remains transversally polar-ized along the propagation axis, making the influence of~∇(~∇· ~FNL)/k2 negligible. Hence, as long as the nonlinearpolarization and current density preserve the conditions(9) and (10), vectorial effects can be ignored for purely
optical or weakly-ionized materials as well. This prop-erty justifies the use of a scalar description for linearly-polarized beams having, e.g., Ey = 0.
2. Weak backscattering
The question of evaluating backscattering waves maybe crucial in several areas, such as remote sensing exper-iments (Kasparian et al., 2003; Yu et al., 2001), whichspectrally analyze the photons returning towards thelaser source. The amount of backscattered photons, how-ever, constitutes a weak percentage of those travelingin the forward direction through a transparent medium.The reason can be seen from the scalar version of Eq.(11) expressed as
D+(ω)D−(ω)E = −∇2⊥E − µ0ω
2F ⊗ E, (12)
where D±(ω) ≡ ∂z ∓ ik(ω). By substituting the solution
E = U+eik(ω)z + U−e−ik(ω)z , Eq. (12) expands as
e2ik(ω)z [∂2z + 2ik(ω)∂z + ∇2
⊥ + µ0ω2F ]U+
+[∂2z − 2ik(ω)∂z + ∇2
⊥ + µ0ω2F ]U− = 0.
(13)
Here, U+ and U− represent the Fourier components ofthe forward and backward running fields, for which wea priori assume |∂zU±| ≪ |k(ω)U±| and U+ ≫ U−. For
technical convenience, we assume F = F δ(ω). FollowingFibich et al. (Fibich et al., 2002), we can integrate Eq.(13) over the interval z − π/2k ≤ z ≤ z + π/2k (one fast
oscillation) and Taylorize U±(z) to evaluate
2ik(ω)∂zU− ∼ −e2ik(ω)z
2ik(ω)∂z[∇2
⊥ + µ0ω2F ]U+. (14)
Since ∇2⊥ ∼ −k2
⊥ in Fourier space, the backscatteredcomponent has a weak influence on the beam dynamicsif k2
⊥ ≪ k2(ω) and as long as the longitudinal variationsof the nonlinearities remain small.
3. Unidirectional pulse propagation
The limit (9) moreover implies that the wave compo-nents forming the angle θ = arcsin (k⊥/k) between thetransverse and longitudinal directions mostly propagateforwards since θ ≪ π/2 (Feit and Fleck, 1988). Becausethe propagation physics is mainly brought by the for-
ward component, one has U− → 0 and E ≃ U+eik(ω)z .With the above approximations, the operator D−(ω) forbackscattering mainly applies to the most rapid varia-tions of the field, expected to be driven by the complex
exponential, i.e., D−(ω)E ≈ 2ik(ω)E. The so-called Uni-directional Pulse Propagation Equation (UPPE)
∂zE =i
2k(ω)∇2
⊥E + ik(ω)E +iµ0ω
2
2k(ω)FNL (15)
5
then naturally emerges from Eq. (12). Validityof this model explicitly requires that the second-order derivative in z of the envelope function
U+ must be small compared with |k(ω)∂zU+|,since D+(ω)D−(ω)E = eik(ω)z [∂2
z + 2ik(ω)∂z]U+
(Geissler et al., 1999; Husakou and Herrmann,2001). This approximation, usually expressed as
|∂zU+| ≪ |k(ω)U+|, refers to the ”paraxiality” as-sumption. It holds if the field envelope U+ does notsignificantly change over propagation distances of theorder of λ, for all wavelengths under consideration.Paraxiality is again linked to the weakness of both theratio k⊥/k and the nonlinearities. Let us indeed assumethe nonlinear function F clamped at a maximal constantlevel, Fmax. The forward component of Eq. (13) thengoes like
U+ ∼ eik(ω)z[
r
1− k2⊥
k2(ω)+
µ0ω2
k2(ω)Fmax−1]
. (16)
It is seen right away that this solution fits that of theparaxial model discarding second derivatives in z, i.e.,
U+ ∼ e−i(k2⊥−µ0ω
2Fmax)z/2k(ω), as long as the two con-straints (9) and (10) apply.
Recently, Kolesik et al. (Kolesik and Moloney, 2004a;Kolesik et al., 2002) proposed an UPPE model basedon the exact linear modes of the Helmoltz equation.
The key idea is to preserve the linear solutions, Elin =
e±i√k2(ω)+∇2
⊥z, as long as possible along the manipula-
tion of Eq. (7a). Rewriting Eq. (12) as
D⊥+(ω)D⊥
−(ω)E = −µ0ω2FNL, (17)
with D⊥±(ω) ≡ (∂z ∓ i
√k2(ω) + ∇2
⊥), we may retain
the forward running component E = U+ei√k2(ω)+∇2
⊥z
constrained to the ”paraxial” limit D⊥−(ω)E ≈
2i√k2(ω) + ∇2
⊥E. Repeating the previous procedureimmediately yields
∂zE = i√k2(ω) + ∇2
⊥E +iµ0ω
2FNL
2√k2(ω) + ∇2
⊥. (18)
Eq. (18) allows to formally describe DC-field components(ω = 0), whereas Eq. (15) is limited to non-zero fre-quencies strictly. Despite these minor differences, UPPEmodels (15) and (18) become quite analogous when thecondition k2
⊥/k2 ≪ 1 applies. The major advantage of
the UPPE models is to elude the formal use of a cen-tral optical frequency and correctly describe the completespectrum of pulses in nonlinear regimes, even when theydevelop very large bandwidths.
For practical use, it is convenient to introduce the com-plex version of the electric field
E =√c1(E + E∗), E =
1√c1
∫Θ(ω)Ee−iωtdω, (19)
where c1 ≡ ω0µ0/2k0 and Θ(x) denotes the Heaviside
function. Because E satisfies E∗(ω) = E(−ω)∗ (∗ means
complex conjugate), it is then sufficient to treat theUPPE model (15) in the frequency domain ω > 0 only.The field intensity can be defined by E2 averaged overan optical period at least, for a given central frequencyω0. This quantity usually follows from the modulus ofthe time averaged Poynting vector. It is expressed inW/cm2 and with the above normalization factor c1 it issimply given by the classical relation I = |E|2.
4. Envelope description
When a central frequency ω0 is imposed, Eq. (15) resti-tutes the Nonlinear Envelope Equation (NEE), earlier de-rived by Brabec and Krausz (Brabec and Krausz, 1997).We can make use of the Taylor expansion
k(ω) = k0 + k′ω + D, D ≡+∞∑
n≥2
k(n)
n!ωn, (20)
where ω = ω − ω0, k′ = ∂k/∂ω|ω=ω0 and k(n) =∂nk/∂ωn|ω=ω0 and develop Eq. (15) as
∂zE =
∫ [i∇2
⊥2k(ω)
+ i(k0 + k′ω + D)
]
× E(ω)e−iωtdω + iµ0
2
∫ω2
k(ω)FNL(ω)e−iωtdω.
(21)
We apply the property following which E(ω) is theFourier transform of E(t)eiω0t in ω, so that ω correspondsto i∂t by inverse Fourier transform. Terms with k(ω) intheir denominator are expanded up to first order in ωonly. Furthermore, we introduce the complex-field rep-resentation
E = Ueik0z−iω0t, (22)
involving the novel envelope function U . Next, the newtime variable t → t − z/vg can be utilized to replacethe pulse into the frame moving with the group velocityvg = k′−1. Eq. (21) then restores the NEE model
(i∂z + D)U ≃ −T−1
2k0(∇2
⊥U) − µ0ω20
2k0√c1TFenv
NL (U), (23)
where
D ≡+∞∑
n≥2
(k(n)/n!)(i∂t)n, T = (1 +
i
ω0∂t), (24)
whenever |k0 − ω0k′|/k0 ≪ 1. This condition is met if
the difference between group and phase velocity relativeto the latter is small, which is fulfilled in a wide rangeof propagation phenomena. The operator T−1 intro-duces space-time focusing in front of the diffraction term[T−1(∇2
⊥U)]. On the other hand, nonlinearities with the
6
envelope function FenvNL (U) are also affected by the op-
erator T , which refers to self-steepening. For dispersionrelations truncated at some finite orders n < +∞, theNEE model applies to optical fields with sufficiently nar-row spectral bandwidths. With full chromatic dispersion,it holds for describing light pulses down to the single cy-cle.
B. Nonlinear optical responses
We henceforth assume a linearly polarized field (along,e.g., ~ex) and treat nonlinear effects within a scalar de-scription. For centro-symmetric materials, only one rel-evant component of the tensor remains in the cubic con-
tribution P (3), e.g., χ(3) = χ(3)xxxx (Agrawal, 2001). For
simplicity, we may first consider χ(3) as keeping a con-stant value for a spectral domain centered around ω0. Eq.
(4) then simplifies with a single component, noted χ(3)ω0 ,
and in time domain one finds P (3)(~r, t) = ǫ0χ(3)ω0 E
3. Thisexpression holds whenever we suppose an instantaneousresponse of the medium, which ignores the contributionof molecular vibrations and rotations to χ(3). Strictlyspeaking, however, the phenomenon of Raman scatter-ing comes into play when the laser field interacts withanisotropic molecules. This interaction can be schema-tized by a three-level system built from the rotationalstates of a molecule. The molecular scatterer has tworotational eigenstates, the ground state (level 1) with en-ergy ~Ω1 and an excited one (level 2) with energy ~Ω2
where ~ = 1.06×10⁻³⁴ Js and Ωm denotes the frequencyof the state m = 1, 2, 3. Far above lies an electronic(or translational) state with energy ~Ω3 ≫ ~Ω2 − ~Ω1.This molecule interacts with the laser field whose pho-ton frequency ω0 fulfills Ω13,Ω23 ≫ ω0 ≫ Ω21, [Ωnm ≡Ωn − Ωm], such that state |3〉 cannot be populated. Be-cause of the definite parity of these molecular states, thedipole matrix element µ12 associated with the transition|1〉 → |2〉 via a single photon is null, so that the rotationalstate |2〉 can only be excited via transition through a vir-tual state |3〉 [µ13 ≃ µ23 ≡ µ 6= 0]. Following this path, aStokes photon with energy ~ωs = ~ω0 − ~Ω21 is emittedand the corresponding polarization vector involves thedensity matrix element associated with the states |1〉 and|2〉 as PRaman = χ(1)[ρ12e
iωRt + c.c.]E. Here, ωR = Ω21
is the fundamental rotational frequency and ρ12 is foundto satisfy (Penano et al., 2003)
∂tρ12 ≃ −ρ12
τ2− i
µ2E2
~2Ω31e−it/τ1 , (25)
where τ1 = 1/ωR and τ2 is the dipole dephasing time.Eq. (25) provides the Raman response
PRaman =2χ(1)µ2
Ω31~2E
∫ t
−∞e−
t−t′
τ2 sin(t− t′
τ1)E2(t′)dt′,
(26)which originates from nonresonant, nonlinear couplings.
Expressed in terms of the rescaled complex fieldE [Eq. (19)] and with appropriate normalizations(Sprangle et al., 2002), it completes the cubic polariza-tion as
P (3) = 2n0n2ǫ0√c1
∫ +∞
−∞R(t− t′)|E(t′)|2dt′E
+ 2n0n2ǫ0√c1(1 − xK)E3/3 + c.c.,
(27a)
R(t) = (1 − xK)δ(t) + xKΘ(t)h(t), (27b)
h(t) =2
3
τ21 + τ2
2
τ1τ22
e−t/τ2 sin(t/τ1), (27c)
with the definition of the nonlinear refractive indexn2 = 3χ
(3)ω0 /(4n
20cǫ0). Here, contributions in O(E3) are
retained to further describe third-harmonic generation.Expression (27a) possesses both retarded and instanta-neous components in the ratio xK . The instantaneouspart ∼ δ(t) describes the response from the bound elec-trons upon a few femtoseconds or less. The retardedpart ∼ h(t) accounts for nuclear responses, namely, theRaman contribution, in which fast oscillations in E2 givenegligible contributions, as τ1 and τ2 currently far exceedthe optical period ∼ ω−1
0 .The fraction of delayed Kerr depends on the molec-
ular species under consideration. For air at 800 nm,Sprangle (Sprangle et al., 2002) suggests τ1 ≃ 62 fs,τ2 ≃ 77 fs and xK = 1/2. This choice is consistent withthat proposed in experimental papers (Nibbering et al.,1997; Ripoche et al., 1997). When τ1 ∼ τ2, the func-tion h(t) ≃ (1/τ1)e
−t/τ1 can also be used in the ratioxK = 1/2 (Chiron et al., 1999). For condensed materi-als, the parameter ranges τ2/τ1 = 2 − 4, τ2 = 30 − 50fs with xK = 0.15 − 0.18 have been suggested (Agrawal,2001; Zozulya et al., 1999). Values of the nonlinear Kerrindex n2 can be found in the literature (Gong et al., 1998;Hellwarth et al., 1990; Lehmeier et al., 1985; Luo et al.,1995; Nibbering et al., 1997). Comprised between 10−19
cm2/W for gases and 10−16 cm2/W in dense media, theymay, however, vary by a factor of the order of unity, de-pending on the procedure used for their evaluation (po-larization spectroscopy, self- or cross-phase modulatedspectra, time-resolved interferometry), together with thelaser wavelength and pulse durations at which measure-ments are performed.
Besides, the susceptibility tensor has nonlinear compo-nents χ(j>3) that satisfy the ordering (Boyd, 1992; Shen,1984)
P (k+2)
P (k)=χ(k+2)
χ(k)· E
k+2
Ek≈ |E|2
|Eat|2, (28)
where Eat ≃ 3 × 10¹⁰ V/m is the characteristic atomicelectric field strength with intensity Iat > 1014 W/cm2.Typically, the evaluation χ(5)/χ(3) ∼ 10−12 holds fornonresonant interactions in, e.g., gases. Despite thelack of knowledge on the sign of χ(5) (Pan et al., 1990),the quintic susceptibility is often expected to satu-rate Kerr focusing and has, therefore, a negative sign
7
(Nurhuda et al., 2002b). Since the ordering (28) suggeststhat χ(j) is rapidly decreasing with the order j, the Tay-lor series with respect to the electric field is truncated atthe 5th order. Quintic polarization can be derived fol-lowing the same procedure as above, with χ(5) assumedconstant in the frequency domain. By developing E5 interms of (E , E∗) [Eq. (19)], the quintic contribution of thepolarization vector then expands as
P (5) = −2n0n4ǫ0√c1
(|E|4 +
1
2|E|2 E2 +
1
10E4
)E + c.c.
(29)
where n4 = 5|χ(5)ω0 |/(4n3
0c2ǫ20). On the whole, the total
nonlinear polarization vector reads as
PNL = P (3) + P (5). (30)
C. Plasma generation for singly-charged ionization
When free electrons are created, they induce a current
density ~J = qeρ~ve. This quantity depends on the electroncharge qe = −1.6 × 10⁻¹⁹ C, the electron density ρ and
the electron velocity ~ve. ~J is computed from the fluidequations (Esarey et al., 1997; Sprangle et al., 1996)
∂tρ+ ~∇ · (ρ~ve) = S, (31a)
∂t~ve + (~ve · ~∇)~ve =qeme
(~E +
~ve × ~B
c
)− νe~ve − S~ve/ρ.
(31b)
Here, S represents external plasma sources and νe is theeffective electron collision frequency. These equations canbe combined to yield
∂t ~J + νe ~J =q2eρ
me
~E + ~Π, (32)
where
~Π =qemec
~J × ~B −~J
ρqe(~∇ · ~J) − ( ~J · ~∇)~ve (33)
represents ponderomotive forces acting on slowly-varyingtime scales. For linearly-polarized electromagnetic fields
( ~E, ~B) oscillating at the high frequency ω0, the driv-
ing term ~Π admits envelope components containing gra-dients of the field intensity, radiation pressure due toelectron collisions and changes in the electron den-sity. Ponderomotive forces induce low plasma currents,which can in turn generate electromagnetic pulses (EMP)(Cheng et al., 2001, 2002) and provide sources of co-herent sub-THz radiation (Tzortzakis et al., 2002). Nu-merical simulations (Penano et al., 2004; Sprangle et al.,2004) have shown, however, that for 100-fs pulses reach-ing intensities of 1014 W/cm2 and free electron densitiesρ ∼ 1016 cm−3 in the atmosphere, the efficiency conver-sion to EMP is of the order of 10−9 with local intensities
attaining only 10 kW/cm2. In dielectrics, the plasmagenerates EMP intensities remaining about ∼ MW/cm2
for peak laser intensities of ∼ 1013 W/cm2. These pon-deromotive terms can thus be ignored, as long as peakintensities are below 1015 W/cm2. In this range, plasmadensity perturbations due to Langmuir wave oscillationsand relativistic increase of the electron mass have also anegligible influence. Therefore, the equation for the cur-rent density reduces to Eq. (32) in which Π = 0. At thelowest order in ve, the growth of the electron density isonly governed by the source term S, i.e.,
∂tρ = S = W (I)(ρnt − ρ) +σ
UiρI − f(ρ), (34)
that involves photo-ionization processes with rate W (I),collisional ionization with cross-section σ, and a functiondescribing electron recombination or attachment withneighboring ions denoted by f(ρ). Here, ρnt and Ui arethe density of neutral species and the ionization poten-tial, respectively, while ρ ≪ ρnt. Typically, the recombi-nation function in gases has a quadratic dependency on ρ,so that f(ρ) = βrecombρ
2 with βrecomb[cm3/s] ∼ 2× 10⁻⁸
at electron temperatures Te = 1 eV (Mlejnek et al.,1998a; Sprangle et al., 2002; Tzortzakis et al., 2000b).Recombination times belong to the nanosecond scale.In dielectrics, much shorter recombination times are in-volved (τrecomb = 50 − 150 fs) and the density linearlydecreases like f(ρ) = ρ/τrecomb (Audebert et al., 1994;Penano et al., 2005; Tzortzakis et al., 2001d).
Besides, the electron collisional rate depends onthe electron energy distribution function and temper-ature versus the ionization potential Ui. Assuming aMaxwellian distribution function for the electron velocity,this rate linearly varies like σ |E|2 /Ui, as long as the elec-tron thermal energy is small compared with Ui. Here, σ isthe inverse bremsstrahlung cross-section (Lotz, 1967a,b).If we omit Ohmic heating, solving for the current density(32) leads by Fourier transformation to
~J =q2e
me(ν2e + ω2)
(νe + iω)(ρ ~E). (35)
The current density term in Eq. (1a) transforms as
µ0∂t ~J → [−iωn0σ(ω)
c+
ω20
c2ρc(1 + ν2e/ω
2)](ρ ~E), (36)
after introducing the critical plasma density
ρc ≡ω2
0meǫ0q2e
≃ 1.11 × 10²¹
λ20[µm]
cm−3, (37)
at which the laser wave number vanishes. The cross-section
σ(ω) =q2e
meǫ0n0cνe(1 + ω2/ν2e )
(38)
then provides the frequency-dependent collisionalrate. This expression was earlier derived in the
8
limit of zero elastic collisions with ions by Kennedy(Kennedy, 1995), Yablonovitch and Bloembergen(Yablonovitch and Bloembergen, 1972) and by Feit andFleck (Feit and Fleck, 1974). Often linked to what iscalled the ”Drude” model, it determines energy lossesthrough plasma (cascade) ionization.
In Eq. (34), W (I) denotes the rate for photo-ionization. It is evaluated from perturbative theoriesvalid as long as the electric field E is weaker thanthe atom field strength Eat. This rate has been red-erived in Appendix A, following Keldysh’s and Perelo-mov, Popov and Terent’ev (PPT)’s theories apply-ing to atoms or dielectrics (crystals) (Keldysh, 1965;Perelomov and Popov, 1967; Perelomov et al., 1966,1967). To describe the ionization of complex atoms, PPTformula usually includes the so-called ADK coefficients[for Ammosov, Delone and Krainov (Ammosov et al.,1986)], originally established in the limit of high inten-sities. Optical field ionization theories stress two majorlimits bounded by the ”adiabaticity” Keldysh parameter,
γ = ω0
√2meUi|qe|Ep
, (39)
namely, the limit for multiphoton ionization (MPI, γ ≫1) concerned with rather low intensities and the tunnellimit (γ ≪ 1) concerned with high intensities, from whichthe Coulomb barrier becomes low enough to let the elec-tron tunnel out. Here, Ep denotes the peak optical am-plitude (Ep =
√2c1I). For simplicity, we ignore the phe-
nomenon of above-threshold ionization (Agostini et al.,1979; Corkum et al., 1989), through which the electronembarks more kinetic energy than K~ω0 − Ui. For laserintensities I = |E|2 < 1013 W/cm2, MPI characterizedby the limit
γ ≫ 1 =⇒W (I) → WMPI = σKIK (40)
dominates, where K = mod(Ui/~ω0) + 1 is the num-ber of photons necessary to liberate one electron. Forhigher intensities, tunnel ionization starts to contribute,i.e., electrons tunnel out within one optical cycle. De-spite the complexity of ionization formulas, all of themexhibit common dependencies on the laser field strength(Perry et al., 1988b; Reiss, 1980). By producing chargedions of noble gases as a function of the laser inten-sity, quantitative measurements confirmed the validity ofKeldysh theory for singly-charged ions only (Perry et al.,1988a). This theory basically applies to hydrogen atomsand discards the Coulomb field of the residual ion on theoutgoing electron. The PPT/ADK or Krainov’s models(Krainov, 1997), instead, better reproduce experimen-tal ionization rates of atoms in, e.g., the tunnel regimeand may even suit for higher-charged states (Augst et al.,1991; Cornaggia and Hering, 2000). On this basis, ion-ization of diatomic molecules can be predicted throughsemi-empirical theories using the PPT rate in which theelectron tunnels through a barrier with effective poten-tial Zeff/r. Here, Zeff is determined by fitting the theo-
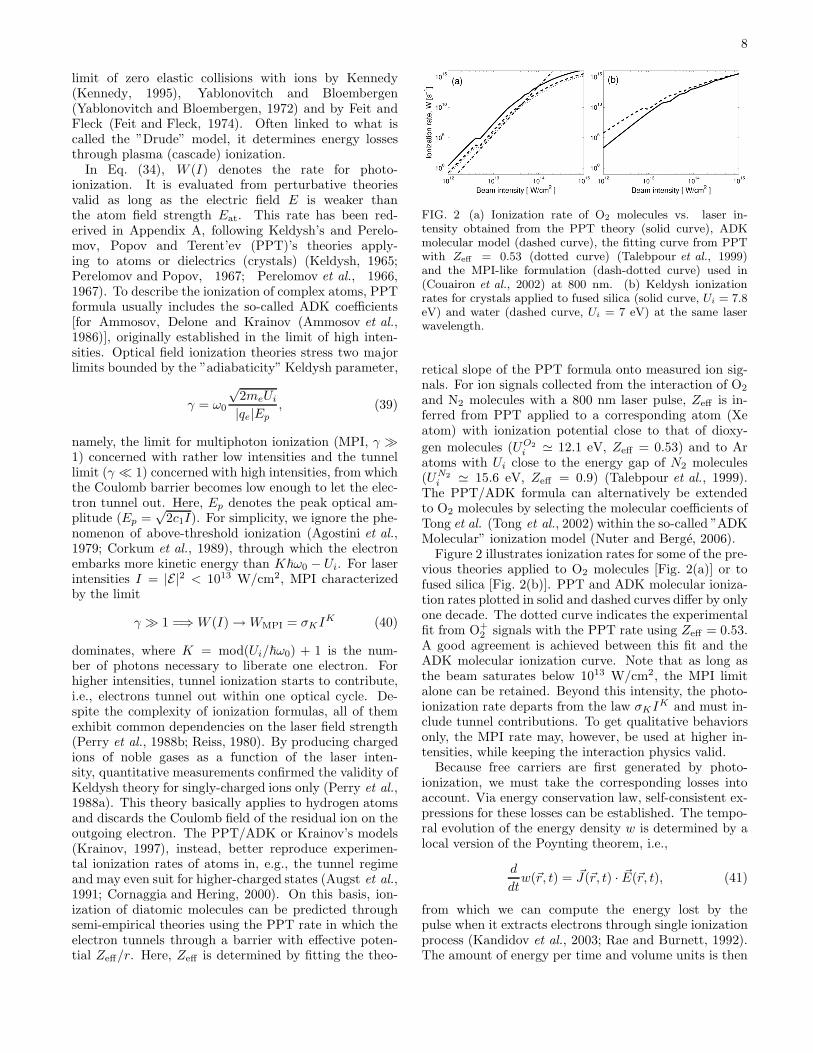
FIG. 2 (a) Ionization rate of O2 molecules vs. laser in-tensity obtained from the PPT theory (solid curve), ADKmolecular model (dashed curve), the fitting curve from PPTwith Zeff = 0.53 (dotted curve) (Talebpour et al., 1999)and the MPI-like formulation (dash-dotted curve) used in(Couairon et al., 2002) at 800 nm. (b) Keldysh ionizationrates for crystals applied to fused silica (solid curve, Ui = 7.8eV) and water (dashed curve, Ui = 7 eV) at the same laserwavelength.
retical slope of the PPT formula onto measured ion sig-nals. For ion signals collected from the interaction of O2
and N2 molecules with a 800 nm laser pulse, Zeff is in-ferred from PPT applied to a corresponding atom (Xeatom) with ionization potential close to that of dioxy-
gen molecules (UO2
i ≃ 12.1 eV, Zeff = 0.53) and to Aratoms with Ui close to the energy gap of N2 molecules(UN2
i ≃ 15.6 eV, Zeff = 0.9) (Talebpour et al., 1999).The PPT/ADK formula can alternatively be extendedto O2 molecules by selecting the molecular coefficients ofTong et al. (Tong et al., 2002) within the so-called ”ADKMolecular” ionization model (Nuter and Berge, 2006).
Figure 2 illustrates ionization rates for some of the pre-vious theories applied to O2 molecules [Fig. 2(a)] or tofused silica [Fig. 2(b)]. PPT and ADK molecular ioniza-tion rates plotted in solid and dashed curves differ by onlyone decade. The dotted curve indicates the experimentalfit from O+
2 signals with the PPT rate using Zeff = 0.53.A good agreement is achieved between this fit and theADK molecular ionization curve. Note that as long asthe beam saturates below 1013 W/cm2, the MPI limitalone can be retained. Beyond this intensity, the photo-ionization rate departs from the law σKI
K and must in-clude tunnel contributions. To get qualitative behaviorsonly, the MPI rate may, however, be used at higher in-tensities, while keeping the interaction physics valid.
Because free carriers are first generated by photo-ionization, we must take the corresponding losses intoaccount. Via energy conservation law, self-consistent ex-pressions for these losses can be established. The tempo-ral evolution of the energy density w is determined by alocal version of the Poynting theorem, i.e.,
d
dtw(~r, t) = ~J(~r, t) · ~E(~r, t), (41)
from which we can compute the energy lost by thepulse when it extracts electrons through single ionizationprocess (Kandidov et al., 2003; Rae and Burnett, 1992).The amount of energy per time and volume units is then
9
given by ~J · ~E = Ui∂tρPI where ∂tρPI ≡ W (I)(ρnt − ρ).Using complex-valued fields, the current associated withphoto-ionization losses is merely found to be
~Jloss =
√k0
2ω0µ0UiW (I)
I(ρnt − ρ)(~E + ~E∗), (42)
where fast oscillations are canceled in the denomina-tor. Geissler et al. (Geissler et al., 1999) derived similarlosses by introducing the overall polarization vector for
free electrons ~P = qeρPI~x, so that ∂t ~P = qeρPI~x + ~J .Free electrons arise with zero velocity at the position
~x(t) ≃ Ui ~E/(2|qe|I), yielding the same loss current.As a final result, the propagation equation within the
UPPE description (15) reads in Fourier space as
∂
∂zE =
[i
2k(ω)∇2
⊥ + ik(ω)
]E +
iµ0ω2
2k(ω)√c1
Θ(ω)PNL
− ik20Θ(ω)
2ǫ(ω0)k(ω)(1 +ν2
e
ω2 )
(ρEρc
)− Θ(ω)
2
√ǫ(ω0)
ǫ(ω)L(ω),
(43)
where
L(ω) =Ui2π
∫E[W (I)
I(ρnt − ρ) +
σ(ω)
Uiρ
]eiωtdt. (44)
PNL(~r, t) [Eq. (30)] and the expression containing theelectron density ρ(~r, t) [Eq. (34)] must be transformedto Fourier space. Treating the complex field E only forpositive frequencies is sufficient because of the symmetry
E∗(ω) = E(−ω)∗, which imposes to select the parts of thenonlinear terms belonging to the frequency range ω > 0.
For practical use, the collision cross-section σ is statedfor a central frequency ω0. We furthermore assumeν2e/ω
20 ≪ 1 and
√ǫ(ω0)/ǫ(ω) ≈ 1. The link to the NEE
model is then straightforward, whenever the dispersionrelation supports a Taylor expansion around ω0. By re-taining only waveforms beating at ω0, the nonlinear en-velope equation for the forward component U is directlyinferred from (23) as
∂
∂zU =
i
2k0T−1∇2
⊥U + iDU + iω0
cn2T
[(1 − xK) |U |2 + xK
∫ t
−∞h(t− t′) |U(t′)|2 dt′
]U
− iω0
cn4T |U |4U − i
k0
2n20ρc
T−1ρU − σ
2ρU − βMPA(|U |)
2U,
(45a)
∂
∂tρ = W (I)(ρnt − ρ) +
σ(ω0)
Uiρ|U |2 − f(ρ) (45b)
where t stands for the retarded time variable t − z/vg.The function βMPA(|U |) = (ρnt − ρ)UiW (I)/|U |2 ac-counts for losses caused by photo-ionization. In theMPI limit (40), this dissipative function takes the formβMPA(|U |) → β(K)|U |2K−2 where β(K) ≡ K~ω0σKρnt
is the coefficient for multiphoton absorption (MPA). Thefirst term of the operator D corresponds to group-velocitydispersion (GVD) with coefficient k′′ = ∂2k/∂ω2|ω=ω0 .Equations (45) describe wave diffraction, Kerr focusingresponse, plasma generation, chromatic dispersion witha self-consistent action of deviations from the classicalslowly-varying envelope approximation through space-time focusing and self-steepening operators [(T−1∇2
⊥E)and (T |E|2E), respectively]. They are usually integratednumerically by using, e.g., initially singly-humped pulsestaken with a super-Gaussian beam shape
U(x, y, z = 0, t) = U0e− r2N
w2N0
−ik0 r2
2f− t2
t2p−iC t2
t2p , (46)
which may be focused through a lens of focal length f and
be temporally chirped if C 6= 0. Here, r =√x2 + y2.
For Gaussian beams (N = 1), U0 =√
2Pin/πw20 in-
volves the input power Pin, w0 is the beam waist andtp the 1/e2 pulse half-width, such that its full-width-at-
half-maximum (FWHM) is ∆t =√
2 ln 2tp. The initiallevel (t = −∞) of plasma density is zero. In linear prop-agation, such Gaussian pulses diffract over the distance
zf = (f2/z0)/(1 + f2/z20), (47)
where z0 = πn0w20/λ0 is the diffraction range of the col-
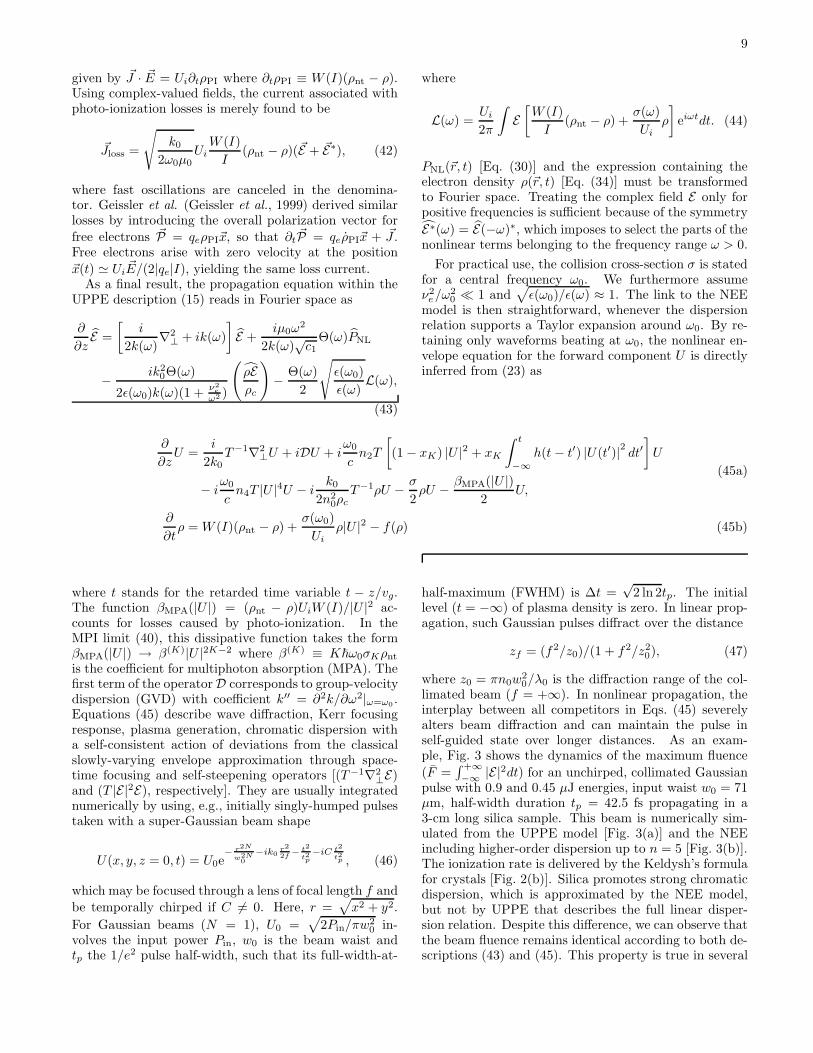
limated beam (f = +∞). In nonlinear propagation, theinterplay between all competitors in Eqs. (45) severelyalters beam diffraction and can maintain the pulse inself-guided state over longer distances. As an exam-ple, Fig. 3 shows the dynamics of the maximum fluence
(F =∫ +∞−∞ |E|2dt) for an unchirped, collimated Gaussian
pulse with 0.9 and 0.45 µJ energies, input waist w0 = 71µm, half-width duration tp = 42.5 fs propagating in a3-cm long silica sample. This beam is numerically sim-ulated from the UPPE model [Fig. 3(a)] and the NEEincluding higher-order dispersion up to n = 5 [Fig. 3(b)].The ionization rate is delivered by the Keldysh’s formulafor crystals [Fig. 2(b)]. Silica promotes strong chromaticdispersion, which is approximated by the NEE model,but not by UPPE that describes the full linear disper-sion relation. Despite this difference, we can observe thatthe beam fluence remains identical according to both de-scriptions (43) and (45). This property is true in several
10
FIG. 3 Maximum fluence for pulses propagating in silica glasswith 0.45 µJ (solid curve) and 0.9 µJ (dashed line) energiessimulated from (a) the UPPE model, (b) the NEE model withdispersion limited to fifth order.
media (dielectrics, liquids and air as well), whenever Eq.(45a) includes dispersive contributions k(n) with n > 3(Kolesik et al., 2003b, 2002).
Earlier studies on femtosecond pulse propagationin the atmosphere started with simpler models thanEqs. (43) or (45) by, e.g., ignoring time dispersion(Kandidov et al., 1994). Their derivation was im-proved later (Feng et al., 1995; Mlejnek et al., 1998a,b;Sprangle et al., 1996), before being finalized into NEEand UPPE formulations.
III. OPTICAL ULTRASHORT FILAMENTS: A FEWTOOLS FOR THEIR ANALYTICAL DESCRIPTION
A. Kerr focusing and wave collapse
For beams with no temporal dispersion, Eq. (45a) withno other nonlinear response than the instantaneous cubicKerr term (xK = 0), i.e.,
∂
∂zU =
i
2k0∇2
⊥U + iω0
cn2|U |2U = 0, (48)
describes the self-focusing of optical wave-packets withn2 > 0 (Askar’yan, 1962; Marburger, 1975). Self-focusingis a nonlinear phenomenon common to several branchesof physics. In optics, it intervenes through the refractiveoptical index Nopt = n0+n2I that increases with the fieldintensity and forces light rays to refract onto the axis.This causes a compression of the beam in the diffraction
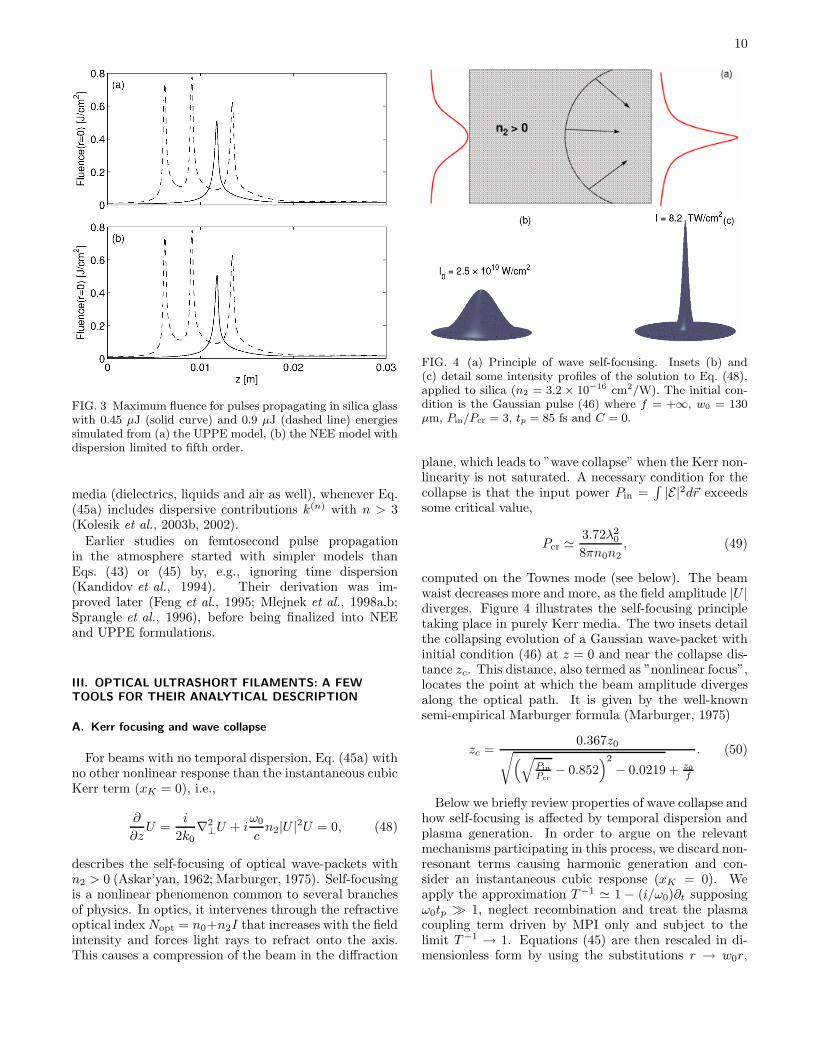
FIG. 4 (a) Principle of wave self-focusing. Insets (b) and(c) detail some intensity profiles of the solution to Eq. (48),applied to silica (n2 = 3.2 × 10⁻¹⁶ cm2/W). The initial con-dition is the Gaussian pulse (46) where f = +∞, w0 = 130µm, Pin/Pcr = 3, tp = 85 fs and C = 0.
plane, which leads to ”wave collapse” when the Kerr non-linearity is not saturated. A necessary condition for thecollapse is that the input power Pin =
∫|E|2d~r exceeds
some critical value,
Pcr ≃3.72λ2
0
8πn0n2, (49)
computed on the Townes mode (see below). The beamwaist decreases more and more, as the field amplitude |U |diverges. Figure 4 illustrates the self-focusing principletaking place in purely Kerr media. The two insets detailthe collapsing evolution of a Gaussian wave-packet withinitial condition (46) at z = 0 and near the collapse dis-tance zc. This distance, also termed as ”nonlinear focus”,locates the point at which the beam amplitude divergesalong the optical path. It is given by the well-knownsemi-empirical Marburger formula (Marburger, 1975)
zc =0.367z0√(√
Pin
Pcr− 0.852
)2
− 0.0219 + z0f
. (50)
Below we briefly review properties of wave collapse andhow self-focusing is affected by temporal dispersion andplasma generation. In order to argue on the relevantmechanisms participating in this process, we discard non-resonant terms causing harmonic generation and con-sider an instantaneous cubic response (xK = 0). Weapply the approximation T−1 ≃ 1 − (i/ω0)∂t supposingω0tp ≫ 1, neglect recombination and treat the plasmacoupling term driven by MPI only and subject to thelimit T−1 → 1. Equations (45) are then rescaled in di-mensionless form by using the substitutions r → w0r,
11
t → tpt, z → 4z0z, U → √c2ψ and ρ → (n2
0ρc/2z0k0)ρ,where c2 ≡ λ2
0/8π2n0n2w
20 . They result into the ex-
tended nonlinear Schrodinger (NLS) equation
i∂zψ + ∇2⊥ψ + |ψ|2ψ + F(ψ) = 0, (51a)
F = −δ∂2tψ − ρψ − ǫ|ψ|4ψ + iν|ψ|2K−2ψ
+i(|ψ|2ψ −∇2
⊥ψ)ttpω0
, ∂tρ = Γ|ψ|2K ,(51b)
where F(ψ) includes ”perturbations” of a critical col-lapse, such as GVD, MPI, nonlinear saturation, MPAand pulse steepening. GVD and MPA have the normal-ized coefficients δ ≡ 2z0k
′′/t2p and ν = 2z0β(K)cK−1
2 ,respectively. Quintic saturation is taken into accountthrough ǫ = n4c2/n2. The rescaled MPI coefficient readsas Γ = (2z0k0/n
20ρc)σKρnttpc
K2 . For Gaussian beams,
the incident amplitude (46) reduces to
|ψ(z = 0)| =
√16πn0n2Pin
λ20
e−r2−t2 . (52)
1. Principles of wave self-focusing
With a purely cubic nonlinearity, solutions to theCauchy problem (51a) can blow-up (or collapse) at fi-nite distance (Kelley, 1965; Sulem and Sulem, 1999). Todescribe this singular process, let us consider the NLSequation (51a) with F = ∂2
t ψ (δ = −1), so that the
Laplacian ~∇2⊥ → ~∇2 = ∂2
x + ∂2y + ∂2
t + ... formally ac-counts for the dispersion of a wave-packet along D or-thogonal spatial axes [~r = (x, y, t, ...)]. The wavefunc-tion ψ evolves from the spatially-localized initial datumψ(~r, 0) ≡ ψ0(~r), assumed to belong to the Hilbert space
H1 with finite norm ‖ψ‖H1 = (‖ψ‖22 + ‖~∇ψ‖2
2)1/2, where
‖f‖p ≡ (∫|f |pd~r)1/p. Two invariants are associated with
ψ, namely, the L2 norm (power) P and Hamiltonian H :
P = ‖ψ‖22 , H = ‖~∇ψ‖2
2 −1
2‖ψ‖4
4. (53)
The following “virial” equality can be established(Glassey, 1977; Vlasov et al., 1974)
Pd2z〈r2〉 = 42H + (1 −D/2)‖ψ‖4
4, (54)
where 〈r2〉 =∫r2|ψ|2d~r/P denotes the mean-squared ra-
dius of the solution ψ. By a double integration in z,Eq. (54) shows that, whenever D ≥ 2, there exist ini-tial conditions for which 〈r2〉 vanishes at finite distance,which is the sufficient signature of a wave collapse. For
finite norms P , the inequality P ≤ (4/D)2〈r2〉 × ‖~∇ψ‖22
thus implies that the gradient norm diverges in collapseregimes. As H is finite, the collapse dynamics makesthe L4 norm ‖ψ‖4
4 blow up in turn and maxr|ψ| di-verges accordingly, by virtue of the mean-value theo-rem
∫|ψ|4d~r ≤ maxr|ψ|2 × P (Kuznetsov, 1996). This
leads to a finite-distance blow-up, at which the solution
ψ stops to exist in H1 (Rasmussen and Rypdal, 1986).This mathematical singularity reflects the ultimate issueof the nonlinear self-focusing in the absence of saturationof the Kerr response and under the paraxiality assump-tion.
While H < 0 arises from Eq. (54) as a sufficient con-dition for collapse, sharper requirements can be derivedby means of the Sobolev inequality
‖ψ‖44 ≤ C‖~∇ψ‖D2 × ‖ψ‖4−D
2 . (55)
In the critical case D = 2, this inequality can be used tobound H from below, so that the gradient norm blows uponly if P fulfills the constraint P > Pc. The best constantin Eq. (55) is exactly Cbest = 2/Pc and it involves thequantity Pc =
∫R2d~r = 11.68, where R is the radially-
symmetric soliton solution, called the ”Townes mode”, of−R+r−1∂rr∂rR+R3 = 0 (Chiao et al., 1964; Weinstein,1983). Pc justifies the existence of a critical power forthe 2D self-focusing of optical beams in nonlinear Kerrmedia. In the supercritical case D = 3, a criterion forcollapse, sharper than H < 0, can be established froma combination of Eqs. (54) and (55) as H < P 2
c /P forgradient norms initially above 3P 2
c /P (Kuznetsov et al.,1995). Here, Pc again corresponds to the mass of the 3Dsoliton satisfying −R+ r−2∂rr
2∂rR+R3 = 0.Once collapse is triggered, the solution focuses self-
similarly near the singularity point zc as (Rypdal et al.,1985)
ψ(~r, z) = L−1(z)φ(~ξ, ζ)eiλζ+iLLzξ2/4, (56)
where ~ξ = ~r/L(z), ζ(z) ≡∫ z0du/L2(u) and the parame-
ter λ is positive for making the new wavefunction φ local-ized. The function L(z) represents the scale length thatvanishes as collapse develops, and φ converges to an ex-
actly self-similar form φ(~ξ) fulfilling ∂ζφ→ 0. For radialsolutions Eq. (51a) transforms into
i∂ζφ+ ξ1−D∂ξξD−1∂ξφ+ |φ|2φ+ β[ξ2 − ξ2T ]φ = 0,
(57)where ξ2T ≡ β−1[λ− iLLz(D2 −1)] is viewed as a complex
turning point, with β ≡ − 14L
3Lzz. As L(z) → 0, φcan be treated by means of quasi-self-similar techniques(Berge, 1998). The solution φ is split into a nonlinearcore, φc, extending in the range ξ ≪ ξT , and a lineartail, φT ∼ e−λπ/β/ξ1+iλ/β , defined in the complementaryspatial domain ξ ≫ ξT where the nonlinearity vanishes.The length L(z) is then identified from the continuityequation describing the mass exchanges between the coreand tail parts of ψ. The dynamics of self-similar collapsesvary with the space dimension number as follows.
• For D = 2, L(z) has a twice-logarithmic correction:
L(z) ≃ L0√zc − z/
√ln ln [1/(zc − z)] (Fraiman,
1985; Landman et al., 1988; Malkin, 1990). Asz → zc, the exponential contribution of the taildecreases to zero, while the core converges to theTownes mode R. The power P relaxes to the
12
critical value Pc and stays mostly located aroundthe center. Self-similar relaxation of self-focusingbeams to the Townes mode has been reported ex-perimentally (Moll et al., 2003).
• For D = 3, β attains a fixed point β0 6= 0, leadingto the scaling law L(z) ≃ L0
√zc − z. The power
is no longer preserved self-similarly in space,
since P = L(z)∫|φ|2d~ξ. This integral behaves
as P ≃ Pcore(z) + Ptail(z), where Pcore(z) ∼ L(z)vanishes, while Ptail(z) contains almost all theinitial mass as L(z) → 0. A 3D collapse is thusaccompanied by an expulsion of mass towardsthe large distances where it keeps a station-ary density r2|ψ|2 → const (Kosmatov et al.,1991; leMesurier, 2000; Vlasov et al., 1989;Zakharov and Kuznetsov, 1986).
2. Variational approaches
Because the cubic NLS equation is not integrable athigh dimension numbers D ≥ 2, approximation methodsdescribing the fate of singular solutions may be employed.Among those, ”variational approaches” consist in build-ing a set of dynamical equations governing the size, am-plitude and phase of the beam. These beam parametersare evaluated from functional integrals (Action or La-grangian integrals) computed from a given trial function,which the pulse is supposed to keep along the opticalpath. Such methods give global, qualitative behaviorswithin a pedestrian way. Their principal drawback isthat, as they need to fulfill the main conservation laws(e.g., preservation of the L2 norm), they capture the en-tire initial mass of the solution and do not let the latterevacuate radiation to the boundaries or relax to an exactground state. This discrepancy may partly be cured byaccounting for corrective damping of the nonlinear core(Arevalo and Becker, 2005; Kath and Smyth, 1995), butimprovements become rapidly tricky and limited. Vari-ational principles applied to NLS solutions were exten-sively studied (Anderson, 1983; Anderson and Bonnedal,1979; Anderson et al., 1979; Bondeson et al., 1979;Desaix et al., 1991) and further exploited in differ-ent contexts (Cerullo et al., 1996; Karlsson et al., 1992;Manassah, 1992; Manassah et al., 1988; Pietsch et al.,1991; Silberberg, 1990; Vidal and Johnston, 1997). Theywere also widely worked out by several authors inthe present scope (Couairon, 2003b; Esarey et al., 1997;Lehner and Auby, 2000; Sprangle et al., 1996).
For example, considering the shape (46) with N = 1,a Gaussian trial function in the form
ψ =
√J (z)
L(z)√T (z)
φ(ξ⊥, η)eiLzL
4 ξ2⊥−iTzT
4δη2
(58)
with φ = e−ξ2⊥/2−η2/2+iθ(z), ξ⊥ = r/L(z), η =
t/T (z) can be employed in the virial identities govern-ing the transverse and temporal mean squared extents
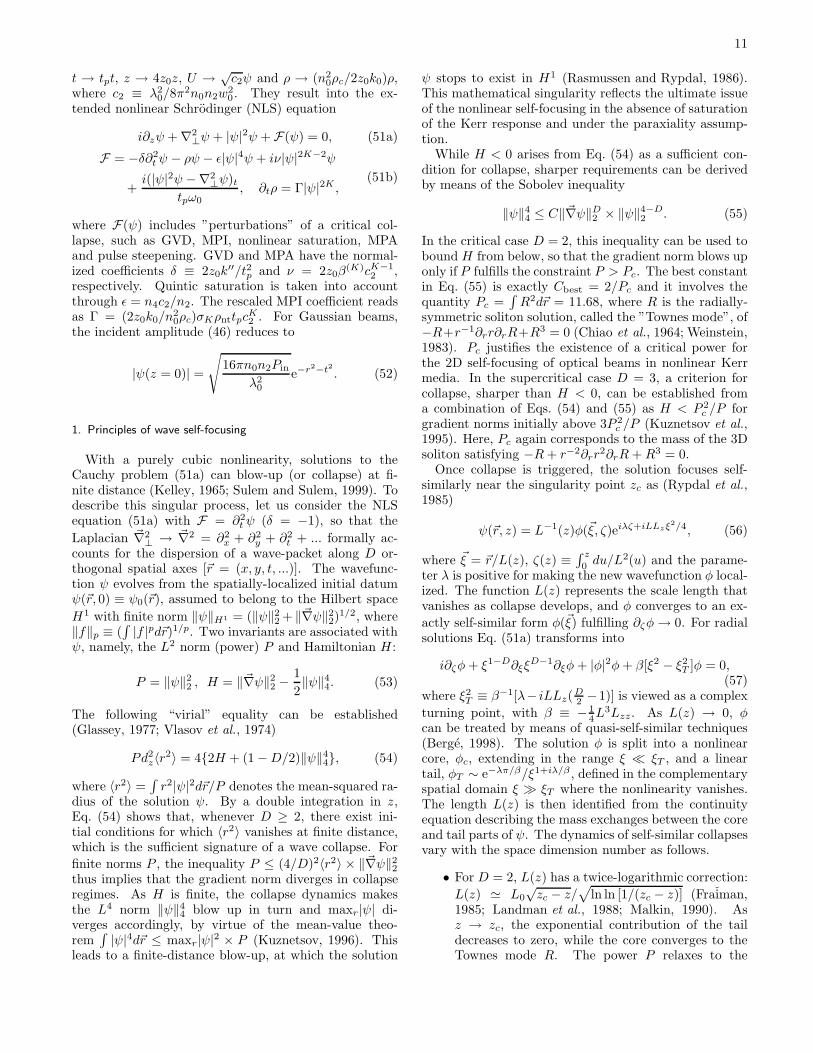
FIG. 5 Peak intensities for a 1 mm-waisted, 100-fs collimatedGaussian pulse with 22 critical powers. Dashed line: Resultsfrom Eqs. (59) in the limits T, T−1 → 1; Solid line: (3 +1)-dimensional numerical simulations (initial conditions areperturbed by a 10% amplitude random noise).
(Berge and Couairon, 2000; Sprangle et al., 2002). Sep-arate dynamical systems for the transverse width [L(z)],the temporal duration [T (z)] and the intensity factor[J (z)] of the pulse are then analytically established as
Lzz4
=1
L3− J T (0)
4TL3+
Γ√πKJK
2(K + 1)2L2K+1TK−1+ · · ·
(59a)
Tzz4
=δ2
T 3+δJ T (0)
4L2T 2+ · · · , (59b)
Jz = − 2ν
K3/2
JK
(L2T )K−1+ · · · (59c)
where final dots formally omit contributions from MPA,Raman-delayed, quintic and steepening effects. WithJ (0) = 2
√2Pin/Pcr imposed by the initial power, Eqs.
(59) yield qualitative behaviors for the propagation of asingle femtosecond pulse preserving its cylindrical sym-metry. It, of course, cannot depict any temporal or spa-tial splitting phenomenon, but offers a global evolutionof the beam intensity. This evolution fairly supports thecomparison with (3 + 1)-dimensional numerical simula-tions (Champeaux and Berge, 2005), apart from an over-estimated nonlinear focus. Figure 5 shows an example ofpeak intensity reached by Gaussian pulses with param-eters Pin/Pcr = 22, w0 = 1 mm, tp = 100 fs at thewavelength λ0 = 800 nm in the limit T → 1 and dis-persion limited to GVD. Collapse is arrested by plasmageneration. The dashed curve corresponds to the solu-tion reconstructed from the two-scale variational method.The solid one shows the result obtained from numericalintegration of the propagation equations.
Besides, alternative procedures, such as perturbativemethods, may provide qualitative information about
13
the changes in the scale L(z, t) induced by contribu-tions that can stop the collapse. Here, the radial sizeL(z, t) tends to zero in the diffraction plane as z →zc, but it now depends on time. The principle is toperturb a collapsing state that naturally tends to theTownes mode R, by means of L2 orthogonal perturba-tive modes. These will provide an integral relation forthe z-dependent function β [Eq. (57)], directly dependingon F (Fibich and Papanicolaou, 1999). At the critical di-mension, the zeroth-order collapsing solution, whose coreconverges as
ψ → ψs = L−1R(~r/L) exp (iζ + iLzr2/4L), (60)
has its mean radius L(z, t) modified by the perturbation|F| ≪ 1. Appropriate functions F are then capable ofturning the sign of β = − 1
4L3Lzz from positive to nega-
tive, which predicts the arrest of collapse. This methodwas applied to many ”perturbations” of NLS, such asnormal GVD, steepening and non-paraxial deviations(Fibich, 1996; Fibich and Papanicolaou, 1997) as wellas for NLS with attractive potentials (leMesurier et al.,2004; Schjødt-Eriksen et al., 2001a). It was later ex-tended to a variational system formally avoiding the con-straints ǫ, β,F ≪ 1 by introducing an amplitude fac-tor accounting for dissipative losses, ψ →
√J (z, t)ψs
(Berge and Couairon, 2001b). Applied to Eqs. (51) forpulses having a Gaussian distribution in time, this pro-cedure involves the substitution
ψ →√J (z, t)ψs; J (z = 0, t) = Pine−2t2/Pcr, (61)
and leads to the dynamical equations
M
4PcL3Lzz = 1 − J + 4ǫ
J 2
L2− L2
2Pc
∫R2ξ∂ξρd~ξ (62a)
JzJ ≃ 2δζtt − 2νA
JK−1
L2K−2− B(L−2)t
tpω0, (62b)
where M =∫ξ2R2(ξ)d~ξ, A =
∫R2Kd~ξ/Pc, B = 3J + 1,
and C =∫R2K+2d~ξ/Pc. Equation (62b) originates from
the power variations, assuming Jz/J ≪ 1. The firstterm refers to GVD, the second one to MPA and the lastterm corresponds to pulse steepening.
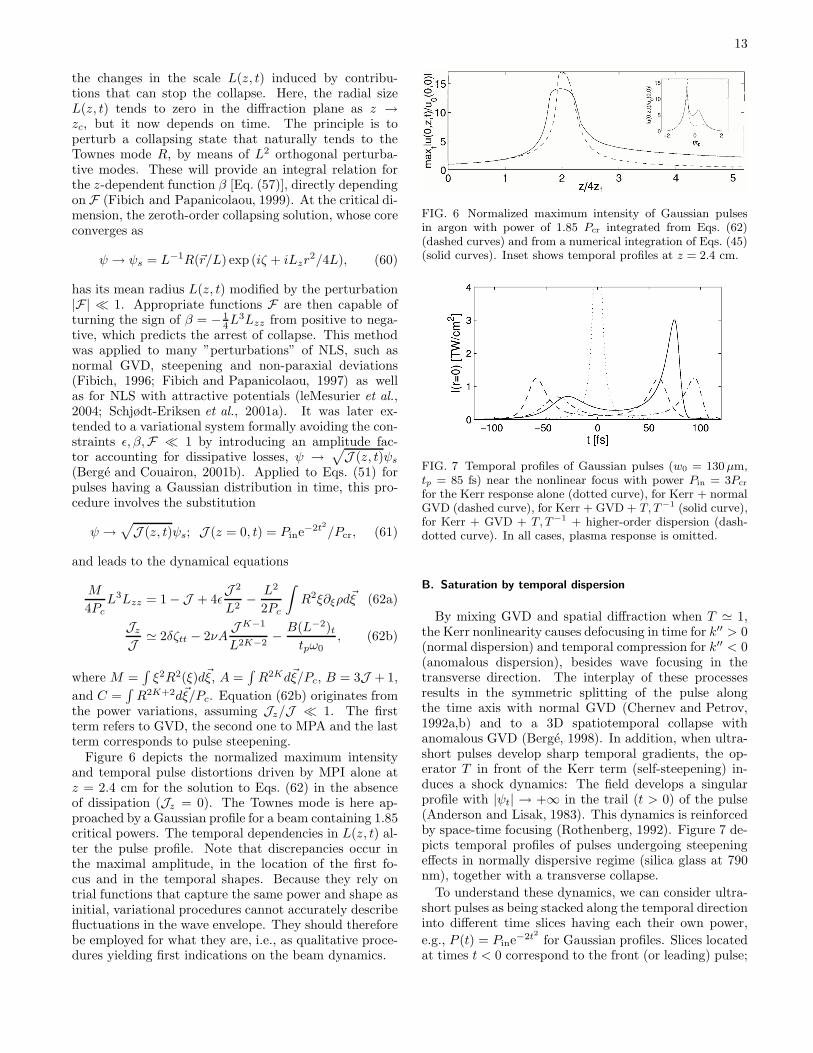
Figure 6 depicts the normalized maximum intensityand temporal pulse distortions driven by MPI alone atz = 2.4 cm for the solution to Eqs. (62) in the absenceof dissipation (Jz = 0). The Townes mode is here ap-proached by a Gaussian profile for a beam containing 1.85critical powers. The temporal dependencies in L(z, t) al-ter the pulse profile. Note that discrepancies occur inthe maximal amplitude, in the location of the first fo-cus and in the temporal shapes. Because they rely ontrial functions that capture the same power and shape asinitial, variational procedures cannot accurately describefluctuations in the wave envelope. They should thereforebe employed for what they are, i.e., as qualitative proce-dures yielding first indications on the beam dynamics.
FIG. 6 Normalized maximum intensity of Gaussian pulsesin argon with power of 1.85 Pcr integrated from Eqs. (62)(dashed curves) and from a numerical integration of Eqs. (45)(solid curves). Inset shows temporal profiles at z = 2.4 cm.
FIG. 7 Temporal profiles of Gaussian pulses (w0 = 130 µm,tp = 85 fs) near the nonlinear focus with power Pin = 3Pcr
for the Kerr response alone (dotted curve), for Kerr + normalGVD (dashed curve), for Kerr + GVD + T, T−1 (solid curve),for Kerr + GVD + T, T−1 + higher-order dispersion (dash-dotted curve). In all cases, plasma response is omitted.
B. Saturation by temporal dispersion
By mixing GVD and spatial diffraction when T ≃ 1,the Kerr nonlinearity causes defocusing in time for k′′ > 0(normal dispersion) and temporal compression for k′′ < 0(anomalous dispersion), besides wave focusing in thetransverse direction. The interplay of these processesresults in the symmetric splitting of the pulse alongthe time axis with normal GVD (Chernev and Petrov,1992a,b) and to a 3D spatiotemporal collapse withanomalous GVD (Berge, 1998). In addition, when ultra-short pulses develop sharp temporal gradients, the op-erator T in front of the Kerr term (self-steepening) in-duces a shock dynamics: The field develops a singularprofile with |ψt| → +∞ in the trail (t > 0) of the pulse(Anderson and Lisak, 1983). This dynamics is reinforcedby space-time focusing (Rothenberg, 1992). Figure 7 de-picts temporal profiles of pulses undergoing steepeningeffects in normally dispersive regime (silica glass at 790nm), together with a transverse collapse.
To understand these dynamics, we can consider ultra-short pulses as being stacked along the temporal directioninto different time slices having each their own power,
e.g., P (t) = Pine−2t2 for Gaussian profiles. Slices located
at times t < 0 correspond to the front (or leading) pulse;
14
those at t > 0 constitute the back (trailing) pulse. Eachtime slice self-focuses at its respective singularity point,zc(t), according to Eq. (50) in which the ratio Pin/Pcr
must be replaced by Pine−2t2/Pcr. This scenario is knownas the ”moving-focus” model (Lugovoi and Prokhorov,1974; Shen, 1976) and yields simple comprehension el-ements to figure out the pulse distortions. Here, the cen-tral time slice focuses at the shortest distance zc(t = 0).Furthermore, zc(t) is positive for t > 0 and negative fort < 0 [zc(0) = 0], whereas zc(t) always remains pos-itive. Near the collapse distance, we can replace alltime derivatives by ∂t = −zc∂z, ∂2
t = −zc∂z + z2c∂
2z
(Fibich and Papanicolaou, 1997; Luther et al., 1994b).Power fluctuations (62b) are then given by
J dispz
J = 2δ[−zc/L2 + z2c (1/L
2)z ] +2B
ω0tpzc(L
−2)z, (63)
where Lz < 0 in compression regime. With δ > 0,Eq. (63) describes defocusing around the central slice:Normal GVD transfers power towards non-zero instants,symmetrically located with respect to t = 0. Self-steepening and space-time focusing moreover produce atransfer of power from the leading (zc < 0) to the trail-ing portion of the pulse (zc > 0). This asymmetrizes thetemporal profile, which was retrieved by direct exper-iments (Ranka and Gaeta, 1998). Normal GVD alone”splits” a focusing pulse into two regular, symmetricspikes at powers < 2Pc. For higher powers, the peakedges develop shock profiles and disintegrate into rip-plelike cells (Fibich et al., 2003; Germaschewski et al.,2001). Because of the hyperbolicity of the opera-tor ∇2
⊥ − δ∂2t , one splitting event transforms the op-
tical field in the (r, t) plane into an X-shaped wave-form (Berge et al., 2002; Christodoulides et al., 2004;Conti et al., 2003; Di Trapani et al., 2003; Litvak et al.,2000a,b; Zharova et al., 2003).
Normal GVD (k′′ > 0) and plasma formation competeat powers moderately above critical to halt the wave col-lapse. The stronger the GVD coefficient, the larger thepower interval in which the collapse is arrested by pulsesplitting. By solving the cubic NLS equation with nor-mal GVD, a boundary δcrit(p), function of the ratio ofinput power over critical, p = Pin/Pcr, can be calculatedin such a way that initial conditions fulfilling δ > δcrit(p)will limit the Kerr self-focusing through GVD splittinginstead of letting the solution diverge into a singular state(Luther et al., 1994a). Higher-order dispersion togetherwith steepening effects (T, T−1) modify this curve in thesense of ”delaying” the self-focusing threshold to higherpowers (Skupin and Berge, 2006; Skupin et al., 2006a).In particular, third-order dispersion tends to delocalizethe pulse by pushing the temporal centroid to the back(Fibich and Ilan, 2004).
In contrast, for anomalous GVD (k′′ < 0) power istransferred to center, as seen from Eq. (63) with δ < 0.Ultrashort pulses thus collapse both in space and time.A mapping |δ| > δcrit(p) can again be constructed on thebasis of virial-type arguments (Berge and Skupin, 2005;
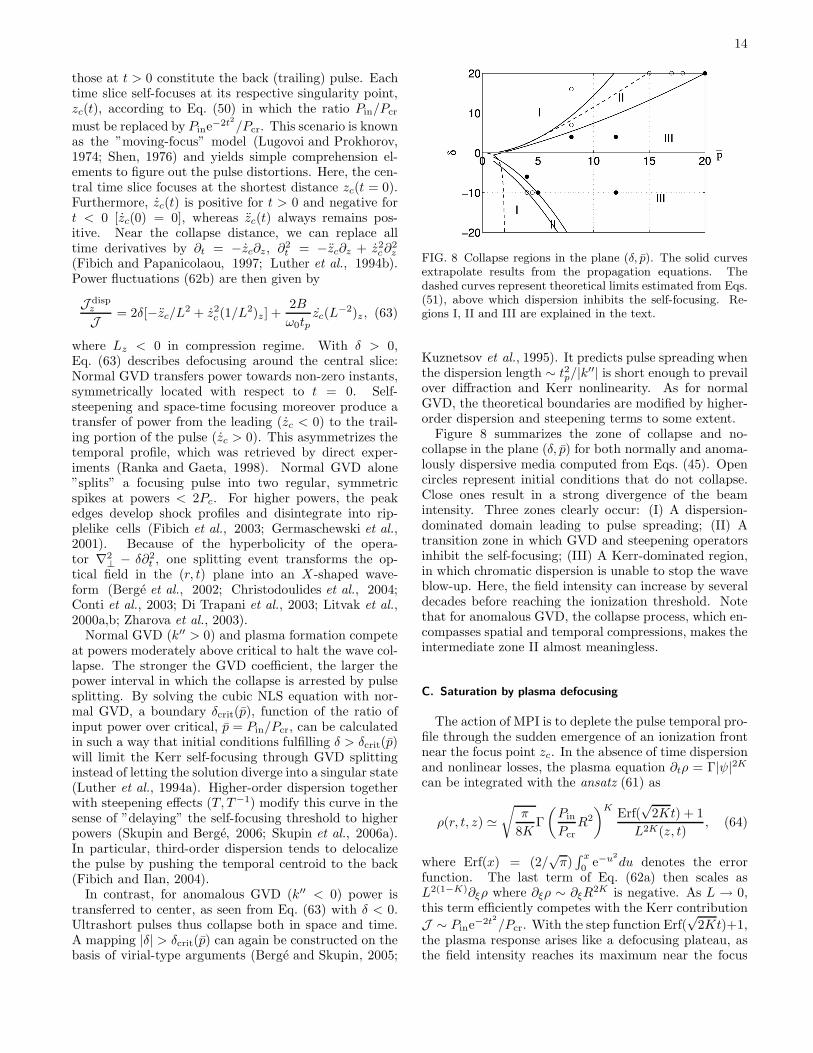
FIG. 8 Collapse regions in the plane (δ, p). The solid curvesextrapolate results from the propagation equations. Thedashed curves represent theoretical limits estimated from Eqs.(51), above which dispersion inhibits the self-focusing. Re-gions I, II and III are explained in the text.
Kuznetsov et al., 1995). It predicts pulse spreading whenthe dispersion length ∼ t2p/|k′′| is short enough to prevailover diffraction and Kerr nonlinearity. As for normalGVD, the theoretical boundaries are modified by higher-order dispersion and steepening terms to some extent.
Figure 8 summarizes the zone of collapse and no-collapse in the plane (δ, p) for both normally and anoma-lously dispersive media computed from Eqs. (45). Opencircles represent initial conditions that do not collapse.Close ones result in a strong divergence of the beamintensity. Three zones clearly occur: (I) A dispersion-dominated domain leading to pulse spreading; (II) Atransition zone in which GVD and steepening operatorsinhibit the self-focusing; (III) A Kerr-dominated region,in which chromatic dispersion is unable to stop the waveblow-up. Here, the field intensity can increase by severaldecades before reaching the ionization threshold. Notethat for anomalous GVD, the collapse process, which en-compasses spatial and temporal compressions, makes theintermediate zone II almost meaningless.
C. Saturation by plasma defocusing
The action of MPI is to deplete the pulse temporal pro-file through the sudden emergence of an ionization frontnear the focus point zc. In the absence of time dispersionand nonlinear losses, the plasma equation ∂tρ = Γ|ψ|2Kcan be integrated with the ansatz (61) as
ρ(r, t, z) ≃√
π
8KΓ
(Pin
PcrR2
)KErf(
√2Kt) + 1
L2K(z, t), (64)
where Erf(x) = (2/√π)∫ x0
e−u2
du denotes the errorfunction. The last term of Eq. (62a) then scales asL2(1−K)∂ξρ where ∂ξρ ∼ ∂ξR
2K is negative. As L → 0,this term efficiently competes with the Kerr contribution
J ∼ Pine−2t2/Pcr. With the step function Erf(√
2Kt)+1,the plasma response arises like a defocusing plateau, asthe field intensity reaches its maximum near the focus
15
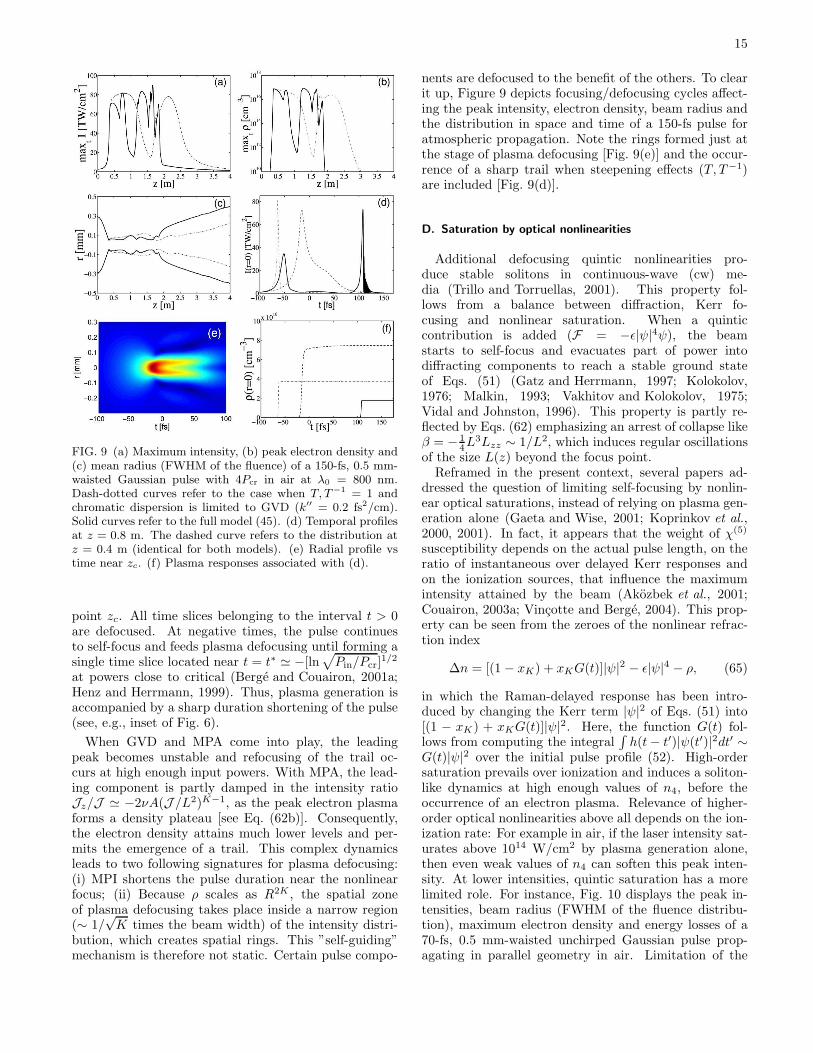
FIG. 9 (a) Maximum intensity, (b) peak electron density and(c) mean radius (FWHM of the fluence) of a 150-fs, 0.5 mm-waisted Gaussian pulse with 4Pcr in air at λ0 = 800 nm.Dash-dotted curves refer to the case when T, T−1 = 1 andchromatic dispersion is limited to GVD (k′′ = 0.2 fs2/cm).Solid curves refer to the full model (45). (d) Temporal profilesat z = 0.8 m. The dashed curve refers to the distribution atz = 0.4 m (identical for both models). (e) Radial profile vstime near zc. (f) Plasma responses associated with (d).
point zc. All time slices belonging to the interval t > 0are defocused. At negative times, the pulse continuesto self-focus and feeds plasma defocusing until forming asingle time slice located near t = t∗ ≃ −[ln
√Pin/Pcr]
1/2
at powers close to critical (Berge and Couairon, 2001a;Henz and Herrmann, 1999). Thus, plasma generation isaccompanied by a sharp duration shortening of the pulse(see, e.g., inset of Fig. 6).
When GVD and MPA come into play, the leadingpeak becomes unstable and refocusing of the trail oc-curs at high enough input powers. With MPA, the lead-ing component is partly damped in the intensity ratioJz/J ≃ −2νA(J /L2)K−1, as the peak electron plasmaforms a density plateau [see Eq. (62b)]. Consequently,the electron density attains much lower levels and per-mits the emergence of a trail. This complex dynamicsleads to two following signatures for plasma defocusing:(i) MPI shortens the pulse duration near the nonlinearfocus; (ii) Because ρ scales as R2K , the spatial zoneof plasma defocusing takes place inside a narrow region(∼ 1/
√K times the beam width) of the intensity distri-
bution, which creates spatial rings. This ”self-guiding”mechanism is therefore not static. Certain pulse compo-
nents are defocused to the benefit of the others. To clearit up, Figure 9 depicts focusing/defocusing cycles affect-ing the peak intensity, electron density, beam radius andthe distribution in space and time of a 150-fs pulse foratmospheric propagation. Note the rings formed just atthe stage of plasma defocusing [Fig. 9(e)] and the occur-rence of a sharp trail when steepening effects (T, T−1)are included [Fig. 9(d)].
D. Saturation by optical nonlinearities
Additional defocusing quintic nonlinearities pro-duce stable solitons in continuous-wave (cw) me-dia (Trillo and Torruellas, 2001). This property fol-lows from a balance between diffraction, Kerr fo-cusing and nonlinear saturation. When a quinticcontribution is added (F = −ǫ|ψ|4ψ), the beamstarts to self-focus and evacuates part of power intodiffracting components to reach a stable ground stateof Eqs. (51) (Gatz and Herrmann, 1997; Kolokolov,1976; Malkin, 1993; Vakhitov and Kolokolov, 1975;Vidal and Johnston, 1996). This property is partly re-flected by Eqs. (62) emphasizing an arrest of collapse likeβ = − 1
4L3Lzz ∼ 1/L2, which induces regular oscillations
of the size L(z) beyond the focus point.Reframed in the present context, several papers ad-
dressed the question of limiting self-focusing by nonlin-ear optical saturations, instead of relying on plasma gen-eration alone (Gaeta and Wise, 2001; Koprinkov et al.,2000, 2001). In fact, it appears that the weight of χ(5)
susceptibility depends on the actual pulse length, on theratio of instantaneous over delayed Kerr responses andon the ionization sources, that influence the maximumintensity attained by the beam (Akozbek et al., 2001;Couairon, 2003a; Vincotte and Berge, 2004). This prop-erty can be seen from the zeroes of the nonlinear refrac-tion index
∆n = [(1 − xK) + xKG(t)]|ψ|2 − ǫ|ψ|4 − ρ, (65)
in which the Raman-delayed response has been intro-duced by changing the Kerr term |ψ|2 of Eqs. (51) into[(1 − xK) + xKG(t)]|ψ|2. Here, the function G(t) fol-lows from computing the integral
∫h(t− t′)|ψ(t′)|2dt′ ∼
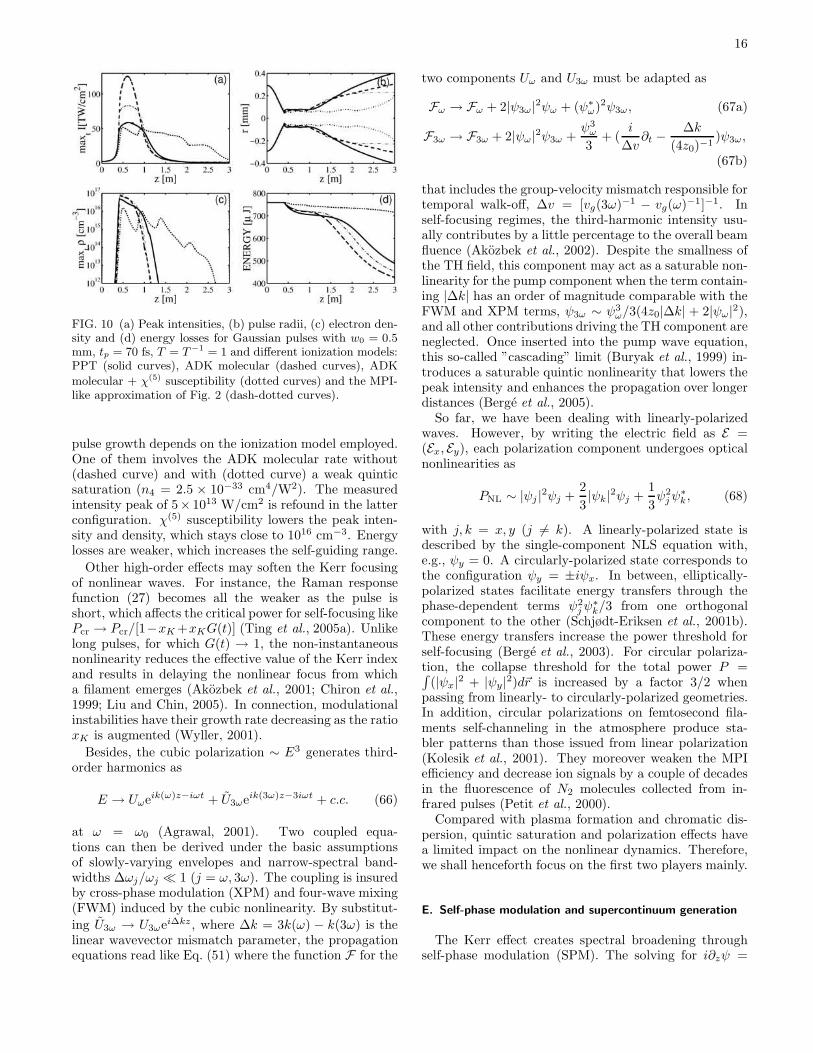
G(t)|ψ|2 over the initial pulse profile (52). High-ordersaturation prevails over ionization and induces a soliton-like dynamics at high enough values of n4, before theoccurrence of an electron plasma. Relevance of higher-order optical nonlinearities above all depends on the ion-ization rate: For example in air, if the laser intensity sat-urates above 1014 W/cm2 by plasma generation alone,then even weak values of n4 can soften this peak inten-sity. At lower intensities, quintic saturation has a morelimited role. For instance, Fig. 10 displays the peak in-tensities, beam radius (FWHM of the fluence distribu-tion), maximum electron density and energy losses of a70-fs, 0.5 mm-waisted unchirped Gaussian pulse prop-agating in parallel geometry in air. Limitation of the
16
FIG. 10 (a) Peak intensities, (b) pulse radii, (c) electron den-sity and (d) energy losses for Gaussian pulses with w0 = 0.5mm, tp = 70 fs, T = T−1 = 1 and different ionization models:PPT (solid curves), ADK molecular (dashed curves), ADK
molecular + χ(5) susceptibility (dotted curves) and the MPI-like approximation of Fig. 2 (dash-dotted curves).
pulse growth depends on the ionization model employed.One of them involves the ADK molecular rate without(dashed curve) and with (dotted curve) a weak quinticsaturation (n4 = 2.5 × 10⁻³³ cm4/W2). The measuredintensity peak of 5× 10¹³ W/cm2 is refound in the latterconfiguration. χ(5) susceptibility lowers the peak inten-sity and density, which stays close to 1016 cm−3. Energylosses are weaker, which increases the self-guiding range.
Other high-order effects may soften the Kerr focusingof nonlinear waves. For instance, the Raman responsefunction (27) becomes all the weaker as the pulse isshort, which affects the critical power for self-focusing likePcr → Pcr/[1−xK+xKG(t)] (Ting et al., 2005a). Unlikelong pulses, for which G(t) → 1, the non-instantaneousnonlinearity reduces the effective value of the Kerr indexand results in delaying the nonlinear focus from whicha filament emerges (Akozbek et al., 2001; Chiron et al.,1999; Liu and Chin, 2005). In connection, modulationalinstabilities have their growth rate decreasing as the ratioxK is augmented (Wyller, 2001).
Besides, the cubic polarization ∼ E3 generates third-order harmonics as
E → Uωeik(ω)z−iωt + U3ωeik(3ω)z−3iωt + c.c. (66)
at ω = ω0 (Agrawal, 2001). Two coupled equa-tions can then be derived under the basic assumptionsof slowly-varying envelopes and narrow-spectral band-widths ∆ωj/ωj ≪ 1 (j = ω, 3ω). The coupling is insuredby cross-phase modulation (XPM) and four-wave mixing(FWM) induced by the cubic nonlinearity. By substitut-
ing U3ω → U3ωei∆kz , where ∆k = 3k(ω) − k(3ω) is thelinear wavevector mismatch parameter, the propagationequations read like Eq. (51) where the function F for the
two components Uω and U3ω must be adapted as
Fω → Fω + 2|ψ3ω|2ψω + (ψ∗ω)2ψ3ω, (67a)
F3ω → F3ω + 2|ψω|2ψ3ω +ψ3ω
3+ (
i
∆v∂t −
∆k
(4z0)−1)ψ3ω,
(67b)
that includes the group-velocity mismatch responsible fortemporal walk-off, ∆v = [vg(3ω)−1 − vg(ω)−1]−1. Inself-focusing regimes, the third-harmonic intensity usu-ally contributes by a little percentage to the overall beamfluence (Akozbek et al., 2002). Despite the smallness ofthe TH field, this component may act as a saturable non-linearity for the pump component when the term contain-ing |∆k| has an order of magnitude comparable with theFWM and XPM terms, ψ3ω ∼ ψ3
ω/3(4z0|∆k| + 2|ψω|2),and all other contributions driving the TH component areneglected. Once inserted into the pump wave equation,this so-called ”cascading” limit (Buryak et al., 1999) in-troduces a saturable quintic nonlinearity that lowers thepeak intensity and enhances the propagation over longerdistances (Berge et al., 2005).
So far, we have been dealing with linearly-polarizedwaves. However, by writing the electric field as E =(Ex, Ey), each polarization component undergoes opticalnonlinearities as
PNL ∼ |ψj |2ψj +2
3|ψk|2ψj +
1
3ψ2jψ
∗k, (68)
with j, k = x, y (j 6= k). A linearly-polarized state isdescribed by the single-component NLS equation with,e.g., ψy = 0. A circularly-polarized state corresponds tothe configuration ψy = ±iψx. In between, elliptically-polarized states facilitate energy transfers through thephase-dependent terms ψ2
jψ∗k/3 from one orthogonal
component to the other (Schjødt-Eriksen et al., 2001b).These energy transfers increase the power threshold forself-focusing (Berge et al., 2003). For circular polariza-tion, the collapse threshold for the total power P =∫(|ψx|2 + |ψy|2)d~r is increased by a factor 3/2 when
passing from linearly- to circularly-polarized geometries.In addition, circular polarizations on femtosecond fila-ments self-channeling in the atmosphere produce sta-bler patterns than those issued from linear polarization(Kolesik et al., 2001). They moreover weaken the MPIefficiency and decrease ion signals by a couple of decadesin the fluorescence of N2 molecules collected from in-frared pulses (Petit et al., 2000).
Compared with plasma formation and chromatic dis-persion, quintic saturation and polarization effects havea limited impact on the nonlinear dynamics. Therefore,we shall henceforth focus on the first two players mainly.
E. Self-phase modulation and supercontinuum generation
The Kerr effect creates spectral broadening throughself-phase modulation (SPM). The solving for i∂zψ =
17
−|ψ|2ψ indeed yields the exact solution ψ = ψ0ei|ψ0|2z
[ψ0 ≡ ψ(z = 0)], which describes a self-induced phasemodulation experienced by the optical field during itspropagation. This intensity-dependent phase shift is re-sponsible for spectral broadening by virtue of the relation∆ω = −∂targ(ψ) (Agrawal, 2001; Shen, 1984). Becausethe frequency spectrum is expanded by the nonlinearity,SPM leads to supercontinuum generation and white-lightemission, as the wave intensity strongly increases throughthe self-focusing process. With plasma generation, thisphenomenon can be described by employing the followingapproximations. First, we assume that the MPI responsebehaves like a static density plateau [see, e.g., Fig. 9(f)],so that the ratio ρ/|ψ|2 is either zero or close to unitywith ∂z(ρ/|ψ|2) ≃ 0. Second, omitting GVD and MPAfor simplicity we retain self-steepening to the detriment ofspace-time focusing, i.e., we neglect diffraction in Kerr-dominated regimes. Phase and amplitude of solutions
ψ = Aeiϕ to Eq. (51a) satisfy ϕz + A2
tpω0∂tϕ = A2 − ρ
and Az + 3tpω0
A2∂tA = 0, respectively. If we model the
pulse initially located at t = t0 by A2 = A20/cosh(τ),
τ = (t− t0)/τ0, and suppose that the amplitude does notchange too much, then
A2 ≃ A20/cosh(τ − 3QA2/A2
0), (69a)
ϕ ≃ tpω0τ0
∫ τ
−∞
(1 − ρ
A2
)dτ ′
− tpω0sinh−1[sinh(τ) −Q],
(69b)
whereQ ≡ zA20/tpω0τ0 is linked to self-steepening. These
expressions yield the spectral broadening
∆λ
λ0≃ 1 − ρ
A2−[1 +
Q2 − 2Qsinh(τ)
cosh2(τ)
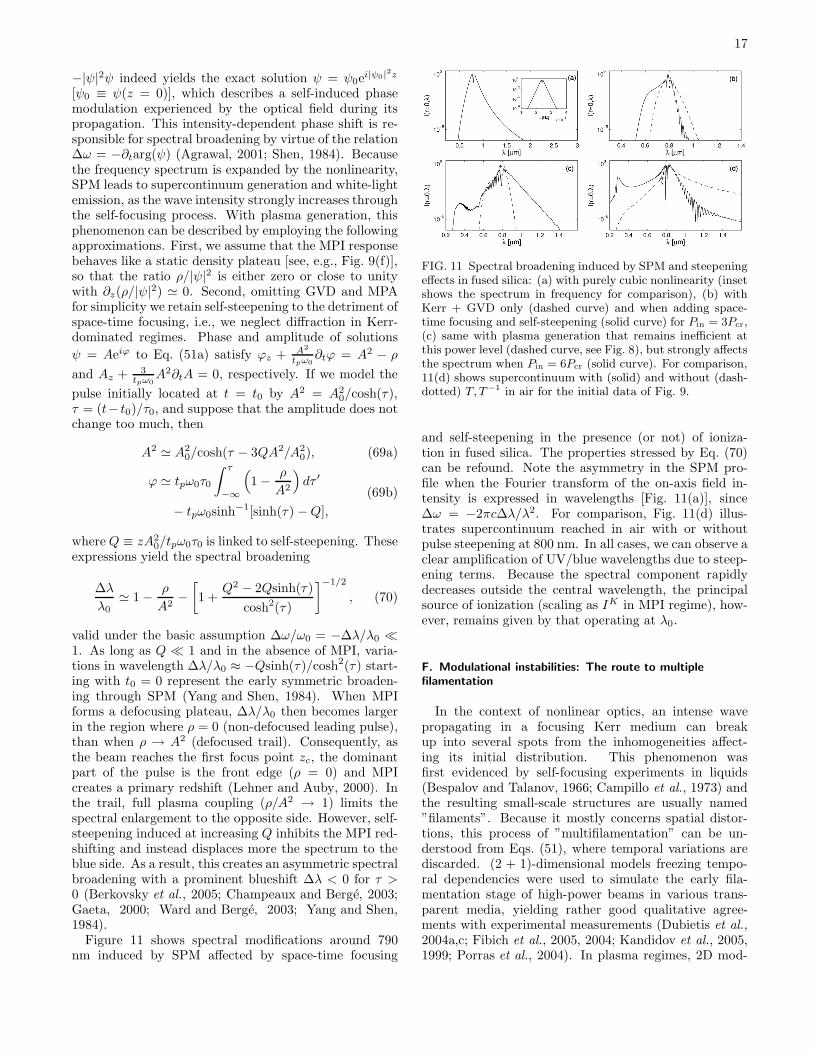
]−1/2
, (70)
valid under the basic assumption ∆ω/ω0 = −∆λ/λ0 ≪1. As long as Q ≪ 1 and in the absence of MPI, varia-tions in wavelength ∆λ/λ0 ≈ −Qsinh(τ)/cosh2(τ) start-ing with t0 = 0 represent the early symmetric broaden-ing through SPM (Yang and Shen, 1984). When MPIforms a defocusing plateau, ∆λ/λ0 then becomes largerin the region where ρ = 0 (non-defocused leading pulse),than when ρ → A2 (defocused trail). Consequently, asthe beam reaches the first focus point zc, the dominantpart of the pulse is the front edge (ρ = 0) and MPIcreates a primary redshift (Lehner and Auby, 2000). Inthe trail, full plasma coupling (ρ/A2 → 1) limits thespectral enlargement to the opposite side. However, self-steepening induced at increasing Q inhibits the MPI red-shifting and instead displaces more the spectrum to theblue side. As a result, this creates an asymmetric spectralbroadening with a prominent blueshift ∆λ < 0 for τ >0 (Berkovsky et al., 2005; Champeaux and Berge, 2003;Gaeta, 2000; Ward and Berge, 2003; Yang and Shen,1984).
Figure 11 shows spectral modifications around 790nm induced by SPM affected by space-time focusing
FIG. 11 Spectral broadening induced by SPM and steepeningeffects in fused silica: (a) with purely cubic nonlinearity (insetshows the spectrum in frequency for comparison), (b) withKerr + GVD only (dashed curve) and when adding space-time focusing and self-steepening (solid curve) for Pin = 3Pcr,(c) same with plasma generation that remains inefficient atthis power level (dashed curve, see Fig. 8), but strongly affectsthe spectrum when Pin = 6Pcr (solid curve). For comparison,11(d) shows supercontinuum with (solid) and without (dash-dotted) T, T−1 in air for the initial data of Fig. 9.
and self-steepening in the presence (or not) of ioniza-tion in fused silica. The properties stressed by Eq. (70)can be refound. Note the asymmetry in the SPM pro-file when the Fourier transform of the on-axis field in-tensity is expressed in wavelengths [Fig. 11(a)], since∆ω = −2πc∆λ/λ2. For comparison, Fig. 11(d) illus-trates supercontinuum reached in air with or withoutpulse steepening at 800 nm. In all cases, we can observe aclear amplification of UV/blue wavelengths due to steep-ening terms. Because the spectral component rapidlydecreases outside the central wavelength, the principalsource of ionization (scaling as IK in MPI regime), how-ever, remains given by that operating at λ0.
F. Modulational instabilities: The route to multiplefilamentation
In the context of nonlinear optics, an intense wavepropagating in a focusing Kerr medium can breakup into several spots from the inhomogeneities affect-ing its initial distribution. This phenomenon wasfirst evidenced by self-focusing experiments in liquids(Bespalov and Talanov, 1966; Campillo et al., 1973) andthe resulting small-scale structures are usually named”filaments”. Because it mostly concerns spatial distor-tions, this process of ”multifilamentation” can be un-derstood from Eqs. (51), where temporal variations arediscarded. (2 + 1)-dimensional models freezing tempo-ral dependencies were used to simulate the early fila-mentation stage of high-power beams in various trans-parent media, yielding rather good qualitative agree-ments with experimental measurements (Dubietis et al.,2004a,c; Fibich et al., 2005, 2004; Kandidov et al., 2005,1999; Porras et al., 2004). In plasma regimes, 2D mod-
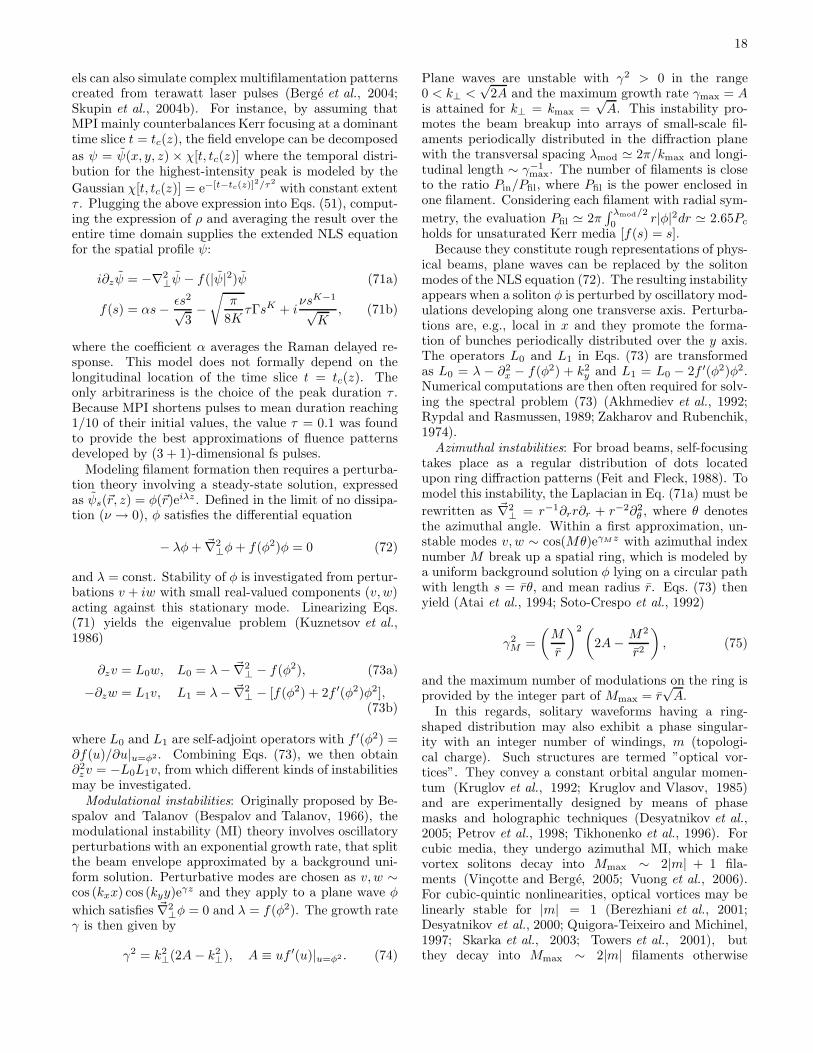
18
els can also simulate complex multifilamentation patternscreated from terawatt laser pulses (Berge et al., 2004;Skupin et al., 2004b). For instance, by assuming thatMPI mainly counterbalances Kerr focusing at a dominanttime slice t = tc(z), the field envelope can be decomposed
as ψ = ψ(x, y, z) × χ[t, tc(z)] where the temporal distri-bution for the highest-intensity peak is modeled by the
Gaussian χ[t, tc(z)] = e−[t−tc(z)]2/τ2
with constant extentτ . Plugging the above expression into Eqs. (51), comput-ing the expression of ρ and averaging the result over theentire time domain supplies the extended NLS equationfor the spatial profile ψ:
i∂zψ = −∇2⊥ψ − f(|ψ|2)ψ (71a)
f(s) = αs− ǫs2√3−√
π
8KτΓsK + i
νsK−1
√K
, (71b)
where the coefficient α averages the Raman delayed re-sponse. This model does not formally depend on thelongitudinal location of the time slice t = tc(z). Theonly arbitrariness is the choice of the peak duration τ .Because MPI shortens pulses to mean duration reaching1/10 of their initial values, the value τ = 0.1 was foundto provide the best approximations of fluence patternsdeveloped by (3 + 1)-dimensional fs pulses.
Modeling filament formation then requires a perturba-tion theory involving a steady-state solution, expressedas ψs(~r, z) = φ(~r)eiλz . Defined in the limit of no dissipa-tion (ν → 0), φ satisfies the differential equation
− λφ+ ~∇2⊥φ+ f(φ2)φ = 0 (72)
and λ = const. Stability of φ is investigated from pertur-bations v + iw with small real-valued components (v, w)acting against this stationary mode. Linearizing Eqs.(71) yields the eigenvalue problem (Kuznetsov et al.,1986)
∂zv = L0w, L0 = λ− ~∇2⊥ − f(φ2), (73a)
−∂zw = L1v, L1 = λ− ~∇2⊥ − [f(φ2) + 2f ′(φ2)φ2],
(73b)
where L0 and L1 are self-adjoint operators with f ′(φ2) =∂f(u)/∂u|u=φ2. Combining Eqs. (73), we then obtain∂2zv = −L0L1v, from which different kinds of instabilities
may be investigated.Modulational instabilities: Originally proposed by Be-
spalov and Talanov (Bespalov and Talanov, 1966), themodulational instability (MI) theory involves oscillatoryperturbations with an exponential growth rate, that splitthe beam envelope approximated by a background uni-form solution. Perturbative modes are chosen as v, w ∼cos (kxx) cos (kyy)e
γz and they apply to a plane wave φ
which satisfies ~∇2⊥φ = 0 and λ = f(φ2). The growth rate
γ is then given by
γ2 = k2⊥(2A− k2
⊥), A ≡ uf ′(u)|u=φ2 . (74)
Plane waves are unstable with γ2 > 0 in the range0 < k⊥ <
√2A and the maximum growth rate γmax = A
is attained for k⊥ = kmax =√A. This instability pro-
motes the beam breakup into arrays of small-scale fil-aments periodically distributed in the diffraction planewith the transversal spacing λmod ≃ 2π/kmax and longi-tudinal length ∼ γ−1
max. The number of filaments is closeto the ratio Pin/Pfil, where Pfil is the power enclosed inone filament. Considering each filament with radial sym-
metry, the evaluation Pfil ≃ 2π∫ λmod/2
0r|φ|2dr ≃ 2.65Pc
holds for unsaturated Kerr media [f(s) = s].Because they constitute rough representations of phys-
ical beams, plane waves can be replaced by the solitonmodes of the NLS equation (72). The resulting instabilityappears when a soliton φ is perturbed by oscillatory mod-ulations developing along one transverse axis. Perturba-tions are, e.g., local in x and they promote the forma-tion of bunches periodically distributed over the y axis.The operators L0 and L1 in Eqs. (73) are transformedas L0 = λ − ∂2
x − f(φ2) + k2y and L1 = L0 − 2f ′(φ2)φ2.
Numerical computations are then often required for solv-ing the spectral problem (73) (Akhmediev et al., 1992;Rypdal and Rasmussen, 1989; Zakharov and Rubenchik,1974).
Azimuthal instabilities: For broad beams, self-focusingtakes place as a regular distribution of dots locatedupon ring diffraction patterns (Feit and Fleck, 1988). Tomodel this instability, the Laplacian in Eq. (71a) must be
rewritten as ~∇2⊥ = r−1∂rr∂r + r−2∂2
θ , where θ denotesthe azimuthal angle. Within a first approximation, un-stable modes v, w ∼ cos(Mθ)eγMz with azimuthal indexnumber M break up a spatial ring, which is modeled bya uniform background solution φ lying on a circular pathwith length s = rθ, and mean radius r. Eqs. (73) thenyield (Atai et al., 1994; Soto-Crespo et al., 1992)
γ2M =
(M
r
)2(2A− M2
r2
), (75)
and the maximum number of modulations on the ring isprovided by the integer part of Mmax = r
√A.
In this regards, solitary waveforms having a ring-shaped distribution may also exhibit a phase singular-ity with an integer number of windings, m (topologi-cal charge). Such structures are termed ”optical vor-tices”. They convey a constant orbital angular momen-tum (Kruglov et al., 1992; Kruglov and Vlasov, 1985)and are experimentally designed by means of phasemasks and holographic techniques (Desyatnikov et al.,2005; Petrov et al., 1998; Tikhonenko et al., 1996). Forcubic media, they undergo azimuthal MI, which makevortex solitons decay into Mmax ∼ 2|m| + 1 fila-ments (Vincotte and Berge, 2005; Vuong et al., 2006).For cubic-quintic nonlinearities, optical vortices may belinearly stable for |m| = 1 (Berezhiani et al., 2001;Desyatnikov et al., 2000; Quigora-Teixeiro and Michinel,1997; Skarka et al., 2003; Towers et al., 2001), butthey decay into Mmax ∼ 2|m| filaments otherwise
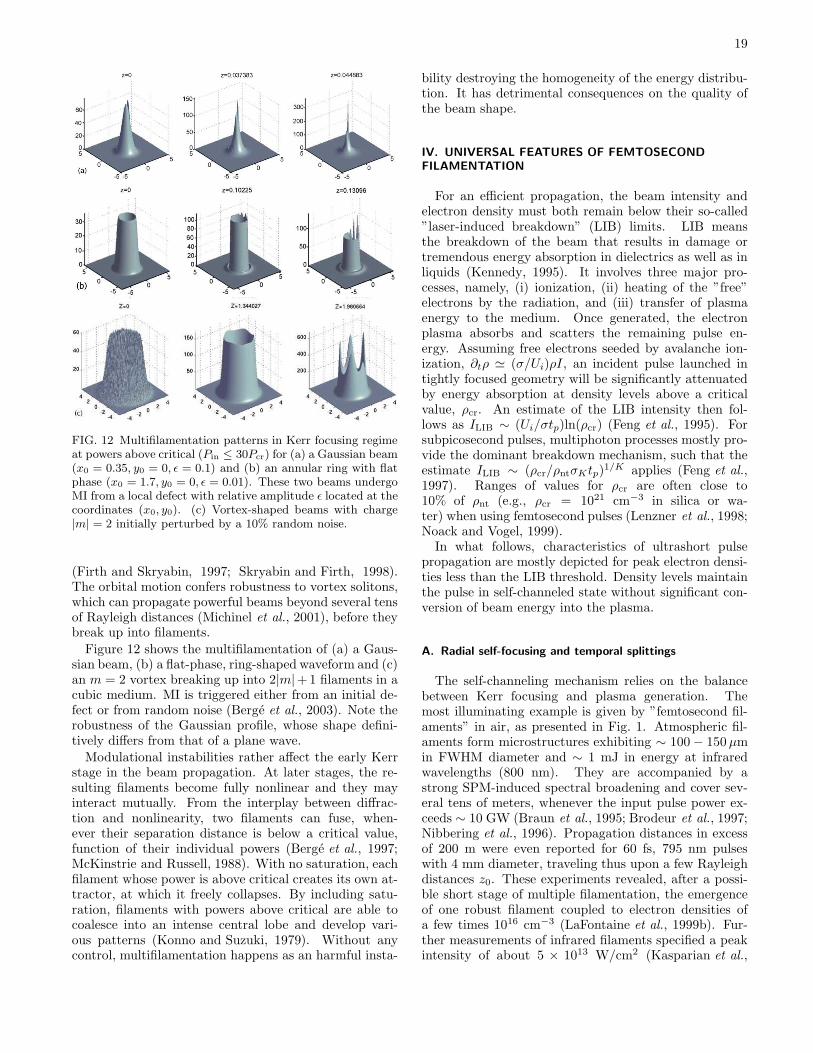
19
FIG. 12 Multifilamentation patterns in Kerr focusing regimeat powers above critical (Pin ≤ 30Pcr) for (a) a Gaussian beam(x0 = 0.35, y0 = 0, ǫ = 0.1) and (b) an annular ring with flatphase (x0 = 1.7, y0 = 0, ǫ = 0.01). These two beams undergoMI from a local defect with relative amplitude ǫ located at thecoordinates (x0, y0). (c) Vortex-shaped beams with charge|m| = 2 initially perturbed by a 10% random noise.
(Firth and Skryabin, 1997; Skryabin and Firth, 1998).The orbital motion confers robustness to vortex solitons,which can propagate powerful beams beyond several tensof Rayleigh distances (Michinel et al., 2001), before theybreak up into filaments.
Figure 12 shows the multifilamentation of (a) a Gaus-sian beam, (b) a flat-phase, ring-shaped waveform and (c)an m = 2 vortex breaking up into 2|m|+1 filaments in acubic medium. MI is triggered either from an initial de-fect or from random noise (Berge et al., 2003). Note therobustness of the Gaussian profile, whose shape defini-tively differs from that of a plane wave.
Modulational instabilities rather affect the early Kerrstage in the beam propagation. At later stages, the re-sulting filaments become fully nonlinear and they mayinteract mutually. From the interplay between diffrac-tion and nonlinearity, two filaments can fuse, when-ever their separation distance is below a critical value,function of their individual powers (Berge et al., 1997;McKinstrie and Russell, 1988). With no saturation, eachfilament whose power is above critical creates its own at-tractor, at which it freely collapses. By including satu-ration, filaments with powers above critical are able tocoalesce into an intense central lobe and develop vari-ous patterns (Konno and Suzuki, 1979). Without anycontrol, multifilamentation happens as an harmful insta-
bility destroying the homogeneity of the energy distribu-tion. It has detrimental consequences on the quality ofthe beam shape.
IV. UNIVERSAL FEATURES OF FEMTOSECONDFILAMENTATION
For an efficient propagation, the beam intensity andelectron density must both remain below their so-called”laser-induced breakdown” (LIB) limits. LIB meansthe breakdown of the beam that results in damage ortremendous energy absorption in dielectrics as well as inliquids (Kennedy, 1995). It involves three major pro-cesses, namely, (i) ionization, (ii) heating of the ”free”electrons by the radiation, and (iii) transfer of plasmaenergy to the medium. Once generated, the electronplasma absorbs and scatters the remaining pulse en-ergy. Assuming free electrons seeded by avalanche ion-ization, ∂tρ ≃ (σ/Ui)ρI, an incident pulse launched intightly focused geometry will be significantly attenuatedby energy absorption at density levels above a criticalvalue, ρcr. An estimate of the LIB intensity then fol-lows as ILIB ∼ (Ui/σtp)ln(ρcr) (Feng et al., 1995). Forsubpicosecond pulses, multiphoton processes mostly pro-vide the dominant breakdown mechanism, such that theestimate ILIB ∼ (ρcr/ρntσKtp)
1/K applies (Feng et al.,1997). Ranges of values for ρcr are often close to10% of ρnt (e.g., ρcr = 1021 cm−3 in silica or wa-ter) when using femtosecond pulses (Lenzner et al., 1998;Noack and Vogel, 1999).
In what follows, characteristics of ultrashort pulsepropagation are mostly depicted for peak electron densi-ties less than the LIB threshold. Density levels maintainthe pulse in self-channeled state without significant con-version of beam energy into the plasma.
A. Radial self-focusing and temporal splittings
The self-channeling mechanism relies on the balancebetween Kerr focusing and plasma generation. Themost illuminating example is given by ”femtosecond fil-aments” in air, as presented in Fig. 1. Atmospheric fil-aments form microstructures exhibiting ∼ 100 − 150µmin FWHM diameter and ∼ 1 mJ in energy at infraredwavelengths (800 nm). They are accompanied by astrong SPM-induced spectral broadening and cover sev-eral tens of meters, whenever the input pulse power ex-ceeds ∼ 10 GW (Braun et al., 1995; Brodeur et al., 1997;Nibbering et al., 1996). Propagation distances in excessof 200 m were even reported for 60 fs, 795 nm pulseswith 4 mm diameter, traveling thus upon a few Rayleighdistances z0. These experiments revealed, after a possi-ble short stage of multiple filamentation, the emergenceof one robust filament coupled to electron densities ofa few times 1016 cm−3 (LaFontaine et al., 1999b). Fur-ther measurements of infrared filaments specified a peakintensity of about 5 × 10¹³ W/cm2 (Kasparian et al.,
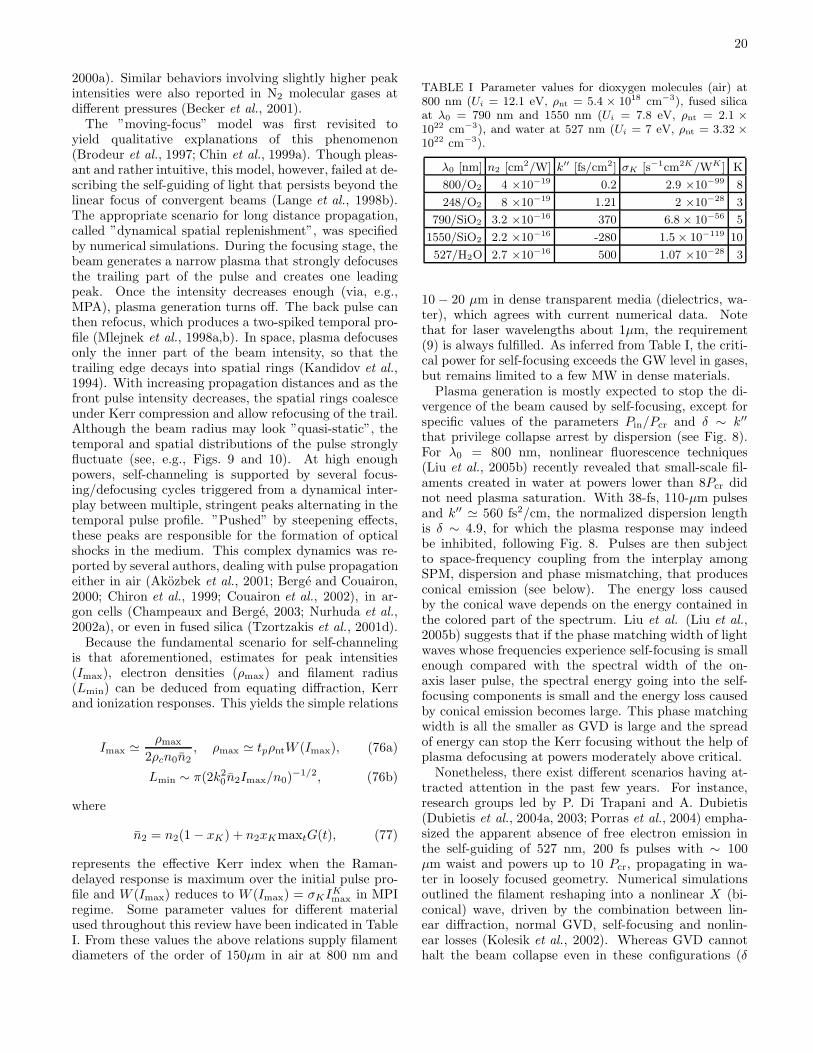
20
2000a). Similar behaviors involving slightly higher peakintensities were also reported in N2 molecular gases atdifferent pressures (Becker et al., 2001).
The ”moving-focus” model was first revisited toyield qualitative explanations of this phenomenon(Brodeur et al., 1997; Chin et al., 1999a). Though pleas-ant and rather intuitive, this model, however, failed at de-scribing the self-guiding of light that persists beyond thelinear focus of convergent beams (Lange et al., 1998b).The appropriate scenario for long distance propagation,called ”dynamical spatial replenishment”, was specifiedby numerical simulations. During the focusing stage, thebeam generates a narrow plasma that strongly defocusesthe trailing part of the pulse and creates one leadingpeak. Once the intensity decreases enough (via, e.g.,MPA), plasma generation turns off. The back pulse canthen refocus, which produces a two-spiked temporal pro-file (Mlejnek et al., 1998a,b). In space, plasma defocusesonly the inner part of the beam intensity, so that thetrailing edge decays into spatial rings (Kandidov et al.,1994). With increasing propagation distances and as thefront pulse intensity decreases, the spatial rings coalesceunder Kerr compression and allow refocusing of the trail.Although the beam radius may look ”quasi-static”, thetemporal and spatial distributions of the pulse stronglyfluctuate (see, e.g., Figs. 9 and 10). At high enoughpowers, self-channeling is supported by several focus-ing/defocusing cycles triggered from a dynamical inter-play between multiple, stringent peaks alternating in thetemporal pulse profile. ”Pushed” by steepening effects,these peaks are responsible for the formation of opticalshocks in the medium. This complex dynamics was re-ported by several authors, dealing with pulse propagationeither in air (Akozbek et al., 2001; Berge and Couairon,2000; Chiron et al., 1999; Couairon et al., 2002), in ar-gon cells (Champeaux and Berge, 2003; Nurhuda et al.,2002a), or even in fused silica (Tzortzakis et al., 2001d).
Because the fundamental scenario for self-channelingis that aforementioned, estimates for peak intensities(Imax), electron densities (ρmax) and filament radius(Lmin) can be deduced from equating diffraction, Kerrand ionization responses. This yields the simple relations
Imax ≃ ρmax
2ρcn0n2, ρmax ≃ tpρntW (Imax), (76a)
Lmin ∼ π(2k20n2Imax/n0)
−1/2, (76b)
where
n2 = n2(1 − xK) + n2xKmaxtG(t), (77)
represents the effective Kerr index when the Raman-delayed response is maximum over the initial pulse pro-file and W (Imax) reduces to W (Imax) = σKI
Kmax in MPI
regime. Some parameter values for different materialused throughout this review have been indicated in TableI. From these values the above relations supply filamentdiameters of the order of 150µm in air at 800 nm and
TABLE I Parameter values for dioxygen molecules (air) at800 nm (Ui = 12.1 eV, ρnt = 5.4 × 1018 cm−3), fused silicaat λ0 = 790 nm and 1550 nm (Ui = 7.8 eV, ρnt = 2.1 ×1022 cm−3), and water at 527 nm (Ui = 7 eV, ρnt = 3.32 ×1022 cm−3).
λ0 [nm] n2 [cm2/W] k′′ [fs/cm2] σK [s−1cm2K/WK ] K
800/O2 4 ×10⁻¹⁹ 0.2 2.9 ×10−99 8
248/O2 8 ×10⁻¹⁹ 1.21 2 ×10⁻²⁸ 3
790/SiO2 3.2 ×10⁻¹⁶ 370 6.8 × 10−56 5
1550/SiO2 2.2 ×10⁻¹⁶ -280 1.5 × 10−119 10
527/H2O 2.7 ×10⁻¹⁶ 500 1.07 ×10⁻²⁸ 3
10 − 20 µm in dense transparent media (dielectrics, wa-ter), which agrees with current numerical data. Notethat for laser wavelengths about 1µm, the requirement(9) is always fulfilled. As inferred from Table I, the criti-cal power for self-focusing exceeds the GW level in gases,but remains limited to a few MW in dense materials.
Plasma generation is mostly expected to stop the di-vergence of the beam caused by self-focusing, except forspecific values of the parameters Pin/Pcr and δ ∼ k′′
that privilege collapse arrest by dispersion (see Fig. 8).For λ0 = 800 nm, nonlinear fluorescence techniques(Liu et al., 2005b) recently revealed that small-scale fil-aments created in water at powers lower than 8Pcr didnot need plasma saturation. With 38-fs, 110-µm pulsesand k′′ ≃ 560 fs2/cm, the normalized dispersion lengthis δ ∼ 4.9, for which the plasma response may indeedbe inhibited, following Fig. 8. Pulses are then subjectto space-frequency coupling from the interplay amongSPM, dispersion and phase mismatching, that producesconical emission (see below). The energy loss causedby the conical wave depends on the energy contained inthe colored part of the spectrum. Liu et al. (Liu et al.,2005b) suggests that if the phase matching width of lightwaves whose frequencies experience self-focusing is smallenough compared with the spectral width of the on-axis laser pulse, the spectral energy going into the self-focusing components is small and the energy loss causedby conical emission becomes large. This phase matchingwidth is all the smaller as GVD is large and the spreadof energy can stop the Kerr focusing without the help ofplasma defocusing at powers moderately above critical.
Nonetheless, there exist different scenarios having at-tracted attention in the past few years. For instance,research groups led by P. Di Trapani and A. Dubietis(Dubietis et al., 2004a, 2003; Porras et al., 2004) empha-sized the apparent absence of free electron emission inthe self-guiding of 527 nm, 200 fs pulses with ∼ 100µm waist and powers up to 10 Pcr, propagating in wa-ter in loosely focused geometry. Numerical simulationsoutlined the filament reshaping into a nonlinear X (bi-conical) wave, driven by the combination between lin-ear diffraction, normal GVD, self-focusing and nonlin-ear losses (Kolesik et al., 2002). Whereas GVD cannothalt the beam collapse even in these configurations (δ
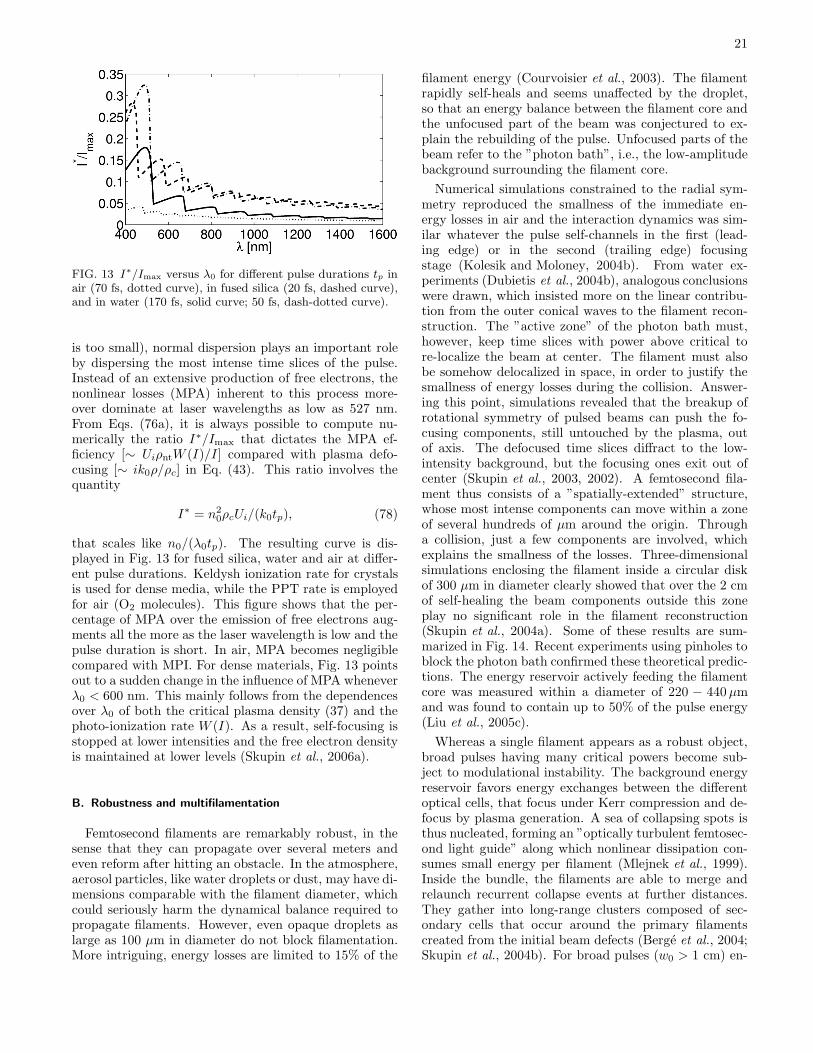
21
FIG. 13 I∗/Imax versus λ0 for different pulse durations tp inair (70 fs, dotted curve), in fused silica (20 fs, dashed curve),and in water (170 fs, solid curve; 50 fs, dash-dotted curve).
is too small), normal dispersion plays an important roleby dispersing the most intense time slices of the pulse.Instead of an extensive production of free electrons, thenonlinear losses (MPA) inherent to this process more-over dominate at laser wavelengths as low as 527 nm.From Eqs. (76a), it is always possible to compute nu-merically the ratio I∗/Imax that dictates the MPA ef-ficiency [∼ UiρntW (I)/I] compared with plasma defo-cusing [∼ ik0ρ/ρc] in Eq. (43). This ratio involves thequantity
I∗ = n20ρcUi/(k0tp), (78)
that scales like n0/(λ0tp). The resulting curve is dis-played in Fig. 13 for fused silica, water and air at differ-ent pulse durations. Keldysh ionization rate for crystalsis used for dense media, while the PPT rate is employedfor air (O2 molecules). This figure shows that the per-centage of MPA over the emission of free electrons aug-ments all the more as the laser wavelength is low and thepulse duration is short. In air, MPA becomes negligiblecompared with MPI. For dense materials, Fig. 13 pointsout to a sudden change in the influence of MPA wheneverλ0 < 600 nm. This mainly follows from the dependencesover λ0 of both the critical plasma density (37) and thephoto-ionization rate W (I). As a result, self-focusing isstopped at lower intensities and the free electron densityis maintained at lower levels (Skupin et al., 2006a).
B. Robustness and multifilamentation
Femtosecond filaments are remarkably robust, in thesense that they can propagate over several meters andeven reform after hitting an obstacle. In the atmosphere,aerosol particles, like water droplets or dust, may have di-mensions comparable with the filament diameter, whichcould seriously harm the dynamical balance required topropagate filaments. However, even opaque droplets aslarge as 100 µm in diameter do not block filamentation.More intriguing, energy losses are limited to 15% of the
filament energy (Courvoisier et al., 2003). The filamentrapidly self-heals and seems unaffected by the droplet,so that an energy balance between the filament core andthe unfocused part of the beam was conjectured to ex-plain the rebuilding of the pulse. Unfocused parts of thebeam refer to the ”photon bath”, i.e., the low-amplitudebackground surrounding the filament core.
Numerical simulations constrained to the radial sym-metry reproduced the smallness of the immediate en-ergy losses in air and the interaction dynamics was sim-ilar whatever the pulse self-channels in the first (lead-ing edge) or in the second (trailing edge) focusingstage (Kolesik and Moloney, 2004b). From water ex-periments (Dubietis et al., 2004b), analogous conclusionswere drawn, which insisted more on the linear contribu-tion from the outer conical waves to the filament recon-struction. The ”active zone” of the photon bath must,however, keep time slices with power above critical tore-localize the beam at center. The filament must alsobe somehow delocalized in space, in order to justify thesmallness of energy losses during the collision. Answer-ing this point, simulations revealed that the breakup ofrotational symmetry of pulsed beams can push the fo-cusing components, still untouched by the plasma, outof axis. The defocused time slices diffract to the low-intensity background, but the focusing ones exit out ofcenter (Skupin et al., 2003, 2002). A femtosecond fila-ment thus consists of a ”spatially-extended” structure,whose most intense components can move within a zoneof several hundreds of µm around the origin. Througha collision, just a few components are involved, whichexplains the smallness of the losses. Three-dimensionalsimulations enclosing the filament inside a circular diskof 300 µm in diameter clearly showed that over the 2 cmof self-healing the beam components outside this zoneplay no significant role in the filament reconstruction(Skupin et al., 2004a). Some of these results are sum-marized in Fig. 14. Recent experiments using pinholes toblock the photon bath confirmed these theoretical predic-tions. The energy reservoir actively feeding the filamentcore was measured within a diameter of 220 − 440µmand was found to contain up to 50% of the pulse energy(Liu et al., 2005c).
Whereas a single filament appears as a robust object,broad pulses having many critical powers become sub-ject to modulational instability. The background energyreservoir favors energy exchanges between the differentoptical cells, that focus under Kerr compression and de-focus by plasma generation. A sea of collapsing spots isthus nucleated, forming an ”optically turbulent femtosec-ond light guide” along which nonlinear dissipation con-sumes small energy per filament (Mlejnek et al., 1999).Inside the bundle, the filaments are able to merge andrelaunch recurrent collapse events at further distances.They gather into long-range clusters composed of sec-ondary cells that occur around the primary filamentscreated from the initial beam defects (Berge et al., 2004;Skupin et al., 2004b). For broad pulses (w0 > 1 cm) en-
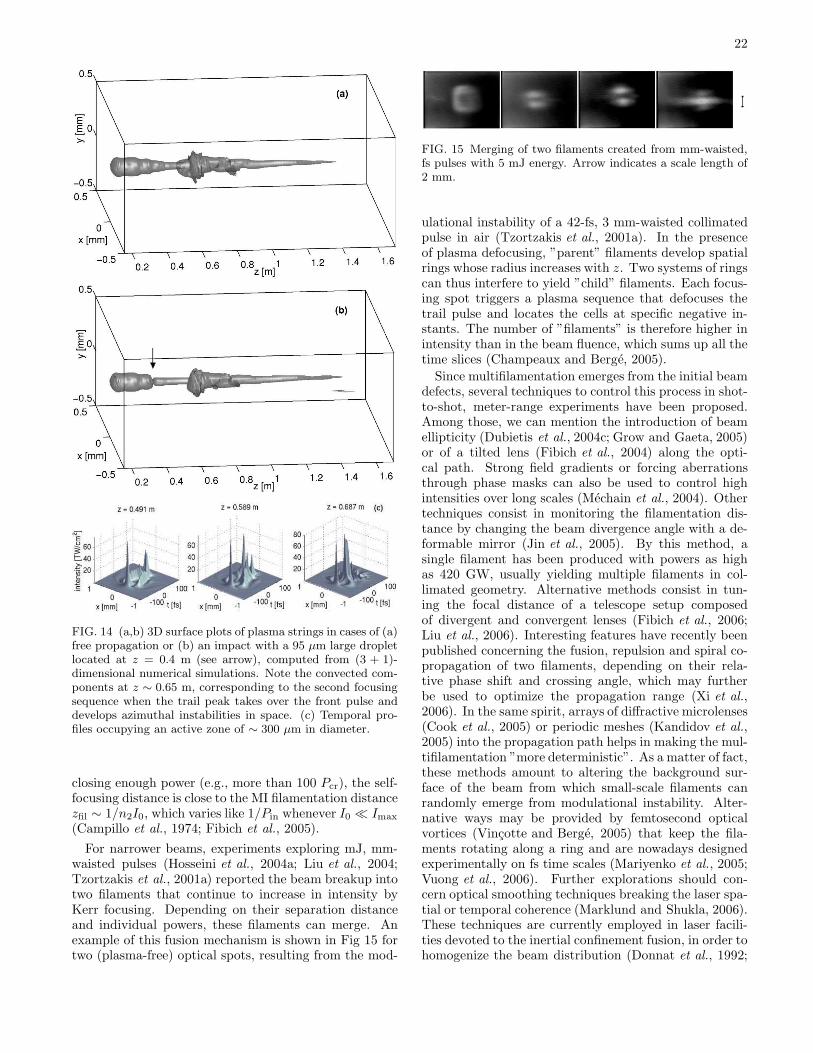
22
FIG. 14 (a,b) 3D surface plots of plasma strings in cases of (a)free propagation or (b) an impact with a 95 µm large dropletlocated at z = 0.4 m (see arrow), computed from (3 + 1)-dimensional numerical simulations. Note the convected com-ponents at z ∼ 0.65 m, corresponding to the second focusingsequence when the trail peak takes over the front pulse anddevelops azimuthal instabilities in space. (c) Temporal pro-files occupying an active zone of ∼ 300 µm in diameter.
closing enough power (e.g., more than 100 Pcr), the self-focusing distance is close to the MI filamentation distancezfil ∼ 1/n2I0, which varies like 1/Pin whenever I0 ≪ Imax
(Campillo et al., 1974; Fibich et al., 2005).
For narrower beams, experiments exploring mJ, mm-waisted pulses (Hosseini et al., 2004a; Liu et al., 2004;Tzortzakis et al., 2001a) reported the beam breakup intotwo filaments that continue to increase in intensity byKerr focusing. Depending on their separation distanceand individual powers, these filaments can merge. Anexample of this fusion mechanism is shown in Fig 15 fortwo (plasma-free) optical spots, resulting from the mod-
FIG. 15 Merging of two filaments created from mm-waisted,fs pulses with 5 mJ energy. Arrow indicates a scale length of2 mm.
ulational instability of a 42-fs, 3 mm-waisted collimatedpulse in air (Tzortzakis et al., 2001a). In the presenceof plasma defocusing, ”parent” filaments develop spatialrings whose radius increases with z. Two systems of ringscan thus interfere to yield ”child” filaments. Each focus-ing spot triggers a plasma sequence that defocuses thetrail pulse and locates the cells at specific negative in-stants. The number of ”filaments” is therefore higher inintensity than in the beam fluence, which sums up all thetime slices (Champeaux and Berge, 2005).
Since multifilamentation emerges from the initial beamdefects, several techniques to control this process in shot-to-shot, meter-range experiments have been proposed.Among those, we can mention the introduction of beamellipticity (Dubietis et al., 2004c; Grow and Gaeta, 2005)or of a tilted lens (Fibich et al., 2004) along the opti-cal path. Strong field gradients or forcing aberrationsthrough phase masks can also be used to control highintensities over long scales (Mechain et al., 2004). Othertechniques consist in monitoring the filamentation dis-tance by changing the beam divergence angle with a de-formable mirror (Jin et al., 2005). By this method, asingle filament has been produced with powers as highas 420 GW, usually yielding multiple filaments in col-limated geometry. Alternative methods consist in tun-ing the focal distance of a telescope setup composedof divergent and convergent lenses (Fibich et al., 2006;Liu et al., 2006). Interesting features have recently beenpublished concerning the fusion, repulsion and spiral co-propagation of two filaments, depending on their rela-tive phase shift and crossing angle, which may furtherbe used to optimize the propagation range (Xi et al.,2006). In the same spirit, arrays of diffractive microlenses(Cook et al., 2005) or periodic meshes (Kandidov et al.,2005) into the propagation path helps in making the mul-tifilamentation ”more deterministic”. As a matter of fact,these methods amount to altering the background sur-face of the beam from which small-scale filaments canrandomly emerge from modulational instability. Alter-native ways may be provided by femtosecond opticalvortices (Vincotte and Berge, 2005) that keep the fila-ments rotating along a ring and are nowadays designedexperimentally on fs time scales (Mariyenko et al., 2005;Vuong et al., 2006). Further explorations should con-cern optical smoothing techniques breaking the laser spa-tial or temporal coherence (Marklund and Shukla, 2006).These techniques are currently employed in laser facili-ties devoted to the inertial confinement fusion, in order tohomogenize the beam distribution (Donnat et al., 1992;
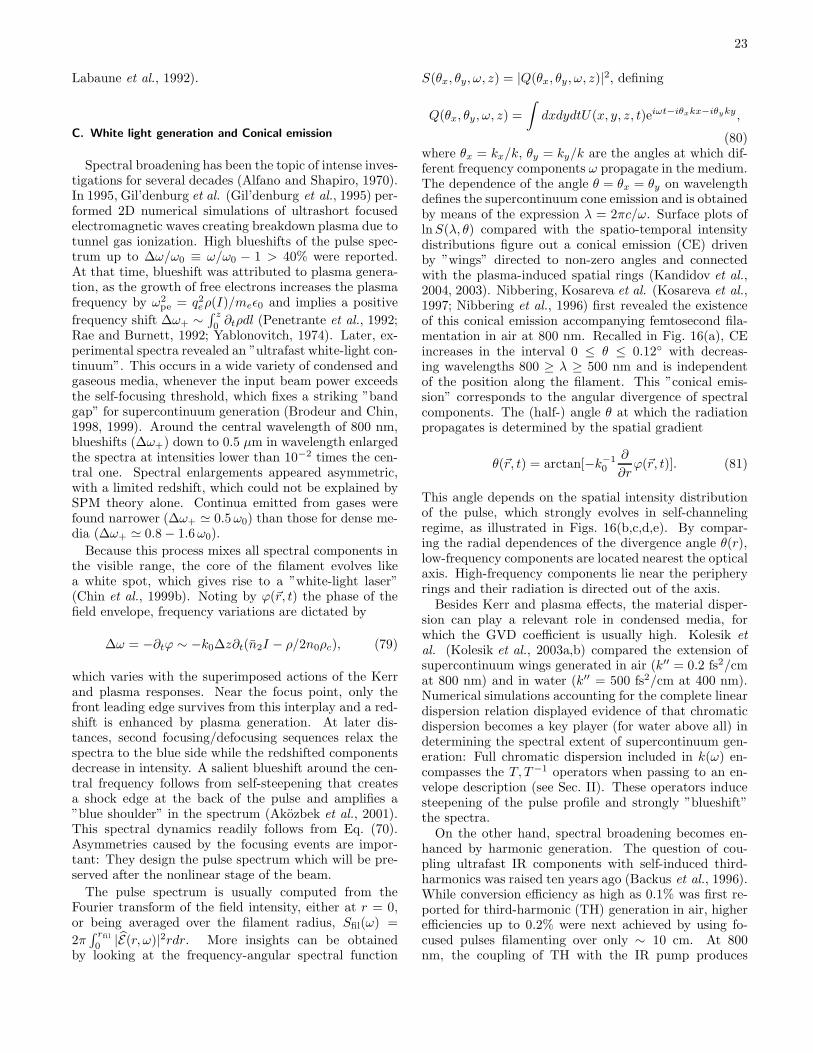
23
Labaune et al., 1992).
C. White light generation and Conical emission
Spectral broadening has been the topic of intense inves-tigations for several decades (Alfano and Shapiro, 1970).In 1995, Gil’denburg et al. (Gil’denburg et al., 1995) per-formed 2D numerical simulations of ultrashort focusedelectromagnetic waves creating breakdown plasma due totunnel gas ionization. High blueshifts of the pulse spec-trum up to ∆ω/ω0 ≡ ω/ω0 − 1 > 40% were reported.At that time, blueshift was attributed to plasma genera-tion, as the growth of free electrons increases the plasmafrequency by ω2
pe = q2eρ(I)/meǫ0 and implies a positive
frequency shift ∆ω+ ∼∫ z0∂tρdl (Penetrante et al., 1992;
Rae and Burnett, 1992; Yablonovitch, 1974). Later, ex-perimental spectra revealed an ”ultrafast white-light con-tinuum”. This occurs in a wide variety of condensed andgaseous media, whenever the input beam power exceedsthe self-focusing threshold, which fixes a striking ”bandgap” for supercontinuum generation (Brodeur and Chin,1998, 1999). Around the central wavelength of 800 nm,blueshifts (∆ω+) down to 0.5 µm in wavelength enlargedthe spectra at intensities lower than 10−2 times the cen-tral one. Spectral enlargements appeared asymmetric,with a limited redshift, which could not be explained bySPM theory alone. Continua emitted from gases werefound narrower (∆ω+ ≃ 0.5ω0) than those for dense me-dia (∆ω+ ≃ 0.8 − 1.6ω0).
Because this process mixes all spectral components inthe visible range, the core of the filament evolves likea white spot, which gives rise to a ”white-light laser”(Chin et al., 1999b). Noting by ϕ(~r, t) the phase of thefield envelope, frequency variations are dictated by
∆ω = −∂tϕ ∼ −k0∆z∂t(n2I − ρ/2n0ρc), (79)
which varies with the superimposed actions of the Kerrand plasma responses. Near the focus point, only thefront leading edge survives from this interplay and a red-shift is enhanced by plasma generation. At later dis-tances, second focusing/defocusing sequences relax thespectra to the blue side while the redshifted componentsdecrease in intensity. A salient blueshift around the cen-tral frequency follows from self-steepening that createsa shock edge at the back of the pulse and amplifies a”blue shoulder” in the spectrum (Akozbek et al., 2001).This spectral dynamics readily follows from Eq. (70).Asymmetries caused by the focusing events are impor-tant: They design the pulse spectrum which will be pre-served after the nonlinear stage of the beam.
The pulse spectrum is usually computed from theFourier transform of the field intensity, either at r = 0,or being averaged over the filament radius, Sfil(ω) =
2π∫ rfil0 |E(r, ω)|2rdr. More insights can be obtained
by looking at the frequency-angular spectral function
S(θx, θy, ω, z) = |Q(θx, θy, ω, z)|2, defining
Q(θx, θy, ω, z) =
∫dxdydtU(x, y, z, t)eiωt−iθxkx−iθyky,
(80)where θx = kx/k, θy = ky/k are the angles at which dif-ferent frequency components ω propagate in the medium.The dependence of the angle θ = θx = θy on wavelengthdefines the supercontinuum cone emission and is obtainedby means of the expression λ = 2πc/ω. Surface plots oflnS(λ, θ) compared with the spatio-temporal intensitydistributions figure out a conical emission (CE) drivenby ”wings” directed to non-zero angles and connectedwith the plasma-induced spatial rings (Kandidov et al.,2004, 2003). Nibbering, Kosareva et al. (Kosareva et al.,1997; Nibbering et al., 1996) first revealed the existenceof this conical emission accompanying femtosecond fila-mentation in air at 800 nm. Recalled in Fig. 16(a), CEincreases in the interval 0 ≤ θ ≤ 0.12 with decreas-ing wavelengths 800 ≥ λ ≥ 500 nm and is independentof the position along the filament. This ”conical emis-sion” corresponds to the angular divergence of spectralcomponents. The (half-) angle θ at which the radiationpropagates is determined by the spatial gradient
θ(~r, t) = arctan[−k−10
∂
∂rϕ(~r, t)]. (81)
This angle depends on the spatial intensity distributionof the pulse, which strongly evolves in self-channelingregime, as illustrated in Figs. 16(b,c,d,e). By compar-ing the radial dependences of the divergence angle θ(r),low-frequency components are located nearest the opticalaxis. High-frequency components lie near the peripheryrings and their radiation is directed out of the axis.
Besides Kerr and plasma effects, the material disper-sion can play a relevant role in condensed media, forwhich the GVD coefficient is usually high. Kolesik etal. (Kolesik et al., 2003a,b) compared the extension ofsupercontinuum wings generated in air (k′′ = 0.2 fs2/cmat 800 nm) and in water (k′′ = 500 fs2/cm at 400 nm).Numerical simulations accounting for the complete lineardispersion relation displayed evidence of that chromaticdispersion becomes a key player (for water above all) indetermining the spectral extent of supercontinuum gen-eration: Full chromatic dispersion included in k(ω) en-compasses the T, T−1 operators when passing to an en-velope description (see Sec. II). These operators inducesteepening of the pulse profile and strongly ”blueshift”the spectra.
On the other hand, spectral broadening becomes en-hanced by harmonic generation. The question of cou-pling ultrafast IR components with self-induced third-harmonics was raised ten years ago (Backus et al., 1996).While conversion efficiency as high as 0.1% was first re-ported for third-harmonic (TH) generation in air, higherefficiencies up to 0.2% were next achieved by using fo-cused pulses filamenting over only ∼ 10 cm. At 800nm, the coupling of TH with the IR pump produces
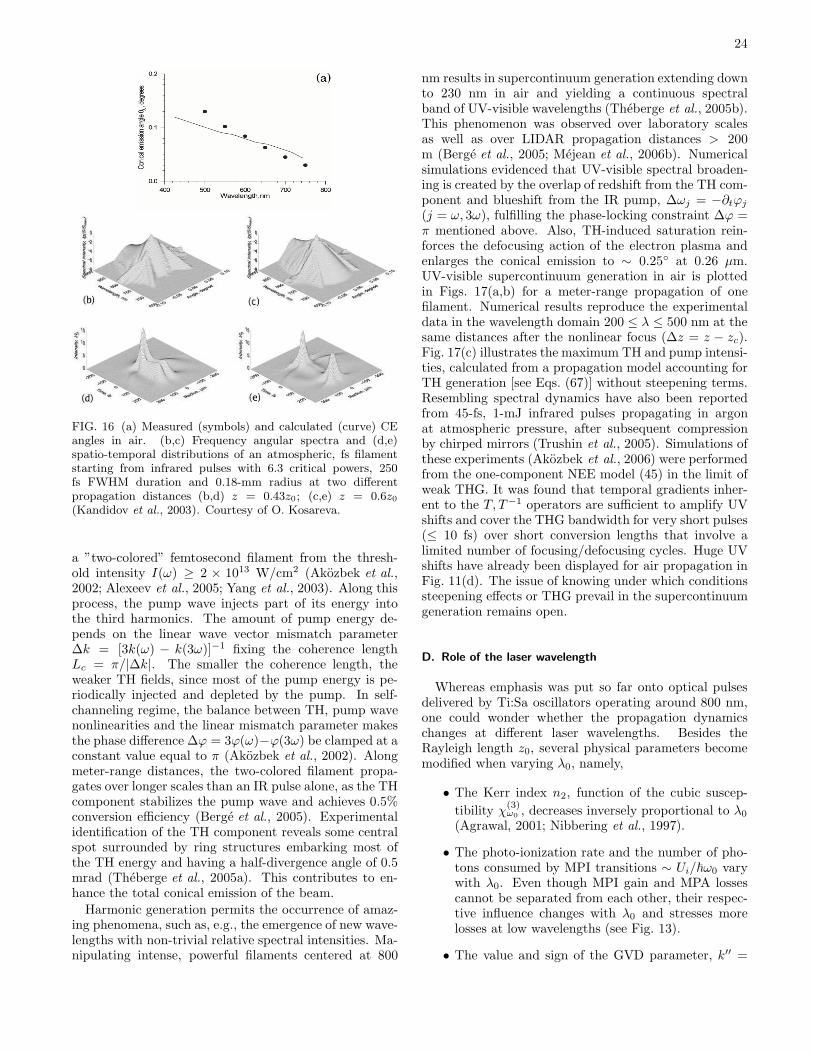
24
FIG. 16 (a) Measured (symbols) and calculated (curve) CEangles in air. (b,c) Frequency angular spectra and (d,e)spatio-temporal distributions of an atmospheric, fs filamentstarting from infrared pulses with 6.3 critical powers, 250fs FWHM duration and 0.18-mm radius at two differentpropagation distances (b,d) z = 0.43z0; (c,e) z = 0.6z0
(Kandidov et al., 2003). Courtesy of O. Kosareva.
a ”two-colored” femtosecond filament from the thresh-old intensity I(ω) ≥ 2 × 10¹³ W/cm2 (Akozbek et al.,2002; Alexeev et al., 2005; Yang et al., 2003). Along thisprocess, the pump wave injects part of its energy intothe third harmonics. The amount of pump energy de-pends on the linear wave vector mismatch parameter∆k = [3k(ω) − k(3ω)]−1 fixing the coherence lengthLc = π/|∆k|. The smaller the coherence length, theweaker TH fields, since most of the pump energy is pe-riodically injected and depleted by the pump. In self-channeling regime, the balance between TH, pump wavenonlinearities and the linear mismatch parameter makesthe phase difference ∆ϕ = 3ϕ(ω)−ϕ(3ω) be clamped at aconstant value equal to π (Akozbek et al., 2002). Alongmeter-range distances, the two-colored filament propa-gates over longer scales than an IR pulse alone, as the THcomponent stabilizes the pump wave and achieves 0.5%conversion efficiency (Berge et al., 2005). Experimentalidentification of the TH component reveals some centralspot surrounded by ring structures embarking most ofthe TH energy and having a half-divergence angle of 0.5mrad (Theberge et al., 2005a). This contributes to en-hance the total conical emission of the beam.
Harmonic generation permits the occurrence of amaz-ing phenomena, such as, e.g., the emergence of new wave-lengths with non-trivial relative spectral intensities. Ma-nipulating intense, powerful filaments centered at 800
nm results in supercontinuum generation extending downto 230 nm in air and yielding a continuous spectralband of UV-visible wavelengths (Theberge et al., 2005b).This phenomenon was observed over laboratory scalesas well as over LIDAR propagation distances > 200m (Berge et al., 2005; Mejean et al., 2006b). Numericalsimulations evidenced that UV-visible spectral broaden-ing is created by the overlap of redshift from the TH com-ponent and blueshift from the IR pump, ∆ωj = −∂tϕj(j = ω, 3ω), fulfilling the phase-locking constraint ∆ϕ =π mentioned above. Also, TH-induced saturation rein-forces the defocusing action of the electron plasma andenlarges the conical emission to ∼ 0.25 at 0.26 µm.UV-visible supercontinuum generation in air is plottedin Figs. 17(a,b) for a meter-range propagation of onefilament. Numerical results reproduce the experimentaldata in the wavelength domain 200 ≤ λ ≤ 500 nm at thesame distances after the nonlinear focus (∆z = z − zc).Fig. 17(c) illustrates the maximum TH and pump intensi-ties, calculated from a propagation model accounting forTH generation [see Eqs. (67)] without steepening terms.Resembling spectral dynamics have also been reportedfrom 45-fs, 1-mJ infrared pulses propagating in argonat atmospheric pressure, after subsequent compressionby chirped mirrors (Trushin et al., 2005). Simulations ofthese experiments (Akozbek et al., 2006) were performedfrom the one-component NEE model (45) in the limit ofweak THG. It was found that temporal gradients inher-ent to the T, T−1 operators are sufficient to amplify UVshifts and cover the THG bandwidth for very short pulses(≤ 10 fs) over short conversion lengths that involve alimited number of focusing/defocusing cycles. Huge UVshifts have already been displayed for air propagation inFig. 11(d). The issue of knowing under which conditionssteepening effects or THG prevail in the supercontinuumgeneration remains open.
D. Role of the laser wavelength
Whereas emphasis was put so far onto optical pulsesdelivered by Ti:Sa oscillators operating around 800 nm,one could wonder whether the propagation dynamicschanges at different laser wavelengths. Besides theRayleigh length z0, several physical parameters becomemodified when varying λ0, namely,
• The Kerr index n2, function of the cubic suscep-
tibility χ(3)ω0 , decreases inversely proportional to λ0
(Agrawal, 2001; Nibbering et al., 1997).
• The photo-ionization rate and the number of pho-tons consumed by MPI transitions ∼ Ui/~ω0 varywith λ0. Even though MPI gain and MPA lossescannot be separated from each other, their respec-tive influence changes with λ0 and stresses morelosses at low wavelengths (see Fig. 13).
• The value and sign of the GVD parameter, k′′ =
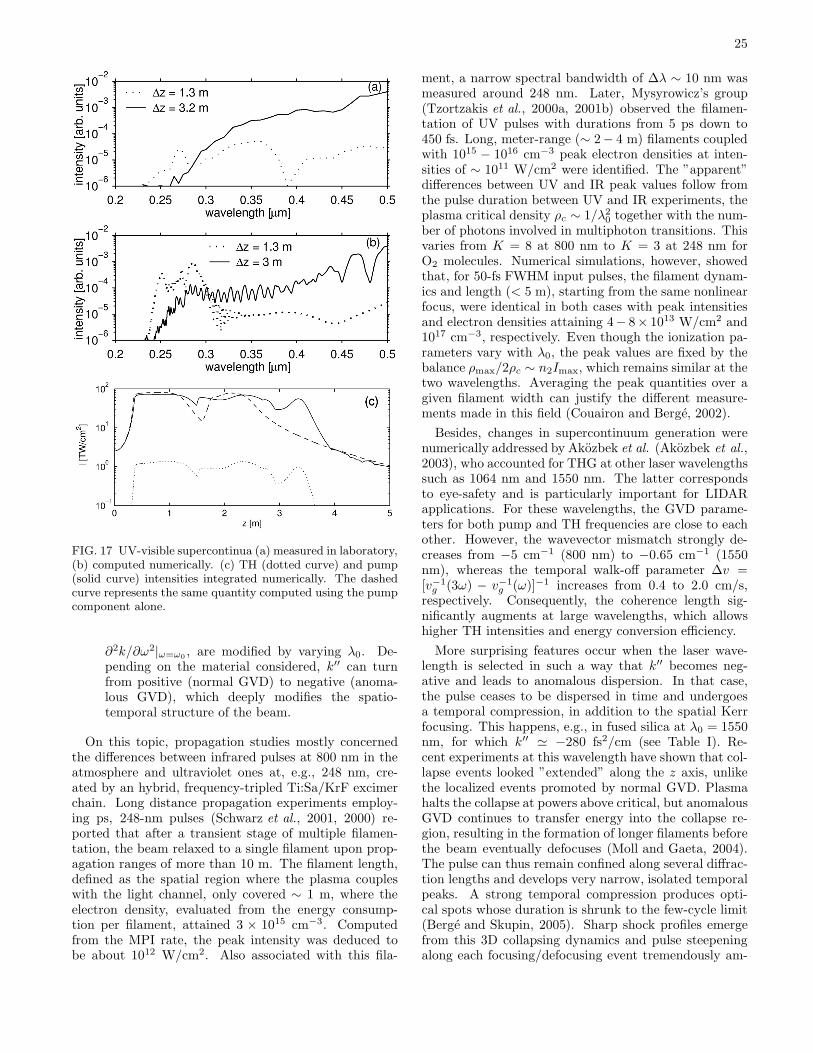
25
FIG. 17 UV-visible supercontinua (a) measured in laboratory,(b) computed numerically. (c) TH (dotted curve) and pump(solid curve) intensities integrated numerically. The dashedcurve represents the same quantity computed using the pumpcomponent alone.
∂2k/∂ω2|ω=ω0 , are modified by varying λ0. De-pending on the material considered, k′′ can turnfrom positive (normal GVD) to negative (anoma-lous GVD), which deeply modifies the spatio-temporal structure of the beam.
On this topic, propagation studies mostly concernedthe differences between infrared pulses at 800 nm in theatmosphere and ultraviolet ones at, e.g., 248 nm, cre-ated by an hybrid, frequency-tripled Ti:Sa/KrF excimerchain. Long distance propagation experiments employ-ing ps, 248-nm pulses (Schwarz et al., 2001, 2000) re-ported that after a transient stage of multiple filamen-tation, the beam relaxed to a single filament upon prop-agation ranges of more than 10 m. The filament length,defined as the spatial region where the plasma coupleswith the light channel, only covered ∼ 1 m, where theelectron density, evaluated from the energy consump-tion per filament, attained 3 × 1015 cm−3. Computedfrom the MPI rate, the peak intensity was deduced tobe about 1012 W/cm2. Also associated with this fila-
ment, a narrow spectral bandwidth of ∆λ ∼ 10 nm wasmeasured around 248 nm. Later, Mysyrowicz’s group(Tzortzakis et al., 2000a, 2001b) observed the filamen-tation of UV pulses with durations from 5 ps down to450 fs. Long, meter-range (∼ 2− 4 m) filaments coupledwith 1015 − 1016 cm−3 peak electron densities at inten-sities of ∼ 1011 W/cm2 were identified. The ”apparent”differences between UV and IR peak values follow fromthe pulse duration between UV and IR experiments, theplasma critical density ρc ∼ 1/λ2
0 together with the num-ber of photons involved in multiphoton transitions. Thisvaries from K = 8 at 800 nm to K = 3 at 248 nm forO2 molecules. Numerical simulations, however, showedthat, for 50-fs FWHM input pulses, the filament dynam-ics and length (< 5 m), starting from the same nonlinearfocus, were identical in both cases with peak intensitiesand electron densities attaining 4− 8× 10¹³ W/cm2 and1017 cm−3, respectively. Even though the ionization pa-rameters vary with λ0, the peak values are fixed by thebalance ρmax/2ρc ∼ n2Imax, which remains similar at thetwo wavelengths. Averaging the peak quantities over agiven filament width can justify the different measure-ments made in this field (Couairon and Berge, 2002).
Besides, changes in supercontinuum generation werenumerically addressed by Akozbek et al. (Akozbek et al.,2003), who accounted for THG at other laser wavelengthssuch as 1064 nm and 1550 nm. The latter correspondsto eye-safety and is particularly important for LIDARapplications. For these wavelengths, the GVD parame-ters for both pump and TH frequencies are close to eachother. However, the wavevector mismatch strongly de-creases from −5 cm−1 (800 nm) to −0.65 cm−1 (1550nm), whereas the temporal walk-off parameter ∆v =[v−1g (3ω) − v−1
g (ω)]−1 increases from 0.4 to 2.0 cm/s,respectively. Consequently, the coherence length sig-nificantly augments at large wavelengths, which allowshigher TH intensities and energy conversion efficiency.
More surprising features occur when the laser wave-length is selected in such a way that k′′ becomes neg-ative and leads to anomalous dispersion. In that case,the pulse ceases to be dispersed in time and undergoesa temporal compression, in addition to the spatial Kerrfocusing. This happens, e.g., in fused silica at λ0 = 1550nm, for which k′′ ≃ −280 fs2/cm (see Table I). Re-cent experiments at this wavelength have shown that col-lapse events looked ”extended” along the z axis, unlikethe localized events promoted by normal GVD. Plasmahalts the collapse at powers above critical, but anomalousGVD continues to transfer energy into the collapse re-gion, resulting in the formation of longer filaments beforethe beam eventually defocuses (Moll and Gaeta, 2004).The pulse can thus remain confined along several diffrac-tion lengths and develops very narrow, isolated temporalpeaks. A strong temporal compression produces opti-cal spots whose duration is shrunk to the few-cycle limit(Berge and Skupin, 2005). Sharp shock profiles emergefrom this 3D collapsing dynamics and pulse steepeningalong each focusing/defocusing event tremendously am-
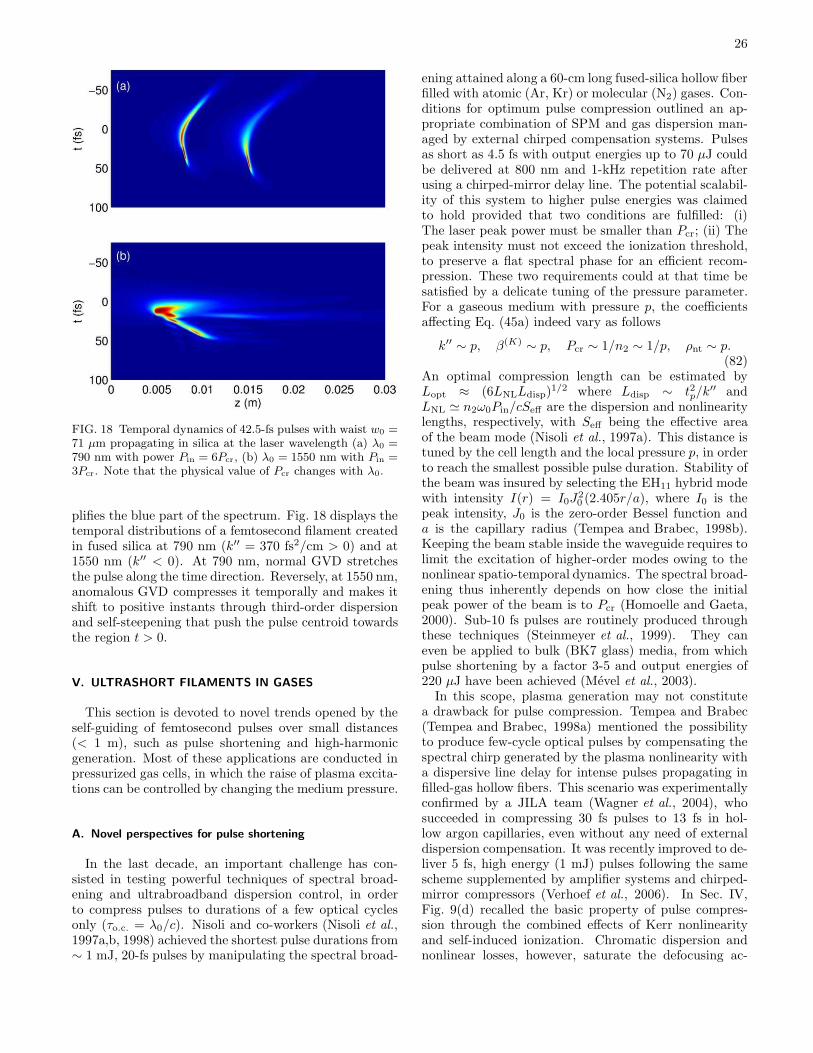
26
FIG. 18 Temporal dynamics of 42.5-fs pulses with waist w0 =71 µm propagating in silica at the laser wavelength (a) λ0 =790 nm with power Pin = 6Pcr, (b) λ0 = 1550 nm with Pin =3Pcr. Note that the physical value of Pcr changes with λ0.
plifies the blue part of the spectrum. Fig. 18 displays thetemporal distributions of a femtosecond filament createdin fused silica at 790 nm (k′′ = 370 fs2/cm > 0) and at1550 nm (k′′ < 0). At 790 nm, normal GVD stretchesthe pulse along the time direction. Reversely, at 1550 nm,anomalous GVD compresses it temporally and makes itshift to positive instants through third-order dispersionand self-steepening that push the pulse centroid towardsthe region t > 0.
V. ULTRASHORT FILAMENTS IN GASES
This section is devoted to novel trends opened by theself-guiding of femtosecond pulses over small distances(< 1 m), such as pulse shortening and high-harmonicgeneration. Most of these applications are conducted inpressurized gas cells, in which the raise of plasma excita-tions can be controlled by changing the medium pressure.
A. Novel perspectives for pulse shortening
In the last decade, an important challenge has con-sisted in testing powerful techniques of spectral broad-ening and ultrabroadband dispersion control, in orderto compress pulses to durations of a few optical cyclesonly (τo.c. = λ0/c). Nisoli and co-workers (Nisoli et al.,1997a,b, 1998) achieved the shortest pulse durations from∼ 1 mJ, 20-fs pulses by manipulating the spectral broad-
ening attained along a 60-cm long fused-silica hollow fiberfilled with atomic (Ar, Kr) or molecular (N2) gases. Con-ditions for optimum pulse compression outlined an ap-propriate combination of SPM and gas dispersion man-aged by external chirped compensation systems. Pulsesas short as 4.5 fs with output energies up to 70 µJ couldbe delivered at 800 nm and 1-kHz repetition rate afterusing a chirped-mirror delay line. The potential scalabil-ity of this system to higher pulse energies was claimedto hold provided that two conditions are fulfilled: (i)The laser peak power must be smaller than Pcr; (ii) Thepeak intensity must not exceed the ionization threshold,to preserve a flat spectral phase for an efficient recom-pression. These two requirements could at that time besatisfied by a delicate tuning of the pressure parameter.For a gaseous medium with pressure p, the coefficientsaffecting Eq. (45a) indeed vary as follows
k′′ ∼ p, β(K) ∼ p, Pcr ∼ 1/n2 ∼ 1/p, ρnt ∼ p.(82)
An optimal compression length can be estimated byLopt ≈ (6LNLLdisp)
1/2 where Ldisp ∼ t2p/k′′ and
LNL ≃ n2ω0Pin/cSeff are the dispersion and nonlinearitylengths, respectively, with Seff being the effective areaof the beam mode (Nisoli et al., 1997a). This distance istuned by the cell length and the local pressure p, in orderto reach the smallest possible pulse duration. Stability ofthe beam was insured by selecting the EH11 hybrid modewith intensity I(r) = I0J
20 (2.405r/a), where I0 is the
peak intensity, J0 is the zero-order Bessel function anda is the capillary radius (Tempea and Brabec, 1998b).Keeping the beam stable inside the waveguide requires tolimit the excitation of higher-order modes owing to thenonlinear spatio-temporal dynamics. The spectral broad-ening thus inherently depends on how close the initialpeak power of the beam is to Pcr (Homoelle and Gaeta,2000). Sub-10 fs pulses are routinely produced throughthese techniques (Steinmeyer et al., 1999). They caneven be applied to bulk (BK7 glass) media, from whichpulse shortening by a factor 3-5 and output energies of220 µJ have been achieved (Mevel et al., 2003).
In this scope, plasma generation may not constitutea drawback for pulse compression. Tempea and Brabec(Tempea and Brabec, 1998a) mentioned the possibilityto produce few-cycle optical pulses by compensating thespectral chirp generated by the plasma nonlinearity witha dispersive line delay for intense pulses propagating infilled-gas hollow fibers. This scenario was experimentallyconfirmed by a JILA team (Wagner et al., 2004), whosucceeded in compressing 30 fs pulses to 13 fs in hol-low argon capillaries, even without any need of externaldispersion compensation. It was recently improved to de-liver 5 fs, high energy (1 mJ) pulses following the samescheme supplemented by amplifier systems and chirped-mirror compressors (Verhoef et al., 2006). In Sec. IV,Fig. 9(d) recalled the basic property of pulse compres-sion through the combined effects of Kerr nonlinearityand self-induced ionization. Chromatic dispersion andnonlinear losses, however, saturate the defocusing ac-
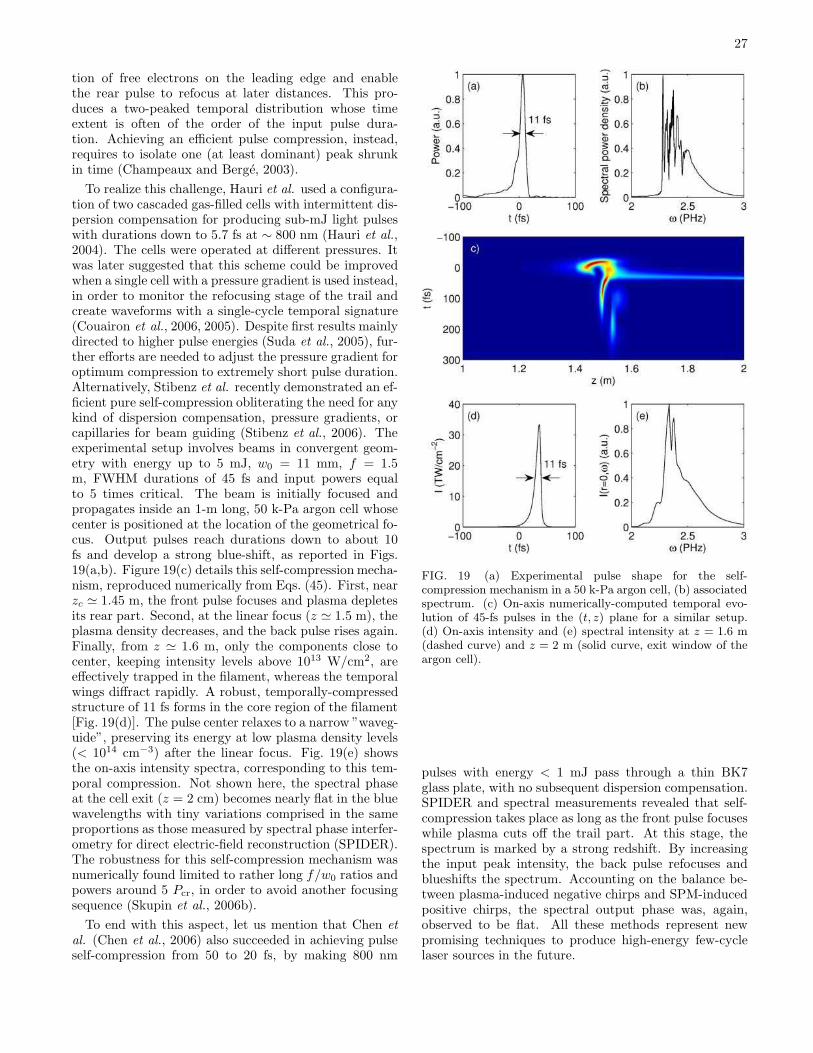
27
tion of free electrons on the leading edge and enablethe rear pulse to refocus at later distances. This pro-duces a two-peaked temporal distribution whose timeextent is often of the order of the input pulse dura-tion. Achieving an efficient pulse compression, instead,requires to isolate one (at least dominant) peak shrunkin time (Champeaux and Berge, 2003).
To realize this challenge, Hauri et al. used a configura-tion of two cascaded gas-filled cells with intermittent dis-persion compensation for producing sub-mJ light pulseswith durations down to 5.7 fs at ∼ 800 nm (Hauri et al.,2004). The cells were operated at different pressures. Itwas later suggested that this scheme could be improvedwhen a single cell with a pressure gradient is used instead,in order to monitor the refocusing stage of the trail andcreate waveforms with a single-cycle temporal signature(Couairon et al., 2006, 2005). Despite first results mainlydirected to higher pulse energies (Suda et al., 2005), fur-ther efforts are needed to adjust the pressure gradient foroptimum compression to extremely short pulse duration.Alternatively, Stibenz et al. recently demonstrated an ef-ficient pure self-compression obliterating the need for anykind of dispersion compensation, pressure gradients, orcapillaries for beam guiding (Stibenz et al., 2006). Theexperimental setup involves beams in convergent geom-etry with energy up to 5 mJ, w0 = 11 mm, f = 1.5m, FWHM durations of 45 fs and input powers equalto 5 times critical. The beam is initially focused andpropagates inside an 1-m long, 50 k-Pa argon cell whosecenter is positioned at the location of the geometrical fo-cus. Output pulses reach durations down to about 10fs and develop a strong blue-shift, as reported in Figs.19(a,b). Figure 19(c) details this self-compression mecha-nism, reproduced numerically from Eqs. (45). First, nearzc ≃ 1.45 m, the front pulse focuses and plasma depletesits rear part. Second, at the linear focus (z ≃ 1.5 m), theplasma density decreases, and the back pulse rises again.Finally, from z ≃ 1.6 m, only the components close tocenter, keeping intensity levels above 1013 W/cm2, areeffectively trapped in the filament, whereas the temporalwings diffract rapidly. A robust, temporally-compressedstructure of 11 fs forms in the core region of the filament[Fig. 19(d)]. The pulse center relaxes to a narrow ”waveg-uide”, preserving its energy at low plasma density levels(< 1014 cm−3) after the linear focus. Fig. 19(e) showsthe on-axis intensity spectra, corresponding to this tem-poral compression. Not shown here, the spectral phaseat the cell exit (z = 2 cm) becomes nearly flat in the bluewavelengths with tiny variations comprised in the sameproportions as those measured by spectral phase interfer-ometry for direct electric-field reconstruction (SPIDER).The robustness for this self-compression mechanism wasnumerically found limited to rather long f/w0 ratios andpowers around 5 Pcr, in order to avoid another focusingsequence (Skupin et al., 2006b).
To end with this aspect, let us mention that Chen et
al. (Chen et al., 2006) also succeeded in achieving pulseself-compression from 50 to 20 fs, by making 800 nm
FIG. 19 (a) Experimental pulse shape for the self-compression mechanism in a 50 k-Pa argon cell, (b) associatedspectrum. (c) On-axis numerically-computed temporal evo-lution of 45-fs pulses in the (t, z) plane for a similar setup.(d) On-axis intensity and (e) spectral intensity at z = 1.6 m(dashed curve) and z = 2 m (solid curve, exit window of theargon cell).
pulses with energy < 1 mJ pass through a thin BK7glass plate, with no subsequent dispersion compensation.SPIDER and spectral measurements revealed that self-compression takes place as long as the front pulse focuseswhile plasma cuts off the trail part. At this stage, thespectrum is marked by a strong redshift. By increasingthe input peak intensity, the back pulse refocuses andblueshifts the spectrum. Accounting on the balance be-tween plasma-induced negative chirps and SPM-inducedpositive chirps, the spectral output phase was, again,observed to be flat. All these methods represent newpromising techniques to produce high-energy few-cyclelaser sources in the future.
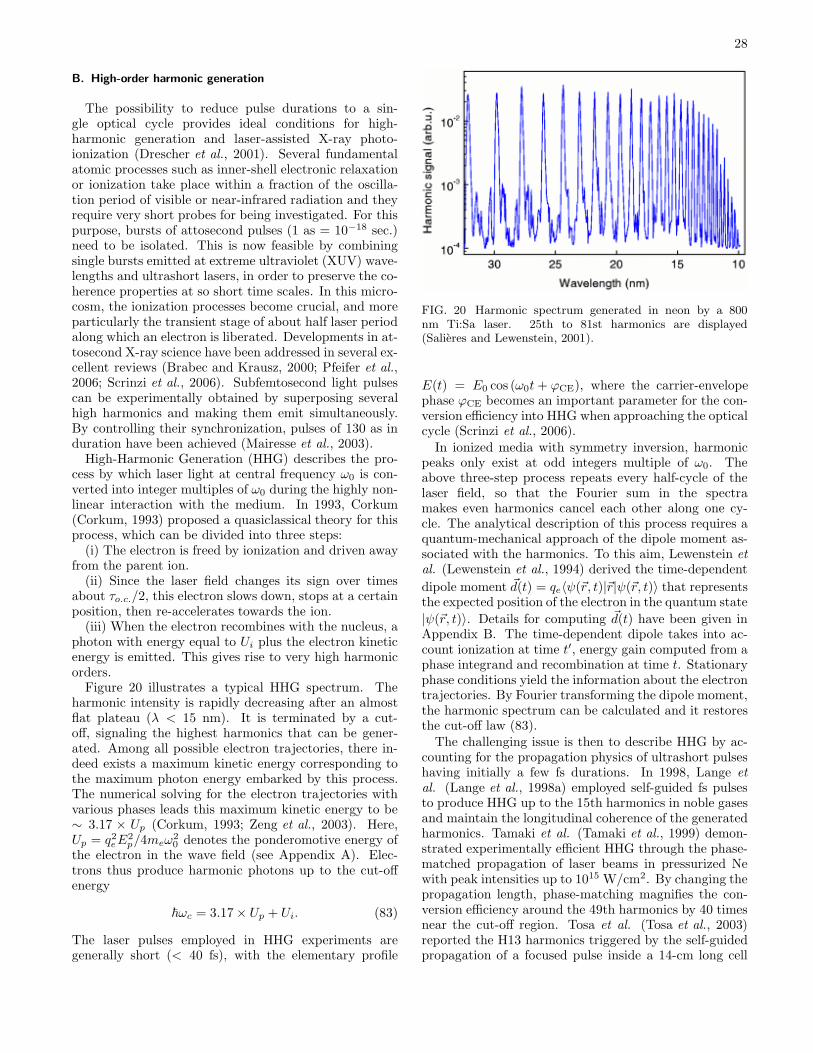
28
B. High-order harmonic generation
The possibility to reduce pulse durations to a sin-gle optical cycle provides ideal conditions for high-harmonic generation and laser-assisted X-ray photo-ionization (Drescher et al., 2001). Several fundamentalatomic processes such as inner-shell electronic relaxationor ionization take place within a fraction of the oscilla-tion period of visible or near-infrared radiation and theyrequire very short probes for being investigated. For thispurpose, bursts of attosecond pulses (1 as = 10−18 sec.)need to be isolated. This is now feasible by combiningsingle bursts emitted at extreme ultraviolet (XUV) wave-lengths and ultrashort lasers, in order to preserve the co-herence properties at so short time scales. In this micro-cosm, the ionization processes become crucial, and moreparticularly the transient stage of about half laser periodalong which an electron is liberated. Developments in at-tosecond X-ray science have been addressed in several ex-cellent reviews (Brabec and Krausz, 2000; Pfeifer et al.,2006; Scrinzi et al., 2006). Subfemtosecond light pulsescan be experimentally obtained by superposing severalhigh harmonics and making them emit simultaneously.By controlling their synchronization, pulses of 130 as induration have been achieved (Mairesse et al., 2003).
High-Harmonic Generation (HHG) describes the pro-cess by which laser light at central frequency ω0 is con-verted into integer multiples of ω0 during the highly non-linear interaction with the medium. In 1993, Corkum(Corkum, 1993) proposed a quasiclassical theory for thisprocess, which can be divided into three steps:
(i) The electron is freed by ionization and driven awayfrom the parent ion.
(ii) Since the laser field changes its sign over timesabout τo.c./2, this electron slows down, stops at a certainposition, then re-accelerates towards the ion.
(iii) When the electron recombines with the nucleus, aphoton with energy equal to Ui plus the electron kineticenergy is emitted. This gives rise to very high harmonicorders.
Figure 20 illustrates a typical HHG spectrum. Theharmonic intensity is rapidly decreasing after an almostflat plateau (λ < 15 nm). It is terminated by a cut-off, signaling the highest harmonics that can be gener-ated. Among all possible electron trajectories, there in-deed exists a maximum kinetic energy corresponding tothe maximum photon energy embarked by this process.The numerical solving for the electron trajectories withvarious phases leads this maximum kinetic energy to be∼ 3.17 × Up (Corkum, 1993; Zeng et al., 2003). Here,Up = q2eE
2p/4meω
20 denotes the ponderomotive energy of
the electron in the wave field (see Appendix A). Elec-trons thus produce harmonic photons up to the cut-offenergy
~ωc = 3.17 × Up + Ui. (83)
The laser pulses employed in HHG experiments aregenerally short (< 40 fs), with the elementary profile
FIG. 20 Harmonic spectrum generated in neon by a 800nm Ti:Sa laser. 25th to 81st harmonics are displayed(Salieres and Lewenstein, 2001).
E(t) = E0 cos (ω0t+ ϕCE), where the carrier-envelopephase ϕCE becomes an important parameter for the con-version efficiency into HHG when approaching the opticalcycle (Scrinzi et al., 2006).
In ionized media with symmetry inversion, harmonicpeaks only exist at odd integers multiple of ω0. Theabove three-step process repeats every half-cycle of thelaser field, so that the Fourier sum in the spectramakes even harmonics cancel each other along one cy-cle. The analytical description of this process requires aquantum-mechanical approach of the dipole moment as-sociated with the harmonics. To this aim, Lewenstein etal. (Lewenstein et al., 1994) derived the time-dependent
dipole moment ~d(t) = qe〈ψ(~r, t)|~r|ψ(~r, t)〉 that representsthe expected position of the electron in the quantum state
|ψ(~r, t)〉. Details for computing ~d(t) have been given inAppendix B. The time-dependent dipole takes into ac-count ionization at time t′, energy gain computed from aphase integrand and recombination at time t. Stationaryphase conditions yield the information about the electrontrajectories. By Fourier transforming the dipole moment,the harmonic spectrum can be calculated and it restoresthe cut-off law (83).
The challenging issue is then to describe HHG by ac-counting for the propagation physics of ultrashort pulseshaving initially a few fs durations. In 1998, Lange et
al. (Lange et al., 1998a) employed self-guided fs pulsesto produce HHG up to the 15th harmonics in noble gasesand maintain the longitudinal coherence of the generatedharmonics. Tamaki et al. (Tamaki et al., 1999) demon-strated experimentally efficient HHG through the phase-matched propagation of laser beams in pressurized Newith peak intensities up to 1015 W/cm2. By changing thepropagation length, phase-matching magnifies the con-version efficiency around the 49th harmonics by 40 timesnear the cut-off region. Tosa et al. (Tosa et al., 2003)reported the H13 harmonics triggered by the self-guidedpropagation of a focused pulse inside a 14-cm long cell
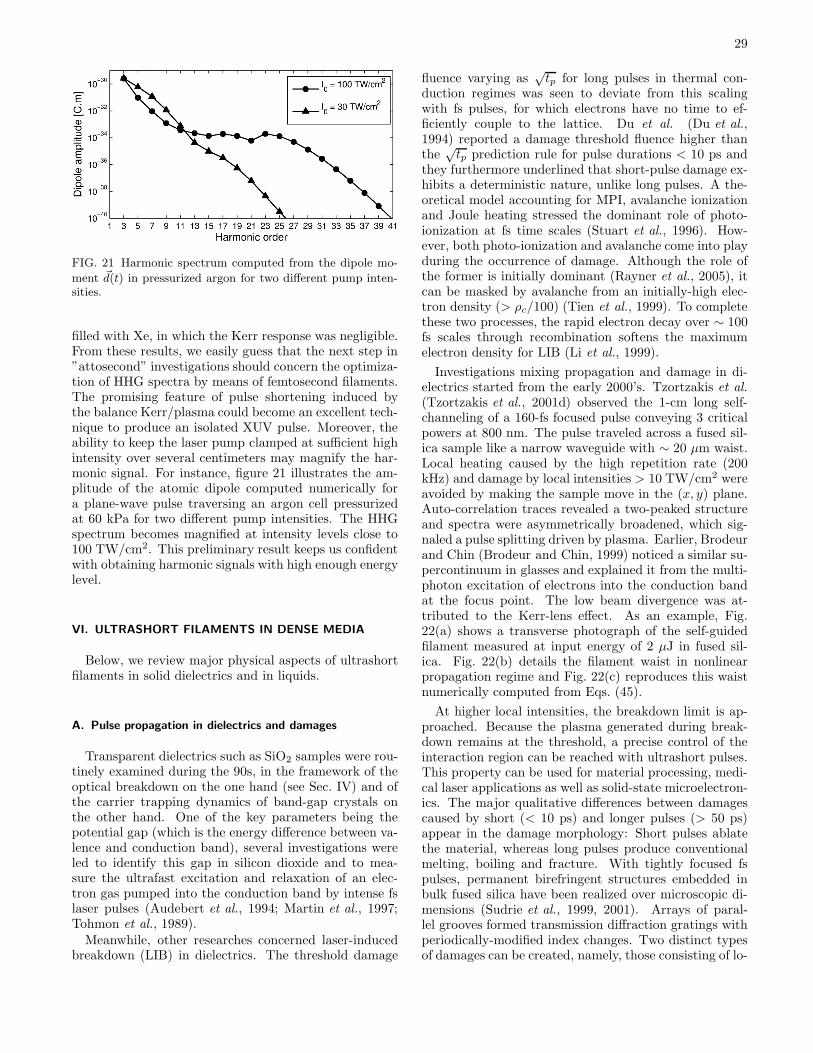
29
FIG. 21 Harmonic spectrum computed from the dipole mo-
ment ~d(t) in pressurized argon for two different pump inten-sities.
filled with Xe, in which the Kerr response was negligible.From these results, we easily guess that the next step in”attosecond” investigations should concern the optimiza-tion of HHG spectra by means of femtosecond filaments.The promising feature of pulse shortening induced bythe balance Kerr/plasma could become an excellent tech-nique to produce an isolated XUV pulse. Moreover, theability to keep the laser pump clamped at sufficient highintensity over several centimeters may magnify the har-monic signal. For instance, figure 21 illustrates the am-plitude of the atomic dipole computed numerically fora plane-wave pulse traversing an argon cell pressurizedat 60 kPa for two different pump intensities. The HHGspectrum becomes magnified at intensity levels close to100 TW/cm2. This preliminary result keeps us confidentwith obtaining harmonic signals with high enough energylevel.
VI. ULTRASHORT FILAMENTS IN DENSE MEDIA
Below, we review major physical aspects of ultrashortfilaments in solid dielectrics and in liquids.
A. Pulse propagation in dielectrics and damages
Transparent dielectrics such as SiO2 samples were rou-tinely examined during the 90s, in the framework of theoptical breakdown on the one hand (see Sec. IV) and ofthe carrier trapping dynamics of band-gap crystals onthe other hand. One of the key parameters being thepotential gap (which is the energy difference between va-lence and conduction band), several investigations wereled to identify this gap in silicon dioxide and to mea-sure the ultrafast excitation and relaxation of an elec-tron gas pumped into the conduction band by intense fslaser pulses (Audebert et al., 1994; Martin et al., 1997;Tohmon et al., 1989).
Meanwhile, other researches concerned laser-inducedbreakdown (LIB) in dielectrics. The threshold damage
fluence varying as√tp for long pulses in thermal con-
duction regimes was seen to deviate from this scalingwith fs pulses, for which electrons have no time to ef-ficiently couple to the lattice. Du et al. (Du et al.,1994) reported a damage threshold fluence higher thanthe
√tp prediction rule for pulse durations < 10 ps and
they furthermore underlined that short-pulse damage ex-hibits a deterministic nature, unlike long pulses. A the-oretical model accounting for MPI, avalanche ionizationand Joule heating stressed the dominant role of photo-ionization at fs time scales (Stuart et al., 1996). How-ever, both photo-ionization and avalanche come into playduring the occurrence of damage. Although the role ofthe former is initially dominant (Rayner et al., 2005), itcan be masked by avalanche from an initially-high elec-tron density (> ρc/100) (Tien et al., 1999). To completethese two processes, the rapid electron decay over ∼ 100fs scales through recombination softens the maximumelectron density for LIB (Li et al., 1999).
Investigations mixing propagation and damage in di-electrics started from the early 2000’s. Tzortzakis et al.
(Tzortzakis et al., 2001d) observed the 1-cm long self-channeling of a 160-fs focused pulse conveying 3 criticalpowers at 800 nm. The pulse traveled across a fused sil-ica sample like a narrow waveguide with ∼ 20 µm waist.Local heating caused by the high repetition rate (200kHz) and damage by local intensities > 10 TW/cm2 wereavoided by making the sample move in the (x, y) plane.Auto-correlation traces revealed a two-peaked structureand spectra were asymmetrically broadened, which sig-naled a pulse splitting driven by plasma. Earlier, Brodeurand Chin (Brodeur and Chin, 1999) noticed a similar su-percontinuum in glasses and explained it from the multi-photon excitation of electrons into the conduction bandat the focus point. The low beam divergence was at-tributed to the Kerr-lens effect. As an example, Fig.22(a) shows a transverse photograph of the self-guidedfilament measured at input energy of 2 µJ in fused sil-ica. Fig. 22(b) details the filament waist in nonlinearpropagation regime and Fig. 22(c) reproduces this waistnumerically computed from Eqs. (45).
At higher local intensities, the breakdown limit is ap-proached. Because the plasma generated during break-down remains at the threshold, a precise control of theinteraction region can be reached with ultrashort pulses.This property can be used for material processing, medi-cal laser applications as well as solid-state microelectron-ics. The major qualitative differences between damagescaused by short (< 10 ps) and longer pulses (> 50 ps)appear in the damage morphology: Short pulses ablatethe material, whereas long pulses produce conventionalmelting, boiling and fracture. With tightly focused fspulses, permanent birefringent structures embedded inbulk fused silica have been realized over microscopic di-mensions (Sudrie et al., 1999, 2001). Arrays of paral-lel grooves formed transmission diffraction gratings withperiodically-modified index changes. Two distinct typesof damages can be created, namely, those consisting of lo-
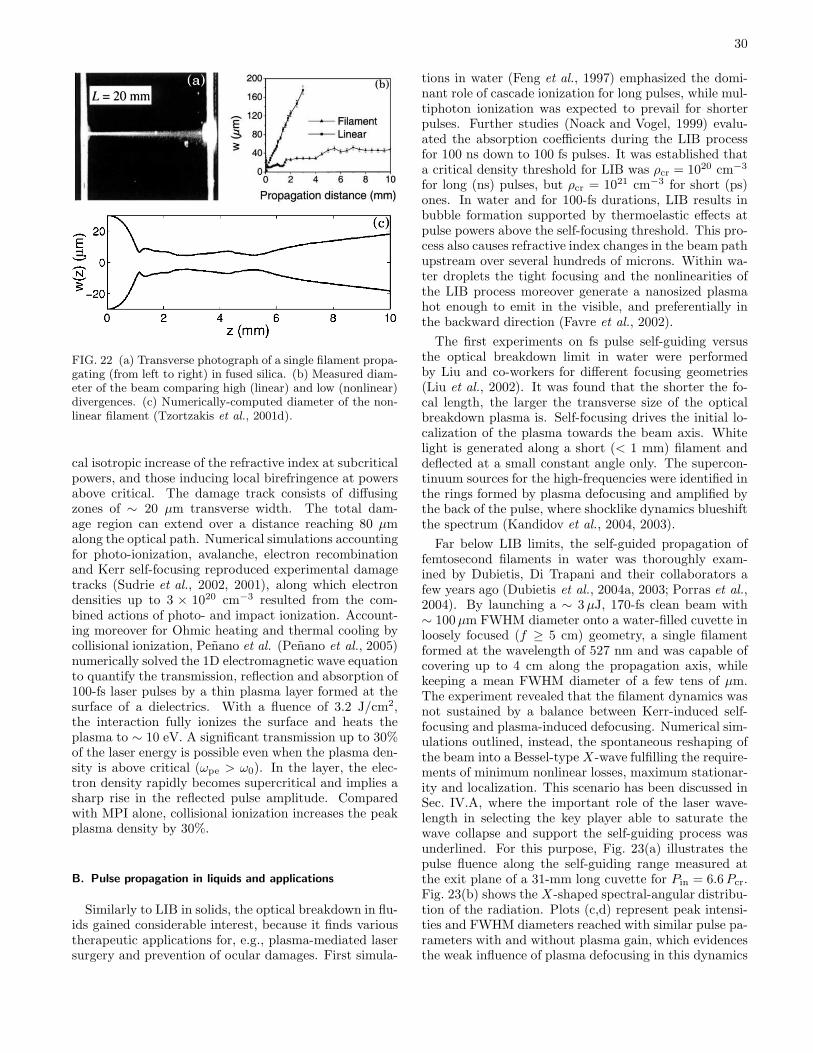
30
FIG. 22 (a) Transverse photograph of a single filament propa-gating (from left to right) in fused silica. (b) Measured diam-eter of the beam comparing high (linear) and low (nonlinear)divergences. (c) Numerically-computed diameter of the non-linear filament (Tzortzakis et al., 2001d).
cal isotropic increase of the refractive index at subcriticalpowers, and those inducing local birefringence at powersabove critical. The damage track consists of diffusingzones of ∼ 20 µm transverse width. The total dam-age region can extend over a distance reaching 80 µmalong the optical path. Numerical simulations accountingfor photo-ionization, avalanche, electron recombinationand Kerr self-focusing reproduced experimental damagetracks (Sudrie et al., 2002, 2001), along which electrondensities up to 3 × 1020 cm−3 resulted from the com-bined actions of photo- and impact ionization. Account-ing moreover for Ohmic heating and thermal cooling bycollisional ionization, Penano et al. (Penano et al., 2005)numerically solved the 1D electromagnetic wave equationto quantify the transmission, reflection and absorption of100-fs laser pulses by a thin plasma layer formed at thesurface of a dielectrics. With a fluence of 3.2 J/cm2,the interaction fully ionizes the surface and heats theplasma to ∼ 10 eV. A significant transmission up to 30%of the laser energy is possible even when the plasma den-sity is above critical (ωpe > ω0). In the layer, the elec-tron density rapidly becomes supercritical and implies asharp rise in the reflected pulse amplitude. Comparedwith MPI alone, collisional ionization increases the peakplasma density by 30%.
B. Pulse propagation in liquids and applications
Similarly to LIB in solids, the optical breakdown in flu-ids gained considerable interest, because it finds varioustherapeutic applications for, e.g., plasma-mediated lasersurgery and prevention of ocular damages. First simula-
tions in water (Feng et al., 1997) emphasized the domi-nant role of cascade ionization for long pulses, while mul-tiphoton ionization was expected to prevail for shorterpulses. Further studies (Noack and Vogel, 1999) evalu-ated the absorption coefficients during the LIB processfor 100 ns down to 100 fs pulses. It was established thata critical density threshold for LIB was ρcr = 1020 cm−3
for long (ns) pulses, but ρcr = 1021 cm−3 for short (ps)ones. In water and for 100-fs durations, LIB results inbubble formation supported by thermoelastic effects atpulse powers above the self-focusing threshold. This pro-cess also causes refractive index changes in the beam pathupstream over several hundreds of microns. Within wa-ter droplets the tight focusing and the nonlinearities ofthe LIB process moreover generate a nanosized plasmahot enough to emit in the visible, and preferentially inthe backward direction (Favre et al., 2002).
The first experiments on fs pulse self-guiding versusthe optical breakdown limit in water were performedby Liu and co-workers for different focusing geometries(Liu et al., 2002). It was found that the shorter the fo-cal length, the larger the transverse size of the opticalbreakdown plasma is. Self-focusing drives the initial lo-calization of the plasma towards the beam axis. Whitelight is generated along a short (< 1 mm) filament anddeflected at a small constant angle only. The supercon-tinuum sources for the high-frequencies were identified inthe rings formed by plasma defocusing and amplified bythe back of the pulse, where shocklike dynamics blueshiftthe spectrum (Kandidov et al., 2004, 2003).
Far below LIB limits, the self-guided propagation offemtosecond filaments in water was thoroughly exam-ined by Dubietis, Di Trapani and their collaborators afew years ago (Dubietis et al., 2004a, 2003; Porras et al.,2004). By launching a ∼ 3µJ, 170-fs clean beam with∼ 100µm FWHM diameter onto a water-filled cuvette inloosely focused (f ≥ 5 cm) geometry, a single filamentformed at the wavelength of 527 nm and was capable ofcovering up to 4 cm along the propagation axis, whilekeeping a mean FWHM diameter of a few tens of µm.The experiment revealed that the filament dynamics wasnot sustained by a balance between Kerr-induced self-focusing and plasma-induced defocusing. Numerical sim-ulations outlined, instead, the spontaneous reshaping ofthe beam into a Bessel-type X-wave fulfilling the require-ments of minimum nonlinear losses, maximum stationar-ity and localization. This scenario has been discussed inSec. IV.A, where the important role of the laser wave-length in selecting the key player able to saturate thewave collapse and support the self-guiding process wasunderlined. For this purpose, Fig. 23(a) illustrates thepulse fluence along the self-guiding range measured atthe exit plane of a 31-mm long cuvette for Pin = 6.6Pcr.Fig. 23(b) shows the X-shaped spectral-angular distribu-tion of the radiation. Plots (c,d) represent peak intensi-ties and FWHM diameters reached with similar pulse pa-rameters with and without plasma gain, which evidencesthe weak influence of plasma defocusing in this dynamics
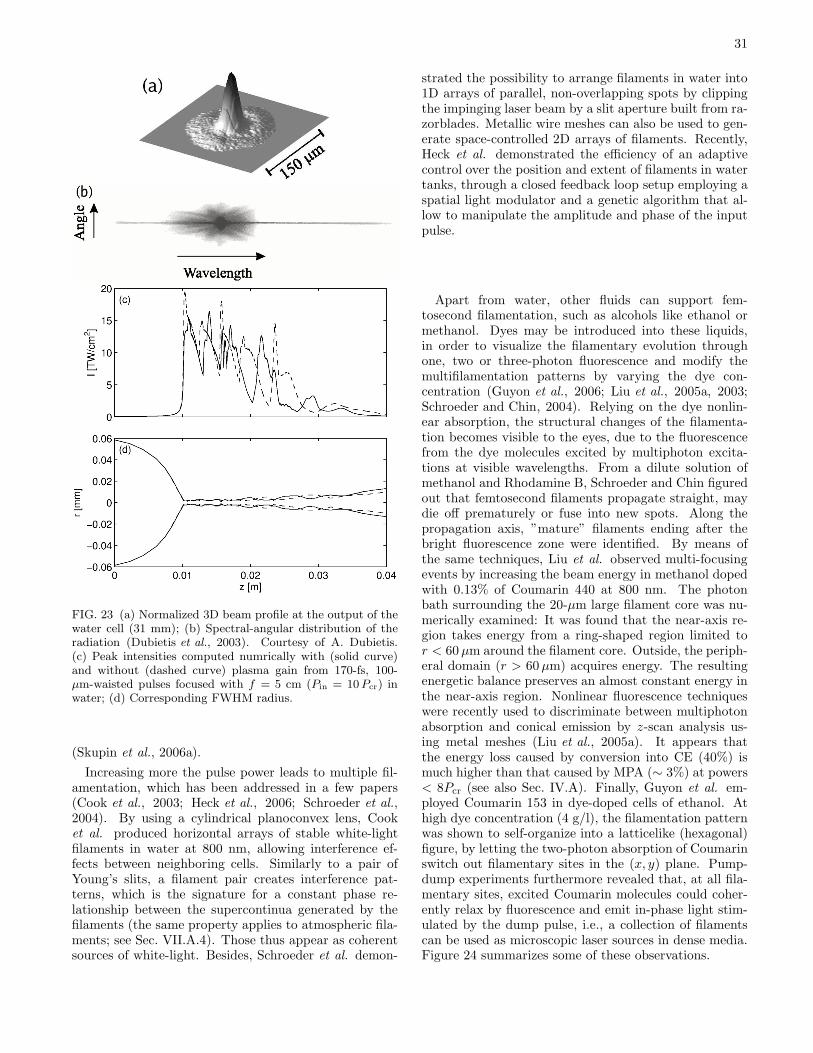
31
FIG. 23 (a) Normalized 3D beam profile at the output of thewater cell (31 mm); (b) Spectral-angular distribution of theradiation (Dubietis et al., 2003). Courtesy of A. Dubietis.(c) Peak intensities computed numrically with (solid curve)and without (dashed curve) plasma gain from 170-fs, 100-µm-waisted pulses focused with f = 5 cm (Pin = 10 Pcr) inwater; (d) Corresponding FWHM radius.
(Skupin et al., 2006a).
Increasing more the pulse power leads to multiple fil-amentation, which has been addressed in a few papers(Cook et al., 2003; Heck et al., 2006; Schroeder et al.,2004). By using a cylindrical planoconvex lens, Cooket al. produced horizontal arrays of stable white-lightfilaments in water at 800 nm, allowing interference ef-fects between neighboring cells. Similarly to a pair ofYoung’s slits, a filament pair creates interference pat-terns, which is the signature for a constant phase re-lationship between the supercontinua generated by thefilaments (the same property applies to atmospheric fila-ments; see Sec. VII.A.4). Those thus appear as coherentsources of white-light. Besides, Schroeder et al. demon-
strated the possibility to arrange filaments in water into1D arrays of parallel, non-overlapping spots by clippingthe impinging laser beam by a slit aperture built from ra-zorblades. Metallic wire meshes can also be used to gen-erate space-controlled 2D arrays of filaments. Recently,Heck et al. demonstrated the efficiency of an adaptivecontrol over the position and extent of filaments in watertanks, through a closed feedback loop setup employing aspatial light modulator and a genetic algorithm that al-low to manipulate the amplitude and phase of the inputpulse.
Apart from water, other fluids can support fem-tosecond filamentation, such as alcohols like ethanol ormethanol. Dyes may be introduced into these liquids,in order to visualize the filamentary evolution throughone, two or three-photon fluorescence and modify themultifilamentation patterns by varying the dye con-centration (Guyon et al., 2006; Liu et al., 2005a, 2003;Schroeder and Chin, 2004). Relying on the dye nonlin-ear absorption, the structural changes of the filamenta-tion becomes visible to the eyes, due to the fluorescencefrom the dye molecules excited by multiphoton excita-tions at visible wavelengths. From a dilute solution ofmethanol and Rhodamine B, Schroeder and Chin figuredout that femtosecond filaments propagate straight, maydie off prematurely or fuse into new spots. Along thepropagation axis, ”mature” filaments ending after thebright fluorescence zone were identified. By means ofthe same techniques, Liu et al. observed multi-focusingevents by increasing the beam energy in methanol dopedwith 0.13% of Coumarin 440 at 800 nm. The photonbath surrounding the 20-µm large filament core was nu-merically examined: It was found that the near-axis re-gion takes energy from a ring-shaped region limited tor < 60µm around the filament core. Outside, the periph-eral domain (r > 60µm) acquires energy. The resultingenergetic balance preserves an almost constant energy inthe near-axis region. Nonlinear fluorescence techniqueswere recently used to discriminate between multiphotonabsorption and conical emission by z-scan analysis us-ing metal meshes (Liu et al., 2005a). It appears thatthe energy loss caused by conversion into CE (40%) ismuch higher than that caused by MPA (∼ 3%) at powers< 8Pcr (see also Sec. IV.A). Finally, Guyon et al. em-ployed Coumarin 153 in dye-doped cells of ethanol. Athigh dye concentration (4 g/l), the filamentation patternwas shown to self-organize into a latticelike (hexagonal)figure, by letting the two-photon absorption of Coumarinswitch out filamentary sites in the (x, y) plane. Pump-dump experiments furthermore revealed that, at all fila-mentary sites, excited Coumarin molecules could coher-ently relax by fluorescence and emit in-phase light stim-ulated by the dump pulse, i.e., a collection of filamentscan be used as microscopic laser sources in dense media.Figure 24 summarizes some of these observations.
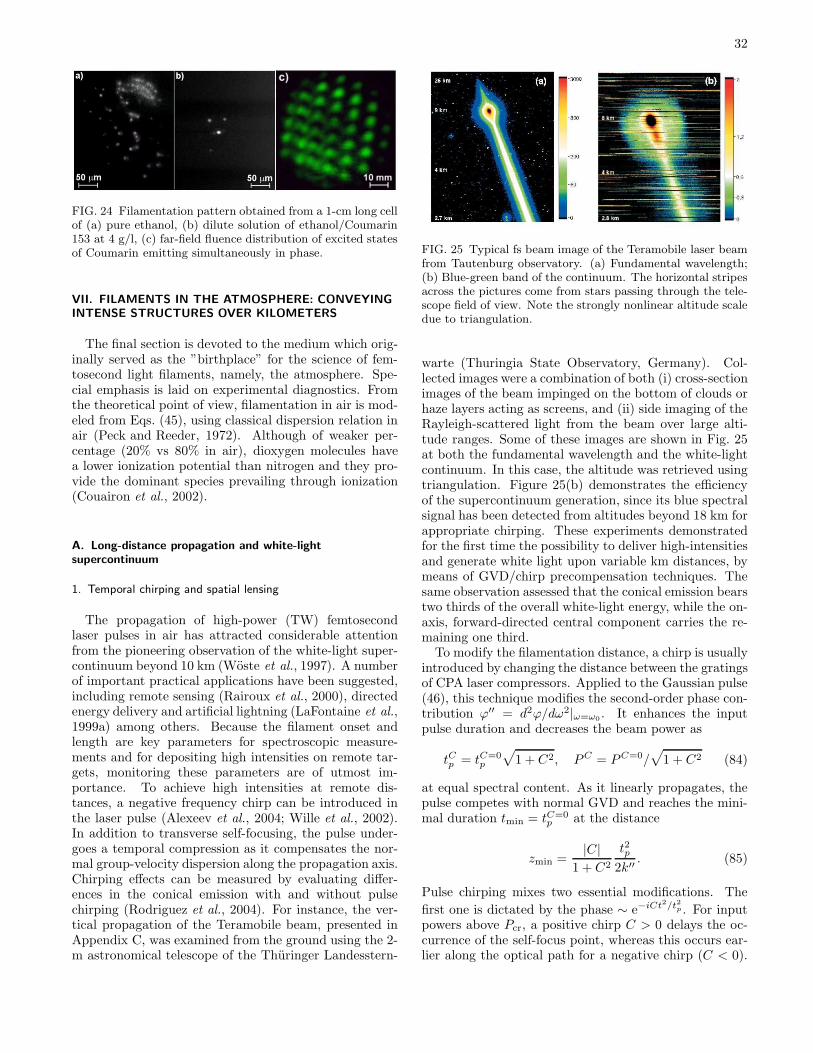
32
FIG. 24 Filamentation pattern obtained from a 1-cm long cellof (a) pure ethanol, (b) dilute solution of ethanol/Coumarin153 at 4 g/l, (c) far-field fluence distribution of excited statesof Coumarin emitting simultaneously in phase.
VII. FILAMENTS IN THE ATMOSPHERE: CONVEYINGINTENSE STRUCTURES OVER KILOMETERS
The final section is devoted to the medium which orig-inally served as the ”birthplace” for the science of fem-tosecond light filaments, namely, the atmosphere. Spe-cial emphasis is laid on experimental diagnostics. Fromthe theoretical point of view, filamentation in air is mod-eled from Eqs. (45), using classical dispersion relation inair (Peck and Reeder, 1972). Although of weaker per-centage (20% vs 80% in air), dioxygen molecules havea lower ionization potential than nitrogen and they pro-vide the dominant species prevailing through ionization(Couairon et al., 2002).
A. Long-distance propagation and white-lightsupercontinuum
1. Temporal chirping and spatial lensing
The propagation of high-power (TW) femtosecondlaser pulses in air has attracted considerable attentionfrom the pioneering observation of the white-light super-continuum beyond 10 km (Woste et al., 1997). A numberof important practical applications have been suggested,including remote sensing (Rairoux et al., 2000), directedenergy delivery and artificial lightning (LaFontaine et al.,1999a) among others. Because the filament onset andlength are key parameters for spectroscopic measure-ments and for depositing high intensities on remote tar-gets, monitoring these parameters are of utmost im-portance. To achieve high intensities at remote dis-tances, a negative frequency chirp can be introduced inthe laser pulse (Alexeev et al., 2004; Wille et al., 2002).In addition to transverse self-focusing, the pulse under-goes a temporal compression as it compensates the nor-mal group-velocity dispersion along the propagation axis.Chirping effects can be measured by evaluating differ-ences in the conical emission with and without pulsechirping (Rodriguez et al., 2004). For instance, the ver-tical propagation of the Teramobile beam, presented inAppendix C, was examined from the ground using the 2-m astronomical telescope of the Thuringer Landesstern-
FIG. 25 Typical fs beam image of the Teramobile laser beamfrom Tautenburg observatory. (a) Fundamental wavelength;(b) Blue-green band of the continuum. The horizontal stripesacross the pictures come from stars passing through the tele-scope field of view. Note the strongly nonlinear altitude scaledue to triangulation.
warte (Thuringia State Observatory, Germany). Col-lected images were a combination of both (i) cross-sectionimages of the beam impinged on the bottom of clouds orhaze layers acting as screens, and (ii) side imaging of theRayleigh-scattered light from the beam over large alti-tude ranges. Some of these images are shown in Fig. 25at both the fundamental wavelength and the white-lightcontinuum. In this case, the altitude was retrieved usingtriangulation. Figure 25(b) demonstrates the efficiencyof the supercontinuum generation, since its blue spectralsignal has been detected from altitudes beyond 18 km forappropriate chirping. These experiments demonstratedfor the first time the possibility to deliver high-intensitiesand generate white light upon variable km distances, bymeans of GVD/chirp precompensation techniques. Thesame observation assessed that the conical emission bearstwo thirds of the overall white-light energy, while the on-axis, forward-directed central component carries the re-maining one third.
To modify the filamentation distance, a chirp is usuallyintroduced by changing the distance between the gratingsof CPA laser compressors. Applied to the Gaussian pulse(46), this technique modifies the second-order phase con-tribution ϕ′′ = d2ϕ/dω2|ω=ω0 . It enhances the inputpulse duration and decreases the beam power as
tCp = tC=0p
√1 + C2, PC = PC=0/
√1 + C2 (84)
at equal spectral content. As it linearly propagates, thepulse competes with normal GVD and reaches the mini-mal duration tmin = tC=0
p at the distance
zmin =|C|
1 + C2
t2p2k′′
. (85)
Pulse chirping mixes two essential modifications. The
first one is dictated by the phase ∼ e−iCt2/t2p . For input
powers above Pcr, a positive chirp C > 0 delays the oc-currence of the self-focus point, whereas this occurs ear-lier along the optical path for a negative chirp (C < 0).
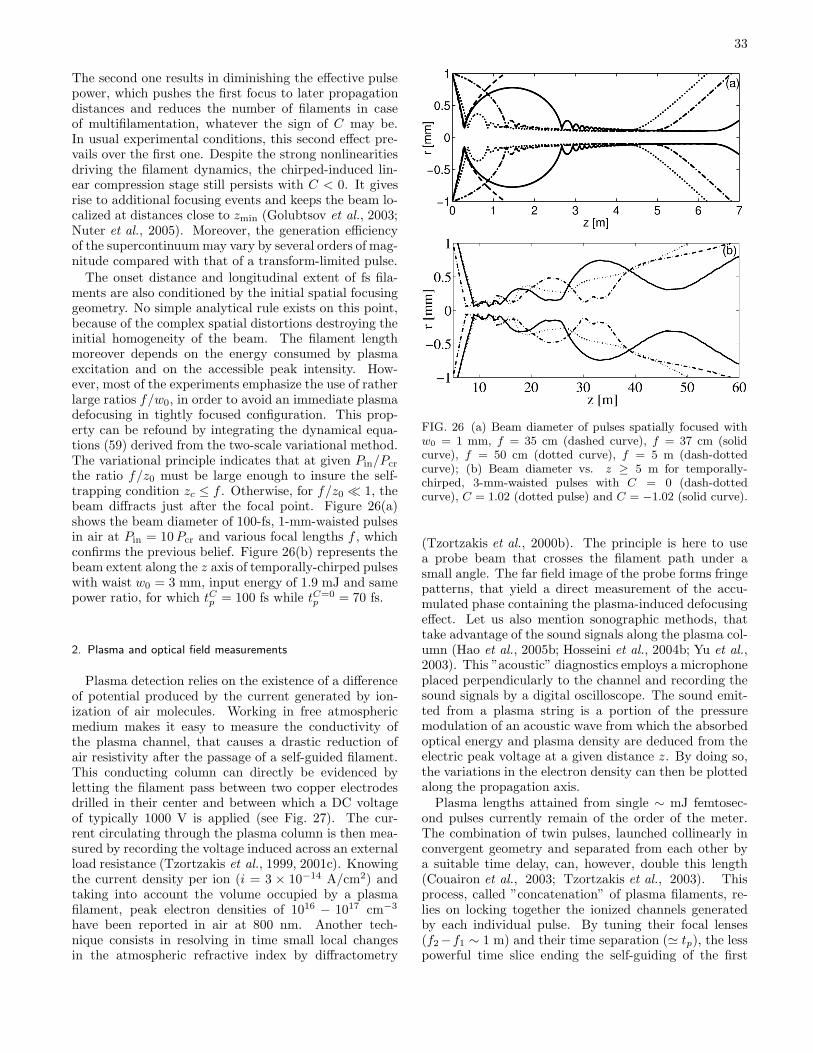
33
The second one results in diminishing the effective pulsepower, which pushes the first focus to later propagationdistances and reduces the number of filaments in caseof multifilamentation, whatever the sign of C may be.In usual experimental conditions, this second effect pre-vails over the first one. Despite the strong nonlinearitiesdriving the filament dynamics, the chirped-induced lin-ear compression stage still persists with C < 0. It givesrise to additional focusing events and keeps the beam lo-calized at distances close to zmin (Golubtsov et al., 2003;Nuter et al., 2005). Moreover, the generation efficiencyof the supercontinuum may vary by several orders of mag-nitude compared with that of a transform-limited pulse.
The onset distance and longitudinal extent of fs fila-ments are also conditioned by the initial spatial focusinggeometry. No simple analytical rule exists on this point,because of the complex spatial distortions destroying theinitial homogeneity of the beam. The filament lengthmoreover depends on the energy consumed by plasmaexcitation and on the accessible peak intensity. How-ever, most of the experiments emphasize the use of ratherlarge ratios f/w0, in order to avoid an immediate plasmadefocusing in tightly focused configuration. This prop-erty can be refound by integrating the dynamical equa-tions (59) derived from the two-scale variational method.The variational principle indicates that at given Pin/Pcr
the ratio f/z0 must be large enough to insure the self-trapping condition zc ≤ f . Otherwise, for f/z0 ≪ 1, thebeam diffracts just after the focal point. Figure 26(a)shows the beam diameter of 100-fs, 1-mm-waisted pulsesin air at Pin = 10Pcr and various focal lengths f , whichconfirms the previous belief. Figure 26(b) represents thebeam extent along the z axis of temporally-chirped pulseswith waist w0 = 3 mm, input energy of 1.9 mJ and samepower ratio, for which tCp = 100 fs while tC=0
p = 70 fs.
2. Plasma and optical field measurements
Plasma detection relies on the existence of a differenceof potential produced by the current generated by ion-ization of air molecules. Working in free atmosphericmedium makes it easy to measure the conductivity ofthe plasma channel, that causes a drastic reduction ofair resistivity after the passage of a self-guided filament.This conducting column can directly be evidenced byletting the filament pass between two copper electrodesdrilled in their center and between which a DC voltageof typically 1000 V is applied (see Fig. 27). The cur-rent circulating through the plasma column is then mea-sured by recording the voltage induced across an externalload resistance (Tzortzakis et al., 1999, 2001c). Knowingthe current density per ion (i = 3 × 10⁻¹⁴ A/cm2) andtaking into account the volume occupied by a plasmafilament, peak electron densities of 1016 − 1017 cm−3
have been reported in air at 800 nm. Another tech-nique consists in resolving in time small local changesin the atmospheric refractive index by diffractometry
FIG. 26 (a) Beam diameter of pulses spatially focused withw0 = 1 mm, f = 35 cm (dashed curve), f = 37 cm (solidcurve), f = 50 cm (dotted curve), f = 5 m (dash-dottedcurve); (b) Beam diameter vs. z ≥ 5 m for temporally-chirped, 3-mm-waisted pulses with C = 0 (dash-dottedcurve), C = 1.02 (dotted pulse) and C = −1.02 (solid curve).
(Tzortzakis et al., 2000b). The principle is here to usea probe beam that crosses the filament path under asmall angle. The far field image of the probe forms fringepatterns, that yield a direct measurement of the accu-mulated phase containing the plasma-induced defocusingeffect. Let us also mention sonographic methods, thattake advantage of the sound signals along the plasma col-umn (Hao et al., 2005b; Hosseini et al., 2004b; Yu et al.,2003). This ”acoustic” diagnostics employs a microphoneplaced perpendicularly to the channel and recording thesound signals by a digital oscilloscope. The sound emit-ted from a plasma string is a portion of the pressuremodulation of an acoustic wave from which the absorbedoptical energy and plasma density are deduced from theelectric peak voltage at a given distance z. By doing so,the variations in the electron density can then be plottedalong the propagation axis.
Plasma lengths attained from single ∼ mJ femtosec-ond pulses currently remain of the order of the meter.The combination of twin pulses, launched collinearly inconvergent geometry and separated from each other bya suitable time delay, can, however, double this length(Couairon et al., 2003; Tzortzakis et al., 2003). Thisprocess, called ”concatenation” of plasma filaments, re-lies on locking together the ionized channels generatedby each individual pulse. By tuning their focal lenses(f2−f1 ∼ 1 m) and their time separation (≃ tp), the lesspowerful time slice ending the self-guiding of the first
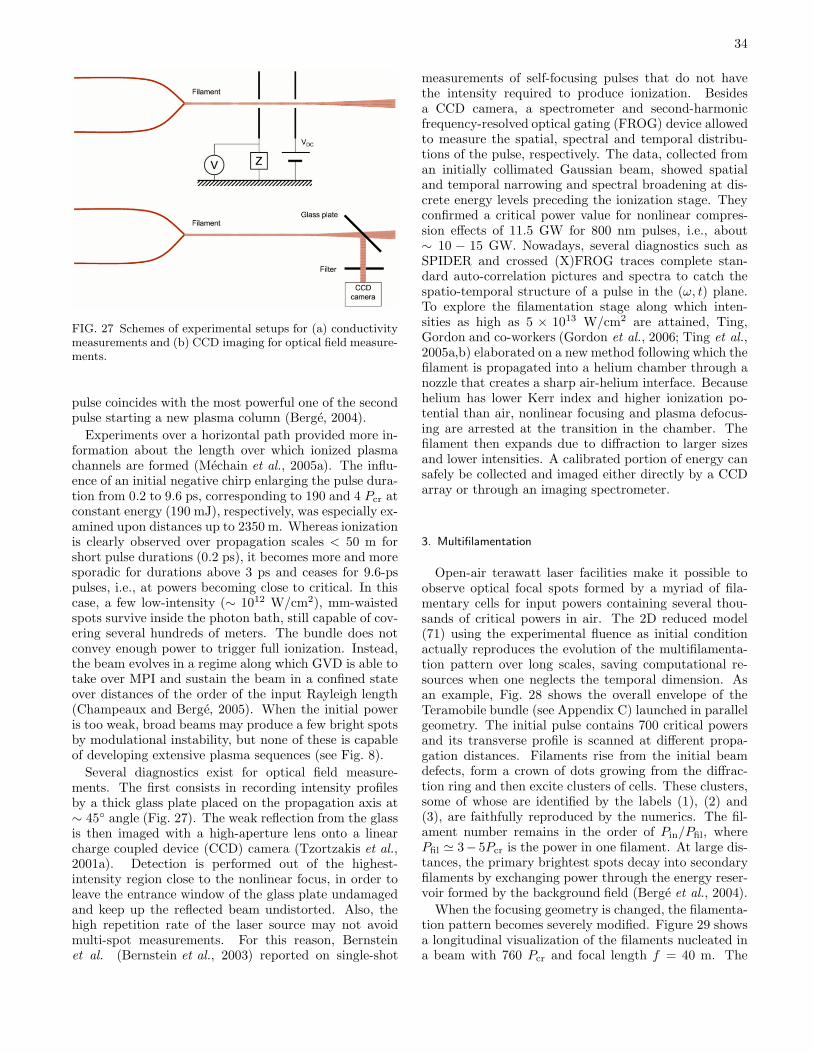
34
FIG. 27 Schemes of experimental setups for (a) conductivitymeasurements and (b) CCD imaging for optical field measure-ments.
pulse coincides with the most powerful one of the secondpulse starting a new plasma column (Berge, 2004).
Experiments over a horizontal path provided more in-formation about the length over which ionized plasmachannels are formed (Mechain et al., 2005a). The influ-ence of an initial negative chirp enlarging the pulse dura-tion from 0.2 to 9.6 ps, corresponding to 190 and 4 Pcr atconstant energy (190 mJ), respectively, was especially ex-amined upon distances up to 2350 m. Whereas ionizationis clearly observed over propagation scales < 50 m forshort pulse durations (0.2 ps), it becomes more and moresporadic for durations above 3 ps and ceases for 9.6-pspulses, i.e., at powers becoming close to critical. In thiscase, a few low-intensity (∼ 1012 W/cm2), mm-waistedspots survive inside the photon bath, still capable of cov-ering several hundreds of meters. The bundle does notconvey enough power to trigger full ionization. Instead,the beam evolves in a regime along which GVD is able totake over MPI and sustain the beam in a confined stateover distances of the order of the input Rayleigh length(Champeaux and Berge, 2005). When the initial poweris too weak, broad beams may produce a few bright spotsby modulational instability, but none of these is capableof developing extensive plasma sequences (see Fig. 8).
Several diagnostics exist for optical field measure-ments. The first consists in recording intensity profilesby a thick glass plate placed on the propagation axis at∼ 45 angle (Fig. 27). The weak reflection from the glassis then imaged with a high-aperture lens onto a linearcharge coupled device (CCD) camera (Tzortzakis et al.,2001a). Detection is performed out of the highest-intensity region close to the nonlinear focus, in order toleave the entrance window of the glass plate undamagedand keep up the reflected beam undistorted. Also, thehigh repetition rate of the laser source may not avoidmulti-spot measurements. For this reason, Bernsteinet al. (Bernstein et al., 2003) reported on single-shot
measurements of self-focusing pulses that do not havethe intensity required to produce ionization. Besidesa CCD camera, a spectrometer and second-harmonicfrequency-resolved optical gating (FROG) device allowedto measure the spatial, spectral and temporal distribu-tions of the pulse, respectively. The data, collected froman initially collimated Gaussian beam, showed spatialand temporal narrowing and spectral broadening at dis-crete energy levels preceding the ionization stage. Theyconfirmed a critical power value for nonlinear compres-sion effects of 11.5 GW for 800 nm pulses, i.e., about∼ 10 − 15 GW. Nowadays, several diagnostics such asSPIDER and crossed (X)FROG traces complete stan-dard auto-correlation pictures and spectra to catch thespatio-temporal structure of a pulse in the (ω, t) plane.To explore the filamentation stage along which inten-sities as high as 5 × 10¹³ W/cm2 are attained, Ting,Gordon and co-workers (Gordon et al., 2006; Ting et al.,2005a,b) elaborated on a new method following which thefilament is propagated into a helium chamber through anozzle that creates a sharp air-helium interface. Becausehelium has lower Kerr index and higher ionization po-tential than air, nonlinear focusing and plasma defocus-ing are arrested at the transition in the chamber. Thefilament then expands due to diffraction to larger sizesand lower intensities. A calibrated portion of energy cansafely be collected and imaged either directly by a CCDarray or through an imaging spectrometer.
3. Multifilamentation
Open-air terawatt laser facilities make it possible toobserve optical focal spots formed by a myriad of fila-mentary cells for input powers containing several thou-sands of critical powers in air. The 2D reduced model(71) using the experimental fluence as initial conditionactually reproduces the evolution of the multifilamenta-tion pattern over long scales, saving computational re-sources when one neglects the temporal dimension. Asan example, Fig. 28 shows the overall envelope of theTeramobile bundle (see Appendix C) launched in parallelgeometry. The initial pulse contains 700 critical powersand its transverse profile is scanned at different propa-gation distances. Filaments rise from the initial beamdefects, form a crown of dots growing from the diffrac-tion ring and then excite clusters of cells. These clusters,some of whose are identified by the labels (1), (2) and(3), are faithfully reproduced by the numerics. The fil-ament number remains in the order of Pin/Pfil, wherePfil ≃ 3− 5Pcr is the power in one filament. At large dis-tances, the primary brightest spots decay into secondaryfilaments by exchanging power through the energy reser-voir formed by the background field (Berge et al., 2004).
When the focusing geometry is changed, the filamenta-tion pattern becomes severely modified. Figure 29 showsa longitudinal visualization of the filaments nucleated ina beam with 760 Pcr and focal length f = 40 m. The
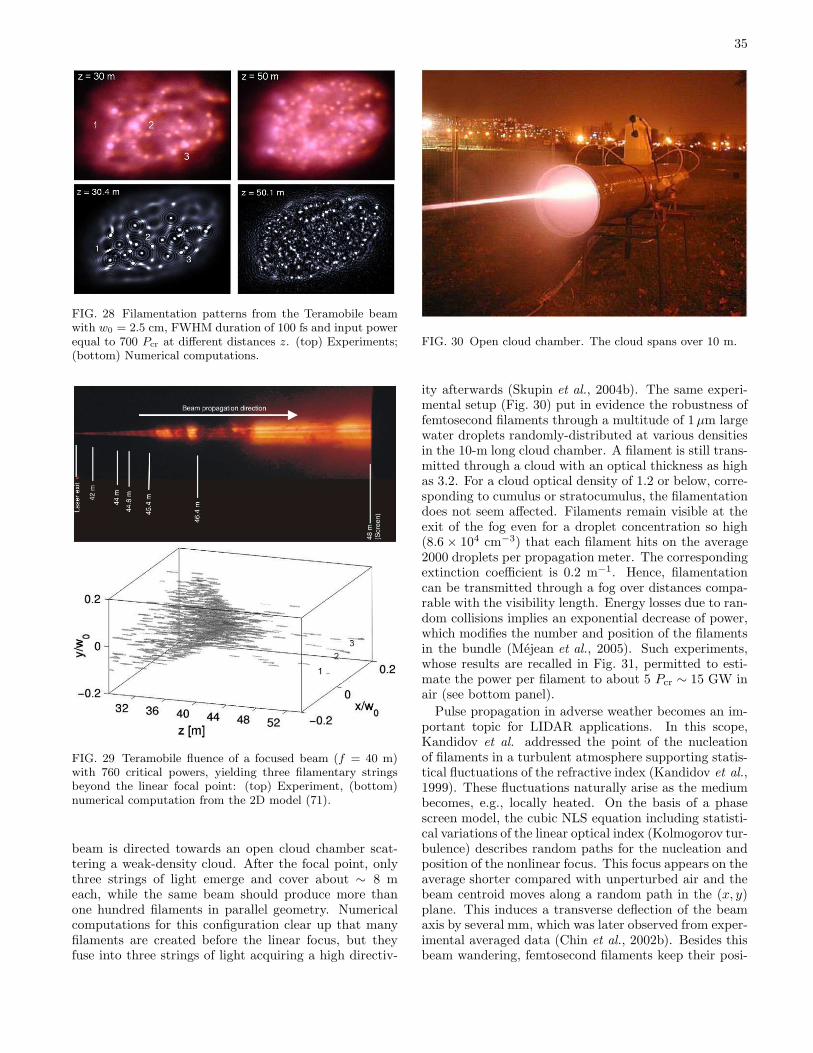
35
FIG. 28 Filamentation patterns from the Teramobile beamwith w0 = 2.5 cm, FWHM duration of 100 fs and input powerequal to 700 Pcr at different distances z. (top) Experiments;(bottom) Numerical computations.
FIG. 29 Teramobile fluence of a focused beam (f = 40 m)with 760 critical powers, yielding three filamentary stringsbeyond the linear focal point: (top) Experiment, (bottom)numerical computation from the 2D model (71).
beam is directed towards an open cloud chamber scat-tering a weak-density cloud. After the focal point, onlythree strings of light emerge and cover about ∼ 8 meach, while the same beam should produce more thanone hundred filaments in parallel geometry. Numericalcomputations for this configuration clear up that manyfilaments are created before the linear focus, but theyfuse into three strings of light acquiring a high directiv-
FIG. 30 Open cloud chamber. The cloud spans over 10 m.
ity afterwards (Skupin et al., 2004b). The same experi-mental setup (Fig. 30) put in evidence the robustness offemtosecond filaments through a multitude of 1µm largewater droplets randomly-distributed at various densitiesin the 10-m long cloud chamber. A filament is still trans-mitted through a cloud with an optical thickness as highas 3.2. For a cloud optical density of 1.2 or below, corre-sponding to cumulus or stratocumulus, the filamentationdoes not seem affected. Filaments remain visible at theexit of the fog even for a droplet concentration so high(8.6 × 104 cm−3) that each filament hits on the average2000 droplets per propagation meter. The correspondingextinction coefficient is 0.2 m−1. Hence, filamentationcan be transmitted through a fog over distances compa-rable with the visibility length. Energy losses due to ran-dom collisions implies an exponential decrease of power,which modifies the number and position of the filamentsin the bundle (Mejean et al., 2005). Such experiments,whose results are recalled in Fig. 31, permitted to esti-mate the power per filament to about 5 Pcr ∼ 15 GW inair (see bottom panel).
Pulse propagation in adverse weather becomes an im-portant topic for LIDAR applications. In this scope,Kandidov et al. addressed the point of the nucleationof filaments in a turbulent atmosphere supporting statis-tical fluctuations of the refractive index (Kandidov et al.,1999). These fluctuations naturally arise as the mediumbecomes, e.g., locally heated. On the basis of a phasescreen model, the cubic NLS equation including statisti-cal variations of the linear optical index (Kolmogorov tur-bulence) describes random paths for the nucleation andposition of the nonlinear focus. This focus appears on theaverage shorter compared with unperturbed air and thebeam centroid moves along a random path in the (x, y)plane. This induces a transverse deflection of the beamaxis by several mm, which was later observed from exper-imental averaged data (Chin et al., 2002b). Besides thisbeam wandering, femtosecond filaments keep their posi-
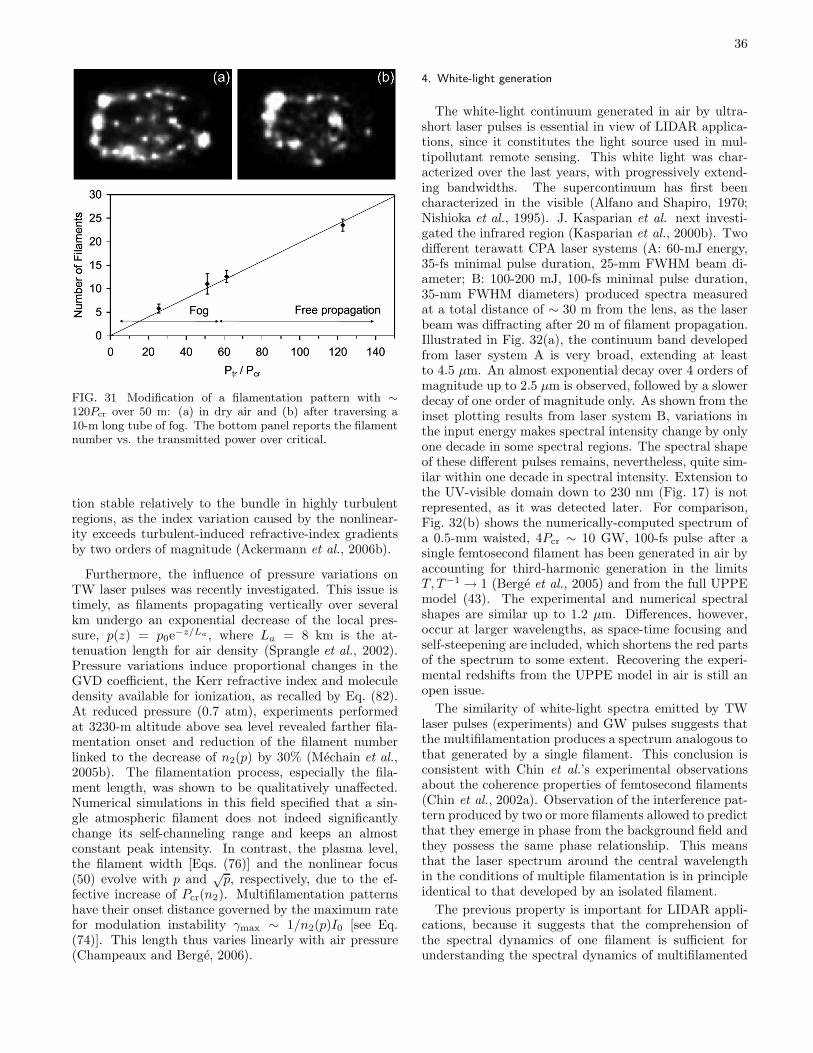
36
FIG. 31 Modification of a filamentation pattern with ∼120Pcr over 50 m: (a) in dry air and (b) after traversing a10-m long tube of fog. The bottom panel reports the filamentnumber vs. the transmitted power over critical.
tion stable relatively to the bundle in highly turbulentregions, as the index variation caused by the nonlinear-ity exceeds turbulent-induced refractive-index gradientsby two orders of magnitude (Ackermann et al., 2006b).
Furthermore, the influence of pressure variations onTW laser pulses was recently investigated. This issue istimely, as filaments propagating vertically over severalkm undergo an exponential decrease of the local pres-sure, p(z) = p0e
−z/La , where La = 8 km is the at-tenuation length for air density (Sprangle et al., 2002).Pressure variations induce proportional changes in theGVD coefficient, the Kerr refractive index and moleculedensity available for ionization, as recalled by Eq. (82).At reduced pressure (0.7 atm), experiments performedat 3230-m altitude above sea level revealed farther fila-mentation onset and reduction of the filament numberlinked to the decrease of n2(p) by 30% (Mechain et al.,2005b). The filamentation process, especially the fila-ment length, was shown to be qualitatively unaffected.Numerical simulations in this field specified that a sin-gle atmospheric filament does not indeed significantlychange its self-channeling range and keeps an almostconstant peak intensity. In contrast, the plasma level,the filament width [Eqs. (76)] and the nonlinear focus(50) evolve with p and
√p, respectively, due to the ef-
fective increase of Pcr(n2). Multifilamentation patternshave their onset distance governed by the maximum ratefor modulation instability γmax ∼ 1/n2(p)I0 [see Eq.(74)]. This length thus varies linearly with air pressure(Champeaux and Berge, 2006).
4. White-light generation
The white-light continuum generated in air by ultra-short laser pulses is essential in view of LIDAR applica-tions, since it constitutes the light source used in mul-tipollutant remote sensing. This white light was char-acterized over the last years, with progressively extend-ing bandwidths. The supercontinuum has first beencharacterized in the visible (Alfano and Shapiro, 1970;Nishioka et al., 1995). J. Kasparian et al. next investi-gated the infrared region (Kasparian et al., 2000b). Twodifferent terawatt CPA laser systems (A: 60-mJ energy,35-fs minimal pulse duration, 25-mm FWHM beam di-ameter; B: 100-200 mJ, 100-fs minimal pulse duration,35-mm FWHM diameters) produced spectra measuredat a total distance of ∼ 30 m from the lens, as the laserbeam was diffracting after 20 m of filament propagation.Illustrated in Fig. 32(a), the continuum band developedfrom laser system A is very broad, extending at leastto 4.5 µm. An almost exponential decay over 4 orders ofmagnitude up to 2.5 µm is observed, followed by a slowerdecay of one order of magnitude only. As shown from theinset plotting results from laser system B, variations inthe input energy makes spectral intensity change by onlyone decade in some spectral regions. The spectral shapeof these different pulses remains, nevertheless, quite sim-ilar within one decade in spectral intensity. Extension tothe UV-visible domain down to 230 nm (Fig. 17) is notrepresented, as it was detected later. For comparison,Fig. 32(b) shows the numerically-computed spectrum ofa 0.5-mm waisted, 4Pcr ∼ 10 GW, 100-fs pulse after asingle femtosecond filament has been generated in air byaccounting for third-harmonic generation in the limitsT, T−1 → 1 (Berge et al., 2005) and from the full UPPEmodel (43). The experimental and numerical spectralshapes are similar up to 1.2 µm. Differences, however,occur at larger wavelengths, as space-time focusing andself-steepening are included, which shortens the red partsof the spectrum to some extent. Recovering the experi-mental redshifts from the UPPE model in air is still anopen issue.
The similarity of white-light spectra emitted by TWlaser pulses (experiments) and GW pulses suggests thatthe multifilamentation produces a spectrum analogous tothat generated by a single filament. This conclusion isconsistent with Chin et al.’s experimental observationsabout the coherence properties of femtosecond filaments(Chin et al., 2002a). Observation of the interference pat-tern produced by two or more filaments allowed to predictthat they emerge in phase from the background field andthey possess the same phase relationship. This meansthat the laser spectrum around the central wavelengthin the conditions of multiple filamentation is in principleidentical to that developed by an isolated filament.
The previous property is important for LIDAR appli-cations, because it suggests that the comprehension ofthe spectral dynamics of one filament is sufficient forunderstanding the spectral dynamics of multifilamented
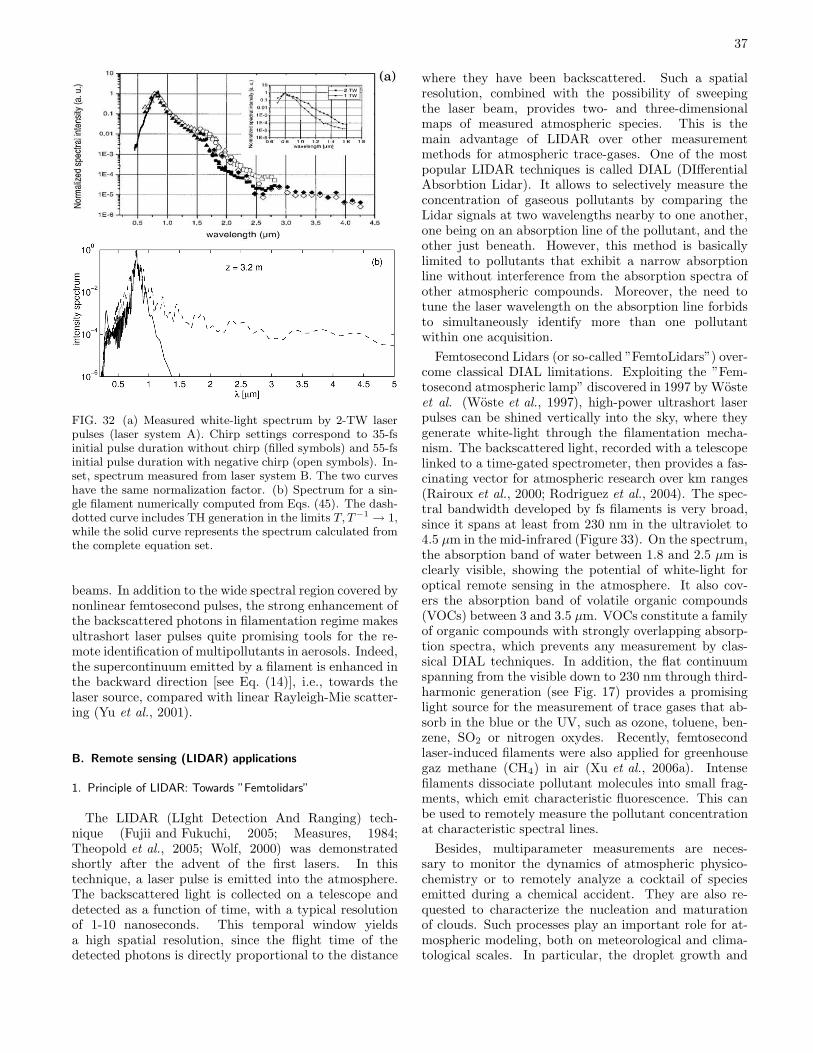
37
FIG. 32 (a) Measured white-light spectrum by 2-TW laserpulses (laser system A). Chirp settings correspond to 35-fsinitial pulse duration without chirp (filled symbols) and 55-fsinitial pulse duration with negative chirp (open symbols). In-set, spectrum measured from laser system B. The two curveshave the same normalization factor. (b) Spectrum for a sin-gle filament numerically computed from Eqs. (45). The dash-dotted curve includes TH generation in the limits T, T−1 → 1,while the solid curve represents the spectrum calculated fromthe complete equation set.
beams. In addition to the wide spectral region covered bynonlinear femtosecond pulses, the strong enhancement ofthe backscattered photons in filamentation regime makesultrashort laser pulses quite promising tools for the re-mote identification of multipollutants in aerosols. Indeed,the supercontinuum emitted by a filament is enhanced inthe backward direction [see Eq. (14)], i.e., towards thelaser source, compared with linear Rayleigh-Mie scatter-ing (Yu et al., 2001).
B. Remote sensing (LIDAR) applications
1. Principle of LIDAR: Towards ”Femtolidars”
The LIDAR (LIght Detection And Ranging) tech-nique (Fujii and Fukuchi, 2005; Measures, 1984;Theopold et al., 2005; Wolf, 2000) was demonstratedshortly after the advent of the first lasers. In thistechnique, a laser pulse is emitted into the atmosphere.The backscattered light is collected on a telescope anddetected as a function of time, with a typical resolutionof 1-10 nanoseconds. This temporal window yieldsa high spatial resolution, since the flight time of thedetected photons is directly proportional to the distance
where they have been backscattered. Such a spatialresolution, combined with the possibility of sweepingthe laser beam, provides two- and three-dimensionalmaps of measured atmospheric species. This is themain advantage of LIDAR over other measurementmethods for atmospheric trace-gases. One of the mostpopular LIDAR techniques is called DIAL (DIfferentialAbsorbtion Lidar). It allows to selectively measure theconcentration of gaseous pollutants by comparing theLidar signals at two wavelengths nearby to one another,one being on an absorption line of the pollutant, and theother just beneath. However, this method is basicallylimited to pollutants that exhibit a narrow absorptionline without interference from the absorption spectra ofother atmospheric compounds. Moreover, the need totune the laser wavelength on the absorption line forbidsto simultaneously identify more than one pollutantwithin one acquisition.
Femtosecond Lidars (or so-called ”FemtoLidars”) over-come classical DIAL limitations. Exploiting the ”Fem-tosecond atmospheric lamp” discovered in 1997 by Wosteet al. (Woste et al., 1997), high-power ultrashort laserpulses can be shined vertically into the sky, where theygenerate white-light through the filamentation mecha-nism. The backscattered light, recorded with a telescopelinked to a time-gated spectrometer, then provides a fas-cinating vector for atmospheric research over km ranges(Rairoux et al., 2000; Rodriguez et al., 2004). The spec-tral bandwidth developed by fs filaments is very broad,since it spans at least from 230 nm in the ultraviolet to4.5 µm in the mid-infrared (Figure 33). On the spectrum,the absorption band of water between 1.8 and 2.5 µm isclearly visible, showing the potential of white-light foroptical remote sensing in the atmosphere. It also cov-ers the absorption band of volatile organic compounds(VOCs) between 3 and 3.5 µm. VOCs constitute a familyof organic compounds with strongly overlapping absorp-tion spectra, which prevents any measurement by clas-sical DIAL techniques. In addition, the flat continuumspanning from the visible down to 230 nm through third-harmonic generation (see Fig. 17) provides a promisinglight source for the measurement of trace gases that ab-sorb in the blue or the UV, such as ozone, toluene, ben-zene, SO2 or nitrogen oxydes. Recently, femtosecondlaser-induced filaments were also applied for greenhousegaz methane (CH4) in air (Xu et al., 2006a). Intensefilaments dissociate pollutant molecules into small frag-ments, which emit characteristic fluorescence. This canbe used to remotely measure the pollutant concentrationat characteristic spectral lines.
Besides, multiparameter measurements are neces-sary to monitor the dynamics of atmospheric physico-chemistry or to remotely analyze a cocktail of speciesemitted during a chemical accident. They are also re-quested to characterize the nucleation and maturationof clouds. Such processes play an important role for at-mospheric modeling, both on meteorological and clima-tological scales. In particular, the droplet growth and
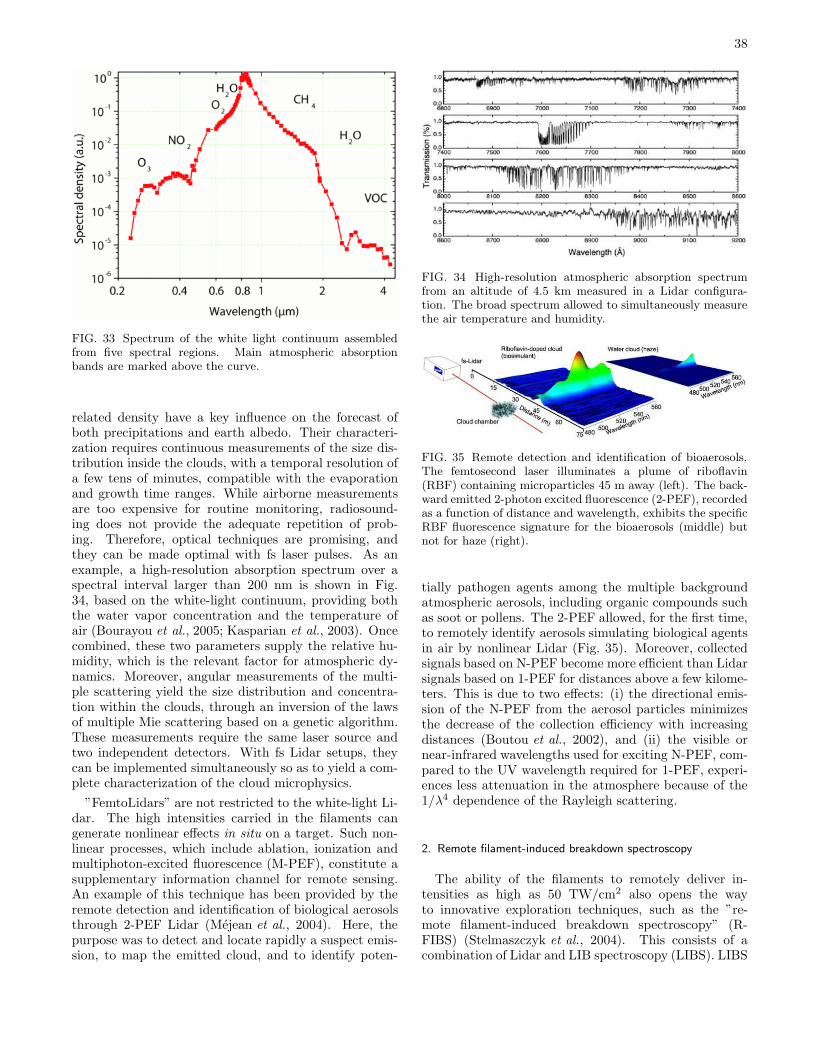
38
FIG. 33 Spectrum of the white light continuum assembledfrom five spectral regions. Main atmospheric absorptionbands are marked above the curve.
related density have a key influence on the forecast ofboth precipitations and earth albedo. Their characteri-zation requires continuous measurements of the size dis-tribution inside the clouds, with a temporal resolution ofa few tens of minutes, compatible with the evaporationand growth time ranges. While airborne measurementsare too expensive for routine monitoring, radiosound-ing does not provide the adequate repetition of prob-ing. Therefore, optical techniques are promising, andthey can be made optimal with fs laser pulses. As anexample, a high-resolution absorption spectrum over aspectral interval larger than 200 nm is shown in Fig.34, based on the white-light continuum, providing boththe water vapor concentration and the temperature ofair (Bourayou et al., 2005; Kasparian et al., 2003). Oncecombined, these two parameters supply the relative hu-midity, which is the relevant factor for atmospheric dy-namics. Moreover, angular measurements of the multi-ple scattering yield the size distribution and concentra-tion within the clouds, through an inversion of the lawsof multiple Mie scattering based on a genetic algorithm.These measurements require the same laser source andtwo independent detectors. With fs Lidar setups, theycan be implemented simultaneously so as to yield a com-plete characterization of the cloud microphysics.
”FemtoLidars” are not restricted to the white-light Li-dar. The high intensities carried in the filaments cangenerate nonlinear effects in situ on a target. Such non-linear processes, which include ablation, ionization andmultiphoton-excited fluorescence (M-PEF), constitute asupplementary information channel for remote sensing.An example of this technique has been provided by theremote detection and identification of biological aerosolsthrough 2-PEF Lidar (Mejean et al., 2004). Here, thepurpose was to detect and locate rapidly a suspect emis-sion, to map the emitted cloud, and to identify poten-
FIG. 34 High-resolution atmospheric absorption spectrumfrom an altitude of 4.5 km measured in a Lidar configura-tion. The broad spectrum allowed to simultaneously measurethe air temperature and humidity.
FIG. 35 Remote detection and identification of bioaerosols.The femtosecond laser illuminates a plume of riboflavin(RBF) containing microparticles 45 m away (left). The back-ward emitted 2-photon excited fluorescence (2-PEF), recordedas a function of distance and wavelength, exhibits the specificRBF fluorescence signature for the bioaerosols (middle) butnot for haze (right).
tially pathogen agents among the multiple backgroundatmospheric aerosols, including organic compounds suchas soot or pollens. The 2-PEF allowed, for the first time,to remotely identify aerosols simulating biological agentsin air by nonlinear Lidar (Fig. 35). Moreover, collectedsignals based on N-PEF become more efficient than Lidarsignals based on 1-PEF for distances above a few kilome-ters. This is due to two effects: (i) the directional emis-sion of the N-PEF from the aerosol particles minimizesthe decrease of the collection efficiency with increasingdistances (Boutou et al., 2002), and (ii) the visible ornear-infrared wavelengths used for exciting N-PEF, com-pared to the UV wavelength required for 1-PEF, experi-ences less attenuation in the atmosphere because of the1/λ4 dependence of the Rayleigh scattering.
2. Remote filament-induced breakdown spectroscopy
The ability of the filaments to remotely deliver in-tensities as high as 50 TW/cm2 also opens the wayto innovative exploration techniques, such as the ”re-mote filament-induced breakdown spectroscopy” (R-FIBS) (Stelmaszczyk et al., 2004). This consists of acombination of Lidar and LIB spectroscopy (LIBS). LIBS
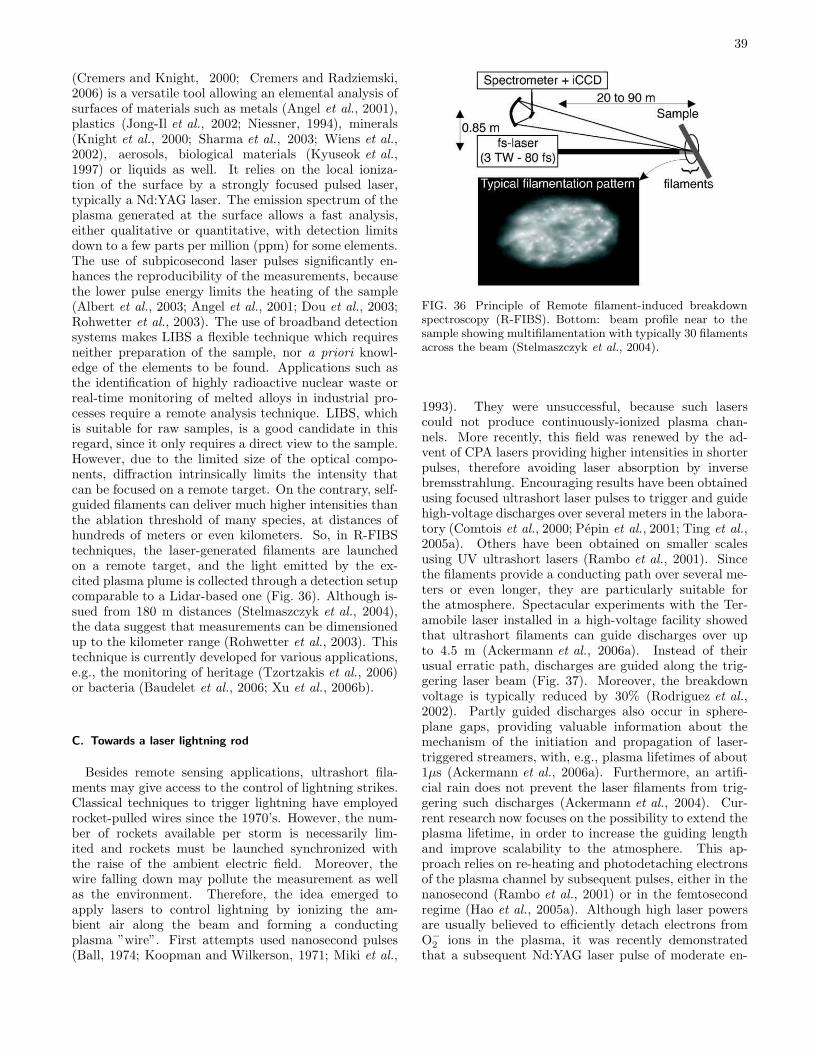
39
(Cremers and Knight, 2000; Cremers and Radziemski,2006) is a versatile tool allowing an elemental analysis ofsurfaces of materials such as metals (Angel et al., 2001),plastics (Jong-Il et al., 2002; Niessner, 1994), minerals(Knight et al., 2000; Sharma et al., 2003; Wiens et al.,2002), aerosols, biological materials (Kyuseok et al.,1997) or liquids as well. It relies on the local ioniza-tion of the surface by a strongly focused pulsed laser,typically a Nd:YAG laser. The emission spectrum of theplasma generated at the surface allows a fast analysis,either qualitative or quantitative, with detection limitsdown to a few parts per million (ppm) for some elements.The use of subpicosecond laser pulses significantly en-hances the reproducibility of the measurements, becausethe lower pulse energy limits the heating of the sample(Albert et al., 2003; Angel et al., 2001; Dou et al., 2003;Rohwetter et al., 2003). The use of broadband detectionsystems makes LIBS a flexible technique which requiresneither preparation of the sample, nor a priori knowl-edge of the elements to be found. Applications such asthe identification of highly radioactive nuclear waste orreal-time monitoring of melted alloys in industrial pro-cesses require a remote analysis technique. LIBS, whichis suitable for raw samples, is a good candidate in thisregard, since it only requires a direct view to the sample.However, due to the limited size of the optical compo-nents, diffraction intrinsically limits the intensity thatcan be focused on a remote target. On the contrary, self-guided filaments can deliver much higher intensities thanthe ablation threshold of many species, at distances ofhundreds of meters or even kilometers. So, in R-FIBStechniques, the laser-generated filaments are launchedon a remote target, and the light emitted by the ex-cited plasma plume is collected through a detection setupcomparable to a Lidar-based one (Fig. 36). Although is-sued from 180 m distances (Stelmaszczyk et al., 2004),the data suggest that measurements can be dimensionedup to the kilometer range (Rohwetter et al., 2003). Thistechnique is currently developed for various applications,e.g., the monitoring of heritage (Tzortzakis et al., 2006)or bacteria (Baudelet et al., 2006; Xu et al., 2006b).
C. Towards a laser lightning rod
Besides remote sensing applications, ultrashort fila-ments may give access to the control of lightning strikes.Classical techniques to trigger lightning have employedrocket-pulled wires since the 1970’s. However, the num-ber of rockets available per storm is necessarily lim-ited and rockets must be launched synchronized withthe raise of the ambient electric field. Moreover, thewire falling down may pollute the measurement as wellas the environment. Therefore, the idea emerged toapply lasers to control lightning by ionizing the am-bient air along the beam and forming a conductingplasma ”wire”. First attempts used nanosecond pulses(Ball, 1974; Koopman and Wilkerson, 1971; Miki et al.,
FIG. 36 Principle of Remote filament-induced breakdownspectroscopy (R-FIBS). Bottom: beam profile near to thesample showing multifilamentation with typically 30 filamentsacross the beam (Stelmaszczyk et al., 2004).
1993). They were unsuccessful, because such laserscould not produce continuously-ionized plasma chan-nels. More recently, this field was renewed by the ad-vent of CPA lasers providing higher intensities in shorterpulses, therefore avoiding laser absorption by inversebremsstrahlung. Encouraging results have been obtainedusing focused ultrashort laser pulses to trigger and guidehigh-voltage discharges over several meters in the labora-tory (Comtois et al., 2000; Pepin et al., 2001; Ting et al.,2005a). Others have been obtained on smaller scalesusing UV ultrashort lasers (Rambo et al., 2001). Sincethe filaments provide a conducting path over several me-ters or even longer, they are particularly suitable forthe atmosphere. Spectacular experiments with the Ter-amobile laser installed in a high-voltage facility showedthat ultrashort filaments can guide discharges over upto 4.5 m (Ackermann et al., 2006a). Instead of theirusual erratic path, discharges are guided along the trig-gering laser beam (Fig. 37). Moreover, the breakdownvoltage is typically reduced by 30% (Rodriguez et al.,2002). Partly guided discharges also occur in sphere-plane gaps, providing valuable information about themechanism of the initiation and propagation of laser-triggered streamers, with, e.g., plasma lifetimes of about1µs (Ackermann et al., 2006a). Furthermore, an artifi-cial rain does not prevent the laser filaments from trig-gering such discharges (Ackermann et al., 2004). Cur-rent research now focuses on the possibility to extend theplasma lifetime, in order to increase the guiding lengthand improve scalability to the atmosphere. This ap-proach relies on re-heating and photodetaching electronsof the plasma channel by subsequent pulses, either in thenanosecond (Rambo et al., 2001) or in the femtosecondregime (Hao et al., 2005a). Although high laser powersare usually believed to efficiently detach electrons fromO−
2 ions in the plasma, it was recently demonstratedthat a subsequent Nd:YAG laser pulse of moderate en-
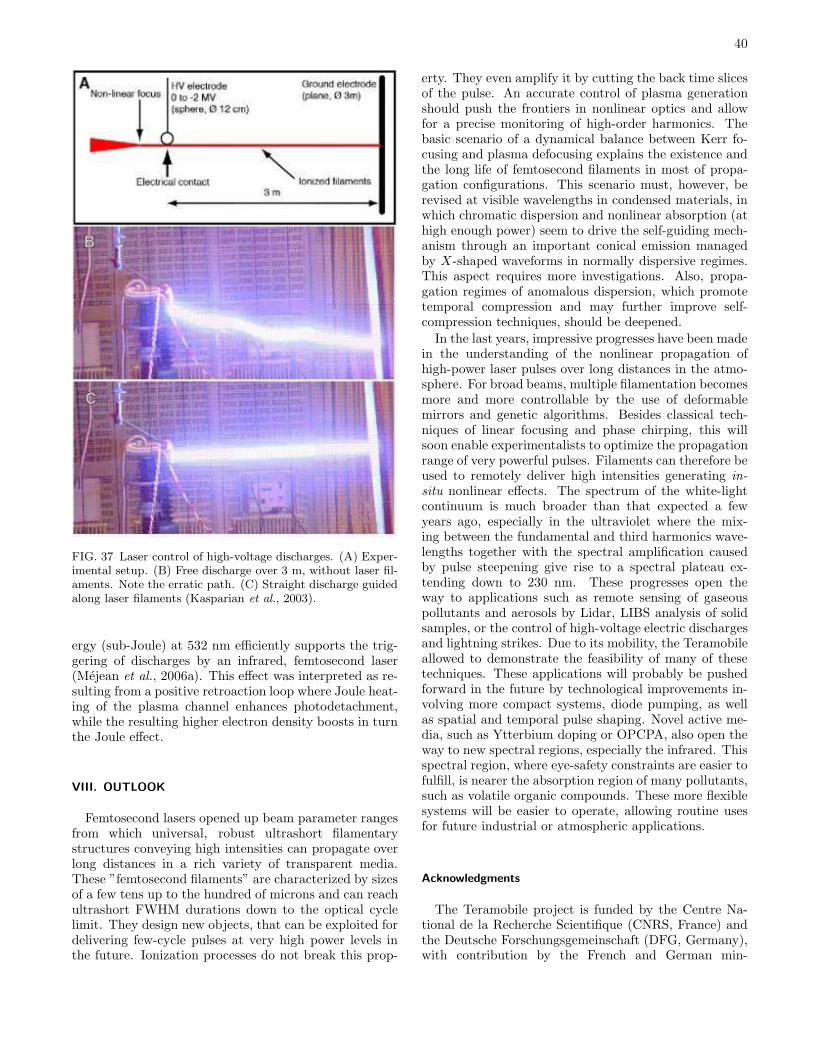
40
FIG. 37 Laser control of high-voltage discharges. (A) Exper-imental setup. (B) Free discharge over 3 m, without laser fil-aments. Note the erratic path. (C) Straight discharge guidedalong laser filaments (Kasparian et al., 2003).
ergy (sub-Joule) at 532 nm efficiently supports the trig-gering of discharges by an infrared, femtosecond laser(Mejean et al., 2006a). This effect was interpreted as re-sulting from a positive retroaction loop where Joule heat-ing of the plasma channel enhances photodetachment,while the resulting higher electron density boosts in turnthe Joule effect.
VIII. OUTLOOK
Femtosecond lasers opened up beam parameter rangesfrom which universal, robust ultrashort filamentarystructures conveying high intensities can propagate overlong distances in a rich variety of transparent media.These ”femtosecond filaments” are characterized by sizesof a few tens up to the hundred of microns and can reachultrashort FWHM durations down to the optical cyclelimit. They design new objects, that can be exploited fordelivering few-cycle pulses at very high power levels inthe future. Ionization processes do not break this prop-
erty. They even amplify it by cutting the back time slicesof the pulse. An accurate control of plasma generationshould push the frontiers in nonlinear optics and allowfor a precise monitoring of high-order harmonics. Thebasic scenario of a dynamical balance between Kerr fo-cusing and plasma defocusing explains the existence andthe long life of femtosecond filaments in most of propa-gation configurations. This scenario must, however, berevised at visible wavelengths in condensed materials, inwhich chromatic dispersion and nonlinear absorption (athigh enough power) seem to drive the self-guiding mech-anism through an important conical emission managedby X-shaped waveforms in normally dispersive regimes.This aspect requires more investigations. Also, propa-gation regimes of anomalous dispersion, which promotetemporal compression and may further improve self-compression techniques, should be deepened.
In the last years, impressive progresses have been madein the understanding of the nonlinear propagation ofhigh-power laser pulses over long distances in the atmo-sphere. For broad beams, multiple filamentation becomesmore and more controllable by the use of deformablemirrors and genetic algorithms. Besides classical tech-niques of linear focusing and phase chirping, this willsoon enable experimentalists to optimize the propagationrange of very powerful pulses. Filaments can therefore beused to remotely deliver high intensities generating in-
situ nonlinear effects. The spectrum of the white-lightcontinuum is much broader than that expected a fewyears ago, especially in the ultraviolet where the mix-ing between the fundamental and third harmonics wave-lengths together with the spectral amplification causedby pulse steepening give rise to a spectral plateau ex-tending down to 230 nm. These progresses open theway to applications such as remote sensing of gaseouspollutants and aerosols by Lidar, LIBS analysis of solidsamples, or the control of high-voltage electric dischargesand lightning strikes. Due to its mobility, the Teramobileallowed to demonstrate the feasibility of many of thesetechniques. These applications will probably be pushedforward in the future by technological improvements in-volving more compact systems, diode pumping, as wellas spatial and temporal pulse shaping. Novel active me-dia, such as Ytterbium doping or OPCPA, also open theway to new spectral regions, especially the infrared. Thisspectral region, where eye-safety constraints are easier tofulfill, is nearer the absorption region of many pollutants,such as volatile organic compounds. These more flexiblesystems will be easier to operate, allowing routine usesfor future industrial or atmospheric applications.
Acknowledgments
The Teramobile project is funded by the Centre Na-tional de la Recherche Scientifique (CNRS, France) andthe Deutsche Forschungsgemeinschaft (DFG, Germany),with contribution by the French and German min-
41
istries of Foreign Affairs and the Agence Nationale dela Recherche (ANR, France). The authors gratefully ac-knowledge its team members, formed by the groups ofL. Woste at the Freie Universitat Berlin, R. Sauerbreyat the Friedrich Schiller Universitat Jena, A. Mysyrow-icz at Laboratory for Applied Optics, Palaiseau (France),and the LASIM team led by J.-P. Wolf.
APPENDIX A: Ionization rates for atoms and molecules
This appendix details different photo-ionization theo-ries for gases and dense transparent materials.
1. Ionization in gases
To model the generation of free electrons by an in-tense light field interacting with a gaseous medium,photo-ionization theories were first developed for atomicsystems by Keldysh (Keldysh, 1965), later by Perelo-mov, Popov and Terent’ev (PPT) (Perelomov et al.,1966, 1967), before being refined by Ammosov, Deloneand Krainov (ADK) twenty years after (Ammosov et al.,1986). More recently, Tong et al. proposed a the-ory for molecular species in tunnel ionization regime(Tong et al., 2002).
a. The Keldysh theory
Keldysh’s theory is limited to hydrogenoid atoms intheir fundamental electronic state and does not considerthe Coulomb interaction between the leaving electron andthe residual ion. The ionization rate W of an atom ir-radiated by a laser field ~E(t) = ~Ep cos(ωt) is evaluatedby
W =q2e~2
limt→∞
∫d~p
(2π~)3d
dt
∣∣∣∣∫ t
0
dt′ cos(ωt′)
×⟨Ψ~p(~r, t
′)|~r · ~Ep|Ψg(~r, t′)⟩∣∣∣
2
,
(A1)
where qe is the electron charge and the ground state ofthe hydrogenlike atom, characterized by the energy Eg =−Ui (ionization potential), is
Ψg(~r, t) =1√πa3
e−ra e−
i~Egt. (A2)
Here, a = aB/Z includes the Bohr radius aB of hydrogen.The continuum electronic states are described with theVolkov functions
Ψ~p(~r, t) = ei~[(~p+qe
~A(t))·~r− 12me
R
t0dt′[~p+qe
~A(t′)]2], (A3)
where ~A(t) is the vector potential of the laser field. In-sertion of (A2) and (A3) into Eq. (A1) and integration
over the spatial coordinates result in the expression
W =2
~2limt→∞
Re
[∫d~p
(2π~)3
×∫ t
0
dt′ cos(ωt) cos(ωt′)L(~p, t′)L∗(~p, t)
],
(A4)
where ∗ means complex conjugate and
L(~p, t) = V0
[~p− qe
ω~Ep sin(ωt)
]
× ei~
n
Uit+1
2me
R
t0dt′[~p− qe
ω~Ep sin(ωt′)]
2o
,
(A5a)
V0(~p) = −i8qe√πa3~ ~Ep · ~∇~p
[1
(1 + a2p2
~2 )2
]. (A5b)
The function L(~p, t) is periodic, with period equal to T =2π/ω. It can then be decomposed into Fourier series.Plugging this series into Eq. (A4) leads to
W =2π
~
∫d~p
(2π~)3|L(~p)|2
×+∞∑
n=−∞δ
(Ui +
p2
2me+
q2eE2p
4meω2− n~ω
),
(A6)
with
L(~p) = 16iqe
√πa7
~πU3i
∫ 1
−1
du
~Ep ·(~p− qe
ω~Epu
)
[Ui + 1
2me
(~p− qe
ω~Epu
)2]3
× ei
~ω
R
u0
dv√1−v2
h
Ui+1
2me(~p− qe
ω~Epv)
2i
.
(A7)
Assuming that the electron leaves the atom with a small
kinetic energy ( p2
2me≪ Ui), the poles in the denominator
of L(~p) are written as
u±s = iγ
[±1 + i
p cos(θ)√2meUi
± p2 sin2(θ)
2meUi
], (A8)
where θ is the angle between the impulsion vector ~p and
the electric field ~E(t). γ = ω√
2meUi/(|qe|Ep) is theadiabaticity Keldysh parameter. It involves the ratioof the ionization potential over the ponderomotive en-ergy Up ≡ q2eE
2p/4meω
2. By means of the Saddle pointmethod and the residue theorem, Eq. (A7) is next inte-grated to yield
W = 4√
2ω
√Ui~ω
[γ√
1 + γ2
] 32
× e− 2Ui
~ω
»
sinh−1(γ)− γ√
1+γ2
1+2γ2
–
S(γ,Ui~ω
),
(A9)
42
where Ui ≡ Ui + Up and S(γ, x) is defined by
S(γ, x) =
+∞∑
n=0
e−2
»
sinh−1(γ)− γ√1+γ2
–
(<x+1>−x+n)
×∫ r
2γ√1+γ2
(<x+1>−x+n)
0
ey2− 2γ√
1+γ2(<x+1>−x+n)
dy.
(A10)
To take electron-ion correlation into account, Keldysheventually multiplies the ionization rate by the factor
(Ui/~ω)γ/√
1 + γ2. Expressed in atomic units (a.u.)me = |qe| = ~ = aB = 1 (Bransden and Joachain, 2003),the resulting ionization rate expresses
W = 2√
2
(2E0
Ep√
1 + γ2
) 12
e−2ν
»
sinh−1(γ)−γ√
1+γ2
1+2γ2
–
× Uiγ2
1 + γ2
+∞∑
κ≥ν0e−α(κ−ν)Φ0(
√β(κ− ν)),
(A11)
where E0 = (2Ui)3/2, γ = ω
√2Ui/Ep, ν = Ui/[~ω]a.u.,
β = 2γ/√
1 + γ2, α = 2[sinh−1(γ) − γ/
√1 + γ2
],
ν0 =< ν + 1 > and Φm(x) = e−x2 ∫ x
0(x2 − y2)|m|ey
2
dy.Equation (A11) differs from the original Keldysh formu-lation by a factor 4, originating from a corrected versionof the residue theorem.
This theory was the first one able to describe atomionization by an alternating field in low intensity regime(γ ≫ 1) as well as in high intensity regime (γ ≪ 1). Theformer regime refers to multiphoton ionization (MPI),through which the electron is freed as the atom absorbsK =< Ui/(~ω) + 1 > photons. The latter one corre-sponds to the tunnel regime, for which the electron leavesthe ion by passing through the Coulomb barrier. In MPIregime, the ionization rate is obtained by taking the limitγ → +∞ in Eq. (A11), which reduces to
W = σ(K) × IK , (A12)
where I is the laser intensity and σ(K) is the photo-ionization cross-section
σ(K) = 4√
2ω
(Ui
[~ω]a.u.
)2K+3/2
× e2K−Ui/[~ω]a.u.
E2K0
Φ0(
√2K − 2Ui
[~ω]a.u.),
(A13)
Expressed in s−1cm2K/WK , the above ”cross-section” parameter must be converted as σ(K) →σ(K)[a.u.]/[2.42 × 10−17 × (3.51 × 1016)K ].
b. The PPT theory
Later, Perelomov, Popov and Terent’ev(Perelomov et al., 1966, 1967) developed a more
accurate model. First, they included the Coulombinteraction between the ion and the electron, when thelatter leaves the atomic core. Second, they consideredany atomic bound states as initial. The resulting rate isthen
W =4√
2
π|Cn∗,l∗ |2
(2E0
Ep√
1 + γ2
)2n∗− 32−|m|
× f(l,m)
|m|! e−2ν
»
sinh−1(γ)− γ√
1+γ2
1+2γ2
–
× Uiγ2
1 + γ2
+∞∑
κ≥ν0e−α(κ−ν)Φm(
√β(κ− ν)),
(A14)
where n∗ = Z/√
2Ui is the effective quantum number, Zis the residual ion charge, l∗ = n∗ − 1 and n, l,m are theprincipal quantum number, the orbital momentum andthe magnetic quantum number, respectively. The factors|Cn∗,l∗ | and f(l,m) are
|Cn∗,l∗ |2 =22n∗
n∗Γ(n∗ + l∗ + 1)Γ(n∗ − l∗), (A15a)
f(l,m) =(2l + 1)(l + |m|)!2|m||m|! (l − |m|)! . (A15b)
Even if Eq. (A14) is usually presented as the PPT for-mula, the coefficients |Cn∗,l∗ | are in fact extracted fromthe tunneling theory derived by Ammosov, Delone andKrainov (Ammosov et al., 1986). Differences betweenPPT and ADK coefficients essentially lie in the factthat ADK theory employs electron wavefunctions in aCoulomb potential (Volkov states), which are connectedby continuity with the continuum states at large dis-tances (r ≫ 1/
√2Ui).
c. The ADK molecular theory
The PPT rate [Eq. (A14)] holds to describe photo-ionization of atoms. It can lead to some discrepancywhen it is applied to molecular systems, because the co-efficients |Cn∗,l∗ |, originally evaluated from atomic wave-functions, cannot reproduce molecular peculiarities, suchas, for example, the suppression of ionization observedfrom the molecule O2 (DeWitt et al., 2001). To overcomesuch limitations, we may extend the molecular tunnelingtheory by Tong et al. (Tong et al., 2002) by pluggingmolecular coefficients into the tunnel limit of the PPTformula and prolonging the latter to low intensity MPIregimes analytically. By doing so, Eq. (A14) is able todescribe molecule ionization after the substitution
|Cn∗,l∗ |2f(l,m) →[∑
l
Cl(2Ui)(n
∗/2)+(1/4)
√(2l + 1)(l + |m|)!2|m||m|!(l − |m|)!
]2
, (A16)
43
where the coefficients Cl have been established for differ-ent molecules. For dioxygen, C2 = 0.683 and C4 = 0.033while C1=C3=0, and m = 1 (Tong et al., 2002).
2. Ionization in dense media
Plasma generation in dense media is described withthe ionization rate for crystals developed by Keldysh(Keldysh, 1965). Its analytical evaluation is identical tothat applying to atoms, except that the initial states arenow modeled by Bloch wave functions. Following similarprocedure, the ionization rate for crystals with energygap Eg irradiated by an electromagnetic field Ep cos(ωt)is then
W =2ω
9π
(√1 + γ2
γ
m∗ω
~
) 32
Q(γ,∆
~ω)
× e−π< ∆
~ω+1>×
2
4
K(γ2
1+γ2 )−E(γ2
1+γ2 )
E( 11+γ2 )
3
5
(A17)
with γ = ω√m∗Eg/(|qe|Ep), m∗−1 = me
−1 +mh−1,
Eg =2
πEg
√1 + γ2
γE(
1
1 + γ2), (A18a)
Q(γ, x) =
√π
2K( 11+γ2 )
×+∞∑
n=0
e−πn
2
4
K(γ2
1+γ2 )−E(γ2
1+γ2 )
E( 11+γ2 )
3
5
× Φ0(
√π2
4
2 < x+ 1 > −2x+ n
K( 11+γ2 )E( 1
1+γ2 )).
(A18b)
Here, the functions K(x) ≡∫ π/20
(1 − x sin2 θ)−1/2dθ
and E(x) ≡∫ π/20 (1 − x sin2 θ)1/2dθ are the com-
plete elliptic integrals of the first and second kind(Abramovitz and Stegun, 1972) and m∗ is the reducedmass for the electron/hole pair. The above equation cor-rects a slip of pen occurring in the original Keldysh’sformula. Note that whereas W for gas [Eq. (A11)] is ex-pressed per time unit, W for condensed media [Eq. (A17)]is expressed per time unit and per cubic meter. This ion-ization rate reduces at low intensities to its multiphotonlimit (γ → +∞) taking the form
W = σ(K) × IK (A19)
where
σ(K) =2ω
9π
(m∗ω
~
) 32
Φ0(
√2(K − Eg
~ω))
× e2K(
q2e8m∗ω2Egǫ0cn0
)K (A20)
and n0 = n(ω = ω0) is the linear refractive index.
APPENDIX B: Atomic dipole for High-HarmonicGeneration
The nonlinear polarization vector ~PNL(~r, t) used to de-scribe HHG in gases is expressed as
~PNL(~r, t) = ρnt~d(~r, t), (B1)
where ~d(~r, t) is the time-dependent atomic dipole cal-culated by Lewenstein et al. (Lewenstein et al., 1994).For a single electron interacting with a linearly-polarized
laser field ~E(t) = Epx cos(ωt), the atomic dipole is de-fined by
~d(~r, t) = qe〈ψ(~r, t)|~r|ψ(~r, t)〉. (B2)
Solving the time-dependent Schrodinger equation, ψ(~r, t)denotes the electronic wavefunction
|ψ(~r, t)〉 = eiUit
~ ×[|0〉 +
∫d3v b(~v, t) |v〉
], (B3)
where Ui is the ionization potential of the atom, |0 >is the ground state and b(~v, t) is the amplitude of thecontinuum states |v >, respectively. In Eq. (B3), severalassumptions have been made, which limits the validitydomain of this theory:
• All excited electronic states are ignored, reducingthe model to the harmonic production of orders2K + 1 ≥ Ui
~ω .
• The depletion of the ground state is neglected suchthat the ground state amplitude is equal to 1.
• Electrons in the continuum are treated as free par-ticles moving in an oscillating laser field, with noCoulomb potential. This assumption is valid whenthe ponderomotive energy Up is higher than theionization potential.
Inserting (B3) into Eq. (B2), we obtain
~d(t) = iq2eEpx
~ω
∫ ωt
0
d(ωt′) cos(ωt′)
∫d3p d∗x[~p+ qe ~A(t)]
× e−iS(~p,t,t′)
~ω × dx[~p+ qe ~A(t′)] + c.c.,
(B4)
where ~d(~p+ qe ~A(t)) is the field-free dipole transition ma-trix element between the ground state and the continuum
state characterized by the momentum ~v = ~p + qe ~A(t).
Here, ~p is the canonical momentum and ~A(t) is the vec-
tor potential of the laser field [ ~E(t) = −∂ ~A(t)/∂t]. Itsformulation for transition from state |1s〉 is
~d(~p) = −i~27/2
π(2meUi)
5/4 ~p
(~p2 + 2meUi)3, (B5)
44
where me is the electron mass. S(~p, t, t′) is the quasi-classical action describing the motion of an electron freelymoving in the laser field with constant momentum ~p as
S(~p, t, t′) =
∫ ωt
ωt′
Ui +
[~p+ qe ~A(t′′)]2
2me
d(ωt′′). (B6)
The harmonic amplitude ~d2K+1 follows from Fourier
transforming the time-dependent dipole moment ~d(t)
~d2K+1 =1
T
∫ T
0
~d(t) ei(2K+1)ωtdt. (B7)
For isotropic media, only odd harmonics are produced.
The dominant contributions to ~d2K+1 comes from thestationary points of the Legendre-transformed quasi-classical action, for which the derivatives of S(~p, t, t′) −(2K + 1)~ω × ωt with respect to ~p, t and t′ vanish. In-troducing the returning time τ = t− t′, the Saddle point
equations read
~∇~pS = ~pstωτ + qe
∫ ωt
ω(t−τ)~A(t′′) d(ωt′′) = 0 (B8a)
∂S
∂(ωτ)= Ui +
[~pst + qe ~A(t− τ)]2
2me= 0 (B8b)
∂S
∂(ωt)=
[~pst + qe ~A(t)]2
2me− [~pst + qe ~A(t− τ)]2
2me
= (2K + 1)~ω
(B8c)
Equation (B8a) reduces to ~∇~pS(~p, t, t′) = ~x(t) − ~x(t′) =~0 where ~x(t) ≡
∫ t0 v(t
′)dt′. This relation imposes thatthe electron trajectories return at time t to the samepoint they left at the time t′ of ionization. Using Eqs.(B8b) and (B8c) together with the Fourier expansion of[(~pst+qe ~A(t−τ))2/(me~ω)+2Ui/(~ω)
]−3yields the final
expression for the Fourier component of the dipole, i.e.,
~d2K+1 = −iqe
(Up
~ω
) 32 32~
π2
(2Ui
~ω
) 52
(2K + 1)3√me~ω
∞∑
M=−∞
∫ +∞
0
dΦ
[π
ǫ+ iΦ2
] 32
bM (Φ)e−iFK(Φ)
~ω iK−M
×−B(Φ)JK−M+2
[UpC(Φ)
~ω
]− iB(Φ)eiΦJK−M−1(
UpC(Φ)
~ω)
+i[B(Φ)eiΦ +D(Φ)
]JK−M+1(
UpC(Φ)
~ω) +
[B(Φ) +D(Φ)eiΦ
]JK−M (
UpC(Φ)
~ω)
,
(B9)
where FK(x) = (Ui + Up −K~ω)x − 2Up[1 − cos(x)]/x,
B(x) = − 12 + sin(x)/x − 2 sin2(x/2)/x2 and D(x) =
−2B(x)−1+cos(x). The function bM (Φ) has a cumber-some expression, whose analytical methods to computeit can be found in (Antoine et al., 1996).
APPENDIX C: The Teramobile laser
Field experiments are required to characterize the fila-mentation over long distances as well as to develop atmo-spheric applications in real scale. Such experiments de-mand mobility to perform investigations at adequate lo-cations. Studies of high-power fs-laser beam propagationover km-range distances can only be performed outdoors,where relevant aerosol pollutants take place, e.g., in ur-ban areas or at industrial sites. Laser-induced lightninginvestigations require spots where the lightning proba-bility is high, as well as test experiments at high voltagefacilities. These considerations clearly define the needfor a mobile fs-TW laser system, embedded in a standardfreight container-integrated laboratory equipped with thenecessary Lidar detection, power and cooling supplies,temperature stabilization, vibration control, and an addi-
tional standard Lidar system to assure eye safety. Thesespecifications were first achieved by the Teramobile sys-tem (Wille et al., 2002). The laser itself is based on aTi:Sapphire CPA oscillator and a Nd:YAG pumped Ti:Saamplification chain. It provides 350 mJ pulses with 70 fsduration resulting in a peak power of 5 TW at around 800nm and with a repetition rate of 10 Hz. Its integrationin the reduced space of the mobile laboratory requireda particularly compact design (Fig. 38). The classicalcompressor setup has been improved into a chirp gener-ator to pre-compensate the group velocity dispersion inair. Combined with an adjustable focus, this permits tocontrol the location of the onset of filamentation and itslength. Mechanical and thermal stabilities of the mobilelaboratory are kept under control, so that the Teramo-bile can be transported to any place in the world andoperated even under adverse weather conditions.
The Teramobile container also includes a Lidar detec-tion chain based on a 40 cm receiving telescope, a high-resolution spectrometer equipped with a set of gratingsand detectors allowing simultaneous temporal and spec-tral analysis of the return signal in a wavelength rangecomprised between 190 nm and 2.5 µm.
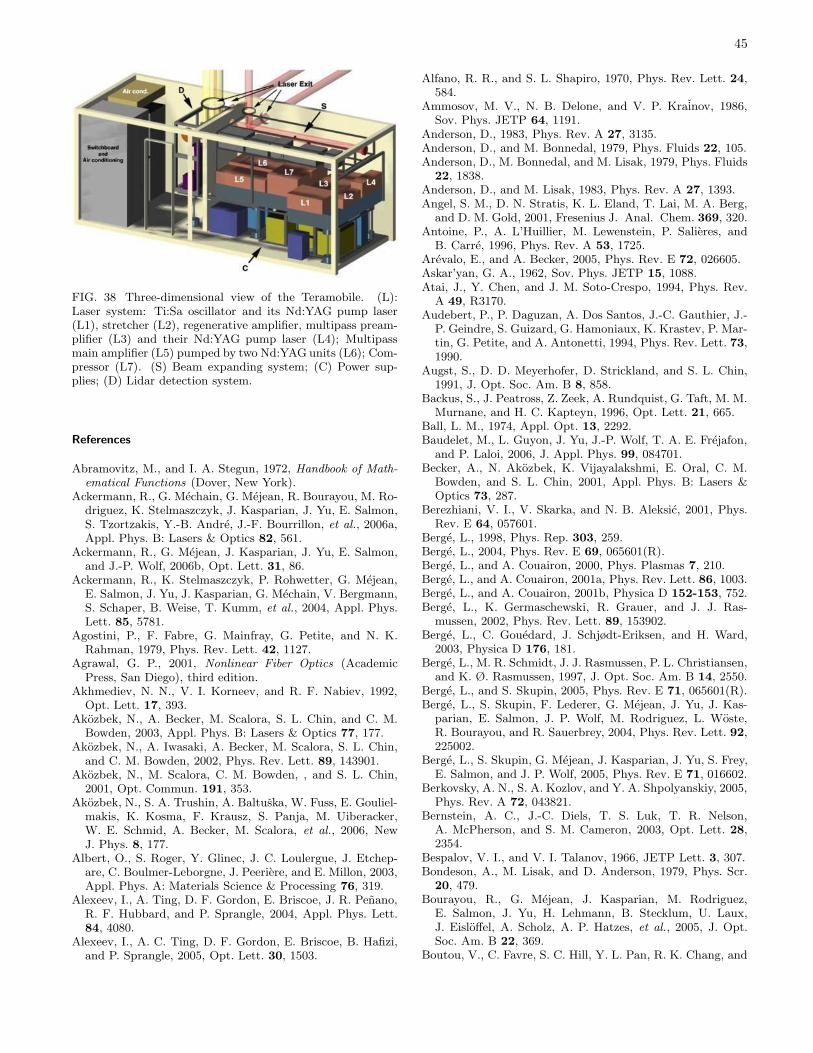
45
FIG. 38 Three-dimensional view of the Teramobile. (L):Laser system: Ti:Sa oscillator and its Nd:YAG pump laser(L1), stretcher (L2), regenerative amplifier, multipass pream-plifier (L3) and their Nd:YAG pump laser (L4); Multipassmain amplifier (L5) pumped by two Nd:YAG units (L6); Com-pressor (L7). (S) Beam expanding system; (C) Power sup-plies; (D) Lidar detection system.
References
Abramovitz, M., and I. A. Stegun, 1972, Handbook of Math-ematical Functions (Dover, New York).
Ackermann, R., G. Mechain, G. Mejean, R. Bourayou, M. Ro-driguez, K. Stelmaszczyk, J. Kasparian, J. Yu, E. Salmon,S. Tzortzakis, Y.-B. Andre, J.-F. Bourrillon, et al., 2006a,Appl. Phys. B: Lasers & Optics 82, 561.
Ackermann, R., G. Mejean, J. Kasparian, J. Yu, E. Salmon,and J.-P. Wolf, 2006b, Opt. Lett. 31, 86.
Ackermann, R., K. Stelmaszczyk, P. Rohwetter, G. Mejean,E. Salmon, J. Yu, J. Kasparian, G. Mechain, V. Bergmann,S. Schaper, B. Weise, T. Kumm, et al., 2004, Appl. Phys.Lett. 85, 5781.
Agostini, P., F. Fabre, G. Mainfray, G. Petite, and N. K.Rahman, 1979, Phys. Rev. Lett. 42, 1127.
Agrawal, G. P., 2001, Nonlinear Fiber Optics (AcademicPress, San Diego), third edition.
Akhmediev, N. N., V. I. Korneev, and R. F. Nabiev, 1992,Opt. Lett. 17, 393.
Akozbek, N., A. Becker, M. Scalora, S. L. Chin, and C. M.Bowden, 2003, Appl. Phys. B: Lasers & Optics 77, 177.
Akozbek, N., A. Iwasaki, A. Becker, M. Scalora, S. L. Chin,and C. M. Bowden, 2002, Phys. Rev. Lett. 89, 143901.
Akozbek, N., M. Scalora, C. M. Bowden, , and S. L. Chin,2001, Opt. Commun. 191, 353.
Akozbek, N., S. A. Trushin, A. Baltuska, W. Fuss, E. Gouliel-makis, K. Kosma, F. Krausz, S. Panja, M. Uiberacker,W. E. Schmid, A. Becker, M. Scalora, et al., 2006, NewJ. Phys. 8, 177.
Albert, O., S. Roger, Y. Glinec, J. C. Loulergue, J. Etchep-are, C. Boulmer-Leborgne, J. Peeriere, and E. Millon, 2003,Appl. Phys. A: Materials Science & Processing 76, 319.
Alexeev, I., A. Ting, D. F. Gordon, E. Briscoe, J. R. Penano,R. F. Hubbard, and P. Sprangle, 2004, Appl. Phys. Lett.84, 4080.
Alexeev, I., A. C. Ting, D. F. Gordon, E. Briscoe, B. Hafizi,and P. Sprangle, 2005, Opt. Lett. 30, 1503.
Alfano, R. R., and S. L. Shapiro, 1970, Phys. Rev. Lett. 24,584.
Ammosov, M. V., N. B. Delone, and V. P. Krainov, 1986,Sov. Phys. JETP 64, 1191.
Anderson, D., 1983, Phys. Rev. A 27, 3135.Anderson, D., and M. Bonnedal, 1979, Phys. Fluids 22, 105.Anderson, D., M. Bonnedal, and M. Lisak, 1979, Phys. Fluids
22, 1838.Anderson, D., and M. Lisak, 1983, Phys. Rev. A 27, 1393.Angel, S. M., D. N. Stratis, K. L. Eland, T. Lai, M. A. Berg,
and D. M. Gold, 2001, Fresenius J. Anal. Chem. 369, 320.Antoine, P., A. L’Huillier, M. Lewenstein, P. Salieres, and
B. Carre, 1996, Phys. Rev. A 53, 1725.Arevalo, E., and A. Becker, 2005, Phys. Rev. E 72, 026605.Askar’yan, G. A., 1962, Sov. Phys. JETP 15, 1088.Atai, J., Y. Chen, and J. M. Soto-Crespo, 1994, Phys. Rev.
A 49, R3170.Audebert, P., P. Daguzan, A. Dos Santos, J.-C. Gauthier, J.-
P. Geindre, S. Guizard, G. Hamoniaux, K. Krastev, P. Mar-tin, G. Petite, and A. Antonetti, 1994, Phys. Rev. Lett. 73,1990.
Augst, S., D. D. Meyerhofer, D. Strickland, and S. L. Chin,1991, J. Opt. Soc. Am. B 8, 858.
Backus, S., J. Peatross, Z. Zeek, A. Rundquist, G. Taft, M. M.Murnane, and H. C. Kapteyn, 1996, Opt. Lett. 21, 665.
Ball, L. M., 1974, Appl. Opt. 13, 2292.Baudelet, M., L. Guyon, J. Yu, J.-P. Wolf, T. A. E. Frejafon,
and P. Laloi, 2006, J. Appl. Phys. 99, 084701.Becker, A., N. Akozbek, K. Vijayalakshmi, E. Oral, C. M.
Bowden, and S. L. Chin, 2001, Appl. Phys. B: Lasers &Optics 73, 287.
Berezhiani, V. I., V. Skarka, and N. B. Aleksic, 2001, Phys.Rev. E 64, 057601.
Berge, L., 1998, Phys. Rep. 303, 259.Berge, L., 2004, Phys. Rev. E 69, 065601(R).Berge, L., and A. Couairon, 2000, Phys. Plasmas 7, 210.Berge, L., and A. Couairon, 2001a, Phys. Rev. Lett. 86, 1003.Berge, L., and A. Couairon, 2001b, Physica D 152-153, 752.Berge, L., K. Germaschewski, R. Grauer, and J. J. Ras-
mussen, 2002, Phys. Rev. Lett. 89, 153902.Berge, L., C. Gouedard, J. Schjødt-Eriksen, and H. Ward,
2003, Physica D 176, 181.Berge, L., M. R. Schmidt, J. J. Rasmussen, P. L. Christiansen,
and K. Ø. Rasmussen, 1997, J. Opt. Soc. Am. B 14, 2550.Berge, L., and S. Skupin, 2005, Phys. Rev. E 71, 065601(R).Berge, L., S. Skupin, F. Lederer, G. Mejean, J. Yu, J. Kas-
parian, E. Salmon, J. P. Wolf, M. Rodriguez, L. Woste,R. Bourayou, and R. Sauerbrey, 2004, Phys. Rev. Lett. 92,225002.
Berge, L., S. Skupin, G. Mejean, J. Kasparian, J. Yu, S. Frey,E. Salmon, and J. P. Wolf, 2005, Phys. Rev. E 71, 016602.
Berkovsky, A. N., S. A. Kozlov, and Y. A. Shpolyanskiy, 2005,Phys. Rev. A 72, 043821.
Bernstein, A. C., J.-C. Diels, T. S. Luk, T. R. Nelson,A. McPherson, and S. M. Cameron, 2003, Opt. Lett. 28,2354.
Bespalov, V. I., and V. I. Talanov, 1966, JETP Lett. 3, 307.Bondeson, A., M. Lisak, and D. Anderson, 1979, Phys. Scr.
20, 479.Bourayou, R., G. Mejean, J. Kasparian, M. Rodriguez,
E. Salmon, J. Yu, H. Lehmann, B. Stecklum, U. Laux,J. Eisloffel, A. Scholz, A. P. Hatzes, et al., 2005, J. Opt.Soc. Am. B 22, 369.
Boutou, V., C. Favre, S. C. Hill, Y. L. Pan, R. K. Chang, and
46
J.-P. Wolf, 2002, Appl. Phys. B: Lasers & Optics 75, 145.Boyd, R. W. (ed.), 1992, Nonlinear Optics (Academic Press,
San Diego).Brabec, T., and F. Krausz, 1997, Phys. Rev. Lett. 78, 3282.Brabec, T., and F. Krausz, 2000, Rev. Mod. Phys. 72, 545.Bransden, B. H., and C. J. Joachain, 2003, Physics of Atoms
and Molecules (Pearson Education Limited, Prentice Hall).Braun, A., G. Korn, X. Liu, D. Du, J. Squier, and G. Mourou,
1995, Opt. Lett. 20, 73.Brodeur, A., C. Y. Chien, F. A. Ilkov, S. L. Chin, O. G.
Kosareva, and V. P. Kandidov, 1997, Opt. Lett. 22, 304.Brodeur, A., and S. L. Chin, 1998, Phys. Rev. Lett. 80, 4406.Brodeur, A., and S. L. Chin, 1999, J. Opt. Soc. Am. B 16,
637.Buryak, A. V., V. V. Steblina, and R. A. Sammut, 1999, Opt.
Lett. 24, 1859.Campillo, A. J., S. L. Shapiro, and B. R. Suydam, 1973, Appl.
Phys. Lett. 23, 628.Campillo, A. J., S. L. Shapiro, and B. R. Suydam, 1974, Appl.
Phys. Lett. 24, 178.Cerullo, G., A. Dienes, and V. Magni, 1996, Opt. Lett. 21,
65.Champeaux, S., and L. Berge, 2003, Phys. Rev. E 68, 066603.Champeaux, S., and L. Berge, 2005, Phys. Rev. E 71, 046604.Champeaux, S., and L. Berge, 2006, Opt. Lett. 31, 1301.Chen, X., Y. Leng, J. Liu, Y. Zhu, R. Li, and Z. Xu, 2006,
Opt. Commun. 259, 331.Cheng, C.-C., E. M. Wright, and J. V. Moloney, 2001, Phys.
Rev. Lett. 87, 213001.Cheng, C.-C., E. M. Wright, and J. V. Moloney, 2002, Phys.
Rev. Lett. 89, 139302.Chernev, P., and V. Petrov, 1992a, Opt. Lett. 17, 172.Chernev, P., and V. Petrov, 1992b, Opt. Commun. 87, 28.Chiao, R. Y., E. Garmire, and C. H. Townes, 1964, Phys.
Rev. Lett. 13, 479.Chin, S. L., A. Brodeur, S. Petit, O. G. Kosareva, and V. P.
Kandidov, 1999a, J. Nonlinear Opt. Phys. Mater. 8, 121.Chin, S. L., S. Petit, F. Borne, and K. Miyazaki, 1999b, Jpn.
J. Appl. Phys. 38, L126.Chin, S. L., S. Petit, W. Liu, A. Iwasaki, M.-C. Nadeau, V. P.
Kandidov, O. G. Kosareva, and K. Y. Andrianov, 2002a,Opt. Commun. 210, 329.
Chin, S. L., A. Talebpour, J. Yang, S. Petit, V. P. Kandidov,O. G. Kosareva, and M. P. Tamarov, 2002b, Appl. Phys.B: Lasers & Optics 74, 67.
Chiron, A., B. Lamouroux, R. Lange, J.-F. Ripoche,M. Franco, B. Prade, G. Bonnaud, G. Riazuelo, andA. Mysyrowicz, 1999, Eur. Phys. J. D 6, 383.
Christodoulides, D. N., N. K. Efremidis, P. Di Trapani, andB. A. Malomed, 2004, Opt. Lett. 29, 1446.
Comtois, D., C. Y. Chien, A. Desparois, F. Guerin, G. Jarry,T. W. Johnston, J.-C. Kieffer, B. LaFontaine, F. Martin,C. Potvin, A. Bondiou-Clergerie, and I. Gallimberti, 2000,Appl. Phys. Lett. 76, 819.
Conti, C., S. Trillo, P. Di Trapani, G. Valiulis, A. Piskarskas,O. Jedrkiewicz, and J. Trull, 2003, Phys. Rev. Lett. 90,170406.
Cook, K., A. K. Kar, and R. A. Lamb, 2003, Appl. Phys.Lett. 83, 3861.
Cook, K., R. McGeorge, A. K. Kar, M. R. Taghizadeh, andR. A. Lamb, 2005, Appl. Phys. Lett. 86, 021105.
Corkum, P. B., 1993, Phys. Rev. Lett. 71, 1994.Corkum, P. B., N. H. Burnett, and F. Brunel, 1989, Phys.
Rev. Lett. 62, 1259.
Cornaggia, C., and P. Hering, 2000, Phys. Rev. A 62, 023403.Couairon, A., 2003a, Phys. Rev. A 68, 015801.Couairon, A., 2003b, Eur. Phys. J. D 27, 159.Couairon, A., and L. Berge, 2002, Phys. Rev. Lett. 88,
135003.Couairon, A., J. Biegert, C. P. Hauri, W. Kornelis, F. W.
Helbing, U. Keller, and A. Mysyrowicz, 2006, J. Mod. Opt.53, 75.
Couairon, A., M. Franco, A. Mysyrowicz, J. Biegert, andU. Keller, 2005, Opt. Lett. 30, 2657.
Couairon, A., G. Mechain, S. Tzortzakis, M. Franco, B. Lam-ouroux, B. Prade, and A. Mysyrowicz, 2003, Opt. Com-mun. 225, 177.
Couairon, A., S. Tzortzakis, L. Berge, M. Franco, B. Prade,and A. Mysyrowicz, 2002, J. Opt. Soc. Am. B 19, 1117.
Courvoisier, F., V. Boutou, J. Kasparian, E. Salmon,G. Mejean, J. Yu, and J. P. Wolf, 2003, Appl. Phys. Lett.83, 213.
Cremers, D. A., and A. K. Knight, 2000, Encyclopedia ofAnalytical Chemistry, in (Meyers, 2000), p. 9595.
Cremers, D. A., and L. J. Radziemski, 2006, Handbook ofLaser-Induced Breakdown measurements (John Wiley &Sons, Chichester).
Desaix, M., D. Anderson, and M. Lisak, 1991, J. Opt. Soc.Am. B 8, 2082.
Desyatnikov, A., A. Maimistov, and B. Malomed, 2000, Phys.Rev. E 61, 3107.
Desyatnikov, A., L. Torner, and Y. S. Kivshar, 2005, Prog. inOpt. 47, 291.
DeWitt, M. J., E. Wells, and R. R. Jones, 2001, Phys. Rev.Lett. 87, 153001.
Di Trapani, P., G. Valiulis, A. Piskarskas, O. Jedrkiewicz,J. Trull, C. Conti, and S. Trillo, 2003, Phys. Rev. Lett. 91,093904.
Donnat, P., C. Gouedard, D. Veron, O. Bonville, C. Sauteret,and A. Migus, 1992, Opt. Lett. 17, 331.
Dou, K., E. T. Knobbe, R. L. Parkhill, B. Irwin, L. Matthews,and K. H. Church, 2003, Appl. Phys. A: Materials Science& Processing 76, 303.
Drescher, M., M. Hentschel, R. Kienberger, G. Tempea,C. Spielmann, G. A. Reider, P. B. Corkum, and F. Krausz,2001, Science 291, 1923.
Du, D., X. Liu, G. Korn, J. Squier, and G. Mourou, 1994,Appl. Phys. Lett. 64, 3071.
Dubietis, A., E. Gaizauskas, G. Tamosauskas, and P. Di Tra-pani, 2004a, Phys. Rev. Lett. 92, 253903.
Dubietis, A., E. Kucinska, G. Tamosauskas, E. Gaizauskas,M. A. Porras, and P. Di Trapani, 2004b, Opt. Lett. 29,2893.
Dubietis, A., G. Tamosauskas, I. Diomin, and A. Var-avavicius, 2003, Opt. Lett. 28, 1269.
Dubietis, A., G. Tamosauskas, G. Fibich, and B. Ilan, 2004c,Opt. Lett. 29, 1126.
Esarey, E., P. Sprangle, J. Krall, and A. Ting, 1997, IEEE J.Quant. Electron. 33, 1879.
Favre, C., V. Boutou, S. C. Hill, W. Zimmer, M. Krenz,H. Lambrecht, J. Yu, R. K. Chang, L. Woeste, and J.-P.Wolf, 2002, Phys. Rev. Lett. 89, 035002.
Feit, M. D., and J. A. Fleck, 1974, Appl. Phys. Lett. 24, 169.Feit, M. D., and J. A. Fleck, 1988, J. Opt. Soc. Am. B 5, 633.Feng, Q., J. V. Moloney, A. C. Newell, and E. M. Wright,
1995, Opt. Lett. 20, 1958.Feng, Q., J. V. Moloney, A. C. Newell, E. M. Wright, K. Cook,
P. K. Kennedy, D. X. Hammer, B. A. Rockwell, and C. R.
47
Thompson, 1997, IEEE J. Quant. Electron. 33, 127.Fibich, G., 1996, Phys. Rev. Lett. 76, 4356.Fibich, G., S. Eisenmann, B. Ilan, Y. Erlich, M. Fraenkel,
Z. Henis, A. L. Gaeta, and A. Zigler, 2005, Opt. Express13, 5897.
Fibich, G., S. Eisenmann, B. Ilan, and A. Zigler, 2004, Opt.Lett. 29, 1772.
Fibich, G., and B. Ilan, 2001a, Opt. Lett. 26, 840.Fibich, G., and B. Ilan, 2001b, Physica D 157, 112.Fibich, G., and B. Ilan, 2004, Opt. Lett. 29, 887.Fibich, G., B. Ilan, and S. Tsynkov, 2002, J. Scien. Comput.
17, 351.Fibich, G., and G. Papanicolaou, 1999, SIAM J. Appl. Math.
60, 183.Fibich, G., and G. C. Papanicolaou, 1997, Opt. Lett. 22, 1379.Fibich, G., W. Ren, and X.-P. Wang, 2003, Phys. Rev. E 67,
056603.Fibich, G., Y. Sivan, Y. Ehrlich, E. Louzon, M. Fraenkel,
S. Eisenmann, Y. Katzir, and A. Ziegler, 2006, Opt. Ex-press 14, 4946.
Firth, W. J., and D. V. Skryabin, 1997, Phys. Rev. Lett. 79,2450.
Fraiman, G. M., 1985, Sov. Phys. JETP 61, 228.Fujii, T., and T. Fukuchi (eds.), 2005, Femtosecond white-light
lidar (Marcel Dekker, Inc., New York).Gaeta, A. L., 2000, Phys. Rev. Lett. 84, 3582.Gaeta, A. L., and F. Wise, 2001, Phys. Rev. Lett. 87, 229401.Gatz, S., and J. Herrmann, 1997, J. Opt. Soc. Am. B 14,
1795.Geissler, M., G. Tempea, A. Scrinzi, M. Schnurer, F. Krausz,
and T. Brabec, 1999, Phys. Rev. Lett. 83, 2930.Germaschewski, K., R. Grauer, L. Berge, V. K. Mezentsev,
and J. J. Rasmussen, 2001, Physica D 151, 175.Gil’denburg, V. B., V. I. Pozdnyakova, and I. A. Shere-
shevskii, 1995, Phys. Lett. A 203, 214.Glassey, R. T., 1977, J. Math. Phys. 18, 1794.Golubtsov, I. S., V. P. Kandidov, and O. G. Kosareva, 2003,
Quant. Electron. 33, 525.Gong, Q.-H., J.-L. Li, T.-Q. Zhang, and H. Yang, 1998, Chin.
Phys. Lett. 15, 30.Gordon, D. F., A. C. Ting, I. Alexeev, R. P. Fischer, and
P. Sprangle, 2006, IEEE Trans. Plasma Sc. 34, 249.Grow, T. D., and A. L. Gaeta, 2005, Opt. Express 13, 4594.Guyon, L., F. Courvoisier, V. Boutou, R. Nuter, A. Vincotte,
S. Champeaux, L. Berge, P. Glorieux, and J.-P. Wolf, 2006,Phys. Rev. A 73, 051802(R).
Hao, Z., J. Zhang, Y. T. Li, X. Lu, X. H. Yuan, Z. Y. Zheng,Z. H. Wang, W. J. Ling, and Z. Y. Wei, 2005a, Appl. Phys.B: Lasers & Optics 80, 627.
Hao, Z.-Q., J. Yu, J. Zhang, Y.-T. Li, X.-H. Yuan, Z.-Y.Zheng, P. Wang, Z.-H. Wang, W.-J. Ling, and Z.-Y. Wei,2005b, Chin. Phys. Lett. 22, 636.
Hauri, C. P., W. Kornelis, F. W. Helbing, A. Heinrich,A. Couairon, A. Mysyrowicz, J. Biegert, and U. Keller,2004, Appl. Phys. B: Lasers & Optics 79, 673.
He, G. S., and S. H. Liu, 1999, Physics of Nonlinear Optics(World Scientific, Singapore).
Heck, G., J. Sloss, and R. J. Levis, 2006, Opt. Commun. 259,216.
Hellwarth, R. W., D. M. Pennington, and M. A. Henesian,1990, Phys. Rev. A 41, 2766.
Henz, S., and J. Herrmann, 1999, Phys. Rev. A 59, 2528.Homoelle, D., and A. L. Gaeta, 2000, Opt. Lett. 25, 761.Hosseini, S. A., Q. Luo, B. Ferland, W. Liu, S. L. Chin, O. G.
Kosareva, N. A. Panov, N. Akozbek, and V. P. Kandidov,2004a, Phys. Rev. A 70, 033802.
Hosseini, S. A., J. Yu, Q. Luo, and S. L. Chin, 2004b, Appl.Phys. B: Lasers & Optics 79, 519.
Husakou, A. V., and J. Herrmann, 2001, Phys. Rev. Lett. 87,203901.
Jin, Z., J. Zhang, M. H. Xu, X. Lu, Y. T. Li, Z. H. Wang,Z. Y. Wei, X. H. Yuan, and W. Yu, 2005, Opt. Express 13,10424.
Jong-Il, Y., R. Klenze, and J. I. Kim, 2002, Appl. Spec-troscopy 56, 852.
Kandidov, V. P., N. Akozbek, M. Scalora, O. G. Kosareva,A. V. Nyakk, Q. Luo, S. A. Hosseini, and S. L. Chin, 2005,Appl. Phys. B: Lasers & Optics 80, 267.
Kandidov, V. P., I. S. Golubtsov, and O. G. Kosareva, 2004,Quant. Electron. 34, 348.
Kandidov, V. P., O. G. Kosareva, I. S. Golubtsov, W. Liu,A. Becker, N. Akozbeck, C. M. Bowden, and S. L. Chin,2003, Appl. Phys. B: Lasers & Optics 77, 149.
Kandidov, V. P., O. G. Kosareva, and S. A. Shlenov, 1994,Quant. Electron. 24, 905.
Kandidov, V. P., O. G. Kosareva, M. P. Tamarov, A. Brodeur,and S. L. Chin, 1999, Quant. Electron. 29, 911.
Karlsson, M., D. Anderson, and M. Desaix, 1992, Opt. Lett.17, 22.
Kasparian, J., M. Rodriguez, G. Mejean, J. Yu, E. Salmon,H. Wille, R. Bourayou, S. Frey, Y. B. Andre, A. Mysy-rowicz, R. Sauerbrey, J. P. Wolf, et al., 2003, Science 301,61.
Kasparian, J., R. Sauerbrey, and S. L. Chin, 2000a, Appl.Phys. B: Lasers & Optics 71, 877.
Kasparian, J., R. Sauerbrey, D. Mondelain, S. Niedermeier,J. Yu, J. P. Wolf, Y. B. Andre, M. Franco, B. Prade,S. Tzortzakis, A. Mysyrowicz, M. Rodriguez, et al., 2000b,Opt. Lett. 25, 1397.
Kath, W. L., and N. F. Smyth, 1995, Phys. Rev. E 51, 1484.Keldysh, L. V., 1965, Sov. Phys. JETP 20, 1307.Kelley, P. L., 1965, Phys. Rev. Lett. 15, 1005.Kennedy, P. K., 1995, IEEE J. Quant. Electron. 31, 2241.Knight, A. K., N. L. Scherbarth, D. A. Cremers, and M. J.
Ferris, 2000, Appl. Spectroscopy 54, 331.Kolesik, M., G. Katona, J. V. Moloney, and E. M. Wright,
2003a, Phys. Rev. Lett. 91, 043905.Kolesik, M., G. Katona, J. V. Moloney, and E. M. Wright,
2003b, Appl. Phys. B: Lasers & Optics 77, 185.Kolesik, M., and J. V. Moloney, 2004a, Phys. Rev. E 70,
036604.Kolesik, M., and J. V. Moloney, 2004b, Opt. Lett. 29, 590.Kolesik, M., J. V. Moloney, and M. Mlejnek, 2002, Phys. Rev.
Lett. 89, 283902.Kolesik, M., J. V. Moloney, and E. M. Wright, 2001, Phys.
Rev. E 64, 046607.Kolokolov, A. A., 1976, Radiophys. Quant. Electron. 17,
1016.Konno, K., and H. Suzuki, 1979, Phys. Scr. 20, 382.Koopman, D. W., and T. D. Wilkerson, 1971, J. Appl. Phys.
42, 1883.Koprinkov, I. G., A. Suda, P. Wang, and K. Midorikawa, 2000,
Phys. Rev. Lett. 84, 3847.Koprinkov, I. G., A. Suda, P. Wang, and K. Midorikawa, 2001,
Phys. Rev. Lett. 87, 229402.Kosareva, O., V. P. Kandidov, A. Brodeur, C. Y. Chien, and
S. L. Chin, 1997, Opt. Lett. 22, 1332.Kosmatov, N. E., V. F. Shvets, and V. E. Zakharov, 1991,
48
Physica D 52, 16.Krainov, V. P., 1997, J. Opt. Soc. Am. B 14, 425.Kruglov, V. I., Y. A. Logvin, and V. M. Volkov, 1992, J. Mod.
Opt. 39, 2277.Kruglov, V. I., and R. A. Vlasov, 1985, Phys. Lett. 111A,
401.Kuznetsov, E. A., 1996, CHAOS 6, 381.Kuznetsov, E. A., J. J. Rasmussen, K. Rypdal, and S. K.
Turitsyn, 1995, Physica D 87, 273.Kuznetsov, E. A., A. M. Rubenchik, and V. E. Zakharov,
1986, Phys. Rep. 142, 103.Kyuseok, S., L. Yong-Ill, and J. Sneddon, 1997, Appl. Spec-
troscopy Reviews 32, 183.Labaune, C., S. Baton, T. Jalinaud, H. A. Baldis, and
D. Pesme, 1992, Phys. Fluids B 4, 2224.LaFontaine, B., F. Vidal, D. Comtois, C.-Y. Chien,
A. Desparois, T.-W. Johnston, J.-C. Kieffer, H.-P. Mer-cure, H. Pepin, and F. A. M. Rizk, 1999a, IEEE Trans.Plasma Sc. 27, 688.
LaFontaine, B., F. Vidal, Z. Jiang, C. Y. Chien, D. Comtois,A. Desparois, T. W. Johnston, J. C. Kieffer, H. Pepin, andH. P. Mercure, 1999b, Phys. Plasmas 6, 1615.
Landman, M. J., G. C. Papanicolaou, C. Sulem, and P. L.Sulem, 1988, Phys. Rev. A 38, 3837.
Lange, H. R., A. Chiron, J.-F. Ripoche, A. Mysyrowicz,P. Breger, and P. Agostini, 1998a, Phys. Rev. Lett. 81,1611.
Lange, H. R., G. Grillon, J.-F. Ripoche, M. A. Franco,B. Lamouroux, B. S. Prade, A. Mysyrowicz, E. T. J. Nib-bering, and A. Chiron, 1998b, Opt. Lett. 23, 120.
Lehmeier, H. J., W. Leupacher, and A. Penzkofer, 1985, Opt.Commun. 56, 67.
Lehner, T., and N. Auby, 2000, Phys. Rev. E 61, 1996.leMesurier, B. J., 2000, Physica D 138, 334.leMesurier, B. J., P. L. Christiansen, Y. B. Gaididei, and J. J.
Rasmussen, 2004, Phys. Rev. E 70, 046614.Lenzner, M., J. Kruger, S. Sartania, Z. Cheng, C. Spielmann,
G. Mourou, W. Kautek, and F. Krausz, 1998, Phys. Rev.Lett. 80, 4076.
Lewenstein, M., P. Balcou, M. Y. Ivanov, A. L’Huillier, andP. B. Corkum, 1994, Phys. Rev. A 49, 2117.
Li, M., S. Menon, J. P. Nibarger, and G. N. Gibson, 1999,Phys. Rev. Lett. 82, 2394.
Litvak, A. G., V. A. Mironov, and E. M. Sher, 2000a, J. Exp.Theor. Phys. 91, 1268.
Litvak, A. G., V. A. Mironov, and E. M. Sher, 2000b, Phys.Rev. E 61, 891.
Liu, J., H. Schroeder, S. L. Chin, R. Li, and Z. Xu, 2005a,Opt. Express 13, 10248.
Liu, J., H. Schroeder, S. L. Chin, R. Li, W. Yu, and Z. Xu,2005b, Phys. Rev. A 72, 053817.
Liu, W., and S. L. Chin, 2005, Opt. Express 13, 5750.Liu, W., S. L. Chin, O. Kosareva, I. S. Golubtsov, and V. P.
Kandidov, 2003, Opt. Commun. 225, 193.Liu, W., S. A. Hosseini, Q. Luo, B. Ferland, S. L. Chin, O. G.
Kosareva, N. A. Panov, and V. P. Kandidov, 2004, New J.Phys. 6, 1.
Liu, W., O. Kosareva, I. S. Golubtsov, A. Iwasaki, A. Becker,V. P. Kandidov, and S. L. Chin, 2002, Appl. Phys. B: Lasers& Optics 75, 595.
Liu, W., F. Theberge, E. Arevalo, J.-F. Gravel, A. Becker,and S. L. Chin, 2005c, Opt. Lett. 30, 2602.
Liu, W., F. Theberge, J.-F. Daigle, P. T. Simard, S. M. Sarifi,Y. Kamali, H. L. Xu, and S. L. Chin, 2006, Appl. Phys. B:
Lasers & Optics 85, 55.Lotz, W., 1967a, Zeitschrift Phys. 206, 205.Lotz, W., 1967b, J. Opt. Soc. Am. B 57, 873.Lugovoi, V. N., and A. M. Prokhorov, 1974, Sov. Phys. Usp.
16, 658.Luo, Y., H. Agren, B. Minaev, and P. Jørgensen, 1995, J.
Mol. Struct. 336, 61.Luther, G. G., J. V. Moloney, A. C. Newell, and E. M. Wright,
1994a, Opt. Lett. 19, 862.Luther, G. G., A. C. Newell, and J. V. Moloney, 1994b, Phys-
ica D 74, 59.Mairesse, Y., A. de Bohan, L. J. Frasinski, H. Merdji, L. C.
Dinu, P. Monchicourt, P. Breger, M. Kovacev, R. Taıeb,B. Carre, H. G. Muller, P. Agostini, et al., 2003, Science302, 1540.
Malkin, V. M., 1990, Phys. Lett. A 151, 285.Malkin, V. M., 1993, Physica D 64, 251.Manassah, J. T., 1992, Opt. Lett. 17, 1259.Manassah, J. T., P. L. Baldeck, and R. R. Alfano, 1988, Opt.
Lett. 13, 589.Marburger, J. H., 1975, Prog. Quantum Electron. 4, 35.Mariyenko, I. G., J. Strohaber, and C. J. G. J. Uiterwaal,
2005, Opt. Express 13, 7599.Marklund, M., and P. K. Shukla, 2006, Opt. Lett. 31, 1884.Martin, P., S. Guizard, P. Daguzan, G. Petite, P. D’Oliveira,
P. Meynadier, and M. Perdrix, 1997, Phys. Rev. B 55, 5799.McKinstrie, C. J., and D. A. Russell, 1988, Phys. Rev. Lett.
61, 2929.Measures, R. M., 1984, Laser remote sensing - Fundamentals
and applications (Wiley Interscience, New York).Mechain, G., A. Couairon, M. Franco, B. Prade, and A. Mysy-
rowicz, 2004, Phys. Rev. Lett. 93, 035003.Mechain, G., C. D’Amico, Y.-B. Andre, S. Tzortzakis,
M. Franco, B. Prade, A. Mysyrowicz, A. Couairon,E. Salmon, and R. Sauerbrey, 2005a, Opt. Commun. 247,171.
Mechain, G., G. Mejean, R. Ackermann, P. Rohwetter, Y.-B.Andre, J. Kasparian, B. Prade, K. Stelmaszczyk, J. Yu,E. Salmon, W. Winn, L. A. V. Schlie, et al., 2005b, Appl.Phys. B: Lasers & Optics 80, 785.
Mejean, G., R. Ackermann, J. Kasparian, E. Salmon, J. Yu,J.-P. Wolf, K. Rethmeier, W. Kalkner, P. Rohwetter,K. Stelmaszczyk, and L. Woste, 2006a, Appl. Phys. Lett.88, 021101.
Mejean, G., J. Kasparian, J. Yu, S. Frey, E. Salmon, R. Ack-ermann, J.-P. Wolf, L. Berge, and S. Skupin, 2006b, Appl.Phys. B: Lasers & Optics 82, 341.
Mejean, G., J. Kasparian, J. Yu, S. Frey, E. Salmon, and J. P.Wolf, 2004, Appl. Phys. B: Lasers & Optics 78, 535.
Mejean, G., J. Kasparian, J. Yu, E. Salmon, S. Frey, J.-P.Wolf, S. Skupin, A. Vincotte, R. Nuter, S. Champeaux,and L. Berge, 2005, Phys. Rev. E 72, 026611.
Mevel, E., O. Tcherbakoff, F. Salin, and E. Constant, 2003,J. Opt. Soc. Am. B 20, 105.
Meyers, R. A., 2000, Encyclopedia of Analytical Chemistry(John Wiley & Sons, Chichester).
Michinel, H., J. Campo-Taboas, M. L. Quiroga-Teixeiro, J. R.Salgueiro, and R. Garcıa-Fernandez, 2001, J. Opt. B: Quan-tum Semiclass. Opt. 3, 314.
Miki, M., Y. Aihara, and T. Shindo, 1993, J. Phys. D: Appl.Phys. 26, 1244.
Milsted Jr., C. S., and C. D. Cantrell, 1996, Phys. Rev. A 53,3536.
Mlejnek, M., M. Kolesik, J. V. Moloney, and E. M. Wright,
49
1999, Phys. Rev. Lett. 83, 2938.Mlejnek, M., E. M. Wright, and J. V. Moloney, 1998a, Opt.
Lett. 23, 382.Mlejnek, M., E. M. Wright, and J. V. Moloney, 1998b, Phys.
Rev. E 58, 4903.Moll, K. D., and A. L. Gaeta, 2004, Opt. Lett. 29, 995.Moll, K. D., A. L. Gaeta, and G. Fibich, 2003, Phys. Rev.
Lett. 90, 203902.Mourou, G., T. Tajima, and S. V. Bulanov, 2006, Rev. Mod.
Phys. 78, 309.Nibbering, E. T. J., P. F. Curley, G. Grillon, B. S. Prade,
M. A. Franco, F. Salin, and A. Mysyrowicz, 1996, Opt.Lett. 21, 62.
Nibbering, E. T. J., G. Grillon, M. A. Franco, B. S. Prade,and A. Mysyrowicz, 1997, J. Opt. Soc. Am. B 14, 650.
Niessner, R., 1994, Proceedings of the SPIE 2360, 254.Nishioka, H., W. Odajima, K. Ueda, and H. Takuma, 1995,
Opt. Lett. 20, 2505.Nisoli, M., S. De Silvestri, O. Svelto, R. Szipocs, K. Ferencz,
C. Spielmann, S. Sartania, and F. Krausz, 1997a, Opt. Lett.22, 522.
Nisoli, M., S. Stagira, S. D. Silvestri, O. Svelto, S. Sarta-nia, Z. Cheng, M. Lenzner, C. Spielmann, and F. Krausz,1997b, Appl. Phys. B: Lasers & Optics 65, 189.
Nisoli, M., S. Stagira, S. D. Silvestri, O. Svelto, S. Sartania,Z. Cheng, G. Tempea, C. Spielmann, and F. Krausz, 1998,IEEE J. Selec. Top. Quant. Electron. 4, 414.
Noack, J., and A. Vogel, 1999, IEEE J. Quant. Electron. 35,1156.
Nurhuda, M., A. Suda, M. Hatayama, K. Nagasaka, andK. Midorikawa, 2002a, Phys. Rev. A 66, 023811.
Nurhuda, M., A. Suda, and K. Midorikawa, 2002b, RIKENRev. 48, 40.
Nuter, R., and L. Berge, 2006, J. Opt. Soc. Am. B 23, 874.Nuter, R., S. Skupin, and L. Berge, 2005, Opt. Lett. 30, 917.Pan, L., K. T. Taylor, and C. W. Clark, 1990, J. Opt. Soc.
Am. B 7, 509.Peck, E. R., and K. Reeder, 1972, J. Opt. Soc. Am. 62, 958.Penano, J. R., P. Sprangle, B. Hafizi, W. Manheimer, and
A. Zigler, 2005, Phys. Rev. E 72, 036412.Penano, J. R., P. Sprangle, B. Hafizi, A. Ting, D. F. Gordon,
and C. A. Kapetanakos, 2004, Phys. Plasmas 11, 2865.Penano, J. R., P. Sprangle, P. Serafim, B. Hafizi, and A. Ting,
2003, Phys. Rev. E 68, 056502.Penetrante, B. M., J. N. Bardsley, W. M. Wood, C. W. Siders,
and M. C. Downer, 1992, J. Opt. Soc. Am. B 9, 2032.Pepin, H., D. Comtois, F. Vidal, C. Y. Chien, A. Desparois,
T. W. Johnston, J.-C. Kieffer, B. LaFontaine, F. Martin,F. A. M. Rizk, C. Potvin, P. Couture, et al., 2001, Phys.Plasmas 8, 2532.
Perelomov, A. M., and V. S. Popov, 1967, Sov. Phys. JETP25, 336.
Perelomov, A. M., V. S. Popov, and M. V. Terent’ev, 1966,Sov. Phys. JETP 23, 924.
Perelomov, A. M., V. S. Popov, and M. V. Terent’ev, 1967,Sov. Phys. JETP 24, 207.
Perry, M. D., O. L. Landen, A. Szoke, and E. M. Campbell,1988a, Phys. Rev. A 37, 747.
Perry, M. D., A. Szoke, O. L. Landen, and E. M. Campbell,1988b, Phys. Rev. Lett. 60, 1270.
Petit, S., A. Talebpour, A. Proulx, and S. L. Chin, 2000, Opt.Commun. 175, 323.
Petrov, D. V., L. Torner, J. Martorell, R. Vilaseca, J. P. Tor-res, and C. Cojocaru, 1998, Opt. Lett. 23, 1444.
Pfeifer, T., C. Spielmann, and G. Gerber, 2006, Rep. Prog.Phys. 69, 443.
Pietsch, H., R. Blaha, E. W. Laedke, and A. Kumar, 1991,Europhys. Lett. 15, 173.
Porras, M. A., A. Parola, D. Faccio, A. Dubietis, and P. DiTrapani, 2004, Phys. Rev. Lett. 93, 153902.
Quigora-Teixeiro, M., and H. Michinel, 1997, J. Opt. Soc.Am. B 14, 2004.
Rae, S. C., and K. Burnett, 1992, Phys. Rev. A 46, 1084.Rairoux, P., H. Schillinger, S. Niedermeier, M. Rodriguez,
F. Ronneberger, R. Sauerbrey, B. Stein, D. Waite,C. Wedekind, H. Wille, L. Woste, and C. Ziener, 2000,Appl. Phys. B: Lasers & Optics 71, 573.
Rambo, P., J. Schwartz, and J.-C. Diels, 2001, J. Opt. A:Pure Appl. Opt. 3, 146.
Ranka, J. K., and A. L. Gaeta, 1998, Opt. Lett. 23, 534.Rasmussen, J. J., and K. Rypdal, 1986, Phys. Scr. 33, 481.Rayner, D. M., A. Naumov, and P. B. Corkum, 2005, Opt.
Express 13, 3208.Reiss, H. R., 1980, Phys. Rev. A 22, 1786.Ripoche, J. F., G. Grillon, B. Prade, M. Franco, E. Nibbering,
R. Lange, and A. Mysyrowicz, 1997, Opt. Commun. 135,310.
Rodriguez, M., R. Bourayou, G. Mejean, J. Kasparian, J. Yu,E. Salmon, A. Scholz, B. Stecklum, J. Eisloffel, U. Laux,A. P. Hatzes, R. Sauerbrey, et al., 2004, Phys. Rev. E 69,036607.
Rodriguez, M., R. Sauerbrey, H. Wille, L. Woste, T. Fujii,Y.-B. Andre, A. Mysyrowicz, L. Klingbeil, K. Rethmeier,W. Kalkner, J. kasparian, E. Salmon, et al., 2002, Opt.Lett. 27, 772.
Rohwetter, P., K. Stelmaszczyk, G. Mejean, J. Yu, E. Salmon,J. Kasparian, J.-P. Wolf, and L. Woste, 2003, J. Anal.Atom. Spectroscopy 19, 437.
Rothenberg, J. E., 1992, Opt. Lett. 17, 1340.Rypdal, K., and J. J. Rasmussen, 1989, Phys. Scr. 40, 192.Rypdal, K., J. J. Rasmussen, and K. Thomsen, 1985, Physica
D 16, 339.Salieres, P., and M. Lewenstein, 2001, Meas. Sci. Technol. 12,
1818.Schjødt-Eriksen, J., Y. B. Gaididei, and P. L. Christiansen,
2001a, Phys. Rev. E 64, 066614.Schjødt-Eriksen, J., J. V. Moloney, E. M. Wright, Q. Feng,
and P. L. Christiansen, 2001b, Opt. Lett. 26, 78.Schroeder, H., and S. L. Chin, 2004, Opt. Commun. 234, 399.Schroeder, H., J. Liu, and S. L. Chin, 2004, Opt. Express 12,
4768.Schwarz, J., P. Rambo, and J.-C. Diels, 2001, Appl. Phys. B:
Lasers & Optics 72, 343.Schwarz, J., P. Rambo, J.-C. Diels, M. Kolesik, E. M. Wright,
and J. V. Moloney, 2000, Opt. Commun. 180, 383.Scrinzi, A., M. Y. Ivanov, R. Kienberger, and D. M. Vil-
leneuve, 2006, J. Phys. B: At. Mol. Opt. Phys. 39, 1.Sharma, S. K., P. G. Lucey, M. Ghosh, H. W. Hubble, and
K. A. Horton, 2003, Spectroch. Acta A 59, 2391.Shen, Y. R., 1976, Rev. Mod. Phys. 1, 48.Shen, Y. R., 1984, The Principles of Nonlinear Optics (John
Wiley & Sons, New-York).Silberberg, Y., 1990, Opt. Lett. 15, 1282.Skarka, V., N. B. Aleksic, and V. I. Berezhiani, 2003, Phys.
Lett. A 319, 317.Skryabin, D. V., and W. J. Firth, 1998, Phys. Rev. E 58,
R1252.Skupin, S., and L. Berge, 2006, Physica D 220, 14.
50
Skupin, S., L. Berge, U. Peschel, and F. Lederer, 2004a, Phys.Rev. Lett. 93, 023901.
Skupin, S., L. Berge, U. Peschel, F. Lederer, G. Mejean,J. Yu, J. Kasparian, E. Salmon, J.-P. Wolf, M. Rodriguez,L. Woste, R. Bourayou, et al., 2004b, Phys. Rev. E 70,046602.
Skupin, S., R. Nuter, and L. Berge, 2006a, Phys. Rev. A 74,043813.
Skupin, S., U. Peschel, C. Etrich, L. Leine, F. Lederer, andD. Michaelis, 2003, Opt. Quant. Electron. 35, 573.
Skupin, S., U. Peschel, C. Etrich, L. Leine, D. Michaelis, andF. Lederer, 2002, Opt. Lett. 27, 1812.
Skupin, S., G. Stibenz, L. Berge, F. Lederer, T. Sokollik,M. Schnurer, N. Zhavoronkov, and G. Steinmeyer, 2006b,Phys. Rev. E 74, 056604.
Soto-Crespo, J. M., E. M. Wright, and N. N. Akhmediev,1992, Phys. Rev. A 45, 3168.
Sprangle, P., E. Esarey, and J. Krall, 1996, Phys. Rev. E 54,4211.
Sprangle, P., J. R. Penano, and B. Hafizi, 2002, Phys. Rev. E66, 046418.
Sprangle, P., J. R. Penano, B. Hafizi, and C. A. Kapetanakos,2004, Phys. Rev. E 69, 066415.
Steinmeyer, G., D. H. Sutter, L. Gallmann, N. Matuschek,and U. Keller, 1999, Science 286, 1507.
Stelmaszczyk, K., P. Rohwetter, G. Mejean, J. Yu, E. Salmon,J. Kasparian, R. Ackermann, J.-P. Wolf, and L. Woste,2004, Appl. Phys. B: Lasers & Optics 85, 3977.
Stibenz, G., N. Zhavoronkov, and G. Steinmeyer, 2006, Opt.Lett. 31, 274.
Stuart, B. C., M. D. Feit, S. Herman, A. M. Rubenchik, B. W.Shore, and M. D. Perry, 1996, Phys. Rev. B 53, 1749.
Suda, A., M. Hatayama, K. Nagasaka, and K. Midorikawa,2005, Appl. Phys. Lett. 86, 111116.
Sudrie, L., A. Couairon, M. Franco, B. Lamouroux, B. Prade,S. Tzortzakis, and A. Mysyrowicz, 2002, Phys. Rev. Lett.89, 186601.
Sudrie, L., M. Franco, B. Prade, and A. Mysyrowicz, 1999,Opt. Commun. 171, 279.
Sudrie, L., M. Franco, B. Prade, and A. Mysyrowicz, 2001,Opt. Commun. 191, 333.
Sulem, C., and P.-L. Sulem, 1999, The Nonlinear SchrodingerEquation: Self-focusing and Wave collapse (Springer-Verlag, New York), first edition.
Talebpour, A., J. Yang, and S. L. Chin, 1999, Opt. Commun.163, 29.
Tamaki, Y., J. Itatani, Y. Nagata, M. Obara, and K. Mi-dorikawa, 1999, Phys. Rev. Lett. 82, 1422.
Tempea, G., and T. Brabec, 1998a, Opt. Lett. 23, 1286.Tempea, G., and T. Brabec, 1998b, Opt. Lett. 23, 762.Theberge, F., N. Akozbek, W. Liu, J.-F. Gravel, and S. L.
Chin, 2005a, Opt. Commun. 245, 399.Theberge, F., W. Liu, Q. Luo, and S. L. Chin, 2005b, Appl.
Phys. B: Lasers & Optics 80, 221.Theopold, F. A., J.-P. Wolf, and L. Woste, 2005, Dial re-
visited: Belinda and white-light femtoseocnd lidar in range-resolved optical sensing of the atmosphere (Springer Verlag,New York).
Tien, A.-C., S. Backus, H. Kapteyn, M. Murnane, andG. Mourou, 1999, Phys. Rev. Lett. 82, 3883.
Tikhonenko, V., J. Christou, and B. Luther-Davies, 1996,Phys. Rev. Lett. 76, 2698.
Ting, A., I. Alexeev, D. Gordon, R. Fisher, D. Kaganovitch,T. Jones, E. Briscoe, J. Penano, R. Hubbard, and P. Spran-
gle, 2005a, Phys. Plasmas 12, 056705.Ting, A., D. F. Gordon, E. Briscoe, J. R. Penano, and
P. Sprangle, 2005b, Appl. Opt. 44, 1474.Tohmon, R., H. Mizuno, Y. Ohki, K. Sasagane, K. Nagasawa,
and Y. Hama, 1989, Phys. Rev. B 39, 1337.Tong, X. M., Z. X. Zhao, and C. D. Lin, 2002, Phys. Rev. A
66, 033402.Tosa, V., E. Takahashi, Y. Nabekawa, and K. Midorikawa,
2003, Phys. Rev. A 67, 063817.Towers, I., A. V. Buryak, R. A. Sammut, B. A. Malomed, L.-
C. Crasovan, and D. Mihalache, 2001, Phys. Lett. A 288,292.
Trillo, S., and W. Torruellas (eds.), 2001, Spatial Solitons(Springer, Berlin).
Trushin, S. A., S. Panja, K. Kosma, W. E. Schmid, andW. Fuss, 2005, Appl. Phys. B: Lasers & Optics 80, 399.
Tzortzakis, S., D. Anglos, and D. Gray, 2006, Opt. Lett. 31,1139.
Tzortzakis, S., L. Berge, A. Couairon, M. Franco, B. Prade,and A. Mysyrowicz, 2001a, Phys. Rev. Lett. 86, 5470.
Tzortzakis, S., M. A. Franco, Y.-B. Andre, A. Chiron,B. Lamouroux, B. S. Prade, and A. Mysyrowicz, 1999,Phys. Rev. E 60, R3505.
Tzortzakis, S., B. Lamouroux, A. Chiron, M. Franco,B. Prade, A. Mysyrowicz, and S. D. Moustaizis, 2000a,Opt. Lett. 25, 1270.
Tzortzakis, S., B. Lamouroux, A. Chiron, S. D. Moustaizis,D. Anglos, M. Franco, B. Prade, and A. Mysyrowicz,2001b, Opt. Commun. 197, 131.
Tzortzakis, S., G. Mechain, G. Patalano, Y.-B. Andre,B. Prade, M. Franco, J.-M. Munier, A. Mysyrowicz,M. Gheudin, G. Beaudin, and P. Encrenaz, 2002, Opt. Lett.27, 1944.
Tzortzakis, S., G. Mechain, G. Patalano, M. Franco, B. Prade,and A. Mysyrowicz, 2003, Appl. Phys. B: Lasers & Optics76, 609.
Tzortzakis, S., B. Prade, M. Franco, and A. Mysyrowicz,2000b, Opt. Commun. 181, 123.
Tzortzakis, S., B. Prade, M. Franco, A. Mysyrowicz, S. Huller,and P. Mora, 2001c, Phys. Rev. E 64, 057401.
Tzortzakis, S., L. Sudrie, M. Franco, B. Prade, A. Mysyrow-icz, A. Couairon, and L. Berge, 2001d, Phys. Rev. Lett. 87,213902.
Vakhitov, N. G., and A. A. Kolokolov, 1975, Radiophys.Quant. Electron. 16, 783.
Verhoef, A. J., J. Seres, K. Schmid, Y. Nomura, G. Tempea,L. Veisz, and F. Krausz, 2006, Appl. Phys. B: Lasers &Optics 82, 513.
Vidal, F., and T. W. Johnston, 1996, Phys. Rev. Lett. 77,1282.
Vidal, F., and T. W. Johnston, 1997, Phys. Rev. E 55, 3571.Vincotte, A., and L. Berge, 2004, Phys. Rev. A 70, 061802(R).Vincotte, A., and L. Berge, 2005, Phys. Rev. Lett. 95, 193901.Vlasov, S. N., V. A. Petrishchev, and V. I. Talanov, 1974,
Radiophys. Quant. Electron. 14, 1062.Vlasov, S. N., L. V. Piskunova, and V. I. Talanov, 1989, Sov.
Phys. JETP 68, 1125.Vuong, L. T., T. D. Grow, A. Ishaaya, A. L. Gaeta, G. W.
’t Hooft, E. R. Eliel, and G. Fibich, 2006, Phys. Rev. Lett.96, 133901.
Wagner, N. L., E. A. Gibson, T. Popmintchev, I. P. Christov,M. M. Murnane, and H. C. Kapteyn, 2004, Phys. Rev. Lett.93, 173902.
Ward, H., and L. Berge, 2003, Phys. Rev. Lett. 90, 053901.
51
Weinstein, M. I., 1983, Commun. Math. Phys. 87, 567.Wiens, R. C., R. E. Arvidson, D. A. Cremers, M. J. Ferris,
J. D. Blacic, and F. P. S. IV, 2002, J. Geophys. Res.Planets 107(E11), FIDO3.
Wille, H., M. Rodriguez, J. Kasparian, D. Mondelain, J. Yu,A. Mysyrowicz, R. Sauerbrey, J. P. Wolf, , and L. Woste,2002, Eur. Phys. Jour. - Appl. Phys. 20, 183.
Wolf, J.-P., 2000, Ultraviolet/visible light detection and rang-ing Applications in air monitoring, in (Meyers, 2000), p.2226.
Woste, L., C. Wedekind, H. Wille, P. Rairoux, B. Stein,S. Nikolov, C. Werner, S. Niedermeier, F. Ronneberger,H. Schillinger, and R. Sauerbrey, 1997, Laser & Optoelek-tron. 29, 51.
Wyller, J., 2001, Physica D 157, 90.Xi, T.-T., X. Lu, and J. Zhang, 2006, Phys. Rev. Lett. 96,
025003.Xu, H. L., J. F. Daigle, Q. Luo, and S. L. Chin, 2006a, Appl.
Phys. B: Lasers & Optics 82, 655.Xu, X. H., W. Liu, and S. L. Chin, 2006b, Opt. Lett. 31,
1540.Yablonovitch, E., 1974, Phys. Rev. A 10, 1888.Yablonovitch, E., and N. Bloembergen, 1972, Phys. Rev. Lett.
29, 907.Yang, G., and Y. R. Shen, 1984, Opt. Lett. 9, 510.Yang, H., J. Zhang, J. Zhang, L. Z. Zhao, Y. J. Li, H. Teng,
Y. T. Li, Z. H. Wang, Z. L. Chen, Z. Y. Wei, J. X. Ma,W. Yu, et al., 2003, Phys. Rev. E 67, 015401(R).
Yu, J., D. Mondelain, G. Ange, R. Volk, S. Niedermeier, J.-P.Wolf, J. Kasparian, and R. Sauerbrey, 2001, Opt. Lett. 26,533.
Yu, J., D. Mondelain, J. Kasparian, E. Salmon, S. Geffroy,C. Favre, V. Boutou, and J.-P. Wolf, 2003, Appl. Opt. 42,7117.
Zakharov, V. E., and E. A. Kuznetsov, 1986, Sov. Phys. JETP64, 773.
Zakharov, V. E., and A. M. Rubenchik, 1974, Sov. Phys.JETP 38, 494.
Zeng, Z., R. Li, W. Yu, and Z. Xu, 2003, Phys. Rev. A 67,013815.
Zharova, N. A., A. G. Litvak, and V. A. Mironov, 2003, J.Exp. Theor. Phys. 96, 643.
Zozulya, A. A., S. A. Diddams, A. G. Van Engen, and T. S.Clement, 1999, Phys. Rev. Lett. 82, 1430.