Embed Size (px)
Citation preview

See discussions, stats, and author profiles for this publication at: https://www.researchgate.net/publication/326261186
"Small is beautiful” - but will small WECs ever become commercial?
Article in Transaction of the International Conference on Endodontics. International Conference on Endodontics · June 2018
CITATIONS
0
READS
63
3 authors, including:
Some of the authors of this publication are also working on these related projects:
Wave Dragon View project
EU NIREX View project
Erik Friis-Madsen
Wave Dragon ApS
47 PUBLICATIONS 502 CITATIONS
SEE PROFILE
Iain Russell
Wave Dragon ApS
10 PUBLICATIONS 21 CITATIONS
SEE PROFILE
All content following this page was uploaded by Erik Friis-Madsen on 09 July 2018.
The user has requested enhancement of the downloaded file.

7th International Conference on Ocean Energy 2018 // Cherbourg, France
1
“Small is beautiful” - but will small WECs ever become commercial?
Erik Friis-Madsen*, H.C. Soerensen*, I. Russell**
* Wave Dragon, Copenhagen, Denmark,
[email protected]; [email protected] **Wave Dragon Wales, UK,
Abstract
This paper presents a short overview of the development of
wave energy converters (WECs) since the 1970s where the
oil crises raised the interest in renewable power generation.
The “small is beautiful” motto is dealt with and dismissed
when regarding the commercial viability of utility scale
WEC power plants. The potential future developmental
pathway towards commercialisation of wave energy is
compared to the development of the Danish wind mill sector
where the first series production of 22 kW started in 1978 –
four years after Prof. Stephen Salter presented his MW sized
so called Duck.
The paper discusses the capital expenditure CAPEX and
operation and maintenance costs (OPEX) for small and large
WECs seen over the WEC lifetime and the resulting
levelized cost of energy (LCOE) for power plant size wave
energy parks. The following statement is taken from the
2014 JRC Ocean Energy Status Report [8]:
“Maintenance: small-scale devices are associated with
reduced maintenance, since they are designed to operate in
farms and a defect to one unit may not affect the overall
array performance, hence reducing the time necessary for
maintenance.”
The paper explains why this is a false statement -
maintenance costs will inevitably decrease with increasing
WEC size.
The paper also justifies that large WECs can obtain
relatively low CAPEX and OPEX compared to small WECs,
and that large WECs can be expected to match the LCOE
for floating wind turbines. Combined offshore wave-wind
power plants can be expected to deliver lower LCOE than
pure wave or wind parks.
Keywords WEC-types, WEC-sizes, utility size WEC power
plants, multi-use platforms.
I. INTRODUCTION
The development of any technology is almost never a
smooth or even direct path; some take far longer to realise
than others. The design for a human carrying helicopter was
theorised in the 1480’s by Da Vinci but it was not until 1907
that such a device actually lifted a pilot off the ground. The
first windmills were constructed around 1500 years ago, and
electrical power was produced by wind turbines 130 years
ago. The development of the commercial Danish type
horizontal-axis 3-bladed wind turbine was kick started by
the oil crisis in the early 1970s with series production of 22
kW windmills. The World’s first offshore wind park with 11
units and a total capacity of 5 MW was inaugurated in
Denmark less than 20 years later. The plant was in operation
for 25 years and was finally decommissioned last year. The
upscaling of the Danish wind turbine has continued with the
same speed and todays offshore turbines, in Europe, have
now a power of more than 6 MW. The reason for this rapid
upscaling of offshore wind turbines is primarily the
reduction of balance of plant costs on a MW basis, with
potential to lower OPEX.
Figure 1 : Development of offshore wind turbine sizes
Between the early 1940s and the 1970s MW size turbines
were constructed in many countries without success. The
commercial success of the Danish stepwise and bottom up
development of wind turbine sizes is therefore generally
recognised as the way to do this kind of technical
development.
7th International Conference on Ocean Energy 2018 // Cherbourg, France
2
The history of wave energy converters is much shorter than
the wind energy history but goes at least back to the 19th
century. Small navigation buoys powered by wave energy
were produced in Japan since 1965. Then around the same
time when the development of the modern wind turbine took
off Professor Stephen Salter presented what was to be
known as Salter’s duck – a very efficient multi MW offshore
device. Since then several large WEC types have been
designed, but no floating MW size devices have been tested
until now. A good description of the development of WECs
in UK until 1999 can be found in “A brief review of Wave
Energy” by T W Thorpe [1]
“Small is beautiful”
The “small is beautiful” motto has been heard from time to
time ever since the first European Wave Energy Symposium
in 1993 (Falnes J. pp. 367-372. 1994). It has however often
been forgotten that this is only a valid statement regarding
point absorbers, where the economic optimal size can only
feed a few hundred kWs to the grid. Since then many point
absorbers have been tested both in laboratories and at sea.
Most of the proposed point absorbers have no on-board
power storage which means that they deliver a highly
fluctuating power production: The average production in the
most common sea states is usually around 1/10 of the
installed generator capacity – i.e. below 100 kW even for
large point absorbers with diameters of 15 – 20 meters. This
results in a rather low capacity factor in line with
photovoltaics – i.e. around 1000 yearly full load hours.
Can the development of wind be copied to wave?
Even though a power plant size wave energy park of 100
MW will need many hundred large point absorbers it has
been suggested that this is the best way forward for
development of wave energy. World’s first offshore wind
park wasn’t built before reliable turbines of 450 kW had
been developed. This 5 MW park had around 2000 yearly
full load hours. The primary reason why the Danish
development of the modern wind turbine cannot be copied
to the wave energy sector is however the fact that even the
small 22 kW wind turbines with 5m wings could deliver
reasonable revenue to their private owners. The
commercialisation of the modern wind turbine had therefore
a jump start. 30 years later we saw the same fast evolution
happen for solar power. Such a route to commercialisation is
obviously not open to wave power as sale of small-scale grid
connected devices to private customers is not an option. So,
when many ask why the development of wave power has
taken so long, the first that comes to mind is that the public
support to research and development of the sector has been -
and still is - quite inadequate simply because the financial
“valley of death” is much deeper and wider as was the case
for wind.
II. WAVE ENERGY CONVERTER TYPES
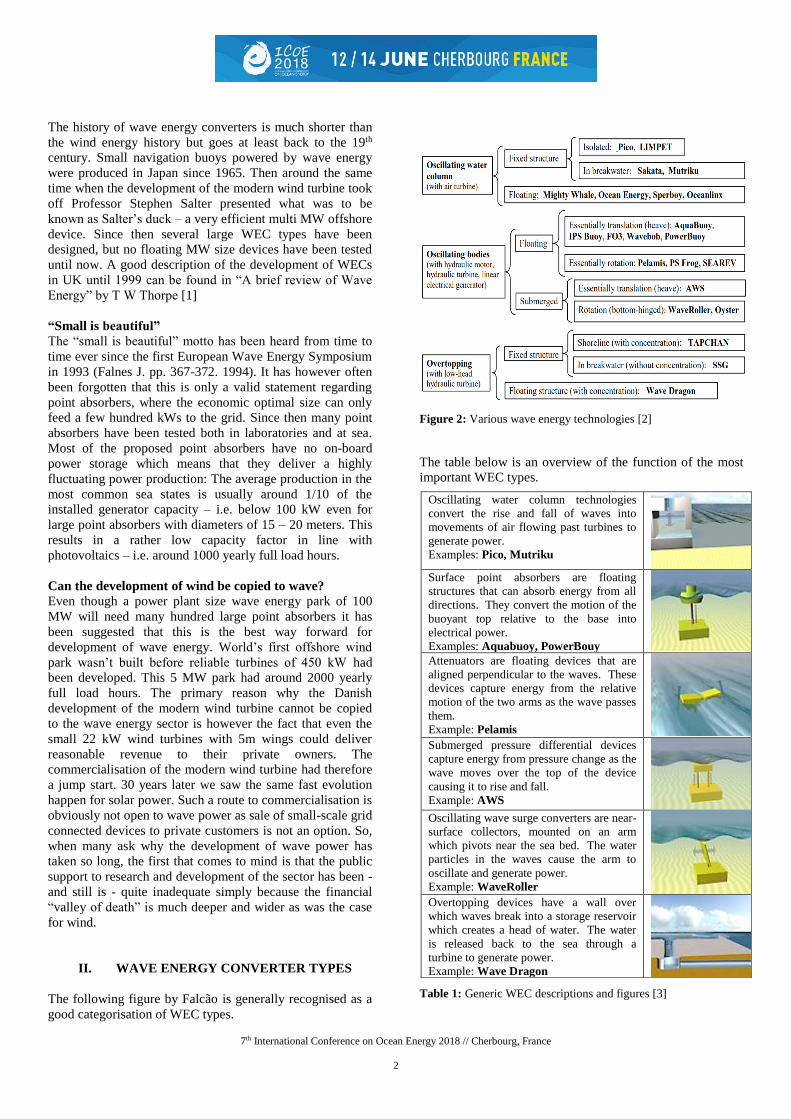
The following figure by Falcão is generally recognised as a
good categorisation of WEC types.
Figure 2: Various wave energy technologies [2]
The table below is an overview of the function of the most
important WEC types.
Table 1: Generic WEC descriptions and figures [3]
Oscillating water column technologies
convert the rise and fall of waves into
movements of air flowing past turbines to
generate power. Examples: Pico, Mutriku
Surface point absorbers are floating
structures that can absorb energy from all
directions. They convert the motion of the
buoyant top relative to the base into
electrical power.
Examples: Aquabuoy, PowerBouy Attenuators are floating devices that are
aligned perpendicular to the waves. These
devices capture energy from the relative
motion of the two arms as the wave passes
them.
Example: Pelamis Submerged pressure differential devices
capture energy from pressure change as the
wave moves over the top of the device
causing it to rise and fall.
Example: AWS Oscillating wave surge converters are near-
surface collectors, mounted on an arm
which pivots near the sea bed. The water
particles in the waves cause the arm to
oscillate and generate power.
Example: WaveRoller Overtopping devices have a wall over
which waves break into a storage reservoir
which creates a head of water. The water
is released back to the sea through a
turbine to generate power.
Example: Wave Dragon

7th International Conference on Ocean Energy 2018 // Cherbourg, France
3
It has in addition been suggested to classify WECs as First,
Second or Third generation systems, where onshore and
nearshore oscillating water column are considered to be First
Generation Systems. Near shore and offshore point
absorbers are according to this terminology Second
Generation Systems, and large-scale offshore devices are
finally classified as Third Generation Systems [4]
The distance from shore of a wave energy parkis of course
important as this has a major impact on the grid connection
costs. The water depth is however much more important as
this decides which WEC types to consider at a given site.
Figure 3 is taken from the SI-Ocean project, and near shore
is characterised by a water depth below 20m. Water depth
between 20 and 50m can be labelled intermediate offshore,
and water depth of more than 50m, deep offshore – even if
the offshore oil industry defines deep offshore as more than
125m.
Figure 3: Mooring and Foundation Configurations for WECs [5]
In “State of the art” [5], “State of the art analysis” [6] and
“Overview of offshore wind and ocean energy technologies”
[7] most of the known and tested WECs are described.
The World’s deep offshore areas with suitable wave
climates for WEC deployment are much larger than the near
shore and intermediate offshore areas. It has however been
found that bottom standing devices can obtain quite high
efficiencies. It is also an advantage that the relation between
the max and average power of the waves is smaller in
shallow waters. Thus, it has been claimed that bottom
standing devices have the best possibility of becoming a
viable technology. This is however not the case:
➢ The cost of land-based wind has fallen with a factor of
five, from the 22kW turbine to today’s 3-4 MW
turbine. This is partly due to upscaling and partly due
to mass production of standardised turbines. Neither
upscaling nor mass production of bottom standing
WECs are possible.
➢ The relative high possible efficiency for the flap type
WECs is counteracted by the lower wave energy in
shallow waters. The efficiency is also hampered by the
variable water depth due to tides.
➢ If the proposed deployment site is close to land it can
be very difficult to obtain a consent to install WECs –
due to security issues, other use of area and/or
environmental concern.
➢ It is true that the max wave power in storms is reduced
in shallow waters, but tidal and storm generated water
streams running along the coast can be strong. It is well
known that scour around wind turbine piles often is a
problem, and what can be even worse for bottom
standing devices is moving sand dunes that can cover
essential parts of a submerged device.
➢ Even if the max wave power in storms is reduced due
to seabed friction, the forces caused by breaking waves
can be much more devastating than the forces
experienced at deep offshore sites. This is well known
from construction work such as harbour building at
exposed coasts.
➢ Last but not least it should be noticed, that it can be
very difficult to do maintenance work on submerged
devices as there can be strong water movements right
down to the bottom in shallow waters.
Intermediate offshore devices have as an outset much better
chances of success than near shore devices. There is
however one serious problem facing development of wave
energy at these water depths:
If the site is sufficiently far from shore and the wind
resource at the site is good there will inevitably be a fierce
competition with offshore wind - and wind is no doubt a
winner technology. Combined wave- and wind parks may
eventually turn out to be a viable solution at these depths.
III. COMMERCIAL SCALE WAVE ENERGY
POWER PLANTS
Commercial offshore wave power plants will be of sizes
comparable to wind turbine parks – both regarding area and
power production. Today’s wind parks often have a capacity
of several hundred MW. It is therefore recommendable to
consider wave energy parks to be of at least 100MW
installed power in feasibility studies.
What types of offshore WECs, i.e. Third Generation
Systems, can be expected to match floating wind turbines?
The first floating wind farm, Hywind in Scotland, consisting
of 5 turbines each of 6MW size was inaugurated in 2017.
In the “2014 JRC Ocean Energy Status Report” [8], it is
predicted that wave power parks made up of hundreds of
small-scale devices is a viable solution - one of the reasons
being:
“Maintenance: small-scale devices are associated with
reduced maintenance, since they are designed to operate in
farms and a defect to one unit may not affect the overall
array performance, hence reducing the time necessary for
maintenance.”
This statement is clearly not valid, because the percentage of
lost power production only depends on the frequency of
defects no matter the size of the devices. Maintenance costs
will without doubt decrease with increasing WEC size. It
makes economic sense to equip large-scale WECs with more
“redundancy” in the PTO system through advanced
Supervisory Control And Data Acquisition (SCADA) and
PLC or computer control systems with backup. In WECs
with more PTO-systems operating in parallel, as is the case

7th International Conference on Ocean Energy 2018 // Cherbourg, France
4
for overtoppers like Wave Dragon, a fault on one generator
will have no influence on the produced power except in the
highest sea states. Equally important regarding OPEX is the
fact that the cost of transport to offshore parks and to access
the individual WECs counts for a large part of the total
OPEX. Large-scale WECs with multiple generators can be
designed to allow for easy access even in sea states where it
is too dangerous to access WECs like point absorbers where
the structure moves in resonance with the waves. It should
also be mentioned that it is all but prohibitive costly to
maintain small-scale devices where essential parts of the
PTO system are under water – or even at the sea bottom as
have been seen in many proposed WECs.
Full scale testing
Only few full-scale test of grid connected WECs have been
reported, and in addition it is very difficult to find results
from testing in accordance with “standards” like ”Protocols
for the Equitable Assessment of Marine Energy Converters”
[9], and the ongoing IEC standardization work. Regarding
experiences and recommendations for the development of
WECs, and equally important how markets and LCOE can
be expected to develop, it is important to be familiar with
www.ocean-energy-systems.org – and in particular the
report ”Cost of Energy for Ocean Energy Technologies”
[10].
Recent Cost of Energy studies for wave
The report “Cost of energy and Cost Reduction
Opportunities” [11], supplements [10] with relevant
findings regarding array cost breakdown. The report states
that CAPEX accounts from under half the LCOE for early
arrays increasing to around 60% in the commercial stage. It
is also important to notice that the estimated OPEX varies
between 70 and 380 $/kW per year for the first commercial
arrays.
Figure 4: Breakdown of LCOE, early and commercial arrays [10]
The difference in OPEX for small-scale WEC power plants
and large-type WEC power plants is significantly higher
than the difference in CAPEX.
Yearly power production of small-scale devices
In the summary paper “Numerical estimation of energy
delivery from a selection of wave energy converters” [12],
the mean average output of a selection of 8 WECs is
described. When looking at the annual mean power
production for typical point absorbers of the heaving buoy
type tight moored to the sea bed – the Seabased WEC is a
good example - the paper justifies the good old rule of
thumb saying that an average power of around 1 kW per m3
of float volume is what can be hoped for with a small point
absorber in wave climates between 20-30 kW/m. A fully
submerged float as used in the CETO device would need to
be more than 5 times larger i.e. a power of only 0.2 kW per
m3 of float volume.
Point absorbers are also characterised by the fact that the
maximum instantaneous power is 10 to 30 times higher than
the average absorbed power measured over an hour. This
means that the PTO system in a medium sized power point
absorber would need to handle an instantaneous power of
several MW. In the paper it is recommended to limit the
rated power of such a device to 5 times the average power
by means of on-board energy storage components. The back
drop of this is of course that there are power losses in such
systems and they also increase the OPEX.
As mentioned in the introduction today’s offshore wind
turbines in Europe have a power of at least 6 MW. At most
sites in northern Europe such turbines can at least deliver a
yearly average power of 3 MW. Small-scale WECs like
point absorbers with a diameter of 20 m – much larger than
tested until now - can probably reach a capture width of
30%. In a 25 kW/m wave climate such a WEC will then
deliver an average yearly power of 0.3 x 20 x 25 = 150 kW.
This means that the small-scale WEC park would need to
have 20 times as many devices as a wind park with 6 MW
turbines to deliver the same yearly power production!
Balance of plant costs
It is generally acknowledged that CAPEX pr. installed MW
can be much lower for parks made up from large-scale
WECs than for parks of small-scale devices. This is
primarily due to the reduced cost of the WECs, but it is also
partly due to lower planning, mooring and deployment costs
and substantial savings in inter array power cables.
The paper “Impacts on the Electrical System Economics
from Critical Design Factors of Wave Energy Converters
and Arrays” [13], delivers a good overview of how cabling
cost varies in dependence of WEC size.
Figure 5: Relative cost of electrical cabling in wave farms, [13]
The relative cost of mooring will likewise fall significantly
with increased WEC size. Taken together savings in cabling
7th International Conference on Ocean Energy 2018 // Cherbourg, France
5
and moorings can reduce the total CAPEX for a wave farm
considerably if MW size converters are installed instead of
small-scale devices.
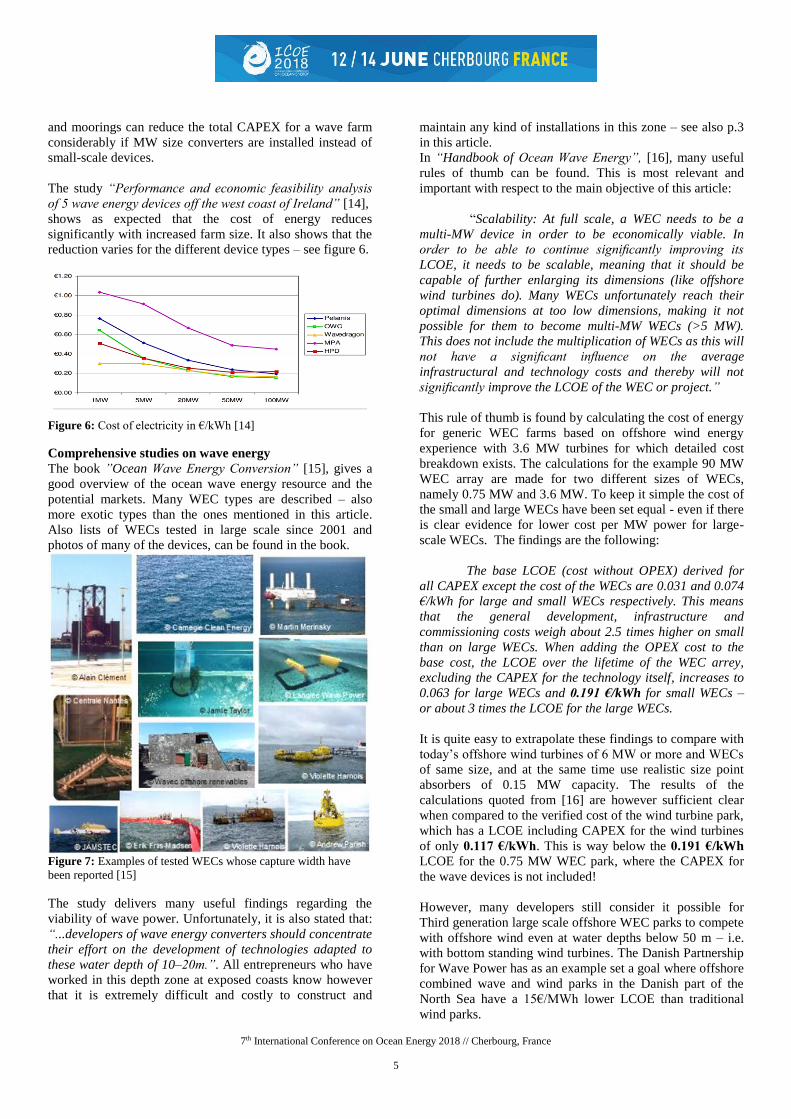
The study “Performance and economic feasibility analysis
of 5 wave energy devices off the west coast of Ireland” [14],
shows as expected that the cost of energy reduces
significantly with increased farm size. It also shows that the
reduction varies for the different device types – see figure 6.
Figure 6: Cost of electricity in €/kWh [14]
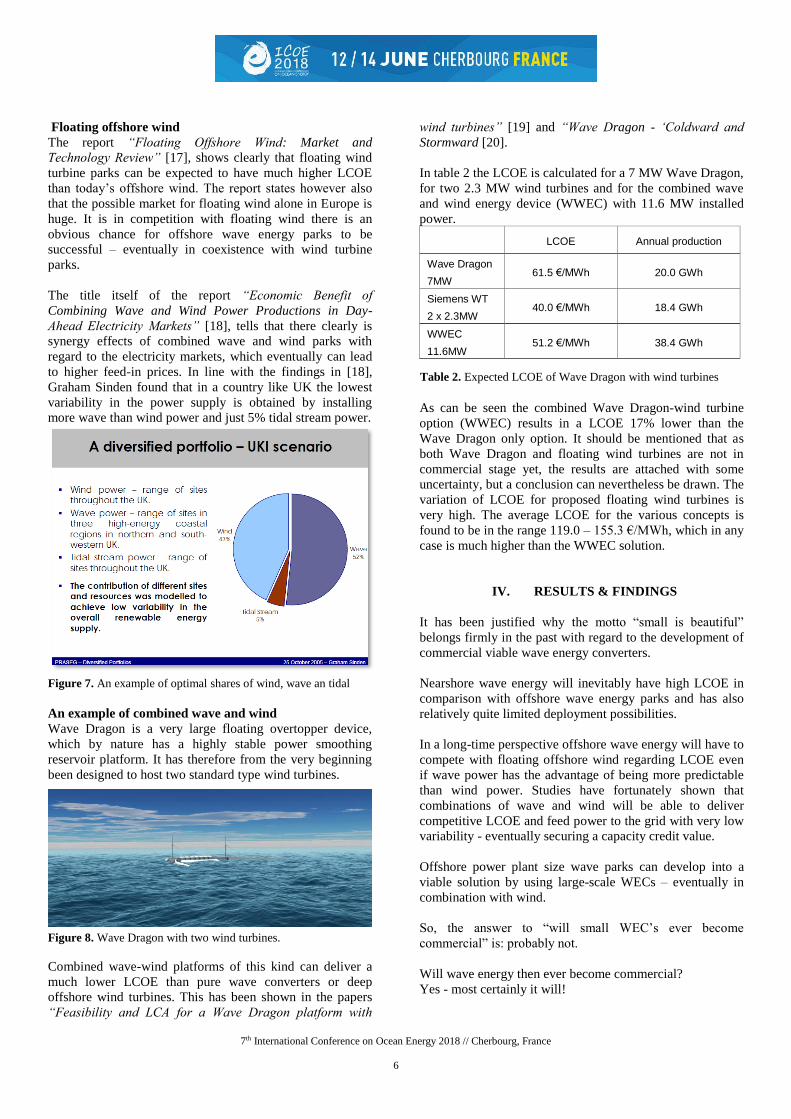
Comprehensive studies on wave energy
The book ”Ocean Wave Energy Conversion” [15], gives a
good overview of the ocean wave energy resource and the
potential markets. Many WEC types are described – also
more exotic types than the ones mentioned in this article.
Also lists of WECs tested in large scale since 2001 and
photos of many of the devices, can be found in the book.
Figure 7: Examples of tested WECs whose capture width have
been reported [15]
The study delivers many useful findings regarding the
viability of wave power. Unfortunately, it is also stated that:
“...developers of wave energy converters should concentrate
their effort on the development of technologies adapted to
these water depth of 10–20m.”. All entrepreneurs who have
worked in this depth zone at exposed coasts know however
that it is extremely difficult and costly to construct and
maintain any kind of installations in this zone – see also p.3
in this article.
In “Handbook of Ocean Wave Energy”, [16], many useful
rules of thumb can be found. This is most relevant and
important with respect to the main objective of this article:
“Scalability: At full scale, a WEC needs to be a
multi-MW device in order to be economically viable. In
order to be able to continue significantly improving its
LCOE, it needs to be scalable, meaning that it should be
capable of further enlarging its dimensions (like offshore
wind turbines do). Many WECs unfortunately reach their
optimal dimensions at too low dimensions, making it not
possible for them to become multi-MW WECs (>5 MW).
This does not include the multiplication of WECs as this will
not have a significant influence on the average
infrastructural and technology costs and thereby will not
significantly improve the LCOE of the WEC or project.”
This rule of thumb is found by calculating the cost of energy
for generic WEC farms based on offshore wind energy
experience with 3.6 MW turbines for which detailed cost
breakdown exists. The calculations for the example 90 MW
WEC array are made for two different sizes of WECs,
namely 0.75 MW and 3.6 MW. To keep it simple the cost of
the small and large WECs have been set equal - even if there
is clear evidence for lower cost per MW power for large-
scale WECs. The findings are the following:
The base LCOE (cost without OPEX) derived for
all CAPEX except the cost of the WECs are 0.031 and 0.074
€/kWh for large and small WECs respectively. This means
that the general development, infrastructure and
commissioning costs weigh about 2.5 times higher on small
than on large WECs. When adding the OPEX cost to the
base cost, the LCOE over the lifetime of the WEC arrey,
excluding the CAPEX for the technology itself, increases to
0.063 for large WECs and 0.191 €/kWh for small WECs –
or about 3 times the LCOE for the large WECs.
It is quite easy to extrapolate these findings to compare with
today’s offshore wind turbines of 6 MW or more and WECs
of same size, and at the same time use realistic size point
absorbers of 0.15 MW capacity. The results of the
calculations quoted from [16] are however sufficient clear
when compared to the verified cost of the wind turbine park,
which has a LCOE including CAPEX for the wind turbines
of only 0.117 €/kWh. This is way below the 0.191 €/kWh
LCOE for the 0.75 MW WEC park, where the CAPEX for
the wave devices is not included!
However, many developers still consider it possible for
Third generation large scale offshore WEC parks to compete
with offshore wind even at water depths below 50 m – i.e.
with bottom standing wind turbines. The Danish Partnership
for Wave Power has as an example set a goal where offshore
combined wave and wind parks in the Danish part of the
North Sea have a 15€/MWh lower LCOE than traditional
wind parks.
7th International Conference on Ocean Energy 2018 // Cherbourg, France
6
Floating offshore wind
The report “Floating Offshore Wind: Market and
Technology Review” [17], shows clearly that floating wind
turbine parks can be expected to have much higher LCOE
than today’s offshore wind. The report states however also
that the possible market for floating wind alone in Europe is
huge. It is in competition with floating wind there is an
obvious chance for offshore wave energy parks to be
successful – eventually in coexistence with wind turbine
parks.
The title itself of the report “Economic Benefit of
Combining Wave and Wind Power Productions in Day-
Ahead Electricity Markets” [18], tells that there clearly is
synergy effects of combined wave and wind parks with
regard to the electricity markets, which eventually can lead
to higher feed-in prices. In line with the findings in [18],
Graham Sinden found that in a country like UK the lowest
variability in the power supply is obtained by installing
more wave than wind power and just 5% tidal stream power.
Figure 7. An example of optimal shares of wind, wave an tidal
An example of combined wave and wind
Wave Dragon is a very large floating overtopper device,
which by nature has a highly stable power smoothing
reservoir platform. It has therefore from the very beginning
been designed to host two standard type wind turbines.
Figure 8. Wave Dragon with two wind turbines.
Combined wave-wind platforms of this kind can deliver a
much lower LCOE than pure wave converters or deep
offshore wind turbines. This has been shown in the papers
“Feasibility and LCA for a Wave Dragon platform with
wind turbines” [19] and “Wave Dragon - ‘Coldward and
Stormward [20].
In table 2 the LCOE is calculated for a 7 MW Wave Dragon,
for two 2.3 MW wind turbines and for the combined wave
and wind energy device (WWEC) with 11.6 MW installed
power.
LCOE Annual production
Wave Dragon
7MW 61.5 €/MWh 20.0 GWh
Siemens WT
2 x 2.3MW 40.0 €/MWh 18.4 GWh
WWEC
11.6MW 51.2 €/MWh 38.4 GWh
Table 2. Expected LCOE of Wave Dragon with wind turbines
As can be seen the combined Wave Dragon-wind turbine
option (WWEC) results in a LCOE 17% lower than the
Wave Dragon only option. It should be mentioned that as
both Wave Dragon and floating wind turbines are not in
commercial stage yet, the results are attached with some
uncertainty, but a conclusion can nevertheless be drawn. The
variation of LCOE for proposed floating wind turbines is
very high. The average LCOE for the various concepts is
found to be in the range 119.0 – 155.3 €/MWh, which in any
case is much higher than the WWEC solution.
IV. RESULTS & FINDINGS
It has been justified why the motto “small is beautiful”
belongs firmly in the past with regard to the development of
commercial viable wave energy converters.
Nearshore wave energy will inevitably have high LCOE in
comparison with offshore wave energy parks and has also
relatively quite limited deployment possibilities.
In a long-time perspective offshore wave energy will have to
compete with floating offshore wind regarding LCOE even
if wave power has the advantage of being more predictable
than wind power. Studies have fortunately shown that
combinations of wave and wind will be able to deliver
competitive LCOE and feed power to the grid with very low
variability - eventually securing a capacity credit value.
Offshore power plant size wave parks can develop into a
viable solution by using large-scale WECs – eventually in
combination with wind.
So, the answer to “will small WEC’s ever become
commercial” is: probably not.
Will wave energy then ever become commercial?
Yes - most certainly it will!

7th International Conference on Ocean Energy 2018 // Cherbourg, France
7
REFERENCES
[1] Thorpe, T.W., “A Brief Review of Wave Energy”, UK
DTI, May 1999.
[2] Falcão, A.F.O., “Modelling of Wave Energy
Conversion”, IST, 2017.
[3] Aqua-RET, http://tinyurl.com/y7r6gjvp
[4] Cruz J, editor. “Ocean wave energy”.
Springer, 2008.
[5] “Ocean Energy: State of the Art.”
Report of SI OCEAN, 2013.
[6] “State of the art analysis – A cautiously optimistic
review of the technical status of wave energy
technology”. Report of Waveplam, Intelligent Energy
Europe; 2009.
[7] “Overview of offshore wind and ocean energy
technologies”, Report of MARINA Platform, 2012.
[8] Magagna, D., Uihlein, A. “2014 JRC Ocean Energy
Status Report”
[9] “Protocols for the Equitable Assessment of Marine
Energy Converters”, Report of Equimar, 2011.
[10] Chozas, J.F. et. al.,”Cost of Energy for Ocean Energy
Technologies” OES, IEA, 2015
[11] “Ocean Energy: Cost of energy and Cost Reduction
Opportunities”, Report of SI OCEAN, 2013.
[12] Babarit, A., et. al., “Numerical estimation of energy
delivery from a selection of wave energy converters”,
Renewable Energy 41 44-63, 2012
[13] Sharkey, F., et. al., “Impacts on the Electrical System
Economics from Critical Design Factors of Wave
Energy Converters and Arrays”, EWTEC 2013.
[14] Dalton, GJ, Lewis, T (2011), “Performance and
economic feasibility analysis of 5 wave energy devices
off the west coast of Ireland”, EWTEC 2011.
[15] Babarit, A. “Ocean Wave Energy Conversion”,
Elsevier, 2017.
[16] Pecher, A., Kofoed, J.P., “Handbook of Ocean Wave
Energy”, Springer Open, 2017.
[17] “Floating Offshore Wind: Market and Technology
Review”. Report by Carbon Trust for the Scottish
Government. 2015.
[18] Chozas, J.F., H.C. Sørensen, and N.E. Helstrup.
“Economic Benefit of Combining Wave and Wind
Power Productions in Day-Ahead Electricity
Markets”. in ICOE, Dublin, Ireland. 2012.
[19] Soerensen, H.C., Friis-Madsen, E., Russel, I.,
Parmeggiani, S., Fernández-Chozas, J.
“Feasibility and LCA for a Wave Dragon platform
with wind turbines”. ISOPE 2016.
[20] Russell, I, “Wave Dragon - ‘Coldward and
Stormward', RENEW 2016 Conference, Lisbon,
Portugal.
View publication statsView publication stats