Embed Size (px)
Citation preview

i
The Hamilton Project • Brookings
Ryan Nunn and Megan Mumford
FRAMING PAPER | OCTOBER 2017
The Incomplete Progress of Women in the Labor Market
ii
The Hamilton Project • Brookings
The Hamilton Project seeks to advance America’s promise
of opportunity, prosperity, and growth.
We believe that today’s increasingly competitive global economy
demands public policy ideas commensurate with the challenges
of the 21st Century. The Project’s economic strategy reflects a
judgment that long-term prosperity is best achieved by fostering
economic growth and broad participation in that growth, by
enhancing individual economic security, and by embracing a role
for effective government in making needed public investments.
Our strategy calls for combining public investment, a secure social
safety net, and fiscal discipline. In that framework, the Project
puts forward innovative proposals from leading economic thinkers
— based on credible evidence and experience, not ideology or
doctrine — to introduce new and effective policy options into the
national debate.
The Project is named after Alexander Hamilton, the nation’s
first Treasury Secretary, who laid the foundation for the modern
American economy. Hamilton stood for sound fiscal policy,
believed that broad-based opportunity for advancement would
drive American economic growth, and recognized that “prudent
aids and encouragements on the part of government” are
necessary to enhance and guide market forces. The guiding
principles of the Project remain consistent with these views.
This policy proposal is a proposal from the authors. As emphasized
in The Hamilton Project’s original strategy paper, the Project was
designed in part to provide a forum for leading thinkers across
the nation to put forward innovative and potentially important
economic policy ideas that share the Project’s broad goals of
promoting economic growth, broad-based participation in growth,
and economic security. The author(s) are invited to express their
own ideas in policy papers, whether or not the Project’s staff or
advisory council agrees with the specific proposals. This policy
paper is offered in that spirit.
MISSION STATEMENT NOTE
The Incomplete Progress of Women in the Labor Market
Ryan NunnThe Hamilton Project and the Brookings Institution
Megan MumfordThe Hamilton Project
OCTOBER 2017
A CHAPTER IN THE RECENTLY RELEASED HAMILTON PROJECT BOOK
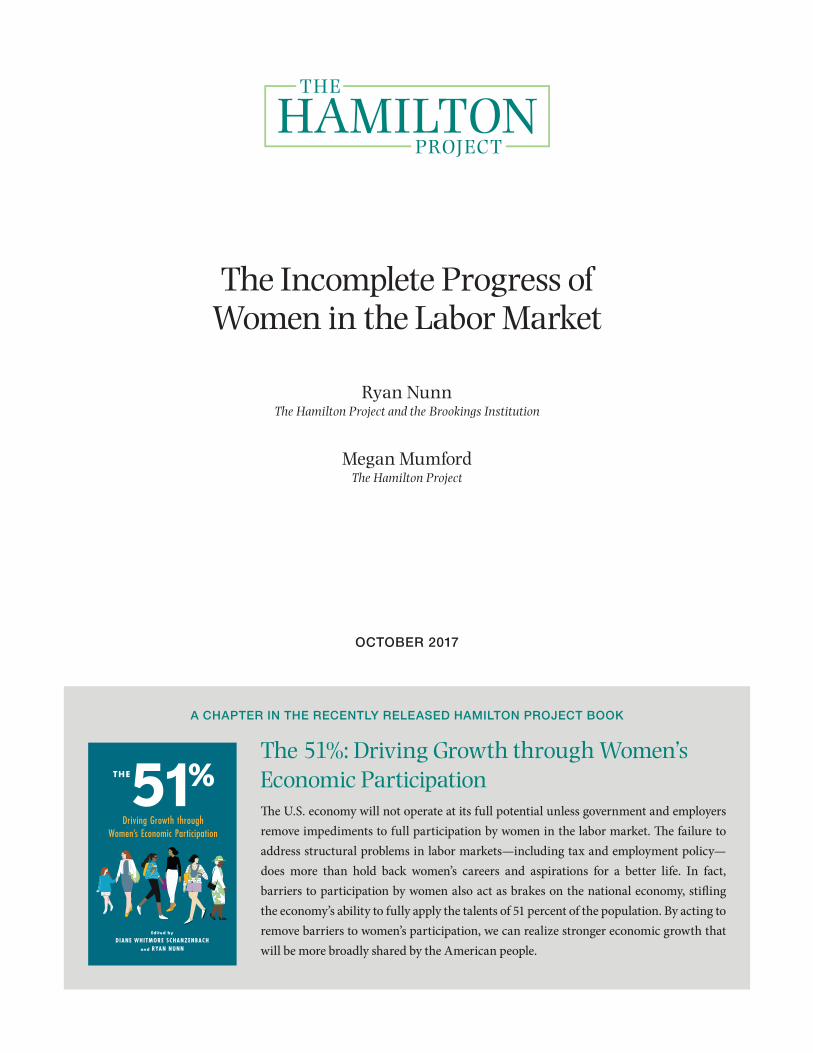
The 51%: Driving Growth through Women’s Economic ParticipationThe U.S. economy will not operate at its full potential unless government and employers remove impediments to full participation by women in the labor market. The failure to address structural problems in labor markets—including tax and employment policy—does more than hold back women’s careers and aspirations for a better life. In fact, barriers to participation by women also act as brakes on the national economy, stifling the economy’s ability to fully apply the talents of 51 percent of the population. By acting to remove barriers to women’s participation, we can realize stronger economic growth that will be more broadly shared by the American people.
Driving Growth through Women’s Economic Participation
51THE %
Edited by
DIANE WHITMORE SCHANZENBACH and RYAN NUNN
THE U.S. ECONOMY will not operate at its full potential unless
government and employers remove impediments to full participation
by women in the labor market. The failure to address structural prob-
lems in labor markets—including tax and employment policy—does
more than hold back women’s careers and aspirations for a better
life. In fact, barriers to participation by women also act as brakes on
the national economy, stifling the economy’s ability to fully apply the
talents of 51 percent of the population. By acting to remove barriers
to women’s participation, we can realize stronger economic growth
that will be more broadly shared by the American people.
Bridget Ansel, Washington Center for Equitable GrowthSandra E. Black, University of Texas at Austin and The Brookings InstitutionAudrey Breitwieser, The Hamilton ProjectJason Brown, Office of Microeconomic Analysis, U.S. Department of the TreasuryHeather Boushey, Washington Center for Equitable GrowthElizabeth Cascio, Dartmouth CollegeKaren Dynan, Harvard UniversityHilary Hoynes, University of California, BerkeleySara LaLumia, Williams CollegeBridget Terry Long, Harvard Graduate School of EducationNicole Maestas, Harvard Medical SchoolMegan Mumford, The Hamilton ProjectRyan Nunn, The Hamilton Project and the Brookings InstitutionJesse Rothstein, Institute for Research on Labor and Employment, California Policy Lab, and the University of California, Berkeley Krista Ruffini, University of California, BerkeleyChristopher J. Ruhm, University of VirginiaDiane Whitmore Schanzenbach, The Hamilton Project, the Brookings Institution, and Northwestern University
SCHAN
ZENBACH
/ N
UN
NT
HE
51%
Driving Growth through Wom
en’s Economic Participation
Contributors
6 × 9 SPINE: 0.4688 FLAPS: 0
HamiltonProject_CV_WIP04.indd 1 8/29/17 8:10 PM
1
The Hamilton Project • Brookings
Regardless of how you measure it, there remains a large gap between men’s and women’s wages and hours worked. It is difficult to determine exactly which measure of the gap is most relevant to economic policy, however. The simplest measure—an unadjusted difference between the wages of men and women—reflects differences in a variety of factors, including discrimination outside and within the labor market, labor market experience, and occupation, among many others. By contrast, the adjusted male-female gap reflects the difference in wages that remains after adjustment for observable factors that vary across men and women, and is generally smaller than the unadjusted gap.
By either measure, the wage gap has declined. In 1979 the unadjusted and adjusted male–female hourly wage gaps were 44 percent and 32 percent, respectively. In 2016 the corresponding gaps had fallen to 16 percent and 15 percent.2 Notably, the total impact of adjustments for observable differences—including occupation and education—has diminished, reflecting progress made by women entering higher-paying occupations and obtaining more education.
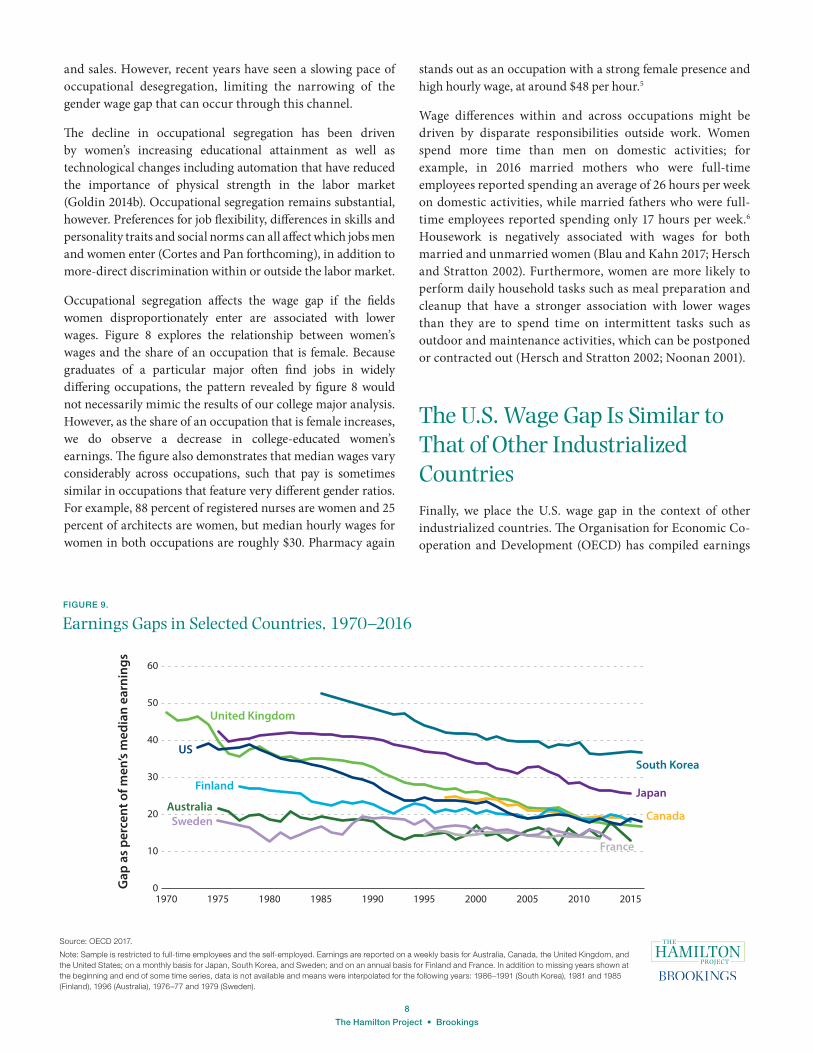
The United States is not alone in continuing to exhibit large differences in men’s and women’s labor market outcomes. For example, the gender wage gap in the United States has roughly mirrored that of the United Kingdom since the 1970s. Both countries fall in the middle of the pack of economies for which data are available, displaying larger gender gaps than some countries, including Australia, France, and Sweden, but smaller gaps than others, including Japan and South Korea (OECD 2017).
IntroductionOne of the most important economic developments of the twentieth century was the improvement in educational and labor market opportunities for women. As a result of this progress, tens of millions of American women attained postsecondary degrees, entered the labor force, and earned wages that have grown over time. The U.S. economy and household living standards have benefited tremendously from these improvements: 41 percent of a typical household’s income is now generated by women (authors’ calculations; Bureau of Labor Statistics [BLS] 2016).1
However, women’s labor market outcomes—and in particular their earnings—do not yet equal those of men, even though women’s educational attainment has surpassed that of men. In this chapter we explore these trends, focusing especially on the earnings gap between men and women and the various factors that give rise to it. This analysis helps to provide important economic context for the policy proposals included in this volume.
Labor market progress for women in the United States has been undeniable. Growth in women’s wages and hours worked has exceeded that of men’s for the past forty years, although women’s wages and hours started at much lower levels (authors’ calculations; BLS 1979–2016). In this chapter, we document that growth over the 1979–2016 period. We also analyze women’s educational attainment relative to men’s, exploring both the overall growth and the different college majors that women and men have entered. These differences in specialization are paralleled by differences in occupations, which in turn are associated with some of the remaining shortfall in women’s earnings relative to men’s.
AbstractThe gap between wages of men and women has fallen over the past several decades, reflecting women’s economic progress. Successive generations of women have obtained more education and received higher wages, entering a broader range of occupations that had previously been male-dominated. However, a significant gender wage gap remains. Occupational segregation, differences in academic specialization, difficulty in balancing work and household responsibilities, and wage discrimination—among many other factors—likely underlie much of the remaining gender wage gap.

2
The Hamilton Project • Brookings
Women’s Hours and Hourly Wages Have Grown QuicklyAs women’s labor force participation rose in the 1980s—a development described in this volume’s chapter by Black, Schanzenbach, and Breitwieser—women’s wages also grew. A combination of rising wages for women and falling wages for men cut the unadjusted median wage gap in half, from almost $9 per hour (in inflation-adjusted 2016 dollars) in 1979 to
more than $4 per hour in 1995 (see figure 1). While changes in relevant worker characteristics (i.e., education and labor market experience) have been found to explain about one-third to one-half of the narrowing of the wage gap in the 1980s, a variety of other factors also contributed, including the decline in wages for low-skilled men (O’Neill and Polachek 1993).
Figure 1 shows that this reduction in the hourly wage gap continued over the last two decades, bringing the 2016 gap to about $3 per hour. Although the rise in women’s wages
FIGURE 1.
Median Real Hourly Wage of Prime-Age Men and Women, 1979–2016
Sources: Current Population Survey 1979–2016; authors’ calculations.
Note: Prime-age indicates ages 25–54. Hourly wages are adjusted for inflation using the CPI-U-RS deflator.
Female
Male
1980 1985 1990 1995 2000 2005 2010 2015
Hou
rly
wag
e (2
016
dolla
rs)
10
15
20
25
0
5
FIGURE 2.
Median Real Hourly Wage of Prime-Age Men and Women, by Race and Ethnicity, 1979–2016
Source: Current Population Survey 1979–2016; authors’ calculations.
Note: Prime-age indicates ages 25–54. Hourly wages are adjusted for inflation using the CPI-U-RS deflator. Racial and ethnic categories are mutually exclusive.
White men
White women
Black womenHispanic women
Black menHispanic men
1980 1985 1990 1995 2000 2005 2010 2015
Hou
rly
wag
e (2
016
dolla
rs)
10
20
12
14
16
18
22
24
26
3
The Hamilton Project • Brookings
weekly hours increased from 36.1 to 37.6 (authors’ calculations; BLS 1979–2016).
Wage differences between men and women also vary considerably by race and ethnicity. Figure 2 shows that the wage gap narrowed between men and women of each race/ethnicity through at least the 1980s. Represented as a share of men’s median wages, the gap between non-Hispanic white men and women in 2016 was 17 percent, whereas the gaps for non-Hispanic black and Hispanic men and women were smaller, at 9 percent and 12 percent, respectively. Differences in wages by race and ethnicity are now larger than gender gaps: notably, white women’s median wages surpassed those of both Hispanic and black men by the 1990s.
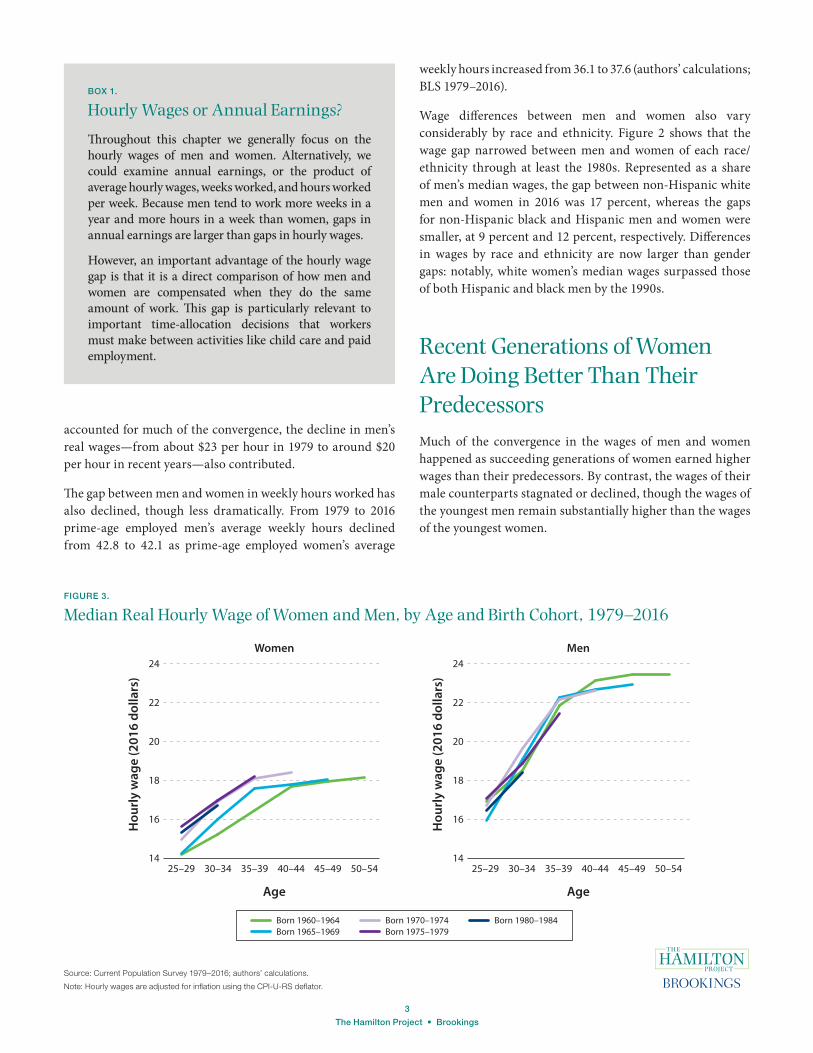
Recent Generations of Women Are Doing Better Than Their PredecessorsMuch of the convergence in the wages of men and women happened as succeeding generations of women earned higher wages than their predecessors. By contrast, the wages of their male counterparts stagnated or declined, though the wages of the youngest men remain substantially higher than the wages of the youngest women.
accounted for much of the convergence, the decline in men’s real wages—from about $23 per hour in 1979 to around $20 per hour in recent years—also contributed.
The gap between men and women in weekly hours worked has also declined, though less dramatically. From 1979 to 2016 prime-age employed men’s average weekly hours declined from 42.8 to 42.1 as prime-age employed women’s average
BOX 1.
Hourly Wages or Annual Earnings?
Throughout this chapter we generally focus on the hourly wages of men and women. Alternatively, we could examine annual earnings, or the product of average hourly wages, weeks worked, and hours worked per week. Because men tend to work more weeks in a year and more hours in a week than women, gaps in annual earnings are larger than gaps in hourly wages.
However, an important advantage of the hourly wage gap is that it is a direct comparison of how men and women are compensated when they do the same amount of work. This gap is particularly relevant to important time-allocation decisions that workers must make between activities like child care and paid employment.
FIGURE 3.
Median Real Hourly Wage of Women and Men, by Age and Birth Cohort, 1979–2016
Source: Current Population Survey 1979–2016; authors’ calculations.
Note: Hourly wages are adjusted for inflation using the CPI-U-RS deflator.
Age Age
Women Men
Hou
rly
wag
e (2
016
dolla
rs)
Born 1960–1964
20
18
16
1425–29 30–34 35–39 40–44 45–49 50–54
22
24
20
18
16
1425–29 30–34 35–39 40–44 45–49 50–54
22
24
Hou
rly
wag
e (2
016
dolla
rs)
Born 1965–1969Born 1970–1974Born 1975–1979
Born 1980–1984

4
The Hamilton Project • Brookings
To explore these developments, we examine the wages of individual cohorts of men or women as they age. Figure 3 shows that women born in the early 1980s earned higher wages early in their careers than did those born in the early 1960s. For example, women who were born in the early 1980s received median wages of $17 per hour when they were ages 30 to 34, whereas women born in the early 1960s made only $15 per hour when they were ages 30 to 34. This is a large improvement across generations, amounting to about $4,000 in annual earnings for a full-time worker.
As seen in figure 3, over the course of their careers women of all generations experienced relatively slow wage growth: for example, those born in the early 1960s saw only a 28 percent wage increase from their late 20s through early 50s. To some extent, this slow growth might reflect increasing demands at home during a woman’s life that shift women toward lower-wage but more-flexible jobs. Because many employers place a premium on an employee’s ability to work long hours, women’s hourly wages can be adversely affected by demands at home (Flabbi and Moro 2012; Goldin 2014a).
By contrast, the wages earned by later generations of men remained about the same as those of their predecessors, with the most recent cohort receiving a slightly lower median wage ($18.40) in their early 30s than the cohort born in 1960–64 ($18.48). However, when compared to women, men continue to enjoy both higher wage levels and faster wage growth during a career. As a result, the wage gap between men and
women of all cohorts is greater for older workers than it is for younger workers.
Stagnation in men’s wages is also apparent when the analysis is restricted to male college graduates (not shown). For female college graduates, wages have also remained roughly level across cohorts, indicating that wage gains across generations of women are associated largely with rising educational attainment.
Educational Attainment of Women Has Surpassed That of MenEducational attainment is of crucial importance in determining wages for individual workers and accounting for variation in wages across groups. Throughout the period we examine, more education is associated with substantially higher wages. Even as average educational attainment rose, the wage advantage of workers with a college degree remained high (Hubbard 2011).
From 1979 to 2016 women’s educational attainment increased both over time and relative to men’s attainment. In fact, the education gap between men and women reversed for bachelor’s degrees in 1996 and for advanced degrees in 2003. Women now outperform men by about three percentage points in both bachelor’s degree and advanced degree attainment.
FIGURE 4.
Educational Attainment of Prime-Age Women and Men, 1979–2016
Source: Current Population Survey 1979–2016; authors’ calculations.
Note: Prime-age indicates ages 25–54.
Women, bachelor’s degree only
Men, bachelor’s degree only
Women, postgraduate degree
Men, postgraduate degree
1980 1985 1990 1995 2000 2005 2010 20150
5
10
15
20
25
30
Perc
ent w
ith d
egre
e

5
The Hamilton Project • Brookings
These gains have powered much of the increase over time in women’s wages. However, the gender gap remains considerable even after women have surpassed men in educational attainment, as shown in figures 1 and 4 (though it should be noted that the labor market impact of that educational overtaking may not yet have been fully observed).
One possible contributor to the remaining wage gap is differences in the type of education women and men obtain. Put another way, are differing college majors driving some of the wage gap? Over time, women have shifted toward traditionally male college majors, resulting in a reduction in gender segregation by major between 1960 and 1980 (Blau and Kahn 2017). However, figure 5 shows that larger shares of women in a given college major continue to be associated with lower wages. One outlier in this relationship is the pharmacy major, where Goldin and Katz (2016) have found that technology and business practices support the availability of flexible part-time work.3
The Hourly Wage Gap Remains after Adjusting for Observable Worker CharacteristicsThus far, we have explored the unadjusted wage gap, which is the difference in men’s and women’s hourly wages before any adjustments are made for differences in variables
such as educational attainment. However, this unadjusted wage gap might not be the appropriate measure for some questions. Often, some of the most urgent questions concern discrimination in the labor market. When investigating discrimination, researchers attempt to isolate wage differences between “comparable” male and female workers. Depending on what adjustments are made to make workers more comparable, estimates of wage gaps will differ.
Comparability is typically defined in terms of observable worker characteristics including age, education, and occupation. As an example, we might want to compare the difference in wages of similarly aged men and women with the same level of education. Without adjustments for age and education, among other factors, differences in men’s and women’s preferences—or discrimination outside the labor market, such as barriers to college majors that lead to high-paying jobs—could bias estimates of labor market discrimination. For instance, women of older generations were less likely than men to obtain a college degree (see figure 4), and could expect to earn lower wages even in the absence of labor market discrimination.
However, when adjusting for worker characteristics, there is a danger of controlling for too many variables (Angrist and Pischke 2009). For example, if labor market discrimination against women takes the form of barriers to particular high-paying occupations, then adjusting for occupation is inappropriate, because it implicitly assumes that all discrimination occurs within occupations.
FIGURE 5.
Prime-Age Women’s Median Annual Earnings and Share of Women in College Major
Source: American Community Survey 2015; authors’ calculations.
Note: Prime-age indicates ages 25–54. Sample is restricted to employed respondents, and to majors with at least 25 male and female respondents.
0 20 40 60 80 100
20
40
60
80
100
0
Pharmacy
Wom
en’s
med
ian
annu
al e
arni
ngs
(tho
usan
ds o
f dol
lars
)
Women’s share of college major

6
The Hamilton Project • Brookings
It is therefore not straightforward to obtain an appropriate comparison of women’s and men’s wages. In figure 6 we take the approach of showing a number of different measures of the wage gap—unadjusted and then adjusted by various factors—to explore the difference made by various assumptions. Estimates are provided for 1979 and 2016 to show how the wage gap has evolved over time.
Moving left to right, we begin with the unadjusted comparison of wages of prime-age employed men and women, which results in a wage gap of 16 percent for 2016, well below the 44 percent gap in 1979. Next, we adjust for age and race, but find that those factors do not much affect the gap in either year. To the right, an adjustment for educational attainment is made along with the previous adjustments. In 1979 the gap shrinks slightly, but in 2016 the gap actually grows. This indicates that women are now earning less than their educational attainment would suggest. Finally, we adjust for occupation, thus reducing the wage gap in both 1979 and 2016, and bringing the hourly gap to 15 percent in 2016. Notably, the difference made by adjusting for detailed occupation is larger in 1979 (when the gap falls by 10.5 percentage points) than in 2016 (when the gap falls by 6.5 percentage points), consistent with the evidence that occupations have become less segregated by gender over time (Cortes and Pan forthcoming).4
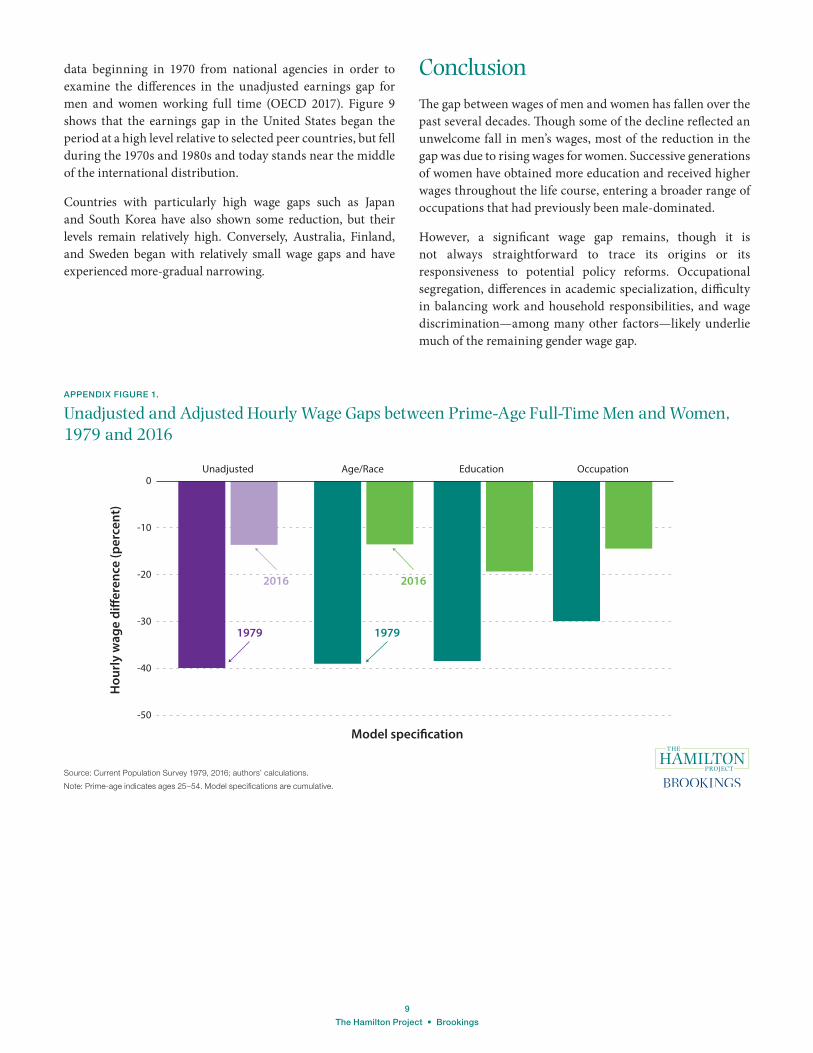
Another possibly relevant consideration is that women are more likely than men to work part time, which could affect hourly wages if firms impose a part-time penalty for workers whose availability is reduced (Goldin 2014a). Appendix figure
1 shows estimates of the wage gap using a sample restricted to full-time workers. This sample restriction reduces the wage gap slightly in both 1979 and 2016.
Given the potential impact of being a parent on women’s labor force participation, it is natural to ask whether the presence of children affects estimated wage gaps (Goldin 2014a). Because the labor market effects of children may depend on birth timing, marital status, and educational attainment—in addition to interacting with other family choices and outcomes—this is a particularly difficult question to answer. However, the presence of young children, particularly for married and high-skilled women, appears to magnify the gender wage gap (Barth, Kerr, and Olivetti 2017; Goldin et al. 2017).
The Role of OccupationsGiven the importance of workers’ occupations for understanding the wage gap, we next explore the extent to which men and women sort into different occupations, as well as the variation in wages across occupations. Together, these two factors can shed light on the overall difference between men’s and women’s wages.
Occupational segregation is defined as the degree to which occupations skew male or female. We do not attempt to explain why the occupations skew the way they do, but simply describe how the occupations vary and how segregation has
FIGURE 6.
Unadjusted and Adjusted Hourly Wage Gaps between Prime-Age Men and Women, 1979 and 2016
Source: Current Population Survey 1979, 2016; authors’ calculations.
Note: Prime-age indicates ages 25–54. Model specifications are cumulative.
Hou
rly
wag
e di
�ere
nce
(per
cent
)
-50
-40
-30
-20
-10
0
1979
2016
1979
2016
Model speci�cation
Education OccupationUnadjusted Age/Race
7
The Hamilton Project • Brookings
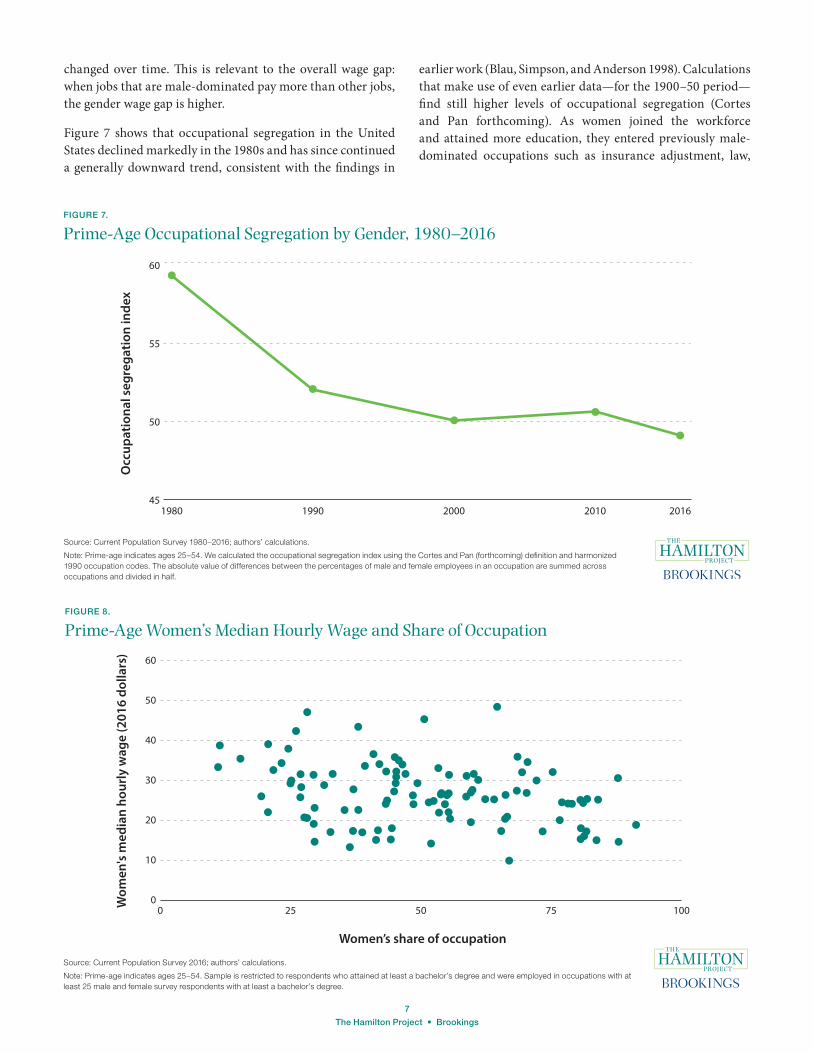
changed over time. This is relevant to the overall wage gap: when jobs that are male-dominated pay more than other jobs, the gender wage gap is higher.
Figure 7 shows that occupational segregation in the United States declined markedly in the 1980s and has since continued a generally downward trend, consistent with the findings in
earlier work (Blau, Simpson, and Anderson 1998). Calculations that make use of even earlier data—for the 1900–50 period—find still higher levels of occupational segregation (Cortes and Pan forthcoming). As women joined the workforce and attained more education, they entered previously male-dominated occupations such as insurance adjustment, law,
FIGURE 7.
Prime-Age Occupational Segregation by Gender, 1980–2016
Source: Current Population Survey 1980–2016; authors’ calculations.
Note: Prime-age indicates ages 25–54. We calculated the occupational segregation index using the Cortes and Pan (forthcoming) definition and harmonized 1990 occupation codes. The absolute value of differences between the percentages of male and female employees in an occupation are summed across occupations and divided in half.
1980 1990 2000 2010 2016
Occ
upat
iona
l seg
rega
tion
inde
x
50
60
45
55
FIGURE 8.
Prime-Age Women’s Median Hourly Wage and Share of Occupation
Source: Current Population Survey 2016; authors’ calculations.
Note: Prime-age indicates ages 25–54. Sample is restricted to respondents who attained at least a bachelor’s degree and were employed in occupations with at least 25 male and female survey respondents with at least a bachelor’s degree.
Wom
en's
med
ian
hour
ly w
age
(201
6 do
llars
)
Women’s share of occupation
0 25 50 75 1000
10
20
30
40
50
60
8
The Hamilton Project • Brookings
and sales. However, recent years have seen a slowing pace of occupational desegregation, limiting the narrowing of the gender wage gap that can occur through this channel.
The decline in occupational segregation has been driven by women’s increasing educational attainment as well as technological changes including automation that have reduced the importance of physical strength in the labor market (Goldin 2014b). Occupational segregation remains substantial, however. Preferences for job flexibility, differences in skills and personality traits and social norms can all affect which jobs men and women enter (Cortes and Pan forthcoming), in addition to more-direct discrimination within or outside the labor market.
Occupational segregation affects the wage gap if the fields women disproportionately enter are associated with lower wages. Figure 8 explores the relationship between women’s wages and the share of an occupation that is female. Because graduates of a particular major often find jobs in widely differing occupations, the pattern revealed by figure 8 would not necessarily mimic the results of our college major analysis. However, as the share of an occupation that is female increases, we do observe a decrease in college-educated women’s earnings. The figure also demonstrates that median wages vary considerably across occupations, such that pay is sometimes similar in occupations that feature very different gender ratios. For example, 88 percent of registered nurses are women and 25 percent of architects are women, but median hourly wages for women in both occupations are roughly $30. Pharmacy again
stands out as an occupation with a strong female presence and high hourly wage, at around $48 per hour.5
Wage differences within and across occupations might be driven by disparate responsibilities outside work. Women spend more time than men on domestic activities; for example, in 2016 married mothers who were full-time employees reported spending an average of 26 hours per week on domestic activities, while married fathers who were full-time employees reported spending only 17 hours per week.6 Housework is negatively associated with wages for both married and unmarried women (Blau and Kahn 2017; Hersch and Stratton 2002). Furthermore, women are more likely to perform daily household tasks such as meal preparation and cleanup that have a stronger association with lower wages than they are to spend time on intermittent tasks such as outdoor and maintenance activities, which can be postponed or contracted out (Hersch and Stratton 2002; Noonan 2001).
The U.S. Wage Gap Is Similar to That of Other Industrialized CountriesFinally, we place the U.S. wage gap in the context of other industrialized countries. The Organisation for Economic Co-operation and Development (OECD) has compiled earnings
FIGURE 9.
Earnings Gaps in Selected Countries, 1970–2016
Source: OECD 2017.
Note: Sample is restricted to full-time employees and the self-employed. Earnings are reported on a weekly basis for Australia, Canada, the United Kingdom, and the United States; on a monthly basis for Japan, South Korea, and Sweden; and on an annual basis for Finland and France. In addition to missing years shown at the beginning and end of some time series, data is not available and means were interpolated for the following years: 1986–1991 (South Korea), 1981 and 1985 (Finland), 1996 (Australia), 1976–77 and 1979 (Sweden).
South Korea
Japan
US
United Kingdom
Finland
AustraliaSweden
France
1970 1975 1980 1985 1990 1995 2000 2005 2010 2015
Gap
as
perc
ent o
f men
’s m
edia
n ea
rnin
gs
10
20
30
40
50
60
0
Canada
9
The Hamilton Project • Brookings
data beginning in 1970 from national agencies in order to examine the differences in the unadjusted earnings gap for men and women working full time (OECD 2017). Figure 9 shows that the earnings gap in the United States began the period at a high level relative to selected peer countries, but fell during the 1970s and 1980s and today stands near the middle of the international distribution.
Countries with particularly high wage gaps such as Japan and South Korea have also shown some reduction, but their levels remain relatively high. Conversely, Australia, Finland, and Sweden began with relatively small wage gaps and have experienced more-gradual narrowing.
ConclusionThe gap between wages of men and women has fallen over the past several decades. Though some of the decline reflected an unwelcome fall in men’s wages, most of the reduction in the gap was due to rising wages for women. Successive generations of women have obtained more education and received higher wages throughout the life course, entering a broader range of occupations that had previously been male-dominated.
However, a significant wage gap remains, though it is not always straightforward to trace its origins or its responsiveness to potential policy reforms. Occupational segregation, differences in academic specialization, difficulty in balancing work and household responsibilities, and wage discrimination—among many other factors—likely underlie much of the remaining gender wage gap.
APPENDIX FIGURE 1.
Unadjusted and Adjusted Hourly Wage Gaps between Prime-Age Full-Time Men and Women, 1979 and 2016
Source: Current Population Survey 1979, 2016; authors’ calculations.
Note: Prime-age indicates ages 25–54. Model specifications are cumulative.
Hou
rly
wag
e di
�ere
nce
(per
cent
)
-50
-40
-30
-20
-10
0
1979
2016
Model speci�cation
Education Occupation
1979
2016
Unadjusted Age/Race
10
The Hamilton Project • Brookings
Authors
Acknowledgments
We are grateful to Heather Boushey, Kristin Butcher, Jessica Pan, Diane Whitmore Schanzenbach, and Jay Shambaugh for insightful feedback. We also thank Rebecca Portman for excellent research assistance.
Ryan NunnPolicy Director, The Hamilton Project; Fellow, Economic Studies, The Brookings Institution
Ryan Nunn is a fellow in Economics Studies at the Brookings Institution and policy director for The Hamilton Project. He was previously an economist in the Office of Economic Policy at the U.S. Department of the Treasury. At both The Hamilton Project and the Department of the Treasury, he has conducted work on a variety of topics including occupational licensing and non-compete policy. Nunn’s research interests include labor economics and public finance, with a particular focus on labor market institutions. He received his doctorate in Public Policy and Economics from the University of Michigan, Ann Arbor.
Megan MumfordSenior Research Assistant, The Hamilton Project
Megan Mumford graduated from Texas A&M University in 2015 with a Master of Public Administration and a Bachelor of Arts in Political Science. While working as a research assistant at the Brookings Institution, she coauthored papers on economic policy topics including criminal justice, education, and worker classification in the gig economy. She is currently a student at Yale Law School.

11
The Hamilton Project • Brookings
Endnotes
1. We classify households into quintiles of total earned income across prime-age respondents (25 to 54 years old), and observe the average share of earned income in the household that was generated by women for households in the middle earnings quintile.
2. Throughout this chapter we restrict our focus to prime-age workers (25 to 54 years old), unless otherwise specified. It is also important to note that gender gaps are considerably larger if one examines annual earnings, rather than hourly wages. See box 1 for a brief discussion.
3. In figure 5, we examine annual earnings rather than hourly wages because of different data available in the American Community Survey, which provides information on college major.
Angrist, Joshua D., and Jörn-Steffen Pischke. 2009. Mostly Harmless Econometrics: An Empiricist’s Companion. Princeton, NJ: Princeton University Press.
Barth, Erling, Sari Kerr, and Claudia Olivetti. 2017. “The Dynamics of Gender Earnings Differentials: Evidence from Establishment Data.” Working Paper 23381, National Bureau of Economic Research, Cambridge, MA.
Blau, Francine D., and Lawrence M. Kahn. 2017. “The Gender Wage Gap: Extent, Trends, and Explanations.” Journal of Economic Literature 55 (3): 789–865.
Blau, Francine D., Patricia Simpson, and Deborah Anderson. 1998. “Continuing Progress? Trends in Occupational Segregation in the United States Over the 1970s and 1980s.” Working Paper 6716, National Bureau of Economic Research, Cambridge, MA.
Bureau of Labor Statistics (BLS). 1979–2016. “Current Population Survey.” Bureau of Labor Statistics, U.S. Department of Labor, Washington, DC.
———. 2016b. “Table A-6A. Time Spent in Primary Activities and the Percent of Married Mothers and Fathers Who Did the Activities on an Average Day by Employment Status, Average for the Combined Years 2011–15, Own Household Child Under Age 18.” American Time Use Survey, Bureau of Labor Statistics, U.S. Department of Labor, Washington, DC.
Cortes, Patricia, and Jessica Pan. Forthcoming. “Occupation and Gender.” In Handbook on the Economics of Women, eds. Susan L. Averett, Laura M. Argys, and Saul D. Hoffman, New York, NY: Oxford University Press.
Flabbi, Luca, and Andrea Moro. 2012. “The Effect of Job Flexibility on Female Labor Market Outcomes: Estimates from a Search and Bargaining Model.” Journal of Econometrics 168 (1): 81–95.
References
4. However, we should note that some other researchers have found an increasing role for occupational adjustments over time when using a different statistical approaches in different datasets (Blau and Kahn 2017).
5. When we do not restrict the sample to those with college degrees, the variation across occupations increases and we no longer observe an association between women’s share in an occupation and median wages (not shown in figure 8).
6. Domestic activities include “household activities,” “purchasing goods and services,” and “caring for and helping household members” in the American Time Use Survey (BLS 2016b).
Goldin, Claudia. 2014a. “A Grand Gender Convergence: Its Last Chapter.” American Economic Review 104 (4): 1–30.
———. 2014b. “A Pollution Theory of Discrimination: Male and Female Differences in Occupations and Earnings.” In Human Capital in History: The American Record, eds. Leah Platt Boustan, Carola Frydman, and Robert A. Margo, 313–48. Chicago, IL: University of Chicago Press.
Goldin, Claudia, and Lawrence Katz. 2016. “A Most Egalitarian: Pharmacy and the Evolution of a Family-Friendly Occupation.” Journal of Labor Economics 34 (3): 705–45.
Goldin, Claudia, Sari Kerr, Claudia Olivetti, and Erling Barth. 2017. “The Expanding Gender Earnings Gap: Evidence from the LEHD-2000 Census.” American Economic Review: Papers & Proceedings 107 (5): 110–4.
Hersch, Joni, and Leslie Stratton. 2002. “Housework and Wages.” Journal of Human Resources 37 (1): 217–29.
Hubbard, William H.J. 2011. “The Phantom Gender Difference in the College Wage Premium.” Journal of Human Resources 46 (3): 568–86.
Noonan, Mary. 2001. “The Impact of Domestic Work on Men’s and Women’s Wages.” Journal of Marriage and Family 63 (4): 1134–45.
O’Neill, June and Solomon Polachek. 1993. “Why the Gender Gap in Wages Narrowed in the 1980s.” Journal of Labor Economics 11 (1): 205–28.
Organisation for Economic Co-operation and Development (OECD). 2017. “Gender wage gap.” OECD Data, Organisation for Economic Co-operation and Development, Paris, France.
U.S. Census Bureau. 2015. “American Community Survey.” U.S. Census Bureau, Washington, DC.

12
The Hamilton Project • Brookings
ADVISORY COUNCIL
GEORGE A. AKERLOFUniversity ProfessorGeorgetown University
ROGER C. ALTMANFounder & Senior ChairmanEvercore
KAREN ANDERSONSenior Director of Policy,Communications, and External AffairsBecker Friedman Institute forResearch in EconomicsThe University of Chicago
ALAN S. BLINDERGordon S. Rentschler Memorial Professor of Economics & Public AffairsPrinceton UniversityNonresident Senior FellowThe Brookings Institution
ROBERT CUMBYProfessor of EconomicsGeorgetown University
STEVEN A. DENNINGChairmanGeneral Atlantic
JOHN DEUTCHEmeritus Institute ProfessorMassachusetts Institute of Technology
CHRISTOPHER EDLEY, JR.Co-President and Co-FounderThe Opportunity Institute
BLAIR W. EFFRONCo-FounderCenterview Partners LLC
DOUGLAS W. ELMENDORFDean & Don K. Price Professorof Public PolicyHarvard Kennedy School
JUDY FEDERProfessor & Former DeanMcCourt School of Public PolicyGeorgetown University
ROLAND FRYERHenry Lee Professor of EconomicsHarvard University
JASON FURMANProfessor of PracticeHarvard Kennedy School
MARK T. GALLOGLYCofounder & Managing PrincipalCenterbridge Partners
TED GAYERVice President & DirectorEconomic StudiesThe Brookings Institution
TIMOTHY F. GEITHNERPresidentWarburg Pincus
RICHARD GEPHARDTPresident & Chief Executive OfficerGephardt Group Government Affairs
ROBERT GREENSTEINFounder & PresidentCenter on Budget and Policy Priorities
MICHAEL GREENSTONEThe Milton Friedman Professor in Economics and the CollegeDirector of the Becker Friedman InstituteDirector of the Energy Policy Instituteat ChicagoUniversity of Chicago
GLENN H. HUTCHINSChairmanNorth Island
JAMES A. JOHNSONChairmanJohnson Capital Partners
LAWRENCE F. KATZElisabeth Allison Professor of EconomicsHarvard University
MELISSA S. KEARNEYProfessor of EconomicsUniversity of MarylandNonresident Senior FellowThe Brookings Institution
LILI LYNTONFounding PartnerBoulud Restaurant Group
HOWARD S. MARKSCo-ChairmanOaktree Capital Management, L.P.
MARK MCKINNONFormer Advisor to George W. BushCo-Founder, No Labels
ERIC MINDICHChief Executive Officer & FounderEton Park Capital Management
SUZANNE NORA JOHNSONFormer Vice ChairmanGoldman Sachs Group, Inc.
PETER ORSZAGManaging Director & Vice Chairman ofInvestment BankingLazardNonresident Senior FellowThe Brookings Institution
RICHARD PERRYManaging Partner & Chief Executive OfficerPerry Capital
PENNY PRITZKERChairmanPSP Capital Partners
MEEGHAN PRUNTYManaging DirectorBlue Meridian PartnersEdna McConnell Clark Foundation
ROBERT D. REISCHAUERDistinguished Institute Fellow& President EmeritusUrban Institute
ALICE M. RIVLINSenior Fellow, Economic StudiesCenter for Health PolicyThe Brookings Institution
DAVID M. RUBENSTEINCo-Founder & Co-Chief Executive OfficerThe Carlyle Group
ROBERT E. RUBINFormer U.S. Treasury SecretaryCo-Chair EmeritusCouncil on Foreign Relations
LESLIE B. SAMUELSSenior CounselCleary Gottlieb Steen & Hamilton LLP
SHERYL SANDBERGChief Operating OfficerFacebook
DIANE WHITMORE SCHANZENBACHMargaret Walker Alexander ProfessorDirectorThe Institute for Policy ResearchNorthwestern UniversityNonresident Senior FellowThe Brookings Institution
RALPH L. SCHLOSSTEINPresident & Chief Executive OfficerEvercore
ERIC SCHMIDTExecutive ChairmanAlphabet Inc.
ERIC SCHWARTZChairman and CEO76 West Holdings
THOMAS F. STEYERBusiness Leader and Philanthropist
LAWRENCE H. SUMMERSCharles W. Eliot University ProfessorHarvard University
LAURA D’ANDREA TYSONProfessor of Business Administration andEconomicsDirectorInstitute for Business & Social ImpactBerkeley-Haas School of Business
JAY SHAMBAUGHDirector

13
The Hamilton Project • Brookings
ADVISORY COUNCIL
W W W . H A M I L T O N P R O J E C T . O R G
1775 Massachusetts Ave., NW Washington, DC 20036
(202) 797-6484
Printed on recycled paper.
AbstractThe gap between wages of men and women has fallen over the past several decades, reflecting women’s economic progress. Successive generations of women have obtained more education and received higher wages, entering a broader range of occupations that had previously been male-dominated. However, a significant gender wage gap remains. Occupational segregation, differences in academic specialization, difficulty in balancing work and household responsibilities, and wage discrimination—among many other factors—likely underlie much of the remaining gender wage gap.
Median Real Hourly Wage of Prime-Age Men and Women, 1979–2016
Sources: Current Population Survey 1979–2016; authors’ calculations.
Note: Prime-age indicates ages 25–54. Hourly wages are adjusted for inflation using the CPI-U-RS deflator.
Female
Male
1980 1985 1990 1995 2000 2005 2010 2015
Hou
rly
wag
e (2
016
dolla
rs)
10
15
20
25
0
5