Embed Size (px)
Citation preview
NKANDLA REVISITED: A LONGITUDINAL STUDY
OF THE STRATEGIES ADOPTED TO ALLEVIATE
POVERTY IN A RURAL COIWJNITY
by
E M Ardington
Centre for Social and Development Studies
University of Natal
Durban
1988
Rural Urban Studies Working Paper No. 16
Rural Urban Studies Unit
The Rural Urban Studies Unit was founded in 1983 by the Human Sciences Research Council for the purpose of studying the dynamics of the links between the rural and urban areas of South Africa. It is situated at the University of Natal, Durban and works in close co-operation with the Centre for Social and Development Studies (previously the Development Studies Unit).
ISBN NO: 0-86980-614-9
ACKNOWLEDGEMENTS
Financial assistance by the Rural Urban Studies Unit, established by
the Human Sciences Research Council is hereby acknowledged. Views
expressed and conclusions drawn are those of the author and should not
be regarded as necessarily reflecting those of the Human Sciences
Research Council. The author would like to thank Jill Nattrass
without whose insistence and encouragement there would have been no
resurvey, Francie Lund, Norman Bromberger, Neil Huller and Julian May
for their draft reading and helpful comments and Barbara Duffy and
Lesley Anderson for their assistance.
(i)

TABLE OF CONTEHTS
CHAPTER ONE : NKANDLA REVISTED 1
1.1 Introduction 1
1.2 Method of Survey 3
CHAPTER TWO : THE HUMAN POPULATION 5
2.1 Introduction 5
2.2 Age, Sex and Household Membership 6
2.3 Household Structure 9
2.4 Household Heads 9
2.5 Changes in Household Structure Since 1982 11
2.6 Occupation 14
2.7 Parenthood 16
2.8 Birth and Mortality Rates 17
2.9 Marriage and Fertility 19
2.10 Migrancy 21
2.11 Pensions and Pensioners 25
2.12 The Human Implications of a Changing Society 28
CHAPTER THREE: ECONOMIC ACTIVITIES 32
3.1 Introduction 32
3.2 Agriculture 34
3.2.1 Access to Land 34
(ii)
3.2.2 Size of Landholdings and Ability to Subsist 37
3.2.3 Land Utilization 37
3.2.4 Production 42
3.2.5 Gardens 46
3.2.6 Conclusion 47
3.3 Stockholding 50
3.3.1 Herd Breakdown 50
3.3.2 Births, Deaths and Take Off Rates 52
3.3.3 Changes in Herd Value 55
3.3.4 Returns on Stockholding 59
3.3.4.1 Calculating Returns 60
3.3.4.2 The Cost of Returns 61
3.3.5 Future Prospects for Economic Stockholding 63
3.4 Small Stock 66
3.5 Informal Sector Activity 66
3.6 Employment and Unemployment 71
CHAPTER FOUR: QUALITY OF LIFE 75
75
75
80
80
81
4.1 Introduction
4.2 Education
4.3 Health
4.4 Water
4.5 Fuel ( H i )
4.6 Transport and Communication
4.7 Shops, Savings and Credit
81
83
CHAPTER FIVE: INCOME LEVELS, DISTRIBUTION AND SOURCES 85
5.1 Introduction 85
5.2 Sources of Income 87
5.2.1 The Chief Sources - Pensions and Remittances 90
5.2.2 Informal Sector Income 91
5.2.3 Subsistence Income 92
5.3 Income Levels and Distribution of Income 94
5.3.1 Household Income 95
5.3.2 Individual Incomes by Household 96
5.4 Income Differentiation and Household Structure 98
5.5 Income Differentiation and Income Sources 101
5.6 Conclusion 105
CHAPTER SIX: A COMPARISON OF INCOME LEVELS OVER THREE YEARS: CHANGING FORTUNES IN FIFTEEN HOUSEHOLDS 108
6.1 Introduction 108
6.1.1 Allocating Rank 109
6.2 Causes of Changes in Income Levels 110
6.2.1 Employment 110 (iv)

6.2.2 Household Size 111
6.2.3 Cattle Movements 112
6.2.4 Informal Sector Activity 115
6.2.5 Pensions 115
6.2.6 Split Households 116
6.3 Case Studies of the Fifteen Households Experiencing the Greatest Change in Income Ranking
6.4 The Changing Fortunes of Households Which Split
118
128
CHAPTER SEVEN: THE FUTURE - IS THERE ONE? 134
APPENDIX A: DIFFICULTIES ASSOCIATED WITH ESTIMATING RURAL 138 INCOMES AND THEIR DISTRIBUTION
B.l Introduction
B.2 Agricultural Production Evaluation
B.3 Subsistence Income from Stockholding
B.4 Income Versus Dissaving
B.5 Subsistence Contribution to Household Income
B.6 Details of Individual Evaluations
APPENDIX C: METHODS OF CALCULATING THE VALUE OF 158 STOCKHOLDING AND THE RETURNS THEREON.
APPENDIX B: EVALUATING SUBSISTENCE PRODUCTION 146
(viii)
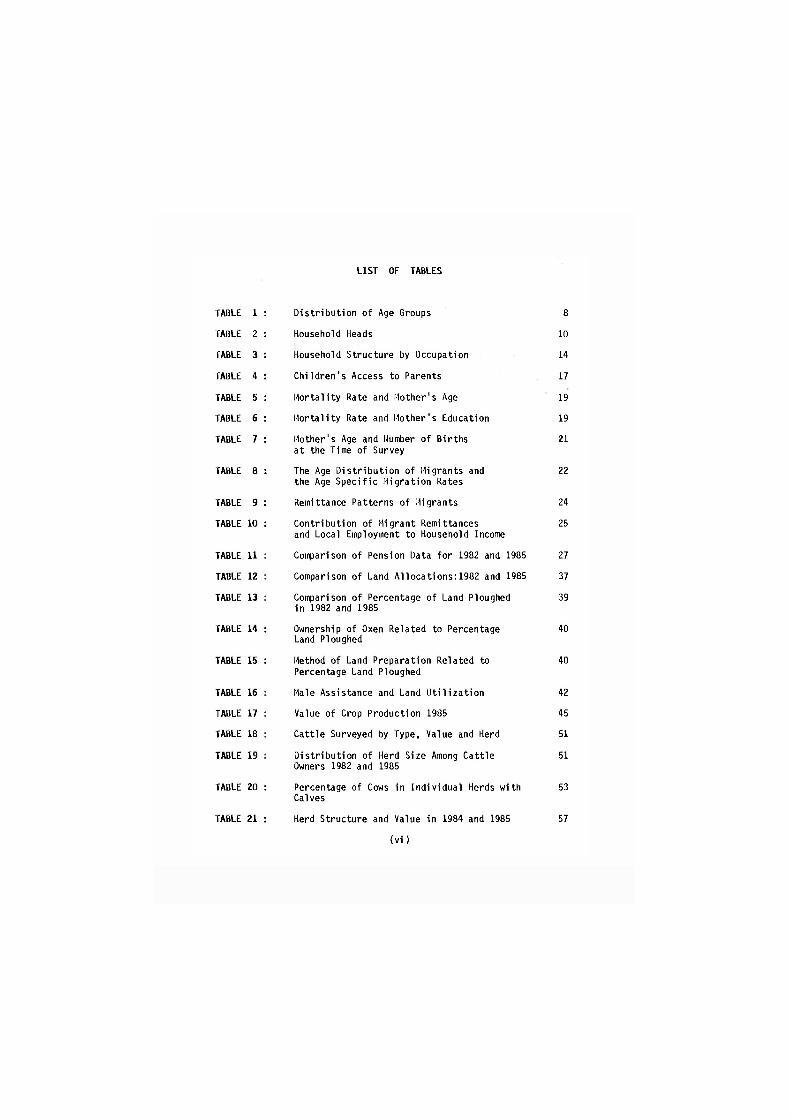
LIST OF TABLES
TABLE 1 : Distribution of Age Groups 8
TABLE 2 : Household Heads 10
TABLE 3 : Household Structure by Occupation 14
TABLE 4 : Children's Access to Parents 17
TABLE 5 : Mortality Rate and Mother's Age 19
TABLE 6 : Mortality Rate and Mother's Education 19
TABLE 7 : Mother's Age and Number of Births at the Time of Survey
21
TABLE 8 : The Age Distribution of Migrants and the Age Specific Migration Rates
22
TABLE 9 : Remittance Patterns of Migrants 24
TABLE 10 : Contribution of Migrant Remittances and Local Employment to Household Income
25
TABLE 11 : Comparison of Pension Data for 1982 and 1985 27
TABLE 12 : Comparison of Land Allocations:1982 and 1985 37
TABLE 13 : Comparison of Percentage of Land Ploughed in 1982 and 1985
39
TABLE 14 : Ownership of Oxen Related to Percentage Land Ploughed
40
TABLE 15 : Method of Land Preparation Related to Percentage Land Ploughed
40
TABLE 16 : Male Assistance and Land Utilization 42
TABLE 17 : Value of Crop Production 1985 45
TABLE 18 : Cattle Surveyed by Type, Value and Herd 51
TABLE 19 : Distribution of Herd Size Among Cattle Owners 1982 and 1985
51
TABLE 20 : Percentage of Cows in Individual Herds with Calves
53
TABLE 21 : Herd Structure and Value in 1984 and 1985
(vi)
57
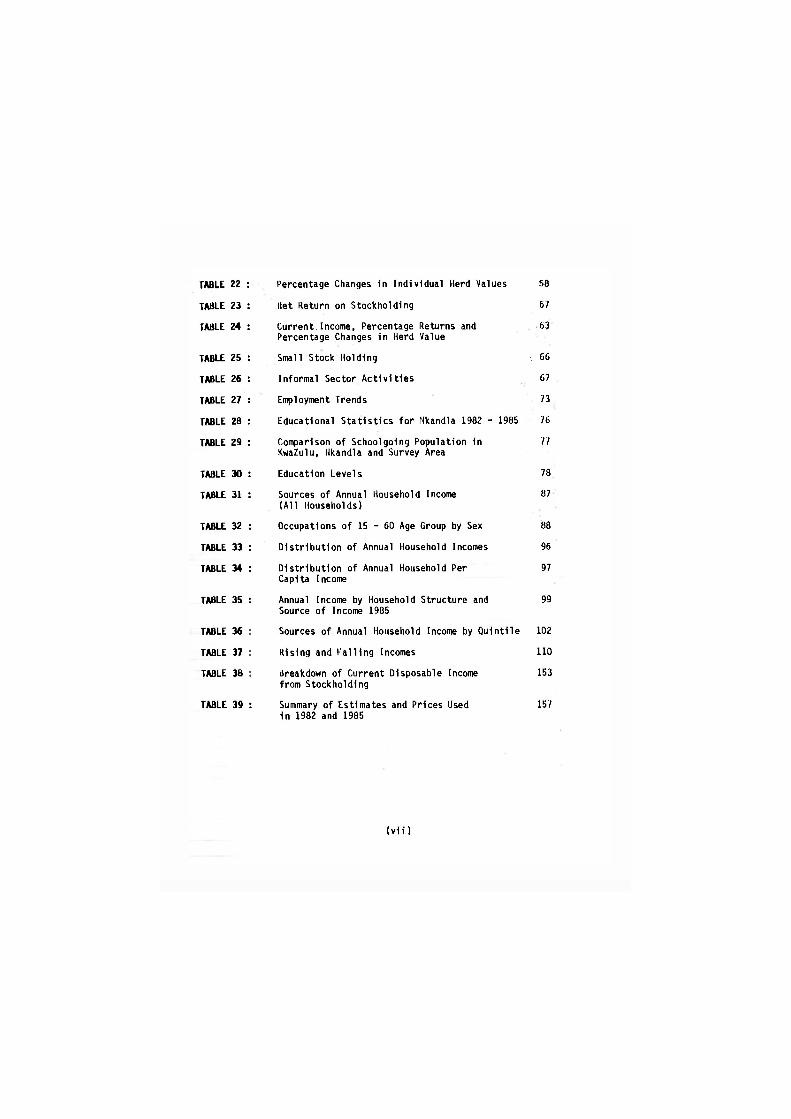
TABLE 22 : Percentage Changes in Individual Herd Values 58
TABLE 23 : llet Return on Stockholding 67
TABLE 24 : Current Income, Percentage Returns and 63 Percentage Changes in Herd Value
TABLE 25 : Small Stock Holding 66
TABLE 26 : Informal Sector Activities 67
TABLE 27 : Employment Trends 73
TABLE 28 : Educational Statistics for Nkandla 1982 - 1985 76
TABLE 29 : Comparison of Schoolgoing Population in 77 KwaZulu, Hkandla and Survey Area
TABLE 30 : Education Levels 78
TABLE 31 : Sources of Annual Household Income 87 (All Households)
TABLE 32 : Occupations of 15 - 60 Age Group by Sex 88
TABLE 33 : Distribution of Annual Household Incomes 96
TABLE 34 : Distribution of Annual Household Per 97 Capita Income
TABLE 35 : Annual Income by Household Structure and 99 Source of Income 1985
TABLE 36 : Sources of Annual Household Income by Quintile 102
TABLE 37 : Rising and Falling Incomes 110
TABLE 38 ; Breakdown of Current Disposable Income 153 from Stockholding
TABLE 39 : Summary of Estimates and Prices Used 157 in 1982 and 1985
(vii)


NKANDLA REVISITED: A LONGITUDINAL STUDY
OF THE STRATEGIES ADOPTED TO ALLEVIATE
POVERTY IN A RURAL COMMUNITY
CHAPTER ONE : NKANDLA REVISITED
1.1 Introduction
This paper relates the findings of a survey, conducted in 1985, of
rural households in the magisterial district of Nkandla in KwaZulu to
a survey of the same households conducted in 1982 as part of the
Second Carnegie Inquiry into Poverty and Development (Ardington,
1984). The resurvey was conducted to establish, through the
investigation of certain randomly selected households over a period of
three years, what strategies those households adopted in reaction to
the changing social and economic circumstances in which they found
themselves. Since the original survey the area had experienced yet
another serious drought and, along with the rest of the country, was
suffering the impact of the general economic recession. The initial
survey had shown clearly how the fortunes of this peripheral rural
area were governed by the way in which the meagre resources (chiefly
pensions and remittances) allocated it by the core industrial
community were distributed. Local lifestyles were shown to be
largely determined by the levels of migratory employment (or
unemployment) and national social security policies. Within these
externally defined constraints, the strategies which households, or
individuals within them, could adopt to alleviate their poverty or
1
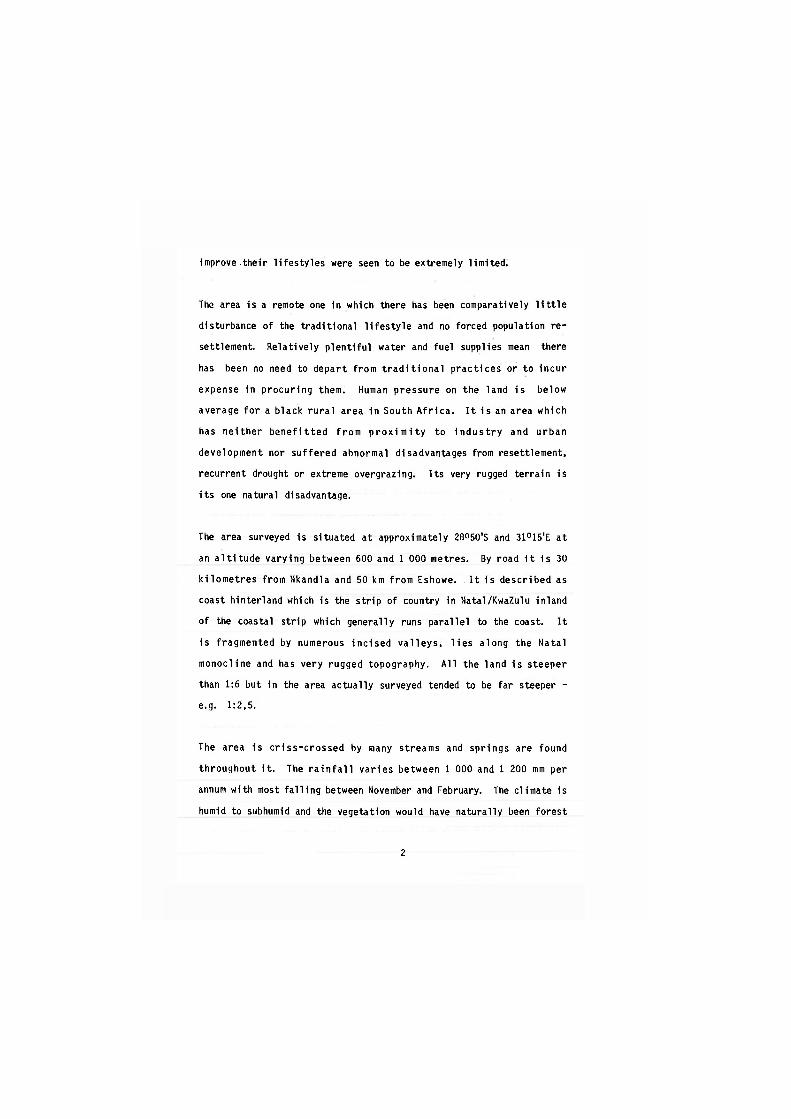
improve their lifestyles were seen to be extremely limited.
The area is a remote one in which there has been comparatively little
disturbance of the traditional lifestyle and no forced population re-
settlement. Relatively plentiful water and fuel supplies mean there
has been no need to depart from traditional practices or to incur
expense in procuring them. Human pressure on the land is below
average for a black rural area in South Africa. It is an area which
has neither benefitted from p r o x i m i t y to industry and urban
development nor suffered abnormal disadvantages from resettlement,
recurrent drought or extreme overgrazing. Its very rugged terrain is
its one natural disadvantage.
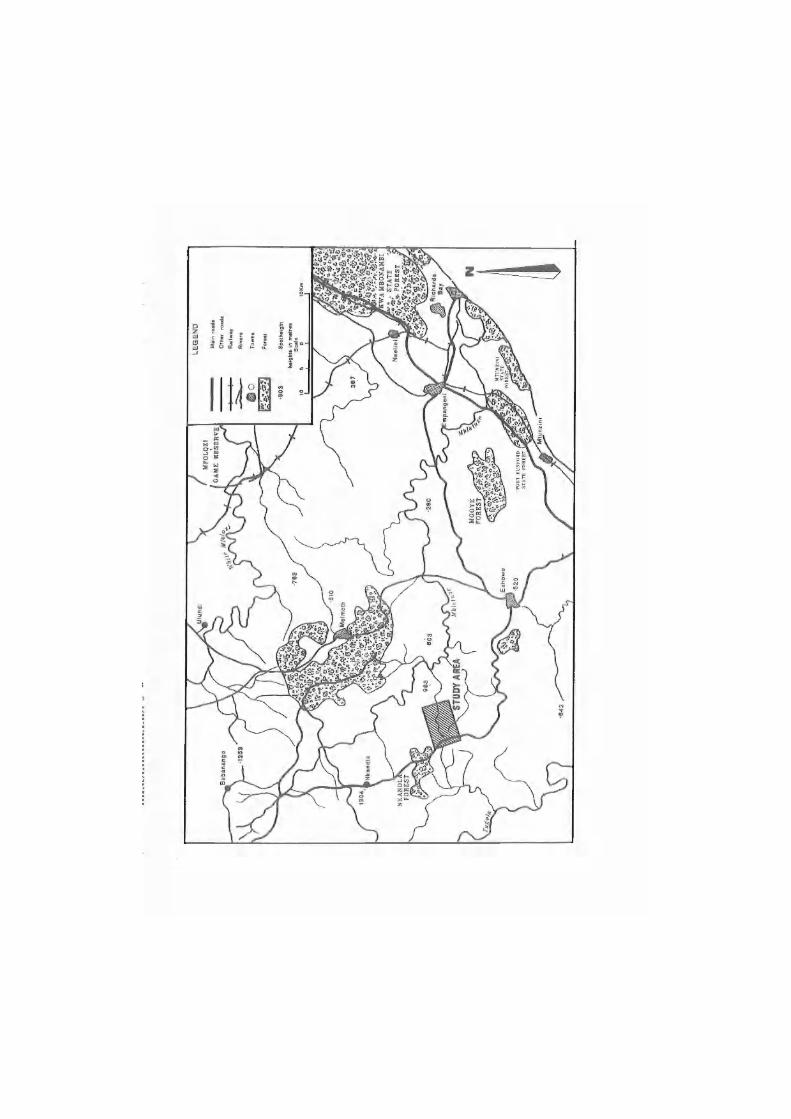
The area surveyed is situated at approximately 28°50'S and 31°15'E at
an altitude varying between 600 and 1 000 metres. By road it is 30
kilometres from Nkandla and 50 km from Eshowe. It is described as
coast hinterland which is the strip of country in Natal/KwaZulu inland
of the coastal strip which generally runs parallel to the coast. It
is fragmented by numerous incised valleys, lies along the Natal
monocline and has very rugged topography. All the land is steeper
than 1:6 but in the area actually surveyed tended to be far steeper -
e.g. 1:2,5.
The area is criss-crossed by many streams and springs are found
throughout it. The rainfall varies between 1 000 and 1 200 mm per
annum with most falling between November and February. The climate is
humid to subhumid and the vegetation would have naturally been forest
2
and scrub forest. Although the forest area has declined1, there are
pockets of indigenous forest remaining in the valleys throughout the
area surveyed, and immediately to the north of the area is the
magnificent Nkandla forest which is now protected.
The natural pasture has deteriorated to become Ngongoni veld. Host of
the grass is today aristida junciformis. The themeda triandra and
tristachya aristida that should naturally be found in the area have
almost disappeared. The soil is badly eroded and large dongas are
found throughout the area.
The population density in the area is low. Thorrington-Smith et al
(1978) state that in most of the area it is between 50 - 100 per
square kilometre and less on the fringes.
1.2 Method of Survey
The households originally surveyed had been selected by a random
sampling technique and marked on aerial photographs. It was therefore
possible to return to them for the resurvey. In 1982 seventy of the
480 households in the area were surveyed. Seven hundred and sixty
four individuals lived in those households. In 1985 four of the
original households no longer existed, their inhabitants having died
or left the area. Another four households had split up - one into
four households and the other three into two. In 1985 all the sub-
1. Cetewayo's grave which was originally hidden in the forest is now a couple of kilometres from the nearest piece of forest.
3
divisions were interviewed, as were three new households which were
selected to replace those no longer existing. There were thus in the
1985 survey 75 participating households with a total of 831 members.
The questionnaire administered in 1985 was not as comprehensive as
that of 1982. Generally questions relating to the quality of life
were omitted and the resurvey concentrated on the demographic and
economic characteristics of the households. The intention of the
resurvey was to highlight and analyse any change which had occurred
since 1982 and not to determine in detail social and demographic
conditions as was done in the original report.
Further information was obtained from interviews with significant
persons in the area. Information was thus obtained from the
magistrate, the assistant magistrate, indunas, the labour officer, the
circuit inspector, the stock inspector, the extension officer, the
hospital superintendant and other doctors and nurses, the KwaTeba
recruiting officer, several teachers and principals and t w o
storekeepers and their wives. In the text it will be made clear
w h e t h e r i n f o r m a t i o n given w a s o b t a i n e d from answers to the
questionnaires or individual interviews. General information was
obtained from observation during residence in the area for the survey
periods.
Both surveys were conducted during the months of September, October
and November.
4
CHAPTER TWO: THE HUMAN POPULATION
2.1 Introduction
The area surveyed was the point at which three tribal wards meet - the
three chiefs were Gwazabangiwe Khanyile, Fangelakhe Biyela and
Bhekabelungu Biyela.1 However, most of the area falls within one ward
- that of Fangelakhe Biyela. Two of the wards are in the Nkandla
magisterial district and one in Inkanyezi. The area covered by the
three wards is approximately 287 square kilometres in extent and
according to the 1980 Census 12 980 people lived in these wards
resulting in a population density of 45 per square kilometre. The
1985 Census showed the population density to have increased to 49 per
square kilometre. The area actually surveyed was 60 square kilometres
in extent and contained 480 homesteads. As the average homestead
surveyed had 9,1 residents the population density in the area surveyed
was 73 per square kilometre - 60 percent higher than that shown by
either Census count for the three wards. As the area surveyed was
closer to the main road, shops and junior secondary school than much
of the balance of the three wards, it is probable that the population
was denser there than elsewhere but this could hardly account for all
of the discrepancy in density figures which may well point to a
significant undercount in the area in the 1980 and 1985 Censuses.
1. By the time of the resurvey the first two chiefs had died but no successors had as yet been appointed.
5
The population appeared to be very stable. 95 percent of those
surveyed were living where the head of the household had been born.
Almost without exception the homesteads were traditional in structure
- both as to the arrangement of the huts and as to the structure of
the huts themselves. There were some rectangular huts but the vast
majority were round. Almost all married adults had their own huts but
not necessarily their own homesteads.
The only immediately obvious changes which were observed to have
occurred between surveys were that the central store had acquired a
telephone and the odd person had added a toilet to the cluster of
buildings that constituted the homestead.
2.2 Age, Sex and Household Membership
Although the number of persons surveyed was larger in 1985 than in
1982 (831 as opposed to 764 individuals), the structure of the
surveyed community with regard to age and sex remained unchanged. The
average age of all surveyed was 23 and 50 percent were under eighteen
years of age. 53 percent of those surveyed were females and 47
percent males. Excluding all migrants the surveyed population was 39
percent male and 61 percent female. According to the 1985 Population
Census the sex ratio of the KwaZulu population was 45:55 and that of
the magisterial district of Nkandla 40:60.
Table 1 below, which indicates the distribution of age groups for
KwaZulu, the magisterial district of Nkandla, the total population
surveyed and the resident (i.e. excluding all migrants) population
6
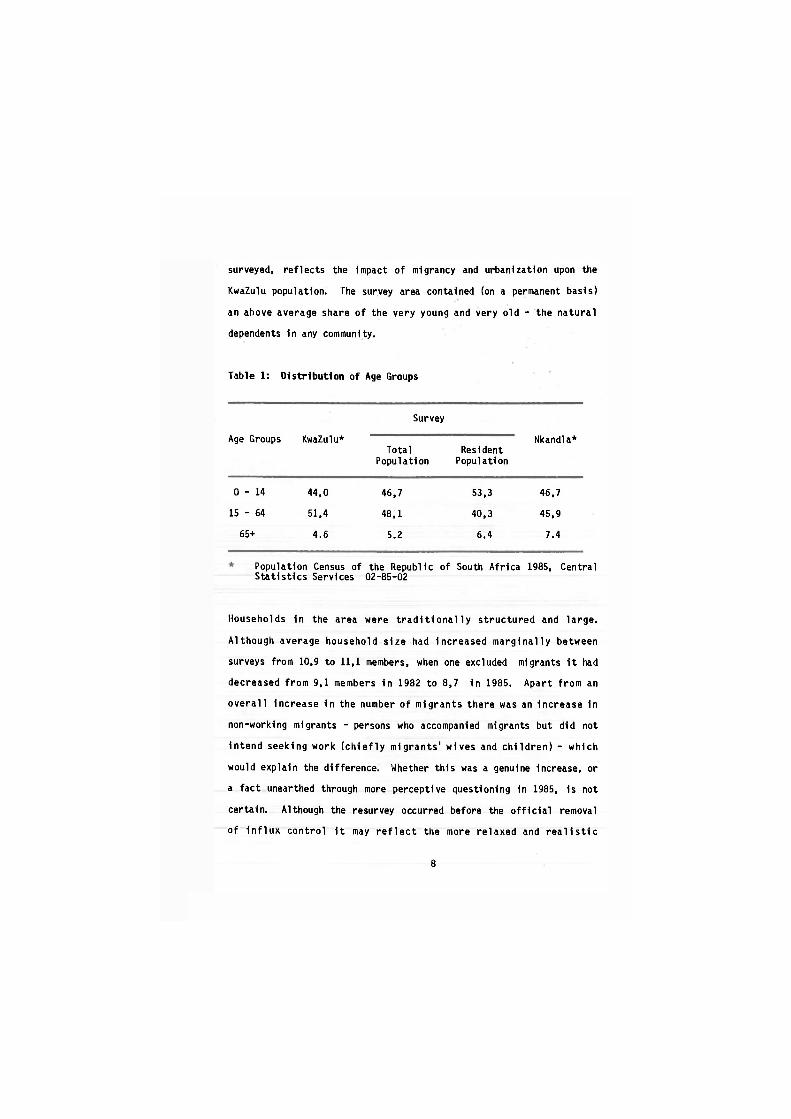
surveyed, reflects the Impact of mlgrancy and urbanization upon the
KwaZulu population. The survey area contained (on a permanent basis)
an above average share of the very young and very old - the natural
dependents in any community.
Table 1: Distribution of Age Groups
Survey
Age Groups KwaZulu* Total
Population Resident
Population
Nkandla*
0 - 1 4 44,0
15 - 64 51,4
65+ 4.6
46,7
48,1
5.2
53,3
40,3
6.4
46,7
45,9
7.4
Population Census of the Republic of South Africa 1985, Central Statistics Services 02-85-02
Households 1n the area were traditionally structured and large.
Although average household size had increased marginally between
surveys from 10,9 to 11,1 members, when one excluded migrants 1t had
decreased from 9,1 members in 1982 to 8,7 in 1985. Apart from an
overall Increase in the number of migrants there was an Increase In
non-working migrants - persons who accompanied migrants but did not
intend seeking work (chiefly migrants' wives and children) - which
would explain the difference. Whether this was a genuine Increase, or
a fact unearthed through more perceptive questioning in 1985, is not
certain. Although the resurvey occurred before the official removal
of Influx control it may reflect the more relaxed and realistic
8
attitudes of the authorities preceding the repeal of the legislation.
The largest household had 34 members and the smallest 1.
2.3 Household Structure
In 1985 78 percent of households consisted of extended families. Five
percent of households contained someone who was not related to the
household head. Nineteen percent consisted of a nuclear family
(parents and children only) and four percent of individuals or
couples. Forty three percent of household members were extended
family members - i.e. they were neither the head, his spouse, nor his
children. Those who lived alone or as couples tended to have
homesteads close to relations - enabling them to obtain assistance
with chores more easily.
2.4 Household Heads
Although the majority of households were in theory, or de jure, headed
by males, the absence of many of them as migrants meant that in effect
half of the de facto heads were females.
The overall position with regard to household heads changed little
between 1982 and 1985. The number of heads who were migrants grew as
did the number who were unemployed. Those who remained at home tended
to be retired or at least of retirement age. Male heads who lived at
home were on average 61,7 years old, whereas migrant heads were 47,7.
Of those who said they were involved in agriculture at home only two
9
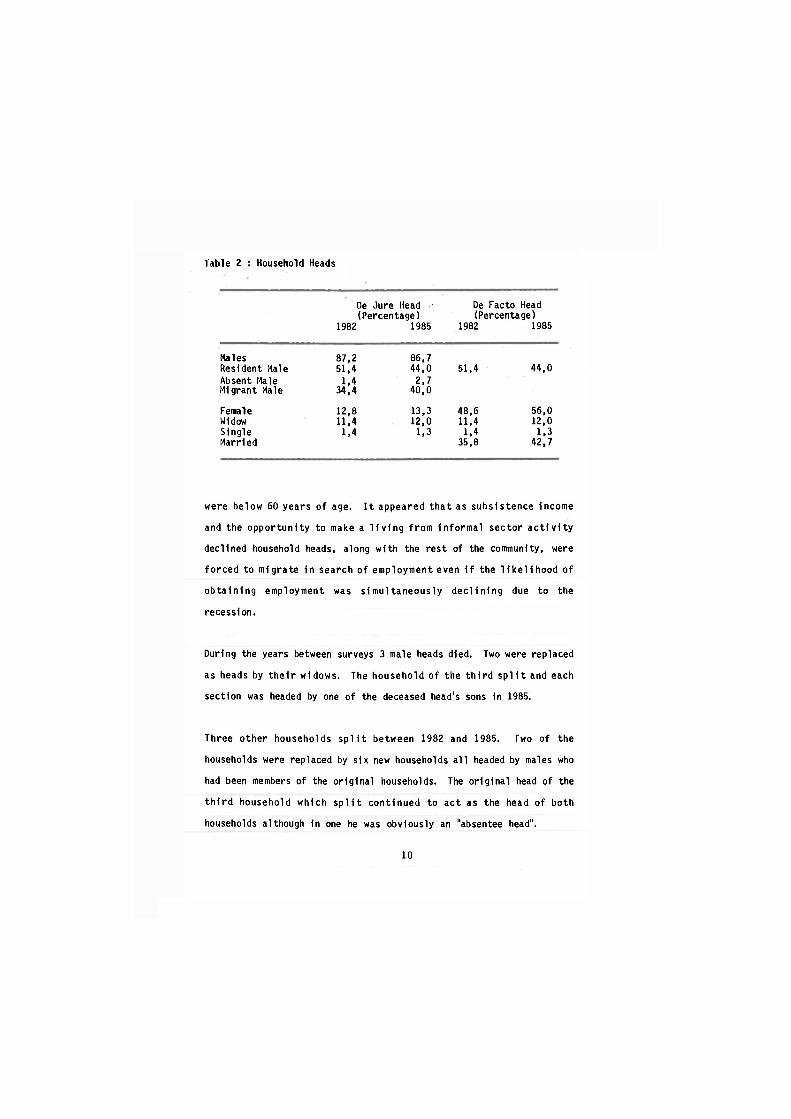
Table 2 : Household Heads
De Jure Head De Facto Head (Percentage) (Percentage)
1982 1985 1982 1985
Hales 87,2 86,7 Resident Male 51,4 44,0 51,4 44,0 Absent Male 1,4 2,7 Migrant Male 34,4 40,0
Female 12,8 13,3 48,6 56,0 Widow 11,4 12,0 11,4 12,0 Single 1,4 1,3 1,4 1,3 Married 35,8 42,7
were below 60 years of age. It appeared that as subsistence Income
and the opportunity to make a living from informal sector activity
declined household heads, along with the rest of the community, were
forced to migrate in search of employment even 1f the likelihood of
obtaining employment was simultaneously declining due to the
recession.
During the years between surveys 3 male heads died. Two were replaced
as heads by their widows. The household of the third split and each
section was headed by one of the deceased head's sons in 1985.
Three other households split between 1982 and 1985. Two of the
households were replaced by six new households all headed by males who
had been members of the original households. The original head of the
third household which split continued to act as the head of both
households although in one he was obviously an "absentee head".
10

Two households which had been headed by widows in 1982 were by 1985
headed by the widows' sons although both widows were still alive. In
another a son had replaced his father who in 1982 had been an
"absentee head".
In the original survey one respondent had been dubious as to who the
head of the household in which she lived was. Although she said her
husband was head she clearly felt her mother-in-law played a dominant
role. In 1985 she unhesitatingly stated that her mother in law was
head of the household. Members of the household were extremely
critical of her husband's recent failure to remit money to his family
who were very short of food.
The only other household recording a change in headship between
surveys was one where a son had left to live permanently in Durban and
his widowed mother had replaced him as head.
2.5 Changes in Household Structure since 1982
A number of changes were found to have taken place in the composition
of individual households in the three years between surveys. Nineteen
people had died and 73 people had been born into the surveyed
homesteads. Six of these new babies had already died. Ninety
household members had left their homes and 59 new members had joined
them.
Ilany of the moves related to the setting up of new homes. A number of
unmarried mothers who had been living at home with their parents in
11

1982, had in the intervening period married the fathers of their
children and moved with the children to the husbands' homes.
A significant number of the changes in household composition, and
often the form of household structure itself, can only be explained
by reference to current sources of income and support. Traditionally
the advantages of many hands to perform daily chores - fetching water
and fuel, housebuilding, the care of children and the aged, cooking,
agriculture and stock management - encouraged the maintenance of
extended families. Today with subsistence agriculture playing an ever
declining role and many households surviving almost entirely on cash
transfers (in the form of remittances and social pensions)1 1t might
be expected that extended households would have broken down to the
point where a migrant's or pensioner's contribution would be shared
solely amongst his immediate family. This would no doubt be the ideal
situation but the presence in the area of relatives who have access to
neither of these major sources of income and the persistence of some
traditional values, has prevented a more significant development along
such lines.
Many of the changes in household composition occuring between surveys
could be traced to destitute persons joining households which had
access to income, or to part of a household breaking away and setting
up on its own when it obtained independent access to some source of
income or when a source of income in the household to which they had
previously belonged dried up. Thus when a pensioner died, relatives
1. See Table 34.
12
who had benefited from the pension might either leave and set up their
own household or join some other household in which there was a
regular source of income. There were a number of cases of persons
who, on being successful in obtaining an old age pension or disability
grant, broke away from a household and established an independent one.
Although there were a few small households which existed successfully
without access to either pensions or remittances, whenever a family
contained a large number of dependents it appeared essential for them
to obtain access to one of the chief sources of income (remittances or
pensions) if they were not to experience dire poverty.
Changes in the composition of two specific households illustrate well
the impact of income sources on household structure. Other examples
are mentioned in subsequent chapters.
In the first the household had for sometime been dependent on the widow's pension. When her brother-in-law started to receive his own pension he and his immediate family left and established their own household. Their places were however soon taken by the widow's daughter-in-law and grandchildren who were left without any source of income when her son suddenly died.
In the second household friction had been observed between the two wives in 1982 and in 1985 the household was found to have split. In 1982 the household had been largely dependent upon one of the wives' disability grant, although the mother-in-law had recently started receiving an old age pension. Shortly after the first survey the household split leaving one wife, her children and the mother-in-law dependent upon the old age pension w h i l e the balance of the household r e m a i n e d d e p e n d e n t upon the second wife's disability grant.
13
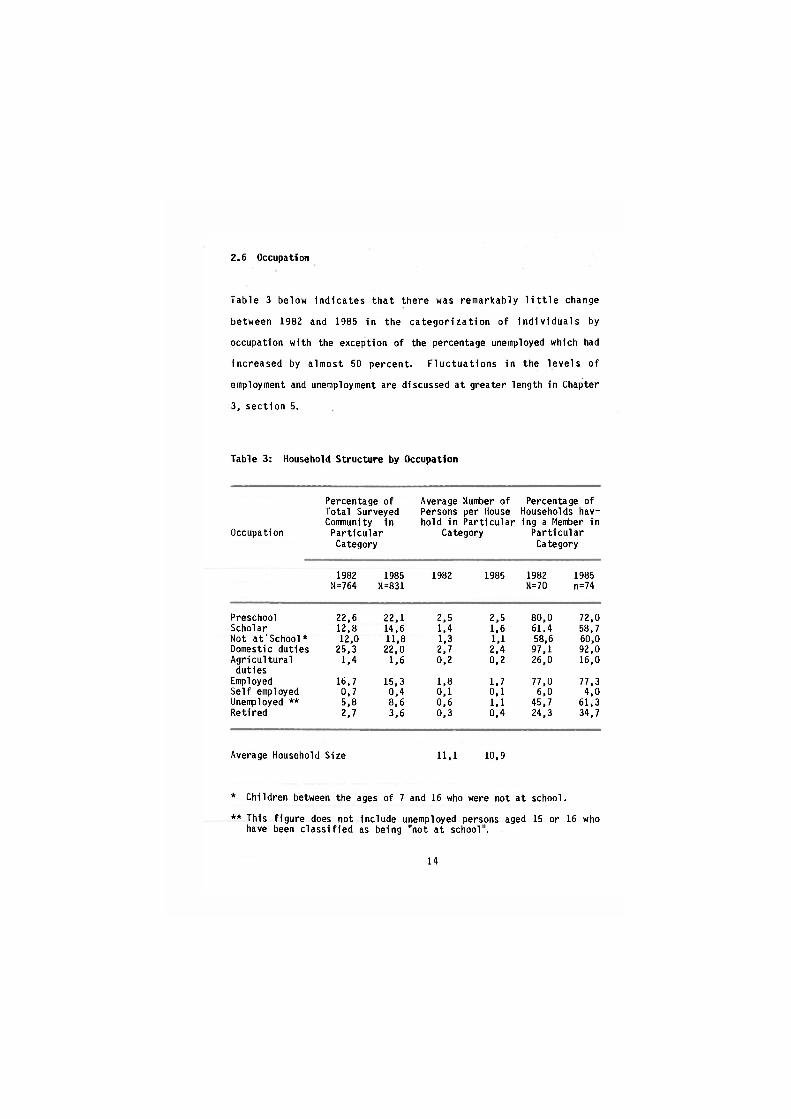
2.6 Occupation
Table 3 below indicates that there was remarkably little change
between 1982 and 1985 in the categorization of individuals by
occupation with the exception of the percentage unemployed which had
increased by almost 50 percent. Fluctuations in the levels of
employment and unemployment are discussed at greater length in Chapter
3, section 5.
Table 3: Household Structure by Occupation
Occupation
Percentage of Average Number of Percentage of Total Surveyed Persons per House Households hav-Community in hold in Particular ing a Member in Particular Category Particular Category Category
1982 N=764
1985 N=831
1982 1985 1982 N=70
1985 n=74
Preschool Scholar Not at'School* Domestic duties Agricultural duties
Employed Self employed Unemployed ** Retired
22,6 22,1 12,8 14,6 12,0 11,8 25,3 22,0 1,4 1,6
16,7 15,3 0,7 0,4 5,8 8,6 2,7 3,6
2,5 2,5 1,4 1,6 1,3 1,1 2,7 2,4 0.2 0,2
1,8 1,7 0,1 0,1 0,6 1,1 0,3 0,4
80,0 72,0 61.4 58,7 58,6 60,0 97,1 92,0 26,0 16,0
77,0 77,3 6,0 4,0
45,7 61,3 24,3 34,7
Average Household Size 11,1 10,9
* Children between the ages of 7 and 16 who were not at school.
** This figure does not include unemployed persons aged 15 or 16 who have been classified as being "not at school".
14

2.7 Parenthood
Of the 404 children surveyed who were aged 16 or less only 7,7 percent
lived permanently with both parents. A further 9,1 percent were
living with both parents at the time of the resurvey either because
illness or unemployment had led to their father being temporarily at
home or because they had accompanied their migrant parents to the
workplace.
Although 35 percent of the children might legally have been referred
to as illegitimate, approximately 10 percent of the parents of these
children, stated that they Intended marrying at some future date.
Host of the unmarried mothers who had stated in 1982 that they
intended marrying the father of their children had done so by the time
of the resurvey in 1985. All these Illegitimate children were fully
absorbed as members of their households. No resentment against their
presence was expressed by the families housing them despite the fact
that only 14 of these children received any maintenance from a parent
who was not part of the household in which the child was living.
Table 4 below gives a general view of the access of children to their
parents.
Of those who lived with their mother only, the fathers of 4,9 percent
had died. Host of these men would, no doubt, have been migrants so
that their death would have only marginally increased the percentage
living with their mother only. The fathers of 54 percent of the
legitimate children who lived with mothers only, were migrants.
16
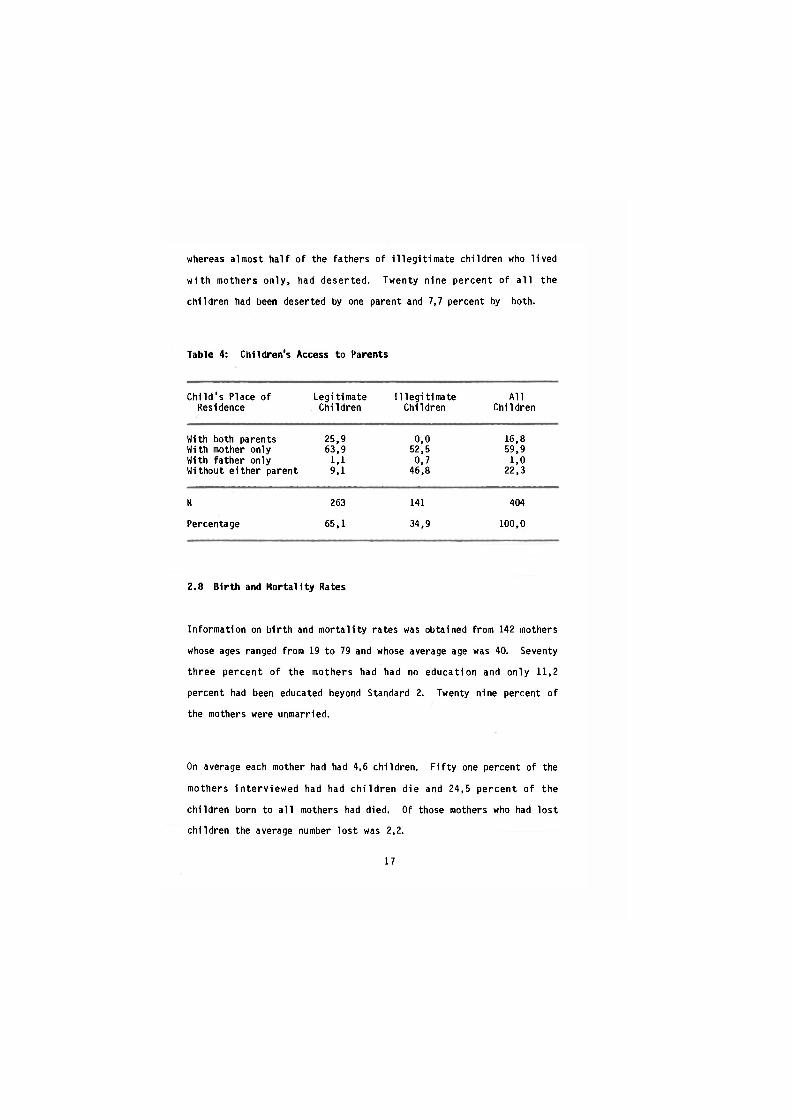
whereas almost half of the fathers of illegitimate children who lived
with mothers only, had deserted. Twenty nine percent of all the
children had been deserted by one parent and 7,7 percent by both.
Table 4: Children's Access to Parents
Child's Place of Legitimate Illegitimate All Residence Children Children Children
With both parents 25,9 0,0 16,8 With mother only 63,9 52,5 59,9 With father only 1,1 0,7 1,0 Without either parent 9,1 46,8 22,3
N 263 141 404
Percentage 65,1 34,9 100,0
2.8 Birth and Mortality Rates
Information on birth and mortality rates was obtained from 142 mothers
whose ages ranged from 19 to 79 and whose average age was 40. Seventy
three percent of the mothers had had no education and only 11,2
percent had been educated beyond Standard 2. Twenty nine percent of
the mothers were unmarried.
On average each mother had had 4,6 children. Fifty one percent of the
mothers interviewed had had children die and 24,5 percent of the
children born to all mothers had died. Of those mothers who had lost
children the average number lost was 2,2.
17
The deaths enumerated 1n the survey include the deaths of all
juveniles and while most deaths probably occurred within the first
five years of the child's life this means the survey's figures are not
directly comparable with national statistics which refer to deaths
within the first or first five years of a child's life. In 1985 the
under five mortality rate for all of South Africa was 104 per 1 000
(Wilson, 1987). This figure conceals significant racial and
geographical differences. The rate in urban areas tends to be
consistently lower than that in rural areas and that for blacks many
times that of whites. Figures from the Transkei in 1980 give an
infant mortality rate of 130/1000 and an under five rate of 190/1000
(Ingle, 1982).
A child mortality rate for each mother was calculated by dividing the
number of deaths while a juvenile by the total number of live births
and multiplying by 100. The average rate thus calculated was 18
percent.
As the younger mothers may yet have further children and as more
children (born and unborn) may still die, it was not possible to
calculate accurate or final mortality rates for all mothers surveyed
or relate these to other factors such as education or age. The most
that could be done with the survey data was to look for trends. The
following tables should, therefore, be viewed with this limitation in
mind and be seen to reflect the position as at the tine of survey
only. They would seem to indicate that the child mortality rate was
declining over time. The child mortality rate of those mothers who
were currently younger (not necessarily those who had given birth at a
18

younger age) was significantly lower than that of mothers who were
currently older suggesting that each year the rate was falling. The
implication that one of the reasons for this fall was the better
education of younger mothers is supported by Table 6 which indicates a
child mortality rate which falls as the level of the mother's
education ri ses.
Table 5: Mortality Rate and Mother's Age
Current Average Child Age of Mother Mortality Rate Age of Mother
(Percentage)
15 - 34 8,9 35 - 54 17,8 55 + 36,5
Table 6: Mortality Rate and Mother's Education
Education of Mother Mortality Rate (Percentage)
None 25,9 1 - 4 years 13,6 4 + years 10,7
2.9 Marriage and Fertility
The surveys showed that marriage was still the norm even if it only
took place relatively late in life. In 1985 there were only four men
and two women over the age of forty who were not and never had been
married. However, it was only at the age of 30 that the majority of
19
women were married and at 33 that this was true of the majority of
men. No men under the age of 25 were married and only 4 women were.
Of those who were married, 42,7 percent of females amd 30,9 percent of
males were parties to polygamous unions.
Worldwide, marriage and fertility appear to follow certain patterns.
Marriage at a relatively young age is normally accompanied by high
fertility rates and is found in societies where marriage is almost
universal (Simkins: 1986). Where changes occur in such societies
resulting in later marriage it usually happens that the fertility rate
declines and marriage is no longer universal. However, where the
changes are related solely to economic causes and do not reflect
cultural change, later marriage may not be accompanied by delayed
childbearing and marriage may remain universal although occurring
later. Thus, in the survey area it seems that whilst economic
circumstances, the wage employment of some young women, the migrant
labour system and other factors have led to a postponement of
marriage, marriage has nevertheless remained almost universal and
childbearing has not been delayed. Almost one third of the surveyed
mothers were unmarried at the time of the survey and it is likely that
the majority were unmarried when they actually gave birth - at least
to their eldest children.
As the younger mothers in the survey group may yet have more children
it is not possible to determine whether the fertility rate is
declining without knowing the ages of the mothers at the time of each
20
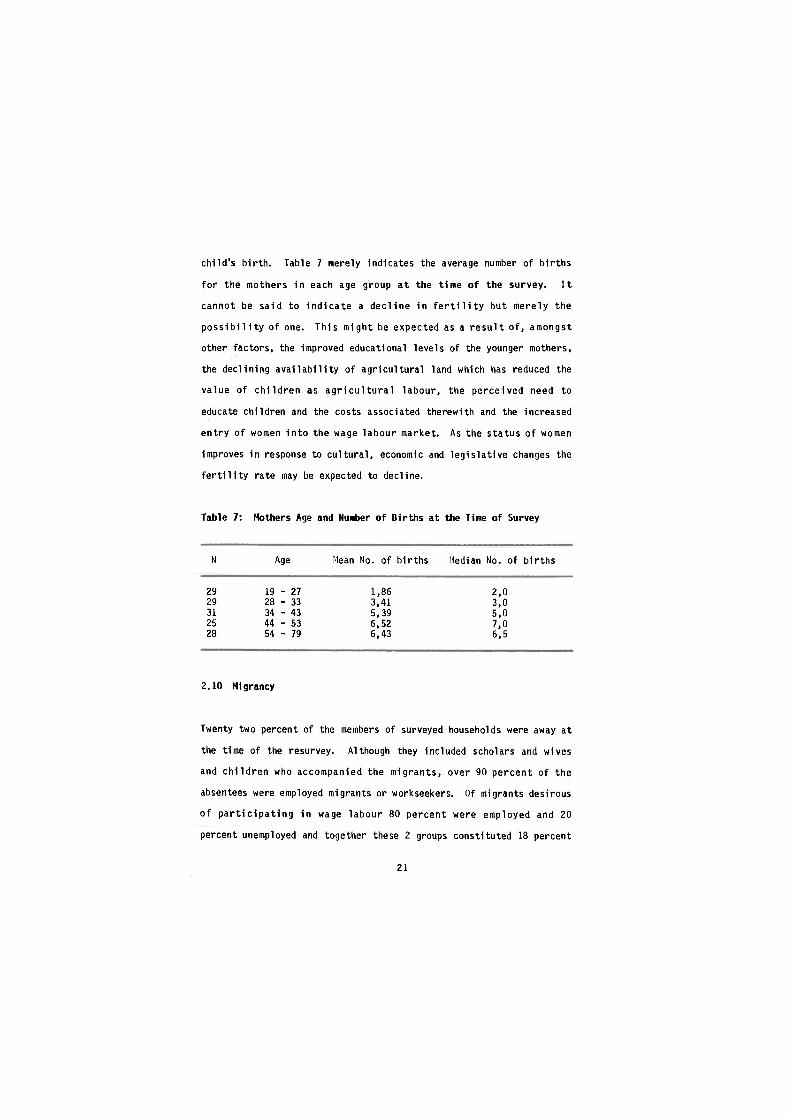
child's birth. Table 7 merely indicates the average number of births
for the mothers in each age group at the time of the survey. It
cannot be said to indicate a decline in fertility but merely the
possibility of one. This might be expected as a result of, amongst
other factors, the improved educational levels of the younger mothers,
the declining availability of agricultural land which has reduced the
value of children as agricultural labour, the perceived need to
educate children and the costs associated therewith and the increased
entry of women into the wage labour market. As the status of women
improves in response to cultural, economic and legislative changes the
fertility rate may be expected to decline.
Table 7: Mothers Age and Number of Births at the Time of Survey
N Age Mean Ho. of births Median No. of births
29 19 - 27 1,86 2,0 29 28 - 33 3,41 3,0 31 34 - 43 5,39 5,0 25 44 - 53 6,52 7,0 28 54 - 79 6,43 6,5
2.10 Migrancy
Twenty two percent of the members of surveyed households were away at
the time of the resurvey. Although they included scholars and wives
and children who accompanied the migrants, over 90 percent of the
absentees were employed migrants or workseekers. Of migrants desirous
of participating in wage labour 80 percent were employed and 20
percent unemployed and together these 2 groups constituted 18 percent
21
of the surveyed population. The 6,7 percent of the population who
were at home but unemployed, should probably be viewed as potential
migrants as the chances of their finding employment in the survey area
were extremely small. Many of them had been previously employed as
migrants. Had half of them been able to find employment as migrants,
a quarter of the population of the area would not have been resident
on a permanent basis at the time of the survey.
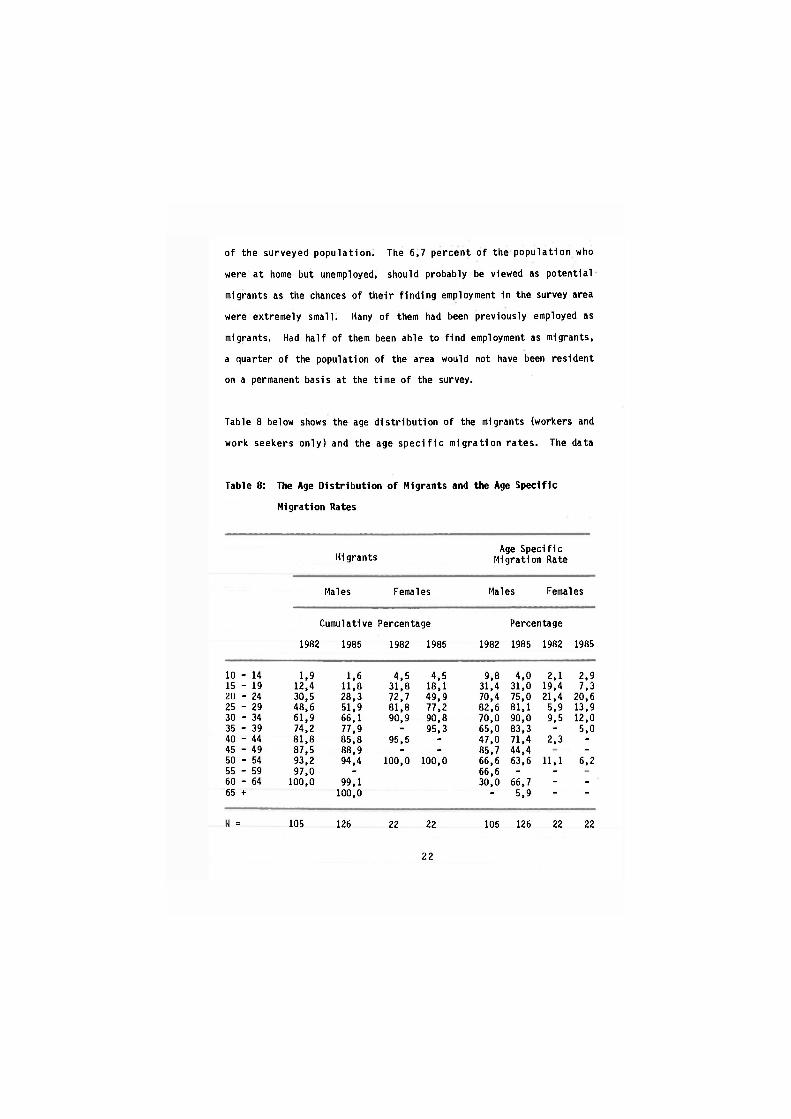
Table 8 below shows the age distribution of the migrants (workers and
work seekers only) and the age specific migration rates. The data
Table 8: The Age Distribution of Migrants and the Age Specific
Migration Rates
Age Specific Migrants Migration Rate
Males Females Males Females
Cumulative Percentage Percentage
1982 1985 1982 1985 1982 1985 1982 1985
10 - 14 1,9 1,6 4,5 4,5 9,8 4,0 2,1 2.9 15 - 19 12,4 11,8 31,8 18,1 31,4 31,0 19,4 7,3 •/() - 24 30,5 28,3 72,7 49,9 70,4
82,6 75,0 21,4 20,6
25 - 29 48,6 51,9 81,8 77,2 70,4 82,6 81,1 5,9 13,9
30 - 34 61,9 66,1 90,9 90,8 70,0 90,0 9,5 12,0 35 - 39 74,2 77,9 - 95,3 65,0 83,3 - 5,0 40 - 44 81,8 85,8 95,5 - 47,0 71,4 2,3 -
45 - 49 87,5 88,9 - - 85,7 44,4 -
50 - 54 93,2 94,4 100,0 100,0 66,6 63,6 11,1 6,2 55 - 59 97,0 - 66,6 - -
60 - 64 100,0 99,1 30,0 66,7 - -
65 + 100,0 - 5,9 - -
N = 105 126 22 22 105 126 22 22
22
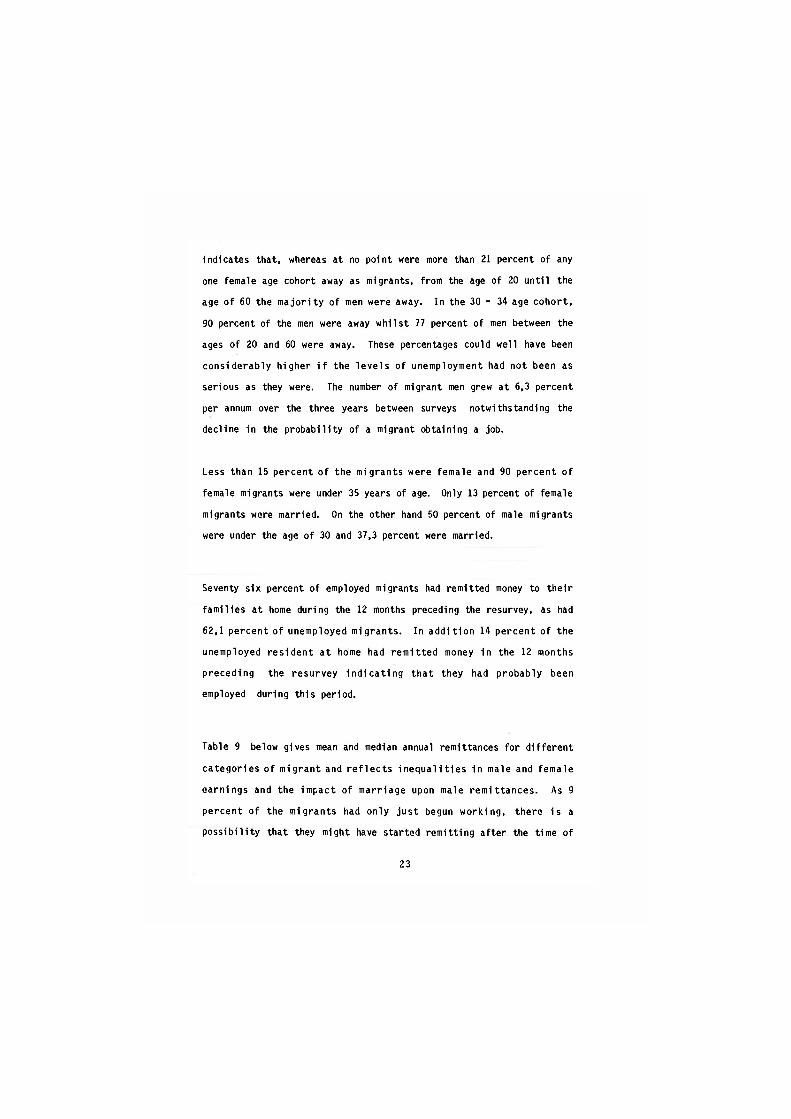
Indicates that, whereas at no point were more than 21 percent of any
one female age cohort away as migrants, from the age of 20 until the
age of 60 the majority of men were away. In the 30 - 34 age cohort,
90 percent of the men were away whilst 77 percent of men between the
ages of 20 and 60 were away. These percentages could well have been
considerably higher if the levels of unemployment had not been as
serious as they were. The number of migrant men grew at 6,3 percent
per annum over the three years between surveys notwithstanding the
decline in the probability of a migrant obtaining a job.
Less than 15 percent of the migrants were female and 90 percent of
female migrants were under 35 years of age. Only 13 percent of female
migrants were married. On the other hand 50 percent of male migrants
were under the age of 30 and 37,3 percent were married.
Seventy six percent of employed migrants had remitted money to their
families at home during the 12 months preceding the resurvey, as had
62,1 percent of unemployed migrants. In addition 14 percent of the
unemployed resident at home had remitted money in the 12 months
preceding the resurvey indicating that they had probably been
employed during this period.
Table 9 below gives mean and median annual remittances for different
categories of migrant and reflects inequalities in male and female
earnings and the impact of marriage upon male remittances. As 9
percent of the migrants had only just begun working, there is a
possibility that they might have started remitting after the time of
23
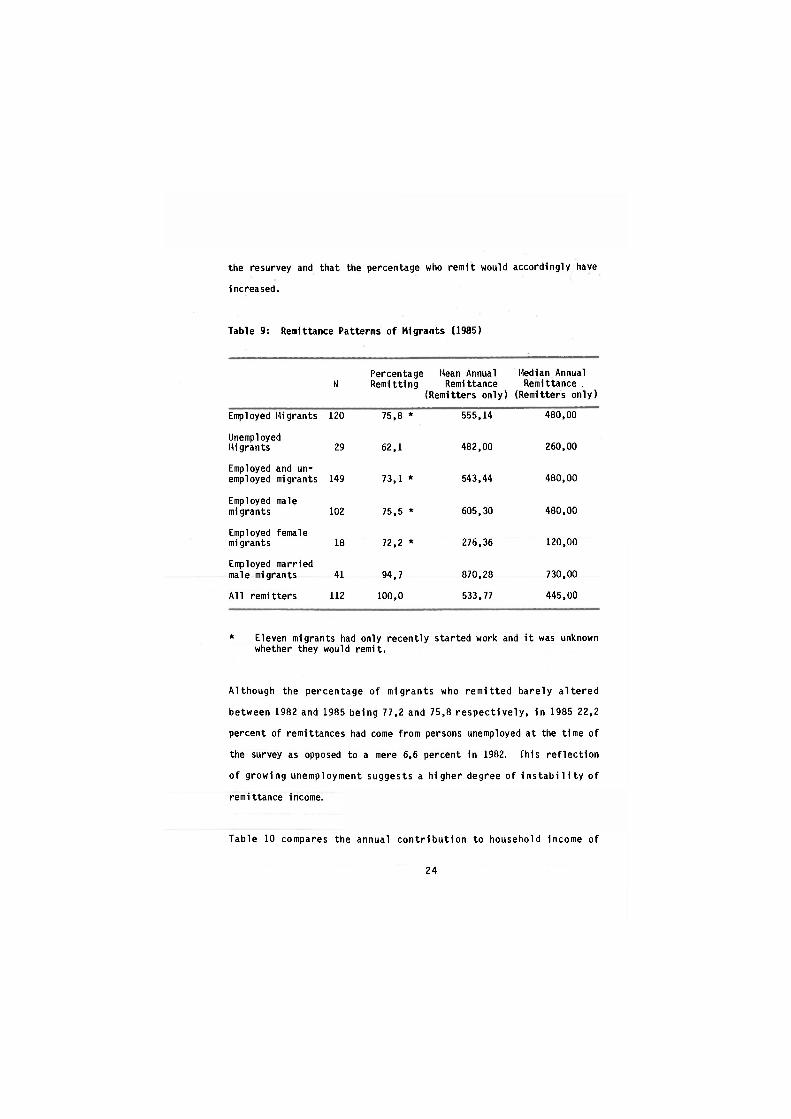
the resurvey and that the percentage who remit would accordingly have
increased.
Table 9: Remittance Patterns of Migrants (1985)
N Percentage Remitting
Mean Annual Remi ttance
(Remitters only)
Median Annual Remittance .
(Remitters only)
Employed Migrants 120 75,8 * 555,14 480,00
Unemployed Migrants 29 62,1 482,00 260,00
Employed and un-employed migrants 149 73,1 * 543,44 480,00
Employed male migrants 102 75,5 * 605,30 480,00
Employed female migrants 18 72,2 * 276,36 120,00
Employed married male migrants 41 94,7 870,28 730,00
All remitters 112 100,0 533,77 445,00
* Eleven migrants had only recently started work and it was unknown whether they would remit.
Although the percentage of migrants who remitted barely altered
between 1982 and 1985 being 77,2 and 75,8 respectively, in 1985 22,2
percent of remittances had come from persons unemployed at the time of
the survey as opposed to a mere 6,6 percent in 1982. This reflection
of growing unemployment suggests a higher degree of instability of
remittance income.
Table 10 compares the annual contribution to household income of
24
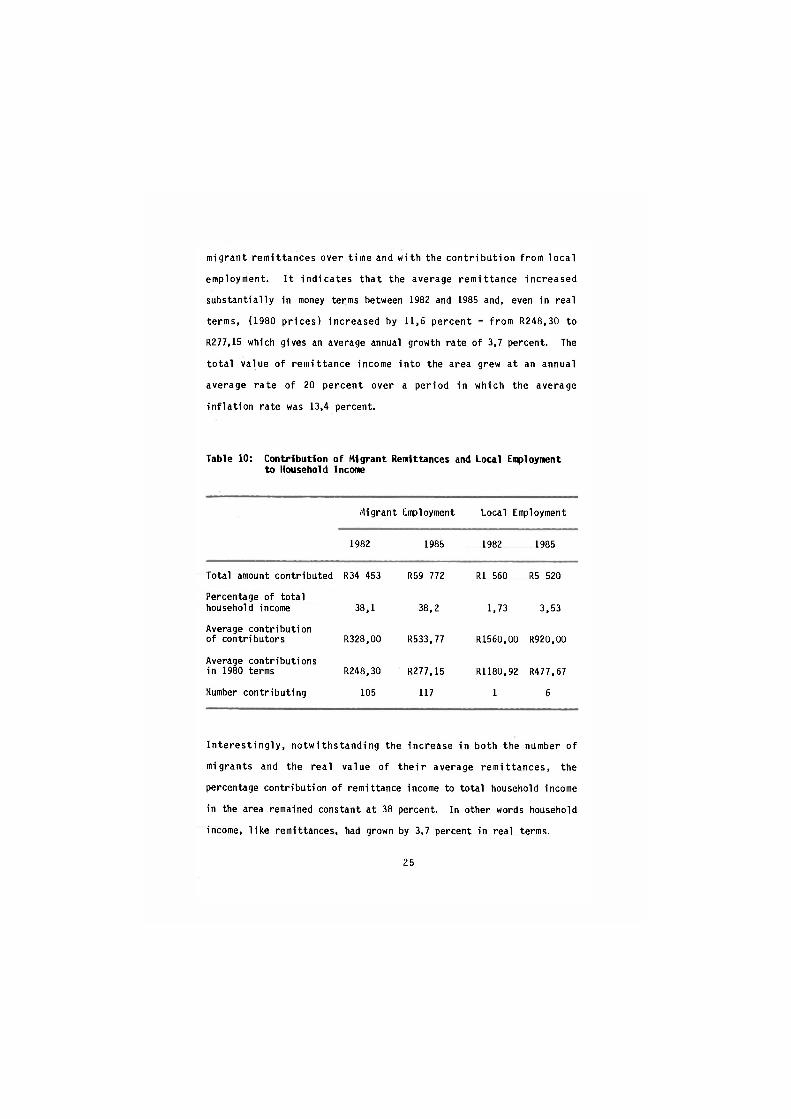
migrant remittances over time and with the contribution from local
employment. It indicates that the average remittance increased
substantially in money terms between 1982 and 1985 and, even in real
terms, (1980 prices) increased by 11,6 percent - from R248.30 to
R277.15 which gives an average annual growth rate of 3,7 percent. The
total value of remittance income into the area grew at an annual
average rate of 20 percent over a period in which the average
inflation rate was 13,4 percent.
Table 10: Contribution of Migrant Remittances and Local Employment to Household Income
Migrant Employment Local Employment
1982 1985 1982 1985
Total amount contributed R34 453 R59 772 R1 560 R5 520
Percentage of total household income 38,1 38,2 1,73 3,53
Average contribution of contributors R328.00 R533.77 R1560.00 R920.00
Average contributions in 1980 terms R248.30 R277.15 R1180.92 R477.67
Number contributing 105 117 1 6
Interestingly, notwithstanding the increase in both the number of
migrants and the real value of their average remittances, the
percentage contribution of remittance income to total household income
in the area remained constant at 38 percent. In other words household
income, like remittances, had grown by 3,7 percent in real terms.
25
2.11 Pensioners and Pensions
Of the population surveyed in 1985 7,7 percent were pensionable - that
is they were women aged 60 and older or men aged 65 and older. Seven
percent or 82,8 percent of pensionable individuals actually received
an old age pension. These pensioners were distributed amongst 56
percent of the surveyed households. 13,3 percent of households
contained a person who although pensionable was not in receipt of a
pension. Half of those who were not in receipt of a pension had
applied for one but as yet had received nothing. The balance had
taken no steps to obtain a pension.
Data relating to pensions is given in Table 11 below w h i c h
demonstrates that between 1982 and 1985 there was a significant
improvement in pension coverage. Of the eighteen pensionable persons
who were without pensions in 1982, 14 were receiving pensions in 1985.
Increased pension coverage had resulted in pensions making an even
greater contribution to household income than was the case in 1982
when 5,4 percent of the surveyed community contributed 29 percent of
the cash income in the form of old age pensions and disability grants.
In 1985, 7,5 percent of those surveyed were old age or disability
pensioners and they contributed 39 percent of the total cash income of
the households surveyed.
Households containing pensioners achieved some of the highest
household incomes per capita amongst those surveyed (Table 35). In
26
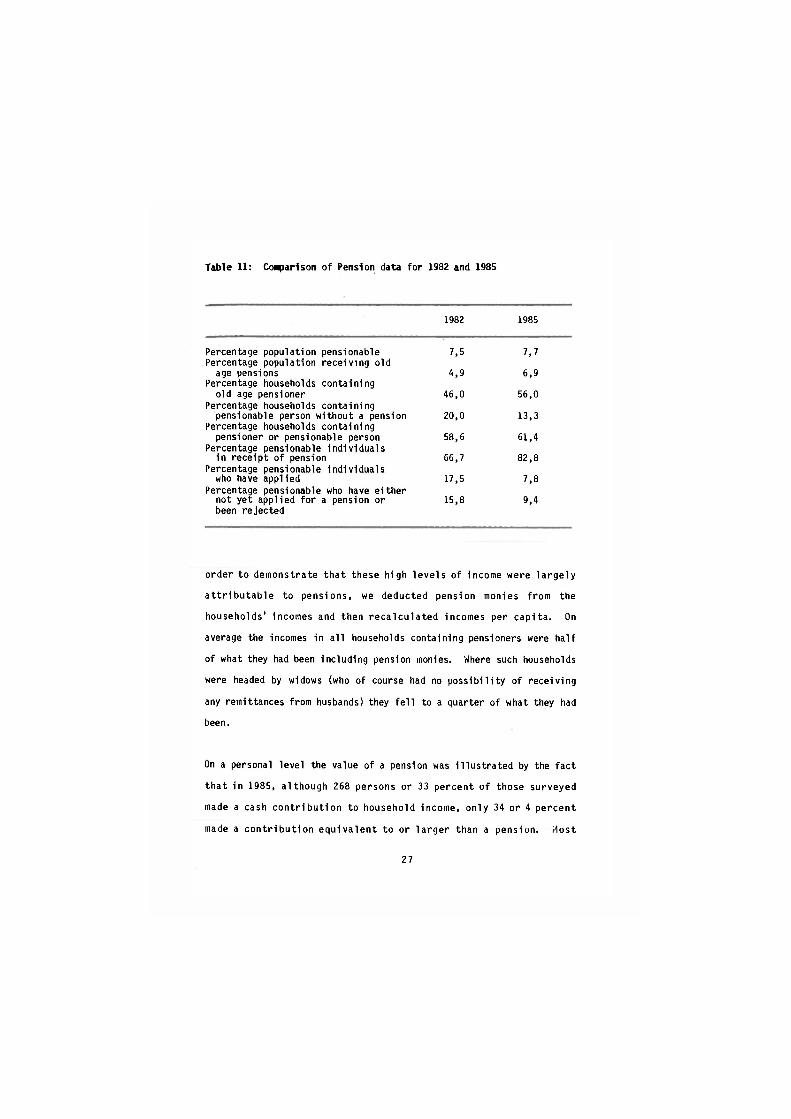
Table 11: Comparison of Pension data for 1982 and 1985
1982 1985
Percentage population pensionable 7,5 7,7 Percentage population receiving old
age pensions 4,9 6,9 Percentage households containing
old age pensioner 46,0 56,0 Percentage households containing
pensionable person without a pension 20,0 13,3 Percentage households containing
pensioner or pensionable person 58,6 61,4 Percentage pensionable individuals
in receipt of pension 66,7 82,8 Percentage pensionable individuals
who have applied 17,5 7,8 Percentage pensionable who have either
not yet applied for a pension or 15,8 9,4 been rejected
order to demonstrate that these high levels of income were largely
attributable to pensions, we deducted pension monies from the
households' Incomes and then recalculated incomes per capita. On
average the incomes in all households containing pensioners were half
of what they had been including pension monies. Where such households
were headed by widows (who of course had no possibility of receiving
any remittances from husbands) they fell to a quarter of what they had
been.
On a personal level the value of a pension was illustrated by the fact
that in 1985, although 268 persons or 33 percent of those surveyed
made a cash contribution to household income, only 34 or 4 percent
made a contribution equivalent to or larger than a pension. Most
27
women only contributed as pensioners and even the contributions of
women migrants never approximated those of pensioners. The average
female migrant remitted R305 per annum while the female pensioners
contributed at least R780 per annum.
The benefits of pensions were not confined to pensioners. As pensions
were often the only reliable and regular source of household income
pensioners were depended upon for the payment of school fees, hospital
charges, transport costs, debts and a major share of the expenditure
on foodstuffs for the household. Frequently 1t was only the presence
of a pensioner that enabled his household to obtain credit at the
local store. Non-family members benefitted from pensions by being
able to sell goods and services to pensioners. The enormous value of
a pension however also made pensioners open to exploitation by the
rest of the community at the same time as it gave them an importance
and influence in the community that would perhaps have been more
constructively and progressively exercised by a younger age group.
2.12 The Human Implications of a Changing Society
Although the structure of the family, h o m e s t e a d and local
administration of the survey area was superficially "traditional", as
a consequence of its Inevitable and increasing involvement in the
modern or core economy, changes had occured in this peripheral
"traditional" community which had serious implications for leadership
roles and the relative importance of certain individuals. Change had
undermined the leadership of traditional chiefs, had physically
28
removed from the area many men whose roles had to be taken by women or
left unfilled, had increased the roles, if not the power, of women,
had greatly enhanced the position of the aged and had introduced a new
power base altogether - that of the trader or shopkeeper.
Officially the chiefs and their headmen still administered the area
and no action could be taken or approaches made to the State other
than through them. They were however neither educated nor church
members and did not (and indeed were not expected to) take the lead in
any "non-traditional" activity such as school or road building. Their
lack of the necessary attributes for leadership in a changing society
meant that their dealings with the community and the State had become
mere formalities, legalising action that had already taken place, and
their importance in the community had decreased accordingly.
The role of men on the other hand had been diminished by their
physical absence from the area. Although the need for migrancy and
the resulting absence of men had been accepted there had been no
formal reallocation of men's roles to other members of the community.
In some cases there had been a de facto transfer to women or
pensioners but in others their roles were simply left unfilled. For
example, amongst the individuals cited as responsible for founding
schools there was not one woman and it still seemed unlikely that a
woman could initiate a project requiring the co-operation and
financial support of the community. The alternate male substitute -
pensioners - also suffered from shortcomings. They were neither
physically or mentally suited to initiate the progressive responses
29
called for by the changing community. The result was that many needs
remain unfilled where with the presence of men, or the development of
others to take their place, they might have been filled.
In the survey area the church did not, except in the field of
education, appear to be playing a leadership role or supplying people
to fill the vacuums created by 1ll-equ1ped chiefs or absent men.
Although there were churches in the area, there had never been a
mission there and seldom had a priest been resident in the area.
The role of school teachers in the area was limited by the facts that
they were not "locals", tended to be transferred after a few years and
generally left the area each weekend to join their families who
remained in town. The same was true of the extension officers.
It seemed to be only the storekeepers who settled permanently and
brought their families and they appeared to have become the pivots of
the changing society. Their education enabled them to comprehend the
modern bureaucratic state and their literacy, telephones and vehicles
to communicate with the outside world. There was little for which the
community did not turn to the storekeeper and little for which he did
not accept responsibility.
The surveys showed the legacy of influx control and the migrant labour
system to be a community with abnormal family structure. Host of the
men in the 20 - 60 age group who were present in the survey area were
30
only there because they were unemployed. Certain age cohorts were 95
percent female and the position would have been worse if employment
prospects had been better. In general young wives lived without their
husbands, and children without their fathers. The absence of the men
affected income levels, agricultural production levels, the ability to
introduce progressive change and the general effectiveness of decision
making.
The survey area was little more than a dormitory for the families of
workers in the core economy and for workers themselves when their
services were no longer required. Migrants drifted between this very
private, personalized world and the impersonal, demanding industrial
core. Few members of their families ever experienced the core or had
the opportunity to study the forces there which determined their
lifestyle on the periphery.
The fact that no respondents, when listing problems they experienced,
referred to a lack of control over their lifestyles, migrancy or
influx control is probably explained by their feeling of powerlessness
to influence the policies, practices or legislation which emanate from
the core, rather than resignation to or acceptance of them.
31
CHAPTER THREE: ECONOMIC ACTIVITIES
3.1 Introduction
Chapter Three describes the various economic activities undertaken by
respondents in the survey area while Chapter Five is concerned with
the actual incomes derived from these activities and their
distribution. The economic activities encountered are described in
some detail, as are changes related to them which took place during
the three years between surveys. Studies often attribute income or
implied levels of wealth to households simply because they have access
to certain assets. The contention of this paper is that this
implication may be incorrect and it is argued that it 1s only when the
dynamics of economic activities are studied over time that 1t can
conclusively be stated that access to certain assets will or does
result in certain incomes for a particular household or an increase in
the value of its assets. Access to land may lead to a negative
income flow where, for example, the household has no cattle or members
to work the land and has to spend money on ploughing and labour.
Similarly in marginal agricultural areas, where certified seed is not
used and plant not fertilized, costs may often exceed the value of the
resultant low yields.
Similar fallacies may derive from attributing a value to the ownership
of stock without determining whether the herd is increasing or
decreasing in value, what the cost of holding stock is and whether it
is realistic to attribute a value to cattle which the owner would
32

never be prepared to realize.
Misconceptions may arise from considering only the agricultural
potential of land and not making a thorough appraisal of marketing
realities. Problems with simple wealth index type analyses may arise
where, for example, the mere ownership of cattle is held to increase
ability to use land regardless of how many and what type of cattle are
owned. Thus the use of such an index may imply that the ownership of
one calf improves the ploughing potential of a household (even if only
marginally) whereas, in fact, it does nothing of the sort.
Attributing wealth to a household on the basis of its assets is no
substitute for actually determining whether a household can or does
derive income or wealth from a particular source.
The section on agriculture thus considers not only access to land but
also the ability to make use of 1t, whether in fact it was made use
of, its potential as well as the costs Incurred, and income received
as a result of land use.
The section on stockholding discusses in detail the type, age and sex
of stock held, fertility and mortality rates, cattle movements etc.
This is necessary if any realistic assessment is to be made of the
economic value of stockholding. A value attributed to stock held on
the day of survey gives limited economic information, and may in fact
be misleading, particularly where there is no breakdown of the herd,
no knowledge of the use to which the cattle or their products are put,
or of whether the herd is increasing or decreasing in value.
33

3.2 Agriculture
The survey area is one which, in terms of climate, rainfall, soil
types and soil condition, compares favourably with other areas of
KwaZulu but the terrain is extremely rugged which makes cultivation
dificult and irrigation impossible except in the very small relatively
level patches next to the streams. For decades people have tilled the
soil there and fed their families. Today the levels of subsistence
off the land are continually falling and there has been almost no
development of cash cropping or marketing of surpluses.
3.2.1 Access to Land
The resurvey found the position with regard to access to land little
changed from that in 1982. Only two households (as compared with one
in 1982) claimed to have no land. Had they requested land from their
indunas they would most probably have had land allocated to them, just
as if those who had land, had requested more they too would probably
have had their request granted. Land suited to crop production in the
survey area was, however, very limited. Much of the land in use was
extremely steep. It was difficult to work, likely to be eroded (with
c o n s e q u e n t seed loss etc) by rain and unlikely to produce
satisfactorily without expensive inputs such as fertilizer and
conservation measures. It is probably factors such as these, along
with other constraints, for example, shortages of labour, capital and
infrastructure, that limit the application for and use of land in the
area, rather than a straightforward shortage of land. Unallocated
land was being used for communal grazing (for which it is far better
34
suited). However, were the incentives and necessary inputs available
there is no reason to believe that a request by residents for the
allocation of more or larger areas of land would be refused.
It was not possible to obtain a clear definition of the nature of
respondents' rights to the land they had been allocated. Eighty eight
percent of respondents claimed to have had to pay something for the
right to plough. The annual amount paid varied between R1 and R20 but
over 50 percent claimed to have paid R2. An induna when questioned
about the fee levied stated that the money constituted Inkatha
membership fees,1 which were collected annually between September and
November - the same period during which ploughing began.2 A number of
persons stated that as pensioners they were not required to pay
anything for the use of land.
Respondents were asked questions about the forms of land tenure found
in the survey area 1n order to establish whether land could only be
held on allocation by the chief or induna or whether other forms of
tenure co-existed. Ninety seven percent of respondents stated that it
was impossible to lease land. However, ninety four percent stated
that land might be borrowed. There was generally no cost Involved in
borrowing although there might be some transfer of produce to the
lender In recognition of his status. Borrowing land was generally
considered unnecessary and the only evidence of it was where someone
had ploughed another's land in return for being allowed to "borrow" a
certain portion of It.
1. Inkatha's joining fee was R3 and the annual renewal R2. 2. Similar confusion was encountered about the need to pay certain
monies to tribal authorities for school fees, building rights etc.
35
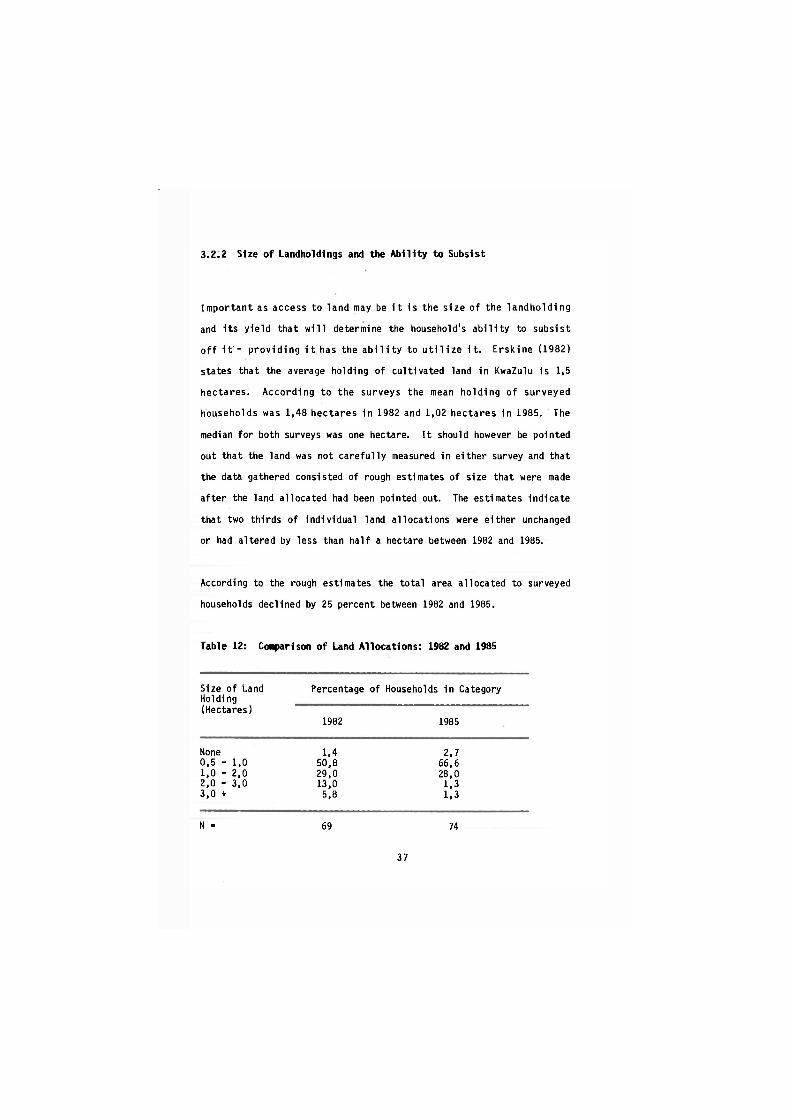
3.2.2 Size of Landholdings and the Ability to Subsist
Important as access to land may be it Is the size of the landholding
and its yield that will determine the household's ability to subsist
off it - providing it has the ability to utilize it. Erskine (1982)
states that the average holding of cultivated land in KwaZulu is 1,5
hectares. According to the surveys the mean holding of surveyed
households was 1,48 hectares in 1982 and 1,02 hectares in 1985. The
median for both surveys was one hectare. It should however be pointed
out that the land was not carefully measured in either survey and that
the data gathered consisted of rough estimates of size that were made
after the land allocated had been pointed out. The estimates indicate
that two thirds of individual land allocations were either unchanged
or had altered by less than half a hectare between 1982 and 1985.
According to the rough estimates the total area allocated to surveyed
households declined by 25 percent between 1982 and 1985.
Table 12: Comparison of Land Allocations: 1982 and 1985
Size of Land Percentage of Households in Category Holding (Hectares)
1982 1985
None 1,4 2,7 0,5 - 1,0 50,8 66,6 1,0 - 2,0 29,0 28,0 2,0 - 3,0 13,0 1,3 3,0 + 5,8 1,3
N = 69 74
37
If an annual yield of 6 bags of mealies per hectare (Appendix B) and
a minimum subsistence requirement of 2 bags per person per annum is
assumed, one hectare in the survey area could not produce sufficient
to meet the subsistence needs of the average household which had 8,7
resident members. This was clearly shown to be the case by the fact
that in September 1985 (approximately five months before anyone could
expect to begin reaping green mealies) over 80 percent of households
surveyed reported having no dry maize left from the previous crop.
Host households had managed to save some seed but 26 percent had not
even managed to do this. Sixty percent of households claimed to have
consumed over half of their maize crop green and less than 30 percent
picked green mealies for longer than a three month period.
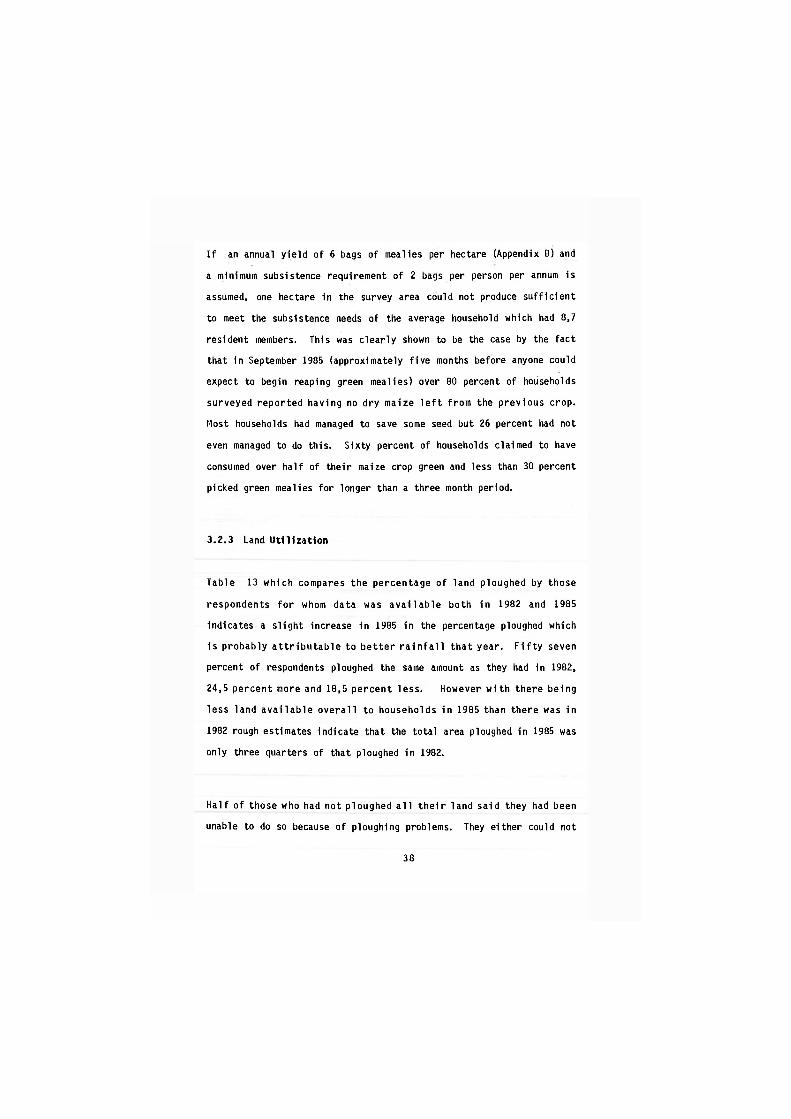
3.2.3 Land Utilization
Table 13 which compares the percentage of land ploughed by those
respondents for whom data was available both in 1982 and 1985
indicates a slight increase in 1985 in the percentage ploughed which
is probably attributable to better rainfall that year. Fifty seven
percent of respondents ploughed the same amount as they had in 1982,
24,5 percent more and 18,5 percent less. However with there being
less land available overall to households in 1985 than there was in
1982 rough estimates indicate that the total area ploughed in 1985 was
only three quarters of that ploughed in 1982.
Half of those who had not ploughed all their land said they had been
unable to do so because of ploughing problems. They either could not
38
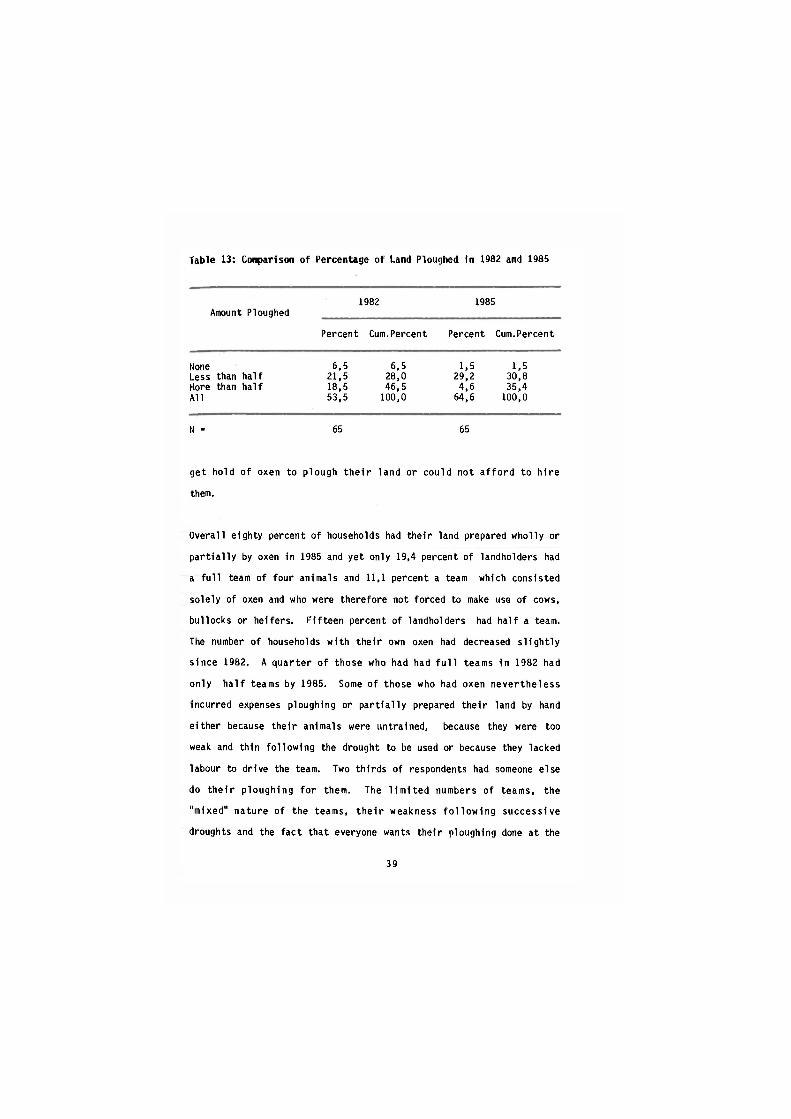
Table 13: Comparison of Percentage of Land Ploughed in 1982 and 1985
1982 1985 Amount Ploughed
Percent Cum.Percent Percent Cum.Percent
None Less than half More than half All
6,5 6,5 21,5 28,0 18,5 46,5 53,5 100,0
1.5 1,5 29,2 30,8 4.6 35,4
64,6 100,0
N = 65 65
get hold of oxen to plough their land or could not afford to hire
them.
Overall eighty percent of households had their land prepared wholly or
partially by oxen in 1985 and yet only 19,4 percent of landholders had
a full team of four animals and 11,1 percent a team which consisted
solely of oxen and who were therefore not forced to make use of cows,
bullocks or heifers. Fifteen percent of landholders had half a team.
The number of households with their own oxen had decreased slightly
since 1982. A quarter of those who had had full teams in 1982 had
only half teams by 1985. Some of those who had oxen nevertheless
incurred expenses ploughing or partially prepared their land by hand
either because their animals were untrained, because they were too
weak and thin following the drought to be used or because they lacked
labour to drive the team. Two thirds of respondents had someone else
do their ploughing for them. The limited numbers of teams, the
"mixed" nature of the teams, their weakness following successive
droughts and the fact that everyone wants their ploughing done at the
39
same time severely limits the amount of ploughing that can be done and
the economic use that can be made of the teams.
Tables 14 and 15 below which relate the ownership of oxen and the
method used to prepare land to the percentage of land ploughed
indicate that access to traction power influences the ability to
produce.
Table 14: Ownership of Oxen Related to Percentage Land Ploughed
Households Households Households Amount of land plouged with No Oxen with Half Span with Full Span
Less than half 40,4 27,3 14,3 More than half 59,6 72,7 85,7
Households in N= 72 47 11 14 Category %=100 65,3 15,3 19,4
Table 15: Method of Land Preparation Related to Percentage Land Ploughed
Method of Land Preparation
Amount Ploughed Hand Hand/Ox Ox Tractor/Ox Tractor
Less than half 54,4 42,9 27,9 More than half 45,5 57,1 72,1 100,0 100,0
Households in N= 72 11 14 43 2 2 Category %=100 15,3 19,4 59,7 2,8 2,8
40
Half of those who had oxen ploughed for others. Where the person had
only half a span the hirer might provide the other half or the
ploughing would simply be done with half a team. One third of those
who ploughed for others charged nothing - either because the hirer
provided half the team or because he was a relative or neighbour. The
total income earned from ploughing in the twelve months preceding the
1985 survey by all households surveyed was R318. A quarter of those
who had ploughing done for them were not charged and the balance paid
out a total of R1350 - an average of R36.50 each. The price charged
per isikofu 1 ranged from R2,66 to R13 and averaged R8.33.
Access to traction power clearly influenced the amount of land
ploughed. The availability of male labour did not appear to have the
same impact. Only three households had no one who worked the land.
Eighty two percent of those involved in agricultural work were women
and only 21 percent of households contained men who performed
agricultural duties. In only 12 percent of households were men always
available and half of these men were either retired or only available
because currently unemployed. Table 16 implies that the availability
of male assistance did not adversely affect the amount of land
ploughed. However, when it came to ploughing for others, male
assistance did seem to make a difference - twice as many oxen owners
ploughed for others when males were at home to help as did those
owners with no men at home.
1. The area ploughed by a team of oxen in a morning which in the area surveyed was approximately ,12 Hectare.
41
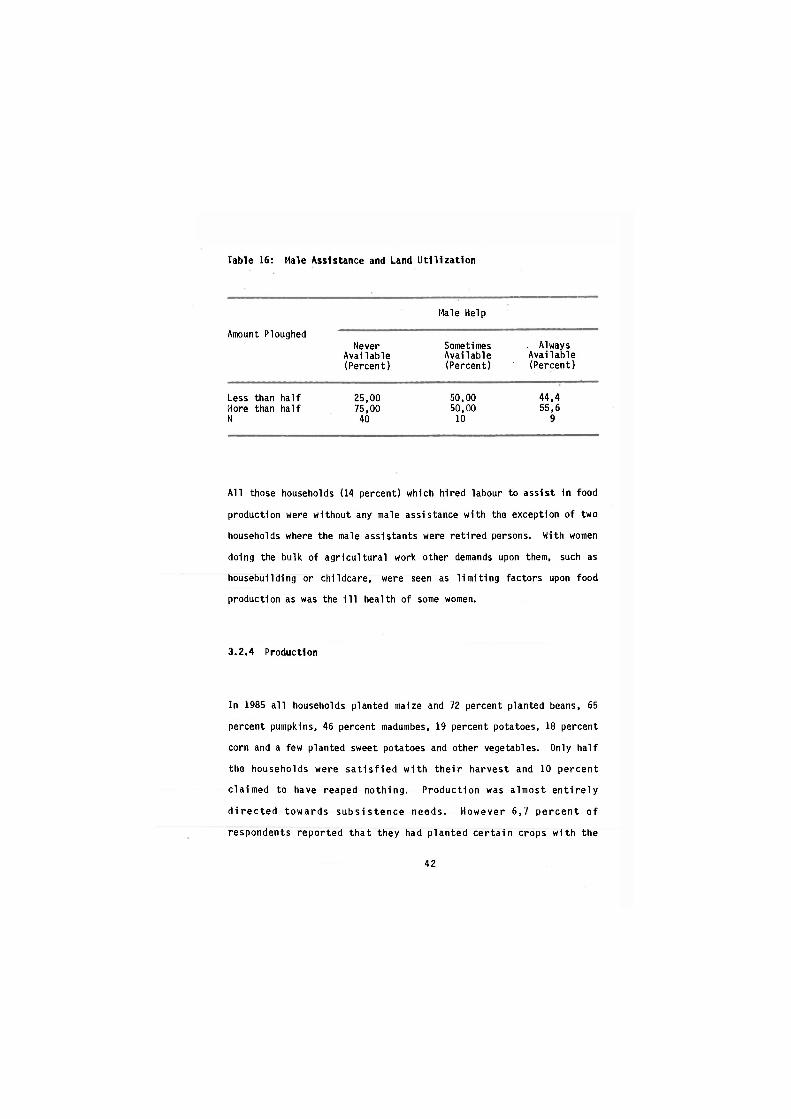
Table 16: Male Assistance and Land Utilization
Male Help
Amount Ploughed Never
Available (Percent)
Sometimes Always Available Available (Percent) (Percent)
Less than half More than half N
25,00 75,00 40
50,00 50,00 10
44,4 55,6
9
All those households (14 percent) which hired labour to assist in food
production were without any male assistance with the exception of two
households where the male assistants were retired persons. With women
doing the bulk of agricultural work other demands upon them, such as
housebuilding or childcare, were seen as limiting factors upon food
production as was the ill health of some women.
3.2.4 Production
In 1985 all households planted maize and 72 percent planted beans, 65
percent pumpkins, 46 percent madumbes, 19 percent potatoes, 18 percent
corn and a few planted sweet potatoes and other vegetables. Only half
the households were satisfied with their harvest and 10 percent
claimed to have reaped nothing. Production was almost entirely
directed towards subsistence needs. H o w e v e r 6,7 percent of
respondents reported that they had planted certain crops with the
42
intention of selling some of the produce. Although the average
landholding was too small to produce enough to meet the subsistence
requirements of the household, and although only 2,7 percent of
respondents produced more of one product than was in fact required by
their household, in the end 20 percent of households actually sold
some of their produce. They sold either because they produced an
excess, needed cash or simply because people asked them to. The total
income from crop sales for all households in 1985 was R1 432. In 1982
it had been R1 560. This represents a fall off of 30 percent in real
terms.
It was not possible for either survey to establish the exact costs of
production. However information concerning expenditure on wages, seed
and fertilizer was collected 1n 1985 and a value placed upon the
ploughing people did with their own oxen which had not been done in
1982. Wages paid to labour (which totalled R926), seldom exceeded R1
per day and labourers were sometimes paid in kind or worked for
nothing where there were no able-bodied persons 1n the household,
itost households used their own seed and very few bought any fertilizer
in the year preceding the resurvey. In total R1117 was spent on seed
and fertilizer. 27 percent of households carried manure into the
fields but it was not possible to value this, just as it was not
possible to value the labour of household members. The surveyed
households spent R1350 paying others to plough for them and the
ploughing they did using their own oxen was valued at R1612.68 (see
Appendix B).
Appendix B describes in detail how agricultural production was
44
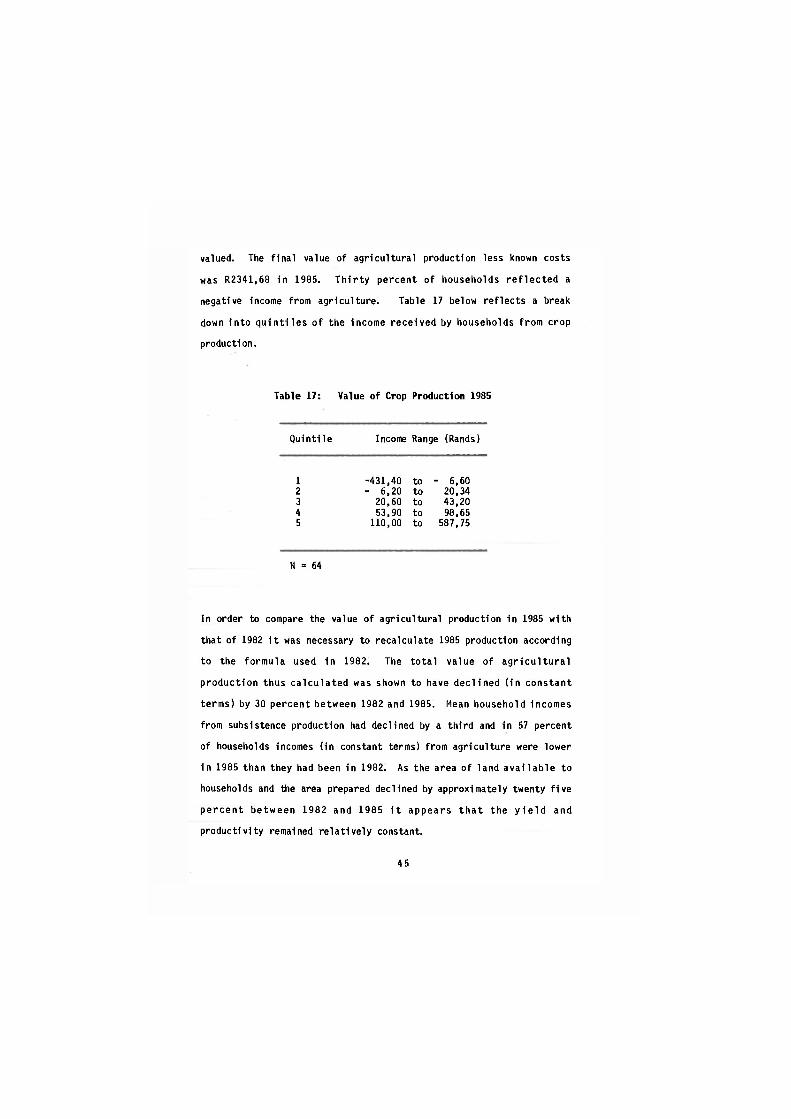
valued. The final value of agricultural production less known costs
was R2341.68 in 1985. Thirty percent of households reflected a
negative income from agriculture. Table 17 below reflects a break
down into quintlles of the Income received by households from crop
production.
Table 17: Value of Crop Production 1985
Quintile Income Range (Rands)
1 -431,40 to - 6,60 2 - 6,20 to 20,34 3 20,60 to 43,20 4 53,90 to 98,65 5 110,00 to 587,75
N = 64
In order to compare the value of agricultural production 1n 1985 with
that of 1982 it was necessary to recalculate 1985 production according
to the formula used in 1982. The total value of agricultural
production thus calculated was shown to have declined (in constant
terms) by 30 percent between 1982 and 1985. Mean household incomes
from subsistence production had declined by a third and in 57 percent
of households incomes (in constant terms) from agriculture were lower
in 1985 than they had been in 1982. As the area of land available to
households and the area prepared declined by approximately twenty five
percent b e t w e e n 1982 and 1985 it appears that the yield and
productivity remained relatively constant.
45
3.2.5 Gardens
The number of households with gardens (in addition to their fields or
lands) increased from 30 percent in 1982 to 50 percent in 1985. The
increase is probably explained by the better rains in 1984/5. These
gardens were either positioned close to the homestead on the hilltop
or in the valleys next to the streams. In view of the fact that only
15 percent were fenced this gave rise to an inherent problem - gardens
could either be close to the homestead where they could be protected
from unherded cattle, wild pigs and other animals or next to the
stream where they could be irrigated. The cost of fencing and the
labour required to make a fence of thorn branches prevented most
gardeners from protecting their planting. Community gardens, where
people through combining have been able to afford fencing and, indeed,
the purchase of seed and provision of irrigation, provide an answer to
the problem of animal damage. However the number of households with
community garden members had only increased from 2 in 1982 to 4 in
1985 and the gardens themselves were not nearly as productive in 1985
as they had been in 1982. It was not clear what had happened but
respondents stated that it had been so dry that people had become lazy
and that the extension officer, who had encouraged the gardens, was no
longer in the area.
Those who made use of their gardens (31,1 percent of respondents)
planted chiefly cabbages (92 percent) tomatoes (88 percent), onions
(48 percent), spinach (44 percent) and beans (37 percent) along with
small plantings of carrots, potatoes, bananas and avocados.
46

3.2.6 Conclusion
Apart from the Innovation of ploughing a very small percentage of the
land by tractor In 1985 there appeared no improvements or even changes
in agricultural practice between 1982 and 1985. The same factors as
were evident, in 1982 continued to Inhibit production and output
continued to decline despite the considerably higher rainfall in 1985.
Although current land holdings are too small to allow for subsistence
1t would seem that the Immediate cause of the surveyed community's
inability to subsist off local production was not a shortage of land
as was Indicated by the fact that at the time of both surveys almost a
third of respondents had ploughed less than half their land the
previous season. The inadequacy of land allocations and an
accompanying absence of infrastructure - particularly marketing
facilities - may have originally driven many to become migrants in
order to provide their dependents with certain basic needs but In the
short term 1t 1s labour shortages, the absence of capital, expertise
and markets and the means to plough that limit production. As many of
these deficiencies flow from the migratory labour system production
problems are perpetuated.
The only successful and relatively extensive farmer surveyed was an
Induna who had access to the largest (over 4 hectares), flattest and
most productive piece of land. He was the only person who made
substantial use of fertilizer and the only person who hired labour on
a regular basis.
Aside from traction power and labour shortages or the inability to pay
47
for them, respondents blamed drought or late rains for their failure
to complete ploughing or to reap a satisfactory crop. Threat of
damage by wild animals or others' cattle also led some to consider
the risk of planting too great. Scorching heat and hail were also
blamed for crop failure. The destruction of crops by heat and hail
and the commonly occurring rotting of pumpkins and melons all point to
winter as a more successful growing period. However, before crops
could be grown in winter, some form of irrigation would have to be
instituted and arrangements made to herd cattle.
Uncontrolled cattle have always created problems for crop producers
but normally only in the winter when unherded. Today with most men
away as migrants and more and more children attending school, cattle
may be unherded, and thus constitute a problem, throughout the year.
Farmers in the area are clearly unable to afford the cost of fencing
their lands and stand to suffer serious losses through cattle damage.
Here one sees the combined impact of the tradition of leaving cattle
unherded in winter, the problems caused by a shortage of labour and
the inability to cope with both due to a lack of capital.
The same restraints (i.e. labour and capital shortages) surface again
and again in different combinations and guises. Lack of capital means
that farmers do not use certified seed or fertilizer but this is also
the consequence of inadequate expert advice. Even if advice and
capital were available the necessary transport infrastructure is
lacking to bring the fertilizer into the area. The absence of the
transport infrastructure also prevents the successful marketing of any
48
excess produce or cash crops. In short, the risks of agricultural
endeavour far outweigh the potential reward.
Despite the extreme gradients of the area and Its distance from
markets there Is the agricultural potential both to I m p r o v e
subsistence levels and produce certain cash crops (e.g. tea and
timber) in the survey area. This potential will not be realized while
the State views the area as a human dormitory and accordingly falls to
supply the necessary Infrastructure and support systems for
agricultural development. Moreover, before any developments are
undertaken or even proposed in the survey area, it should be clearly
understood that agriculture does not have the potential to support the
entire community. It could never become the major source of income.
This should be borne In mind before decisions are taken to spend
public funds In the support of agriculture or which Impact on the
wider community - those who do not stand to benefit from agricultural
development.
As Is made clear in Chapter 5 the fortunes of the survey area are
almost entirely externally determined In the core economy. Decisions
relating to agriculture in the area cannot be taken in Isolation. The
success or failure of agricultural projects there and, m o r e
Importantly, the effects they may have upon the community will In a
very large m e a s u r e be d e t e r m i n e d by the area's s u b s e r v i e n t
relationship to the core economy.
49

3.3 Stockholding
The resurvey found that cattle continued to play an Important role.
However, the wide Incidence of cattle ownership and the Importance
attached to stockholding should not be seen as a reflection of their
economic value to the community - something which, 1n fact, often did
not extend beyond their value as draught animals.
3.3.1 Herd Breakdown
In 1985 two thirds of surveyed households had cattle. This represents
a slight decline from the 70 percent of households which had cattle In
1982. The average herd, which consisted of 7,9 1n 1982 consisted of
7,5 head in 1985. This means that although a higher percentage of
surveyed households owned cattle than is true of all KwaZulu
households, the herds were in general a little smaller than the
average KwaZulu herd of 10 head (Erskine, 1982).
In 1985 30 percent of cattleholders had a bull, 94 percent cows, 50
percent oxen, 72 percent heifers, 56 percent young bulls and 60
percent calves. With only one third of herds having a bull and a mere
28 percent a full span of "oxen"1 these herds were not well structured
commercially.
1. Twenty two percent had half a span of oxen. "Oxen" spans frequently contained cows, young bulls etc.
50
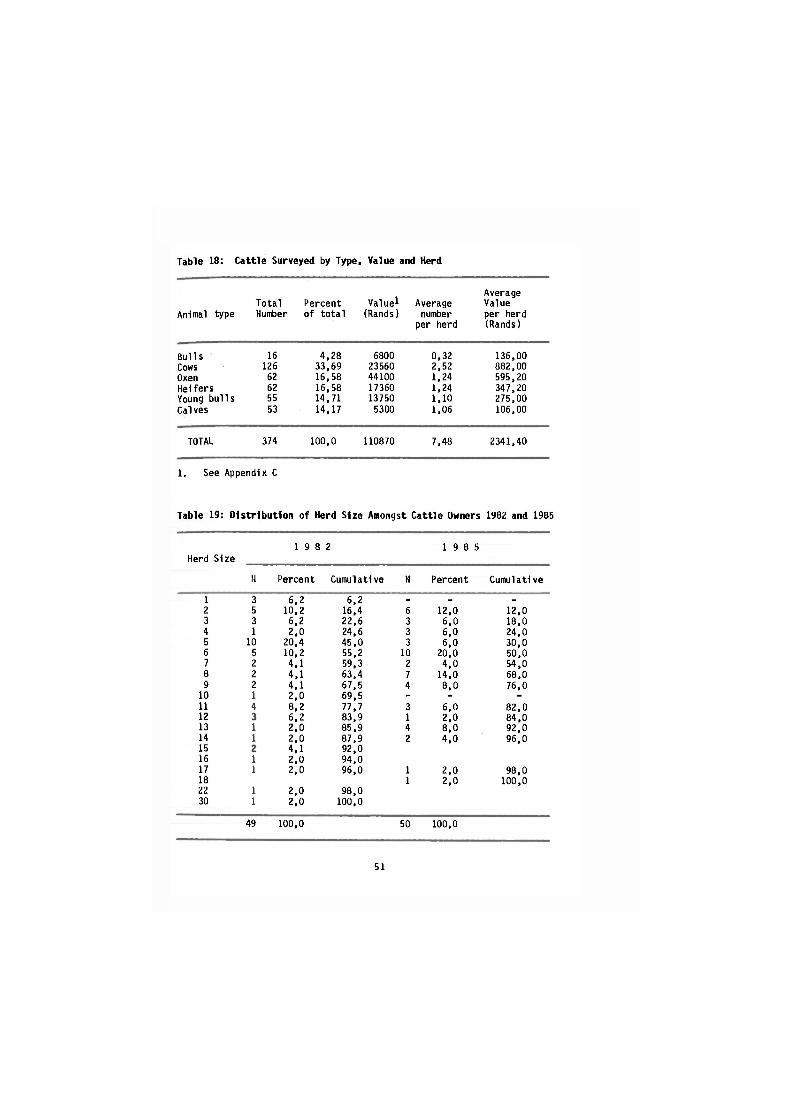
Table 18: Cattle Surveyed by Type, Value and Herd
Animal type Total Number
Percent of total
Value1
(Rands) Average number
per herd
Average Value per herd (Rands)
Bulls 16 4,28 6800 0,32 136,00 Cows 126 33,69 23560 2,52 882,00 Oxen 62 16,58 44100 1,24 595,20 Heifers 62 16,58 17360 1,24 347,20 Young bulls 55 14,71 13750 1,10 275,00 Calves 53 14,17 5300 1,06 106,00
TOTAL 374 100,0 110870 7,48 2341,40
1. See Appendix C
Table 19: Distribution of Herd Size Amongst Cattle Owners 1982 and 1985
1 9 8 2 1 9 8 5 Herd Size
M Percent Cumulative N Percent Cumulative
1 3 6.2 6,2 - - -
2 5 10,2 16,4 6 12,0 12,0 3 3 6.2 22,6 3 6,0 18,0 4 1 2.0 24,6 3 6,0 24,0 5 10 20,4 45,0 3 6,0 30,0 6 5 10,2 55,2 10 20,0 50,0 7 2 4,1 59,3 2 4,0 54,0 8 2 4,1 63,4 7 14,0 68,0 9 2 4,1 67,5 4 8,0 76,0
10 1 2,0 69,5 - - -
11 4 8,2 77,7 3 6,0 82,0 12 6,2 83,9 1 2,0 84,0 13 1 2,0 85,9 4 8,0 92,0 14 1 2,0 87,9 2 4,0 96,0 15 4,1 92,0 16 1 2,0 94,0 17 1 2,0 96,0 1 2,0 98,0 18 1 2,0 100,0 22 1 2,0 98,0 30 1 2,0 100,0
49 100,0 50 100,0
51

Table 18 above gives a breakdown by type, value and herd of the
cattle surveyed in 1985 and Table 19 a comparison of the distribution
of herd sizes among cattle owners in 1982 and 1985.
3.3.2 Births, Deaths and Take Off Rates
During the twelve months preceding the resurvey 71 calves were born
into the surveyed herds. At the time of the resurvey 53 had survived
giving a death rate among calves of 25 percent. As some of the calves
had only recently been born and may have died before they were a year
old this is probably an underestimate of the first year death rate.
Among all the cattle surveyed the death rate was 15,19 percent and
among all cattle except calves, 13,24 percent. At the time of the
survey there were 126 cows. Assuming a death rate of 13,24 percent,
twelve months previously there would have been 143 cows. A total of
71 calves born from these 143 cows gives a calving percentage of 49,65
percent for all the cows surveyed.
On average 33,69 percent of each herd consisted of breeding stock
(cows) and 42,06 percent of the cows in each herd had a calf surviving
at the time of the survey. Table 20 indicates the range in
percentages of cows in each herd which had calves alive at the time of
the survey. In 38 percent of the herds there were no calves alive at
the time of the survey and in more than half the herds only a third of
the cows had a calf.
In a commercial herd a calving percentage of 42,06 percent would be
considered unacceptably low. A comparison with the figures for the
52
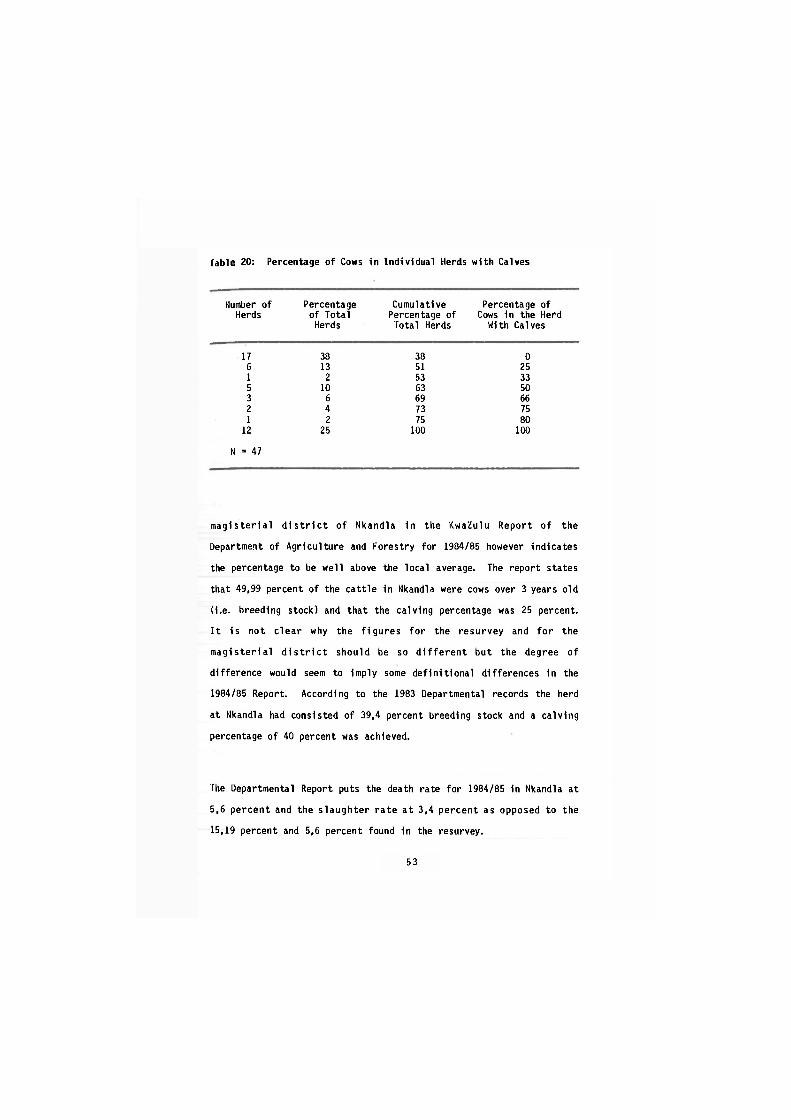
Table 20: Percentage of Cows in Individual Herds with Calves
Number of Percentage Cumulative Percentage of Herds of Total Percentage of Cows in the Herd
Herds Total Herds With Calves
17 38 38 0 6 13 51 25 1 2 53 33 5 10 63 50 3 6 69 66 2 4 73 75 1 2 75 80
12 25 100 100
N = 47
magisterial district of Nkandla in the KwaZulu Report of the
Department of Agriculture and Forestry for 1984/85 however indicates
the percentage to be well above the local average. The report states
that 49,99 percent of the cattle in Nkandla were cows over 3 years old
(i.e. breeding stock) and that the calving percentage was 25 percent.
It is not clear why the figures for the resurvey and for the
magisterial district should be so different but the degree of
difference would seem to imply some definitional differences in the
1984/85 Report. According to the 1983 Departmental records the herd
at Nkandla had consisted of 39,4 percent breeding stock and a calving
percentage of 40 percent was achieved.
The Departmental Report puts the death rate for 1984/85 in Nkandla at
5,6 percent and the slaughter rate at 3,4 percent as opposed to the
15,19 percent and 5,6 percent found in the resurvey.
53
The sales rate among the surveyed cattle was 2,3 percent giving a take
off rate of 7,9 percent (5,6 percent slaughtered, 2,3 percent sales).
As was the case in 1982 lobola accounted for a third of the changes in
the makeup of individual herds resulting from births, deaths, sales,
slaughter and lobola.
The death rate for cattle appears to fluctuate a great deal over time
and to be chiefly dictated by weather patterns. Valid comparisons can
therefore only be made with figures from the same area and period.
Erskine (1982) states that the average death rate 1n KwaZulu Is
approximately 10 percent per annum which means that the twelve months
preceding the resurvey show an above averate rate. In the 1982 survey
the death rate was 6,73 percent but a lower rate was to be expected 1n
the years immediately following the very high death rate in 1980/81
which resulted from the 1980 drought.
During 1984/85 the surveyed herd decreased by 5,6 percent in number.
There was an excess of births over deaths of 1,6 percent but the
numbers sold, slaughtered and transferred out as lobola exceeded those
purchased and received as lobola. Sales although showing an almost
300 percent increase over 1982 were still insignificant and only
occurred where money was needed because of illness or a loss of
employment in the household. As in 1982 many of the cattle purchased
were purchased specifically for the purpose of slaughter. Where there
was a need for an animal to be slaughtered households which had the
means to purchase one appeared to prefer to do so, rather than
54
slaughter one of their own animals even where theirs were of a lesser
economic value or potential thah that purchased.
3.3.3 Changes In Herd Value
In order to comment upon the commercial value of cattle to the
surveyed community it was necessary to ascribe a particular value to
each animal. The basis on which this was done is discussed in
Appendix C. Using these figures, the herd at the time of resurvey was
worth R110 870. Valuing individual animals at the same prices twelve
months previously the herd's value had been R119 550,37 in constant
price terms. Overall the number of cattle held by the surveyed
households had decreased by 24.
In the severe drought of 1980 many households had lost cattle. By
1982 at the time of the first survey some were re-establishing their
herds and 70 percent of the households surveyed had some cattle. By
1984 the percentage of households holding cattle had risen to 73,3
percent but there was a decline during the following twelve months and
at the time of re-survey only 56,7 percent of households still had
cattle.
There was little change 1n the average herd size - 7,88 in 1982, 7,24
in 1984 and 7,48 in 1985 - although the number held declined by 22
(5,7 percent) between 1982 and 1985 and by 24 (6,7 percent) between
1984 and 1985. The average change in herd size during 1984/85 was 2
head but one herd decreased by 15 and another increased by 9. Thirty
55
six percent of herds increased in size, 29,1 percent remained
unchanged and 34,5 percent decreased in size. The changes occurring
between 1982 and 1985 were very similar. During the three years there
was no change in the stockholding of 25,7 percent of households.
Stockholdings increased in 35,4 percent of households and decreased in
37,9 percent. The average change in herd size was 3,5 percent with
the largest decrease being 13 and the largest increase, 10 animals.-
Table 21 below indicates the changes which took place in the total
herd during the twelve months preceding the survey. The table is
based on the data giving a herd breakdown at the time of the resurvey.
The number of births, deaths, sales etc occurring during the year have
been used to calculate herd breakdowns twelve months previously.
Where it was not recorded what type of animal died etc, deaths etc
were attributed amongst the different types of animal having taken
into account the proportion of the herd that that type of animal
constituted and the comparative likelihood of that type of animal
dying, being transferred as lobola, etc. During the 12 months
preceding the survey, in 55,5 percent of herds calves were born, in
18,2 percent animals were purchased and 28,2 percent received cattle
under lobola transactions. During the same period cattle were sold
from 10,1 percent of herds, died in 50,9 percent and were transferred
from 28,2 percent under lobola transactions.
Apart from recording changes in herd composition, Table 21 reflects
the fact that the 303 head which were held throughout the period grew
or matured and accordingly appreciated in value. Thus, for example,
calves became heifers and heifers became cows. The table reflects
their enhanced values.
56
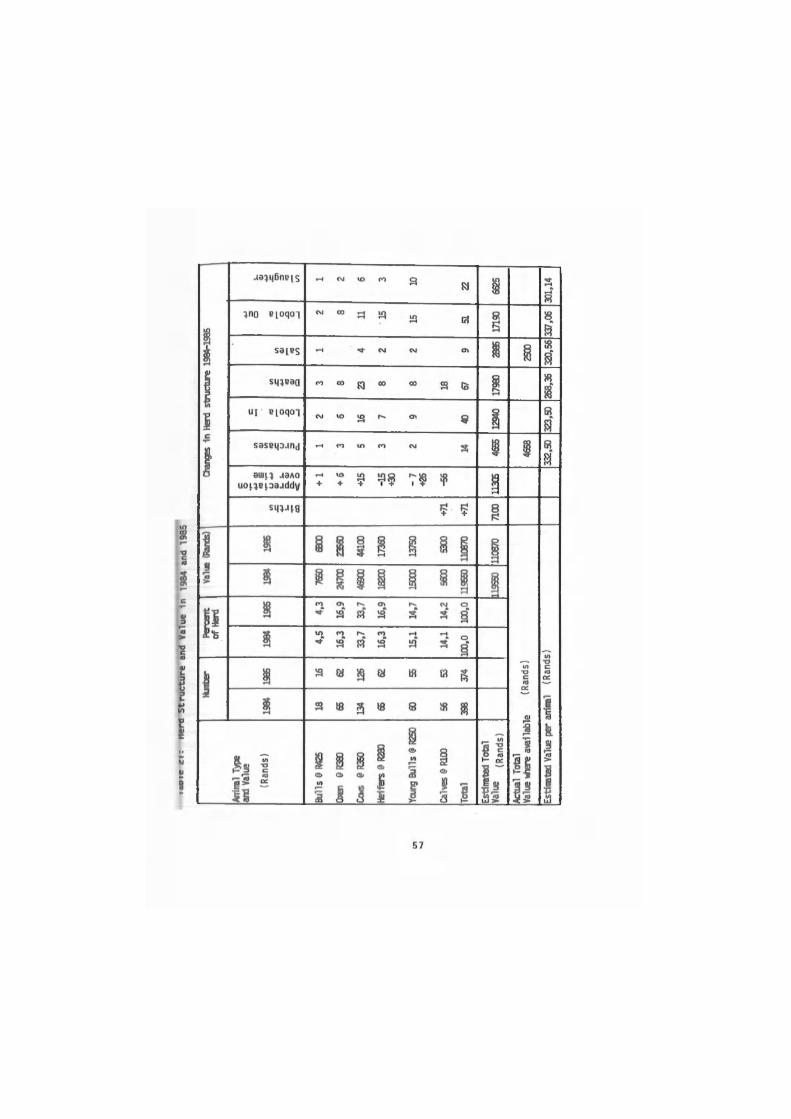
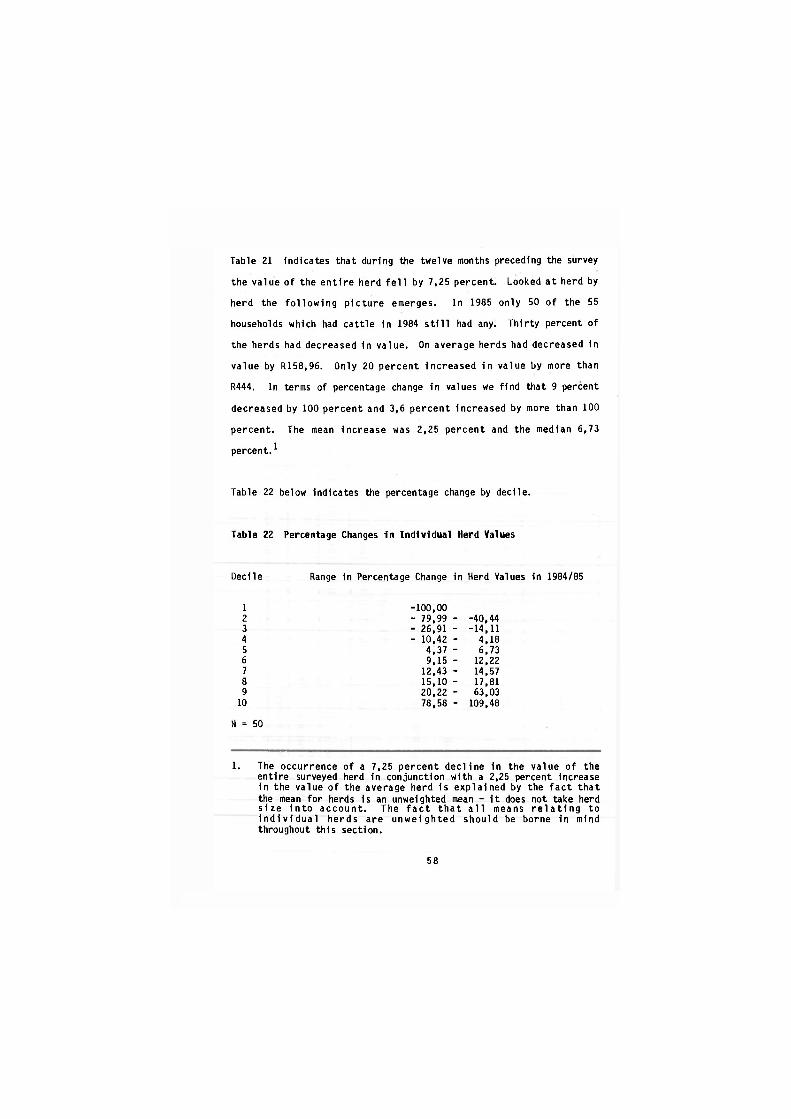
Table 21 indicates that during the twelve months preceding the survey
the value of the entire herd fell by 7,25 percent. Looked at herd by
herd the following picture emerges. In 1985 only 50 of the 55
households which had cattle in 1984 still had any. Thirty percent of
the herds had decreased in value. On average herds had decreased in
value by R158.96. Only 20 percent increased in value by more than
R444. In terms of percentage change in values we find that 9 percent
decreased by 100 percent and 3,6 percent increased by more than 100
percent. The mean increase was 2,25 percent and the median 6,73
percent.1
Table 22 below indicates the percentage change by decile.
Table 22 Percentage Changes In Individual Herd Values
Decile Range in Percentage Change in Herd Values 1n 1984/85
1 -100,00 2 - 79,99 - -40,44 3 - 26,91 - -14,11 4 - 10,42 - 4,18 5 4,37 - 6,73 6 9,15 - 12,22 7 12,43 - 14,57 8 15,10 - 17,81 9 20,22 - 63,03
10 78,58 - 109,48
N = 50
1. The occurrence of a 7,25 percent decline in the value of the entire surveyed herd in conjunction with a 2,25 percent increase in the value of the average herd is explained by the fact that the mean for herds is an unweighted mean - it does not take herd size into account. The fact that all means relating to Individual herds are u n w e i g h t e d should be borne in mind throughout this section.
58
The method of calculating herd appreciation is explained in Appendix C
and when considering the increases/decreases in herd value it should
be borne in mind that the appreciation through physical growth
(maturation) alone on a herd of 7,24 head (the average cattle holding
in 1984) would have amounted to R270.12. Seventy percent of cattle
owners' herds appreciated by less than this sum. Although it is true
that beef production as an economic activity is dependent on the sale
or consumption of assets, where this results in an overall decline in
the value of assets or an increase which is less than the value placed
upon the natural maturation of the asset, the long term prospects for
it as an economic activity cannot be good.
3.3.4 Returns on Stockholding
In order to assess the commercial value of stockholding it was
necessary to establish not only whether herds were Increasing or
decreasing in value but also what levels of return stockholders were
realizing on their investments. Apart from placing a value on the
appreciation of existing herds, and adjusting herd values to allow for
acquisitions or losses, a value had to be placed upon the current
disposable income realized as a consequence of stockholding. Cattle
owners used their animals to plough for themselves and others and took
milk from cows; they also received income on the sale of animals and
benefitted from the consumption of meat and use or sale of the hide on
the death or slaughter of an animal. In Appendix B the methods used
to evaluate current disposable i n c o m e from s t o c k h o l d i n g a r e
explained. The majority of the subsistence income realized by the
59
surveyed community consisted of the current disposable income realized
from stockholding (see 5.2.3). Individual households received
substantial incomes from this source. It will be shown that most of
this income was achieved through the consumption or sale of an asset
as is inevitable in the case of beef production. However, where this
occurs at a rate which exceeds replacement this implies declining
returns in the future and of course a general decrease in herd value.
3.3.4.1 Calculating Returns
By adding the value of herd appreciation, the value of calves born and
the current disposable income realised from stockholding together and
relating the total to the value of individual herds or the total herd
surveyed, a return on stockholding might be calculated but this would
make no allowance for the facts that not all calves lived and that
much of current disposable income was achieved at the cost of the loss
of a productive asset. A more realistic assessment of the value of
stockholding is made by subtracting the 1984 value of herds from their
1985 value and then adding current disposable income and subtracting
the cost of purchases. The sum thus calculated may be considered a
net return on stockholding, and Table 23 below, which demonstrates
net returns on stockholding, indicates that 23,6 percent of
stockholders had negative net returns. The mean return was R168.37
and the median R215.45. The methods of calculation used are described
in greater detail in Appendix C.
A percentage return was calculated by relating net returns to the 1984
60

value of herds. Percentage returns on individual herds ranged from
-73,41 percent to 233,51 percent with the median being 14,23 percent
and the mean 17,87 percent. The percentage return for the surveyed
herd considered as a whole was only 7,24 percent.
Table 23: Net Return on StockHoldlng (Households holding cattle in
1984 only)
Value in Rands N Quintile
-3484,87 - -106 36 11 1
- 106,36 - 111 93 11 2
137,31 - 253 28 11 3
254,81 - 708 12 11 4
749,91 - 2570 43 11 5
55
3.3.4.2 The Cost of Returns
When reference is made to net rate of return on stockholding and the
percentage change in herd value in those households which achieved the
highest current disposable incomes from stockholding it becomes clear
that much of current income is being achieved at the price of a
capital loss.
Table 24 below gives details for those households which achieved
61
current disposable incomes from stockholding which were above the
average. One third of cattle holders achieved such incomes and their
incomes accounted for 72 percent of the current disposable income
achieved from stockholding.
These stockholders achieved an average percentage return on stock-
holding of 6,02 percent and an average percentage change in herd value
of -24,56 percent. In order to achieve above average current incomes
from stockholding they were consuming capital and consuming it faster
than the average herd owner who achieved a percentage return of 17,87
percent and whose herd increased in value by 2,25 percent. Sixty six
percent of the herds which produced above average current disposable
incomes decreased in value whereas only 38,7 percent of all herds did.
Superficially it may appear that cattle owners are achieving a
reasonable return on their herds but a closer look at the sources of
current disposal income from cattle shows that less than 10 percent of
this income is achieved without consuming or decreasing the capital
from which it flows - i.e. that which is realized from ploughing (See
Table 38).
The fact that current income is being realized at a capital cost is
confirmed by comparing the 1985 stockholding of those households which
achieved above average incomes from stockholding in 1982 with their
1982 stockholding. As in 1985, in 1982 one third of stockowners
achieved above average current disposable incomes from stockholding.
The stockholdings in 75 percent of these housholds decreased between
1982 and 1985 with the average herd decreasing from 10,3 head to 7,3
62
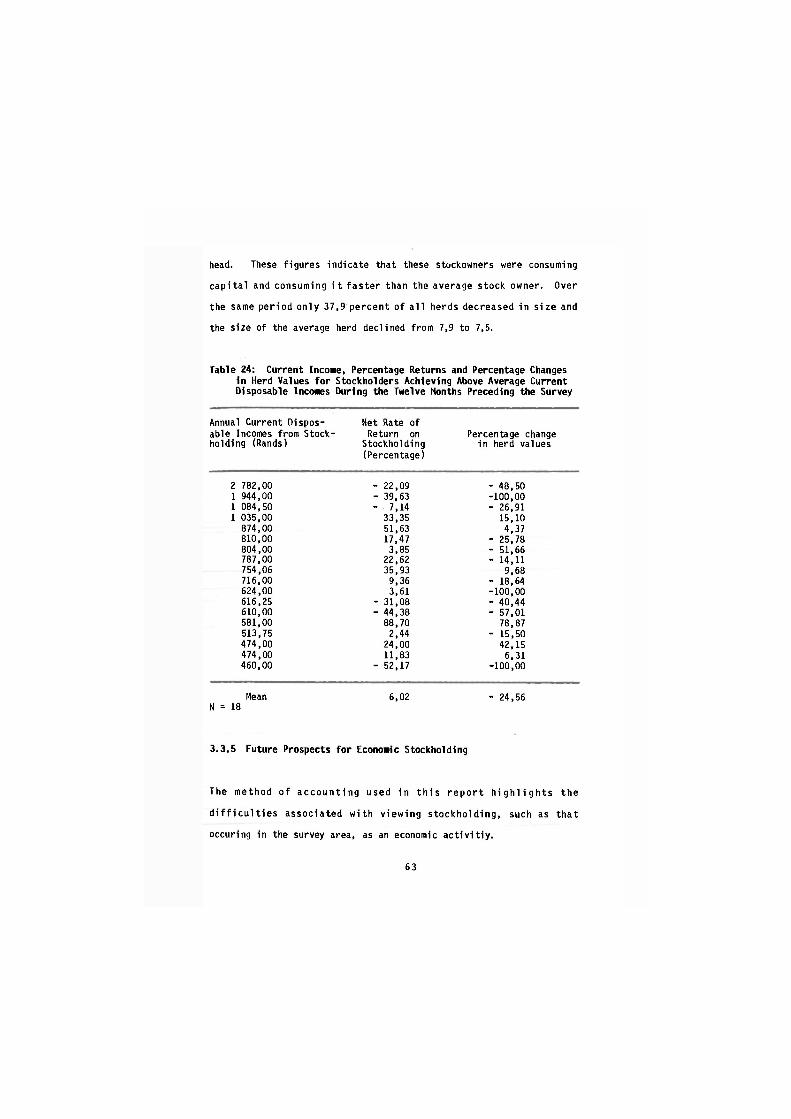
head. These figures indicate that these stockowners were consuming
capital and consuming it faster than the average stock owner. Over
the same period only 37,9 percent of all herds decreased in size and
the size of the average herd declined from 7,9 to 7,5.
Table 24: Current Income, Percentage Returns and Percentage Changes in Herd Values for Stockholders Achieving Above Average Current Disposable Incones During the Twelve Months Preceding the Survey
Annual Current Dispos-able Incomes from Stock-holding (Rands)
Net Rate of Return on
Stockholding (Percentage)
Percentage change in herd values
2 782,00 - 22,09 - 48,50 1 944,00 - 39,63 -100,00 1 084,50 - 7,14 - 26,91 1 035,00 33,35 15,10
874,00 51,63 4,37 810,00 17,47 - 25,78 804,00 3,85 - 51,66 787,00 22,62 - 14,11 754,06 35,93 9,68 716,00 9,36 - 18,64 624,00 3,61 -100,00 616,25 - 31,08 - 40,44 610,00 - 44,38 - 57,01 581,00 88,70 78,87 513,75 2,44 - 15,50 474,00 24,00 42,15 474,00 11,83 6,31 460,00 - 52,17 -100,00
Mean N = 18
6,02 - 24,56
3.3.5 Future Prospects for Economic Stockholding
The m e t h o d of accounting used in this report highlights the
difficulties associated with viewing stockholding, such as that
occuring in the survey area, as an economic actlvitiy.
63
The cattle owners themselves do not view cattle primarily in economic
terms and therefore do not adopt the breeding or management practices
of a commercial farmer. Although in recent years there has been a
growing acceptance of the fact that traditional cattle owners do not
view their stock as a source of income it is still widely considered
that as a method of saving stockholding has proved most effective.
This belief is not supported by this study which shows a mean annual
increase in herd value of only 2,25 percent.
As long as the reasons for stockholding remain primarily "non-
economic" cattle owners should not be expected to adopt practices
which are essentially economic. However as the capacity to hold stock
for non-economic reasons seems certain to decline, there would seem to
be some point in establishng those factors which currently act as
constraints on stockholding as a source of income, and in determining
what changes might be introduced to ensure not only an increased
income from stockholding but also that stockholding might prove an
effective way to save.
Existing herds are too small to be economic. One man cares for less
than eight animals on average. Many herds are without bulls, and none
of the bulls have sufficient cows. The size of herds will either have
to be increased (and therefore the number of herds decreased) or
herds will have to be run co-operatively. 1 Hon productive animals
1. The use of artifical insemination by individual stockholders would be difficult if they were unable to keep their cattle apart from those of other stockholders.
64
(infertile cows, oxen too weak to plough etc.) will have to be culled
and productive ones spared from unnecessary slaughter or sale.
If the veld in the survey area were allowed to recover and improved
management practices followed it could probably carry double the
number of cattle it is struggling to carry at present. If the quality
of animals were improved, the structure (bull:cow ratio) of herds
rationalized, fertility rates increased, death rates decreased and
herd health improved the numbers would automatically increase. These
improvements would have to be accompanied by an increase in the take
off rate (sales and slaughter) if they were not merely to result in
restarting the vicious cycle of overstocking, veld and herd
deterioration etc. This in turn would be impossible without the
introduction of reliable and regular marketing mechanisms. The
changes in attitude amongst cattleowners required to achieve these
improvements would be wide ranging and fundamental.1
Perhaps the most difficult requirement of the changes necessary is
that all these changes will have to be made by all cattleholders and
made simultaneously. The communal tenure of the grazing land and the
fact that the cattle all run together make this essential. This is
made all the more difficult by the fact that although there is
undoubted potential for increased income and saving from stockholding
the capacity, even under ideal conditions, to do this for the entire
local population is definitely not there.
1. Traditional attitudes to stockholding and the difficulties associated with changing them either individually or collectively are discussed in Ardington (1984, p.108).
65
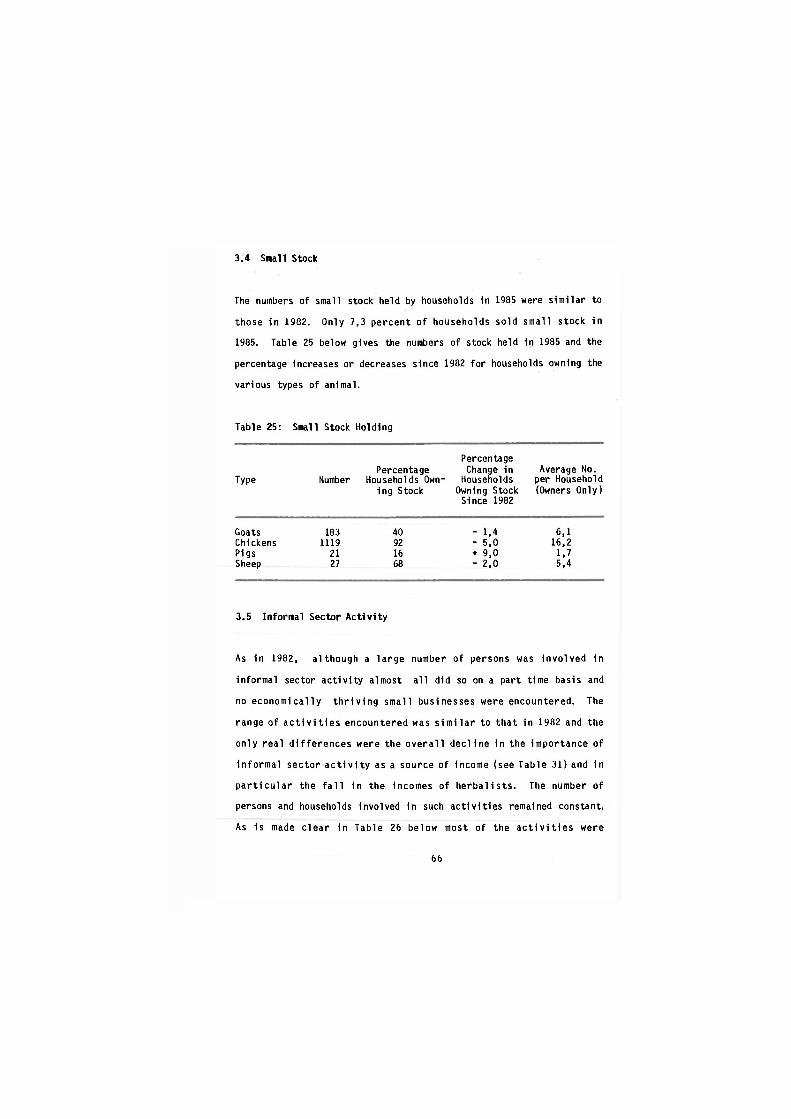
3.4 Small Stock
The numbers of small stock held by households in 1985 were similar to
those in 1982. Only 7,3 percent of households sold small stock in
1985. Table 25 below gives the numbers of stock held in 1985 and the
percentage increases or decreases since 1982 for households owning the
various types of animal.
Table 25: Small Stock Holding
Percentage Percentage Change in Average No.
Type Number Households Own- Households per Household ing Stock Owning Stock (Owners Only)
Since 1982
Goats 183 40 - 1,4 6,1 Chickens 1119 92 - 5,0 16,2 Pigs 21 16 + 9,0 1,7 Sheep 27 68 - 2,0 5,4
3.5 Informal Sector Activity
As in 1982, although a large number of persons was involved in
informal sector activity almost all did so on a part time basis and
no economically thriving small businesses were encountered. The
range of activities encountered was similar to that in 1982 and the
only real differences were the overall decline in the importance of
informal sector activity as a source of income (see Table 31) and in
particular the fall in the incomes of herbalists. The number of
persons and households involved in such activities remained constant.
As is made clear in Table 26 below most of the activities were
66

undertaken to provide the goods or services for the household members themselves and not with the intention of selling the product or service. Seventy five individuals made some contribution to household income from their informal sector activities. The amounts ranged from R2 to R1 165 per annum. The mean was R94 and the median R32. Only 8 persons made contributions larger than R200.
The numbers involved in each activity appear inversely related to the
economic rewards to be obtained. Although relatively large numbers
were Involved in grass cutting and grasswork the returns that were
achieved were negligible. The average price realised for a bunch of
thatching grass was 40 cents. Operators claimed to cut between two
and six bundles in a day. Grass bowls sold for approximatly Rl, hanks
of rope for R2 and icansi mats R3 each. The prices obtained locally
for goods and services were extremely low and did not act as an
incentive to producers or operators.
Table 26: Informal Sector Activities
Activity Percent of Households with Members Partici-pating in Activity
Percent Participating with intention of
marketing
Grasscutting 49,0 14,7 Grasswork 44,0 25,3 Thatching 37,3 8,0 Housebuilding 21,3 5,3 Sewing, knitting etc 16,0 9,3 Herbalism 9,3 9,3 Hawking 6,7 6,7 Pottery 6,7 4,0 Trading 5,3 5,3 Grinding 1,3 1,3
67
Although one surveyed household had contracted to pay someone R300 to
build a cattle kraal the average prices received by some of those
surveyed for performing tasks associated with building a house which
are listed below, do not make the tasks involved attractive.
Cut and supply 15 poles • R15 Cutting only (poles) = R 3 Erection of frame = R30 Supply Thatching grass = R15 Thatching = R28
Generally tasks were performed or goods produced in response to a
particular request. The only opportunity for general marketing
occurred at the bi-monthly pension day. People otherwise had to hawk
goods in order to conclude a sale. The costs involved in travelling
to obtain raw materials and travelling to hawk frequently made the
operation uneconomic although few took travelling expenses into
account when calculating prices. It was the exception rather than the
rule where the operator made a profit after deducting all expenses.
Although higher prices could be obtained where goods were sold out of
the area (eg. in Kwailashu) the difficulties and expense of
transporting the goods generally made this impossible. Lack of
experience in trading, particularly with regard to costing, frequently
resulted in small businesses being operated at a loss - although
generally the operator seemed unaware that this was the case.
The range of skills in the area was limited and those that there were
tended to be in over-supply. Thus some claimed that although they
could thatch, for example, no one had asked them to do so that year
and others that their attempts at hawking were unsuccessful because
68
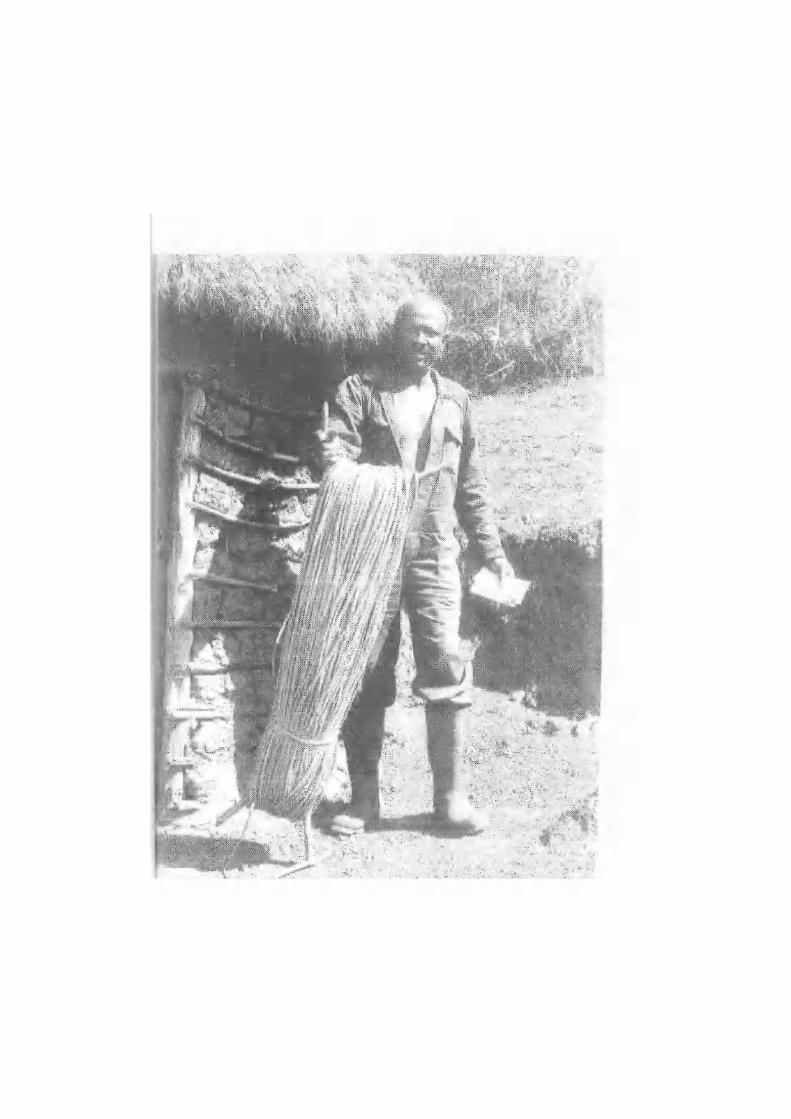
too many others were doing the same thing.
The problem of acquiring new skills in an isolated area frustrated
some of those surveyed in their attempts to generate income. There
were a few households which had sewing machines but none was fully
utilized. None of the owners had ever had the opportunity of learning
to operate a machine properly. There were others who expressed a
desire to raise chickens but did not know how to go about it.
The woman who conducted by far the most profitable operation was
raising day old chicks. She had watched a relative raise chicks
elsewhere but required considerable Initiative to obtain chicks by
mail order which were eventually delivered by railway bus. The food
she fetched bag by bag from Eshowe (50 km away) having to buy a bus
ticket not only for herself but also for the bag!
Apart from oxen, ploughs and a couple of sewing machines no Income
generating capital equipment was found in any of the surveyed
households.
A lack of operating capital often prevented people from getting
involved in any type of informal sector activity and some businesses
which had appeared successful in 1982 were found to have collapsed in
1985 because the source of capital had dried up. One woman's husband
(who used to buy her wool) had died and another had had to use all her
capital on hospital fees. In some cases where capital was available,
materials were 1n short supply or difficult to obtain without
travelling long distances which made the operation uneconomic.
70
Certain women who visited their migrant husbands in Durban from time
to time related how this gave them access to waste materials they
would otherwise have been unable to obtain. Others (including a
number of herbalists) explained how ill health and old age prevented
their obtaining the raw materials they needed.
Competing claims for labour limit the input into the informal sector.
Most operators are women who have agricultural, housekeeping,
housebuilding and childrearing tasks, which demand much of their time,
to perform. Where there are no others in the household to share these
responsibilities informal sector activities have to be foregone.
There was little evidence of any plan to make use of such activities
to provide a regular source of cash income. Whether it was cattle,
goats, pigs, chickens, handwork or grasswork that was being sold, the
transaction was generally initiated by the buyer and agreed to by the
seller only because he was in dire need at the time. It was
frequently concluded at a price which bore little relation to the
costs incurred and did not encourage the seller to repeat the
transaction unless unavoidable. For example the average price
realised for cattle sold was R170 and for cattle bought R333.
3.6 Eaployaent and Uneoploynent
One of the reasons for choosing the area surveyed was its degree of
remoteness from the modern core economy. It offered no employment
71
opportunities not normally found in a rural area. Moreover, the
transport available to Eshowe (50 kilometres) and Nkandla (30
kilometres) made it impossible for people to commute to these centres
daily so that if one wished to obtain employment, the choice was
between what employment there was in the area or migration out of it.
There are very few opportunities for local wage employment in the
average rural area - those that there are tend to be restricted to
people with some education with the result that teachers, agricultural
extension officers, priests, nurses and storekeepers 1n rural areas
all tend to be immigrants into the area rather than local people.
Table 27 below indicates the percentage of households containing
people participating in various types of employment at the time of
both surveys. It should be read In conjunction with fable 32 which
relates the occupations of the 15 - 60 age group. Extremely limited
local opportunities explain the high mlgrancy rate. Sixty two percent
of migrants were employed In Durban. Forty four percent were employed
in service industries, 20,8 percent in agriculture, 15,8 percent in
manufacturing, 9,6 percent 1n construction, 5,0 percent in mining and
4,6 percent 1n commerce reflecting the low average educational levels
of the population. The chances of obtaining casual employment in the
area were limited and primarily restricted to agriculture.
Table 27 shows the percentage of households containing a migrant to
have decreased slightly between 1982 and 1985 which was to be expected
owing to the increase in the percentage of households with unemployed
72
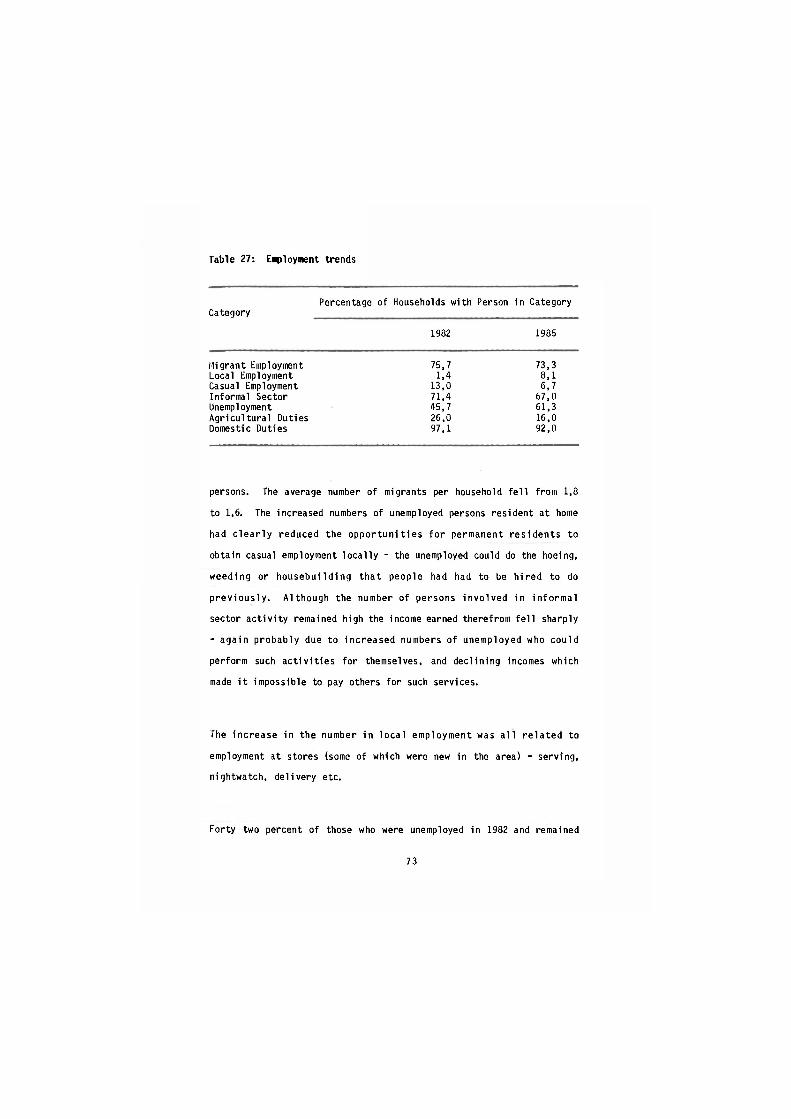
Table 27: Employment trends
Percentage of Households with Person in Category Category
1982 1985
Migrant Employment 75,7 73,3 Local Employment 1,4 8,1 Casual Employment 13,0 6,7 Informal Sector 71,4 67,0 Unemployment 45,7 61,3 Agricultural Duties 26,0 16,0 Domestic Duties 97,1 92,0
persons. The average number of migrants per household fell from 1,8
to 1,6. The increased numbers of unemployed persons resident at home
had clearly reduced the opportunities for permanent residents to
obtain casual employment locally - the unemployed could do the hoeing,
weeding or housebuilding that people had had to be hired to do
previously. Although the number of persons involved in informal
sector activity remained high the income earned therefrom fell sharply
- again probably due to increased numbers of unemployed who could
perform such activities for themselves, and declining incomes which
made it impossible to pay others for such services.
The increase in the number in local employment was all related to
employment at stores (some of which were new in the area) - serving,
nightwatch, delivery etc.
Forty two percent of those who were unemployed in 1982 and remained
73
part of the surveyed community1 were still unemployed in 1985. Twenty
five percent had obtained jobs, five percent retired and eighteen
percent said they were occupied with domestic duties or agriculture.
However, as all except one of those involved in domestic duties or
agriculture were very young and unmarried they were probably only thus
occupied because they could not find any employment and accordingly
more correctly should have been classified as unemployed. If this
had been done almost sixty percent of those unemployed in 1982 would
have still been unemployed in 1985. It is probably an indication of
the hopelessness of their situation that young unmarried women who
said they were unemployed in 1982 in 1985 said they were occupied in
the home.
Looked at in reverse, 37,8 percent of those who were unemployed in
1985 (and had been part of the community at the time of the first
survey) had been employed in 1982. Seven percent had been at school
in 1982 and 17,6 percent had been involved in domestic or agricultural
activities. Although only 37,8 percent of the unemployed 1n 1985
stated that they were unemployed in 1982 many of the 17,6 percent who
said they were involved in domestic or agricultural duties were
probably only so involved because they were unemployed. If these
people are considered to have been unemployed then over half of those
who were unemployed in 1985 were also unemployed in 1982.
1. Twenty two percent of those who were unemployed in 1982 had either died or left the community by 1985.
74

CHAPTER FOUR
QUALITY OF LIFE
4.1 Introduction
This chapter deals with the survey community's access to basic
amenities and the factors determining their availability or non-
availability. In certain spheres this was a relatively favoured
community with ready access to, for example, water and fuel. But with
regard to the amenities associated with a developing society, such as
education and health, this was a seriously disadvantaged community
both in real terms and in relation to their fellows elsewhere in the
country.
4.2 Education
Education in a developing community is a matter to which people attach
particular importance. It is generally considered an essential pre-
requisite for the progressive development of the area and any
improvement in the quality of life of the inhabitants. The survey
area was no exception to this rule. Although the majority of those
surveyed over the age of 20 have had no education the value placed
upon education by the community was evidenced by their communal
efforts to erect more schools and additional classrooms, the ever
increasing number of children attending school and the general
improvement in literacy by age group over time.
75
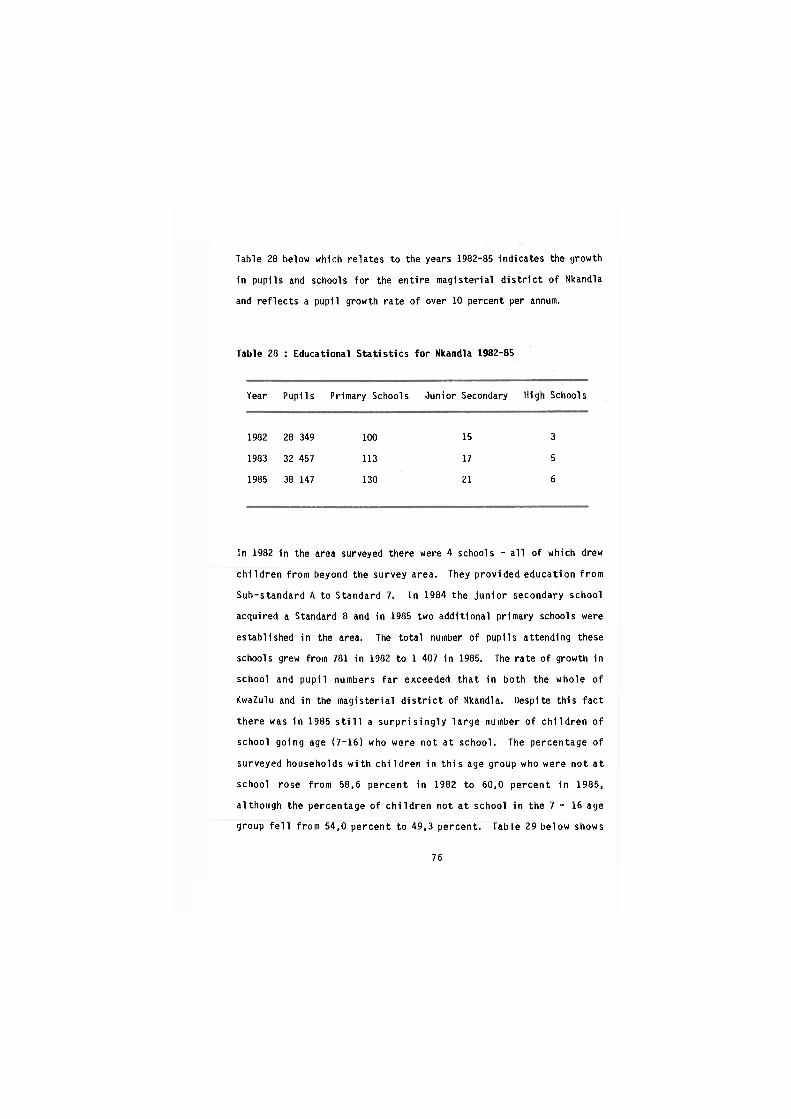
Table 28 below which relates to the years 1982-85 indicates the growth
in pupils and schools for the entire magisterial district of Nkandla
and reflects a pupil growth rate of over 10 percent per annum.
Table 28 : Educational Statistics for Nkandla 1982-85
Year Pupils Primary Schools Junior Secondary High Schools
1982 28 349 100 15 3
1983 32 457 113 17 5
1985 38 147 130 21 6
In 1982 in the area surveyed there were 4 schools - all of which drew
children from beyond the survey area. They provided education from
Sub-standard A to Standard 7. In 1984 the junior secondary school
acquired a Standard 8 and in 1985 two additional primary schools were
established in the area. The total number of pupils attending these
schools grew from 781 in 1982 to 1 407 in 1985. The rate of growth in
school and pupil numbers far exceeded that in both the whole of
KwaZulu and in the magisterial district of Nkandla. Despite this fact
there was in 1985 still a surprisingly large number of children of
school going age (7-16) who were not at school. The percentage of
surveyed households with children in this age group who were not at
school rose from 58,6 percent in 1982 to 60,0 percent in 1985,
although the percentage of children not at school in the 7 - 1 6 age
group fell from 54,0 percent to 49,3 percent. Table 29 below shows
76
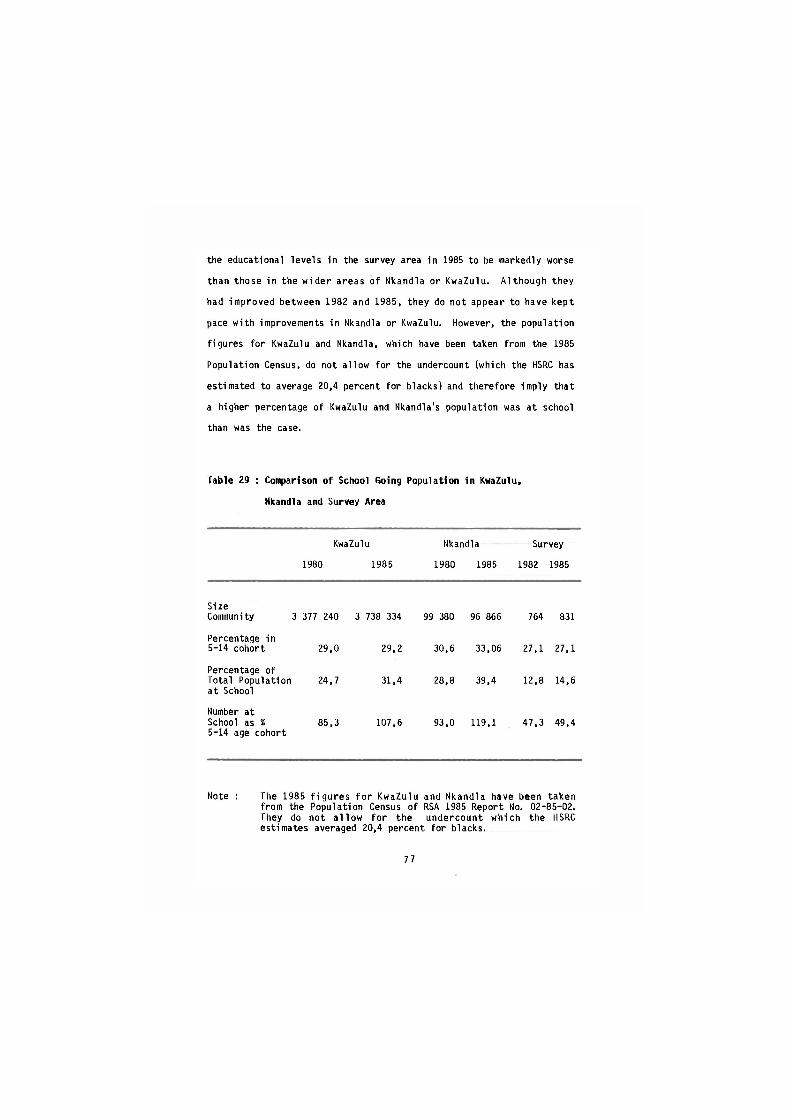
the educational levels in the survey area in 1985 to be markedly worse
than those in the wider areas of Nkandla or KwaZulu. Although they
had improved between 1982 and 1985, they do not appear to have kept
pace with improvements in Nkandla or KwaZulu. However, the population
figures for KwaZulu and Nkandla, which have been taken from the 1985
Population Census, do not allow for the undercount (which the HSRC has
estimated to average 20,4 percent for blacks) and therefore imply that
a higher percentage of KwaZulu and Nkandla's population was at school
than was the case.
Table 29 : Comparison of School Going Population 1n KwaZulu,
Nkandla and Survey Area
KwaZulu Nkandla Survey
1980 1985 1980 1985 1982 1985
Size
Community 3 377 240 3 738 334 99 380 96 866 764 831
Percentage in
5-14 cohort 29,0 29,2 30,6 33,06 27,1 27,1
Percentage of Total Population 24,7 31,4 28,8 39,4 12,8 14,6 at School Number at School as % 85,3 107,6 93,0 119,1 47,3 49,4 5-14 age cohort
Note : The 1985 figures for KwaZulu and Nkandla have been taken from the Population Census of RSA 1985 Report No. 02-85-02. They do not allow for the undercount which the HSRC estimates averaged 20,4 percent, for blacks.
77

Table 30 : Education Levels
Total Population 5 - 24 Age Group
Educational Level KwaZulu*
1980 1985 Nkandla* 1980 1985
Survey Area 1982 1965
Survey Area 1982 1985
KwaZulu* Nkarxila* 1985 1985
No Education 52,5 39,7 68,7 52,4 67,7 65,1 50,9 48,4 24,0 34,1
SSA - Std 5 24,6 29,9 19,9 29,4 24,1 24,8 39,2 31,1 42,1 42,6
Std 4 - Std 5 9,7 12,5 5,8 8,7 4,3 5,2 6,4 14,3 14,0 11,1
Std 6 - Std 8 10,5 13,5 4,9 7,7 3,3 3,3 2,9 5,1 14,8 10,1
Std 9 + 2,7 4,4 0,7 1,8 0,6 1,1 0,6 1.1 5,1 2,1
* 1980 and 1985 Population Censuses
A comparison of the educational levels of all those surveyed with the
total population of KwaZulu and that of Nkandla, and of the 5 - 2 4 age
groups for the three areas illustrates the markedly lower levels of
education in the survey area. However, the same trends towards
improvement which are illustrated in the figures for kwaZulu and
Nkandla are also evident in the survey figures.
In 1985 there was still no high school in the area. There were no
centres of adult education and the agricultural extension officer who
alone, in 1982, could be said to be involved in adult education, was
no longer in the area in 1985. The nearest high school was in Nkandla,
30 kilometres away.
In 1982 the 781 pupils were taught by 25 teachers only 6 of whom were
qualified. Together the schools had 11 classrooms. In addition they
78
made use of 4 nearby church buildings. Pupils had to walk varying but
considerable distances to reach schools and no public transport was
available. Sixty nine percent of households surveyed were estimated
to be more than 1 hours walking time from the nearest primary school.
Although school fees were not high (they varied from R1.20 to R4.00 in
1982) and uniforms were not compulsory both in 1982 and 1985 a t test
indicated that incomes per capita in households where children of
school going age were not at school were lower than in households
where all children of schooling age were at school. This may be
explained by the fact that pupils were required to purchase almost all
of their text and exercise books and contribute approximately RIO per
annum to the school building fund.
School building funds are required because all schools in the area
are c o m m u n i t y schools. The State plays no part in their
establishment. When funds permit, the State will reimburse the school
with up to 50 percent of the cost of the building, but it is the
community or some interested individual who has to take the full
initiative in the proposing, planning and building of a school. This
system does not lead to the rational positioning of schools in
relation to population density, transport routes, growth points etc.,
but instead places them where communities or individuals have money
and initiative. Poor rural communities where the majority of able
bodied men are away and many of the chiefs uneducated must evitably
come off worse under such a system. The survey area illustrates just
this.
79
4.3 Health
There were no permanent health facilities within the survey area (60
square kilometres) a l t h o u g h mobile clinics from Nkandla and
i-tbongolwane hospitals visited the area on a monthly basis. There was
a clinic just north of the survey area but although the surveyed
community appeared to use it for ante-natal and immunization purposes,
they tended to bypass the clinic in medical emergencies and travel
either to Eshowe or Nkandla hospitals - involving themselves in a
round trip of a minimum of 60 kilometres. There were a surprising
number of traditional healers or inyangas in the area who appeared to
be well supported by the community. A permanent clinic based in the
survey area would appear justified by the numbers it would serve and
services it might deliver. Until such a clinic is provided the
surveyed community would benefit if the existing clinic just outside
the area were upgraded and the community itself educated as to the
services it does and could provide.
4.4 Hater
Water was always available from the numerous perennial streams and
springs in the area. Respondents reported that even in the 1980
drought they had drinking water although the Irrigation of gardens
next to streams became impossible. Over 70 percent of respondents
obtained their water from streams and the balance from springs. There
were no other sources of water. There was no piped water in the area
and no attempt had been made to protect springs. No water tanks were
80

observed. Despite the fact that water sources were unprotected most
appeared not to have become polluted and the hospital reported very
low levels of cholera and other water related diseases. Although the
daily collection of water inevitably involved a steep climb back to
the homestead, most households were within 15 minutes walking time
from the source.
4.5 Fuel
Host people 1n the survey area had a ready access to plentiful
supplies of free wood from natural forests or their own small
plantations. Obtaining fuel did not therefore give rise to
difficulties or constitute a major item of expenditure. However wood
gathering is very time consuming and the natural forests are rapidly
being depleted.
4.6 Transport and Conaunicatlon
The transport Infrastructure in the survey area in 1985 remained
totally Inadequate. There were few roads and fewer cars. Apart from
those belonging to store keepers no cars were based in the area. The
cars owned by migrants were only in the area during the brief periods
when the migrants were home. Two buses a day travelled to Nkandla and
two to Eshowe along the main gravel road but owing to the gradients
and condition of the other roads no buses travelled along them. The
construction and maintenance of all roads other than the main road
were entirely the responsibility of the community with the result that
few had a passable road within easy reach of their homes.
81
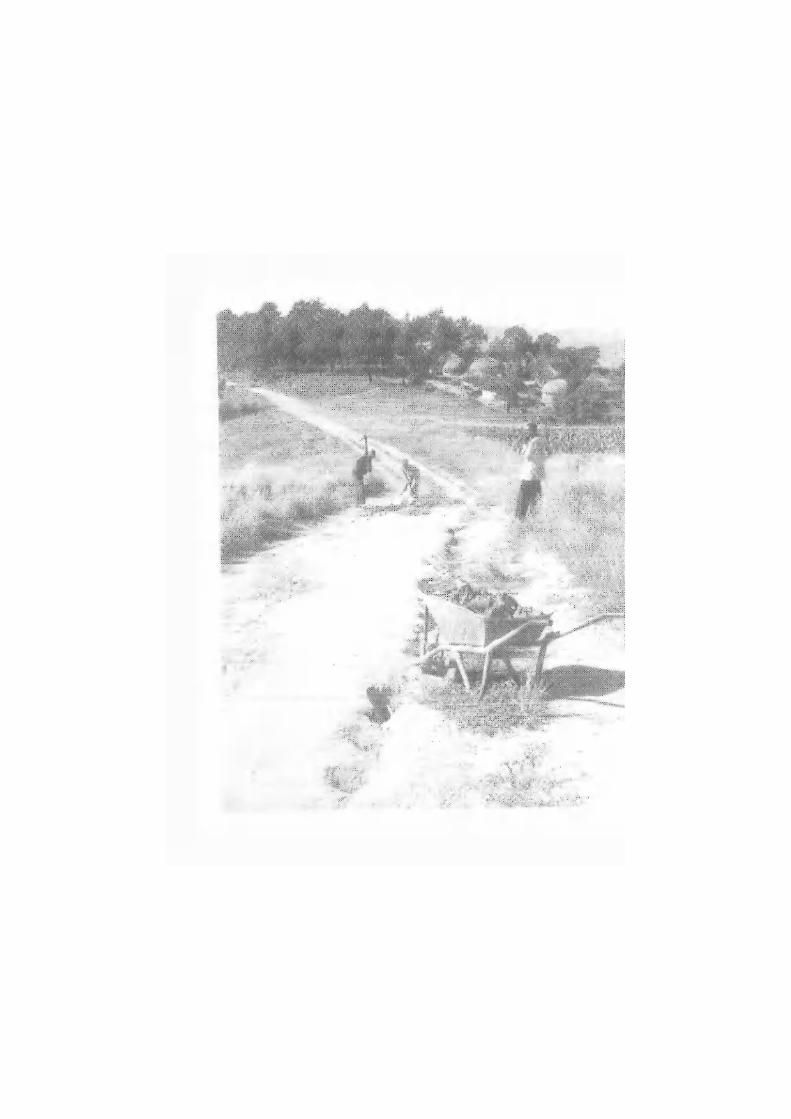
The area was relatively well served by taxis. The nearest rail link
was in Eshowe 30kms away. Transport was most frequently required for
medical reasons. It was possible to call an ambulance but as they
were little cheaper than taxis and could only be summoned by
telephone the community generally resorted to public transport in
medical emergencies.
At the time of the first survey there were no telephones in the survey
area. The central store had acquired a telephone by the time of the
resurvey. There was only one telephone within 12kms of the boundary
of the area surveyed and even the local clinic had no telephone.
There were no post offices within 30 kms of the area; none of the
local stores sold newspapers and although there were a number of
households with radios they seldom seemed to use them - perhaps
because of the cost of batteries.
4.7 Shops, Savings and Credit
There were three stores within the survey area in 1982 and four 1n
1985. Three larger stores with a far wider range of goods were within
15kms of the boundary of the area but the surveyed population still
found it necessary to shop in Nkandla or Eshowe from time to time.
The local shops have a very limited range of foodstuffs (none had
electricity) and few soft goods. They stocked no fertilizer and
almost no seed.
There appeared to be no savings clubs or credit unions in the area at
83

the time of the surveys although some had existed In the past. Cash
for credit could not be obtained within the area but all the stores
offered varying but limited credit facilities for the purchase of
foodstuffs. Pensioners were the group most likely to be granted
credit - being the only people with a regular Income.
84
CHAPTER FIVE: INCOME LEVELS, DISTRIBUTION AND SOURCES
5.1 Introduction
The difficulties associated with estimating rural incomes, their
consumption and distribution are immense and unresolved. They are
discussed at length in Appendix A. In order to understand the
significance of the evaluations made in this chapter it is essential
that Appendix A be read first.
Cross sectional income studies give rise to additional difficulties in
that they reflect only current annual incomes which may be strongly
influenced by random and transitory factors, such as droughts or
recessions, as well as by the phase of lifecycle in which the
household is placed at the time and by prevailing social or political
forces.
The relation of income levels to the development cycle of the
household is only appropriate where households experience similar
progress through the various stages of the life cycle. These are
usually considered to be the initial formation, the subsequent growth
in size and the number of dependents as children are born into the
household, the change in dependency ratio as children who were
previously consumers became contributors to household income, and
finally the contraction in size as children leave to establish their
own households. In order to apply the development cycle theory it is
85
also necessary to be able to distinguish the "cyclical process from
either shorter term or longer term processes of social structural
change" (Murrary: 1987). Studies over time which claim that trends in
the level of households income may be related to the phase of
household lifecycle imply that what, in a cross sectional study, may
appear to be differences in levels of income between various
households may be merely reflections of the different phases of the
lifecycle 1n which individual houses are at the time (Kuznets, 1976).
Although it is true that cross sectional studies reflect income at one
point only and give no indication of the overall lifetime levels of
income achieved by the household studied, the variety and complexity
of forces influencing income levels in Southern Africa make the
exclusive application of the life cycle theory inappropriate. The
common occurrence of large extended households in rural Southern
Africa makes a comprehensive application of this theory impossible.
In this study over three quarters of the households surveyed consisted
of extended families which could not be readily allocated to any one
particular phase of a household's lifecyle. Indeed in many cases all
the various phases in the usual household lifecycle were
simultaneously represented by different sections of these extended
households. If there is some relationship between the level of
household income and the phase in household lifecycle such extended
households might be expected to show less variation in the levels of
household income realized throughout their existence than simple
households which can be firmly categorized as belonging to a
particular phase of the lifecycle at a particular time. For this
reason the incomes recorded in this survey may be more generally
86
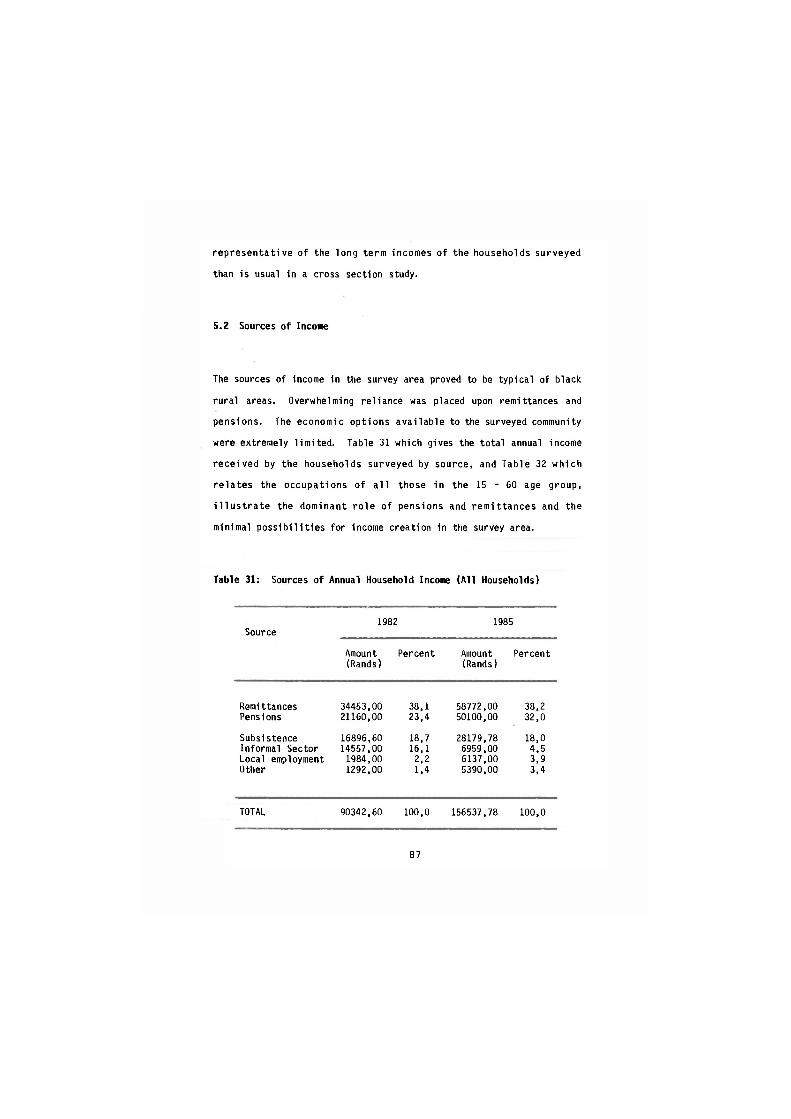
representative of the long term incomes of the households surveyed
than is usual in a cross section study.
5.2 Sources of Incone
The sources of income in the survey area proved to be typical of black
rural areas. Overwhelming reliance was placed upon remittances and
pensions. The economic options available to the surveyed community
were extremely limited. Table 31 which gives the total annual income
received by the households surveyed by source, and Table 32 which
relates the occupations of all those in the 15 - 60 age group,
illustrate the dominant role of pensions and remittances and the
minimal possibilities for income creation in the survey area.
Table 31: Sources of Annual Household Income (All Households)
1982 1985 Source
Amount Percent Amount Percent (Rands) (Rands)
Remittances 34453, ,00 38, 1 58772, ,00 38, 2 Pensions 21160, ,00 23, 4 50100, ,00 32, ,0
Subsi stence 16896, ,60 18, 7 28179, ,78 18, 0 Informal Sector 14557, ,00 16, 1 6959, ,00 4, ,5 Local employment 1984, ,00 2, 2 6137, ,00 3, 9 Other 1292, ,00 1, .4 5390, ,00 3, 4
TOTAL 90342, ,60 100, .0 156537, ,78 100, ,0
87
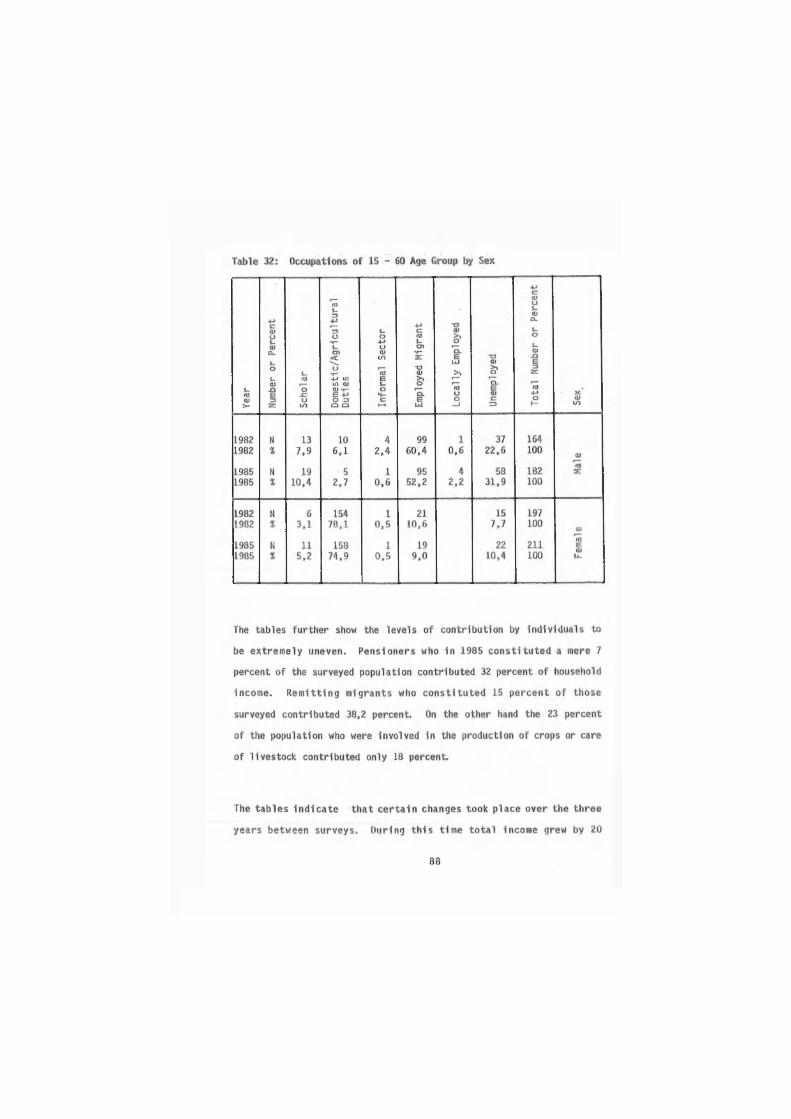
percent per annum while the contribution from migrants grew by a
similar amount and that from pensioners by 33 percent per annum.
Although local employment grew by 46 percent per annum it remained
relatively insignificant both as a source of income and as an
occupation. Subsistence only maintained its position as a source of
income as a result of the different method of evaluation used in 1985
(See section 5.2.3 below). A comparison of the two sets of figures
confirms the limited possibilities for generating income other than
through migrancy or welfare transfers. The contribution from informal
sector activity declined absolutely as well as relatively. The growth
in "other income" over the three years does not reflect a trend but
merely the fact that in 1985 15, as opposed to 6 in 1982, children
received maintenance payments and that one household received payments
totalling R800 from TEBA as compensation for the death of a household
member on the mines and another received regular payments (totalling
R480 during year year) from a household member's boyfriend.
The tables Indicate that certain changes occurred between 1982 and
1985. These were not the result of fundamental changes in the
surveyed community but reflections on the periphery of events
occurring in the core society. Pretoria increased pension payments
and pension coverage improved. Real wages in the core economy
increased despite the recession and growth in unemployment. The
Increased numbers of unemployed who returned home restricted the
opportunities for informal sector activity in the survey area both
because they could perform for themselves tasks they might have paid
others for and because they lacked the funds to pay for goods or
services.
89
5:2.1 The Chief Sources - Remittances and Pensions
In 1985 as in 1982 the two main sources of income were remittances
and pensions. Remittances as a percentage of total income had
remained static but pensions were seen to be playing an increased
role. With regard to the average individual remittance or pension
both had increased in actual and real terms. In real, terms
remittances increased by 11,6 percent and pensions by 11,5 percent.
However, whereas the number of pensioners in the community increased
over the three year period, although the number of persons involved
in, or desirous of being involved in, wage labour remained constant,
the number of employed migrants fell while the number of unemployed
grew. By 1985 whereas 56 percent of households were in receipt of old
age pensions as opposed to 46 percent in 1982, almost a quarter of
those who had remitted money over the previous twelve months were
unemployed and therefore would be unable to remit in the future unless
they found new employment which was unlikely 1n the recessionary
climate. The percentage of income derived from remittances was
therefore likely to fall as, although the average amount remitted may
have increased further since the resurvey, the percentage remitting
will most probably have continued to decline. Pension payments have
been increased again since the 1985 survey, and the percentage of
income derived from this source is likely to have grown further.
In 1985 seventy nine percent of households contained a migrant (73,3 percent an employed migrant). Eighty percent1 contained a migrant who
1. Includes some unemployed ex-migrants who were at home at the time of the survey.
90
had remitted money during the 12
over half the households all
remittance patterns of migrants
2.10.
months preceding the survey. In just
employed migrants remitted. The
are referred to at greater length in
5.2.2 Informal Sector
Between surveys there was a serious decline in informal sector income
which fell in percentage terms from 16,1 percent of total household
income from all sources in 1982 to a mere 4,5 percent in 1985.
Contributions to income from informal sector activities were
exceedingly unequal. The top 10 percent of contributors accounted for
63,5 percent of informal sector income in 1985 and 88,4 percent in
1982. The death or departure from the district of one or more of the
top income earners in this sector will, therefore, have a
disproportionate impact on the importance of incomes from this source
as would ill health which prevents a person from operating. In 1982
64,5 percent of informal sector income was contributed by herbalists
and the top 5 contributors to informal sector income were all
herbalists. In 1985 herbalists contributed only 30,5 percent of a
much decreased income from this sector. By the time of the 1985
survey one herbalist had left the area, one had died and one was too
ill to collect medicines. Another claimed a dramatic decline in
income from this source. Indeed, only the fifth claimed a modest
increase (in constant terms). Nevertheless three of the four top
contributors to this source of income in 1985 were still the
91
herbalists.
The departure from the area (on her marriage) of the only woman with a
knitting machine, who alone contributed 12 percent of informal sector
income in 1982, was another important cause of the decline in income
from this source. The general recession and growing unemployment in
1985 may also have meant that the local community was less able to
support a herbalist or other informal sector operator and, moreover,
an individual's unemployment would have freed him to perform certain
tasks or services he may have been prepared to pay others to perform
when he was employed.
Although over 30 percent of those who contributed to the cash income
of households in 1982 and 1985 did so as informal sector operators the
majority of them - chiefly women grass workers or potters -
contributed negligible amounts. The dramatic decline in income from
this source does not indicate a fall off in this type of activity but
merely reflects events (some of a personal and some of a national
nature) overtaking Informal sector operators and, in particular the
top contributors who contributed so much of income from this source.
5.2.3 Subsistence Income
The contribution of subsistence farming to household income might
appear from Table 31 to have remained constant over the three years
between surveys. Unfortunately this is not the case. It is a
reflection of a change in the basis on which these incomes were
92
estimated. In 1985 agricultural income was debited with the costs of
production which were not taken into account in 1982. As a percentage
of subsistence income the contribution from agriculture fell from over
50 to 12,2 percent. This decline was not solely the result of taking
costs into account. A real decline in agricultural production
occurred which was demonstrated by calculating the value of 1985
agricultural production according to the 1982 formula. This showed
the value of agricultural production to have fallen by 30 percent in
constant terms.
Reference to Appendix B where the methods of calculating subsistence
income are explained at length will indicate that the maintenance of
the level of subsistence contribution is largely explained by the
values placed in 1985 upon the consumption of small stock and the
value placed upon hides neither of which were considered in 1982, upon
the increased values placed upon the meat consumed from dead and
slaughtered animals and upon the fact that more cattle died in 1985
than 1n 1982. An appreciation of the methods used to attribute
economic values to subsistence production and consumption, and the
implications of consumption and sales for future subsistence income is
essential to the understanding of the significance of subsistence
income. The methods and the implications are discussed in Appendices
B and C. It is made clear that the level of the subsistence
contribution in 1985 was only being maintained by placing an increased
reliance upon the consumption of capital or dissaving. In 1982 half
of subsistence income was derived from field production. In 1985 this
source contributed only 12,2 percent of subsistence income. Although
the different methods of estimation used in 1985 account for some of
93
the decline in the value of agricultural production, the fact remains
that 86 percent of subsistence income was achieved through the
consumption or sale of assets. As has been stated beef production is
by definition dependent upon the consumption or sale of assets.
However, its successful continuation Is reliant upon an overall
increase in the value of assets (or at least maintenance of their
value) despite the consumption or sale of some. The income earned
from ploughing was the only subsistence Income achieved from sources
other than field production which did not involve the consumption of
assets.
Although subsistence may appear to have maintained its importance as a
contributor to household Income it has done so 1n a way which would
seem to ensure that in future its Importance as a contributor must
decline unless there is a sharp improvement In the fertility rate and
a sharp decline In the death rate of stock of all types or a dramatic
turn around in agricultural production.
5.3 Income Levels and Distribution of Income
In this chapter we refer to both household and household per capita
income. It is however felt that, chiefly as a consequence of the
great variation in household size and structure, the household per
capita measure is a more accurate reflection of the levels of
individual poverty 1n the surveyed community (Appendix A). This
study 1s concerned with the measurement of levels of poverty rather
than the nature of and reasons for certain income flows, and what is
94
required from the measurement of income is a tool for determining a
household's ability to supply its members with certain basic needs
rather than the size of its income. The reasons why this is better
done by the per capita than the household measure are discussed at
length in Appendix A. To determine household per capita incomes total
household Income was divided by the number of resident household
members. The figures thus obtained are the mean or average annual per
capita incomes in particular households. Section 5.3.1 refers briefly
to household incomes so that comparisons may be drawn with those
studies which refer only to household incomes. In the balance of this
study references to income are generally to household per capita
incomes.
5.3.1 Household Incomes
Total household incomes from all sources ranged in 1985 from R141.20
to R7 804,60 with a mean of R2 115,37 and a median of R1 845. In 1982
household incomes ranged from R100 to R8 460 with the mean being
R1309.31 and the median R1 125. In order to make a direct comparison
both sets of figures were converted into 1980 prices according to the
Consumer Price Index. Table 33 which contains these figures indicates
that except at the extremes household incomes were slightly higher in
1985 than in 1982. The distribution of incomes (as reflected in the
column showing the percentage of total income received by each decile)
was very similar in 1982 and 1985 with the richest decile receiving
more than twenty percent of the total income while the poorest decile
received just over 2 percent or a tenth of the share received by the
richest decile.
95
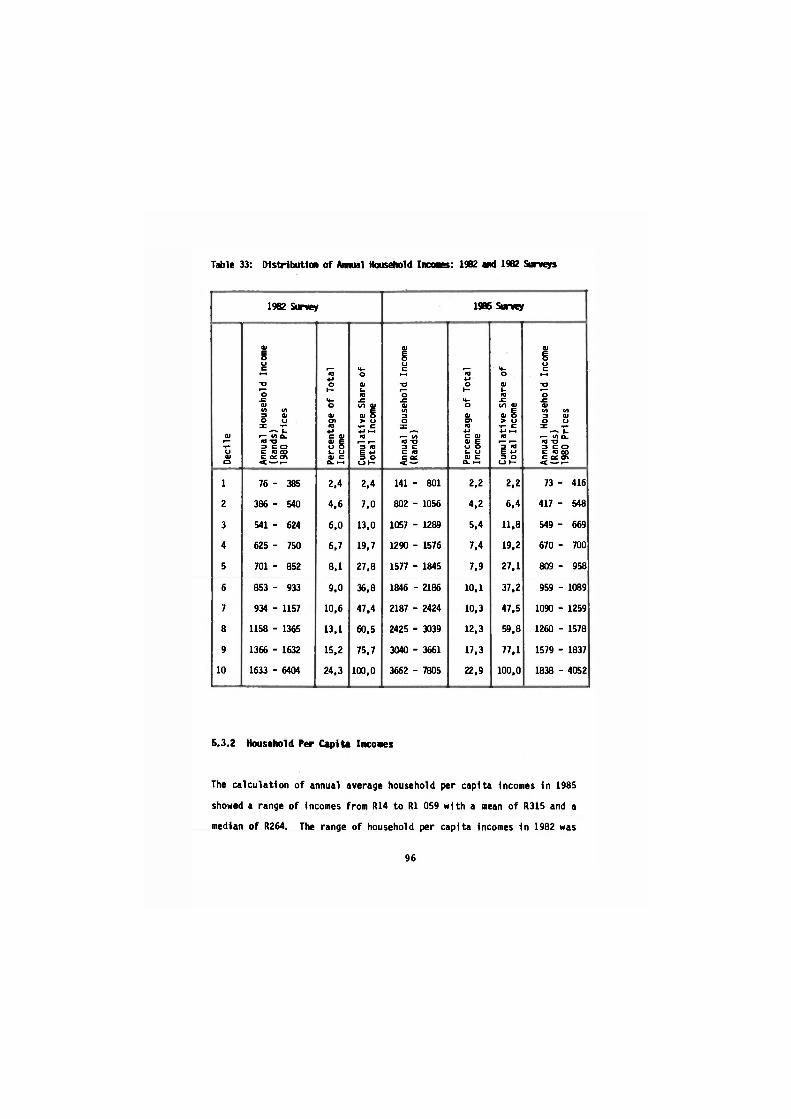
Table 33: Distribution of Annual Household I news: 1982 «id 1982 .Surveys
1962 Survey 1986 Surwey
Decile
Annual Household Income
(Rands)
1980 Prices
Percentage of Total
Income
Cumulative Share of
Total Income
Annual Household Income
(Rands)
Percentage of Total
Income
Cumulative Share of
Total
Income
Annual Household Income
(Rands)
1980 Prices
1 76 - 385 2.4 2.4 141 - 801 2.2 2,2 73 - 416
2 386 - 540 4.6 7.0 802 - 1056 4.2 6.4 417 - 548
3 541 - 624 6,0 13,0 1057 - 1289 5.4 11.8 549 - 669
4 625 - 750 6.7 19.7 1290 - 1576 7.4 19.2 670 - 700
5 701 - 852 8.1 27,8 1577 - 1845 7.9 27.1 809 - 958
6 853 - 933 9.0 36,8 1846 - 2186 10,1 37,2 959 - 1089
7 934 - 1157 10,6 47,4 2187 - 2424 10,3 47,5 1090 - 1259
8 1158 - 1365 13,1 60,5 2425 - 3039 12,3 59,8 1260 - 1578
9 1366 - 1632 15,2 75,7 3040 - 3661 17,3 77.1 1579 - 1837
10 1633 - 6404 24,3 100,0 3662 - 7805 22,9 100,0 1838 - 4052
5.3.2 Household Per Capita Incoaes
The calculation of annual average household per capita incomes In 1985
showed a range of Incomes from R14 to R1 059 with a mean of R315 and a
median of R264. The range of household per capita Incomes 1n 1982 was
96

R16 to R886 with a mean of R183 and a median of R144.
Table 34: Distribution of Annual Household per Capita Incomes
1982
1 2 3 4 5 6 7 8 9
10
<u i_> m a> cn (U u C I. E -r-<a <u o t-
16 - 38 39 - 57 58 - 73 74 - 89 90 - 109
109 - 125 126 - 151 152 - 173 174 - 267 268 - 305 306 - 886
O o. 1/1 (o a) <u o E cn o C i- O ro a) c oc a- >-i
21 -51 -76 -
50 75 97
98 - 118 119 - 144 144 - 165 166 - 199 200 - 229 230 - 353 354 - 403 404 - 1170
1985
O Q. (/) ro ai
1IU E o a- </» to a> v) QJ t_> E aj cn o <_) C 1- U -r-(O a C L
14 81 7 - 42 82 - 165 43 - 86
166 - 184 87 - 96 185 - 222 97 - 115 223 - 264 116 - 137 265 - 301 138 - 156 302 - 355 157 - 184 355 - 388 185 - 201 389 - 617 202 - 320 618 - 801 321 - 416 802 - 1059 417 - 550
Despite the real increase in average household per capita incomes over
the three years between surveys the 1985 figures confirm that as in
1982 there was widespread poverty in the surveyed community with half
the households surveyed achieving average household per capita
incomes of R264 per annum or less and 30 percent incomes of less than
R185. At the other end of the scale, only 2,6 percent achieved
incomes of over R1 000.
When household per capita incomes for both 1982 and 1985 were
converted to 1980 prices (using the Consumer Price Index) it became
clear that, except at the extremes, incomes were consistently lower in
97
1982. The improvement 1n real per capita average household incomes in
1985 can chiefly be attributed to remittances which, in real terms,
had increased by 11,6 percent and receipts from old age pensions which
had grown, in real terms, by 11,5 percent and were received by 56
percent of households in 1985 as opposed to only 46 percent in 1982.
5.4 Income Differentiation and Household Structure
Tables 33 and 34 above illustrate the income inequality found in the
survey area. In an attempt to establish the causes of this inequality
the levels of income of different groupings of households were
investigated. Thus factors such as size of landholding, number of
cattle, number of migrants etc. were related to income levels. In
most cases no link between the factor and the level of income could be
established. Those in which the factor tested appeared to have some
relevance are listed in Table 35 below.
Table 35 gives both household and household per capita incomes and
indicates clearly how differently they reflect the situation.
Reference to household per capita incomes in Table 35 indicates that
of all the groupings of households listed there small households were
best able to meet dependents' needs although their incomes were
amongst the lowest in household terms. Although there was no definite
relationship between household income per capita and household size
the chance of enjoying a high income was significantly greater when
one was a member of a household which was below average in size.
Conversely membership of a household with above average membership
tended to ensure a comparatively low income.
98
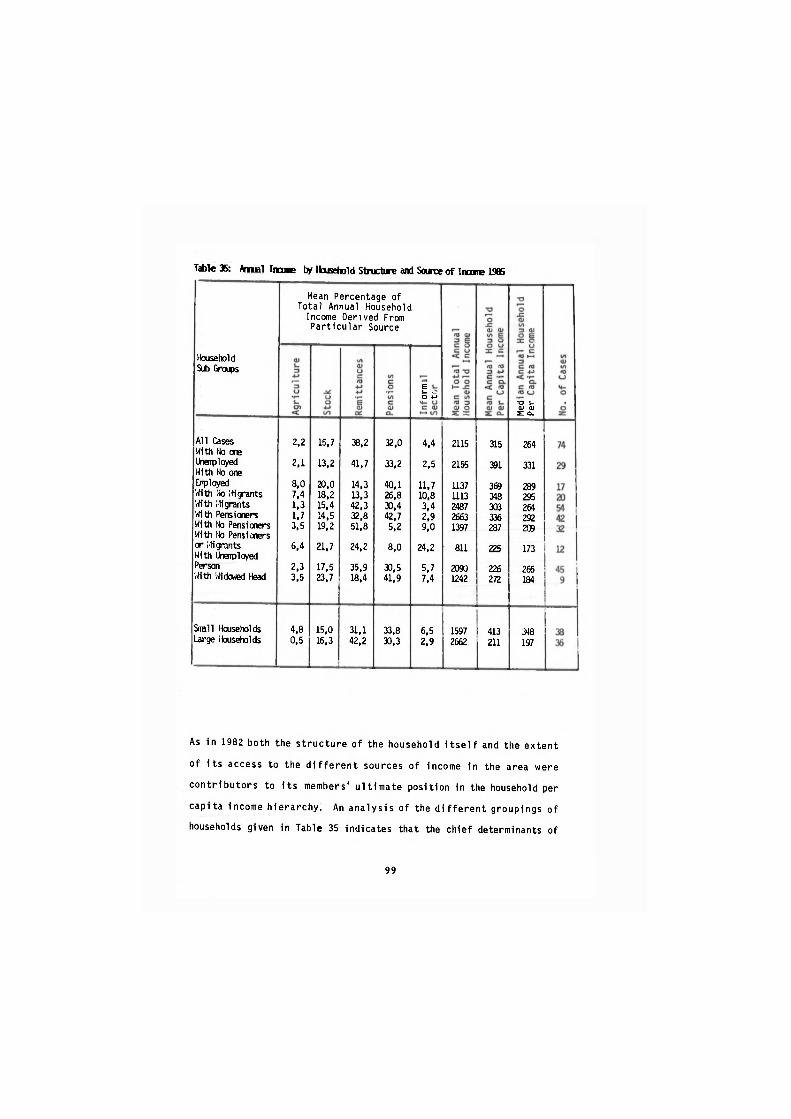
Table 35: Anal Inane by Household Structure and Soiree of I name 1986
Household Sub Groins
Mean Percentage of Total Annual Household Income Derived From Particular Source
E S- _ O -M
XJ t-QJ QJ s: a.
All Cases With No one Urenployed With No one Enployed With to Migrants With Migrants With Pensioners With No Pensioners With No Pensioners or Mig-ants With Unenployed Person
With Widowed Head
2.2
2,1
8,0
7.4 1.3 1.7
3.5
6.4
2,3 3.5
15,7
13,2
20,0 18,2 15.4 14.5 19,2
21.7
17,5 23.7
38.2
41.7
14.3 13,3 42.3 32.8 51.8
24,2
35.9 18.4
32.0
33,2
40.1 26,8 30.4 42,7 5,2
8,0 30.5 41,9
4.4
2.5
U.7 10,8 3,4 2.9 9,0
24,2
5,7 7,4
2115
2155
1137 1113 2487 2663 1397
811
2090 1242
315
391
369 348 303 336 287
225
226
272
264
331
289 295 264 292 209
173
266 184
Snail Households Urge Households
4,8 0,5
15,0 16,3
31.1 42.2
33,8 30,3
6,5 2.9
1597 2662
413 211
348 197
As in 1982 both the structure of the household itself and the extent
of its access to the different sources of income in the area were
contributors to its members' ultimate position in the household per
capita income hierarchy. An analysis of the different groupings of
households given in Table 35 indicates that the chief determinants of
99

poverty 1n 1985 were the same factors as those observed in 1982.
Households without migrants or pensioners were the poorest. They were
followed by households in which there were unemployed persons (where
the head of the household was amongst the unemployed incomes fell even
lower). The third poorest group was the households headed by widows.
Outside of the grouping by size, the group of households which
achieved the highest household per capita incomes was that in which no
one was unemployed. However, somewhat anomalously, this group was
closely followed by those in which no one was employed either locally
or as a migrant. Thus although unemployment or its absence is
probably the chief determinant of an individual's position in the
income hierarchy, there is a significant group of households, in which
people achieve relatively high incomes, whose fortunes are
uninfluenced by unemployment rates since their members do not
participate in the labour market.
Amongst those with the highest household per capita incomes were
members of households headed by an old age pensioner closely followed
by those containing a pensioner. Recent increases 1n the amount of
pension payments and the improvement 1n pension coverage means that
not only does a larger share of the community's total Income come from
pension transfers than in 1982 but also that part of the reason for
the overall improvement in household per capita incomes is that
pension payments have increased faster than inflation. In 1982
pension payments per person were R480 per annum whilst by 1985 they
had risen to R780 per annum. When these amounts are converted into
100
1980 prices according to the Consumer Price Index they still reflect
an increase. In 1980 terms pension payments rose from R363.36 per
annum in 1982 to R404.98 in 1985.
Even more important than the increase in the real value of social
pensions was the fact that the number of pensioners and the number of
households in the area which contained pensioners had also increased.
In 1985 old age pensions were received by 56 percent of households as
opposed to 46 percent in 1982. Although, the pensionable percentage
of the surveyed community had hardly altered between 1982 when it was
7,5 percent and 1985 when it was 7,7 percent, the percentage who
actually received pensions rose from 4,9 percent in 1982 to 6,9
percent in 1985.
5.5 Income Differentiation and Income Sources
Although there were differences in the percentage of income derived
from various sources between the differing levels of income in general
the differences were not significantly large or consistent to be able
to relate differential incomes to access to the particular source of
Income. Table 36 shows sources of income by quintile in the hierarchy
of households per capita incomes and Table 35 the percentage of income
derived from various sources for the groups of households listed
there.
As might be expected those in the lowest income group were the most
101
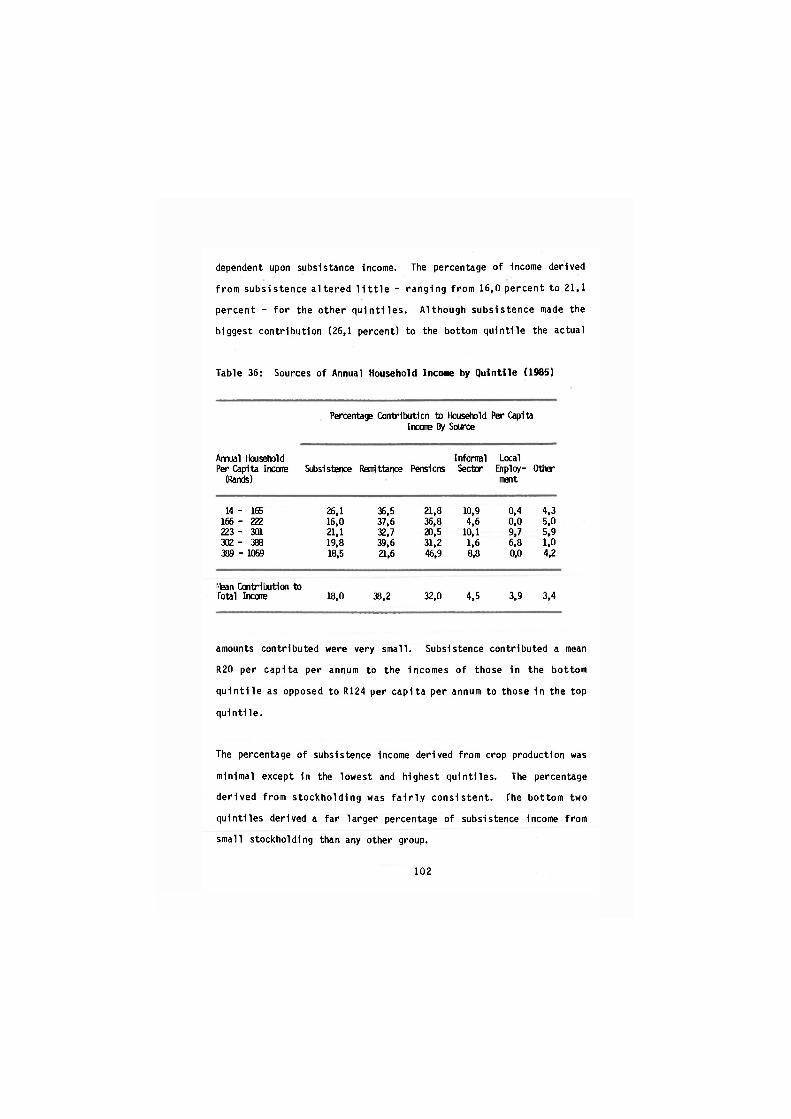
dependent upon subsistance Income. The percentage of income derived
from subsistence altered little - ranging from 16,0 percent to 21,1
percent - for the other quintiles. Although subsistence made the
biggest contribution (26,1 percent) to the bottom quintile the actual
Table 36: Sources of Annual Household Incoae by Quintile (1985)
Percentage Contribution to Household Per Capita Incore By Source
Annual Household Informal Local Per Capita IncaiE Subsistence Remittance Pensions Sector Enploy- Other (Rands) ment
14 - 165 26,1 36,5 a,8 10,9 0,4 4.3 166 - 222 16,0 37,6 36,8 4,6 0,0 5,0 223 - 301 21,1 32,7 20,5 10,1 9,7 5,9 302 - 388 19,8 39,6 31,2 1,6 6,8 1,0 389 - 1059 18,5 21,6 46,9 8,8 0,0 4,2
Mean Contribution to Total Income 18,0 38,2 32,0 4,5 3.9 3,4
amounts contributed were very small. Subsistence contributed a mean
R20 per capita per annum to the incomes of those in the bottom
quintile as opposed to R124 per capita per annum to those in the top
quintile.
The percentage of subsistence income derived from crop production was
minimal except In the lowest and highest quintiles. The percentage
derived from stockholding was fairly consistent. The bottom two
quintiles derived a far larger percentage of subsistence income from
small stockholding than any other group.
102
Table 35 shows clearly how households which receive no income from one
particular source compensate by receiving larger than average
contributions from other sources. In those households where no one
was employed 40,1 percent of total household income was derived from
pensions as compared with 32,0 for all households. Averaging the
percentage contribution amongst all households in the group disguises
the extent to which some households which have no employed members are
dependent upon pensions as a smaller percentage of these households
(46 percent) than all households (56 percent) received any income from
this source. Similarly a lower percentage of these households (48
percent) than all households (58 percent) received any income from
informal sector activity. Those who are in receipt of informal sector
income are therefore deriving a far larger percentage of their income
from this source than the 11,7 percent received by the whole group.
Such persons have probably taken a decision to participate in informal
sector activity 1n preference to the labour market. They may, of
course, have been forced to this decision because they were unable to
find employment. Similar reasoning may explain the very much larger
contribution of agriculture to the incomes of these households.
The influence of pension monies 1s clearly shown by the fact that
those 1n the lowest quintile receive the smallest percentage from this
source and those in the highest Income the greatest. In the quintile
in which almost half household Income is derived from pension money
the highest incomes are achieved with the smallest percentage of
incomes derived from remittances. Remittances showed the least
variation contributing between 30 - 40 percent to incomes in all
categories other than the top category of per capita incomes.
103
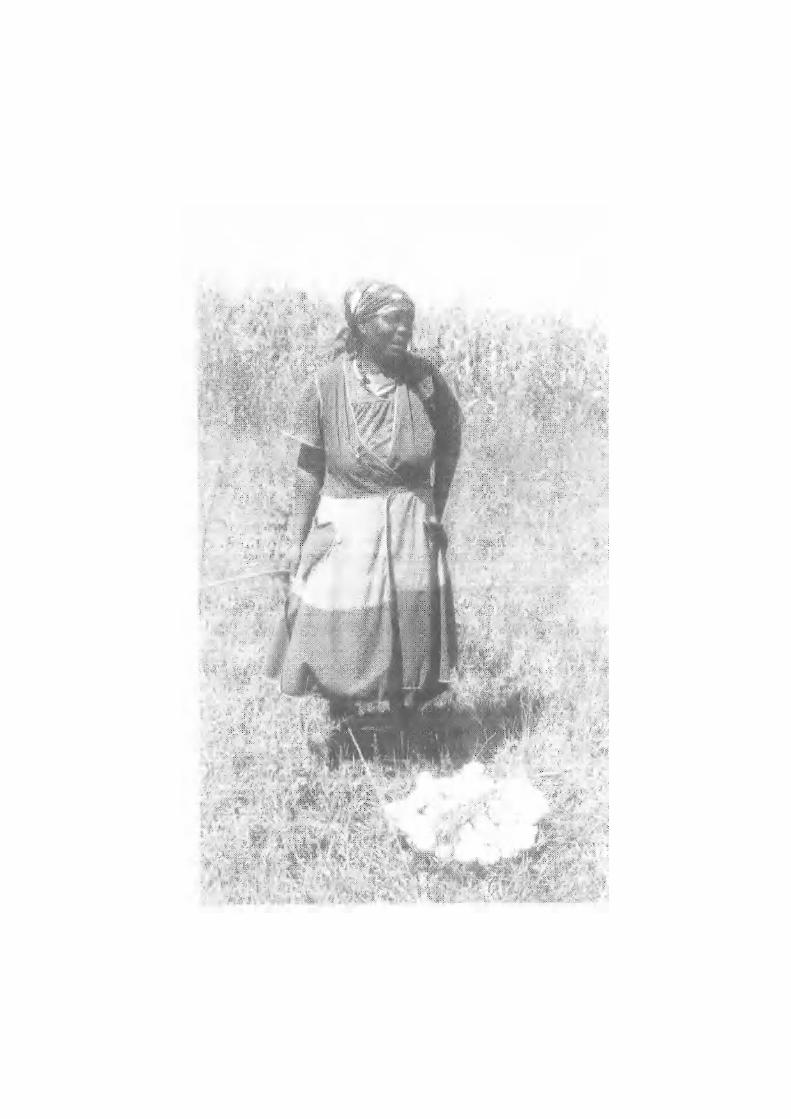
5.6 Conclusion
Despite the geographical remoteness of the survey area and the
apparently traditional nature of its structure income data provided by
the surveys indicates that the community's lifestyle is almost
entirely externally determined. The industrial core of South Africa
and the policies of Pretoria hold the keys to most aspects of most of
the community's life most of the time.
Only 9 percent of the households surveyed were neither in receipt of
migrants' remittances nor social pensions. These two sources
accounted for over 70 percent of the total income of surveyed
households. Households in receipt of neither generally achieved
pitifully low incomes. Only one household appeared to be in this
position by choice. This was a household consisting of only two
persons. The wife realised a considerable income through the sale of
clay pots which she made. The only other household in this group
which achieved an above average income was one which had been forced
to sell cattle to meet medical expenses and had received compensation
payments for the death of a son on the mines. The remaining
households which were neither in receipt of remittances or pensions
were dependent upon subsistance income and tiny sums they received
from selling grasswork etc.
There was a further 7 percent of households which were really in the
same position as those receiving no income from remittances or
pensions in that although they had received some remittance income
105
over the twelve months preceding the survey no one In the household
was employed at the time of the survey. All those who had remitted
had been retrenched or were 111 and therefore unable to work. These
households averaged an annual household per capita Incomes of only
R197 despite the fact that 45 percent of the households' total Income
was derived from migrant remittances. Incomes in these households
were set to fall even lower if none of the unemployed found work.
Table 35 which classifies together the above two groups as households
containing no migrants or pensioners indicates that as a group they
achieved the lowest annual household per capita Incomes (R225)
recorded in that table. It also Indicates that although no household
members were employed at the time of the survey almost a quarter of
total household Income was derived from remittances.
Non-farm employment in the area remained extremely limited and largely
restricted to people with some education or skill (e.g. teachers,
nurses, extension officers and storekeepers) whereas the people left
in the area after the migrants had departed were those with the least
education or skills.
The restraints upon the development of informal sector Income will
remain until the necessary changes are made in the area's
infrastructure and local incomes rise. Similarly the development of
subsistence Income cannot take place before the infrastructure is
developed, and the other restraints upon its growth removed (see
3.2.6).
106

Almost all these requirements (like the area's income itself) are
externally determined. No progress is likely to be made while current
policies persist in the core economy. But equally, no change is
likely in these policies while the people affected by them have no
means of bringing pressure to bear on the policymakers.
107
CHAPTER SIX: A COMPARISON OF INCOME LEVELS OVER THREE YEARS:
CHANGING FORTUNES IN FIFTEEN HOUSEHOLDS
6.1 Introduction
In order to compare the annual household per capita incomes realized
by the surveyed community in 1985 with those achieved in 1982 both
sets of figures were converted to 1980 prices according to the
Consumer Price Index. This adjustment showed mean annual household
per capita incomes to have risen from R138 in 1982 to R164 in 1985.
Median annual household per capita incomes rose from R109 in 1982 to
R137 in 1985. On a household basis one third of incomes decreased and
the average increase in per capita income in 1980 terms was R26.
In Chapter 5 and Appendices A and B the difficulties associated with
estimating rural incomes are discussed. On account of these
difficulties it was felt that a more valuable comparison of income
levels discovered by the two surveys would result from an examination
of comparative rankings in a household per capita income hierarchy
than from a comparison of estimated household incomes achieved. A
comparison of ranking would be less dependent upon price changes,
inflation, different methods of evaluation etc. In order to determine
the causes of rising or falling income 1t was decided to investigate
thoroughly the changing fortunes of the fifteen households whose
rankings had altered most over the three year period. Although 1t was
decided that ranking would be a more relevant measurement it should be
noted that there was more than a 50 percent overlap between the
fifteen households whose rankings had altered most and those whose
incomes had altered most. Whether actual incomes or rankings are
108
compared the danger remains of attaching too much importance to a
shift which, although it may appear large in percentage or position
terms, when expressed in terms of rands or purchasing power may not
seem as significant.
6.1.1 Allocating Rank
In order to create an income hierarchy it was necessary to rank all
household per capita incomes in 1982 and in 1985. The incomes for
each household were ranked and numbered in descending order for 1982
and 1985. By subtracting each household's 1985 ranking from its 1982
ranking it was possible to determine which households' positions in
the Income hierarchy had altered most over the three year period.
Certain households surveyed in 1982 were no longer in existence in
1985 and were replaced in the resurvey. None of these households
could be used for comparative purposes. Four households split into
two or more between 1982 and 1985 and all such new households were
compared with the single household from which they originated. It was
possible to compare incomes in 65 households and accordingly 65
rankings were allocated to 1982 and 65 to 1985. Thereafter the
households (fifteen in number) whose rankings altered through more
than 30 percent of the positions between 1982 and 1985 were selected
for further analysis. In eight cases rankings had i m p r o v e d
dramatically and in seven cases fallen.
6.2 Causes of Changes in Income Levels
Table 37 below indicates the number of positions (out of a possible
65) shifted by the fifteen households whose positions shifted most,
their household per capita Incomes for 1982 and 1985 (in 1982 terms)
109
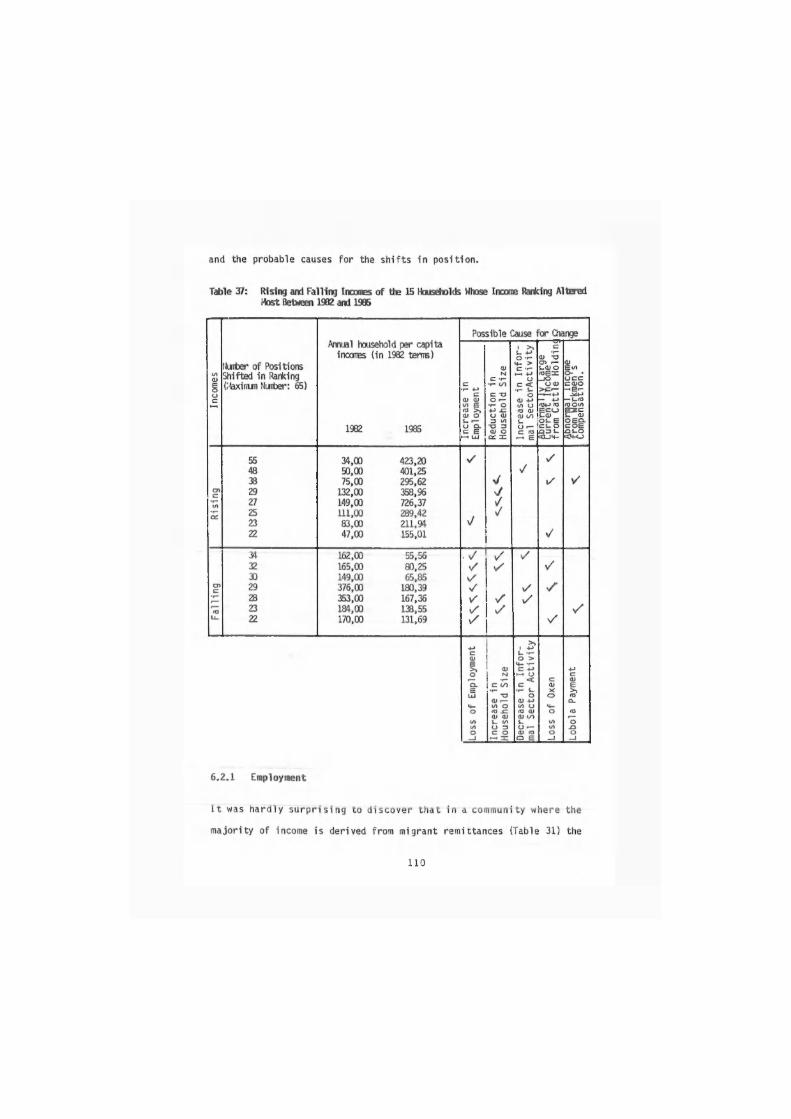
securing or loss of a job by a member of the household should be the
chief factor affecting rising or falling incomes in a household.
Where incomes fell it was found that members of the household had
either lost jobs or been unable to find employment as first time job
seekers.
6.2.2 Household Size
Of secondary importance in determining alterations in household income
rankings were changes in household size. Where the household
decreased in size incomes tended to rise, provided the decrease did
not result 1n the departure from the household of a pension-holding
member or one who remitted regularly. In one case a sharp decline in
income could be traced to the departure from the household of one of
the most successful small business operators encountered in the
original survey. Conversely a growth in household size generally led
to falling incomes particularly if it led, as it inevitably did, to an
Increase In the percentage of dependents in the household. Closely
allied to a decrease in household size is the breakdown of an extended
family unit into households which basically consist of nuclear
families only. Where this occurred in a situation where the head of
the nuclear family was an employed migrant, it appeared that incomes
rose not only because remittances were shared amongst fewer persons,
but also because the knowledge that the remittance was to be spent
solely on his immediate family appeared to lead the migrant to remit a
larger proportion of his wage. The average annual remittance to
households which consisted of a nuclear family only was double that to
a household whose structure was that of an extended family. In the
111
former the average remittance was R1 039,63 per annum and in the
latter R516.27 per annum.
With remittances constituting the major share of household income and
changes in employment the major determinant of falling or rising
income rankings, it followed that in almost all cases where rankings
fell dramatically household cash income in 1985 was lower than that in
1982 even without inflation being taken into account. There were two
cases where a fall or rise in ranking was not accompanied by a fall or
rise in cash income. In one case (where ranking fell) the household
had doubled in size and in the other (where ranking rose) the
household had halved in size.
6.2.3 Cattle Movements
Amongst the households where rankings rose or fell markedly there was
above average activity associated with cattle holding. This can be
explained by a number of factors the combined implications of which
are sometimes confusing. Thus where household members were ill or
lost employment the household may have been forced to sell an animal.
As explained in Appendix 8 the price realised for any animals sold was
included in current disposable income obtained as a result of
stockholding, although such monies are not true Income but rather
money received in return for the transfer of a capital asset. The
consequence of their inclusion is a temporary abnormal increase in
incomes 1n a situation which has essentially been brought about by
falling Incomes. Similarly where an animal is slaughtered as a
112
consequence of the death of a household member or where animals die
and the household consumes the carcass, the value attributed to the
consumed meat will increase current "incomes" in a situation which
results in a decrease in assets and heralds decreasing incomes in the
future. 1
There were a number of notable cases where "income" derived from
cattle holding cushioned what were in reality economically disastrous
situations. Improved ranking in one household was achieved as a
consequence of compensation payments from TEBA for the death of a son
on the mines and the proceeds of the sale of three head of cattle sold
to pay for expenses associated with the mother's illness. Ranking was
maintained in another household by the sale of a cow when the head
lost his job (and was therefore no longer able to remit regularly).
Through the sale of an asset the household was temporarily able to
maintain their disposable income level. Another household's ranking
appeared to improve dramatically where little else changed. The size
of household remained similar as did the cattle holding. Agricultural
production levels were unchanged and employment levels the same.
During the year, however, two head of cattle were sold to meet
expenses associated wtih illness and lobola payments. Attributing the
sale proceeds to household incomes caused an apparent increase in
income levels.
1. In this connection it is interesting to note that households with a widowed head derived the largest percentage of their income from stockholding. Host of this income was probably accounted for by the value attached to the consumption of meat from animals slaughtered in connection with the head's husband's death.
113
Cattle movements tend to be associated with changes in household
structure. Bethrothals and marriages result in persons joining or
leaving households, cattle being transferred as lobola and cattle
being slaughtered in celebration of the marriage. Deaths likewise are
followed by ritual slaughters and where preceded by illness may have
necessitated sales to meet expenses. The loss of a household member
who used to remit may also lead to sales in order to replace the lost
income. The impact of lobola transfers on household income is
difficult to measure - where a household receives cattle it loses the
input of a productive member and conversely where a household parts
with cattle it acquires a new productive member in their place. The
need to pay lobola may also lead to a household member remitting less
than he did when not involved in lobola payments.
The effect of cattle sales and deaths is also not clearcut - what
initially appears to be a boost to household incomes in fact probably
heralds a fall in incomes. Those cases where falling or rising
ranking can be traced to cattle movements should therefore be viewed
with caution.
Where households lost oxen with which they had previously ploughed
there was a serious drop in the value of agricultural production. In
the few cases where the level of production was maintained this was
generally achieved through incurring ploughing costs which exceeded
the value of the production. There did not appear to be any firm link
between declining and increasing agricultural production and
declining and increasing incomes. Where there was a marked decline in
114
the value of agricultural production this was generally the result of
the household having lost oxen with which to plough. However,
overall, increasing agricultural incomes were not necessarily found
in households where incomes rose or the household's ranking improved.
Neither was the converse true.
6.2.4 Informal Sector Activity
Although there is undoubtedly scope for the development of small
business or informal sector activities in the survey area, the
dispersed nature of the community and its poverty will always act as
brakes upon informal sector growth. A number of households reported
serious falls in income from this source between 1982 and 1985 which
probably should be attributed to the general economic recession and
growth of unemployment in the area.
6.2.5 Pensions
It is interesting that although pensions constitute a significant part
of household incomes none of the significant changes in ranking could
be directly traced to the granting or cessation of a pension. There
was no automatic improvement in ranking where a household member was
granted a pension nor was there a corresponding decline in ranking
where a household lost a pension. Indeed it often seemed that the
granting of a pension led to a fall in ranking and the cessation of a
pension to a rise. A reason for this unexpected consequence (of the
115
granting or withdrawal of a pension) only becomes apparent when
accompanying changes in household size and structure are investigated.
It appears that dependent relatives are frequently drawn to households
which contain pensioners in the hope that they will be able to share
the pension benefit. Conversely when a pensioner dies and the benefit
ceases such relatives may well depart in search of another relative
who is still in receipt of a pension. The attraction of dependent
relatives to the household increases its size and accordingly
decreases per capita incomes whereas the departure of such dependents
decreases size and may lead to an increase in incomes despite the loss
of the pension.
6.2.6 Split Households
Further information on the dynamics of rising and falling rankings may
be discovered by looking at the varying fortunes of the constituent
parts of households which split between 1982 and 1985. Some of these
cases have already been dealt with in that they were amongst those 15
households whose ranking had altered most over the period, and a
closer look at the balance produces no new causes for falling or
rising ranking. Employment, household size, availability of oxen and
declining informal sector activity are the factors which again appear
to explain the changes. In 6.4 the differing fortunes of the various
components of households which split are discussed in detail.
In the following section the case histories of the fifteen households
116
which experienced the greatest changes in income ranking are discussed
in detail.
6.3 Case Studies of the Fifteen Households Experiencing the
Greatest Change In Income Ranking
1. This is the household whose ranking according to household Income
per capita changed most between the time of the first and second
surveys - it moved from the bottom 10 percent of households to
the top 10 percent. There is no dramatic explanation for this
change 1n rank. The case 1s however a good illustration of how
the various stages in the life cycle of an extended family affect
the Income levels of the household.
Membership of the household changed little over the period - one
person left 1t and two (a wife and child) joined. However the
household moved Into a new era as the head who had for years
supported his family as a migrant worker returned home to have
his place taken in the labour market by his five sons. Three of
the sons had just started working in 1982 but had not yet begun
remitting money on a regular basis. By 1985 all five were
working and remitted money every month.
One son and one daughter had married 1n the interim and there had
been significant movements in the cattle herd. During the twelve
months preceding the 1985 survey five head had been transferred
out as lobola, two had died, two had been slaughtered, eight
118
head were received into the herd as lobola and one was purchased.
As the sons and daughters of the household w e r e all of
marriageable age this movement in cattle was to be expected. The
increase in slaughterings which is associated with the marriages
has the effect of increasing current disposable income from
cattle holding. The value of the meat from slaughtered animals
should not strictly speaking be considered income as it is income
achieved at the cost of the loss of a productive asset. In this
case however the income so achieved does not form a significant
part of the houshold's income 1 - the overwhelming majority of
which consists of migrants' remittances.
The number of cattle held by the household had increased by seven
between 1982 and 1985. The value of agricultural production in
1985 exceeded that in 1982.
2. The household whose income ranking had changed the second most
places was an unusual one. The household consisted solely of man
and wife. They had no children, no relatives sharing their
homestead, no land and no cattle. The husband had been a ship's
cook who had taken the unusual step of building his home close to
his wife's family rather than his own. When surveyed in 1982 the
husband had recently been discharged from hospital where he had
been for some months with a leg injury. The couple were at that
stage living off his savings which the wife supplemented in a
small way with the proceeds of the sale of clay pots. At the
1. Subsistence income from agriculture and cattleholding constituted only 17,6 percent of household income.
119
time the head gave the impression that he would find work again
as a migrant once he had recovered - although he said he would
not be returning to sea. In 1985 the head had made no move to
find employment and stated that he no longer had any intention of
doing so. His savings were depleted but his wife's pottery
business had grown so that their income had increased manifold.
The business was almost their sole source of Income - they had no
land, cultivated only the smallest of gardens and had a few
chickens. There were no elaborate marketing arrangements for the
pots and it appeard that most were in fact made to order.
3. Another household which showed a remarkable Improvement 1n
ranking was one which Illustrates very well the need to
differentiate between capital and income.
The household decreased in size by 14 persons between 1982 and
1985. A son and daughter in the household died. Two daughters,
who had previously left their children at home with their parents
while they were living with their boyfriends, removed their
children when their mother became ill. Another two daughters
left home to live with their boyfriends. In 1982 both the father
and son were migrants; in 1985 the son had died on the mines, the
father was unemployed and the head's wife was in hospital with
cancer. In order to meet the medical expenses incurred in
connection with the mother's illness all the household's cattle
had been sold. Despite this tale of woe Incomes in the household
appeared to have Improved dramatically. A closer look at the
120
components of the Income show them to be chiefly of a "one off"
nature - the proceeds of the cattle sales, and the money received
from TEBA in compensation for the son's death - and in fact not
income but the realisation of capital. Apart from these two
sources the household produced food to the value of R30 but had
no other income. In 1986 the household looked set to achieve one
of the lowest incomes in the area. The proceeds of cattle sales
are only acquired at the loss of productive assets. Compensation
for a son's death is an infinitely more tragic illustration of
current "income" achieved at the cost of future income.
4. This was the household which showed the most significant fall in
ranking. Although a number of factors no doubt contributed to
the household's decline in fortune it is chiefly explained by the
head's loss of job. In 1982 the head remitted R140 per month.
Since losing his job he had only been able to find temporary jobs
and remit small sums of money from time to time. The household
had acquired five new members since 1982 - a baby and four
relatives who joined the household - thus increasing the demand
upon decreasing resources. Apart from putting an end to
r e m i t t a n c e s the loss of the head's job a p p e a r e d to have
demoralized the family. Whereas in 1982 a number of members of
the household were involved in a variety of activities, In 1985
only one was doing grasswork and one selling chickens. In 1982
they had obtained additional income by ploughing for others,
selling piglets and large quantities of grasswork and chickens.
Their cattle herd had increased by seven since 1982 although
three died in 1985. The meat from the dead animals constituted
121
most of the "current income" obtained from cattle in 1985.
The household said they had harvested almost nothing that year
because someone had come in the night and let their cattle out of
the cattle kraal with the result that their crop was destroyed.
They had not actually seen this happening (the cattle were "back"
in the kraal when they awoke the next morning) and their
explanation may be another example of their demoralized attitudes
in 1985.
5. This household whose ranking had fallen substantially had a
number of characteristics which could explain the fall. Whereas
there were five working migrants in 1982, in 1985 there were only
two - one of whom had only just started working. No one was
unemployed in 1982. Two were unemployed in 1985. One son and
his wife and children had left the homestead. Both he and a
sister who also left the household had been employed in 1982 and
remitted to the household. The head was no longer working, one
son had been knocked down by a car and badly injured, another was
unwell and temporarily unable to work. Another daughter had
stopped working and returned home.
In 1982 the household had had a male at home who undertook
agricultural duties and a full span of oxen. In 1985 no men
assisted with agricultural duties and they had no oxen. As a
result the household spent a large sum of money hiring tractors
although they ploughed less land than in 1982. As a result they
122
actually made an agricultural loss whereas agriculture had made a
significant contribution to income in 1982.
6. This household was one part of a household which had split into
four since 1982. In 1982 the household had 19 members, four head
of cattle, two persons in receipt of old age pensions, four
employed migrants and one unemployed person. The household
achieved incomes per capita which were close to the median.
The household in 1985 had eight members, three of whom were
migrants - all unemployed. It no longer had access to a pension
and incomes had fallen dramatically.
7. This household formed part of one which split Into two between
1982 and 1985. In 1982 the household consisted of a three
generational extended family of 23 members. There were four
employed migrants none of whom remitted more than R20 per month.
Average incomes per capita were achieved.
On the head's death two of his sons set up their own households.
Their wives, who had sometimes accompanied them to the work
place, returned home to build new homesteads. This household
which had eight members, was receiving R400 per month from its
migrant head with the result that incomes per capita in the
household changed from average in 1982 to close to the highest in
1985. It would seem that knowing the money was going directly to
his immediate family led to the migrant remitting a far higher
123
proportion of his salary. The amount he remitted was also no
doubt influenced by the return home of his wife and the fact that
she was involved in the expense of building a new home.
The other half of the original homestead showed similar increases
in income levels.
8. Although a number of factors no doubt contributed to this
household's fall in fortune undoubtedly the greatest depletion in
income resulted from the departure of one daughter on her
marriage. She had a knitting machine and had made considerable
sums knitting to order. Her departure unfortunately coincided
with the loss of job by the migrant in the household who had
remitted most in the past. As the migrant had only recently lost
his job the economic position of the household was likely to
deteriorate further as he had remitted money for most of the
twelve months preceding the survey. There were at the time of
the second survey two unemployed migrants in the household. The
only person in the household who was employed was a fifteen year
old farmworker. The position for food production had also
deteriorated in that the family had lost their oxen and had had
to hire oxen to plough for them. They had as a result ploughed
considerably less land than in 1982 and the value of agricultural
production dropped significantly. The head of the house who
lived at home and practiced as an inyanga claimed to make less in
1985 than in 1982.
Despite the marriage of two daughters the number of cattle
124
attached to the household had fallen from twelve to five.
This large household grew by eight members (26 - 34) during the
three years between surveys - all the additional members were
economically inactive which significantly increased the burden on
the income earners who decreased during the period from two to
one. Unemployment increased from one to three persons and
informal sector earnings dropped significantly. The value of
agricultural production was negated by the cost of hired labour
which the head insisted upon using despite his large unemployed
household. Significant amounts of "income" were attributed to
the household to account for the value of meat taken from dead or
slaughtered animals and for milk used for household purposes.
All this "income" was achieved at the cost of assets. During the
year nine animals died and two were slaughtered. Another nine
head were transferred out as lobola. During 1985 the household's
cattle holding decreased by fifteen and they had thirteen less
head in 1985 than they did in 1982.
This household was one part of a household which had split into
four since 1982. In 1982 the household had nineteen members,
four head of cattle, two persons in receipt of old age pensions,
four employed migrants and one unemployed person. The household
achieved incomes per capita which were close to the median.
In 1985 this household had only two members - an old age
pensioner and an employed migrant. The migrant's wife and
125
children had recently been struck dead by lightning. This
household achieved the highest incomes per capita of all
surveyed.
11. This was a household where incomes increased although the
circumstances of the members could hardly be termed cheerful. An
old man of 66 lived alone with his 29 year old son. The old man
had no pension and his feet troubled him making him unable to
continue practicing as a herbalist as he had in the past. His
sole income was obtained from the sale of pineapples which he
grew. He paid the people who worked his fields with pineapples
and he paid someone R20 to plough two isikofu for him so that he
could plant mealies. His son (who was in hospital with
tuberculosis In 1982) was at home, still 111 and unable to assist
the old man in any way but he was, by 1985, in receipt of a
disability grant.
In 1982 the household had contained in addition the head's wife,
a daughter and three grandchildren. The wife who had been 1n
receipt of a pension died in 1985 and the daughter and her
children left to join her mother (the head's second wife) who had
left the home some time ago.
Despite the loss of the wife's pension, and the fact that both
members of the household were unemployed, the reduction in the
number of dependents in the household and the fact that the
invalid son obtained a disability grant led to an Improvement in
ranking.
126
12. The Improvement in this household's fortune can be attributed
almost entirely to employment. Little else had changed apart from
the fact that in 1982 the household was entirely dependent on the
mother's pension whereas in 1985 her son had managed to obtain
employment and remitted money regularly to his family.
13. This household's decline in fortunes despite the fact that in
1985 it contained two pensioners in place of the one it had in
1982, is attributable to its increase in dependent members and
the fact that two members had lost their jobs. In addition two
sons were in the process of paying lobola and if it were not for
this fact they might have remitted more to their families.
14. This household whose ranking improved dramatically is another
e x a m p l e of the false i m p r e s s i o n that can be created by
considering the money from cattle sales as income.
The household was one which had split since 1982. Three new
members had joined the household which now had eight in place of
twelve members. The household still had one employed and one
unemployed member, had thirteen as opposed to fourteen head of
cattle and continued to plough with its own oxen.
During the year the household had been forced to sell three head
of cattle to meet expenses incurred in connection with the son's
illness and certain lobola payments. If this money had not been
included in income the household would have barely altered its
127
ranking. The i m p r o v e m e n t in ranking was almost totally
attributable to the sales which represent a long term decrease in
assets even if they had the effect of improving the immediate
income flow.
15. Although this household had fallen 34 percent on the income
ranking this is probably not the full reflection of what had
happened to it. The head of the household had only recently lost
his job and had remitted regularly while still employed. The
remittances for the part of the year during which he was employed
were included when calculating incomes. The household had also
sold a cow to meet household expenses when the remittances dried
up and this too was included in income.
Whereas previously they had ploughed their own land the oxen they
had in 1985 were untrained with the result that they had had to
hire a tractor to plough their land. They had also ploughed
considerably less land than they had in 1982.
6.4 The Changing Fortunes of Households Which Split
Four households split betwen 1982 and 1985. It 1s informative to
compare the different fortunes of the component parts after the
splits.
1. In 1982 this household had 29 members who achieved annual incomes
per capita of R57,00. Sometime before the resurvey the household
128
split and in 1985 one of the new households realized incomes of
R39.10 (in 1982 terms) and the other R127.57 (in 1982 terms). In
1982 there had been six employed and three unemployed persons in
the household. There were no pensioners in the household and
over 80 percent of household income consisted of migrant
remittances. The household had three head of cattle.
In 1985 the household in which income had fallen had 25 members
of whom three were employed and four unemployed. The three who
were employed comprised the head, who although 72 had not yet
applied for a pension, one son who had started work a month
previously and another who had not been heard of for months. The
chief income contributor had lost his job two months previously.
Despite the fact that they had thirteen head of cattle they had
no oxen with which to plough. They had had to pay someone to
plough their land and had only ploughed less than half of it.
The household in which incomes had risen had twelve members, four
of whom were employed. The head who had not worked for years had
not, although pensionable, applied for a pension because he had
not paid his taxes. His wife who was disabled said she could not
apply for a disability grant because she could not afford to go
to a doctor. They had no cattle.
The combination of a decrease in household size and an increase
in employment ensured that one household's income rose whereas a
fall in employment accompanied by a number of dependent relatives
joining what would otherwise have been a smaller household led to
129
a decline in incomes in the other household.
2. This was a house in which a man, his mother, two wives and seven
children lived. The mother had an old age pension and one of the
wives a disability grant. One son was a migrant worker but
remitted nothing. The head of house occasionally built house
frames and one wife did the odd thatching job but basically there
was no income in the household other than the two pensions.
In 1982 there had clearly been tension between the two wives and
when we returned in 1985 we found the household had split. The
husband was living with the wife with the disability grant and
her children and the other wife had set up a separate home with
her children and her mother in law who had an old age pension.
In the first house the migrant son continued to remit nothing and
the man and his wife no longer did any building or thatching. In
the new house one son had found employment locally at a shop. In
the first house incomes fell marginally whereas in the new house
the son's locally earned salary had the effect of increasing
incomes.
3. In 1982 this household was headed by a very old man who was deaf
and blind. Both he and his wife had old age pensions. The
household had 23 members and 9 head of cattle. There were four
migrant workers in the household but none remitted more than R20
per month. The sons' wives often accompanied their husbands to
their work place, sometimes with some of their children. Before
his death the head instructed his sons to establish their own
130
homesteads. In 1985 we found two households, one with eight
members and the other with nine. One of the son's second wife
and two children had left home. One household had nine head of
cattle and the other two. Both households were busy building new
homes and in one an outsider was being paid R300 to build a
cattle kraal. One head was remitting R400 per month to his wife.
It is possible that once the building was complete the head might
reduce the amount he remitted but it would seem that where a
household consists of a man's immediate family only, he is likely
to remit a far larger percentage of his salary knowing that all
he sends is going direct to his family (see 6.2.2). In this
case, although the people involved were basically unchanged
following the split, incomes in both households increased
markedly. It appears that when migrant workers are accompanied
by their wives to the work place they remit very little to their
rural homes even if their children are left there. One of the
heads in this case had a house in Johannesburg but feeling he
would be unable to retire there he was concerned to establish a
decent home in the country.
4. In 1982 the household consisted of nineteen members. The head had
recently died but his two widows, their sons and wives and
children were still all living together. The homestead had four
head of cattle, two members (the widows) who received old age
pensions and five migrants, four of whom were employed and
remitted money to ther families at home. The one unemployed
migrant was ill and unable to work at the time. Although it was a
relatively large household average incomes per capita were
131
achieved - R149 per capita per annum when the median income par
capita for all surveyed was R144.
Before his death the head had instructed his sons to establish
their own homesteads and this they did sometime before the return
survey in 1985. In 1985 four households with a total membership
of 22 had replaced the single 19 member household. None of the
households had any cattle. The level of income achieved in two
of the households was similar to that achieved in 1982 in that it
was close to the median income of all surveyed but in one the
highest per capita incomes of all surveyed were achieved and in
the fourth incomes close to the lowest.
One of the two households where income levels were unchanged had
five members, one of whom was a migrant who had recently been
retrenched and had been unable to find other employment. The
household at the time of survey was living off Income saved
during the last year while the head was still employed and
remitting. Incomes in this household are thus likely to fall in
ensuing months unless one of its members finds employment.
The other household where incomes were similar to those achieved
in 1982 had eight members, two of whom were employed migrants.
One member of the household was in receipt of an old age pension.
The household head stated that as he was the only son of his
mother there was no need to share her pension with his brothers
who were the children of his father's other wife.
132
The household which following the split received the highest
income recorded in the re-survey had two members one of whom was
an employed migrant. The migrant's mother who lived alone at
home had an old age pension. The migrant's wife and two children
had recently been struck dead by lightning.
The household in which incomes had fallen dramatically had eight
members - three of whom were migrants - all unemployed. The head
of the hosehold who was ill 1n 1982 was still 111 and unemployed.
The fate of the members of the original household subsequent to
the split clearly indicates the importance of access to
employment or pensions, or both. All four households which were
situated next to one another, had access to land. They had all
made use of their land the previous season and all had had to pay
someone to plough their land for them - none of the households
had oxen or indeed any cattle. None had any male assistance with
agricultural chores. Indeed, in each household there was only
one woman who worked the land except in the household which
achieved the lowest incomes where there were three women and one
girl who worked the land.
133
CHAPTER SEVEH:
7.1 The Future: Is There One?
The original survey in 1982 indicated that incomes, living conditions
and lifestyles in the survey area were largely determined externally
in the core economy. The 1985 resurvey not only confirmed this but
showed that most changes which occurred between surveys were likewise
externally sourced.
The general recession in the core economy resulted 1n growing
unemployment. Increased real wages led to an increase in the level of
remittances and, similarly, a real increase in pension payments and
improved coverage led to an Increase in income from this source. The
growing numbers of unemployed reduced the opportunities for those
normally resident in the area to earn incomes from casual employment
or informal sector activities. Subsistence Income continued to
decline in the face of, amongst other factors, the persistence of
government policies in regard to commercial agriculture 1n the core
economy, the migratory labour system and the continued absence of any
agricultural support mechanisms 1n the area. In short the surveyed
community's dependence on the core economy, and with it Its
vulnerability, had increased.
It is not only lifestyles and income levels in the area which have
been determined by the policies of Pretoria. This 1s also true of the
very structure of the population Itself, numerous legislative
measures such as the Influx Control laws, the Group Areas Act and the
134
Land Acts have unnaturally determined the composition of rural
societies. Proposals for the development of such areas which do not
take both existing and possible future legislation and policies of the
central government into account are accordingly valueless.
Development recommendations which are not premised, for example, on
the likely effects of the government's policy towards 'normal
urbanization' or the role foreseen by Pretoria for h o m e l a n d
agriculture will bear little relation to reality. Rural communities
may be physically isolated from the core economy but there is no
aspect of their lives which is not dominated by it.
Past legislation and economic policies have prevented agricultural
development in the periphery. However, even if these policies were to
be reversed and agriculture given the support it requires to grow,
the development of the majority of existing rural populations could
not be agriculturally based. Realization of this fact might be
expected to lead some rural dwellers to urbanize if they were legally
able to and if conditions in town were comparable to (even if not
•preferable to) those in the countryside. Others, appreciating that
agriculture held no future for them, might be expected to adopt new
land use and settlement patterns within the area in an attempt to
facilitate their participation in some other form of development or to
gain improved access to certain amenities. Without some knowledge of
the legality and likelihood of such developments it will be
impossible, for example, to attempt to provide adequate facilities for
the current community in such a way that will not lead to unnecessary
135
or misplaced facilities in the future.
One of the most immediate and important needs of the survey area is
improved educational facilities. At present these are erratically and
illogically dispersed across the countryside. Their location is
determined by the presence of persons with Initiative and fundraising
ability in a particular area and not, either by where there are
concentrations of children of schoolgoing age who are without a
school, or by accessibility to existing or future transport routes or
growth points. If educational facilities were to be increased to
acceptable levels for the current population, future likely population
densities and settlement patterns should be taken into account so that
where facilities currently required appear likely to exceed future
demands mobile or temporary facilities could be provided and permanent
facilities centralized and positioned where future growth points are
likely to develop.
While the area is forced to accommodate the density of population it
currently holds on the presumption that the community subsists off the
land little development other than in the spheres of education and
health seems possible. If, however, there was some alteration in this
premise other developments would be facilitated. Productivity levels
from stockholding could be improved and crops such as timber or tea,
whose cultivation would be possible and economic in the rugged terrain
and whose development would not lead to the degradation of the
environment, could be introduced. Agricultural projects do not,
however, hold out opportunities for the majority of the population and
136
projects, other than agricultural ones, will have to form the basis
for the development of the majority of the community. Such projects
might of course be based upon processing the product of agricultural
projects.
The impact of any project upon the community and its economic success
or failure will be dependent on the context within which it is
introduced. This remains entirely in the hands of the central
government. Until local communities have at their disposal a
democratically based mechanism through which they can bring pressure
to bear on the central government, it is unlikely that changes will be
introduced which place homeland agriculture or industry on an equal or
competitive footing with the core economy, or which will ensure
equality of access to any new development to all members of rural
communities. Inequalities in rural incomes and lifestyles may only be
exacerbated by projects which are introduced without consideration of
the implication for the entire community. Developments which benefit
males at the expense of females, the old at the expense of the young
or those with access to capital at the expense of the destitute may in
the long term do damage to the wider community despite the fact that
they may lead to increased production. Such an outcome is quite
possible where changes are introduced not as a result of community
based responses to needs but as part of a plan to increase, for
example, 'agricultural output'.
137

APPENDIX A: DIFFICULTIES ASSOCIATED WITH ESTIHATIN6
RURAL INCOMES AND THEIR DISTRIBUTION
The difficulties associated with obtaining estimates of Incomes from
extended families In rural areas were well Illustrated In the
resurvey. The experience of the first survey led to certain changes
in methodology in the resurvey. and the resurvey Itself rfevealed
further shortcomings. The particular difficulties encountered 1n
rural areas are those associated with placing a value on subsistence
output (Appendix B) and with quantifying produce of which there Is
ongoing consumption. A number of refinements were introduced with
regard to the evaluation of crops and stockholding, but the resulting
figures are still only 'estimates' and many factors remain unaccounted
for.
Apart from the Inherent unreliability of "income" figures a number of
other difficulties are encountered defining rural Incomes. Firstly 1t
is necessary to define the recipient units of such Incomes (Martin,
1987; Russell, 1984). Arguments In favour of the selection of the
household as the recipient unit were particularly acceptable in the
survey area where households constitute clearly identifiable and
discrete units, where almost all households derive some income from
jointly held assets, where most households are involved in joint
efforts to produce resources subsequently shared by all members, where
the majority of households are dependent on remittances from
Individual migrant members, where no one lived 1n an institution and
where even those very few who lived alone lived in households which In
other respects resembled those with many members.
138
The second difficulty relates to determining whether the different
levels of income and degrees of poverty resulting from that income
distribution are more accurately reflected when incomes are measured
per household or per person. Table 35 which gives both household and
household per capita incomes shows that the two measures frequently
reflect very different pictures. Such differences between the two
measures would seem to be the rule rather than the exception (Kuznets,
1976). This makes it necessary to decide which is appropriate in the
circumstances or whether both are required, with one being relevant in
some Instances and the other in others.
It may be argued that per capita or per person income figures are
meaningless where per person expenditure patterns are not known.
Expenditure studies generally reveal only the amounts spent on various
items by households and not individual members of those households
(Kuznets, 1976). Very few such studies have been conducted in rural
areas and there is no data available Indicating on behalf of which
members of the household expenditure on clothes, medicine etc was
incurred (Hay, 1987; Cragg, 1984). It is an undoubted shortcoming
that such information is not available but just as the impossibility
of attributing certain items of income to Individual members of an
extended family need not prevent the addition of that income to the
household's total from which per person income 1s subsequently
calculated, so the inability to allocate expenditure to individuals
need not undermine the validity of the per capita measure. Household
per capita income figures reflect merely the mean personal income in a
particular household and make no pretence to reflect individual
incomes.
139
Where expenditure data is available it may be possible to develop a
formula reflecting the different consumption levels of persons of
different ages, sexes and occupations and to calculate household per
capita incomes accordingly. Even where such data is not available,
people may, on the assumption that juveniles consume a fraction of
what adults consume, develop a formula which may simply differentiate
on a 2:1 basis between adults and juveniles or which may be adjusted
for age. However if such a formula is to have real value it must be
related to the facts of the cases to which it is being applied. As
the needs and nature of dependents and consumers differ In urban and
rural situations and in different societies or countries, it is not
possible to develop a formula which is generally applicable. Although
no expenditure data was collected 1n this study, much of the
information which was collected indicates that it would be wrong to
assume that the amount expended on juveniles was significantly less
than that spent on adults.
Children's clothes may be cheaper than adults', but children grow out
of and wear out clothes which therefore have to be replaced more often
than adults' clothes. In a traditional rural environment, where very
few are locally employed, adults in general need fewer and less
expensive clothes than they would in an urban environment. Children
in such areas still however require school uniforms which generally
are more expensive in rural stores than urban hypermarkets.
Medical expenses often loom large in the expenditure of rural
households. These are more likely to be Incurred in connection with
140
children than adults with the possible exception of the aged and
pregnant women. An important item of expenditure linked to medical
expenditure is transport costs. These are also incurred travelling to
shops and magistrates courts and occasionally to school. Host of this
expenditure could be attributed to juveniles (who anyhow constitute
over half of the surveyed population) and not as in an urban
environment to adults who almost all incur transport costs travelling
to and from work. If migrants are excluded when calculating household
per capita incomes in a rural area, all monies normally expended in
the course of employment - on clothes, travel, refreshment etc -
become irrelevant.
School fees and expenditure on school books are only incurred in
respect of juveniles as are the administrative and travelling expenses
incurred registering births, obtaining identity documents etc.
In areas such as that surveyed there seems little justification for
assuming that expenditure on juveniles is only a fraction of that on
adults. In the absence of such evidence, the lack of data on
expenditure patterns and the consequent impossibility of calculating
"adult equivalents" need not preclude the use of per capita income
measures. Although the consumption of household income by household
members undoubtedly varies widely the differences are probably not so
great as to undermine the value of the per capita measure.
The equal division of household income amongst members in order to
achieve a household per capita figure is not only criticised for
141
making no allowance for the varying levels of consumption of different
members but also for making no allowance for economies of scale and
pooling of expenses. These may be significant where houses are bought
or rented, where rates, water, electricity, etc have to be paid for or
where people share an asset such as a fridge, stove or car. However
in a rural area none of these costs is incurred and there are no such
savings with regard to food, clothing, medical attention or public
transport. In rural areas houses, fuel, etc are generally obtained
without any cash outlay. However, the large household does of course
have greater access to labour for housebuilding, water and fuel
gathering, crop planting etc.
The calculation of income by household which allows for economies of
scale and does not necessitate the calculation of adult equivalents
may be the preferable measure where the households under consideration
are similar in size and structure, but where these vary widely some
recognition must be given to these differences. If what 1s being
measured is the extent of poverty rather than the nature of and
reasons for certain income flows, and poverty is defined by reference
to ability to fulfil certain basic needs, then it must be the
household's ability to meet those basic needs that should be measured
and not its income. This ability is determined by the number of
persons reliant upon that income to meet their basic needs. Ranking a
household with 25 members and an annual income of R2000 above a
household consisting of a lone pensioner who receives only his pension
of R780 per annum makes no sense in a poverty study and yet this would
be the result in the large number of cases where the size and
structure of households surveyed vary widely. In this study the mean
142
household size was 8,68 but half the households had less than six or
more than eleven members. It is for these households that household
income figures may give a false impression. Where there are only a
few outliers this may not be important but in this survey almost half
the cases can be considered "outliers".
In order to test the discrepancy between household incomes and incomes
per capita all households were ranked according to both scales and the
first ranking was then subtracted from the second. It was found that
on average the 74 households for which incomes were calculated in 1985
changed 19,5 places between the two rankings and that half the
households changed more than sixteen places. All the households which
moved nineteen or more places were found to have either four or less
members or eleven or more - in other words they were all abnormally
large or abnormally small households. With a few exceptions it was
also true to say that all abnormally large and small households moved
an above average number of positions. The average move for households
with four or less or eleven or more members was 29,8 places. Only
five percent of households appeared in both the top quintile of
household and household per capita incomes.
It is the presence of this significant number of very large and very
small households which causes the two measures to come up with
different results in specific cases. A field inspection of households
would appear to indicate that as a measure of individual poverty
rather than household income the per capita measure reflects the facts
more accurately. Household incomes show households where there are no
143
migrants to have exceedingly low incomes and yet these households
include a number of small households which are in receipt of pensions
and above average incomes from agriculture and the informal sector.
The health and prosperity of the household members belles their low
rating in the household income hierarchy.
Households with migrants rank high in household income terms. Average
per capita incomes in households with migrants were however a little
lower (R263.50) than in those without migrants (R295.00). The
household measure is insensitive to the number of dependents reliant
upon a remittance which in per capita terms shows itself to be more
important than the number of migrants although the test showed both
measures to be Influenced positively by the presence of migrants in
the household.
Generally the household measure is less sensitive. Where incomes are
as low as they were in the survey the loss of a migrant's job may have
a devastating impact on those dependent upon his remittance. In
household terms the loss of one remittance may not make a significant
difference. Its real significance will be determined by the number of
people dependent upon the income and any alternate sources of income -
both of which are reflected in the per capita measure.
The household income measure will also be found to be unsatisfactory
when comparing rural and urban incomes or the incomes of households
containing persons from different countries or race groups because
there is generally a large variation in the average number of members
144

in the households belonging to these different groupings.
145
APPENDIX B : EVALUATING SUBSISTENCE PRODUCTION
B.l Introduction
The problems associated with the economic analysis of subsistence
production are multlfaceted. Economic analysis may reflect, albeit 1n
cash equivalents, all the misconceptions which may be encountered in
any other form of analysis (e.g. biological or nutritional) and in
addition is only practical where there exist markets which assign
numerical values i.e. prices, to goods and services (Behnke: 1985).
Subsistence production by definition never reaches the market and
numerical values therefore have to be assigned. Apart from the price,
measurement of the product Itself is difficult as there 1s frequently
ongoing consumption and no formal records of the total harvest are
likely to be available. Further complications result from the fact
that the cultivators and consumers of subsistence production are
frequently the members of complicated extended families whose
relationships with one another cannot be readily determined.
There is no generally accepted rule for assigning cash values to
subsistence crops and livestock production. At times use is made of
farm gate prices, at others opportunity or replacement cost. In
subsistence based communities Items may be infrequently traded both
because self-sufficiency is the aim and because the farm gate price
does not reflect the value of the commodity to the subsistence farmer.
A cattle price which only reflects the animal's red meat value may be
unrealistic to the subsistence farmer who In addition obtains milk and
manure from his cattle and uses them to plough. Sales will
146
nevertheless occur from time to time at this "unacceptable" farm gate
price where the farmer has no other means of financing essential
purchases but this would not justify valuing his entire herd at farm
gate prices. Similarly certain crops may have greater value as animal
fodder than as marketable produce or the farm gate price may simply be
below the farmers replacement cost. The use of the products'
replacement value in preference to farm gate prices allows for more
accurate evaluation of the product to the subsistence household. It
is not however always clear how the replacement cost should be
calculated and the figures used vary widely from one study to another
and one area to another. This makes comparisons difficult and
necessitates explanation of how the values in a particular study were
calculated. In Section 6.0 of this Appendix the values placed on
agricultural production in this survey are explained and in Appendix C
the values placed upon stockholding.
B.2 Agricultural Production Evaluation
As no records of agricultural production were available for the
households surveyed estimates had to be made so that the value of
subsistence income could be added to income from other sources in
order to determine total household income. The figures thus derived
are essentially estimates and make no allowance for differences 1n
yields between different farmers or indeed different fields.
In both 1982 and 1985 field sizes were estimated "by eye" and no
accurate measurements were made. Respondents were asked what
percentage of their land they had ploughed and in 1985, they were also
147
asked whether the yield had been good, fair, poor or non-existent.
When calculating the value of agricultural production in 1982 we had
presumed a yield of 4,5 bags maize per hectare on the basis that the
average yield of dry maize in KwaZulu was three bags per hectare and
that at the time of harvest one third of the crop had already been
c o n s u m e d green. I n f o r m a t i o n obtained in 1985 showed that
approximately half the maize crop was consumed green and we therefore
presumed the yield to be 6 bags per hectare. The value of a bag was
put at R36 in 1985 - the average price at local stores. The figure of
R20 used in 1982 was obtained in the same way. When recalculated in
1980 prices according to the Consumer Price Index the 1985 price (R21)
was higher than the 1982 (R15) price. The final value of the presumed
yield in 1980 prices for 1985 was R112 per hectare whereas that for
1982 was R68.
In the resurvey, as a result of the more thorough collection of
relevant data, it was possible to deduct many of the costs incurred in
agricultural production from the value of the production. Thus any
expenditure on seed, fertilizer, ploughing or labour was deducted.
However, there was still no deduction for the labour Input of
household members. As in 1982 where people hired oxen to plough the
actual cost was deducted from the value of the produce but whereas in
1982 no deduction was made where people used their own animals to
plough, in 1985 the average cost (R75 per hectare) was deducted in
such cases. (The costs Incurred in this way were neutralized when
considering total household income as an equivalent amount was added
Into the current disposable income achieved as a result of owning
148
cattle (see B.3)). No deduction was made where people used their own
seed for planting although they would have consumed or sold this seed
had it not been planted.
Despite the fact that the final value of the presumed yield was higher
in 1980 prices in the 1985 survey than in the 1982 survey the final
value attributed to total agricultural production for all households
surveyed in 1985 (R2 341.69) was less than that of 1982 (5 827.60)
even without taking inflation into account. To establish whether
agricultural production had declined or whether the value attributed
was lower because expenses had been deducted in 1985 which were not
deducted in 1982 the value of agricultural production in 1985 was
recalculated according to the 1982 formula. The figure for total
agricultural production in 1985 thus calculated (R4 074.46) was
equivalent to 70 percent of the 1982 figure which confirmed that
agricultural production had in fact declined. The value of the mean
household production in 1985 was 64 percent of that in 1982 when
calculated this way.
Where households had vegetable gardens or contained a member of a
community garden and they had made use of these gardens and harvested
something R40 or R60 respectively (or a percentage thereof in the case
of partial use or harvest) was added to that household's income.
The value of crop production (which included monies received from the
sale of produce) together with the value of garden production
constituted 12,2 percent of subsistence income.
149
11.3 Subsistence Income from Stockholding
The majority of subsistence income was derived from stockholding. The
value placed upon stockholding consisted of the following:
the income from cattle sales
the income from ploughing for others
the value of ploughing own land
the value of meat from slaughtered animals
the value of meat consumed from dead animals
the value of hides of slaughtered and dead animals
the value of milk/maas where consumed.
In a number of respects the values relating to stockholding in 1985
were estimated differently from those used in 1982. In 1982 no value
was placed upon ploughing for oneself1. Nor was any value attributed
to hides. In 1982 consumption of milk was assumed wherever there was
a calf. However, as a result of a number of consecutive drought years
many households had ceased taking any milk in 1985 considering that
the entire production was needed by calves, and therefore in 1985 we
only placed a value upon milk consumption where the household actually
consumed milk. Significantly higher values were placed upon meat from
slaughtered and dead animals 1n 1985. The effect of this Increase was
multiplied by the very much larger number of deaths which occurred in
1985 (67 as opposed to 26 in 1982).
1. In terms of total subsistence income however this value becomes irrelevant as it is cancelled out by the charge levied against agricultural production for ploughing for oneself.
150
B.4 Income versus Dissaving
Where beef production Is practised as an economic enterprise
consumption or sales are the intended sources of income for the
stockholder. However, where consumption or sale occur, not because
that was the ultimate intention of the stockholder, but because he has
been forced to do so by circumstances beyond his control, the proceeds
of such sales or the value of meat consumed etc may not in fact be
income but monies or values received in exchange for or on the loss of
an asset and accordingly represent a form of dissaving. It could,
therefore, be argued that such monies have no place in an income
study. However, in a community where incomes are as low as they were
in the surveyed community if these monies were not included in income
it would be impossible to explain how certain households survived. In
the interests of reflecting the survival mechanisms operating in
households which would otherwise appear to have expenditure far in
excess of income these amounts have therefore been considered income.
Although explaining survival mechanisms this inclusion can create
false Impressions as was well illustrated when the fifteen households
whose incomes had risen or fallen most in the three years between
surveys were closely investigated (see 6.3).
The economic position in a number of the households where incomes
appeared to have improved, far from improving had in fact deteriorated
to the point where a number of cattle had to be sold to meet
outstanding debts and purchase necessaries. Although the proceeds of
151
the sales resulted in an immediate inflov/ of cash into the household
this in no way implied that this new level of income was likely to be
maintained. The reverse would have probably been the correct
implication.
B.5 Subsistence Contribution to Household Income
The percentage of total household income obtained from subsistence was
similar in 1982 (18,3 percent) to that in 1985 (18,0 percent). This
is surprising in view of the fact that the value ascribed to
agricultural production had fallen in both actual and real terms.
When translated into 1980 prices according to the Consumer Price Index
its 1985 value was less than a third of its 1982 value.
The maintenance in the level of the contribution of subsistence to
total income is explained by the fact that the current disposable
income attributed to stockholding grew by over thirty percent over the
three years and that, whereas in 1982 no value was placed upon the
home consumption of chickens, goats, sheep and pigs, in 1985 it was
assumed that households consumed 40 percent of their chickens during a
year, and 10 percent of their goats, sheep and pigs. Chickens were
valued at R4 each and goats, sheep and pigs at R60. The sum thus
calculated constituted 10 percent of the total value of subsistence
income. When the value of the sales of small stock was added 1n, the
percentage of subsistence income derived from small stock holding rose
to 14,3 percent.
152
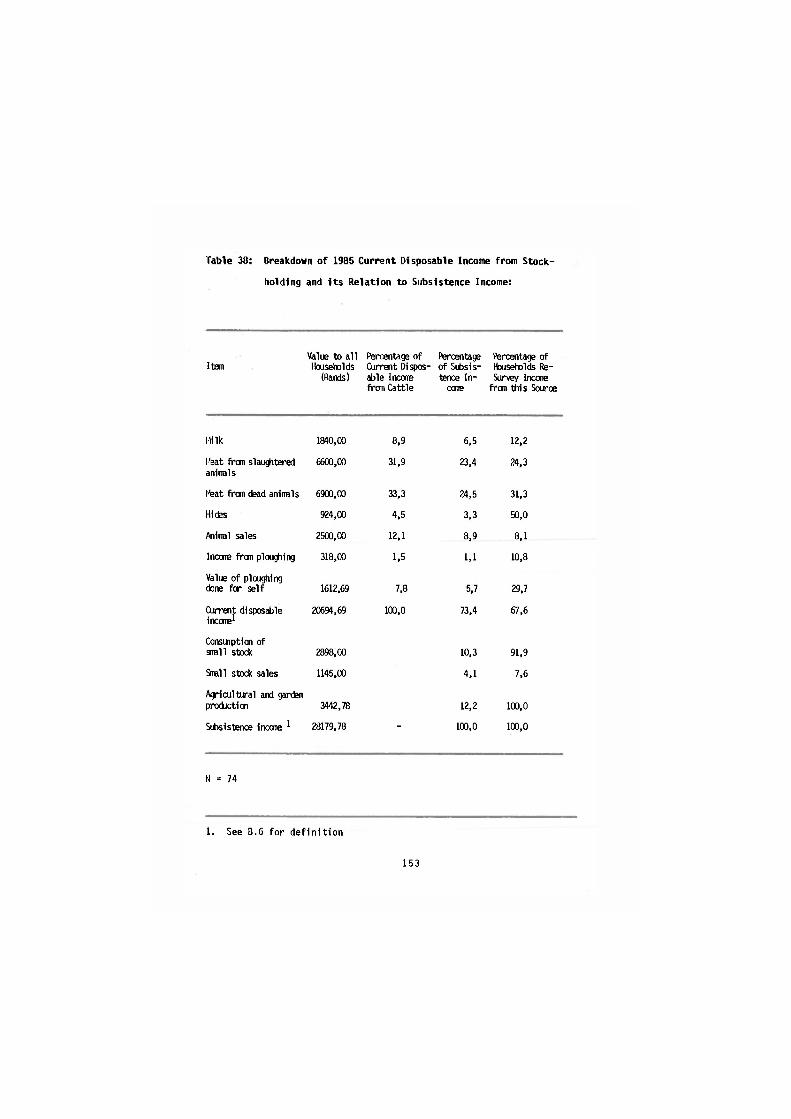
Table 38: Breakdown of 1985 Current Disposable Income from Stock-
holding and Its Relation to Subsistence Income:
Item Value to all Households
(Rands)
Percentage of Current Dispos-able Incare from Cattle
Percentage of Sifcsis-tence ln-cone
Percentage of Households Re-Survey Incare frcm this Source
Milk 1840,00 8,9 6,5 12,2
Meat from slau^itered animals
6600,00 31,9 23,4 24,3
Meat from dead aniimls 6900,00 33,3 24,5 31,3
Hides 924,00 4,5 3,3 50,0
Animal sales 2500,00 IZA 8,9 8,1
Income from ploughing 318,00 1,5 1.1 10,8
Value of ploughing done for self 1612,69 7,8 5,7 29,7
Current disposable income1
20691,69 100,0 73,4 67,6
Consunption of small stock 2898,00 10,3 91,9
Small stock sales 1145,00 4,1 7,6
A<j»icultural and gardsn prediction 3442,78 12,2 100,0
Sifoslstence irtcone 1 28179,78 - 100,0 100,0
N = 74
1. See B.6 for definition
153

B.6 Details of Individual Evaluations
Details are given below of the individual evaluations which were made
in order to attribute values to agricultural production, current
disposable income from stockholding, small stock consumption and
finally the subsistence income of each household.
1. Value of agricultural production:
Amount of land available to household (hectares) x percentage
ploughed x nature of yield (good, fair, poor, or nil represented
as 1, 0,8, 0,4, and 0) respectively x 6 bags at R36 each less
actual cost of hiring oxen or labour, less price of fertilizer
ior seed, less R75 per hectare for use of own oxen, plus actual
proceeds of sale of agricultural produce.
2. Value of use of own oxen to plough:
Amount of land in hectares available to household x percentage
ploughed x how ploughed (by oxen = 1, partially by oxen = ,5, by
hand, tractor etc = 0) x own oxen (all own oxen = 1, half own,
half another's oxen = ,5, no oxen = 0) x R75 (R75 was the average
price paid per hectare by those who paid others to plough).
3. Value of vegetable garden production:
Access to vegetable garden, x did (1) or did not (0) harvest
154
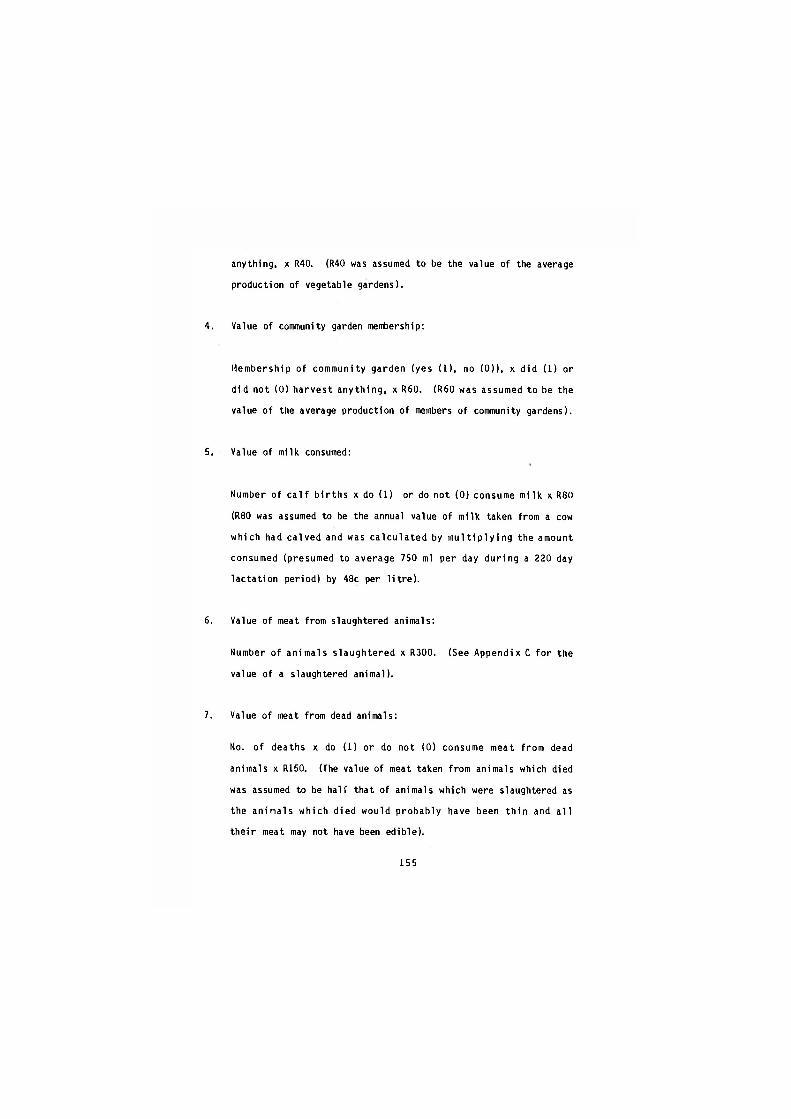
anything, x R40. (R40 was assumed to be the value of the average
production of vegetable gardens).
4. Value of community garden membership:
Membership of community garden (yes (1), no (0)), x did (1) or
did not (0) harvest anything, x R60. (R60 was assumed to be the
value of the average production of members of community gardens).
5. Value of milk consumed:
Number of calf births x do (1) or do not (0) consume milk x R80
(R80 was assumed to be the annual value of milk taken from a cow
which had calved and was calculated by multiplying the amount
consumed (presumed to average 750 ml per day during a 220 day
lactation period) by 48c per litre).
6. Value of meat from slaughtered animals:
Number of animals slaughtered x R300. (See Appendix C for the
value of a slaughtered animal).
7. Value of meat from dead animals:
No. of deaths x do (1) or do not (0) consume meat from dead
animals x R150. (The value of meat taken from animals which died
was assumed to be half that of animals which were slaughtered as
the animals which died would probably have been thin and all
their meat may not have been edible).
155
8. Value of hides:
(Number of deaths plus number slaughtered) x R12. (R12 was the
average current price realized for hides 1n Eshowe - the nearest
market).
9. Value of current disposable Income realized from stockholding.
Value of milk where consumed plus value of meat from slaughtered
animals plus value of meat from dead animals where consumed plus
value of hides from dead and slaughtered animals plus value of
ploughing own land plus actual income from ploughing for others
plus actual proceeds of stock sales.
10. Value of chickens consumed:
40 percent of chicken holding x R4 each.
11. Value of sheep, goats and pigs consumed:
10 percent of stock holding x R60 each.
12. Subsistence Income
Subsistence Income In 1985 was calculated by adding together the
value of agricultural, vegetable garden and community garden
production, the value of chicken meat, goat meat, sheep meat and
plgmeat consumed, the value of all stock sales and the current
156
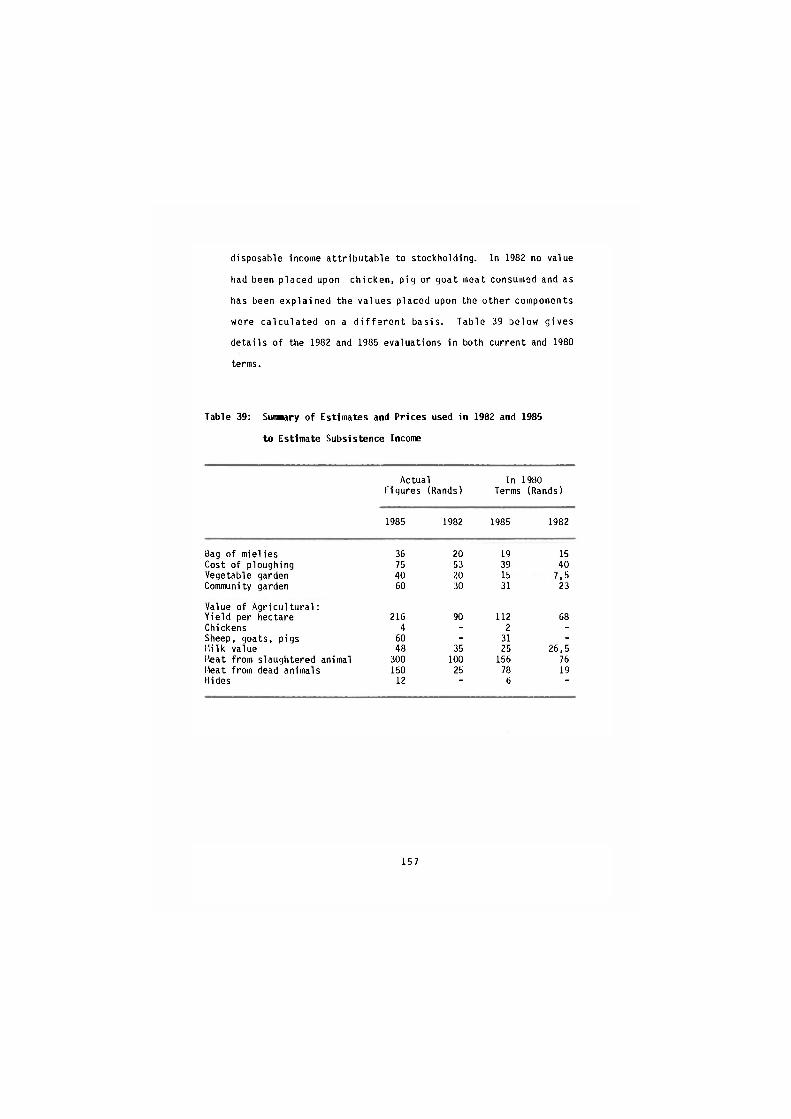
disposable income attributable to stockholding. In 1982 no value
had been placed upon chicken, pig or goat meat consumed and as
has been explained the values placed upon the other components
were calculated on a different basis. Table 39 below gives
details of the 1982 and 1985 evaluations in both current and 1980
terms.
Table 39: Sumary of Estimates and Prices used in 1982 and 1985
to Estimate Subsistence Income
Actual In 1980 Figures (Rands) Terms (Rands)
1985 1982 1985 1982
Bag of mielies 36 20 19 15 Cost of ploughing 75 53 39 40 Vegetable garden 40 20 15 7,5 Community garden 60 30 31 23
Value of Agricultural: Yield per hectare 216 90 112 68 Chickens 4 - 2 -
Sheep, goats, pigs 60 - 31 -
Hilk value 48 35 25 26,5 Meat from slaughtered animal 300 100 156 76 Meat from dead animals 150 25 78 19 Hides 12
" 6
"
157
APPENDIX C: METHODS OF CALCULATING THE VALUE OF STOCKHOLDING
AND THE RETURNS THEREON
In order to assess the economic value of cattle to the surveyed
community it was necessary to determine whether herd value was
increasing or decreasing over time and what levels of return on assets
cattleholders received.1
We had available for the purposes of making this assessment the
cattleholding of the surveyed households in 1982, 1984 and 1985, as
well as information concerning purchases, sales, deaths, births,
lobola transactions etc. However, in order to put a financial value
on stockholding it was necessary to attribute a certain value to each
animal. Where sales or purchases occurred the value of the animal
could be fixed at the price at which it was transferred. Where an
animal died, was slaughtered, or was transferred as part of a lobola
transaction or remained in the herd the animal's value had to be
estimated and the question therefore arose as to how this value was to
be calculated. Should farm gate prices or replacement costs be used
and how should these be determined? As explained in Appendix B
replacement costs seem more appropriate than farm gate prices in a
subsistence situation and the following values were accordingly
assigned to the different types of animal.
1. See Appendix B for the method used to calculate current disposable income acquired as a consequence of stockholding and an evaluation thereof.
158
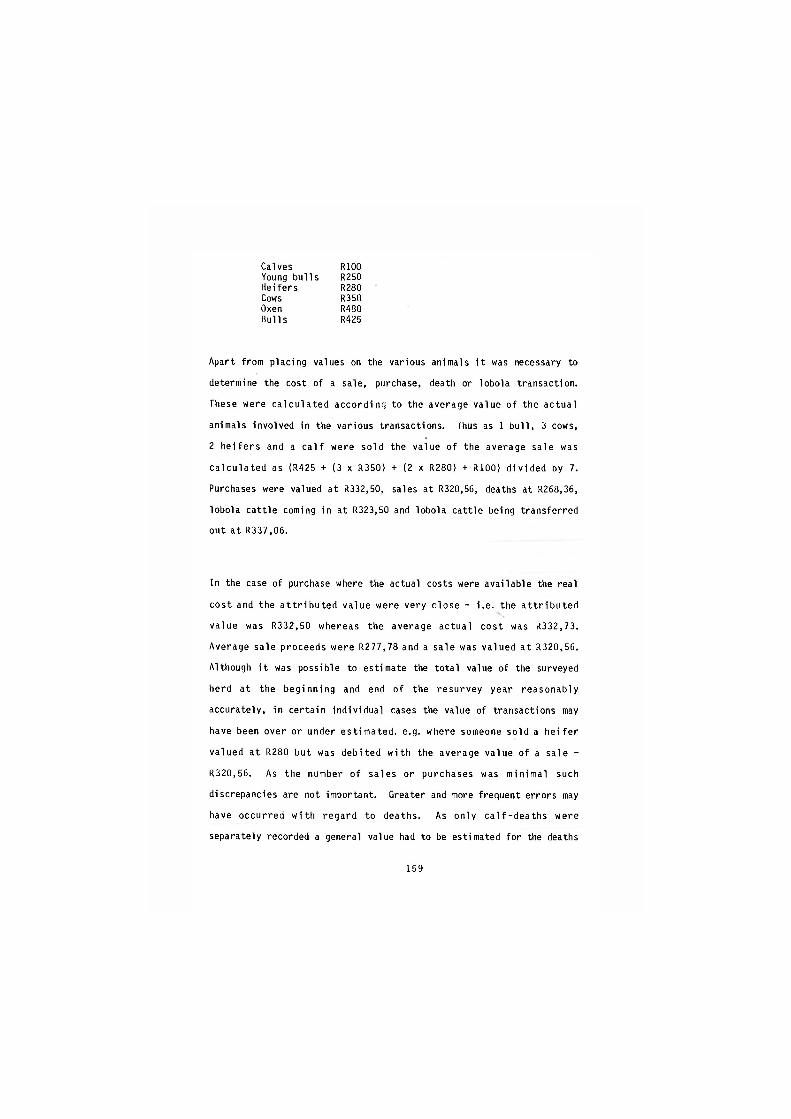
Calves Young bulls Heifers
R100 R250 R280 R350 R480 R425
Cows Oxen Bulls
Apart from placing values on the various animals it was necessary to
determine the cost of a sale, purchase, death or lobola transaction.
These were calculated according to the average value of the actual
animals involved in the various transactions. Thus as 1 bull, 3 cows,
2 heifers and a calf were sold the value of the average sale was
calculated as (R425 + (3 x R350) + (2 x R280) + R100) divided by 7.
Purchases were valued at R332.50, sales at R320.56, deaths at R268.36,
lobola cattle coming in at R323.50 and lobola cattle being transferred
out at R337.06.
In the case of purchase where the actual costs were available the real
cost and the attributed value were very close - i.e. the attributed
value was R332.50 whereas the average actual cost was R332.73.
Average sale proceeds were R277.78 and a sale was valued at R320.56.
Although it was possible to estimate the total value of the surveyed
herd at the beginning and end of the resurvey year reasonably
accurately, in certain individual cases the value of transactions may
have been over or under estimated, e.g. where someone sold a heifer
valued at R280 but was debited with the average value of a sale -
R320.56. As the number of sales or purchases was minimal such
discrepancies are not important. Greater and more frequent errors may
have occurred with regard to deaths. As only calf-deaths were
separately recorded a general value had to be estimated for the deaths
159

of animals other than calves. Stockholders were thus debited R268.36
for a death regardless of whether the dead animal was a young bull
valued at R250 or an ox valued at R480.
Host of the cattle which were held throughout the twelve months
preceding the resurvey would have increased in value during that
period. An arbitrary value needed to be placed upon this
appreciation. During the year calves grew into heifers or young
bulls, heifers became cows etc. On the basis of the values placed
upon calves, heifers, cows etc at the beginning and end of the year it
was necessary that the value of the herd grew through appreciation by
R11305 during this period. 303 head were held throughout the period
and R37.31 (R11305 divided by 303) has therefore been added to the
value of each of the animals held. Unavoidably for some this is an
over-evaluation and for others an undervaluation.
The same values were attributed to the different types of animal at
the beginning and end of the survey year although replacement costs
would not have been identical. Prices in the survey area were
reported to change in response to price changes elsewhere in the
country but increases would seem to be less marked and to lag behind
those elsewhere. There were no public sales held in the survey area
(and indeed none in the entire magisterial district of Nkandla) from
which average prices realized might be obtained. The average price
realized in 1985 for cattle sales from surveyed households was in fact
10 percent below that for 1982. However, too few sales occurred for
the prices to be considered to reflect a trend. The appreciation
160
attributed to all animals held throughout the year would, in the case
of mature animals whose weight did not increase during the year, have
to some extent compensated for the fact that the price at which they
were valued was the same at the beginning and end of the survey year.
An annual return on investment was calculated by adding herd
appreciation (R11305) to the value of calves born (R7100) and the
current disposable income received from cattle1 (R22 638,69) received
during the year preceding the resurvey and relating the total (R41044)
to the value of the herd in 1984 (119550,37). Over the herd as a
whole the return was 34,3 percent. However as not all the calves
lived and much of the current disposable income - viz. meat from dead
and slaughtered animals, hides, milk etc - was achieved at the cost of
loss of a productive asset, a more realistic assessment of the value
of cattle holding would be the net annual return calculated by
subtracting the 1984 herd value from the 1985 herd value and then
adding the current disposable income realized during the year
preceding the resurvey and subtracting the cost of purchases made
during that year.
The percentage return was calculated by relating the total net return
(R9300) to last years herd value. Overall a return of 7,9 percent was
achieved.
1. See Appendix 8 Table 38.
161
REFERENCES
Ardington, E.M., 1984: Poverty and Development in a Rural Area of KwaZulu, Development Studies Working Paper Ho. 9, University of Natal, Durban.
Behnke, Roy H. Jr. 1985: Measuring the Benefits of subsistence versus commercial livestock Production in Africa, Agricultural Systems 16.
Cragg, C., 1984: Estimated Household Subsistence Levels for Transkei Urban and Rural Areas 1983, Carnegie Conference Paper No. 44.
Erskine, J.M. 1982: Agriculture in Natal/KwaZulu: Development Potential, Institute of Natural Resources Monograph 1.
Ingle R.F. and Irwig, L.M. 1982: Transkei Child Mortality Survey 1980: A Preliminary Report, Proceedings of the 7th Biennial Conference of the Transkei and Ciskei Research Society April, 1982.
Kuznets, S., 1976: Demographic Aspects of the Size Distribution of Income : An Explorating Essay : Economic Development and Cultural Change, Vol. 25, Ho. 1, October 1976.
KwaZulu Department of Agriculture and Forestry, Annual Report 1984/85.
Martin, W.G. and Beitel, M. 1987 : The Hidden Abode of Reproduction conceptualizing Households in Southern Africa, Development and Change, Vol. 18, No. 2, April 1987.
May, J.D. 1981, Income and Expenditure in Metropolitan, Urban and Rural KwaZulu, Development Studies Unit, Research Report.
Population Census of the Repbulic of South Africa 1985: Report No. 02-85-02 Central Statistics Services.
Russell, M. 1984 : Beyond Remittances the Redistribution of Cash in Swazi Society, Journal of Modern African Affairs, Vol. .2, No. 4, (1984) December.
Simkins, Charles, 1986: Multiplication Leadership 5/86.
Thorrington-Smith, Rosenberg and McCrystal, 1978: Towards a Plan for KwaZulu, KwaZulu Government.
Wilson, F. and Ramphele, M. 1987: Children on the Front Line, A Report for UNICEF.
162

This work is licensed under a Creative Commons Attribution - Noncommercial - NoDerivs 3.0 Licence.
To view a copy of the licence please see: http://creativecommons.Org/licenses/by-nc-nd/3.0/