Embed Size (px)
Citation preview
RUSSIAN SHOPPERS IN NEW ECONOMIC ENVIRONMENT
RESEARCH FINDINGS
SEPTEMBER 2014

Co
pyr
igh
t ©
2013
Th
e N
iels
en C
om
pan
y. C
on
fid
enti
al a
nd
pro
pri
etar
y.
2
The Client is not authorised to publish and/or adapt this research report,
whether in whole or in part(s), in the press, on the radio, on television, in
leaflets, data search systems, litigations etc. without prior written consent of
Nielsen .
Consent for publication should be sought from Nielsen each time.
CONFIDENTIALITY
Co
pyr
igh
t ©
2013
Th
e N
iels
en C
om
pan
y. C
on
fid
enti
al a
nd
pro
pri
etar
y.
3
THE CONTENT
RESEARCH DESIGN 4
MAIN FINDINGS 5
SHOPPER IN NEW ECONOMIC ENVIRONMENT 8
PURCHASE BEHAVIOUR BY CATEGORIES 14
SHOPPER UNDER IMPORT EMBARGO 26
SHOPPER PROFILE 37

Co
pyr
igh
t ©
2013
Th
e N
iels
en C
om
pan
y. C
on
fid
enti
al a
nd
pro
pri
etar
y.
4
RESEARCH DESIGN Quantitative research
Method: on-line interviews (recruitment from on-line panel)
Scope: Moscow, St. Petersburg, Ekaterinburg, Novosibirsk, Rostov-on-Don, Nizhny Novgorod, Samara, cities of 500 th.inh.+
Sample: 1110 respondents
• 533 = cities over 1 mln.inh.+
• 577 = cities over 500 th.inh.+
Target audience: men and women 18-64 y. o. (quotas for gender and age), main shoppers in household
Fieldwork duration: 27 August - 2 September

Co
pyr
igh
t ©
2013
Th
e N
iels
en C
om
pan
y. C
on
fid
enti
al a
nd
pro
pri
etar
y.
5
MAIN FINDINGS Level of shopper optimism

Co
pyr
igh
t ©
2013
Th
e N
iels
en C
om
pan
y. C
on
fid
enti
al a
nd
pro
pri
etar
y.
6
MAIN FINDINGS Changes in FMCG consumption

Co
pyr
igh
t ©
2013
Th
e N
iels
en C
om
pan
y. C
on
fid
enti
al a
nd
pro
pri
etar
y.
7
MAIN FINDINGS Consumption under import embargo
SHOPPER IN NEW ECONOMIC ENVIRONMENT
• LEVEL OF SHOPPER OPTIMISM • INCOME AND SAVINGS • CHANGE IN CONSUMER BEHAVIOUR • STRATEGIES OF SAVING • CHANGES OF CONSUMER BEHAVIOUR BY CHANNELS
Co
pyr
igh
t ©
2013
Th
e N
iels
en C
om
pan
y. C
on
fid
enti
al a
nd
pro
pri
etar
y.
9
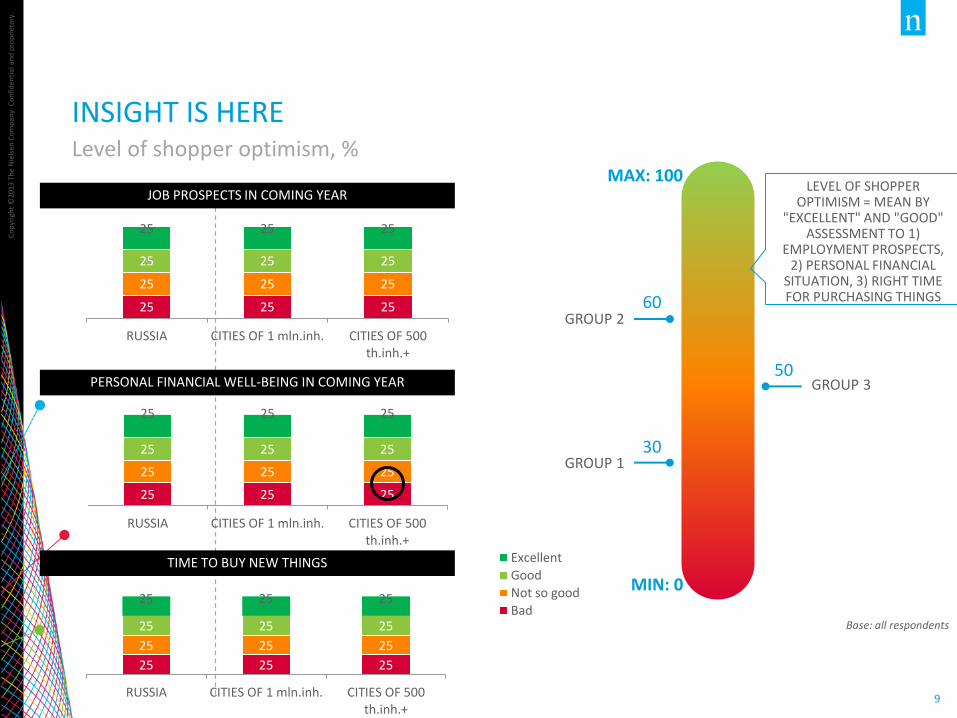
INSIGHT IS HERE Level of shopper optimism, %
25 25 25
25 25 25
25 25 25
25 25 25
RUSSIA CITIES OF 1 mln.inh. CITIES OF 500th.inh.+
JOB PROSPECTS IN COMING YEAR
25 25 25
25 25 25
25 25 25
25 25 25
RUSSIA CITIES OF 1 mln.inh. CITIES OF 500th.inh.+
Excellent
Good
Not so good
Bad
25 25 25
25 25 25
25 25 25
25 25 25
RUSSIA CITIES OF 1 mln.inh. CITIES OF 500th.inh.+
PERSONAL FINANCIAL WELL-BEING IN COMING YEAR
Base: all respondents
TIME TO BUY NEW THINGS
GROUP 3
GROUP 1
MAX: 100
MIN: 0
LEVEL OF SHOPPER OPTIMISM = MEAN BY
"EXCELLENT" AND "GOOD" ASSESSMENT TO 1)
EMPLOYMENT PROSPECTS, 2) PERSONAL FINANCIAL
SITUATION, 3) RIGHT TIME FOR PURCHASING THINGS
50
GROUP 2 60
30
Co
pyr
igh
t ©
2013
Th
e N
iels
en C
om
pan
y. C
on
fid
enti
al a
nd
pro
pri
etar
y.
10
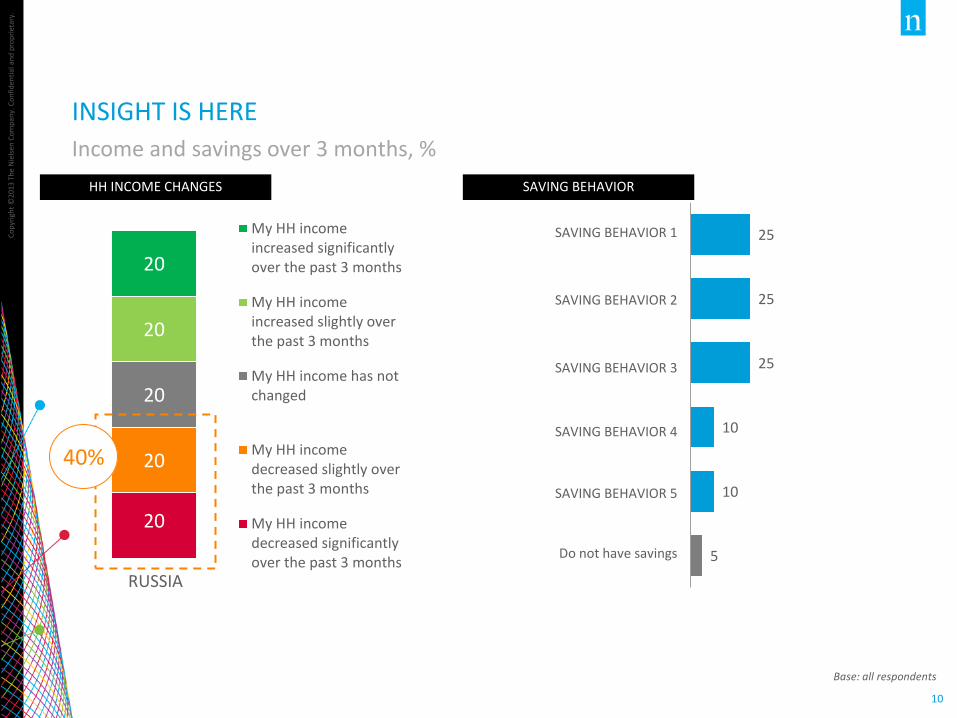
20
20
20
20
20
My HH incomeincreased significantlyover the past 3 months
My HH incomeincreased slightly overthe past 3 months
My HH income has notchanged
My HH incomedecreased slightly overthe past 3 months
My HH incomedecreased significantlyover the past 3 months
25
25
25
10
10
5
INSIGHT IS HERE
Income and savings over 3 months, %
Base: all respondents
HH INCOME CHANGES SAVING BEHAVIOR
SAVING BEHAVIOR 1
SAVING BEHAVIOR 2
SAVING BEHAVIOR 3
SAVING BEHAVIOR 4
SAVING BEHAVIOR 5
Do not have savings
RUSSIA
40%
Co
pyr
igh
t ©
2013
Th
e N
iels
en C
om
pan
y. C
on
fid
enti
al a
nd
pro
pri
etar
y.
11
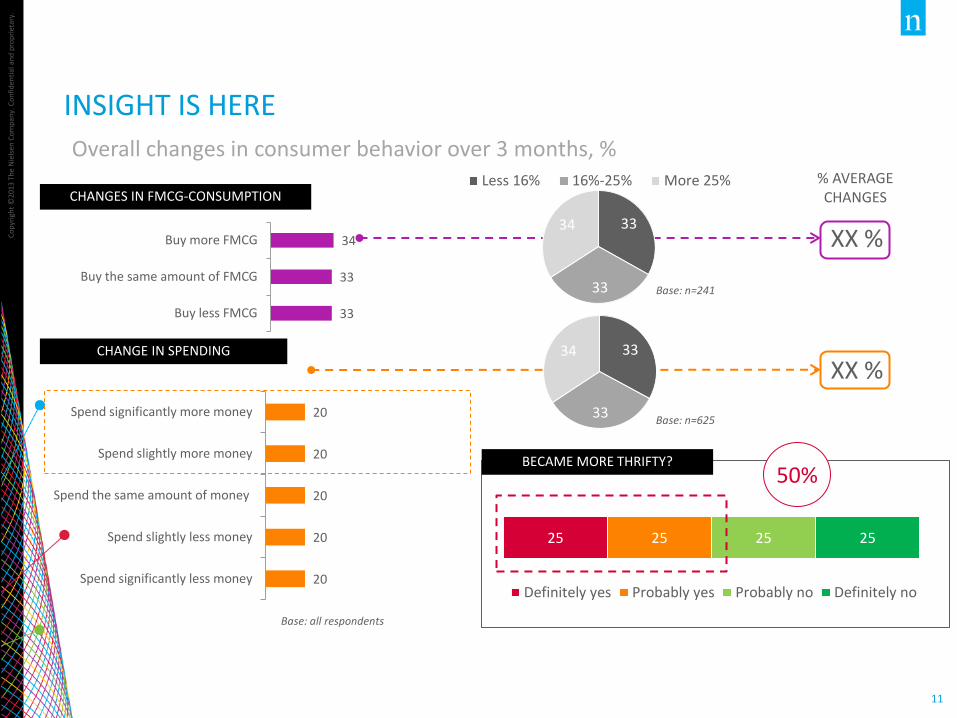
25 25 25 25
Definitely yes Probably yes Probably no Definitely no
INSIGHT IS HERE
Overall changes in consumer behavior over 3 months, %
33
33
34
Buy less FMCG
Buy the same amount of FMCG
Buy more FMCG
CHANGES IN FMCG-CONSUMPTION
CHANGE IN SPENDING
Base: all respondents
XX %
XX %
Base: n=241
Base: n=625
% AVERAGE CHANGES
20
20
20
20
20
Spend significantly more money
Spend slightly more money
Spend the same amount of money
Spend slightly less money
Spend significantly less money
33
33
34
Less 16% 16%-25% More 25%
BECAME MORE THRIFTY? 50%
33
33
34
Co
pyr
igh
t ©
2013
Th
e N
iels
en C
om
pan
y. C
on
fid
enti
al a
nd
pro
pri
etar
y.
12
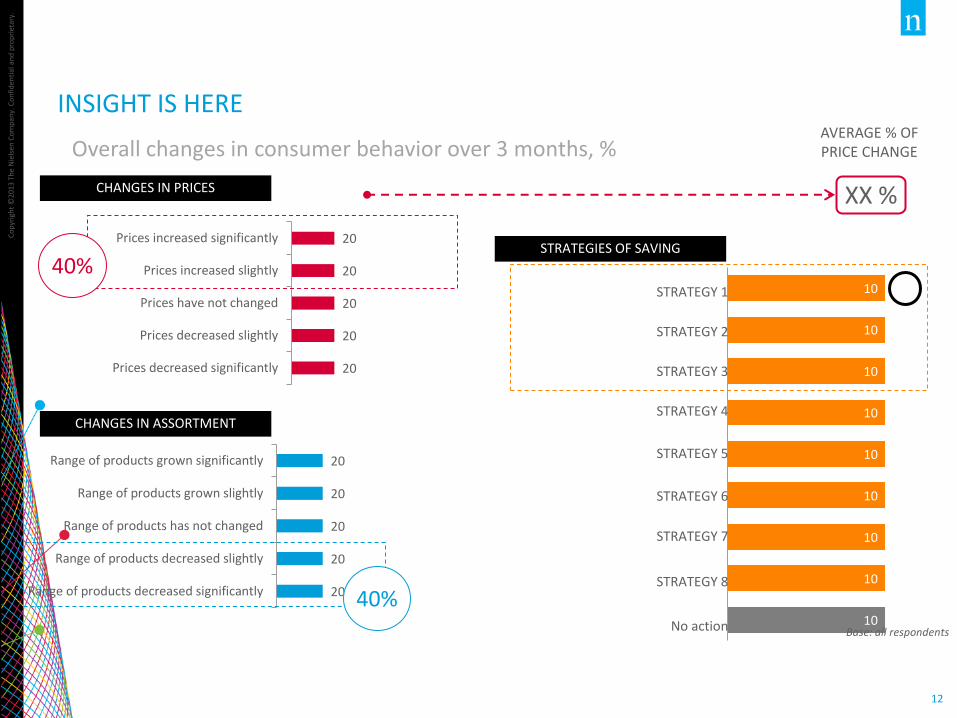
10
10
10
10
10
10
10
10
10
INSIGHT IS HERE
Overall changes in consumer behavior over 3 months, %
Base: all respondents
20
20
20
20
20
Prices increased significantly
Prices increased slightly
Prices have not changed
Prices decreased slightly
Prices decreased significantly
CHANGES IN PRICES XX %
20
20
20
20
20
Range of products grown significantly
Range of products grown slightly
Range of products has not changed
Range of products decreased slightly
Range of products decreased significantly
CHANGES IN ASSORTMENT
AVERAGE % OF PRICE CHANGE
40%
40%
STRATEGY 1
STRATEGY 2
STRATEGY 3
STRATEGY 4
STRATEGY 5
STRATEGY 6
STRATEGY 7
STRATEGY 8
No action
STRATEGIES OF SAVING
Co
pyr
igh
t ©
2013
Th
e N
iels
en C
om
pan
y. C
on
fid
enti
al a
nd
pro
pri
etar
y.
13
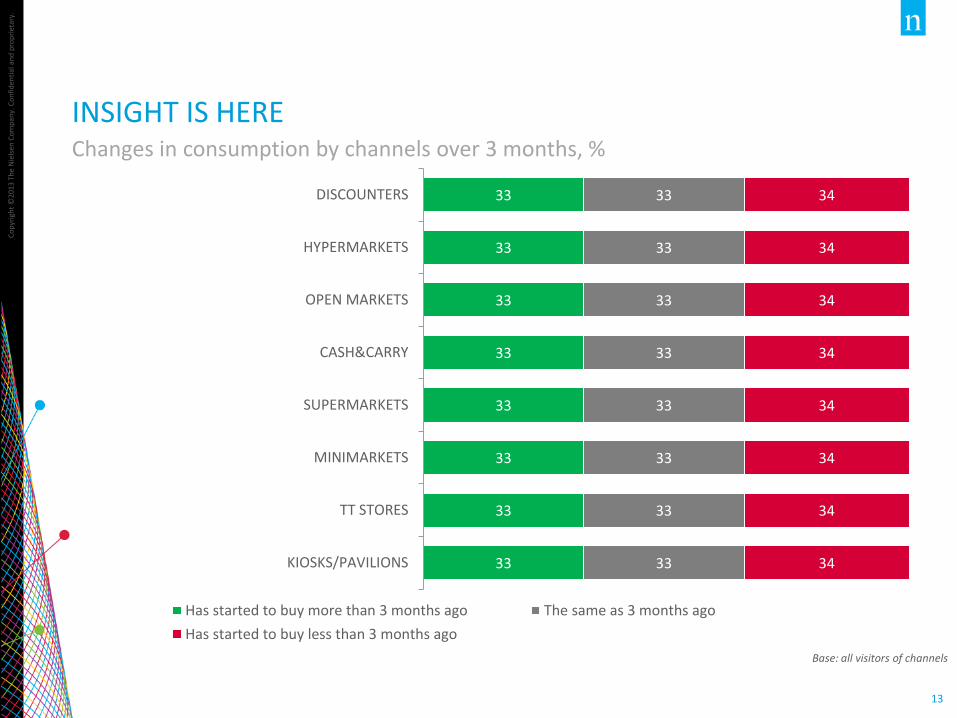
33
33
33
33
33
33
33
33
33
33
33
33
33
33
33
33
34
34
34
34
34
34
34
34
DISCOUNTERS
HYPERMARKETS
OPEN MARKETS
CASH&CARRY
SUPERMARKETS
MINIMARKETS
TT STORES
KIOSKS/PAVILIONS
Has started to buy more than 3 months ago The same as 3 months ago
Has started to buy less than 3 months ago
INSIGHT IS HERE Changes in consumption by channels over 3 months, %
Base: all visitors of channels
PURCHASE BEHAVIOUR BY CATEGORIES
• CHANGES IN CONSUMER BEHAVIOUR BY CATEGORIES • REASONS FOR CHANGES IN CONSUMER BEHAVIOUR • PRICE CHANGE BY CATEGORY • SAVING STRATEGIES BY CATEGORY • CATEGORIES-INDICATORS OF PRICE LEVEL
Co
pyr
igh
t ©
2013
Th
e N
iels
en C
om
pan
y. C
on
fid
enti
al a
nd
pro
pri
etar
y.
15
25
25
25
25
25
25
25
25
25
25
25
25
25
25
25
25
25
25
25
25
25
25
25
25
25
25
25
25
25
25
25
25
25
25
25
25
25
25
25
25
25
25
25
25
25
25
25
25
25
25
25
25
25
25
25
25
25
25
25
25
25
25
25
25
25
25
25
25
25
25
25
25
25
25
25
25
25
25
25
25
25
25
25
25
Beer
Bottled / mineral water
Boxes of chocolate pralines
Carbonated soft drinks
Cereals, pasta
Cheese
Chips, crackers, and other snacks
Chocolate
Coffee
Fresh fruit and vegetables
Fresh meat, poultry, fish
Frozen food
Fruit juices
Meat products, sausages
Modern dairy
Packed sweets
Pet food
Premium alcohol
Tea
Traditional dairy
Vodka
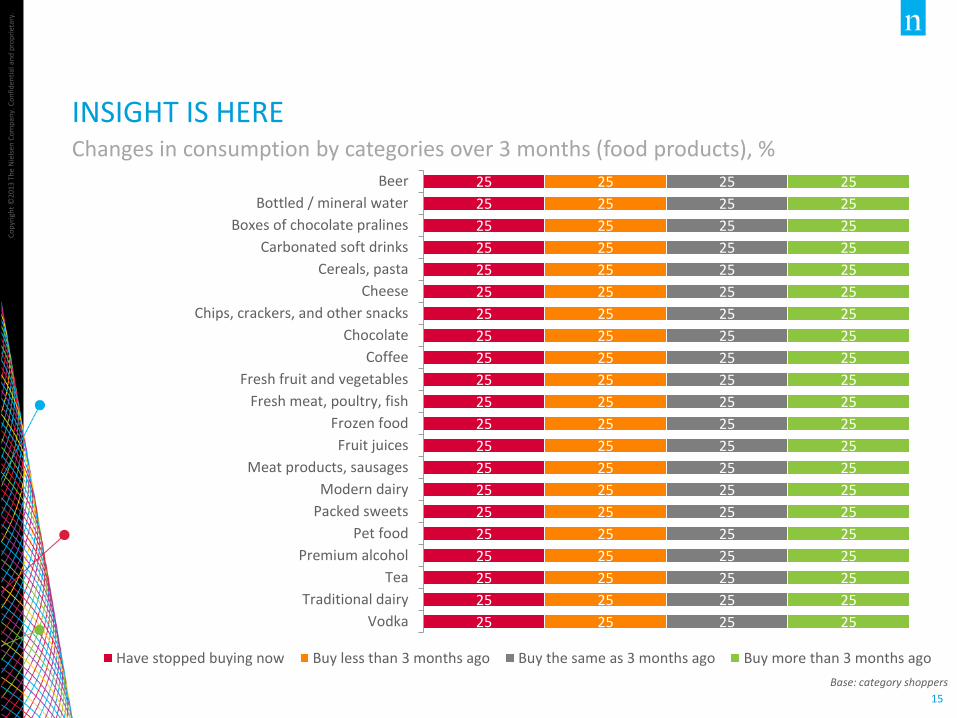
Have stopped buying now Buy less than 3 months ago Buy the same as 3 months ago Buy more than 3 months ago
Changes in consumption by categories over 3 months (food products), %
INSIGHT IS HERE
Base: category shoppers
Co
pyr
igh
t ©
2013
Th
e N
iels
en C
om
pan
y. C
on
fid
enti
al a
nd
pro
pri
etar
y.
16
25
25
25
25
25
25
25
25
25
25
25
25
25
25
25
25
25
25
25
25
25
25
25
25
25
25
25
25
Diapers
Feminine products
Hair care
Household cleaners
Laundry detergents
Paper products
Personal care
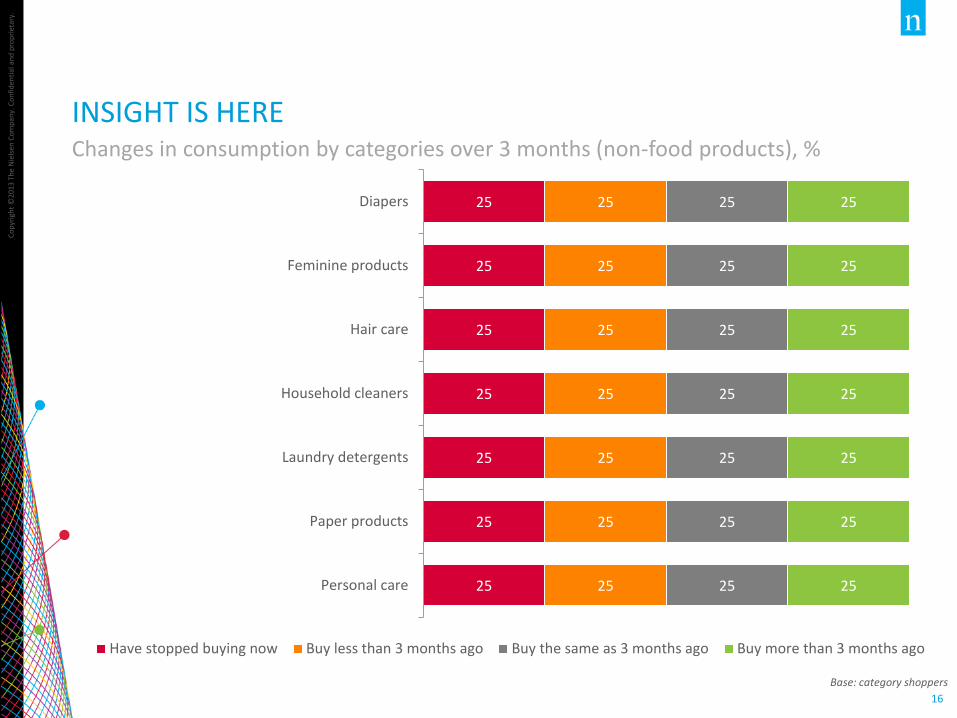
Have stopped buying now Buy less than 3 months ago Buy the same as 3 months ago Buy more than 3 months ago
Changes in consumption by categories over 3 months (non-food products), %
INSIGHT IS HERE
Base: category shoppers
Co
pyr
igh
t ©
2013
Th
e N
iels
en C
om
pan
y. C
on
fid
enti
al a
nd
pro
pri
etar
y.
17
50
50
50
50
50
50
50
50
50
50
50
50
50
50
50
50
50
50
50
50
50
Beer
Bottled / mineral water
Boxes of chocolate pralines
Carbonated soft drinks
Cereals, pasta
Cheese
Chips, crackers, and other snacks
Chocolate
Coffee
Expensive alcohol
Forage for animals
Fresh fruit and vegetables
Fresh meat, poultry, fish
Frozen foods
Fruit juices
Meat products, sausages
Modern dairy products
Packaged candy
Tea
Traditional dairy products
Vodka
25
25
25
25
25
25
25 25
25
25
25
25
25
25
25
25 25
25
25
25
25
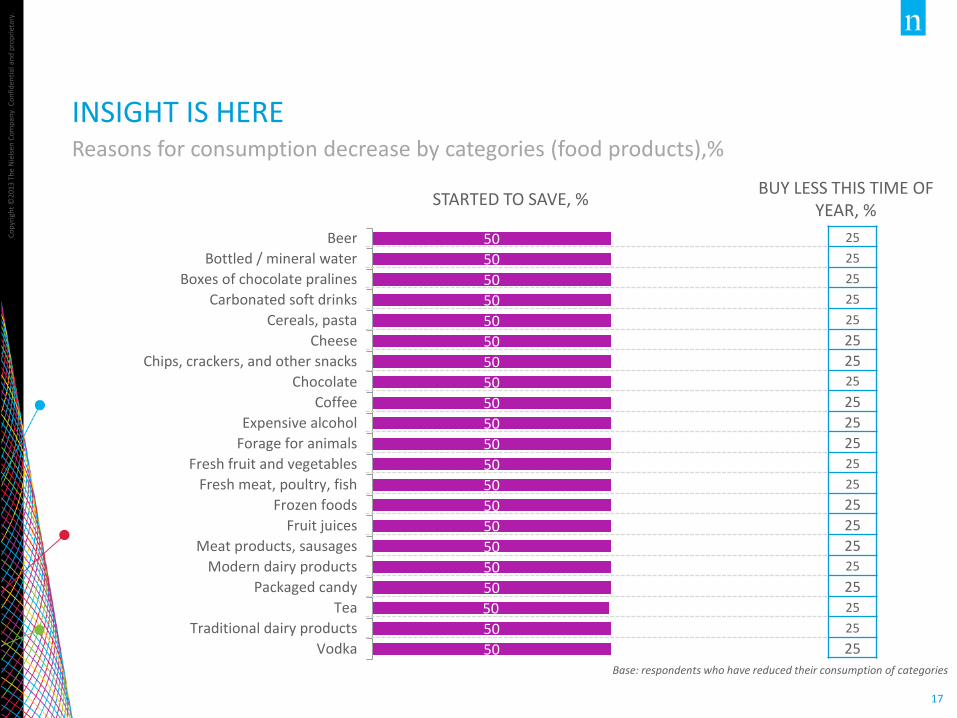
INSIGHT IS HERE Reasons for consumption decrease by categories (food products),%
Base: respondents who have reduced their consumption of categories
STARTED TO SAVE, % BUY LESS THIS TIME OF
YEAR, %
Co
pyr
igh
t ©
2013
Th
e N
iels
en C
om
pan
y. C
on
fid
enti
al a
nd
pro
pri
etar
y.
18
50
50
50
50
50
50
50
50
Cigarettes
Diapers
Feminine hygiene
Household goods
Laundry detergent
Paper products
Personal care products
Products for hair care
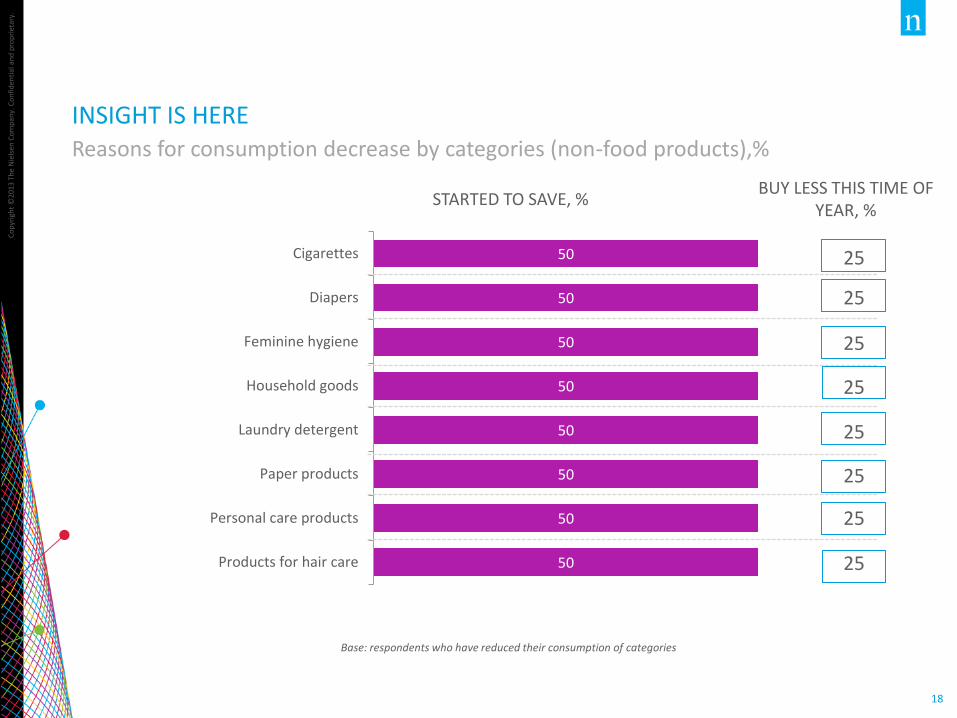
INSIGHT IS HERE Reasons for consumption decrease by categories (non-food products),%
25
25
25
25
25
25
25
25
STARTED TO SAVE, % BUY LESS THIS TIME OF
YEAR, %
Base: respondents who have reduced their consumption of categories
Co
pyr
igh
t ©
2013
Th
e N
iels
en C
om
pan
y. C
on
fid
enti
al a
nd
pro
pri
etar
y.
19
25
25
25
25
25
25
25
25
25
25
25
25
25
25
25
25
25
25
25
25
25
25
25
25
25
25
25
25
25
25
25
25
25
25
25
25
25
25
25
25
25
25
25
25
25
25
25
25
25
25
25
25
25
25
25
25
25
25
25
25
25
25
25
25
25
25
25
25
25
25
25
25
25
25
25
25
25
25
25
25
25
25
25
25
25
25
25
25
25
25
25
25
25
25
25
25
25
25
25
25
25
25
25
25
25
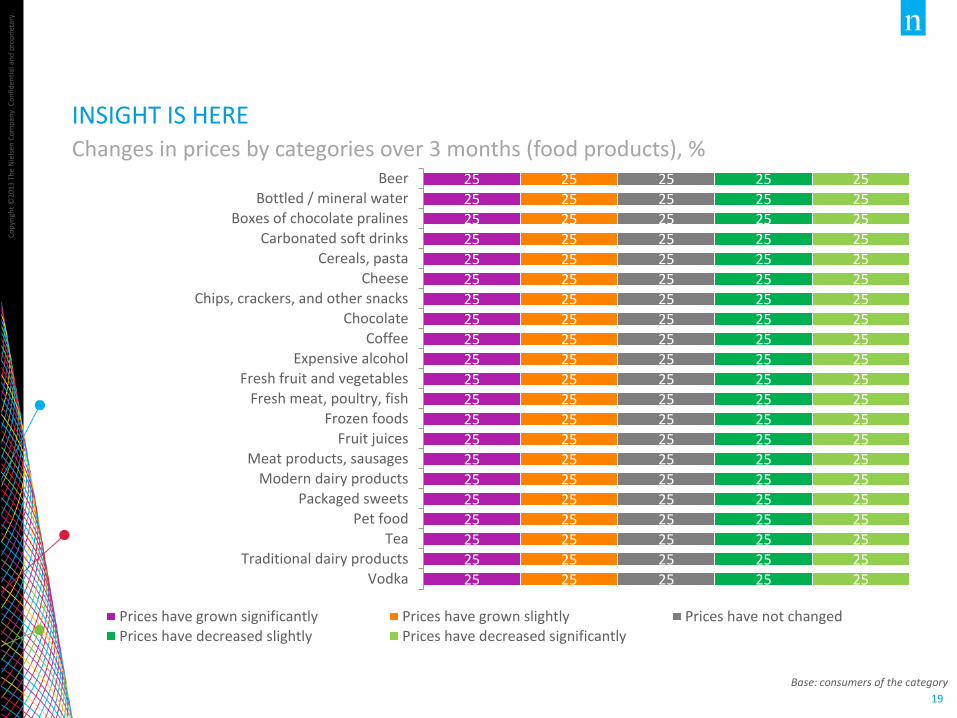
Beer
Bottled / mineral water
Boxes of chocolate pralines
Carbonated soft drinks
Cereals, pasta
Cheese
Chips, crackers, and other snacks
Chocolate
Coffee
Expensive alcohol
Fresh fruit and vegetables
Fresh meat, poultry, fish
Frozen foods
Fruit juices
Meat products, sausages
Modern dairy products
Packaged sweets
Pet food
Tea
Traditional dairy products
Vodka
Prices have grown significantly Prices have grown slightly Prices have not changedPrices have decreased slightly Prices have decreased significantly
INSIGHT IS HERE Changes in prices by categories over 3 months (food products), %
Base: consumers of the category
Co
pyr
igh
t ©
2013
Th
e N
iels
en C
om
pan
y. C
on
fid
enti
al a
nd
pro
pri
etar
y.
20
25
25
25
25
25
25
25
25
25
25
25
25
25
25
25
25
25
25
25
25
25
25
25
25
25
25
25
25
25
25
25
25
25
25
25
25
25
25
25
25
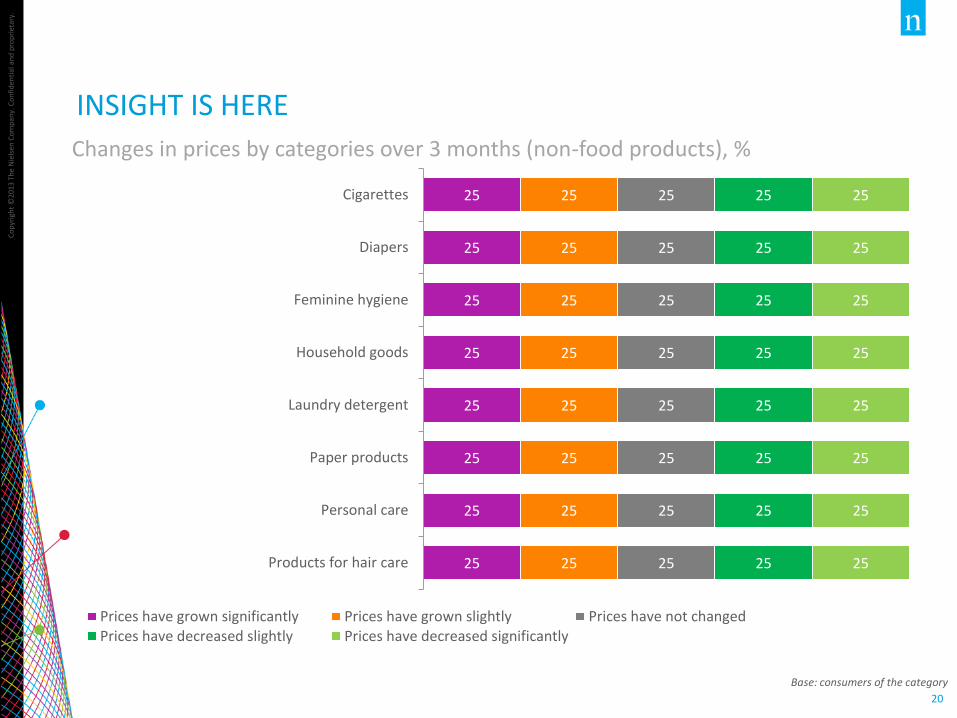
Cigarettes
Diapers
Feminine hygiene
Household goods
Laundry detergent
Paper products
Personal care
Products for hair care
Prices have grown significantly Prices have grown slightly Prices have not changedPrices have decreased slightly Prices have decreased significantly
INSIGHT IS HERE
Changes in prices by categories over 3 months (non-food products), %
Base: consumers of the category
Co
pyr
igh
t ©
2012
Th
e N
iels
en C
om
pan
y. C
on
fid
enti
al a
nd
pro
pri
etar
y.
21
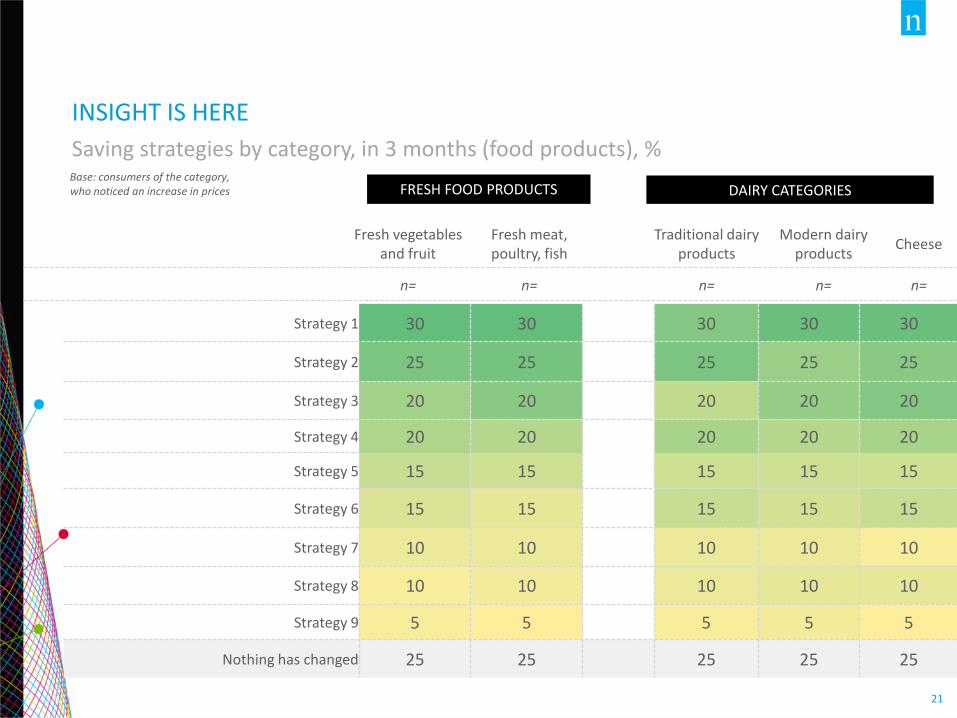
FRESH FOOD PRODUCTS DAIRY CATEGORIES
Fresh vegetables and fruit
Fresh meat, poultry, fish
Traditional dairy products
Modern dairy products
Cheese
n= n= n= n= n=
INSIGHT IS HERE
Saving strategies by category, in 3 months (food products), % Base: consumers of the category, who noticed an increase in prices
Strategy 1 30 30 30 30 30
Strategy 2 25 25
25 25 25
Strategy 3 20 20 20 20 20
Strategy 4 20 20 20 20 20
Strategy 5 15 15 15 15 15
Strategy 6 15 15
15 15 15
Strategy 7 10 10 10 10 10
Strategy 8 10 10 10 10 10
Strategy 9 5 5 5 5 5
Nothing has changed 25 25 25 25 25
Co
pyr
igh
t ©
2012
Th
e N
iels
en C
om
pan
y. C
on
fid
enti
al a
nd
pro
pri
etar
y.
22
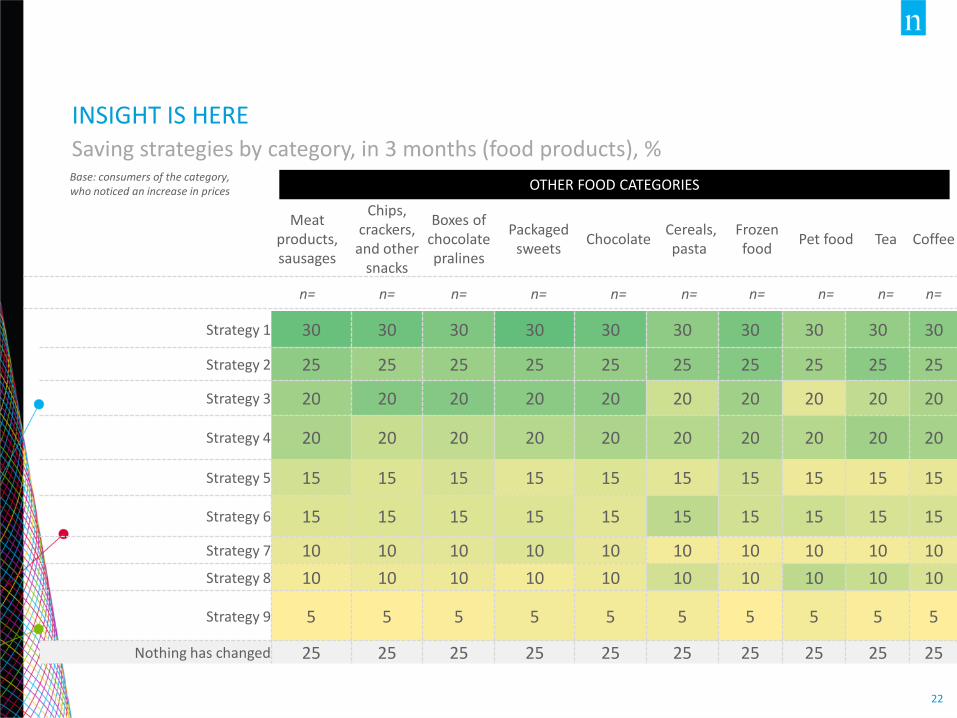
OTHER FOOD CATEGORIES
Meat products, sausages
Chips, crackers,
and other snacks
Boxes of chocolate pralines
Packaged sweets
Chocolate Cereals,
pasta Frozen food
Pet food Tea Coffee
n= n= n= n= n= n= n= n= n= n=
INSIGHT IS HERE Saving strategies by category, in 3 months (food products), % Base: consumers of the category, who noticed an increase in prices
Strategy 1 30 30 30 30 30 30 30 30 30 30
Strategy 2 25 25 25 25 25 25 25 25 25 25
Strategy 3 20 20 20 20 20 20 20 20 20 20
Strategy 4 20 20 20 20 20 20 20 20 20 20
Strategy 5 15 15 15 15 15 15 15 15 15 15
Strategy 6 15 15 15 15 15 15 15 15 15 15
Strategy 7 10 10 10 10 10 10 10 10 10 10
Strategy 8 10 10 10 10 10 10 10 10 10 10
Strategy 9 5 5 5 5 5 5 5 5 5 5
Nothing has changed 25 25 25 25 25 25 25 25 25 25
Co
pyr
igh
t ©
2012
Th
e N
iels
en C
om
pan
y. C
on
fid
enti
al a
nd
pro
pri
etar
y.
23
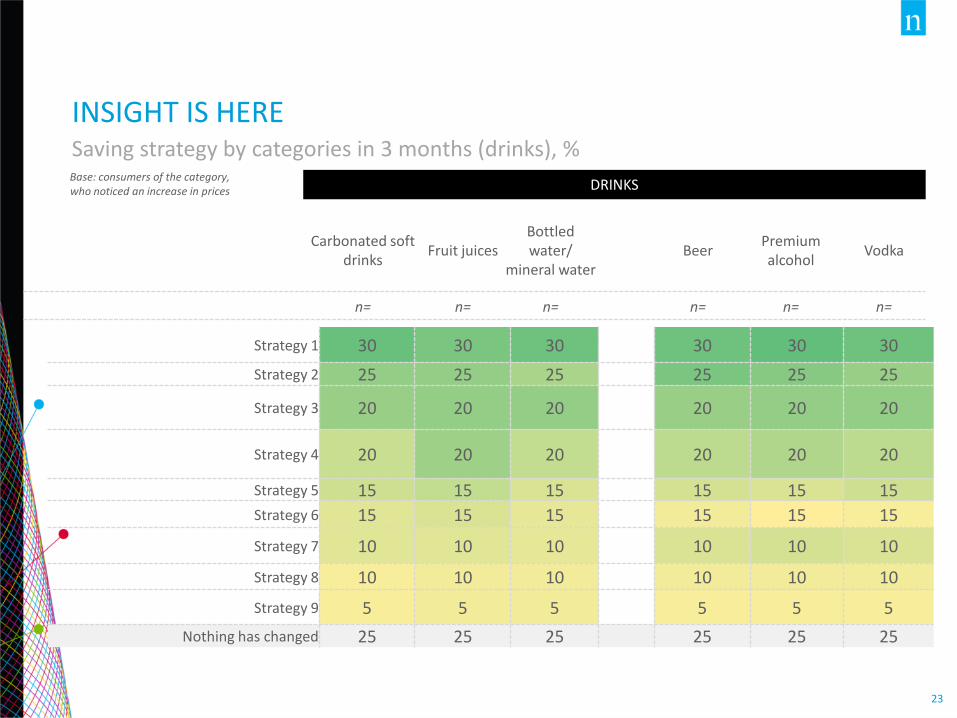
DRINKS
Carbonated soft drinks
Fruit juices Bottled water/
mineral water Beer
Premium alcohol
Vodka
n= n= n= n= n= n=
INSIGHT IS HERE Saving strategy by categories in 3 months (drinks), % Base: consumers of the category, who noticed an increase in prices
Strategy 1 30 30 30 30 30 30
Strategy 2 25 25 25 25 25 25
Strategy 3 20 20 20 20 20 20
Strategy 4 20 20 20 20 20 20
Strategy 5 15 15 15 15 15 15
Strategy 6 15 15 15 15 15 15
Strategy 7 10 10 10 10 10 10
Strategy 8 10 10 10 10 10 10
Strategy 9 5 5 5 5 5 5
Nothing has changed 25 25 25 25 25 25
Co
pyr
igh
t ©
2012
Th
e N
iels
en C
om
pan
y. C
on
fid
enti
al a
nd
pro
pri
etar
y.
24
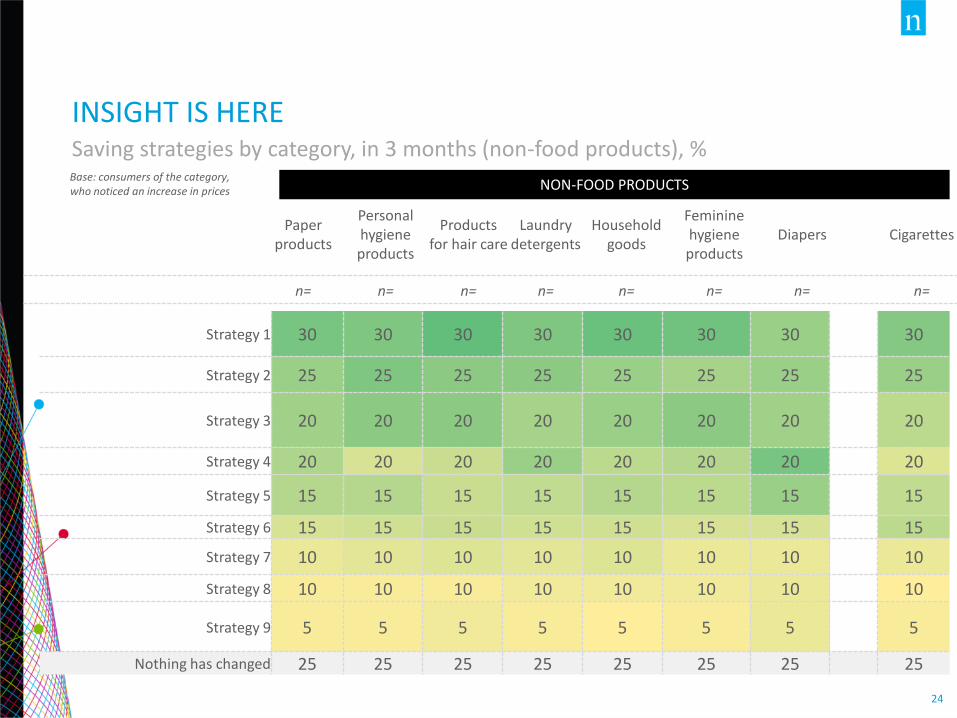
NON-FOOD PRODUCTS
Paper products
Personal hygiene products
Products for hair care
Laundry detergents
Household goods
Feminine hygiene products
Diapers Cigarettes
n= n= n= n= n= n= n= n=
INSIGHT IS HERE Saving strategies by category, in 3 months (non-food products), % Base: consumers of the category, who noticed an increase in prices
Strategy 1 30 30 30 30 30 30 30 30
Strategy 2 25 25 25 25 25 25 25 25
Strategy 3 20 20 20 20 20 20 20 20
Strategy 4 20 20 20 20 20 20 20 20
Strategy 5 15 15 15 15 15 15 15 15
Strategy 6 15 15 15 15 15 15 15 15
Strategy 7 10 10 10 10 10 10 10 10
Strategy 8 10 10 10 10 10 10 10 10
Strategy 9 5 5 5 5 5 5 5 5
Nothing has changed 25 25 25 25 25 25 25 25
Co
pyr
igh
t ©
2013
Th
e N
iels
en C
om
pan
y. C
on
fid
enti
al a
nd
pro
pri
etar
y.
25
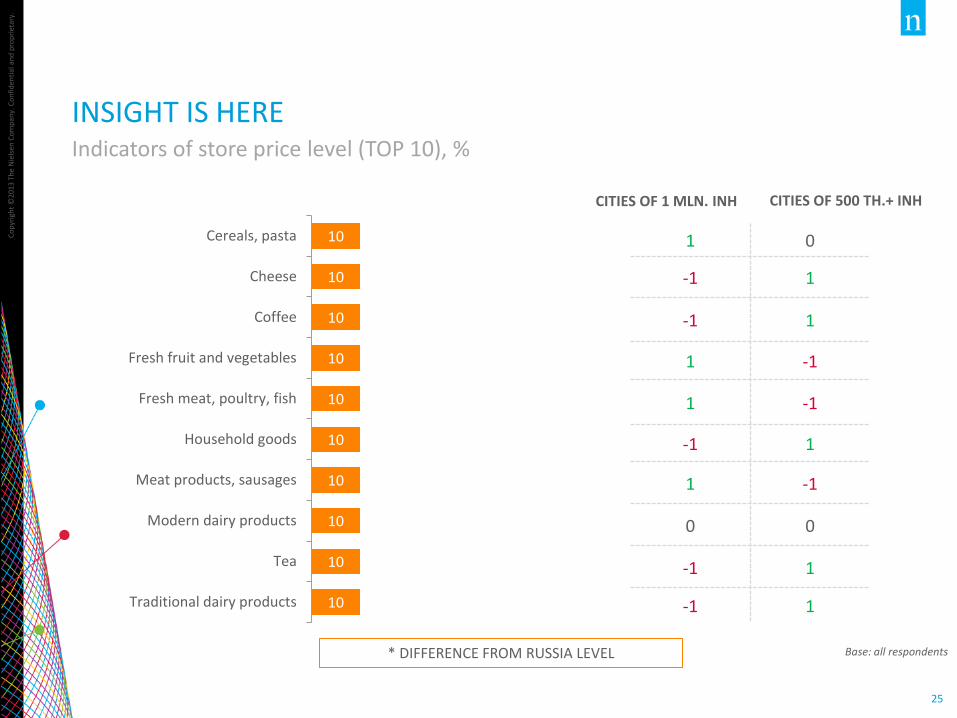
10
10
10
10
10
10
10
10
10
10
Cereals, pasta
Cheese
Coffee
Fresh fruit and vegetables
Fresh meat, poultry, fish
Household goods
Meat products, sausages
Modern dairy products
Tea
Traditional dairy products
INSIGHT IS HERE Indicators of store price level (TOP 10), %
Base: all respondents
1 0
-1 1
-1 1
1 -1
1 -1
-1 1
1 -1
0 0
-1 1
-1 1
CITIES OF 1 MLN. INH CITIES OF 500 TH.+ INH
* DIFFERENCE FROM RUSSIA LEVEL
SHOPPER UNDER IMPORT EMBARGO
• CONCERNS ABOUT EMBARGO • POSITIVE AND NEGATIVE EFFECTS • OBSERVED CHANGES AND STRATEGIES OF SAVING • POSSIBLE RESULT OF IMPORT EMBARGO • CATEGORIES OF CONSUMPTION • CATEGORIES OF CONCERN • STRATEGIES FOR SAVING IN BANNED CATEGORIES • POSSIBLE STRATEGIES FOR SAVING IN BANNED CATEGORIES • OOS CONSUMPTION
Co
pyr
igh
t ©
2013
Th
e N
iels
en C
om
pan
y. C
on
fid
enti
al a
nd
pro
pri
etar
y.
27
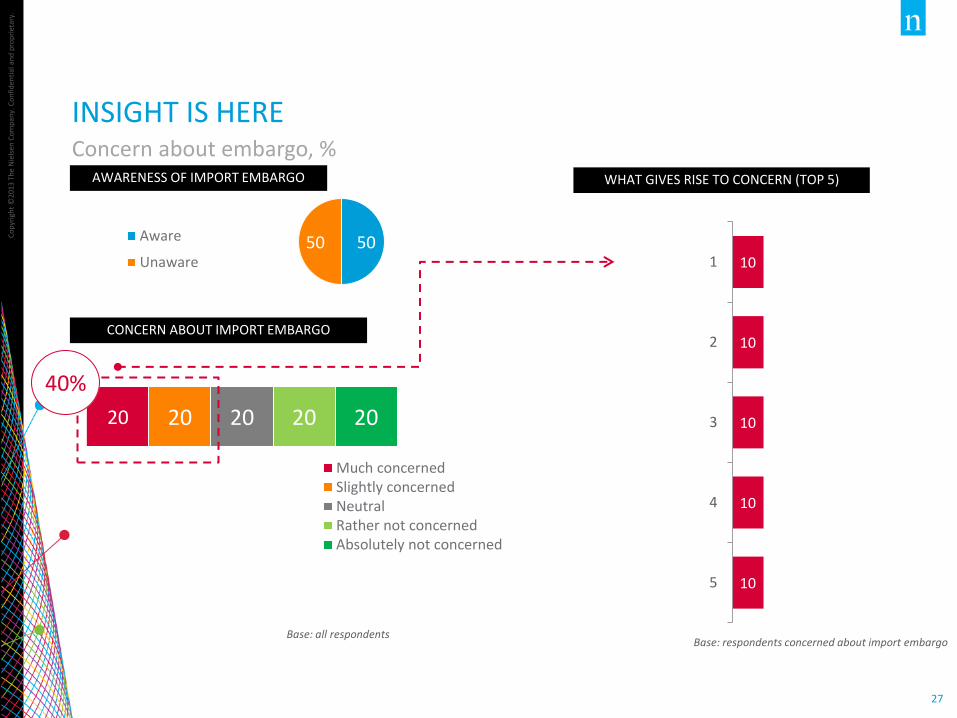
20 20 20 20 20
Much concernedSlightly concernedNeutralRather not concernedAbsolutely not concerned
Base: all respondents
INSIGHT IS HERE Concern about embargo, %
AWARENESS OF IMPORT EMBARGO
CONCERN ABOUT IMPORT EMBARGO
50 50 Aware
Unaware 10
10
10
10
10
1
2
3
4
5
WHAT GIVES RISE TO CONCERN (TOP 5)
Base: respondents concerned about import embargo
40%
Co
pyr
igh
t ©
2013
Th
e N
iels
en C
om
pan
y. C
on
fid
enti
al a
nd
pro
pri
etar
y.
28
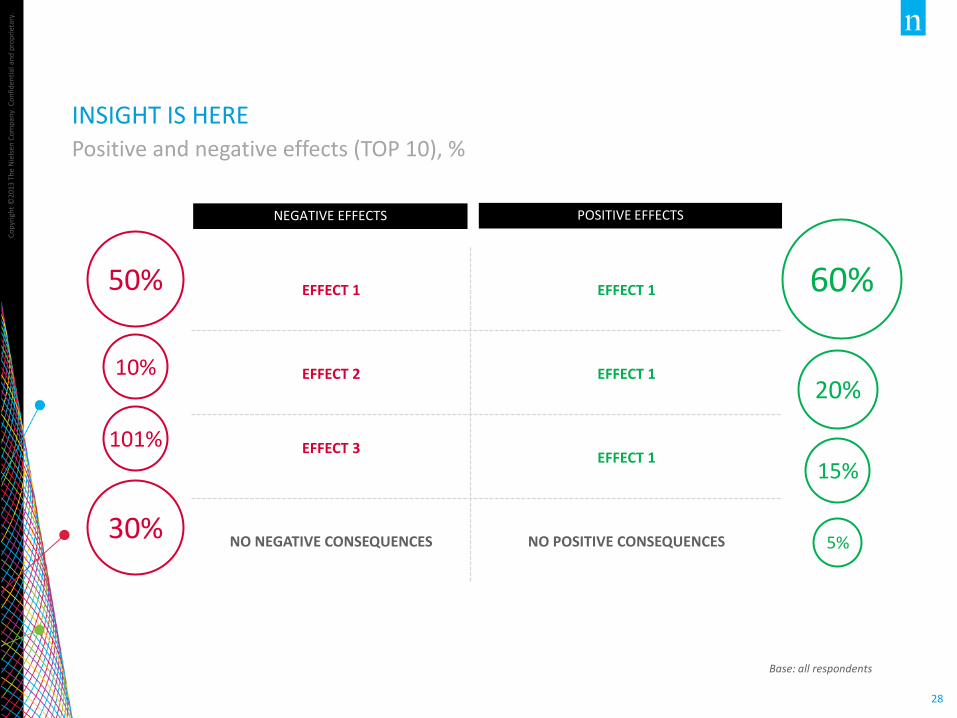
INSIGHT IS HERE Positive and negative effects (TOP 10), %
Base: all respondents
EFFECT 1 EFFECT 1
EFFECT 2 EFFECT 1
EFFECT 3
EFFECT 1
NO NEGATIVE CONSEQUENCES NO POSITIVE CONSEQUENCES
POSITIVE EFFECTS NEGATIVE EFFECTS
50%
30%
10%
101%
60%
20%
15%
5%
Co
pyr
igh
t ©
2013
Th
e N
iels
en C
om
pan
y. C
on
fid
enti
al a
nd
pro
pri
etar
y.
29
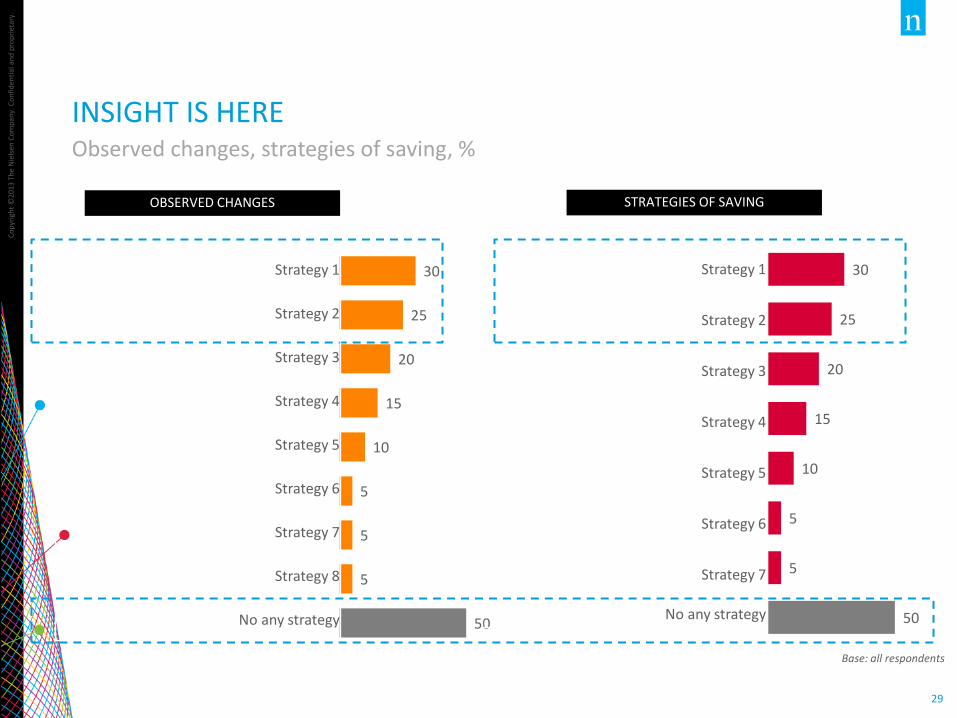
30
25
20
15
10
5
5
50
INSIGHT IS HERE Observed changes, strategies of saving, %
Base: all respondents
STRATEGIES OF SAVING
30
25
20
15
10
5
5
5
50
OBSERVED CHANGES
Strategy 1
Strategy 2
Strategy 3
Strategy 4
Strategy 5
Strategy 6
Strategy 7
Strategy 8
No any strategy
Strategy 1
Strategy 2
Strategy 3
Strategy 4
Strategy 5
Strategy 6
Strategy 7
No any strategy
Co
pyr
igh
t ©
2013
Th
e N
iels
en C
om
pan
y. C
on
fid
enti
al a
nd
pro
pri
etar
y.
30
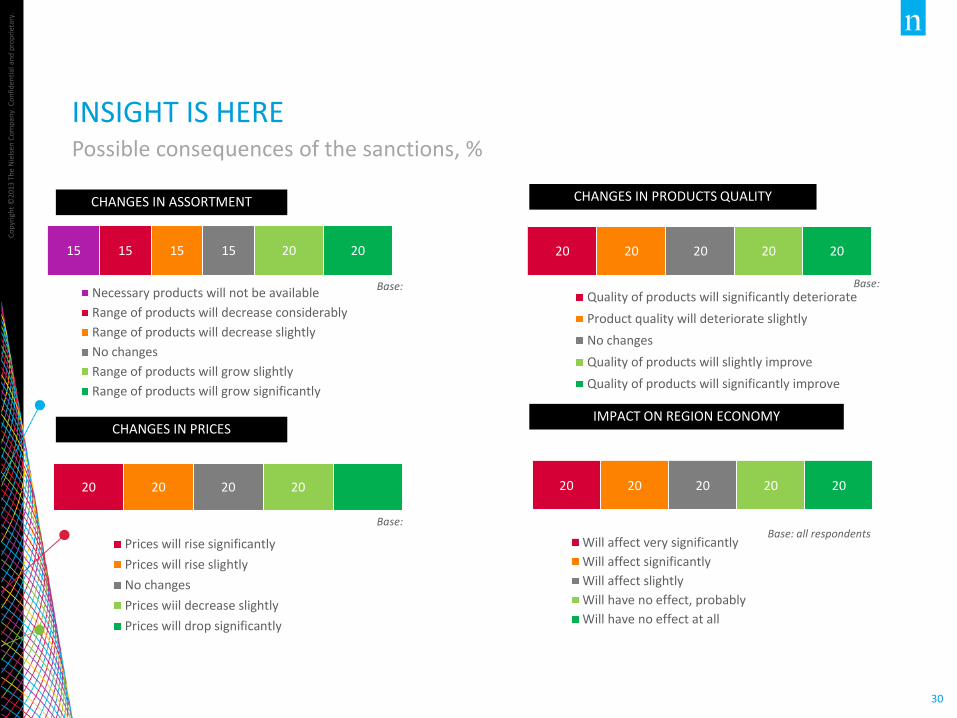
20 20 20 20 20
Will affect very significantly
Will affect significantly
Will affect slightly
Will have no effect, probably
Will have no effect at all
20 20 20 20
Prices will rise significantly
Prices will rise slightly
No changes
Prices wiil decrease slightly
Prices will drop significantly
INSIGHT IS HERE Possible consequences of the sanctions, %
15 15 15 15 20 20
Necessary products will not be available
Range of products will decrease considerably
Range of products will decrease slightly
No changes
Range of products will grow slightly
Range of products will grow significantly
CHANGES IN ASSORTMENT
20 20 20 20 20
Quality of products will significantly deteriorate
Product quality will deteriorate slightly
No changes
Quality of products will slightly improve
Quality of products will significantly improve
CHANGES IN PRICES
CHANGES IN PRODUCTS QUALITY
Base: all respondents Base:
Base: Base:
IMPACT ON REGION ECONOMY
Co
pyr
igh
t ©
2013
Th
e N
iels
en C
om
pan
y. C
on
fid
enti
al a
nd
pro
pri
etar
y.
31
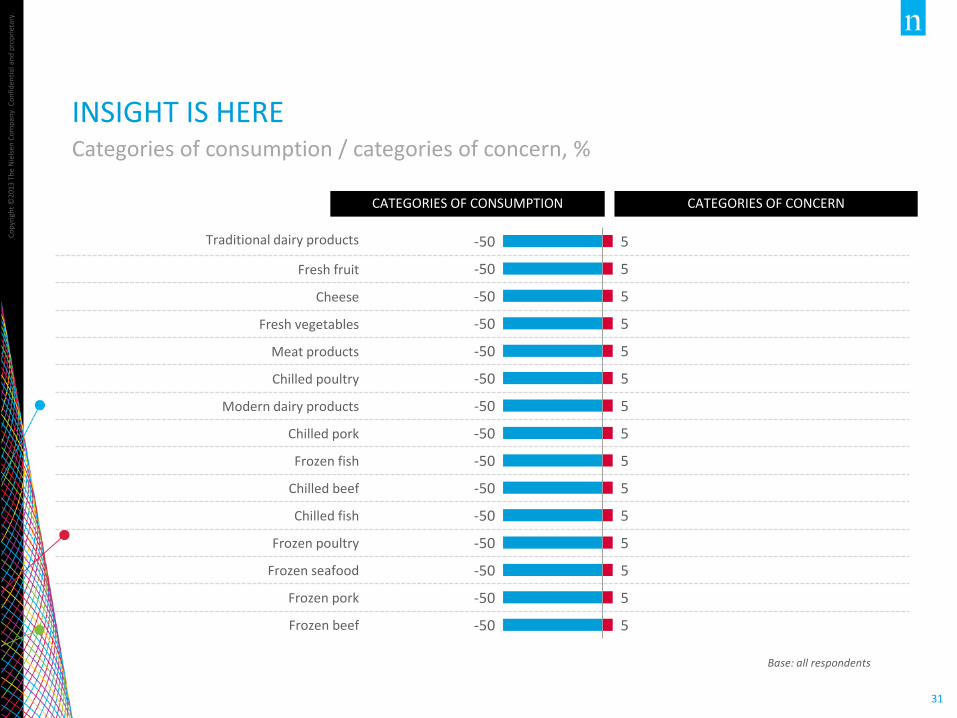
Traditional dairy products
Fresh fruit
Cheese
Fresh vegetables
Meat products
Chilled poultry
Modern dairy products
Chilled pork
Frozen fish
Chilled beef
Chilled fish
Frozen poultry
Frozen seafood
Frozen pork
Frozen beef
INSIGHT IS HERE Categories of consumption / categories of concern, %
Base: all respondents
CATEGORIES OF CONCERN
-50
-50
-50
-50
-50
-50
-50
-50
-50
-50
-50
-50
-50
-50
-50
5
5
5
5
5
5
5
5
5
5
5
5
5
5
5
CATEGORIES OF CONSUMPTION
Co
pyr
igh
t ©
2012
Th
e N
iels
en C
om
pan
y. C
on
fid
enti
al a
nd
pro
pri
etar
y.
32
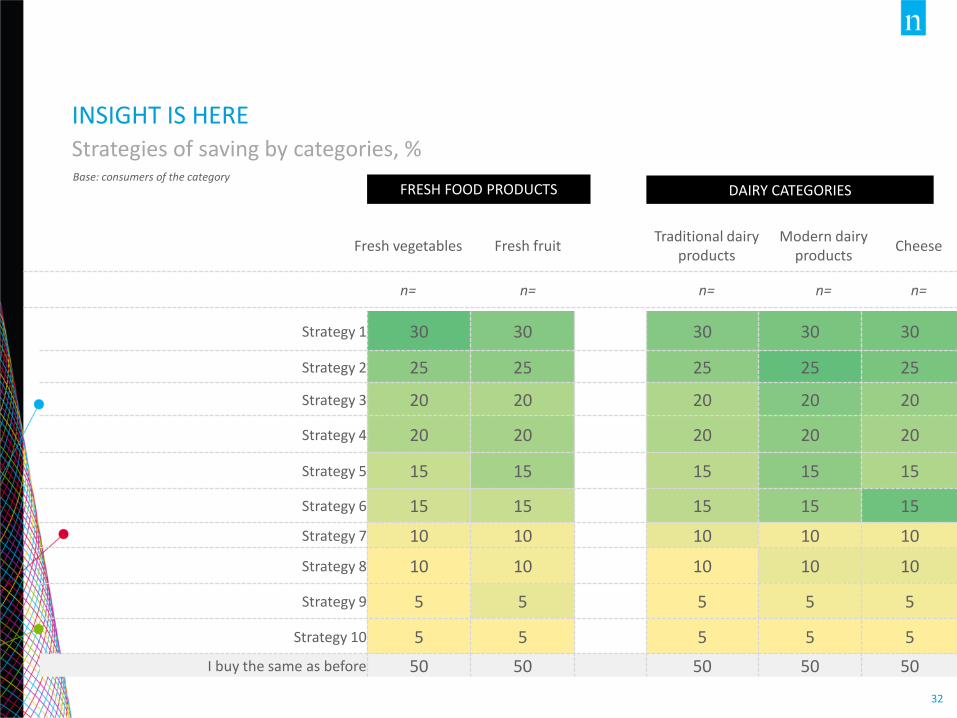
FRESH FOOD PRODUCTS DAIRY CATEGORIES
Fresh vegetables Fresh fruit Traditional dairy
products Modern dairy
products Cheese
n= n= n= n= n=
INSIGHT IS HERE Strategies of saving by categories, % Base: consumers of the category
Strategy 1 30 30 30 30 30
Strategy 2 25 25 25 25 25
Strategy 3 20 20 20 20 20
Strategy 4 20 20 20 20 20
Strategy 5 15 15 15 15 15
Strategy 6 15 15 15 15 15
Strategy 7 10 10 10 10 10
Strategy 8 10 10 10 10 10
Strategy 9 5 5 5 5 5
Strategy 10 5 5 5 5 5
I buy the same as before 50 50 50 50 50
Co
pyr
igh
t ©
2012
Th
e N
iels
en C
om
pan
y. C
on
fid
enti
al a
nd
pro
pri
etar
y.
33
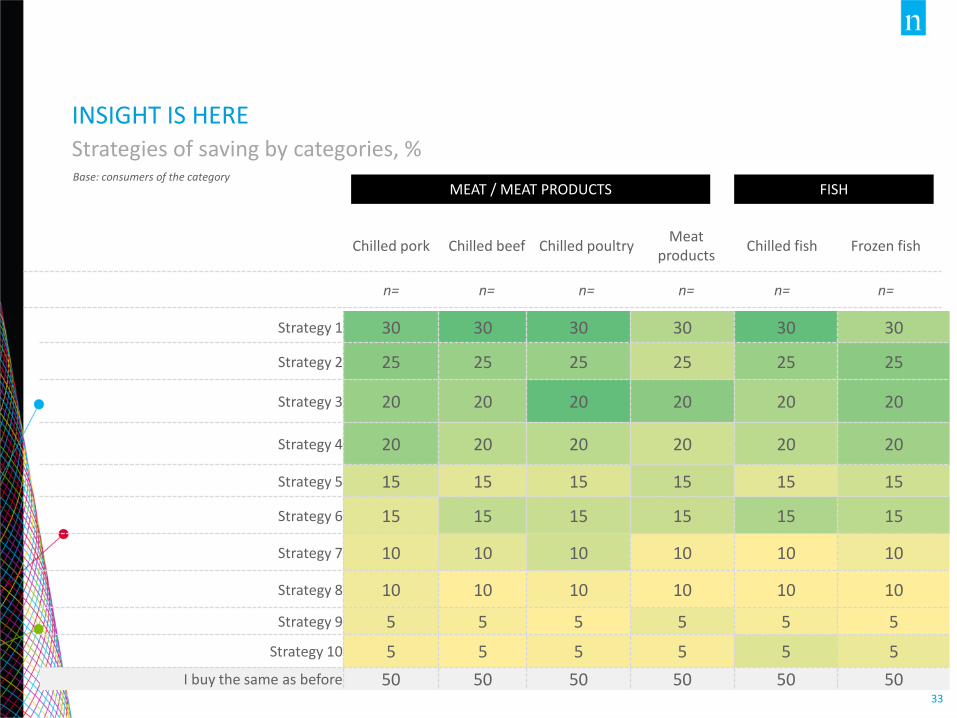
MEAT / MEAT PRODUCTS
Chilled pork Chilled beef Chilled poultry Meat
products Chilled fish Frozen fish
n= n= n= n= n= n=
INSIGHT IS HERE Strategies of saving by categories, %
FISH Base: consumers of the category
Strategy 1 30 30 30 30 30 30
Strategy 2 25 25 25 25 25 25
Strategy 3 20 20 20 20 20 20
Strategy 4 20 20 20 20 20 20
Strategy 5 15 15 15 15 15 15
Strategy 6 15 15 15 15 15 15
Strategy 7 10 10 10 10 10 10
Strategy 8 10 10 10 10 10 10
Strategy 9 5 5 5 5 5 5
Strategy 10 5 5 5 5 5 5
I buy the same as before 50 50 50 50 50 50
Co
pyr
igh
t ©
2012
Th
e N
iels
en C
om
pan
y. C
on
fid
enti
al a
nd
pro
pri
etar
y.
34
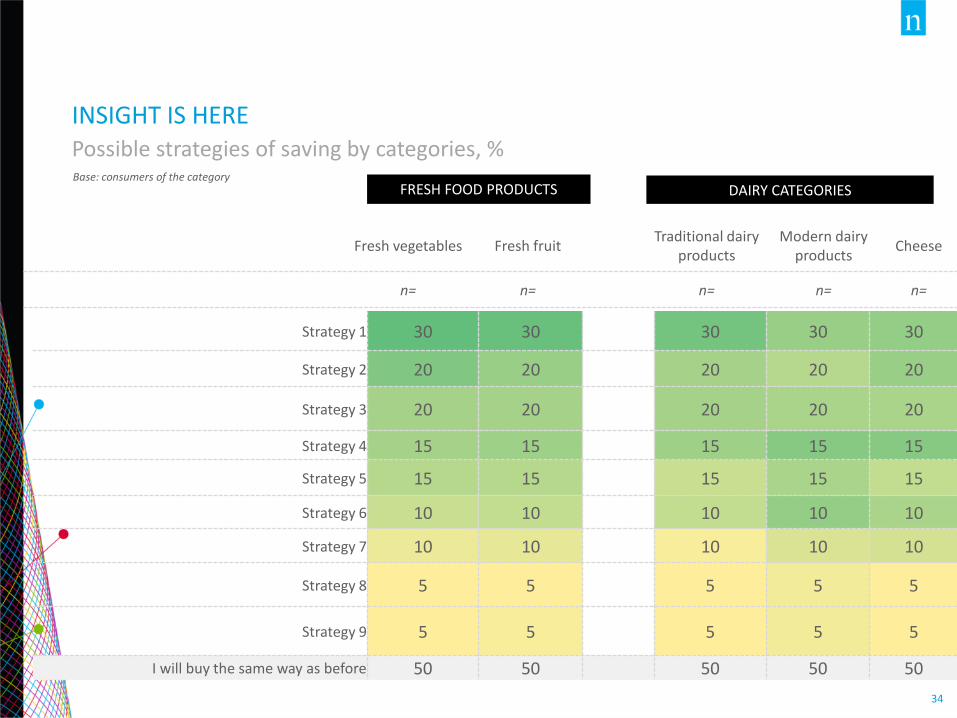
FRESH FOOD PRODUCTS DAIRY CATEGORIES
Fresh vegetables Fresh fruit Traditional dairy
products Modern dairy
products Cheese
n= n= n= n= n=
INSIGHT IS HERE Possible strategies of saving by categories, % Base: consumers of the category
Strategy 1 30 30 30 30 30
Strategy 2 20 20 20 20 20
Strategy 3 20 20 20 20 20
Strategy 4 15 15 15 15 15
Strategy 5 15 15 15 15 15
Strategy 6 10 10 10 10 10
Strategy 7 10 10 10 10 10
Strategy 8 5 5 5 5 5
Strategy 9 5 5 5 5 5
I will buy the same way as before 50 50 50 50 50
Co
pyr
igh
t ©
2012
Th
e N
iels
en C
om
pan
y. C
on
fid
enti
al a
nd
pro
pri
etar
y.
35
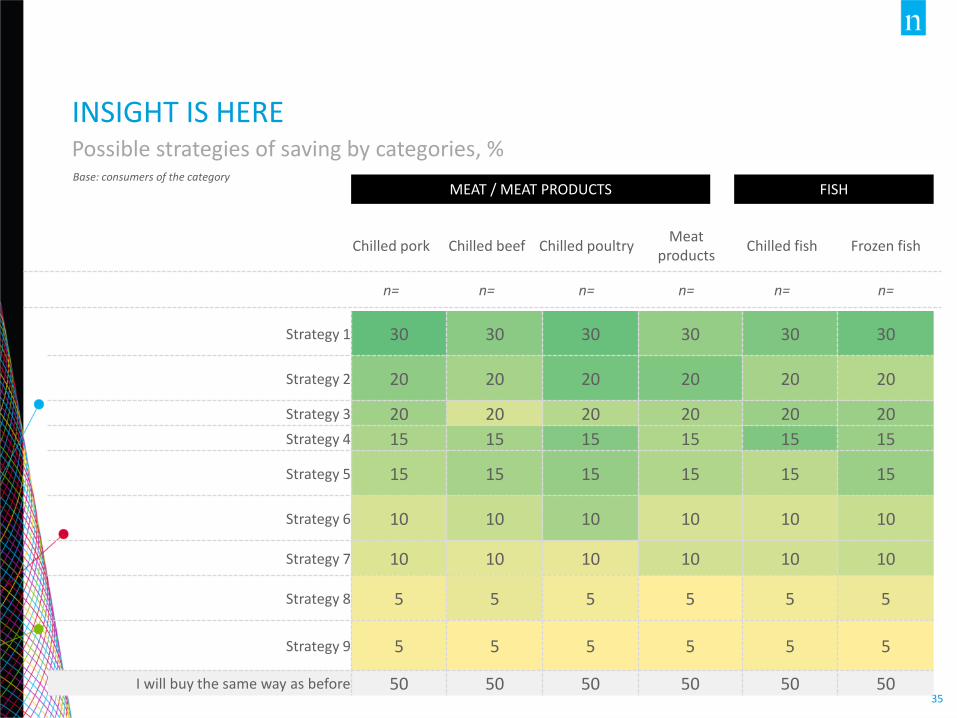
MEAT / MEAT PRODUCTS
Chilled pork Chilled beef Chilled poultry Meat
products Chilled fish Frozen fish
n= n= n= n= n= n=
INSIGHT IS HERE Possible strategies of saving by categories, %
FISH Base: consumers of the category
Strategy 1 30 30 30 30 30 30
Strategy 2 20 20 20 20 20 20
Strategy 3 20 20 20 20 20 20
Strategy 4 15 15 15 15 15 15
Strategy 5 15 15 15 15 15 15
Strategy 6 10 10 10 10 10 10
Strategy 7 10 10 10 10 10 10
Strategy 8 5 5 5 5 5 5
Strategy 9 5 5 5 5 5 5
I will buy the same way as before 50 50 50 50 50 50
Co
pyr
igh
t ©
2013
Th
e N
iels
en C
om
pan
y. C
on
fid
enti
al a
nd
pro
pri
etar
y.
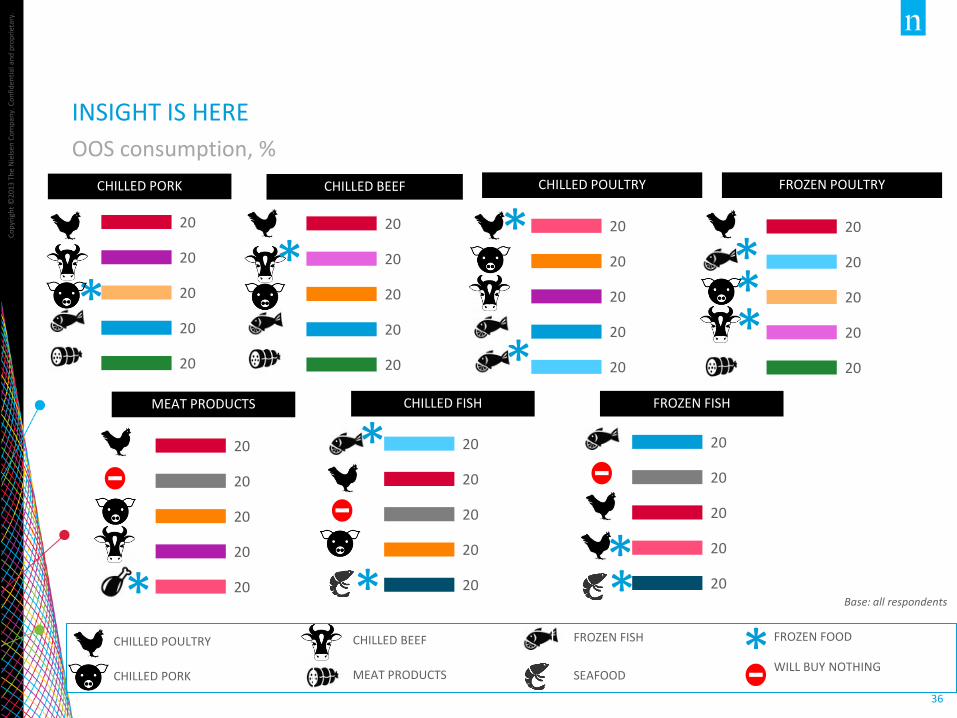
36
FROZEN FOOD
WILL BUY NOTHING
FROZEN FISH
SEAFOOD
INSIGHT IS HERE
OOS consumption, %
Base: all respondents
20
20
20
20
20
CHILLED PORK
20
20
20
20
20
CHILLED BEEF
20
20
20
20
20
CHILLED POULTRY
*
*
20
20
20
20
20
FROZEN POULTRY
20
20
20
20
20
MEAT PRODUCTS
*
20
20
20
20
20
CHILLED FISH
*
* 20
20
20
20
20
FROZEN FISH
* *
CHILLED BEEF
MEAT PRODUCTS
CHILLED POULTRY
CHILLED PORK *
* *
* * *
SHOPPERS' PROFILE
Co
pyr
igh
t ©
2013
Th
e N
iels
en C
om
pan
y. C
on
fid
enti
al a
nd
pro
pri
etar
y.
38
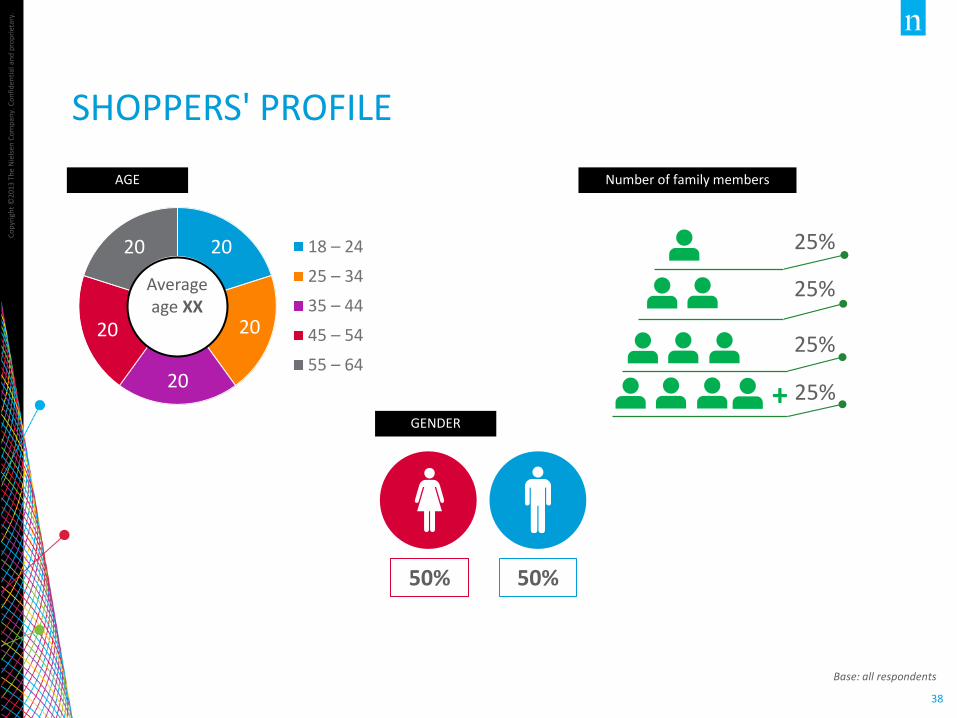
20
20
20
20
20 18 – 24
25 – 34
35 – 44
45 – 54
55 – 64
SHOPPERS' PROFILE
Base: all respondents
50% 50%
25%
25%
25%
25% +
Average age XX
Number of family members AGE
GENDER
Co
pyr
igh
t ©
2013
Th
e N
iels
en C
om
pan
y. C
on
fid
enti
al a
nd
pro
pri
etar
y.
39
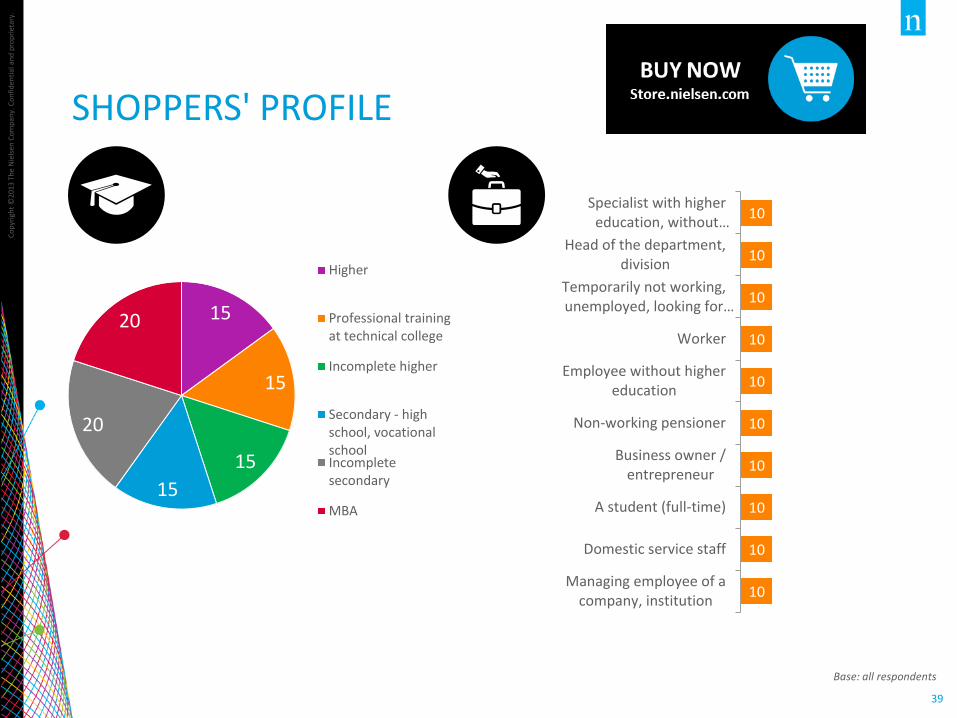
15
15
15
15
20
20
Higher
Professional trainingat technical college
Incomplete higher
Secondary - highschool, vocationalschoolIncompletesecondary
MBA
SHOPPERS' PROFILE
Base: all respondents
10
10
10
10
10
10
10
10
10
10
Specialist with highereducation, without…
Head of the department,division
Temporarily not working,unemployed, looking for…
Worker
Employee without highereducation
Non-working pensioner
Business owner /entrepreneur
A student (full-time)
Domestic service staff
Managing employee of acompany, institution