Embed Size (px)
Citation preview
1
Russell Sage Foundation Volume
Chapter 7
RATINGS, MORTGAGE SECURITIZATIONS, AND
THE APPARENT CREATION OF VALUE
John Hull and Alan White
University of Toronto
First Version: April 2010
This version: November 2011
ABSTRACT
This chapter studies the criteria used by rating agencies when they rate structured products. The
criterion used by S&P and Fitch aims to ensure that the probability of a loss on a structured
product with a certain rating is similar to the probability of a loss on a corporate bond with the
same rating. The criterion used by Moody’s aims to ensure that the expected loss on a structured
product with a certain rating is similar to the expected loss on a corporate bond with the same
rating.
The rating of a structured product is in some sense a measure of quality. It is reasonable to
assume that some investors assign a value to a structured product that increases as the credit
rating improves. This raises the question of whether the ratings criteria permit arbitrage. Is it
possible to improve the average perceived quality of a portfolio by restructuring it? We propose
a simple no-arbitrage condition that measures of credit quality should satisfy. We show that the
criterion used by Moody’s does satisfy the condition whereas the criterion used by S&P and
Fitch does not.
2
RATINGS, MORTGAGE SECURITIZATIONS, AND
THE APPARENT CREATION OF VALUE
1. Introduction
The traditional business of rating agencies is the rating of corporate and sovereign bonds.
Between 2000 and 2007 another part of their business, the rating of structured products, grew
very quickly, so much so that by the end of this period it was accounting for close to half of their
revenues. This paper examines whether the growth of the market for structured products was
influenced by the rating criteria used by rating agencies. We do not examine whether the ratings
criteria were correctly applied.1 Instead, we examine whether the ratings criteria, assuming that
they were correctly applied, led to ratings arbitrage where investors were misled about the value
of products.
This is an important public policy issue. Rating agencies have been widely criticized for their
role in the credit crisis that started in 2007. Investors were prepared to buy the products that
were created because rating agencies gave them AAA (Aaa) ratings. The products had complex
interdependent structures and, in many instances, investors’ reliance on ratings was so great that
they did no analysis of their own. In the fall of 2007, many structured products were
downgraded, which contributed to a panic in the market.2
In a securitization, a set of cash flows are repackaged to make them more attractive to the
market. Modigliani and Miller (1958) argue that, in a perfect and complete market, it should not
be possible to do this. A bundle of cash flows, whether from mortgages or other sources, should
be worth the same regardless of how it is packaged. A securitization can be attractive only if it
makes the market more complete or overcomes some market imperfection such as taxes or
regulation, and in doing so allows greater cash flows to be delivered to investors.
In practice, several factors influenced the development of the mortgage securitization market in
the United States during the 2000 to 2007 period. Among these are the following:
1 This is considered in Hull and White (2010)
2 See Gorton (2009) for a discussion of this.
3
a. Banks were regulated in such a way that capital requirements for assets in the
banking book3 were often greater than the capital requirements for equivalent-risk
assets in the trading book. A bank could therefore reduce its capital requirements
by securitizing mortgages and holding equivalent-risk products in its trading
book.
b. While moving assets from the banking book to the trading book reduced capital to
some extent, greater reductions could be achieved by removing the assets from
the bank altogether. This led banks to use what is termed the “originate-to-
distribute” model in which the bank originated loans and then eliminated their
credit exposures through securitizations.
c. Arguably, markets were incomplete and securitization created products that were
not otherwise available and for which there was unmet demand.
d. Structurers may have been able to take advantage of the methodologies used by
rating agencies and the assumptions about ratings made by investors to create
products that could be sold for considerably more than the value of the underlying
assets.
It is this last point that is the focus of this paper.
Brennan et al. (2009) also consider the role of rating agencies in securitization. They argue that
many arrangers of the securitizations of subprime mortgages were engaged in a form of ratings
arbitrage. They consider a framework similar to that in Merton (1974) in which the value of debt
is based on the value of the underlying assets. In this context, the debt’s rating is a property of
the probability distribution of the underlying asset value at the debt maturity date. Two different
underlying distributions may give rise to debt issues that have the same rating but different
values. Our approach differs from Brennan et al in that we consider alternative debt structures
based on the same underlying assets.
The research of Artzner et al. (1999) is related to ours. Regulators have for many years used risk
measures to determine capital requirements. Artzner et al. proposed four reasonable conditions
3 The banking book consists of assets such as loans than are expected to be held to maturity. Unless severely
impaired these assets are usually recorded at historic cost plus accrued interest. The trading book consists of assets
that are held for trading. These assets are recorded at current (mark-to-market) value.
4
that such risk measures should have. One of these conditions is subadditivity: if two portfolios
are combined, the risk measure for the combined portfolio should not be greater than the sum of
the risk measures for the individual portfolios. Diversification may cause the risk measure for the
combined portfolio to be smaller than the sum of the risk measures for the individual portfolios,
but there should never be a case in which the risks are somehow amplified. Artzner et al. show
that value at risk, which is the measure widely used by regulators, does not satisfy the
subadditivity condition because the total value at risk sometimes increases when two portfolios
are combined. Equivalently, value at risk sometimes decreases when portfolios are subdivided.
In this paper, we show that some of the criteria used by rating agencies lead to a similar
phenomenon. When a portfolio is restructured, or split into a number of separate products, there
is an apparent improvement in credit quality.
The Artzner et al. research emphasizes that risk measures are not necessarily concerned with
value. Unless some sort of market imperfection is addressed, combining portfolios or
subdividing a portfolio does not change total value. However, the total risk as quantified by some
of the measures that are used may change. In this paper we show that, even when the
restructuring of assets does not remove a market imperfection, restructuring can result in an
apparent improvement in credit quality which leads to an increase in the value of the assets. To
produce this result we make the plausible assumption that investors believe that, for all debt
instruments with a certain life, the value as a percentage of the no-default value increases as the
credit rating improves. Thus, if a 5-year A-rated instrument sells for 95% of its no-default value,
investors believe a similar AA-rated instrument should sell for more than 95% of its no-default
value.4
Our results may explain some of the phenomena that were observed during the crisis and may
have policy implications for the SEC oversight of rating agencies that has been mandated by the
Dodd-Frank legislation. They also raise some fundamental issues concerned with what ratings
are trying to measure. If they are trying to measure value, some of the criteria are misguided. If
4 Other similar simple assumptions about the way investors use ratings as a guide to valuation lead to the same
results as those in this paper.
5
they are trying to measure something else, it is important that this is made clear to the consumers
of ratings.5
This paper is organized as follows. We start by giving some background about rating agencies,
subprime securitization, and the criteria used by rating agencies for structured products. We then
propose a simple condition that any credit quality measure such as a rating should satisfy. We
show that probability of default does not satisfy this condition whereas expected loss does. This
leads us to conclude that in some cases the procedures used to rate structured products can create
the illusion of a free lunch.
2. Rating Agencies
Rating agencies have a long and largely successful history in the United States. John Moody and
Company first published “Moody’s Manual” which contained statistics and general information
about stocks and bonds in 1900. In 1909, it began publishing analytical information about
railroad securities and in 1914 created Moody’s Investors Service, which first provided ratings
for government bonds and later for corporate bonds and commercial paper. Standard and Poor’s
can trace its origins back to 1860 when Henry Varnum Poor published a book, updated annually,
on the financial and operational health of railroads. Standard Statistics was founded in 1906 to
provide financial information on non-railroad companies. Standard and Poor’s was formed in
1941 from a merger of Standard Statistics and Poor’s Publishing. The third major rating agency,
Fitch, was formed in 1913 when John Knowles Fitch formed Fitch Publishing Company, and
published statistics via “The Fitch Stock and Bond Manual.”
S&P and Fitch use the rating categories AAA, AA, A, BBB, BB, B, CCC, CCC, and C to
describe bonds while Moody’s uses Aaa, Aa, A, Baa, Ba, B, Caa, Ca, and C. To create a finer
gradation S&P and Fitch divide the all categories except AAA into three subcategories. For
example, AA is divided into AA+, AA, and AA−; A is divided into A+, A, and A−, etc.
Similarly Moody’s divides its rating categories into three subcategories. Aa is divided into Aa1,
5 Arguably, learning and competition should lead investors to understand the weaknesses of ratings over time. If this
were the case, the regulation of rating agencies would seem to be unnecessary.
6
Aa2, and Aa3; A is divided into A1, A2, and A3; etc. The difference between adjacent
subcategories is called a ‘notch.’ Thus an A1 rating is one notch better than an A2 rating. It
seems generally accepted by the market that there is equivalence between the rating systems of
the three rating agencies. Thus AA− from S&P is considered equivalent to AA− from Fitch and
equivalent to Aa3 from Moody’s.
Rating agencies use a “through-the-cycle” rather than a “point-in-time” approach to rating. This
means that they try to consider only permanent changes in a company’s health when changing
the company’s rating.6 Problems faced by a company that are considered to be temporary (e.g.,
poor economic conditions) do not usually lead to a rating change. This allows ratings agencies to
satisfy one of the requirements of investors: ratings stability. Ratings reversals (e.g., a
downgrade followed by an upgrade) are avoided as far as possible. Cantor and Mann (2003)
describe Moody’s policy: “If over time new information reveals a potential change in an issuer’s
relative creditworthiness, Moody’s considers whether or not to adjust the rating. It manages the
tension between its dual objectives – accuracy and stability – by changing ratings only when it
believes an issuer has experienced what is likely to be an enduring change in fundamental
creditworthiness. For this reason ratings are said to ‘look-through-the-cycle’.” Standard and
Poor’s (2010) states that “…Standard & Poor's incorporates credit stability as an important factor
in our rating opinions.”
Bond investors rely heavily on ratings.7 Often the bonds that investment funds are allowed to
invest in are determined by their ratings. For example, some funds are allowed to invest only in
investment grade bonds (i.e., those rated are BBB (Baa) or better). If a bond is downgraded
below investment grade it must be sold. This is a simple governance tool that limits the activities
of the fund manager. Without such a rule the investors in the fund would have to monitor the
fund’s trading activities more closely to ensure that the fund is not taking undue risks. With such
a rule the monitoring role is effectively delegated to the rating agency. Investors assume that the
bonds that are rated investment grade have an acceptably low level of risk.
6 For a discussion of this, see Altman and Rijken (2004).
7 The National Association of Insurance Regulators (NAIC) implies that ratings are used to make investment
decisions in its statement that “Unlike the ratings of nationally recognized statistical rating organizations, NAIC
designations are not produced to aid the investment decision making process…” http://www.naic.org/svo.htm.
7
A measure of the success of ratings is that they are used by more than just bond investors.
Ratings are used by the Basel Committee in setting regulatory capital.8 Also, rating triggers are
not uncommon in agreements for derivatives transactions between two parties. For example, an
agreement might state that collateral has to be posted by a counterparty if its credit rating falls
below a certain level. (A trigger of this type was involved in the government bailout of AIG.9)
This is an example of how large financial institutions also delegate monitoring responsibility to
the rating agencies.
Originally the credit rating agencies used a “user-pay model.” Ratings were published in books
that were issued monthly and sold to users of ratings such as investors. With the development of
inexpensive photocopying in the 1970s this business model was no longer viable and the rating
agencies switched to an “issuer-pay model.” This means that the services of rating agencies are
now paid for by the issuers of bonds, not by the investors and other market participants that use
those services. This creates an obvious potential conflict of interest in which the issuer refuses to
pay for a rating unless the rating is satisfactory to the issuer.
The main constraint on this potential conflict of interest is that the ratings business is a
reputation-based business. The only reason investors rely on ratings is that the rating agencies
have a long history of producing reasonably reliable ratings. As long as the reputation is
maintained, the ratings business provides an ongoing stream of revenue from new ratings. (As a
result, rating agencies have an incentive to avoid significant bias in the ratings.) The reputation
also acts as a barrier to entry since new entrants would presumably have to operate at a loss for
some time while developing their own reputation.
If the issuer decides not to pay, the agency may issue an unsolicited rating. Issuers might fear
that such an unsolicited rating will be worse than the solicited rating and so pay for the rating.
The evidence is that unsolicited ratings are most often issued for poorer quality borrowers and so
8 The Dodd-Frank act in the United States seeks to eliminate any reliance on external credit ratings and is therefore
in conflict with Basel requirements. 9 In an August 6, 2008 regulatory filing AIG revealed that a ratings cut might trigger more than $13 billion in
collateral calls. (Bloomberg, September 15, 2008.) Again in March 2009 AIG reported that another downgrade
would result in $8 billion of collateral calls and termination payments. (MarketWatch, March 2, 2009.) A summary
of the use of ratings in setting collateral can be found in ISDA (2010).
8
tend to be lower than average. There is also some evidence that unsolicited ratings are less than
solicited ratings for firms with similar financial statements.10
3. Subprime Securitization
Asset backed securities (ABSs) were first created in the late 1970’s. In these securitizations, a
special purpose vehicle (SPV) is created. The SPV is essentially a special type of corporation in
which the assets of the corporation are a portfolio of debt instruments and the liabilities of the
corporation are the securities issued to the investors. Unlike regular corporations in which the
types of financing are given names such as senior secured debt or equity and may have different
tax treatment, in an ABS the securities issued are referred to as tranches, tend to have the same
tax treatment, and are usually just numbered. There are rules for determining how cash flows
from the portfolio of debt instruments are distributed to the securities. The more senior a security
is, the less likely it is to be affected by defaults on the debt instruments.
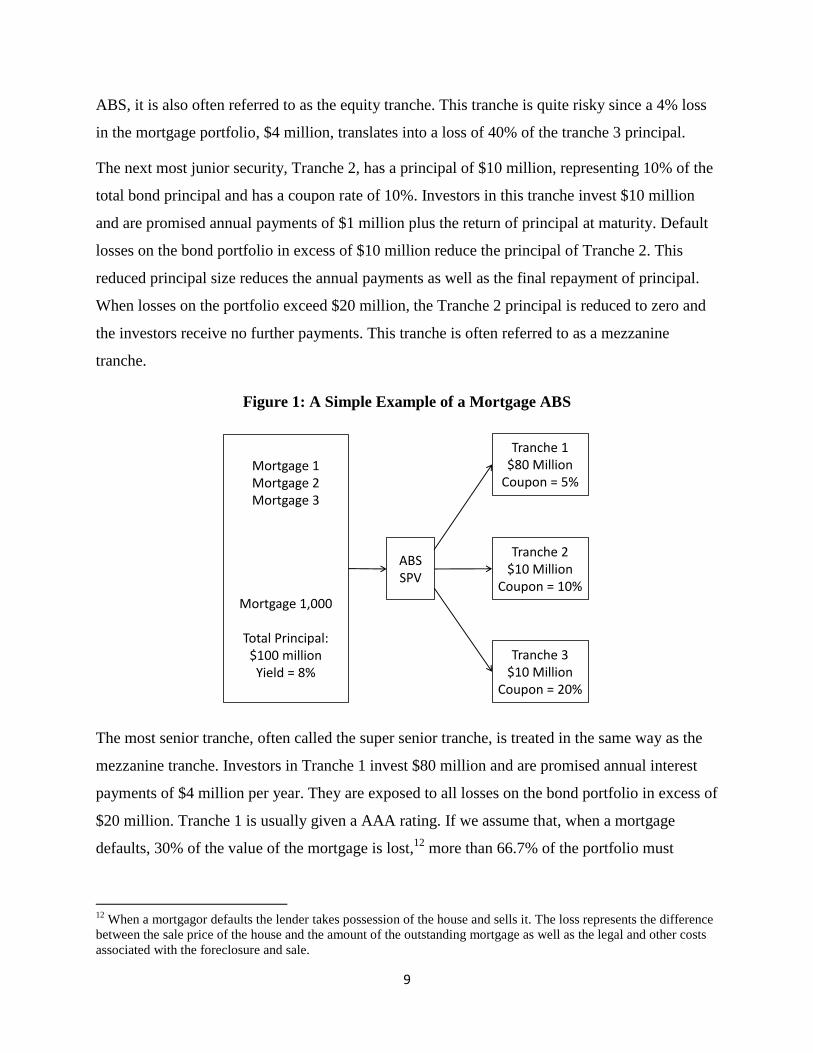
Figure 1 shows the structure of a very simple securitization. The most junior security, Tranche 3,
has a principal of $10 million, representing 10% of the total mortgage principal and has a coupon
rate of 20%. Investors in this tranche invest $10 million and are promised annual payments equal
to $2 million per year plus the return of principal at maturity. As defaults occur in the mortgage
portfolio reducing the asset base, the principal of Tranche 3 is reduced. This reduction in
principal reduces the annual payments as well as the final repayment of principal. For example,
if portfolio losses are $4 million the remaining Tranche 3 principal is $6 million and the annual
interest payments are reduced to $1.2 million. If losses on the portfolio exceed $10 million, 10%
of the portfolio size, the Tranche 3 principal is reduced to zero and the investors receive no
further payments.11
In a regular corporation, Tranche 3 would be referred to as equity. In an
10
See Poon (2003) and Poon et al (2005). 11
This is a simplified description of events. In practice losses due to default in the mortgage portfolio reduce the
amount of income available to pay interest to the tranche investors. Any interest shortfall is borne by the Tranche 3
investors first. The reduction of principal in the mortgage portfolio reduces the amount available to repay tranche
investors when the mortgage portfolio is liquidated. Any principal repayment shortfall is borne by the Tranche 3
investors first. Thus, it is as though losses due to default in the mortgage portfolio reduce the Tranche 3 principal
and the corresponding interest payments.
9
ABS, it is also often referred to as the equity tranche. This tranche is quite risky since a 4% loss
in the mortgage portfolio, $4 million, translates into a loss of 40% of the tranche 3 principal.
The next most junior security, Tranche 2, has a principal of $10 million, representing 10% of the
total bond principal and has a coupon rate of 10%. Investors in this tranche invest $10 million
and are promised annual payments of $1 million plus the return of principal at maturity. Default
losses on the bond portfolio in excess of $10 million reduce the principal of Tranche 2. This
reduced principal size reduces the annual payments as well as the final repayment of principal.
When losses on the portfolio exceed $20 million, the Tranche 2 principal is reduced to zero and
the investors receive no further payments. This tranche is often referred to as a mezzanine
tranche.
Figure 1: A Simple Example of a Mortgage ABS
Mortgage 1Mortgage 2Mortgage 3
Mortgage 1,000
Total Principal:$100 millionYield = 8%
ABSSPV
Tranche 1$80 Million
Coupon = 5%
Tranche 2$10 Million
Coupon = 10%
Tranche 3$10 Million
Coupon = 20%
The most senior tranche, often called the super senior tranche, is treated in the same way as the
mezzanine tranche. Investors in Tranche 1 invest $80 million and are promised annual interest
payments of $4 million per year. They are exposed to all losses on the bond portfolio in excess of
$20 million. Tranche 1 is usually given a AAA rating. If we assume that, when a mortgage
defaults, 30% of the value of the mortgage is lost,12
more than 66.7% of the portfolio must
12
When a mortgagor defaults the lender takes possession of the house and sells it. The loss represents the difference
between the sale price of the house and the amount of the outstanding mortgage as well as the legal and other costs
associated with the foreclosure and sale.
10
default before the principal of Tranche 1 is impaired.13
If 100% of the mortgages default, the
total loss on the mortgage portfolio is $30 million of which only $10 million is borne by the
Tranche 1 investors.
The assets in an ABS do not have to be mortgages. They may be securities backed by auto loans,
credit card receivables, student loans, manufactured housing loans, or non-traditional asset types
such as mutual fund fees, tax liens, tobacco settlement payments, and intellectual property. In
some cases, as we shall see, the assets in the portfolio may include tranches from other
securitizations.
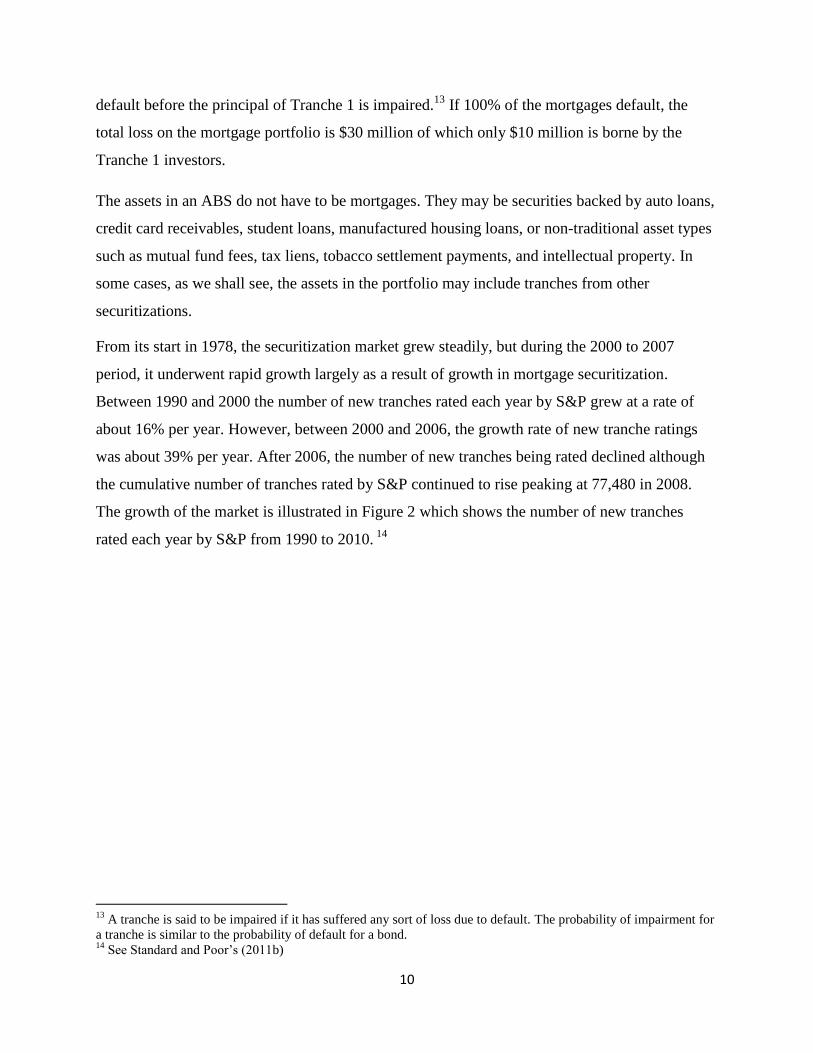
From its start in 1978, the securitization market grew steadily, but during the 2000 to 2007
period, it underwent rapid growth largely as a result of growth in mortgage securitization.
Between 1990 and 2000 the number of new tranches rated each year by S&P grew at a rate of
about 16% per year. However, between 2000 and 2006, the growth rate of new tranche ratings
was about 39% per year. After 2006, the number of new tranches being rated declined although
the cumulative number of tranches rated by S&P continued to rise peaking at 77,480 in 2008.
The growth of the market is illustrated in Figure 2 which shows the number of new tranches
rated each year by S&P from 1990 to 2010. 14
13
A tranche is said to be impaired if it has suffered any sort of loss due to default. The probability of impairment for
a tranche is similar to the probability of default for a bond. 14
See Standard and Poor’s (2011b)
11
Figure 2: Number of New Tranches Rated By S&P 1990 to 2010
0
5,000
10,000
15,000
20,000
25,000
1990 1991 1992 1993 1994 1995 1996 1997 1998 1999 2000 2001 2002 2003 2004 2005 2006 2007 2008 2009 2010
Number of new ratings
Number of new defaults
As of 2006,15
the outstanding number of ABS tranches rated by Moody’s was 37,035 of which
88% were rated investment grade and about 26% were rated Aaa (Moody’s (2007a)). About 22%
were US residential mortgage backed securities (RMBS), 30% were US home equity loans
(HEL),16
and about 12% were US commercial mortgage backed securities (CMBS). By
comparison at the same time Moody’s was rating 4,989 corporate bonds of which 61.7% were
rated investment grade and 2.7% were rated Aaa.17
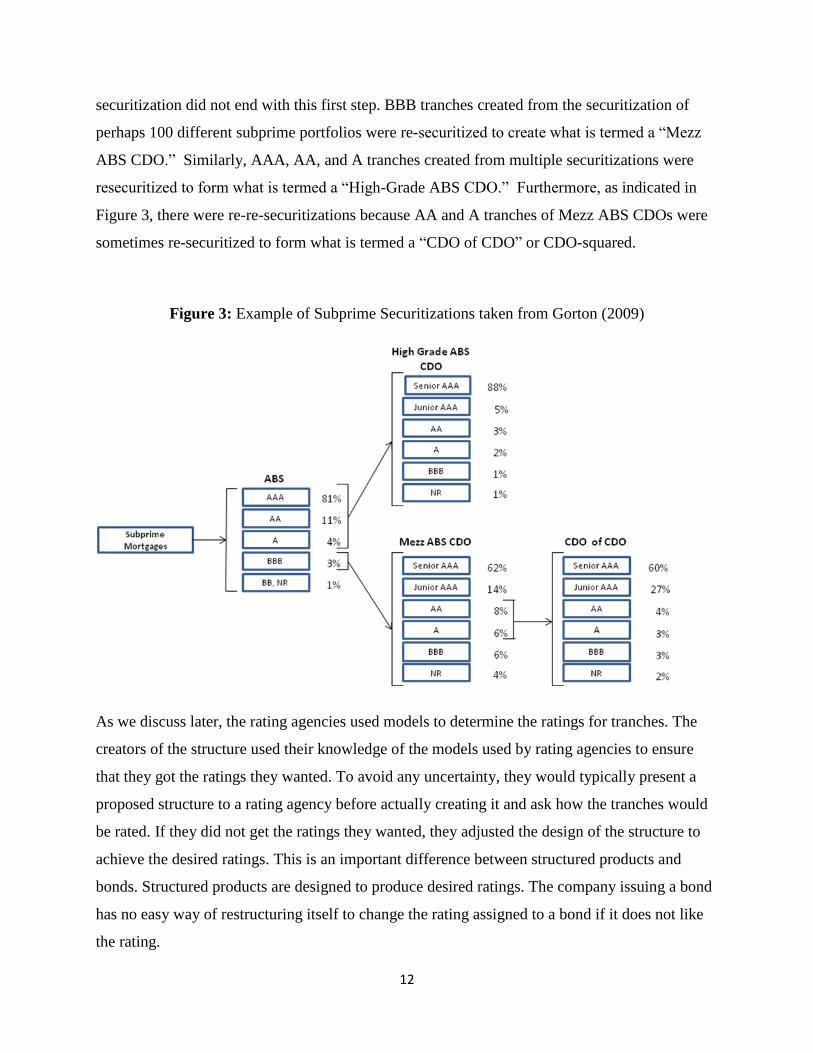
Market participants were very creative in the way that they used the ABS structure in Figure 1
for subprime mortgages. An example of what was done is shown in Figure 3. This is based on an
illustration in Gorton (2009), which in turn is based on an article published by UBS. The ABS in
Figure 3 would typically be created from a portfolio of 1,000 subprime mortgages, but the
15
The Moody’s results are reported for 2006 since this is the last year in which the two agencies counted tranches in
the same way. Up until this time, pari passu and other equivalent tranches from the same securitization were
counted as a single tranche. After 2006, Moody’s counted all tranches separately. This led to an approximate
doubling of the number of tranches reported. In 2006, S&P rated 50,899 tranches, about 37% more than Moody’s. 16
Home equity loans include sub-prime mortgages, high loan-to-value loans, and home equity lines of credit. 17
See Moody’s (2011).
12
securitization did not end with this first step. BBB tranches created from the securitization of
perhaps 100 different subprime portfolios were re-securitized to create what is termed a “Mezz
ABS CDO.” Similarly, AAA, AA, and A tranches created from multiple securitizations were
resecuritized to form what is termed a “High-Grade ABS CDO.” Furthermore, as indicated in
Figure 3, there were re-re-securitizations because AA and A tranches of Mezz ABS CDOs were
sometimes re-securitized to form what is termed a “CDO of CDO” or CDO-squared.
Figure 3: Example of Subprime Securitizations taken from Gorton (2009)
As we discuss later, the rating agencies used models to determine the ratings for tranches. The
creators of the structure used their knowledge of the models used by rating agencies to ensure
that they got the ratings they wanted. To avoid any uncertainty, they would typically present a
proposed structure to a rating agency before actually creating it and ask how the tranches would
be rated. If they did not get the ratings they wanted, they adjusted the design of the structure to
achieve the desired ratings. This is an important difference between structured products and
bonds. Structured products are designed to produce desired ratings. The company issuing a bond
has no easy way of restructuring itself to change the rating assigned to a bond if it does not like
the rating.
13
Securitization is profitable to the creators of tranches because the weighted average return paid to
the tranche holders is less than the weighted average return received from the mortgages. For
example, in the structure illustrated in Figure 1 the average interest rate on the mortgages is 8%.
The weighted average interest rate on the three tranches issued is 7%. The difference between the
interest rate earned on the mortgages and the rate paid on the tranches, 1%, is referred to as
excess spread. It is used to cover the cost of the securitization, provide extra security to the
investors, and to provide a profit to the creator of the structure. Profitability is maximized by
making the ratings of the tranches as high as possible because the higher the rating of a tranche
the lower the return the tranche holder is prepared to accept. Structurers therefore aim to make
the percentage of AAA-rated products in a securitization as large as possible. If all
securitizations had the characteristics of Figure 3, 91.9% of the subprime mortgages fed into the
securitization machines would eventually become AAA-rated securities.18
Dodd and Mills
(2008) suggest that Figure 3 is not atypical in this respect. They estimate the total principal of the
AAA-rated securities created from subprime mortgages was about 90% of the principal of the
underlying mortgages.
4. Ratings Criteria
The rating of bonds is based on a mixture of judgment and analysis. Ratings agencies test
whether the ratings are both reasonable and consistent over time. For example, they carry out
annual cohort studies which measure the ex-post realized default rates for all the securities they
rate in each rating category. If the ratings are consistent over time, the realized default rate for
each rating class will not change materially from year to year.
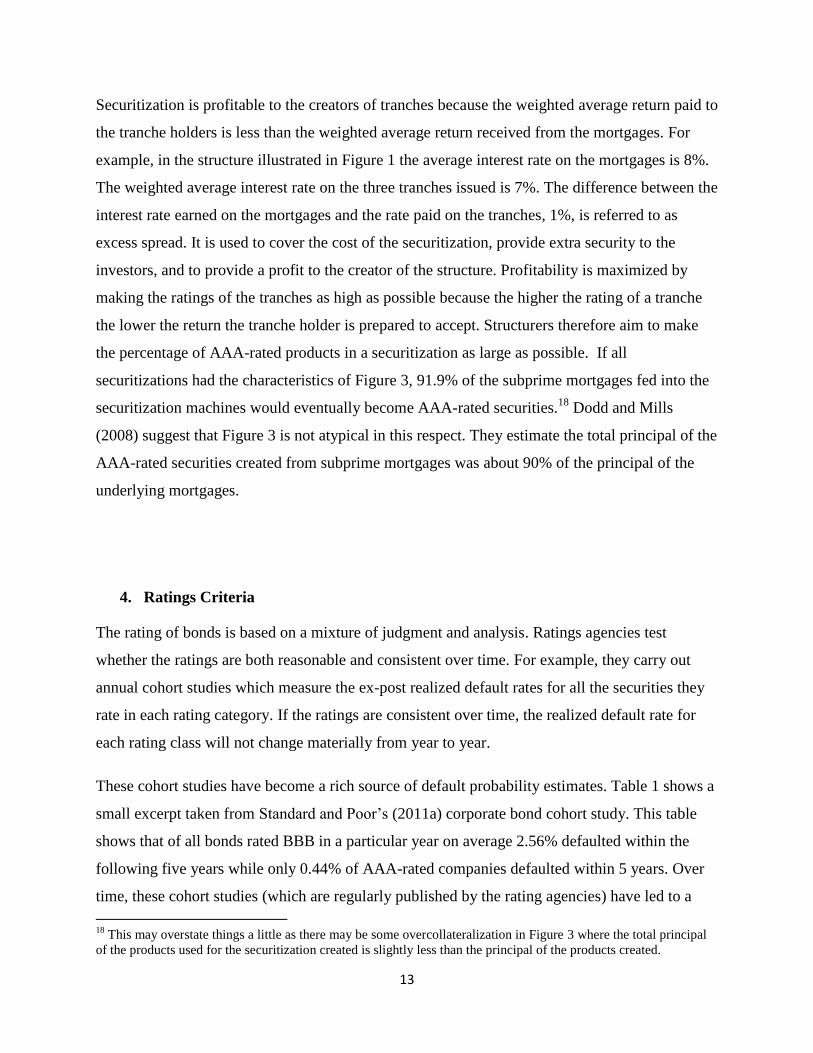
These cohort studies have become a rich source of default probability estimates. Table 1 shows a
small excerpt taken from Standard and Poor’s (2011a) corporate bond cohort study. This table
shows that of all bonds rated BBB in a particular year on average 2.56% defaulted within the
following five years while only 0.44% of AAA-rated companies defaulted within 5 years. Over
time, these cohort studies (which are regularly published by the rating agencies) have led to a
18
This may overstate things a little as there may be some overcollateralization in Figure 3 where the total principal
of the products used for the securitization created is slightly less than the principal of the products created.
14
perception by market participants that the credit rating provides an estimate of the bond’s
probability of default.
Table 1: S&P Average Cumulative Default Rates, 1981-2010
Time Horizon (Years)
Rating 1 2 3 4 5
AAA 0.00% 0.04% 0.17% 0.30% 0.44%
AA 0.04% 0.09% 0.20% 0.34% 0.46%
A 0.09% 0.24% 0.42% 0.63% 0.85%
BBB 0.27% 0.73% 1.21% 1.86% 2.56%
BB 1.00% 3.02% 5.47% 7.77% 9.80%
B 4.77% 10.67% 15.78% 19.79% 22.84%
CCC-C 28.31% 39.25% 45.51% 49.42% 52.35%
When rating agencies started to rate structured products their initial approach was similar to that
used for bonds: judgment and analysis. However, because of the relatively simple nature of the
structured products,19
over time the approach to rating structured products became more model-
based. The rating agencies are fairly open about the models they use. Two key inputs to their
models are the probabilities of default for each of the assets underlying the securitization
(derived from the cohort study results) and expected losses given default for each asset (based on
their historical experience). Default correlation also has to be quantified in some way.
The approach used by the rating agencies to assess the rating of a structured product will be
discussed in the context of the simplified structure20
illustrated in Figure 1. In assigning ratings
to the tranches, the rating agency considers the historical behavior of the subprime mortgages.
Experience has been that some subprime borrowers prepay their mortgages early in order to
borrow at a better interest rate while other subprime borrowers default. As a result, although
subprime mortgages are usually scheduled to last 30 years, in practice they have an average life
of about 5 years. When determining the ratings of tranches created from subprime mortgages, it
is therefore appropriate to compare their losses with the losses on bonds over a five-year period.
19
It is much easier to understand the nature of the assets underlying a securitization and how these asset values may
change than it is to understand how the value of the assets of a corporation may change. 20
In addition to the simplified structure, we ignore any excess spread or any prepayments of the mortgages being
securitized.
15
Suppose the historical experience has been that 10% of subprime borrowers default within five
years of taking out the mortgage and that the losses due to default are 25% of the value of the
outstanding mortgage.21
If the future is the same as the past, this means that losses on the pool of
mortgages in Figure 1 will be $2.5 million, all of which will be borne by the Tranche 3 investors.
However default rates in the future may be higher than in the past and higher default rates will
probably be associated with greater losses since it will probably be more difficult to sell the
repossessed house when there are many defaults. If more than 40% of subprime borrowers
default within five years (more than four times the historic default rate) and losses due to default
are 50% of the value of the outstanding mortgage (twice the historic experience), the total
portfolio loss is over $20 million. This consumes the entire principal of Tranches 2 and 3 and
Tranche 1 bears some loss. A rating agency that was matching the probability of tranche
impairment to the historical bond default rates in Table 1 would therefore give Tranche 1 a rating
of AAA if it believed that the probability that more than 40% of borrowers would default was
less than 0.44% (which is the 5-year AAA default rate for bonds in Table 1).22
This procedure of assigning tranche ratings by comparing the estimated probability of tranche
impairment to the historical realized probability of default for corporate bonds was used by
Standard and Poor’s and Fitch. The differences between the ratings assigned to a tranche by the
two agencies were the result of different estimates of historical default behaviour and differences
in the estimated probabilities of extreme default events.
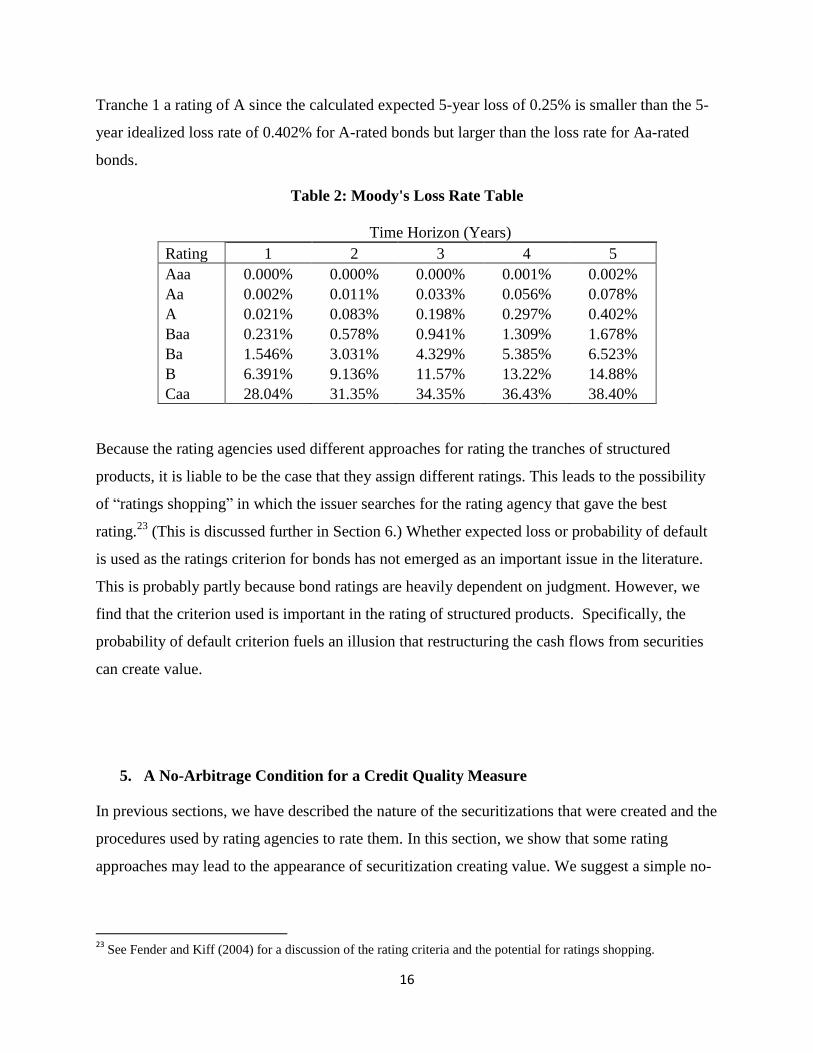
Moody’s assigned tranche ratings based on how much investors expected to lose on average as a
result of defaults. The averaging was done over all possible outcomes. For example, suppose that
Moody’s estimated that 99% of the time the subprime default rate and the loss due to default
would be sufficiently low that Tranche 1 suffered no loss, but that 1% of the time the total
portfolio loss would be $40 million so that the loss to Tranche 1 is $20 million (i.e., 25% of its
principal). In this case the expected loss is 0.99×0% + 0.01×25% or 0.25% of the principal. This
calculated expected loss would be compared with Moody’s historical experience of the losses on
bonds with different ratings. Table 2 taken from Moody’s (2007a) shows the relationship
between ratings and expected loss. Based on the assumed outcomes Moody’s would give
21
These are roughly consistent with subprime experience prior to 2005. 22
All of the complex default modelling undertaken by the rating agencies is related to determining the likelihood of
high default rates and what the loss would be in such an environment.
16
Tranche 1 a rating of A since the calculated expected 5-year loss of 0.25% is smaller than the 5-
year idealized loss rate of 0.402% for A-rated bonds but larger than the loss rate for Aa-rated
bonds.
Table 2: Moody's Loss Rate Table
Time Horizon (Years)
Rating 1 2 3 4 5
Aaa 0.000% 0.000% 0.000% 0.001% 0.002%
Aa 0.002% 0.011% 0.033% 0.056% 0.078%
A 0.021% 0.083% 0.198% 0.297% 0.402%
Baa 0.231% 0.578% 0.941% 1.309% 1.678%
Ba 1.546% 3.031% 4.329% 5.385% 6.523%
B 6.391% 9.136% 11.57% 13.22% 14.88%
Caa 28.04% 31.35% 34.35% 36.43% 38.40%
Because the rating agencies used different approaches for rating the tranches of structured
products, it is liable to be the case that they assign different ratings. This leads to the possibility
of “ratings shopping” in which the issuer searches for the rating agency that gave the best
rating.23
(This is discussed further in Section 6.) Whether expected loss or probability of default
is used as the ratings criterion for bonds has not emerged as an important issue in the literature.
This is probably partly because bond ratings are heavily dependent on judgment. However, we
find that the criterion used is important in the rating of structured products. Specifically, the
probability of default criterion fuels an illusion that restructuring the cash flows from securities
can create value.
5. A No-Arbitrage Condition for a Credit Quality Measure
In previous sections, we have described the nature of the securitizations that were created and the
procedures used by rating agencies to rate them. In this section, we show that some rating
approaches may lead to the appearance of securitization creating value. We suggest a simple no-
23
See Fender and Kiff (2004) for a discussion of the rating criteria and the potential for ratings shopping.
17
arbitrage condition that a credit quality measure such as a credit rating should satisfy in order to
avoid this problem.
Suppose that q is a measure of the credit quality of an asset that is subject to default risk with the
property that q increases as the credit quality decreases. As mentioned, the credit quality measure
used by S&P and Fitch for structured products is the probability that the loss will be greater than
zero while that used by Moody’s is the percentage expected loss. Both of these measures have
the desired property: higher probability of default or higher expected loss due to default is
associated with poorer credit quality.
The asset for which a credit quality measure is calculated can be a single asset such as a bond or
a portfolio of assets. For a portfolio, the credit quality can be measured either in terms of the
single value of q corresponding to the whole portfolio or in terms of the frequency distribution of
q’s for the constituent assets. For example, suppose the portfolio contains four $100 bonds and
our q-measure is the probability of default. One of the bonds has a default probability of 1%, one
has a default probability of 2%, and two have a default probability of 5%. The q-measure for the
entire portfolio is the probability that the portfolio suffers impairment due to default. This occurs
if any bond in the portfolio defaults. (This q-measure is greater than 5%, the largest single bond
default probability.) The frequency distribution of the q’s is as follows
25% of the portfolio has q=1%
25% of the portfolio has q=2%
50% of the portfolio has q=5%
We now define a concept which we refer to as “credit quality dominance” which we define in
terms of the frequency distribution of the q’s for a portfolio. Portfolio Y dominates Portfolio X
if it gives an unambiguous better frequency distribution for the q’s. The concept is best
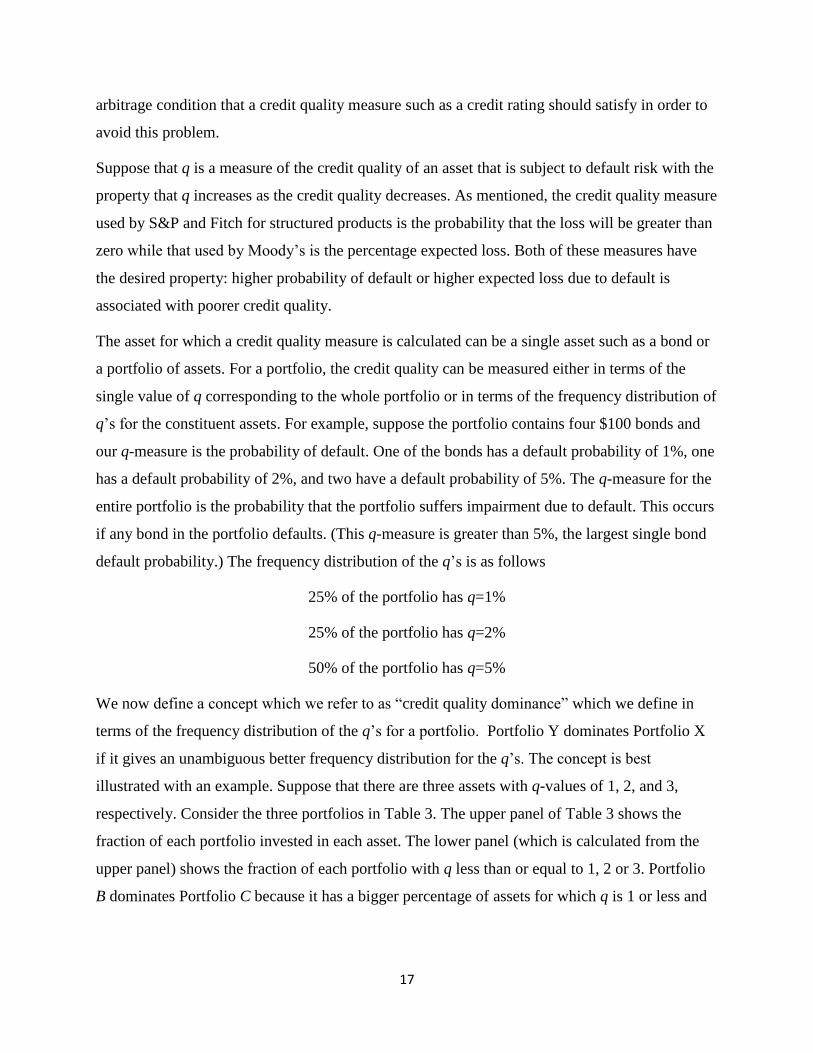
illustrated with an example. Suppose that there are three assets with q-values of 1, 2, and 3,
respectively. Consider the three portfolios in Table 3. The upper panel of Table 3 shows the
fraction of each portfolio invested in each asset. The lower panel (which is calculated from the
upper panel) shows the fraction of each portfolio with q less than or equal to 1, 2 or 3. Portfolio
B dominates Portfolio C because it has a bigger percentage of assets for which q is 1 or less and
18
the percentage of assets for which q is 2 or less or 3 or less is the same for both portfolios. 24
Also, Portfolio A dominates Portfolio C because they have the same percentage of assets for
which q is 1 or less or 3 or less, but Portfolio A has more assets for which q is 2 or less. There is
no dominance between portfolio A and Portfolio B.
Table 3: Example illustrating credit quality dominance
Portfolio A Portfolio B Portfolio C
Asset 1 (q=1) 0% 80% 0%
Asset 2 (q=2) 100% 10% 90%
Asset 3 (q=3) 0% 10% 10%
Fraction with q equal to1 or less 0% 80% 0%
Fraction with q equal to 2 or less 100% 90% 90%
Fraction with q equal to 3 or less 100% 100% 100%
We assume that some investors use the credit quality measure, q, as a guide to valuing a
portfolio. More specifically, we assume that the value that some investors assign to a product
with a certain life, as a percentage of its no-default value, increases as the credit quality measure
improves. That is, assets with worse credit ratings (higher q) have lower value than otherwise
similar assets with better credit ratings. This behaviour is plausible and seems to be at the heart
of the criticisms of the rating agencies.
We define a restructuring of a portfolio as a method by which all the cash flows generated by the
assets in the portfolio are redistributed to create a new portfolio of assets. A credit quality
arbitrage occurs when a portfolio can be restructured into a new portfolio that has a higher value
for at least some market participants. Under our assumption about investor behavior in the
previous paragraph, if the restructuring produces credit quality dominance it results in credit
quality arbitrage.25
It follows that:
24
The technical definition is: B dominates C if for each value of q the fraction of B with that q or smaller less the
fraction of C with that q or less is either positive or zero and for at least one q it is positive. 25
This is intuitively obvious. It is proved formally in Hull and White (2011)
19
A necessary condition for a credit quality measure to be arbitrage-free is that, for
every Portfolio X and every Portfolio Y that can be restructured from X, there be no
credit quality dominance between X and Y.
Probability of loss does not satisfy the no-arbitrage condition. To show this, define Portfolio X as
any portfolio that may be subject to losses due to default. (For example, Portfolio X could be a
single bond or a portfolio of bonds.) Define Portfolio Y as a portfolio consisting of two securities
(or tranches). The first security is responsible for all losses on Portfolio X up to 50% of the
principal of portfolio X; the second security is responsible for the remaining losses on Portfolio
X. Portfolio Y is a portfolio that can be costlessly created from Portfolio X. The probability of
loss for the first security of Portfolio Y is the same as the probability of loss for Portfolio X. In
general, the second security in Portfolio Y has a lower probability of loss than the Portfolio X.26
As a result, the necessary condition for no arbitrage is violated. Part of portfolio Y has the same
q-measure as Portfolio X; the rest of the portfolio has a lower q-measure. If probability of loss is
the credit quality measure used for X and Y, then Y will always be more valuable than X to some
investors even though X can be costlessly converted into Y.
Now consider a third Portfolio, Z, which consists of three tranches responsible for losses in the
ranges 0 to 25%, 25% to 50%, and 50% to 100%. Using arguments similar to those used in
comparing Y and X we can show that when probability of loss is used as a criterion Portfolio Z
dominates Portfolio Y even though Portfolio Y can be costlessly converted into Portfolio Z. It is
easy to see how the probability of loss criterion encourages financial institutions to create
multiple tranches from portfolios of loans. As more tranches are created, the violation of the no-
arbitrage condition becomes greater.
It can be shown that the credit quality measure used by Moody’s, percentage expected loss (EL),
always satisfies the no-arbitrage condition. To see this suppose that the EL for portfolio X is 2%,
that is q=2%. One of the properties of expected loss is that the weighted average of the tranche
expected losses must equal the portfolio expected loss. Suppose that the EL for the two tranches
of portfolio Y are 1% and 3%. The EL for the three tranches of portfolio Z might be 0.5%, 1.5%,
and 3%. In each case the weighted average of the tranche expected losses is 2%.27
The frequency
26
This is always true providing there is some chance of losses less than 50% of the principal amount. 27
For portfolio Z the weighted average is 0.25×0.5% + 0.25×1.5% + 0.5×3% = 2%.
20
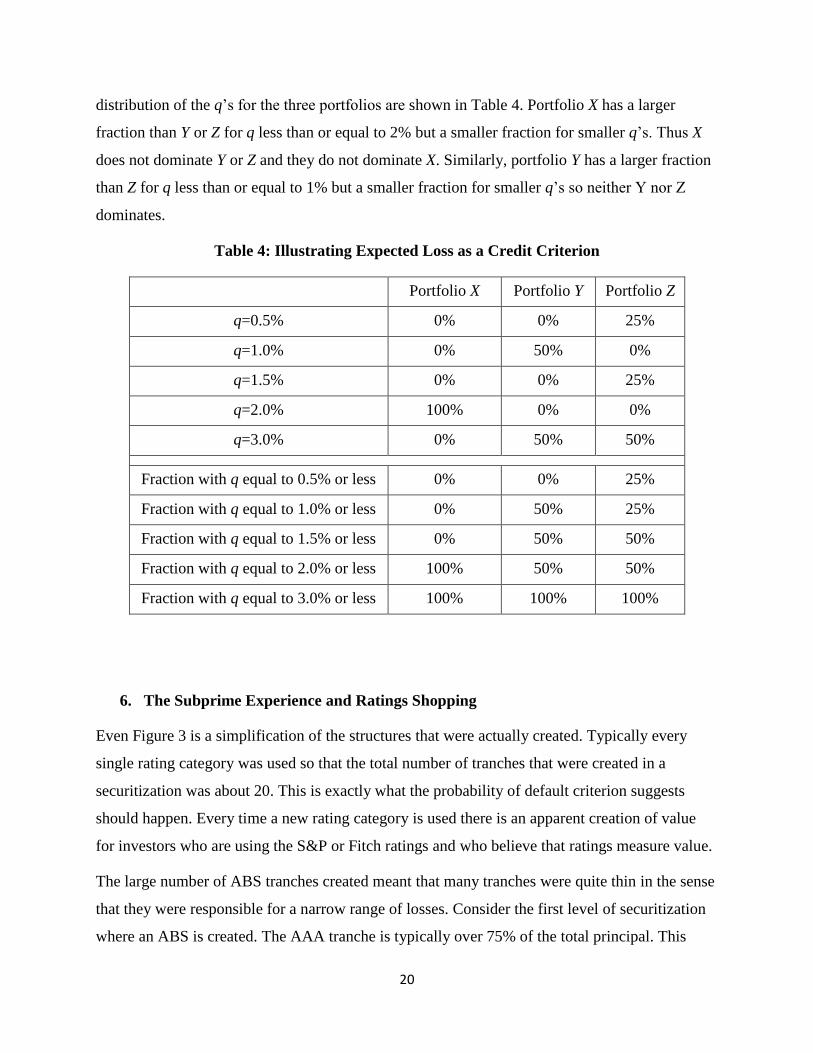
distribution of the q’s for the three portfolios are shown in Table 4. Portfolio X has a larger
fraction than Y or Z for q less than or equal to 2% but a smaller fraction for smaller q’s. Thus X
does not dominate Y or Z and they do not dominate X. Similarly, portfolio Y has a larger fraction
than Z for q less than or equal to 1% but a smaller fraction for smaller q’s so neither Y nor Z
dominates.
Table 4: Illustrating Expected Loss as a Credit Criterion
Portfolio X Portfolio Y Portfolio Z
q=0.5% 0% 0% 25%
q=1.0% 0% 50% 0%
q=1.5% 0% 0% 25%
q=2.0% 100% 0% 0%
q=3.0% 0% 50% 50%
Fraction with q equal to 0.5% or less 0% 0% 25%
Fraction with q equal to 1.0% or less 0% 50% 25%
Fraction with q equal to 1.5% or less 0% 50% 50%
Fraction with q equal to 2.0% or less 100% 50% 50%
Fraction with q equal to 3.0% or less 100% 100% 100%
6. The Subprime Experience and Ratings Shopping
Even Figure 3 is a simplification of the structures that were actually created. Typically every
single rating category was used so that the total number of tranches that were created in a
securitization was about 20. This is exactly what the probability of default criterion suggests
should happen. Every time a new rating category is used there is an apparent creation of value
for investors who are using the S&P or Fitch ratings and who believe that ratings measure value.
The large number of ABS tranches created meant that many tranches were quite thin in the sense
that they were responsible for a narrow range of losses. Consider the first level of securitization
where an ABS is created. The AAA tranche is typically over 75% of the total principal. This
21
means that the other tranches were on average about 1% wide. As a result they tend to have “all-
or nothing” characteristics. They either experience no defaults or are completely wiped out.
For the AAA tranche the expected loss given default is relatively low because, if it does
experience loss, the loss will in most cases be small. By contrast the all-or-nothing properties of
the other tranches mean that the expected loss given default is high. The relation between the
criteria used by rating agencies is
Expected Loss = Probability of Default ×Loss Given Default
If the rating agencies agree on the probability of default, it is likely that Moody’s will produce a
lower rating for non-AAA tranches. This is because these tranches have a much higher loss given
default than corporate bonds. A corporate bond that has the same expected loss as a non-AAA
tranche is likely to have a lower rating than a corporate bond that has the same probability of
default as the tranche.
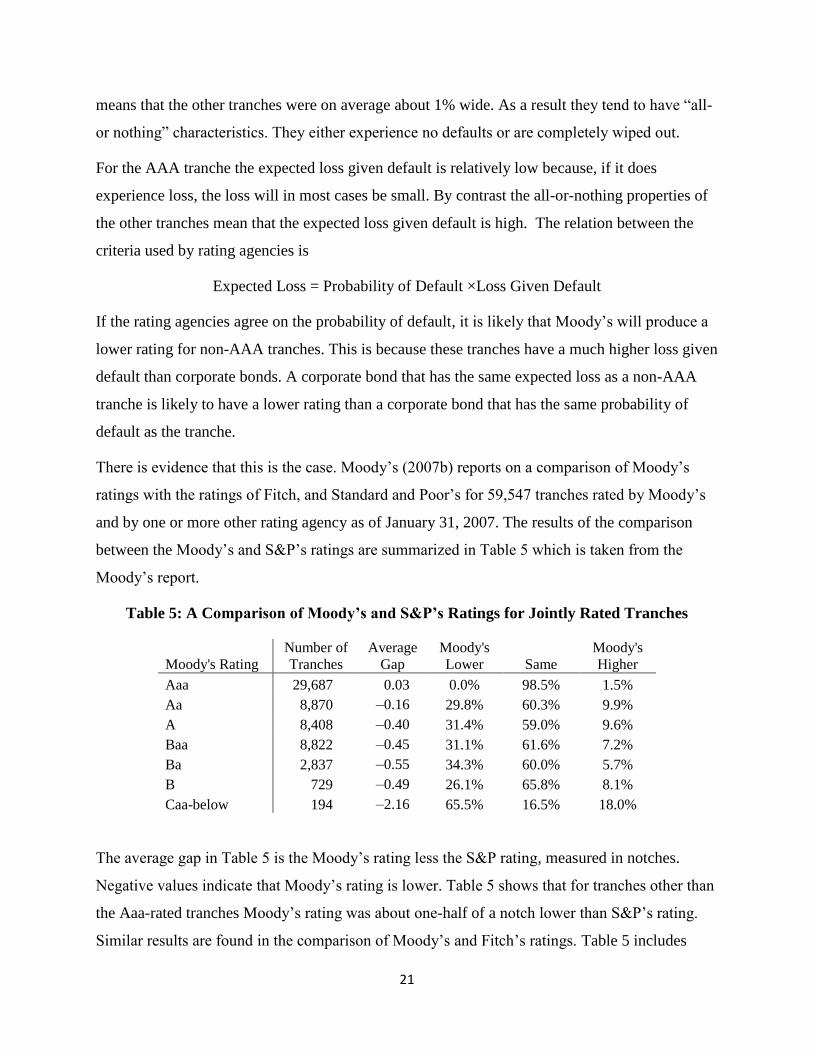
There is evidence that this is the case. Moody’s (2007b) reports on a comparison of Moody’s
ratings with the ratings of Fitch, and Standard and Poor’s for 59,547 tranches rated by Moody’s
and by one or more other rating agency as of January 31, 2007. The results of the comparison
between the Moody’s and S&P’s ratings are summarized in Table 5 which is taken from the
Moody’s report.
Table 5: A Comparison of Moody’s and S&P’s Ratings for Jointly Rated Tranches
Moody's Rating
Number of
Tranches
Average
Gap
Moody's
Lower Same
Moody's
Higher
Aaa 29,687 0.03 0.0% 98.5% 1.5%
Aa 8,870 –0.16 29.8% 60.3% 9.9%
A 8,408 –0.40 31.4% 59.0% 9.6%
Baa 8,822 –0.45 31.1% 61.6% 7.2%
Ba 2,837 –0.55 34.3% 60.0% 5.7%
B 729 –0.49 26.1% 65.8% 8.1%
Caa-below 194 –2.16 65.5% 16.5% 18.0%
The average gap in Table 5 is the Moody’s rating less the S&P rating, measured in notches.
Negative values indicate that Moody’s rating is lower. Table 5 shows that for tranches other than
the Aaa-rated tranches Moody’s rating was about one-half of a notch lower than S&P’s rating.
Similar results are found in the comparison of Moody’s and Fitch’s ratings. Table 5 includes
22
tranches from all types of securitizations (ABS, RMBS, CMBS, etc.) but similar results are
found for each individual type of securitization. This indicates that the difference is a result of
Moody’s methodology rather than the characteristics of a particular market. The positive average
gap for the Aaa-rated tranches is an artefact of the calculation. Since it is the highest rating S&P
could not produce a higher rating which would produce a negative gap. The only possible
differences are cases in which S&P has a lower rating.
The results reported in Table 5 should be interpreted as a conservative estimate of the difference
between Moody’s ratings and the ratings of other agencies because of ratings shopping. While
multiple ratings are attractive to the underwriter, split ratings28
are not. If one rating agency
produced a lower rating for a tranche when a structure was being created it was likely that they
would not be asked to rate that tranche. As a result almost all of the jointly rated tranches
reported in Table 5 had the same rating from both agencies at inception. The rating differences
that subsequently evolved arose because the initial Moody’s rating was closer to a downgrade.
It is likely that structurers recognized this. They could achieve the highest possible rating for
each tranche by having Moody’s rate the Aaa-rated tranches but not lower quality tranches. On
the other hand there may have been pressure from investors to have multiple ratings for tranches.
The evidence is suggestive of these competing forces. Standard and Poor’s (2011) reports that of
all RMBS tranches they rates issued between 1978 and 2010, when equivalent tranches are
considered as a single tranche, about 20% were rated AAA at the time of issue. By comparison,
Moody’s (2007a) reports that in 2006, of all the structured tranches being rated in that year,
about 26% were rated Aaa.29
While it appears that rather more of Moody’s business was in rating
Aaa-rated tranches the difference is not large. At the same time the results in Table 5 suggest that
the non-Aaa-rated tranches were structured in such a way as to just meet the Moody’s criterion
resulting in more subsequent downgrades by Moody’s.
The apparent creation of value happens when any portfolio of debt-like assets is securitized. It is
therefore a potential explanation for popularity of re-securitization and re-re-securitization. There
is an apparent creation of value in Figure 3 when the Mezz ABS CDO is created from BBB-rated
28
A split rating refers to the case in which different rating agencies assign different ratings to the same tranche. 29
These percentages are for the case in which pari passu and other equivalent tranches are considered to be a single
tranche. The results in Table 5 count every tranche separately.
23
tranches, when the High Grade ABS CDO is created from AAA-, AA-, and A-rated tranches,
and when the CDO of CDOs are created.
7. AAA Ratings
The creation of tranches with AAA ratings was the key to the success of the securitization of
subprime mortgages during the 2000 to 2006 period. Indeed, the profitability of a securitization
to the structurer depended critically as the volume of AAA-rated tranches that were created. This
helps to explain the popularity of re-securitizations and re-re-securitizations. In Figure 3, without
the re- and re-re-securitizations, 81% of mortgage portfolios became AAA-rate securities; with
them over 90% did so.
Pension funds, endowments and other large investors often establish rules governing how their
assets can be invested. These rules often specify that the credit rating of instruments must be
above a certain level, and sometimes that the credit rating must be AAA. There is a limited
supply of AAA-rated corporate and sovereign bonds in the world. The artificial creation of
almost unlimited amounts of AAA-rated securities from the securitization of mortgages was
therefore attractive to many fund managers.
Was a AAA-rated tranche equivalent to a AAA-rated bond? The answer is should be clear from
our analysis in this paper. If the rating agencies applied their criteria appropriately, one
dimension of the loss distribution of a AAA-rated tranche was the same as that of a AAA-rated
corporate bond, but other aspects of the loss distribution were liable to be quite different. For
example, if they have the same probability of suffering a loss they are liable to have different
expected losses. Consider a bond and a thin tranche, both rated BBB by S&P or Fitch. They will
have approximately the same probability of default. However, in the case of the bond, the
expected loss in the event of default is about 60% whereas, in the case of the tranche, it is almost
100%.
There are other reasons why investors should have been wary of regarding a AAA bond as
equivalent to a AAA tranche. As pointed out by Coval et al. (2009), AAA-rated tranches have
high systematic or market risk. They tend to lose money when the market as a whole performs
24
very poorly and there are many defaults. AAA-rated bonds do not have as much systematic risk.
The issuing firm may default because the market as a whole performs very poorly or for firm-
specific reasons. Investors require compensation for bearing systematic risk. For this reason,
even if the loss distribution for a AAA-rated bond and a AAA-rated tranche were exactly the
same, the two securities would not be valued in the same way. The AAA-rated tranche would
have a lower price and a higher rate of return.
Another difference concerns the probability of downgrade. As explained earlier, structurers knew
the models used by rating agencies and were able to show proposed structures to rating agencies
before creating them. As a result, it is likely that AAA-rated tranches had just made it to the
AAA category. A structurer would not choose a AAA tranche to be 81% wide, as in Figure 3, if
a tranche that was 82% wide or 83% wide would also be rated AAA. If the tranche has just made
it into the AAA category, then, assuming that the criterion applied by the rating agency does not
change, any worsening of the portfolio underlying the structure leads to the tranche being
downgraded resulting in tranche downgrades rates that are much higher than bond downgrade
rates. Rating agencies may counter this possibility by having more stringent conditions for initial
tranche ratings than they do for ongoing ratings.
8. Conclusions
Rating agencies have come under criticism because of their role in the securitization of
mortgages. We have argued in this paper that the market may have been misled because of an
ambiguity about what ratings were measuring. The probability of loss may be a satisfactory
credit quality measure when used solely to characterize the credit quality of a single bond but it
permits arbitrage when it is used to rate portfolios of bonds or structured products.
The expected loss criterion does satisfy the basic no-arbitrage condition that we have proposed.
However, this does not mean that it is correct to base a valuation solely on expected loss (or base
it solely on a rating that is calculated from expected loss). Rating agencies calculate expected
loss in the real world, not the risk-neutral world. As is well known, the discount rate that is
appropriate for cash flows estimated in the real world is difficult to estimate and may be
counterintuitive. Market participants that rely on the expected loss estimates of rating agencies

25
are liable to be arbitraged by other market participants that employ more complete valuation
methodologies.
The loss distributions for structured products are often quite different from those for bonds or
portfolios of bonds. To provide a complete set of information to the users of ratings it is tempting
to propose a single measure that involves characteristics of the loss distribution other than its
expected value. However, it is difficult to find a measure that does this and does not permit the
basic arbitrage we have considered in this paper. A better approach for rating agencies might be
to provide multiple measures for structured products.

26
References
Altman, Edward and Herbert Rijken, “How Rating Agencies Achieve Stability,” Journal of
Banking and Finance, 28, 12 (2004), 2679-2714
Artzner, Philippe, Freddy Delbaen, Jean-Marc Eber, and David Heath (1999), “Coherent
Measures of Risk,” Mathematical Finance, 9 (1999), 203-228.
Brennan, Michael J., Julia Hein, and Ser-Huang Poon, “Tranching and Rating,” European
Financial Management Journal, 15, 5 (November 2009), 891-922.
Cantor, Richard and Chris Mann, “Are Corporate Bond ratings Pro-Cyclical,” Special Comment,
Moody’s Investors Services, October 2003.
Coval, Joshua D., Jakub W. Jurek and Erik Stafford, “Economic Catastrophe Bonds,” American
Economic Review, 99, 3 (2009), 628-666.
Dodd, Randall and Paul Mills, “Outbreak: U.S. Subprime Contagion,” Finance and
Development, 45, 2, (2008).
Fender, I. and J. Kiff, “CDO Rating Methodology: Some Thoughts on Model Risk and its
Implications,” BIS Working Paper No 163, November 2004.
Gorton, Gary, “The Subprime Panic,” European Financial Management, 15, 1, (2009), 10-46.
ISDA, “Market Review of OTC Derivative Bilateral Collateralization Practices (2.0),” ISDA
Collateral Steering Committee - March 1, 2010.
Hull, John and Alan White, “The Risk of Tranches Created from Mortgages,” Financial Analysts
Journal, 66, 5 (Sept/Oct 2010), 54-67.
Hull, John and Alan White, “Ratings Arbitrage and Structured Products,” Working Paper,
University of Toronto, 2011.
Merton, Robert, “On the Pricing of Corporate Debt: The Risk structure of Interest Rates,”
Journal of Finance, 29 (1974), 449-470.
27
Modigliani, F. and M. Miller, “The Cost of Capital, Corporation Finance and the Theory of
Investment,” American Economic Review, 48, 3, (1958), 261-297.
Moody’s Investor Service, “Default and Loss Rates of Structured Finance Securities: 1993-
2006,” Special Comment, April 2007a.
Moody’s Investor Service, “Comparing Ratings on Jointly-Rated U.S. Structured Finance
Securities: 2007 Update,” Structured Finance Special Report, March 30, 2007b.
Moody’s Investor Service, “Default and Loss Rates of Structured Finance Securities: 1993-
2007,” Special Comment, July 2008.
Moody’s Investor Service, “Corporate Default and Recovery Rates, 1920-2010,” Special
Comment, February 2011.
Poon, Winnie P.H., “Are Unsolicited Credit Ratings Downward biased?” Journal of Banking and
Finance, 27 (2003), 593-614.
Poon, W. P. H. and Firth, M., “Are Unsolicited Credit Ratings Lower? International Evidence
From Bank Ratings,” Journal of Business Finance & Accounting, 32 (2005) 1741–1771.
Standard and Poor’s, “General Criteria: Methodology: Credit Stability Criteria,”
http://www.standardandpoors.com/prot/ratings/articles/en/us/?assetID=1245211381919, May
2010.
Standard and Poor’s, “2010 Annual U.S. Corporate Default Study And Rating Transitions,”
http://www.standardandpoors.com/ratings/articles/en/us/?articleType=HTML&assetID=1245302
234800#ID19071, March 2011a.
Standard and Poor’s, “Default Study: Global Structured Finance Default Study–1978-2010:
Credit Trends Started to Improve in 2010, But U.S. RMBS Faces Challenges,”
http://www.standardandpoors.com/prot/ratings/articles/en/us/?assetID=1245301718990#ID3531
4, March 2011b.