Embed Size (px)
Citation preview

Rush County
RUSH COUNTY, INDIANA AND INCORPORATED AREAS
COMMUNITY COMMUNITY NAME NUMBER CARTHAGE, TOWN OF 180222 *GLENWOOD, TOWN OF 180454 RUSH COUNTY (Unincorporated Areas) 180421 RUSHVILLE, CITY OF 180223 *No Special Flood Hazard Area
Preliminary:
Federal Emergency Management Agency
FLOOD INSURANCE STUDY NUMBER
18139CV000A

i
TABLE OF CONTENTS
Page
1.0 INTRODUCTION 1
1.1 Purpose of Study 1
1.2 Authority and Acknowledgments 2
1.3 Coordination 3
2.0 AREA STUDIED 4
2.1 Scope of Study 4
2.2 Community Description 5
2.3 Principal Flood Problems 6
2.4 Flood Protection Measures 7
3.0 ENGINEERING METHODS 7
3.1 Hydrologic Analyses 8
3.2 Hydraulic Analyses 10
3.3 Vertical Datum 11
4.0 FLOODPLAIN MANAGEMENT APPLICATIONS 12
4.1 Floodplain Boundaries 12
4.2 Floodways 13
5.0 INSURANCE APPLICATION 21
6.0 FLOOD INSURANCE RATE MAP 22
7.0 OTHER STUDIES 24
8.0 LOCATION OF DATA 24
9.0 BIBLIOGRAPHY AND REFERENCES 24
FIGURES
Figure 1 - Floodway Schematic 14

ii
TABLES
Table 1 - CCO Meeting Dates 3
Table 2 – Incorporated Letters of Map Change 4
Table 3 – Streams Studied By Detailed Methods 4
Table 4 – Streams Studied By Approximate Methods 4
Table 5 – Scope of Study 5
Table 6 – Population of Incorporated Cities and Towns in Rush County 6
Table 7 – Flood Crest Elevations (Big Blue River at Carthage) 6
Table 8 – Flood Crest Elevations (Flatrock River at Milroy) 7
Table 9 – Summary of Discharges 8
Table 10 – Channel and Overbank Roughness Factors 11
Table 11 – Floodway Data Table 15
Table 12 – Community Map History 23
EXHIBITS
Exhibit 1 - Flood Profiles Panel #s
Big Blue River 01P-09P
Charlottes Brook 10P-11P
Flatrock River 12P-16P
Goose Creek 17P-19P
Hodges Branch 20P-21P
Six Mile Creek 22P-28P
Three Mile Creek 29P-33P
Exhibit 2 - Flood Insurance Rate Map Index
Flood Insurance Rate Map

1
FLOOD INSURANCE STUDY
RUSH COUNTY, INDIANA AND INCORPORATED AREAS
1.0 INTRODUCTION
1.1 Purpose of Study
This Flood Insurance Study (FIS) revises and supersedes the FIS reports and Flood
Insurance Rate Maps (FIRMs) in the geographic area of Rush County, Indiana,
including the City of Rushville, the Towns of Carthage and Glenwood, and the
unincorporated areas of Rush County (hereinafter referred to collectively as Rush
County), and aids in the administration of the National Flood Insurance Act of 1968
and the Flood Disaster Protection Act of 1973. This study has developed flood risk
data for various areas of the community that will be used to establish actuarial flood
insurance rates and to assist the community in its efforts to promote sound floodplain
management. This information will also be used by Rush County to update existing
floodplain regulations as part of the Regular Phase of the National Flood Insurance
Program (NFIP), and by local and regional planners to further promote sound land
use and floodplain development. Minimum floodplain management requirements for
participation in the National Flood Insurance Program (NFIP) are set forth in the
Code of Federal Regulations at 44 CFR, 60.3.
In some states or communities, floodplain management criteria or regulations may
exist that are more restrictive or comprehensive than the minimum Federal
requirements. In such cases, the more restrictive criteria take precedence and the
State (or other jurisdictional agency) will be able to explain them.
Furthermore, the Town of Glenwood does not have special flood hazard areas within
its incorporated limits. However, for the purpose of complete countywide mapping of
Rush County, this town is still included in this FIS and FIRMs.
The Digital Flood Insurance Rate Map (DFIRM) and FIS report for this countywide
study have been produced in digital format. Flood hazard information was converted
to meet the Federal Emergency Management Agency (FEMA) DFIRM database
specifications and Geographic Information System (GIS) format requirements. The
flood hazard information was created and is provided in a digital format so that it can
be incorporated into local GIS and be accessed more easily by the community.

2
1.2 Authority and Acknowledgments
The sources of authority for this Flood Insurance Study are the National Flood
Insurance Act of 1968 and the Flood Disaster Protection Act of 1973.
Information of the authority and acknowledgements for each of the new studies and
previously printed FIS reports and Flood Insurance Rate Maps (FIRMs) for
communities within Rush County was compiled and is shown below:
Rush County
(Unincorporated Areas) The hydrologic and hydraulic analyses for this study
were prepared by Snell Environmental Group, Inc. for
the Federal Emergency Management Agency (FEMA),
under Contract No. H-4777. This study, which was
completed in December 1980, covered all significant
flooding sources affecting the unincorporated areas of
Rush County.
Rushville, City of: The hydrologic and hydraulic analyses for this study
were prepared by Snell Environmental Group, Inc. for
the Federal Emergency Management Agency (FEMA),
under Contract No. H-4777. This study, which was
completed in Febuary 1981, covered all significant
flooding sources affecting the City of Rushville.
Carthage, Town of: The hydrologic and hydraulic analyses for this study
were taken from the Unincorporated Areas of the
County of Rush, Indiana Flood Insurance Study.
Glenwood, Town of: No previous FIS.
New Studies: The hydrologic and hydraulic analyses for approximate
stream reaches of Rush County were performed by
AMEC Earth and Environmental, Inc., on behalf of the
Indiana Department of Natural Resources, under
Indiana Public Works Project Number E060019. The
Indiana Department of Natural Resources managed the
production of this study as part of their Cooperating
Technical Partner agreement with the Federal
Emergency Management Agency dated April 29, 2004,
which was defined by the Indiana DNR Mapping
Activity Statement 08-01 dated July 7, 2008 and funded
under agreement number EMC-2007-CA-7027.

3
Redelineation of the previously effective flood hazard information for this FIS report,
correction to the North American Vertical Datum of 1988, and conversion of the
unincorporated and incorporated areas of Rush County into the Countywide format
was performed by AMEC Earth and Environmental, Inc., on behalf of the Indiana
Department of Natural Resources, under Indiana Public Works Project Number
E060019. The Indiana Department of Natural Resources managed the production of
this study as part of their Cooperating Technical Partner agreement with the Federal
Emergency Management Agency dated April 29, 2004, which was defined by the
Indiana DNR Mapping Activity Statement 08-01 dated July 7, 2008 and funded under
agreement number EMC-2007-CA-7027.
1.3 Coordination
The purpose of an initial Consultation Coordinated Officer’s (CCOs) meeting is to
discuss the scope of the FIS. A final CCO meeting is held to review the results of the
study. The dates of the initial and final CCO meetings held for the previously
effective FIS reports covering the geographic area of Rush County, Indiana are shown
in Table 1. The initial and final CCO meetings were attended by the study contractor,
FEMA (or the Federal Insurance Administration), the Indiana Department of Natural
Resources (IDNR), and the affected communities.
Table 1: CCO Meeting Dates for Pre-Countywide FIS
Community Name Initial CCO Date Final CCO Date
Rush County * December 8, 1981
(Unincorporated Areas)
Rushville, City of (original) * December 8, 1981
Carthage, Town of * December 2, 1982
*Data Not Available
For this countywide FIS, an initial CCO meeting was held on August 29, 2007, and
was attended by IDNR, the Rush County Commission, the Rush County Area Plan
Commission, the Rush County Auditor, the Rush County GIS Specialist, the Rush
County Board of Supervisors, the Rush County Surveyor, the Glenwood Council, and
the City of Rushville.
The results of the countywide study were reviewed at the final CCO meeting held on
--, and attended by representatives of FEMA, IDNR and________. All problems
raised at that meeting have been addressed.

4
2.0 AREA STUDIED
2.1 Scope of Study
This FIS covers the geographic area of Rush County, Indiana, including the
incorporated communities listed in Section 1.1.
All FIRM panels for Rush County have been revised, updated, and republished in
countywide format as a part of this FIS. The FIRM panel index, provided as Exhibit
2, illustrates the revised FIRM panel layout.
Approximate methods of analysis were used to study those areas having a low
development potential or minimal flood hazards as identified during the initial CCO
meeting. For this study, seven new stream reaches were studied using approximate
methods. The scope and methods of new approximate studies were proposed and
agreed upon by FEMA, the IDNR, and Rush County.
This FIS update also incorporates the determination of letters issued by FEMA
resulting in map changes (Letters of Map Change, or LOMC’s). All Letters of Map
Revision (LOMR’s) are summarized in Table 2. Letters of Map Amendment
(LOMA’s) incorporated for this study are summarized in the Summary of Map
Actions (SOMA) included in the Technical Support Data Notebook (TSDN)
associated with this FIS update. Copies of the TSDN may be obtained from the
Community Map Repository.
Table 2: Incorporated Letters of Map Change
LOMC Case Number Date Issued Project Identifier
LOMR 01-05-372P 7/20/2001 Rushville Levee and Floodwall
Table 3: Streams Previously Studied by Detailed Methods
Big Blue River Hodges Branch
Charlottes Brook Six Mile Creek
Flatrock River Three Mile Creek
Goose Creek
Table 4: Streams Previously Studied by Approximate Methods
Ben Davis Creek Miles Creek
Bob Creek Mud River
Buck Creek North Branch Clifty Creek
Conns Creek Shankatank Creek
Flatrock River Shawnee Creek

5
Table 4: Streams Previously Studied by Approximate Methods (cont’d)
Hurricane Creek Tributary to Bob Creek
Lick Creek Turkey Creek
Little Blue River Wikoff Ditch
Little Flatrock River
Table 5: Scope of Study
Stream Limits of Approximate Study
Flatrock River Decatur Co Line to County Road 350S
Flatrock River County Road 300N to Henry Co Line
Lick Creek Mouth to County Road 160E
Little Blue River Shelby County Line to Newhouse Ditch
Little Flatrock River Decatur Co Line to County Road 300S
Mud Creek Mouth to Base Line Road
North Branch Clifty Creek Mouth to County Road 450E
Stream Limits of Redelineation Study
Big Blue River Shelby Co Line to Henry Co Line
Flatrock River County Road 350S to County Road 300N
Hodges Branch 9th
St to State Road 3
2.2 Community Description
Rush County is located in east-central Indiana and is bordered by Henry County to
the north, Fayette and Franklin Counties to the east, Decatur County to the south,
Shelby County to the west and Hancock County to the northwest. The total land area
within the county is approximately 408.3 square miles. The largest city and the
county seat is Rushville which is located approximately 40 miles southeast of
Indianapolis. Rush County is served by US Highway 52, and State Routes 3, 44, and
244.
The climate in Rush County ranges from hot and humid in the summertime to cold
during the winter season. Average daytime temperatures during the summer fall
around 71.9ºF, while winter temperatures average at approximately 32.9ºF.
Precipitation for Rush County totals an annual amount of 42.36 inches.
According to U.S. Census Data from the year 2000, the population of Rush County
was reported to be 18,261. Table 6 lists the population of the incorporated areas in
Rush County.

6
Table 6: Population of incorporated cities and towns in Rush County 2000 Census
Community Population
Carthage, Town of 928
Glenwood, Town of 318
Rushville, City of 5,995
2.3 Principal Flood Problems
Major flooding in Rush County primarily occurs along the Big Blue River and the
Flatrock River. Floods principally occur during the winter and spring months, but can
occur during any season. Generally, two types of storm events cause flooding.
During the winter and spring, storms of moderate intensity and long duration, coupled
with frozen ground, cause flooding to occur. During the summer, thunderstorms
which have high intensities and relatively short durations can cause floods. Localized
flood problems in the incorporated areas are summarized below:
Carthage, Town of: Subject to flooding from the Big Blue River. The
largest recorded flood on record at Carthage was in
March of 1963. The discharges and frequencies of
these floods are as follows:
Table 7: Flood Crest Elevations
USGS gage for the Big Blue River in Carthage
Discharge Elevation
Date Cubic Feet Per Second (CFS) (feet, gage datum)
March 4, 1963 12,900 14.62
November 14, 1993 8,410 12.91
January 21, 1959 8,340 13.28
December 30, 1990 7,510 12.31
June 14, 1958 7,020 12.42
February 21, 1958 6,650 11.20
Rushville, City of: Major floods along the Flatrock River occurred in 1949
with 18,500 cubic feet per second (CFS), 1963 with
17,111 (CFS) and 1968 with 17, 600 (CFS) per the St.
Paul gaging station. The discharges and frequencies of
floods along the Flatrock River at the gaging station in
Milroy are as follows:

7
Table 8: Flood Crest Elevations
USGS gage for the Flatrock River at Milroy
Discharge Elevation
Date Cubic Feet Per Second (CFS) (feet, gage datum)
April 30, 1983 5,320 15.22
May 26, 1989 5,060 15.04
April 23, 1981 2,260 13.81
March 14, 1978 1,600 11.97
February 23, 1985 1,470 11.58
June 6, 1986 1,200 11.12
2.4 Flood Protection Measures
At the time the 1982 FIS for Rush County was published, a project called the “Upper
Big Blue River Flood Control Project” was underway. Several structures were built in
Rush County as well as other counties. This project was sponsored by the U.S.
Department of Agriculture, Soil Conservation Service (SCS).
In 2001, the City of Rushville implemented a levee maintenance program for a levee
system located between 0.6 miles downstream of U.S. Route 52 and 0.7 miles
upstream of the Chessie System along the Flatrock River. Please refer to the
corresponding Flood Insurance Rate Map panels for the protection status of this levee
system. No other flood control measures exist within the City of Rushville, the Towns
of Carthage and Glenwood, and the unincorporated areas of Rush County
3.0 ENGINEERING METHODS
For the flooding sources studied by detailed methods in Rush County, standard hydrologic
and hydraulic study methods were used to determine the flood hazard data required for this
study. Flood events of a magnitude that are expected to be equaled or exceeded once on the
average during any 10-, 50-, 100-, or 500-year period (recurrence interval) have been
selected as having special significance for floodplain management and for flood insurance
rates. These events, commonly termed the 10-, 50-, 100-, and 500-year floods, have a 10-, 2-
, 1-, and 0.2-percent chance, respectively, of being equaled or exceeded during any year.
Although the recurrence interval represents the long-term, average period between floods of
a specific magnitude, rare floods could occur at short intervals or even within the same year.
The risk of experiencing a rare flood increases when periods greater than 1 year are
considered. For example, the risk of having a flood that equals or exceeds the 1-percent-
annual-chance flood in any 50-year period is approximately 40 percent (4 in 10); for any 90-
year period, the risk increases to approximately 60 percent (6 in 10). The analyses reported
herein reflect flooding potentials based on conditions existing in the community at the time
of completion of this study. Maps and flood elevations will be amended periodically to
reflect future changes.

8
3.1 Hydrologic Analyses
Hydrologic analyses were carried out to establish peak discharge-frequency
relationships for each flooding source studied by detailed methods affecting Rush
County. Table 9 contains a summary of peak discharges for the 10-, 2-, 1-, and 0.2-
percent annual chance floods, where applicable, for each flooding source studied in
detail in Rush County. Peak discharges in the table were compiled from previously
effective FIS reports for Rush County and incorporated areas.
Table 9. Summary of Discharges
Peak Discharge (CFS)
10% 2% 1% 0.2%
Flooding Source Drainage Area Annual Annual Annual Annual
And Location (Square Miles) Chance Chance Chance Chance
BIG BLUE RIVER
Upstream of Six Mile Creek 196 8,400 11,800 13,300 15,400
County Road 800 North 188 8,000 11,600 13,100 15,000
Upstream of Three Mile
Creek 161 6,900 9,600 11,000 12,500
Upstream of Montgomery
Creek 134 5,600 7,700 8,800 10,000
CHARLOTTES BROOK
Mouth 3.7 1,170 1,630 1,840 2,320
About 0.8 Miles
Upstream of Mouth 2.6 960 1,380 1,550 1,920
FLATROCK RIVER
County Road 350 South 180 10,750 15,750 17,800 23,000
At Conrail 168 10,200 15,000 17,100 22,000
Upstream of Ben Davis
Creek 140 9,100 13,400 15,250 19,500
0.2 Miles Downstream of
County Road 300 North 135 8,900 13,000 14,950 19,000
GOOSE CREEK
Mouth 7.2 855 1,230 1,445 1,900
About 1.2 Miles Upstream
Of Mouth 5.9 130 320 460 860
Upstream of Big Blue Dam
Number 2 5.0 1,350 1,900 2,150 2,700
About 0.7 Miles Upstream
Of Big Blue Dam No. 2 4.0 1,200 1,700 1,910 2,400

9
Table 9. Summary of Discharges (Cont’d)
Peak Discharge (CFS)
10% 2% 1% 0.2%
Flooding Source Drainage Area Annual Annual Annual Annual
And Location (Square Miles) Chance Chance Chance Chance
HODGES BRANCH
At End of Culvert Upstream
Of 9th
Street 1.7 510 1,000 1,220 1,830
About 325 Feet Downstream
Of Main Street 1.2 370 720 900 1,350
SIX MILE CREEK
Mouth 45.6 4,200 5,900 6,600 8,600
County Road 800 North 44.0 4,100 5,800 6,500 8,400
0.3 Miles Downstream of
County Road 900 North 41.1 3,950 5,550 6,250 8,100
Upstream of Dilly Brook 32.8 3,500 5,000 5,600 7,200
Upstream of Miles Creek 30.0 3,380 4,750 5,370 6,900
Upstream of Unnamed
Tributary North of
County Road 1000 North 28.6 3,300 4,600 5,200 6,700
Upstream of Charlottes
Brook 24.7 3,050 4,300 4,750 6,200
THREE MILE CREEK
Mouth 13.0 235 250 257 264
Upstream of Big Blue
Dam No. 3 11.4 2,050 2,900 3,250 4,200
About 1,800 Feet Downstream
Of Campground Dam 10.0 1,920 2,700 3,050 3,900
About 2,000 Feet Downstream
Of County Road 310 West 9.0 1,800 2,560 2,900 3,700
County Road 450 West 8.0 1,700 2,400 2,700 3,500
County Road 250 West 6.6 1,550 2,200 2,480 3,180
Standard and accepted hydrologic methods were used to develop discharge data on
the study streams in Rush County. These data were coordinated with the Indiana
Department of Natural Resources, the Natural Resources Conservation Service
(formally the Soil Conservation Service), the U. S. Geological Survey and the
Louisville District of the U. S. Army Corps of Engineers, through a Memorandum Of
Understanding dated May 6, 1976. Discharge curves for the 10%, 2%, 1%, and 0.2%
annual chance floods were developed for each study stream using several different
procedures and compared for consistency.

10
3.2 Hydraulic Analyses
Analyses of the hydraulic characteristics of flooding from the sources studied were
carried out to provide estimates of the elevations of floods of the selected recurrence
intervals. Users should be aware that flood elevations shown on the Flood Insurance
Rate Map (FIRM) represent rounded whole-foot elevations and may not exactly
reflect the elevations shown on the Flood Profiles or in the Floodway Data table in
the FIS report. Flood elevations shown on the FIRM are primarily intended for flood
insurance rating purposes. For construction and/or floodplain management purposes,
users are cautioned to use the flood elevation data presented in this FIS report in
conjunction with the data shown on the FIRM.
Cross sections for the backwater analyses were obtained from a variety of sources
including: physical survey data, IDNR contour mapping, USGS topographic mapping
and local contour mapping.
Water-surface elevations for floods of the selected recurrence intervals were
computed through use of the USACE HEC-2 step-backwater computer program. For
the new approximate study reaches, the USACE HEC-RAS program was used. HEC-
RAS is an updated version of the HEC-2 program used to perform step-backwater
analyses.
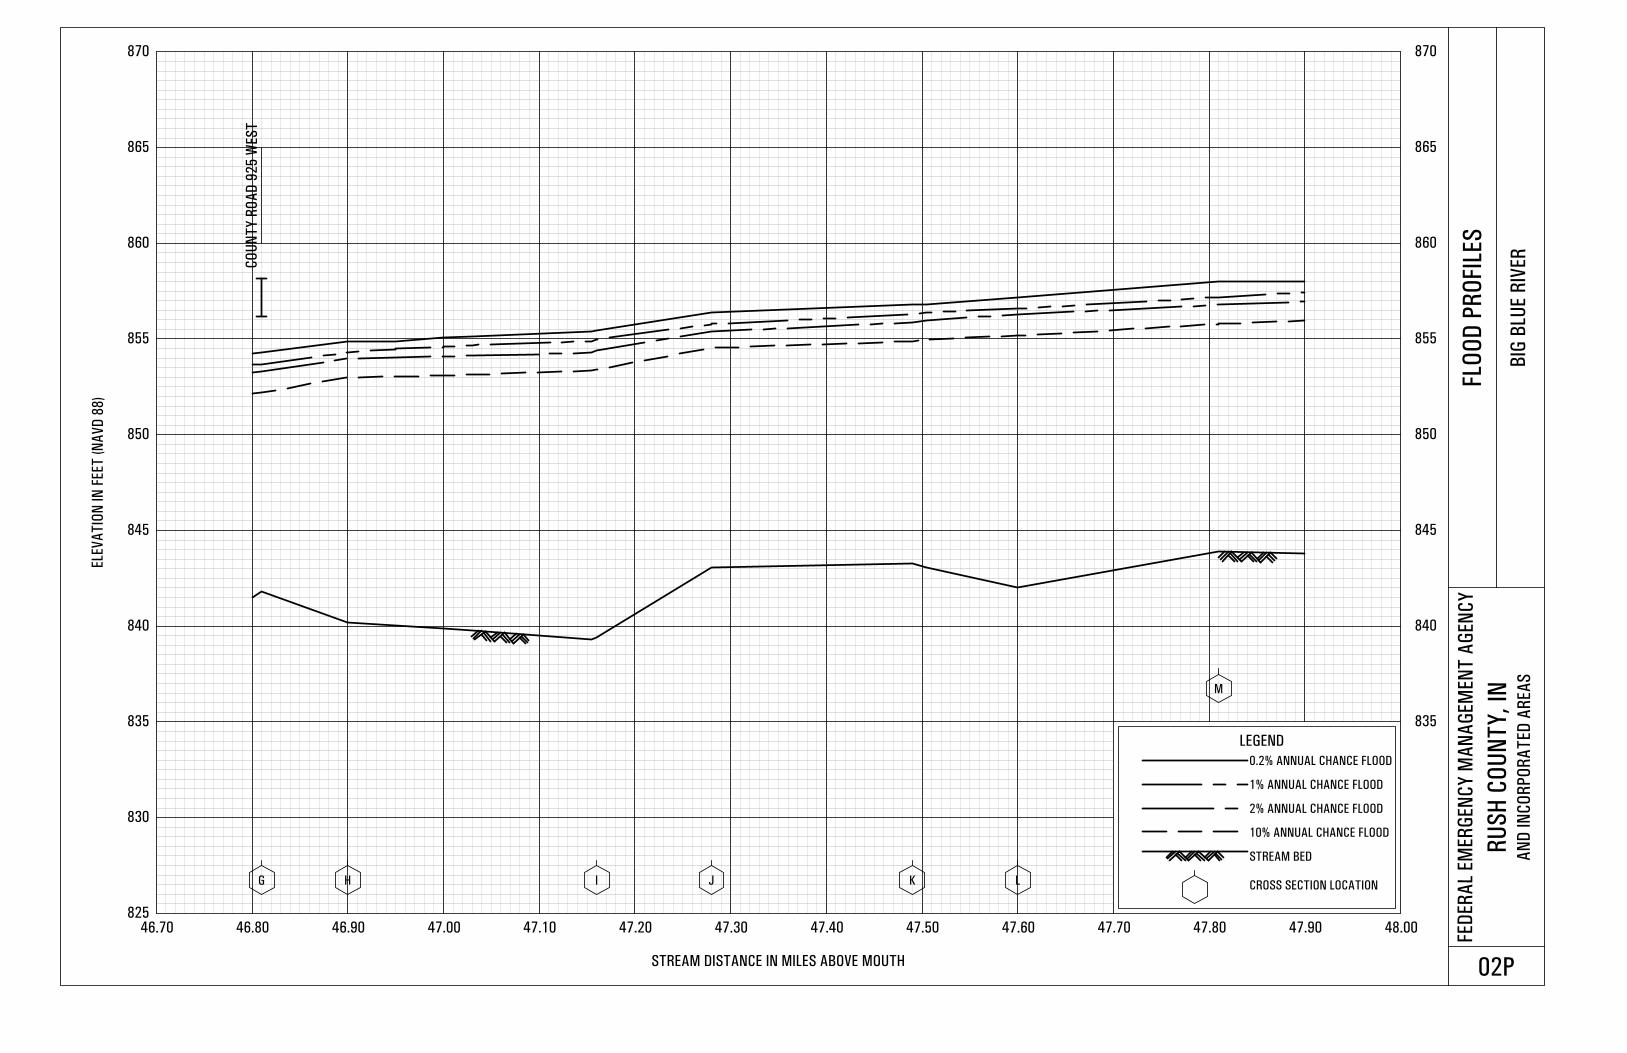
Flood profiles were prepared for all streams studied by detailed methods and show
computed water-surface elevations to an accuracy of 0.5 feet for floods of the selected
recurrence intervals. For this countywide FIS, flood profiles and approved LOMRs
have been consolidated into continuous stream reaches and adjusted to reflect the
current vertical datum as described in Section 3.3.
The starting water-surface elevations for Big Blue River and Six Mile Creek were
obtained from the concurrent downstream study for Hancock County. The Flatrock
River, Goose Creek, Hodges Branch, and Three Mile Creek starting water-surface
elevations were derived using the slope-area method. Starting elevations for
Charlottes Brook were taken from Six Mile Creek assuming coincident flood peaks.
High water marks of historic floods were used where available to calibrate the
hydraulic computer models. Elevations of the 1959 flood on the Flatrock River,
approximately a 10% Annual Chance event, and the 1963 flood on the Big Blue
River, approximately a 1% Annual Chance event, were used for calibration. No high
water records were available for other watercourses studied in detail in this report.
Channel and overbank roughness factors (Manning’s “n” values) used in the
hydraulic computations were chosen by engineering judgment and were based on
field observations of the stream and floodplain areas. Factors were estimated by field
inspection with the aid of “n” value tables and equations. Channel and overbank
roughness factors used in the detailed studies are summarized by stream in Table 10

11
Table 10. Channel and Overbank Roughness Factors
Roughness Coefficients
Stream Main Channel Left Overbank Right Overbank
Big Blue River 0.040-0.060 0.040-0.120 0.040-0.120
Charlottes Brook 0.035-0.070 0.040-0.095 0.040-0.095
Flatrock River (Rush Co.) 0.035-0.060 0.025-0.095 0.025-0.095
Flatrock River (Rushville) 0.023-0.060 0.025-0.095 0.025-0.095
Goose Creek 0.035-0.070 0.040-0.095 0.040-0.095
Hodges Branch 0.03 0.03-0.055 0.03-0.055
Six Mile Creek 0.035-0.070 0.040-0.095 0.040-0.095
Three Mile Creek 0.035-0.070 0.040-0.095 0.040-0.095
For new approximate study areas, analyses were based on field inspection and
modeling of the stream reaches using simplified HEC-RAS models. Structural
measurements or field surveying was not performed. Cross section geometry was
derived from topographic mapping from the 2005 statewide orthophotography
project. Starting elevations were assumed to be normal depth.
The hydraulic analyses for this study were based on unobstructed flow. The flood
elevations shown on the Flood Profiles (Exhibit 1) are thus considered valid only if
hydraulic structures remain unobstructed, operate properly, and do not fail.
3.3 Vertical Datum
All FIS reports and FIRMs are referenced to a specific vertical datum. The vertical
datum provides a starting point against which flood, ground, and structure elevations
can be referenced and compared. Until recently, the standard vertical datum in use
for newly created or revised FIS reports and FIRMs was the National Geodetic
Vertical Datum of 1929 (NGVD29). With the finalization of the North American
Vertical Datum of 1988 (NAVD88), many FIS reports and FIRMs are being prepared
using NAVD88 as the referenced vertical datum.
All flood elevations shown in this FIS report and on the FIRM are referenced to
NAVD88. Structure and ground elevations in the community must, therefore, be
referenced to NAVD88. It is important to note that adjacent communities may be
referenced to NGVD29. This may result in differences in Base Flood Elevations
(BFEs) across the corporate limits between the communities.
In this revision, a vertical datum conversion of -0.41 feet was calculated at the
centroid of the county and used to convert all elevations in Rush County from
NGVD29 to NAVD88 using the National Geologic Survey’s VERTCON online
utility (VERTCON, 2005).
(NGVD29 – 0.41 = NAVD88)

12
For more information on NAVD88, see the FEMA publication entitled Converting
the National Flood Insurance Program to the North American Vertical Datum of 1988
(FEMA, June 1992), or contact the Vertical Network Branch, National Geodetic
Survey, Coast and Geodetic Survey, National Oceanic and Atmospheric
Administration, Rockville, Maryland 20910 (Internet address
http://www.ngs.noaa.gov).
The coordinate system used for the production of the digital FIRMs is the Transverse
Mercator projection, Indiana State Plane coordinate system, East Zone, referenced to
the North American Datum of 1983 and the GRS 1980 spheroid.
Temporary vertical monuments are often established during the preparation of a flood
hazard analysis for the purpose of establishing local vertical control. Although these
monuments are not shown on the FIRM, they may be found in the Technical Support
Data Notebook associated with the FIS report and FIRM for this community.
Interested individuals may contact FEMA to access these data.
4.0 FLOODPLAIN MANAGEMENT APPLICATIONS
The NFIP encourages State and local governments to adopt sound floodplain
management programs. Therefore, each FIS provides 1-percent-annual-chance flood
elevations and delineations of the 1- and 0.2-percent-annual-chance floodplain
boundaries and 1-percent-annual-chance floodway to assist communities in
developing floodplain management measures. This information is presented on the
FIRM and in many components of the FIS report, including Flood Profiles, and the
Floodway Data table. Users should reference the data presented in the FIS report as
well as additional information that may be available at the local map repository
before making flood elevation and/or floodplain boundary determinations.
4.1 Floodplain Boundaries
To provide a national standard without regional discrimination, the 1-percent-annual-
chance flood has been adopted by FEMA as the base flood for floodplain
management purposes. The 0.2-percent-annual-chance flood is employed to indicate
additional areas of flood risk in the community. For each stream studied by detailed
methods, the 1- and 0.2-percent-annual-chance floodplain boundaries have been
delineated using the flood elevations determined at each cross section. Between cross
sections, the boundaries were interpolated using topographic mapping from the 2005
statewide orthophotography flight.
The 1- and 0.2-percent-annual-chance floodplain boundaries are shown on the FIRM
(Exhibit 2). On this map, the 1-percent-annual-chance floodplain boundary
corresponds to the boundary of the areas of special flood hazards (Zones A, AE, V,
and VE); and the 0.2-percent-annual-chance floodplain boundary corresponds to the
boundary of areas of moderate flood hazards. In cases where the 1- and 0.2-percent-

13
annual-chance floodplain boundaries are close together, only the 1-percent-annual-
chance floodplain boundary has been shown. Small areas within the floodplain
boundaries may lie above the flood elevations but cannot be shown due to limitations
of the map scale and/or lack of detailed topographic data.
For the streams studied by approximate methods, only the 1-percent-annual chance
floodplain boundary is shown on the FIRM (Exhibit 2).
4.2 Floodways
Encroachment on floodplains, such as structures and fill, reduces flood-carrying
capacity, increases flood heights and velocities, and increases flood hazards in areas
beyond the encroachment itself. One aspect of floodplain management involves
balancing the economic gain from floodplain development against the resulting
increase in flood hazard. For purposes of the NFIP, a floodway is used as a tool to
assist local communities in this aspect of floodplain management. Under this
concept, the area of the 1-percent-annual-chance floodplain is divided into a floodway
and a floodway fringe. The floodway is the channel of a stream, plus any adjacent
floodplain areas, that must be kept free of encroachment so that the 1-percent-annual-
chance flood can be carried without substantial increases in flood heights. Minimum
Federal standards limit such increases to 1.0 foot, provided that hazardous velocities
are not produced. The floodways in this study are presented to local agencies as
minimum standards that can be adopted directly or that can be used as a basis for
additional floodway studies.
The State of Indiana, however, per Indiana Code IC 14-28-1 and Indiana
Administrative Code 312 IAC 10, has designated that encroachment in the floodplain
is limited to that which will cause no significant increase in flood height. As a result,
floodways for this study are delineated based on a flood surcharge of less than 0.15
feet. The floodways in this study were approved by the IDNR, and are presented to
local agencies as minimum standards that can be adopted directly or that can be used
as a basis for additional floodway studies.
The floodway presented in this FIS report and on the FIRM was computed for certain
stream segments on the basis of equal conveyance reduction from each side of the
floodplain. Floodway widths were computed at cross sections. Between cross
sections, the floodway boundaries were interpolated. The results of the floodway
computations have been tabulated for selected cross sections (Table 11). In cases
where the floodway and 1-percent-annual-chance floodplain boundaries are either
close together or collinear, only the floodway boundary has been shown.
The area between the floodway and 1-percent-annual-chance floodplain boundaries is
termed the floodway fringe. The floodway fringe encompasses the portion of the
floodplain that could be completely obstructed without increasing the water-surface
elevation of the 1-percent-annual-chance flood more than 0.14 foot at any point.

14
Typical relationships between the floodway and the floodway fringe and their
significance to floodplain development are shown in Figure 1.
Figure 1: Floodway Schematic

WIDTH3
SECTION
AREA
MEAN
VELOCITY REGULATORY
WITHOUT
FLOODWAY
WITH
FLOODWAY INCREASE
(FEET) (SQ. FEET) (FT/SEC) (FEET, NAVD) (FEET, NAVD) (FEET, NAVD) (FEET)
BIG BLUE RIVER
A 45.70 1,030 2,154 6.2 850.7 850.7 850.7 0.0
B 45.84 1,138 7,009 1.9 852.0 852.0 852.0 0.0
C 46.00 1,246 9,895 1.3 852.2 852.2 852.2 0.0
D 46.15 1,283 7,580 1.8 852.4 852.4 852.4 0.0
E 46.30 1,460 7,356 1.8 852.7 852.7 852.7 0.0
F 46.57 1,476 7,003 1.9 853.1 853.1 853.1 0.0
G 46.81 1,220 4,456 3.0 853.7 853.7 853.7 0.0
H 46.90 1,432 6,841 1.9 854.3 854.3 854.3 0.0
I 47.16 1,190 5,004 2.7 854.8 854.8 854.8 0.0
J 47.28 1,427 7,249 1.8 855.7 855.7 855.7 0.0
K 47.49 1,649 10,928 1.2 856.2 856.2 856.2 0.0
L 47.60 1,770 8,370 1.6 856.6 856.6 856.6 0.0
M 47.81 1,369 11,100 1.2 857.2 857.2 857.2 0.0
N 47.92 1,665 5,684 2.0 857.5 857.5 857.5 0.0
O 48.20 1,279 7,072 1.9 859.5 859.5 859.5 0.0
P 48.40 1,084 5,592 2.4 860.1 860.1 860.1 0.0
Q 48.57 1,261 6,178 2.2 860.8 860.8 860.8 0.0
R 48.66 1,150 5,867 2.3 861.1 861.1 861.1 0.0
S 49.04 1,154 4,815 2.8 862.0 862.0 862.0 0.0
T 49.13 1,213 5,118 2.6 862.8 862.8 862.8 0.0
U 49.37 1,490 5,337 2.5 863.6 863.6 863.6 0.0
V 49.39 1,121 5,197 2.5 863.8 863.8 863.8 0.0
W 49.45 1,200 4,596 2.9 864.2 864.2 864.2 0.0
X 49.64 1,175/9002 2,065 6.3 866.4 866.4 866.4 0.0
Y 49.75 1,145/9002 2,422 5.4 869.1 869.1 869.1 0.0
Z 49.90 1,190 3,065 4.3 870.4 870.4 870.4 0.0
1 Miles Above Mouth
3 Floodway Width May Differ From DFIRM. See DFIRM For Regulatory Width
2 Total Width/Width Within Unincorporated Area
WATER SURFACE ELEVATION
TA
BL
E 1
1
FLOODWAY DATAFEDERAL EMERGENCY MANAGEMENT AGENCY
RUSH COUNTY, IN
AND INCORPORATED AREAS
FLOODING SOURCE FLOODWAY
CROSS SECTION DISTANCE1
1- PERCENT ANNUAL CHANCE FLOOD
BIG BLUE RIVER

WIDTH3
SECTION
AREA
MEAN
VELOCITY REGULATORY
WITHOUT
FLOODWAY
WITH
FLOODWAY INCREASE
(FEET) (SQ. FEET) (FT/SEC) (FEET, NAVD) (FEET, NAVD) (FEET, NAVD) (FEET)
BIG BLUE RIVER
AA 50.10 1,210/1,0502 4,117 3.2 872.2 872.2 872.2 0.0
AB 50.26 1,275/1,1002 10,856 1.2 872.6 872.6 872.6 0.0
AC 50.53 1,100 2,821 4.6 872.6 872.6 872.6 0.0
AD 50.61 1,165/1,1002 2,984 4.4 873.4 873.4 873.4 0.0
AE 50.70 1,252/1,1002 3,257 4.0 873.7 873.7 873.7 0.0
AF 50.95 1,218/1,1502 10,053 1.3 874.5 874.5 874.5 0.0
AG 51.23 1,895 2,917 4.5 875.2 875.2 875.2 0.0
AH 51.38 1,435 6,375 2.1 875.7 875.7 875.7 0.0
AI 51.70 1,166 7,174 1.8 876.2 876.2 876.2 0.0
AJ 52.00 1,129 6,578 2.0 876.7 876.7 876.7 0.0
Ak 52.23 1,182 5,939 2.2 877.4 877.4 877.4 0.0
AL 52.50 1,180 4,852 2.7 878.5 878.5 878.5 0.0
AM 52.71 1,093 2,960 4.4 879.9 879.9 879.9 0.0
AN 53.08 1,563 7,312 1.5 883.1 883.1 883.1 0.0
AO 53.26 1,212 3,989 2.8 884.1 884.1 884.1 0.0
AP 53.48 1,207 4,020 2.7 885.0 885.0 885.0 0.0
AQ 53.66 1,204 6,375 1.7 885.9 885.9 885.9 0.0
AR 53.93 1,248 3,714 3.0 886.5 886.5 886.5 0.0
AS 54.22 1,367 3,445 3.2 888.9 888.9 888.9 0.0
AT 54.64 1,586 8,589 1.3 890.0 890.0 890.0 0.0
AU 54.86 1,840 9,102 1.2 890.2 890.2 890.2 0.0
AV 55.15 1,420 7,035 1.3 890.6 890.6 890.6 0.0
AW 55.34 1,410/6502 4,810 1.8 891.2 891.2 891.2 0.0
AX 55.43 1,185/2002 4,856 1.8 891.4 891.4 891.4 0.0
1 Miles Above Mouth
3 Floodway Width May Differ From DFIRM. See DFIRM For Regulatory Width
2 Total Width/Width Within Unincorporated Area
WATER SURFACE ELEVATION
CROSS SECTION DISTANCE1
FEDERAL EMERGENCY MANAGEMENT AGENCY
FLOODING SOURCE FLOODWAY1- PERCENT ANNUAL CHANCE FLOOD
TA
BL
E 1
1
FLOODWAY DATA
RUSH COUNTY, IN
AND INCORPORATED AREAS BIG BLUE RIVER

WIDTH3
SECTION
AREA
MEAN
VELOCITY REGULATORY
WITHOUT
FLOODWAY
WITH
FLOODWAY INCREASE
(FEET) (SQ. FEET) (FT/SEC) (FEET, NAVD) (FEET, NAVD) (FEET, NAVD) (FEET)
CHARLOTTES BROOK
A 367 900 2 2,042 2.3 915.5 915.5 915.5 0.0
B 1,587 406 986 1.9 918.6 918.6 918.6 0.0
C 2,457 216 1,002 1.8 918.9 918.9 918.9 0.0
D 3,357 67 233 7.9 921.0 921.0 921.0 0.0
E 4,177 266 537 2.9 929.5 929.5 929.5 0.0
F 5,492 201 407 3.8 935.0 935.0 935.0 0.0
G 7,612 237 528 2.9 942.2 942.2 942.2 0.0
H 8,427 224 442 3.5 945.4 945.4 945.4 0.0
I 9,807 220 425 3.6 950.2 950.2 950.2 0.0
FLATROCK RIVER
A 53.18 1,483 6,307 2.8 936.5 936.5 936.5 0.0
B 53.42 1,721 7,805 2.3 937.4 937.4 937.4 0.0
C 54.19 2,100 11,522 1.5 939.2 939.2 939.2 0.0
D 55.14 1,900 8,088 2.2 941.0 941.0 941.0 0.0
E 55.63 1,849 8,830 2.0 942.5 942.5 942.5 0.0
F 55.99 1,968 9,870 1.8 943.6 943.6 943.6 0.0
G 56.73 1,972 9,974 1.8 945.3 945.3 945.3 0.0
H 57.29 2,242 10,327 1.7 946.3 946.3 946.3 0.0
I 57.68 1,695 8,585 2.1 947.2 947.2 947.2 0.0
J 58.11 842 4,514 3.8 949.1 949.1 949.1 0.0
K 58.48 510 * 1,392 7.4 952.8 952.8 952.8 0.0
L 58.63 380 * 2,607 3.9 953.3 953.3 953.3 0.0
M 58.68 378 * 3,514 4.9 953.8 953.8 953.8 0.0
N 58.97 1,120 * 9,166 1.9 955.1 955.1 955.1 0.0
O 59.09 2,000 * 6,819 2.5 955.3 955.3 955.3 0.0
P 59.31 1,880 * 6,399 2.7 955.4 955.4 955.4 0.0
Q 59.42 2,220 * 3,039 5.6 955.4 955.4 955.4 0.0
R 59.53 2,400 * 8,921 1.9 956.0 956.0 956.0 0.0
S 59.73 2,380 * 3,099 5.5 956.2 956.2 956.2 0.01 Feet Above Confluence With Six Mile Creek - Charlottes Brook 3
Floodway Width May Differ From DFIRM. See DFIRM For Regulatory Width2
Combined Floodway Width Of Six Mile Creek and Charlottes Brook 4 Miles Above Mouth - Flatrock River
* These Widths Consider Adjustments Made To Ensure Compliance With FEMA Policy Regarding The Mapping Of Floodways On Levees
FLOODING SOURCE FLOODWAY
CROSS SECTION DISTANCE1,4
TA
BL
E 1
1
FEDERAL EMERGENCY MANAGEMENT AGENCY
RUSH COUNTY, IN
AND INCORPORATED AREAS
1- PERCENT ANNUAL CHANCE FLOOD
CHARLOTTES BROOK/FLATROCK RIVER
WATER SURFACE ELEVATION
FLOODWAY DATA

WIDTH2
SECTION
AREA
MEAN
VELOCITY REGULATORY
WITHOUT
FLOODWAY
WITH
FLOODWAY INCREASE
(FEET) (SQ. FEET) (FT/SEC) (FEET, NAVD) (FEET, NAVD) (FEET, NAVD) (FEET)
FLATROCK RIVER
T 59.88 2,172 18,763 0.9 956.9 956.9 956.9 0.0
U 60.70 1,909 10,627 1.6 957.4 957.4 957.4 0.0
V 61.06 2,223 11,401 1.5 958.4 958.4 958.4 0.0
W 61.64 2,231 10,027 1.7 960.1 960.1 960.1 0.0
X 62.09 1,660 4,263 4.0 961.6 961.6 961.6 0.0
Y 62.20 1,115 6,875 2.2 962.6 962.6 962.6 0.0
Z 62.26 813 3,496 4.4 962.7 962.7 962.7 0.0
AA 62.92 754 4,284 3.6 964.5 964.5 964.5 0.0
AB 62.84 1,163 3,755 4.1 965.2 965.2 965.2 0.0
AC 63.33 1,640 9,276 1.6 965.8 965.8 965.8 0.0
AD 63.87 1,620 8,605 1.7 966.4 966.4 966.4 0.0
AE 64.05 1,552 5,079 2.9 966.6 966.6 966.6 0.0
GOOSE CREEK
A 0.71 600 348 4.2 878.2 878.2 878.2 0.0
B 1.00 380 659 2.2 883.3 883.3 883.3 0.0
C 1.20 328 584 2.5 887.9 887.9 887.9 0.0
D 1.40 290 338 1.4 890.0 890.0 890.0 0.0
E 1.60 210 269 1.7 895.0 895.0 895.0 0.0
F 1.81 54 146 3.2 898.7 898.7 898.7 0.0
G 1.90 70 191 2.4 900.5 900.5 900.5 0.0
H 2.11 28 90 5.1 904.0 904.0 904.0 0.0
I 2.18 138 176 2.6 905.3 905.3 905.3 0.0
1 Miles Above Mouth
2 Floodway Width May Differ From DFIRM. See DFIRM For Regulatory Width
FLOODING SOURCE FLOODWAY
TA
BL
E 1
1
WATER SURFACE ELEVATION
CROSS SECTION DISTANCE1
FEDERAL EMERGENCY MANAGEMENT AGENCY
RUSH COUNTY, IN
AND INCORPORATED AREAS FLATROCK RIVER/GOOSE CREEK
FLOODWAY DATA
1- PERCENT ANNUAL CHANCE FLOOD

WIDTH4
SECTION
AREA
MEAN
VELOCITY REGULATORY
WITHOUT
FLOODWAY
WITH
FLOODWAY INCREASE
(FEET) (SQ. FEET) (FT/SEC) (FEET, NAVD) (FEET, NAVD) (FEET, NAVD) (FEET)
HODGES BRANCH
A 0 330 907 1.3 966.7 966.7 966.7 0.0
B 420 400 961 1.3 967.3 967.3 967.3 0.0
C 880 405 450 2.7 968.7 968.7 968.7 0.0
D 1,450 505 817 1.5 970.1 970.1 970.1 0.0
E 1,738 510 32 3.8 970.3 970.3 970.3 0.0
F 2,021 545 697 1.8 971.1 971.1 971.1 0.0
G 2,241 595 1,251 1.0 971.4 971.4 971.4 0.0
H 3,011 255 563 2.2 971.7 971.7 971.7 0.0
I 3,336 158 352 2.4 972.0 972.0 972.0 0.0
J 3,661 380 167 5.4 972.0 972.0 972.0 0.0
SIX MILE CREEK
A 8,896 98 812 8.1 858.9 858.9 858.9 0.0
B 9,996 487 2852 2.3 860.7 860.7 860.7 0.0
C 12,196 940 3379 2.0 862.8 862.8 862.8 0.0
D 12,802 752 2,062 3.2 863.5 863.5 863.5 0.0
E 14,032 672 2,512 2.6 865.8 865.8 865.8 0.0
F 23,533 171 1,200 4.7 883.0 883.0 883.0 0.0
G 25,563 739 3,154 1.8 884.3 884.3 884.3 0.0
H 27,363 767 2,619 2.1 885.4 885.4 885.4 0.0
I 29,393 640 1,176 4.9 887.4 887.4 887.4 0.0
J 28,618 809 2,267 2.5 888.5 888.5 888.5 0.0
K 31,068 980 1,945 2.8 892.5 892.5 892.5 0.0
L 32,348 572 1,494 3.6 895.6 895.6 895.6 0.0
M 33,207 663 1,711 3.1 898.2 898.2 898.2 0.0
N 36,367 920 1,874 2.9 903.7 903.7 903.7 0.0
O 38,447 652 1,368 3.8 908.2 908.2 908.2 0.0
P 41,047 529 1,426 3.6 913.4 913.4 913.4 0.0
Q 41,396 900 3 2,042 3.1 915.1 915.1 915.1 0.0
1 Feet Above Culvert Inlet At 9th Street - Hodges Branch
3 Combined Floodway Width Of Six Mile Creek And Charlottes Brook
2 Feet Above Mouth - Six Mile Creek
4 Floodway Width May Differ From DFIRM. See DFIRM For Regulatory Width
FLOODWAY DATA
RUSH COUNTY, IN
AND INCORPORATED AREAS
FLOODING SOURCE FLOODWAYWATER SURFACE ELEVATION
1- PERCENT ANNUAL CHANCE FLOOD
HODGES BRANCH/SIX MILE CREEK
CROSS SECTION DISTANCE1,2
FEDERAL EMERGENCY MANAGEMENT AGENCY
TA
BL
E 1
1

WIDTH2
SECTION
AREA
MEAN
VELOCITY REGULATORY
WITHOUT
FLOODWAY
WITH
FLOODWAY INCREASE
(FEET) (SQ. FEET) (FT/SEC) (FEET, NAVD) (FEET, NAVD) (FEET, NAVD) (FEET)
SIX MILE CREEK
R 42,666 403 933 5.1 916.5 916.5 916.5 0.0
S 45,264 714 2,372 2.0 921.7 921.7 921.7 0.0
T 47,316 500 1,703 2.8 925.8 925.8 925.8 0.0
U 48,296 520 1,718 2.8 926.8 926.8 926.8 0.0
THREE MILE CREEK
A 12,672 313 1,003 3.0 929.6 929.6 929.6 0.0
B 14,098 55 396 7.7 937.0 937.0 937.0 0.0
C 14,309 238 869 3.5 937.9 937.9 937.9 0.0
D 15,946 306 764 3.8 942.9 942.9 942.9 0.0
E 18,058 326 1,104 2.6 948.8 948.8 948.8 0.0
F 18,744 375 1,108 2.6 950.4 950.4 950.4 0.0
G 20,011 300 284 10.2 956.8 956.8 956.8 0.0
H 22,440 362 1,190 2.4 963.2 963.2 963.2 0.0
I 23,549 300 325 8.9 968.1 968.1 968.1 0.0
J 25,238 525 1,752 1.7 971.7 971.7 971.7 0.0
K 25,555 466 1,358 2.1 973.0 973.0 973.0 0.0
L 28,565 326 933 2.9 977.9 977.9 977.9 0.0
1- PERCENT ANNUAL CHANCE FLOOD
CROSS SECTION DISTANCE1
FLOODWAYFLOODING SOURCEWATER SURFACE ELEVATION
L 28,565 326 933 2.9 977.9 977.9 977.9 0.0
M 29,410 317 1,116 2.4 980.7 980.7 980.7 0.0
N 30,043 265 1,183 2.1 984.7 984.7 984.7 0.0
O 31,258 477 1,285 1.9 985.6 985.6 985.6 0.0
P 32,947 467 875 2.8 987.9 987.9 987.9 0.0
1 Feet Above Mouth
2 Floodway Width May Differ From DFIRM. See DFIRM For Regulatory Width
SIX MILE CREEK/THREE MILE CREEK
FLOODWAY DATA
TA
BL
E 1
1
FEDERAL EMERGENCY MANAGEMENT AGENCY
RUSH COUNTY, IN
AND INCORPORATED AREAS

21
5.0 INSURANCE APPLICATIONS
For flood insurance rating purposes, flood insurance zone designations are assigned to a community
based on the results of the engineering analyses. These zones are as follows:
Zone A
Zone A is the flood insurance risk zone that corresponds to the 1-percent-annual-chance floodplains
that are determined in the FIS by approximate methods. Because detailed hydraulic analyses are not
performed for such areas, no BFEs or base flood depths are shown within this zone.
Zone AE
Zone AE is the flood insurance risk zone that corresponds to the 1-percent-annual-chance floodplains
that are determined in the FIS by detailed methods. In most instances, whole-foot BFEs derived from
the detailed hydraulic analyses are shown at selected intervals within this zone.
Zone X
Zone X is the flood insurance risk zone that corresponds to areas outside the 0.2-percent-annual-
chance floodplain, areas within the 0.2-percent-annual-chance floodplain, and areas of 1-percent-
annual-chance flooding where average depths are less than 1 foot, areas of 1-percent-annual-chance
flooding where the contributing drainage area is less than 1 square mile, and areas protected from the
1-percent-annual-chance flood by levees. No BFEs or base flood depths are shown within this zone.

22
6.0 FLOOD INSURANCE RATE MAP
The FIRM is designed for flood insurance and floodplain management applications.
For flood insurance applications, the map designates flood insurance risk zones as described in
Section 5.0 and, in the 1-percent-annual-chance floodplains that were studied by detailed
methods, shows selected whole-foot BFEs or average depths. Insurance agents use the zones and
BFEs in conjunction with information on structures and their contents to assign premium rates for
flood insurance policies.
For floodplain management applications, the map shows by tints, screens, and symbols, the 1-
and 0.2-percent-annual-chance floodplains, floodways, and the locations of selected cross
sections used in the hydraulic analyses and floodway computations.
The current FIRM presents flooding information for the entire geographic area of Rush County.
Previously, separate FIRMs were prepared for each identified flood prone incorporated
community and for the unincorporated areas of the county. Historical data relating to the maps
prepared for each community are presented in Table 12.

Carthage, Town of November 23, 1973 April 16, 1976 November 2, 1983 None
*Glenwood, Town of N/A None N/A None
Rush County June 3, 1977 None December 1, 1982 None
(Unincorporated Areas)
Rushville, City of December 7, 1973 June 11, 1976 November 3, 1982 None
*No Special Flood Hazard Area
FIRM REVISIONS
DATE
COMMUNITY MAP HISTORY
FEDERAL EMERGENCY MANAGEMENT AGENCY
RUSH COUNTY, IN
AND INCORPORATED AREAS
TABLE 12
COMMUNITY NAME INITIAL IDENTIFICATION
FLOOD HAZARD
BOUNDARY MAP
REVISIONS DATE
FIRM EFFECTIVE
DATE

24
7.0 OTHER STUDIES
This FIS report either supersedes or is compatible with all previous studies on streams studied in
this report and should be considered authoritative for purposes of the NFIP.
8.0 LOCATION OF DATA
Information concerning the pertinent data used in the preparation of this study can be obtained by
contacting the Flood Insurance and Mitigation Division, Federal Emergency Management
Agency, Region V, 536 S. Clark Street, 6th
Floor, Chicago, IL 60605
9.0 BIBLIORAPHY AND REFERENCES
1. Federal Emergency Management Agency. Flood Insurance Study, Rush County, IN
(Unincorporated Areas), June 1, 1982. Washington, D.C.
2. Federal Emergency Management Agency, Flood Insurance Study, City of Rushville, Indiana,
May 3, 1982. Washington, D.C.
3. Federal Emergency Management Agency, Flood Insurance Study, Town of Carthage, Indiana,
May 2 1983. Washington, D.C.
4. “Historic Census Counts for Indiana Counties, 1900-2000” STATS Indiana, Indiana Business
Research Center, Indiana University Kelley School of Business, accessed at
http://www.stats.indiana.edu/population/PopTotals/historic_counts_counties.asp.
5. “Historic Census for Indiana Incorporated and Census Designated Places from 1900 to 2000”
STATS Indiana, Indiana Business Research Center, Indiana University Kelley School of
Business, accessed at
http://www.stats.indiana.edu/population/PopTotals/historic_counts_cities.asp
6. Indiana Administrative Code 310 IAC 10 Flood Plain Management accessed at
http://www.in.gov/legislative/iac/T03120/A00100.PDF
7. Indiana Code IC 14-28-1, Flood Control Act, accessed at
http://www.in.gov/legislative/ic/code/title14/ar28/ch1.html
8. Indiana Department of Natural Resources, Division of Water, Coordinated Discharges of
Selected Streams in Indiana, accessed at
http://www.in.gov/dnr/water/surface_water/coordinated_discharges/index.html
9. Indiana Department of Natural Resources, Division of Water, General Guidelines For The
Hydrologic-Hydraulic Assessment Of Floodplains In Indiana, December 2002.
10. Knipe, David, and Rao, A. R. Estimation of Peak Discharges of Indiana Streams by Using the
Log Pearson III Distribution, Purdue University, School of Civil Engineering, Joint
Transportation Research Program, Project No. C-36-620, File No. 9-8-15, 2005.
11. National Oceanic and Atmospheric Administration, National Climatic Data Center, Monthly
Station Normals of Temperature, Precipitation, and Heating and Cooling Days, 1971-2000,
Climatography of the United States No. 81, 2002.

25
12. U.S. Army Corps of Engineers, HEC-2 Water-Surface Profiles Computer Program 723-X6,
L202A, Davis, California, November 1976.
13. U.S. Department of the Interior, Geological Survey, Water Resources Investigation 35-75,
Statistical Summaries of Indiana Streamflow Data, February 1976.
14. U.S. Geological Survey, Surface-Water Data for Indiana, Peak-Flow Data for Rush County.
http://nwis.waterdata.usgs.gov/in/nwis/peak.

820
825
830 830
835 835
840 840
845 845
850 850
855 855
860 860
865 865
45.60 45.70 45.80 45.90 46.00 46.10 46.20 46.30 46.40 46.50 46.60 46.70 46.80 46.90
ELE
VA
TIO
N IN
FEET
(N
AV
D 8
8)
STREAM DISTANCE IN MILES ABOVE MOUTH
FED
ER
AL
EM
ER
GEN
CY
MA
NA
GEM
EN
T A
GEN
CY
RU
SH
CO
UN
TY
, IN
AN
D IN
CO
RP
OR
AT
ED
AR
EA
S
FLO
OD
PR
OFI
LES
BIG
BLU
E R
IVER
01P
A B C D E F
CO
UN
TY
RO
AD
10
00
WES
T
LEGEND
0.2% ANNUAL CHANCE FLOOD
1% ANNUAL CHANCE FLOOD
2% ANNUAL CHANCE FLOOD
10% ANNUAL CHANCE FLOOD
STREAM BED
CROSS SECTION LOCATION
CO
UN
TY
BO
UN
DA
RY
LIM
IT O
F D
ET
AIL
ED
ST
UD
Y
825
830
835 835
840 840
845 845
850 850
855 855
860 860
865 865
870 870
46.70 46.80 46.90 47.00 47.10 47.20 47.30 47.40 47.50 47.60 47.70 47.80 47.90 48.00
ELE
VA
TIO
N IN
FEET
(N
AV
D 8
8)
STREAM DISTANCE IN MILES ABOVE MOUTH
FED
ER
AL
EM
ER
GEN
CY
MA
NA
GEM
EN
T A
GEN
CY
RU
SH
CO
UN
TY
, IN
AN
D IN
CO
RP
OR
AT
ED
AR
EA
S
FLO
OD
PR
OFI
LES
BIG
BLU
E R
IVER
02P
G H I J K L
M
CO
UN
TY
RO
AD
92
5 W
ES
T
LEGEND
0.2% ANNUAL CHANCE FLOOD
1% ANNUAL CHANCE FLOOD
2% ANNUAL CHANCE FLOOD
10% ANNUAL CHANCE FLOOD
STREAM BED
CROSS SECTION LOCATION

835
840
845 845
850 850
855 855
860 860
865 865
870 870
875 875
880 880
47.80 47.90 48.00 48.10 48.20 48.30 48.40 48.50 48.60 48.70 48.80 48.90 49.00 49.10
ELE
VA
TIO
N IN
FEET
(N
AV
D 8
8)
STREAM DISTANCE IN MILES ABOVE MOUTH
FED
ER
AL
EM
ER
GEN
CY
MA
NA
GEM
EN
T A
GEN
CY
RU
SH
CO
UN
TY
, IN
AN
D IN
CO
RP
OR
AT
ED
AR
EA
S
FLO
OD
PR
OFI
LES
BIG
BLU
E R
IVER
03P
N O P Q R
LEGEND
0.2% ANNUAL CHANCE FLOOD
1% ANNUAL CHANCE FLOOD
2% ANNUAL CHANCE FLOOD
10% ANNUAL CHANCE FLOOD
STREAM BED
CROSS SECTION LOCATION

840
845
850 850
855 855
860 860
865 865
870 870
875 875
880 880
885 885
48.80 48.90 49.00 49.10 49.20 49.30 49.40 49.50 49.60 49.70 49.80 49.90 50.00 50.10
ELE
VA
TIO
N IN
FEET
(N
AV
D 8
8)
STREAM DISTANCE IN MILES ABOVE MOUTH
FED
ER
AL
EM
ER
GEN
CY
MA
NA
GEM
EN
T A
GEN
CY
RU
SH
CO
UN
TY
, IN
AN
D IN
CO
RP
OR
AT
ED
AR
EA
S
FLO
OD
PR
OFI
LES
BIG
BLU
E R
IVER
04P
S T U
V
W X Y
ZC
OU
NT
Y R
OA
D 8
00
NO
RT
H
LEGEND
0.2% ANNUAL CHANCE FLOOD
1% ANNUAL CHANCE FLOOD
2% ANNUAL CHANCE FLOOD
10% ANNUAL CHANCE FLOOD
STREAM BED
CROSS SECTION LOCATION

840
845
850 850
855 855
860 860
865 865
870 870
875 875
880 880
885 885
49.90 50.00 50.10 50.20 50.30 50.40 50.50 50.60 50.70 50.80 50.90 51.00 51.10 51.20
ELE
VA
TIO
N IN
FEET
(N
AV
D 8
8)
STREAM DISTANCE IN MILES ABOVE MOUTH
FED
ER
AL
EM
ER
GEN
CY
MA
NA
GEM
EN
T A
GEN
CY
RU
SH
CO
UN
TY
, IN
AN
D IN
CO
RP
OR
AT
ED
AR
EA
S
FLO
OD
PR
OFI
LES
BIG
BLU
E R
IVER
05P
AA AB AC AD AE
AF
CO
NFLU
EN
CE O
F
CO
NFLU
EN
CE O
F N
OR
TH
CO
UN
TY
RO
AD
LEGEND
0.2% ANNUAL CHANCE FLOOD
1% ANNUAL CHANCE FLOOD
2% ANNUAL CHANCE FLOOD
10% ANNUAL CHANCE FLOOD
STREAM BED
CROSS SECTION LOCATION
CA
RT
HA
GE C
REEK
90
0 N
OR
TH
CA
RT
HA
GE C
REEK
CO
NFLU
EN
CE O
F G
OO
SE C
REEK

845
850
855 855
860 860
865 865
870 870
875 875
880 880
885 885
890 890
51.00 51.10 51.20 51.30 51.40 51.50 51.60 51.70 51.80 51.90 52.00 52.10 52.20 52.30
ELE
VA
TIO
N IN
FEET
(N
AV
D 8
8)
STREAM DISTANCE IN MILES ABOVE MOUTH
FED
ER
AL
EM
ER
GEN
CY
MA
NA
GEM
EN
T A
GEN
CY
RU
SH
CO
UN
TY
, IN
AN
D IN
CO
RP
OR
AT
ED
AR
EA
S
FLO
OD
PR
OFI
LES
BIG
BLU
E R
IVER
06P
AG AH AI
AJ
CO
NR
AIL
LEGEND
0.2% ANNUAL CHANCE FLOOD
1% ANNUAL CHANCE FLOOD
2% ANNUAL CHANCE FLOOD
10% ANNUAL CHANCE FLOOD
STREAM BED
CROSS SECTION LOCATION

850
855
860 860
865 865
870 870
875 875
880 880
885 885
890 890
895 895
52.10 52.20 52.30 52.40 52.50 52.60 52.70 52.80 52.90 53.00 53.10 53.20 53.30 53.40
ELE
VA
TIO
N IN
FEET
(N
AV
D 8
8)
STREAM DISTANCE IN MILES ABOVE MOUTH
FED
ER
AL
EM
ER
GEN
CY
MA
NA
GEM
EN
T A
GEN
CY
RU
SH
CO
UN
TY
, IN
AN
D IN
CO
RP
OR
AT
ED
AR
EA
S
FLO
OD
PR
OFI
LES
BIG
BLU
E R
IVER
07P
AK AL AM AN
AO
CO
NFL
UEN
CE O
F T
HR
EE M
ILE C
REEK
LEGEND
0.2% ANNUAL CHANCE FLOOD
1% ANNUAL CHANCE FLOOD
2% ANNUAL CHANCE FLOOD
10% ANNUAL CHANCE FLOOD
STREAM BED
CROSS SECTION LOCATION

855
860
865 865
870 870
875 875
880 880
885 885
890 890
895 895
900 900
53.20 53.30 53.40 53.50 53.60 53.70 53.80 53.90 54.00 54.10 54.20 54.30 54.40 54.50
ELE
VA
TIO
N IN
FEET
(N
AV
D 8
8)
STREAM DISTANCE IN MILES ABOVE MOUTH
FED
ER
AL
EM
ER
GEN
CY
MA
NA
GEM
EN
T A
GEN
CY
RU
SH
CO
UN
TY
, IN
AN
D IN
CO
RP
OR
AT
ED
AR
EA
S
FLO
OD
PR
OFI
LES
BIG
BLU
E R
IVER
08P
AP AQ AR
AS
LEGEND
0.2% ANNUAL CHANCE FLOOD
1% ANNUAL CHANCE FLOOD
2% ANNUAL CHANCE FLOOD
10% ANNUAL CHANCE FLOOD
STREAM BED
CROSS SECTION LOCATION

860
865
870 870
875 875
880 880
885 885
890 890
895 895
900 900
905 905
54.30 54.40 54.50 54.60 54.70 54.80 54.90 55.00 55.10 55.20 55.30 55.40 55.50 55.60
ELE
VA
TIO
N IN
FEET
(N
AV
D 8
8)
STREAM DISTANCE IN MILES ABOVE MOUTH
FED
ER
AL
EM
ER
GEN
CY
MA
NA
GEM
EN
T A
GEN
CY
RU
SH
CO
UN
TY
, IN
AN
D IN
CO
RP
OR
AT
ED
AR
EA
S
FLO
OD
PR
OFI
LES
BIG
BLU
E R
IVER
09P
AT AU AV
AW AX
ST
AT
E R
OU
TE 1
40
CO
UN
TY
BO
UN
DA
RY
LEGEND
0.2% ANNUAL CHANCE FLOOD
1% ANNUAL CHANCE FLOOD
2% ANNUAL CHANCE FLOOD
10% ANNUAL CHANCE FLOOD
STREAM BED
CROSS SECTION LOCATION
LIM
IT O
F D
ET
AIL
ED
ST
UD
Y

900
905
910 910
915 915
920 920
925 925
930 930
935 935
940 940
945 945
0 0 500 1000 1500 2000 2500 3000 3500 4000 4500 5000 5500 6000
ELE
VA
TIO
N IN
FEET
(N
AV
D 8
8)
STREAM DISTANCE IN FEET ABOVE MOUTH
FED
ER
AL
EM
ER
GEN
CY
MA
NA
GEM
EN
T A
GEN
CY
RU
SH
CO
UN
TY
, IN
AN
D IN
CO
RP
OR
AT
ED
AR
EA
S
FLO
OD
PR
OFI
LES
CH
AR
LOT
TES
BR
OO
K
10P
A B C D E
F
CO
UN
TY
RO
AD
90
0 W
ES
T
LEGEND
0.2% ANNUAL CHANCE FLOOD
1% ANNUAL CHANCE FLOOD
2% ANNUAL CHANCE FLOOD
10% ANNUAL CHANCE FLOOD
STREAM BED
CROSS SECTION LOCATION
CO
NFLU
EN
CE W
ITH
SIX
MIL
E C
REEK
LIM
IT O
F D
ET
AIL
ED
ST
UD
Y

920
925
930 930
935 935
940 940
945 945
950 950
955 955
960 960
965 965
5000 5500 6000 6500 7000 7500 8000 8500 9000 9500 10000 10500 11000 11500
ELE
VA
TIO
N IN
FEET
(N
AV
D 8
8)
STREAM DISTANCE IN FEET ABOVE MOUTH
FED
ER
AL
EM
ER
GEN
CY
MA
NA
GEM
EN
T A
GEN
CY
RU
SH
CO
UN
TY
, IN
AN
D IN
CO
RP
OR
AT
ED
AR
EA
S
FLO
OD
PR
OFI
LES
CH
AR
LOT
TES
BR
OO
K
11P
G H I
CO
UN
TY
RO
AD
12
00
NO
RT
H
CO
UN
TY
BO
UN
DA
RY
LEGEND
0.2% ANNUAL CHANCE FLOOD
1% ANNUAL CHANCE FLOOD
2% ANNUAL CHANCE FLOOD
10% ANNUAL CHANCE FLOOD
STREAM BED
CROSS SECTION LOCATION
LIM
IT O
F D
ET
AIL
ED
ST
UD
Y
910
915
920 920
925 925
930 930
935 935
940 940
945 945
950 950
955 955
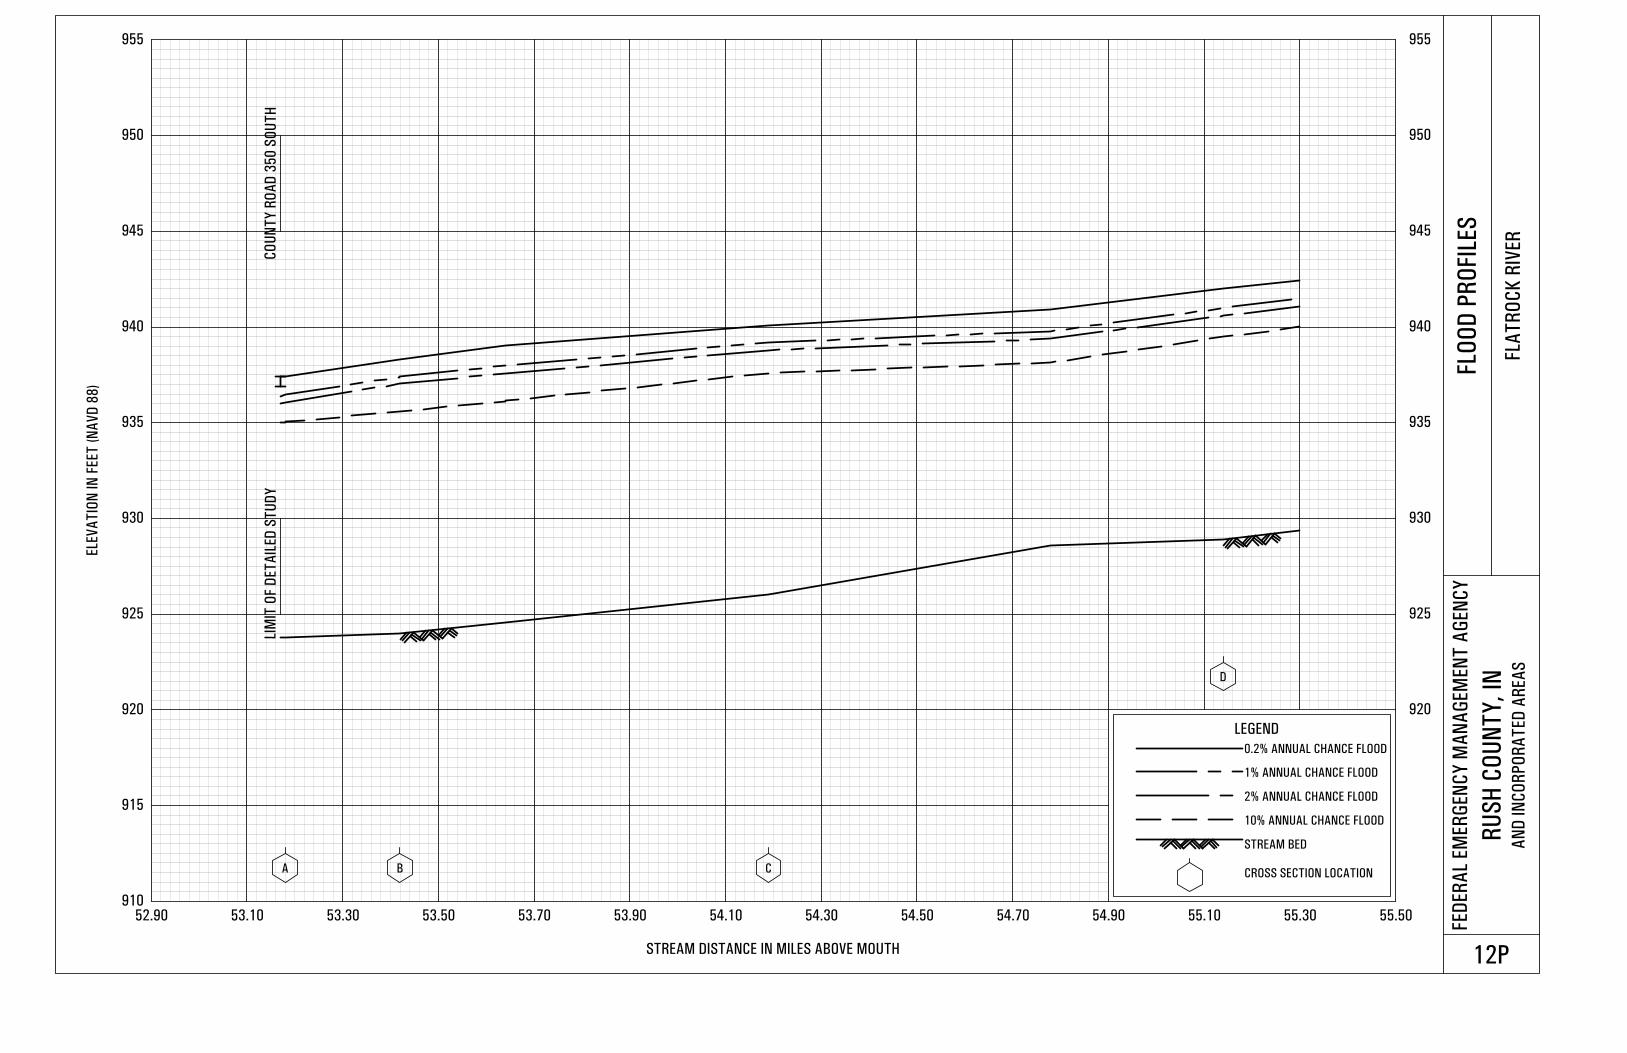
52.90 53.10 53.30 53.50 53.70 53.90 54.10 54.30 54.50 54.70 54.90 55.10 55.30 55.50
ELE
VA
TIO
N IN
FEET
(N
AV
D 8
8)
STREAM DISTANCE IN MILES ABOVE MOUTH
FED
ER
AL
EM
ER
GEN
CY
MA
NA
GEM
EN
T A
GEN
CY
RU
SH
CO
UN
TY
, IN
AN
D IN
CO
RP
OR
AT
ED
AR
EA
S
FLO
OD
PR
OFI
LES
FL A
TR
OC
K R
IVER
12P
A B C
D
CO
UN
TY
RO
AD
35
0 S
OU
TH
LEGEND
0.2% ANNUAL CHANCE FLOOD
1% ANNUAL CHANCE FLOOD
2% ANNUAL CHANCE FLOOD
10% ANNUAL CHANCE FLOOD
STREAM BED
CROSS SECTION LOCATION
LIM
IT O
F D
ET
AIL
ED
ST
UD
Y

920
925
930 930
935 935
940 940
945 945
950 950
955 955
960 960
965 965
55.10 55.30 55.50 55.70 55.90 56.10 56.30 56.50 56.70 56.90 57.10 57.30 57.50 57.70
ELE
VA
TIO
N IN
FEET
(N
AV
D 8
8)
STREAM DISTANCE IN MILES ABOVE MOUTH
FED
ER
AL
EM
ER
GEN
CY
MA
NA
GEM
EN
T A
GEN
CY
RU
SH
CO
UN
TY
, IN
AN
D IN
CO
RP
OR
AT
ED
AR
EA
S
FLO
OD
PR
OFI
LES
FL A
TR
OC
K R
IVER
13P
E F G
H
LEGEND
0.2% ANNUAL CHANCE FLOOD
1% ANNUAL CHANCE FLOOD
2% ANNUAL CHANCE FLOOD
10% ANNUAL CHANCE FLOOD
STREAM BED
CROSS SECTION LOCATION

925
930
935 935
940 940
945 945
950 950
955 955
960 960
965 965
970 970
57.30 57.50 57.70 57.90 58.10 58.30 58.50 58.70 58.90 59.10 59.30 59.50 59.70 59.90
ELE
VA
TIO
N IN
FEET
(N
AV
D 8
8)
STREAM DISTANCE IN MILE ABOVE MOUTH
FED
ER
AL
EM
ER
GEN
CY
MA
NA
GEM
EN
T A
GEN
CY
RU
SH
CO
UN
TY
, IN
AN
D IN
CO
RP
OR
AT
ED
AR
EA
S
FLO
OD
PR
OFI
LES
FL A
TR
OC
K R
IVER
14P
I J K L
M
N O
P Q R
CO
NFL
UEN
CE O
F H
AC
KLE
MA
N C
REEK
CIT
Y O
F R
US
HV
ILLE
CO
RP
OR
AT
E L
IMIT
S
U.S
. R
OU
TE 5
2
CIT
Y O
F R
US
HV
ILLE
CO
RP
OR
AT
E L
IMIT
S
ST
AT
E R
OU
TE 4
4
LEGEND
0.2% ANNUAL CHANCE FLOOD
1% ANNUAL CHANCE FLOOD
2% ANNUAL CHANCE FLOOD
10% ANNUAL CHANCE FLOOD
STREAM BED
CROSS SECTION LOCATION
ST
AT
E R
OU
TE 3

935
940
945 945
950 950
955 955
960 960
965 965
970 970
975 975
980 980
59.50 59.70 59.90 60.10 60.30 60.50 60.70 60.90 61.10 61.30 61.50 61.70 61.90 62.10
ELE
VA
TIO
N IN
FEET
(N
AV
D 8
8)
STREAM DISTANCE IN MILES ABOVE MOUTH
FED
ER
AL
EM
ER
GEN
CY
MA
NA
GEM
EN
T A
GEN
CY
RU
SH
CO
UN
TY
, IN
AN
D IN
CO
RP
OR
AT
ED
AR
EA
S
FLO
OD
PR
OFI
LES
FL A
TR
OC
K R
IVER
15P
S T U V
W
CH
ES
SIE
SY
ST
EM
LEGEND
0.2% ANNUAL CHANCE FLOOD
1% ANNUAL CHANCE FLOOD
2% ANNUAL CHANCE FLOOD
10% ANNUAL CHANCE FLOOD
STREAM BED
CROSS SECTION LOCATION

940
945
950 950
955 955
960 960
965 965
970 970
975 975
980 980
985 985
61.70 61.90 62.10 62.30 62.50 62.70 62.90 63.10 63.30 63.50 63.70 63.90 64.10 64.30
ELE
VA
TIO
N IN
FEET
(N
AV
D 8
8)
STREAM DISTANCE IN MILES ABOVE MOUTH
FED
ER
AL
EM
ER
GEN
CY
MA
NA
GEM
EN
T A
GEN
CY
RU
SH
CO
UN
TY
, IN
AN
D IN
CO
RP
OR
AT
ED
AR
EA
S
FLO
OD
PR
OFI
LES
FL A
TR
OC
K R
IVER
16P
X Y Z AA AB AC
AD AE
CO
NFL
UEN
CE O
F B
EN
DA
VIS
CR
EEK
CO
UN
TY
RO
AD
15
0 N
OR
TH
CO
UN
TY
RO
AD
30
0 N
OR
TH
LEGEND
0.2% ANNUAL CHANCE FLOOD
1% ANNUAL CHANCE FLOOD
2% ANNUAL CHANCE FLOOD
10% ANNUAL CHANCE FLOOD
STREAM BED
CROSS SECTION LOCATION
LIM
IT O
F D
ET
AIL
ED
ST
UD
Y

855
860
865 865
870 870
875 875
880 880
885 885
890 890
895 895
900 900
0.00 0.00 0.10 0.20 0.30 0.40 0.50 0.60 0.70 0.80 0.90 1.00 1.10 1.20
ELE
VA
TIO
N IN
FEET
(N
AV
D 8
8)
STREAM DISTANCE IN MILES ABOVE CONFLUENCE WITH BIG BLUE RIVER
FED
ER
AL
EM
ER
GEN
CY
MA
NA
GEM
EN
T A
GEN
CY
RU
SH
CO
UN
TY
, IN
AN
D IN
CO
RP
OR
AT
ED
AR
EA
S
FLO
OD
PR
OFI
LES
GO
OS
E C
REEK
17P
A
B
CO
UN
TY
RO
AD
10
00
NO
RT
H
LEGEND
0.2% ANNUAL CHANCE FLOOD
1% ANNUAL CHANCE FLOOD
2% ANNUAL CHANCE FLOOD
10% ANNUAL CHANCE FLOOD
STREAM BED
CROSS SECTION LOCATION
1% ANNUAL CHANCE BACKWATER FROM BIG BLUE RIVER
CO
NFLU
EN
CE W
ITH
BIG
BLU
E R
IVER

875
880
885 885
890 890
895 895
900 900
905 905
910 910
915 915
920 920
1.00 1.10 1.20 1.30 1.40 1.50 1.60 1.70 1.80 1.90 2.00 2.10 2.20 2.30
ELE
VA
TIO
N IN
FEET
(N
AV
D 8
8)
STREAM DISTANCE IN MILES ABOVE CONFLUENCE WITH BIG BLUE RIVER
FED
ER
AL
EM
ER
GEN
CY
MA
NA
GEM
EN
T A
GEN
CY
RU
SH
CO
UN
TY
, IN
AN
D IN
CO
RP
OR
AT
ED
AR
EA
S
FLO
OD
PR
OFI
LES
GO
OS
E C
REEK
18P
C D E F G
H I
PR
IVA
TE D
RIV
E
LEGEND
0.2% ANNUAL CHANCE FLOOD
1% ANNUAL CHANCE FLOOD
2% ANNUAL CHANCE FLOOD
10% ANNUAL CHANCE FLOOD
STREAM BED
CROSS SECTION LOCATION

900
905
910 910
915 915
920 920
925 925
930 930
935 935
940 940
945 945
2.10 2.20 2.30 2.40 2.50 2.60 2.70 2.80 2.90 3.00 3.10 3.20 3.30 3.40
ELE
VA
TIO
N IN
FEET
(N
AV
D 8
8)
STREAM DISTANCE IN MILES ABOVE CONFLUENCE WITH BIG BLUE RIVER
FED
ER
AL
EM
ER
GEN
CY
MA
NA
GEM
EN
T A
GEN
CY
RU
SH
CO
UN
TY
, IN
AN
D IN
CO
RP
OR
AT
ED
AR
EA
S
FLO
OD
PR
OFI
LES
GO
OS
E C
REEK
19P
BI G
BLU
E D
AM
NO
. 2
CO
UN
TY
BO
UN
DA
RY
LEGEND
0.2% ANNUAL CHANCE FLOOD
1% ANNUAL CHANCE FLOOD
2% ANNUAL CHANCE FLOOD
10% ANNUAL CHANCE FLOOD
STREAM BED
CROSS SECTION LOCATION
LIM
IT O
F D
ET
AIL
ED
ST
UD
Y
940
945
950 950
955 955
960 960
965 965
970 970
975 975
980 980
985 985
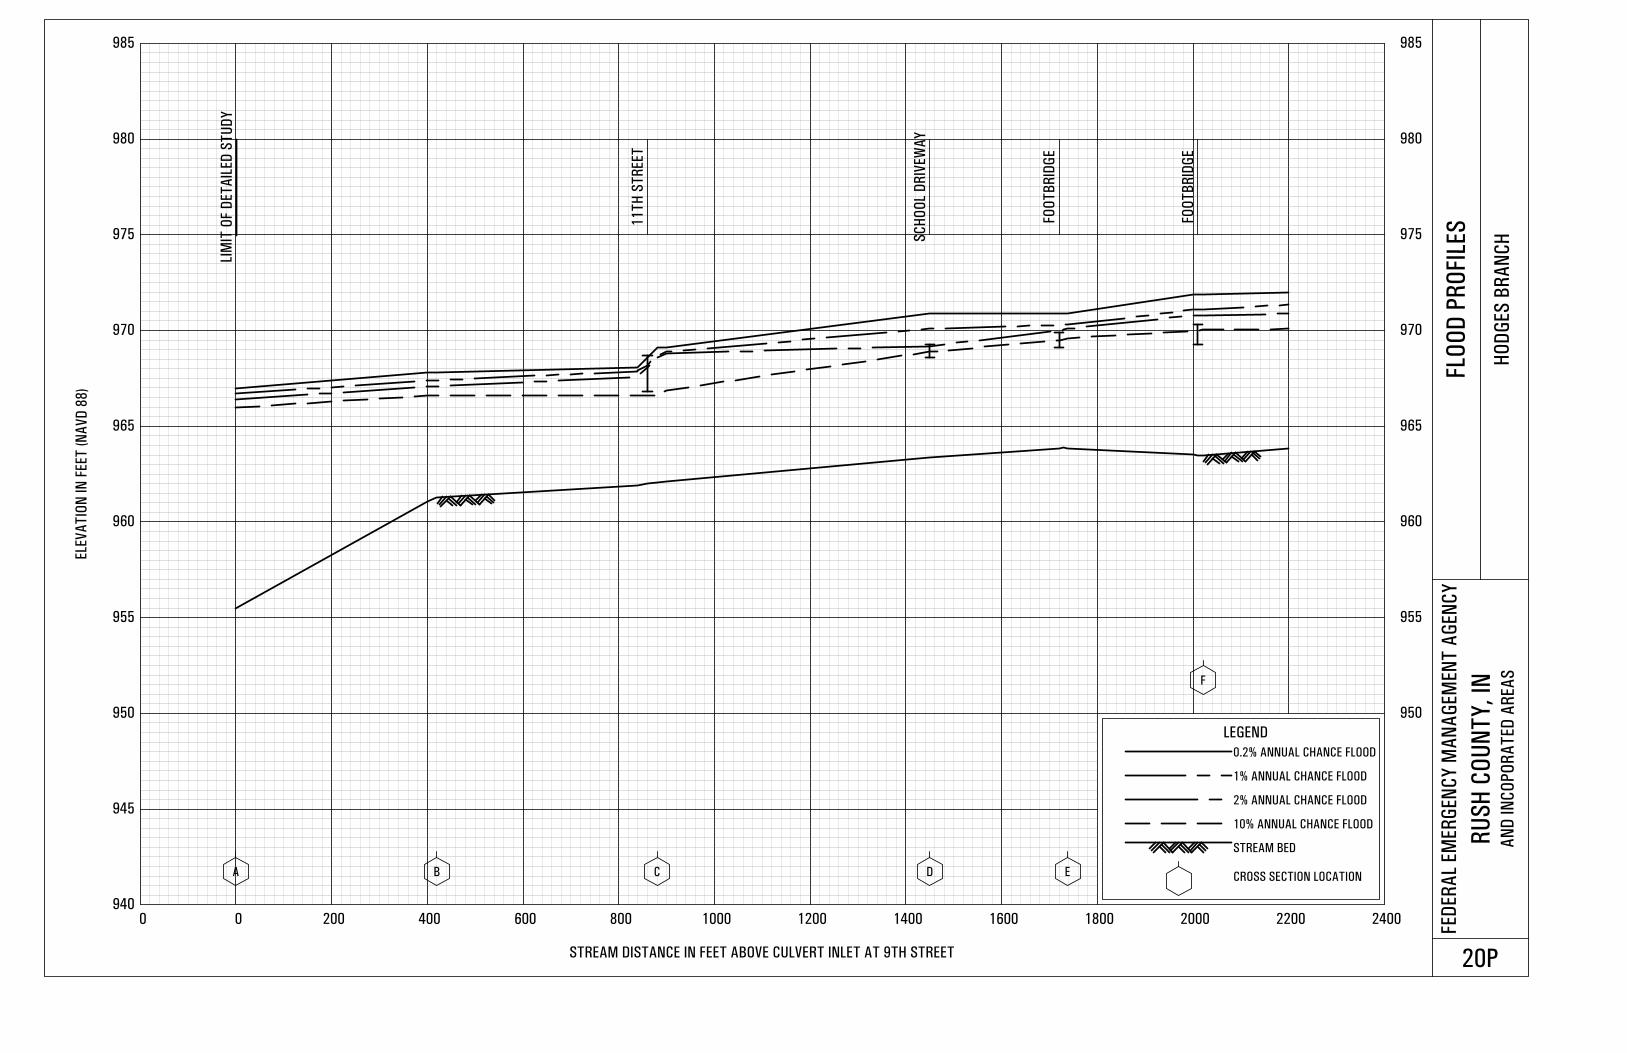
0 0 200 400 600 800 1000 1200 1400 1600 1800 2000 2200 2400
ELE
VA
TIO
N IN
FEET
(N
AV
D 8
8)
STREAM DISTANCE IN FEET ABOVE CULVERT INLET AT 9TH STREET
FED
ER
AL
EM
ER
GEN
CY
MA
NA
GEM
EN
T A
GEN
CY
RU
SH
CO
UN
TY
, IN
AN
D I
NC
OP
OR
AT
ED
AR
EA
S
FLO
OD
PR
OFI
LES
HO
DG
ES
BR
AN
CH
20P
A B C D E
F
11
TH
ST
REET
SC
HO
OL
DR
IVEW
AY
FOO
TB
RID
GE
FOO
TB
RID
GE
LEGEND
0.2% ANNUAL CHANCE FLOOD
1% ANNUAL CHANCE FLOOD
2% ANNUAL CHANCE FLOOD
10% ANNUAL CHANCE FLOOD
STREAM BED
CROSS SECTION LOCATION
LIM
IT O
F D
ET
AIL
ED
ST
UD
Y

940
945
950 950
955 955
960 960
965 965
970 970
975 975
980 980
985 985
2000 2200 2400 2600 2800 3000 3200 3400 3600 3800 4000 4200 4400 4600
ELE
VA
TIO
N IN
FEET
(N
AV
D 8
8)
STREAM DISTANCE IN FEET ABOVE CULVERT INLET AT 9TH STREET
FED
ER
AL
EM
ER
GEN
CY
MA
NA
GEM
EN
T A
GEN
CY
RU
SH
CO
UN
TY
, IN
AN
D I
NC
OP
OR
AT
ED
AR
EA
S
FLO
OD
PR
OFI
LES
HO
DG
ES
BR
AN
CH
21P
G H I J
13
TH
ST
REET
MA
IN S
TR
EET
LEGEND
0.2% ANNUAL CHANCE FLOOD
1% ANNUAL CHANCE FLOOD
2% ANNUAL CHANCE FLOOD
10% ANNUAL CHANCE FLOOD
STREAM BED
CROSS SECTION LOCATION
LIM
IT O
F D
ET
AIL
ED
ST
UD
Y

835
840
845 845
850 850
855 855
860 860
865 865
870 870
875 875
880 880
8500 9000 9500 10000 10500 11000 11500 12000 12500 13000 13500 14000 14500 15000
ELE
VA
TIO
N IN
FEET
(N
AV
D 8
8)
STREAM DISTANCE IN FEET ABOVE MOUTH
FED
ER
AL
EM
ER
GEN
CY
MA
NA
GEM
EN
T A
GEN
CY
RU
SH
CO
UN
TY
, IN
AN
D IN
CO
RP
OR
AT
ED
AR
EA
S
FLO
OD
PR
OFI
LES
SIX
MIL
E C
REEK
22P
A B C D
CO
UN
TY
RO
AD
10
00
WES
T
CO
UN
TY
RO
AD
80
0 N
OR
TH
LEGEND
0.2% ANNUAL CHANCE FLOOD
1% ANNUAL CHANCE FLOOD
2% ANNUAL CHANCE FLOOD
10% ANNUAL CHANCE FLOOD
STREAM BED
CROSS SECTION LOCATION
CO
UN
TY
BO
UN
DA
RY
E
LIM
IT O
F D
ET
AIL
ED
ST
UD
Y

845
850
855 855
860 860
865 865
870 870
875 875
880 880
885 885
890 890
14000 14500 15000 15500 16000 16500 17000 17500 18000 18500 19000 19500 20000 20500
ELE
VA
TIO
N IN
FEET
(N
AV
D 8
8)
STREAM DISTANCE IN FEET ABOVE MOUTH
FED
ER
AL
EM
ER
GEN
CY
MA
NA
GEM
EN
T A
GEN
CY
RU
SH
CO
UN
TY
, IN
AN
D IN
CO
RP
OR
AT
ED
AR
EA
S
FLO
OD
PR
OFI
LES
SIX
MIL
E C
REEK
23P
CO
UN
TY
RO
AD
10
00
WES
T
FOO
TB
RID
GE
LEGEND
0.2% ANNUAL CHANCE FLOOD
1% ANNUAL CHANCE FLOOD
2% ANNUAL CHANCE FLOOD
10% ANNUAL CHANCE FLOOD
STREAM BED
CROSS SECTION LOCATION
CO
UN
TY
BO
UN
DA
RY

855
860
865 865
870 870
875 875
880 880
885 885
890 890
895 895
900 900
19500 20000 20500 21000 21500 22000 22500 23000 23500 24000 24500 25000 25500 26000
ELE
VA
TIO
N IN
FEET
(N
AV
D 8
8)
STREAM DISTANCE IN FEET ABOVE MOUTH
FED
ER
AL
EM
ER
GEN
CY
MA
NA
GEM
EN
T A
GEN
CY
RU
SH
CO
UN
TY
, IN
AN
D IN
CO
RP
OR
AT
ED
AR
EA
S
FLO
OD
PR
OFI
LES
SIX
MIL
E C
REEK
24P
F
CO
UN
TY
RO
AD
90
0 N
OR
TH
CO
UN
TY
RO
AD
10
00
WES
T
LEGEND
0.2% ANNUAL CHANCE FLOOD
1% ANNUAL CHANCE FLOOD
2% ANNUAL CHANCE FLOOD
10% ANNUAL CHANCE FLOOD
STREAM BED
CROSS SECTION LOCATION

865
870
875 875
880 880
885 885
890 890
895 895
900 900
905 905
910 910
25000 25500 26000 26500 27000 27500 28000 28500 29000 29500 30000 30500 31000 31500
ELE
VA
TIO
N IN
FEET
(N
AV
D 8
8)
STREAM DISTANCE IN FEET ABOVE MOUTH
FED
ER
AL
EM
ER
GEN
CY
MA
NA
GEM
EN
T A
GEN
CY
RU
SH
CO
UN
TY
, IN
AN
D IN
CO
RP
OR
AT
ED
AR
EA
S
FLO
OD
PR
OFI
LES
SIX
MIL
E C
REEK
25P
G H I J
LEGEND
0.2% ANNUAL CHANCE FLOOD
1% ANNUAL CHANCE FLOOD
2% ANNUAL CHANCE FLOOD
10% ANNUAL CHANCE FLOOD
STREAM BED
CROSS SECTION LOCATION

875
880
885 885
890 890
895 895
900 900
905 905
910 910
915 915
920 920
30500 31000 31500 32000 32500 33000 33500 34000 34500 35000 35500 36000 36500 37000
ELE
VA
TIO
N IN
FEET
(N
AV
D 8
8)
STREAM DISTANCE IN FEET ABOVE MOUTH
FED
ER
AL
EM
ER
GEN
CY
MA
NA
GEM
EN
T A
GEN
CY
RU
SH
CO
UN
TY
, IN
AN
D IN
CO
RP
OR
AT
ED
AR
EA
S
FLO
OD
PR
OFI
LES
SIX
MIL
E C
REEK
26P
K L M
CO
UN
TY
RO
AD
10
00
NO
RT
H
LEGEND
0.2% ANNUAL CHANCE FLOOD
1% ANNUAL CHANCE FLOOD
2% ANNUAL CHANCE FLOOD
10% ANNUAL CHANCE FLOOD
STREAM BED
CROSS SECTION LOCATION
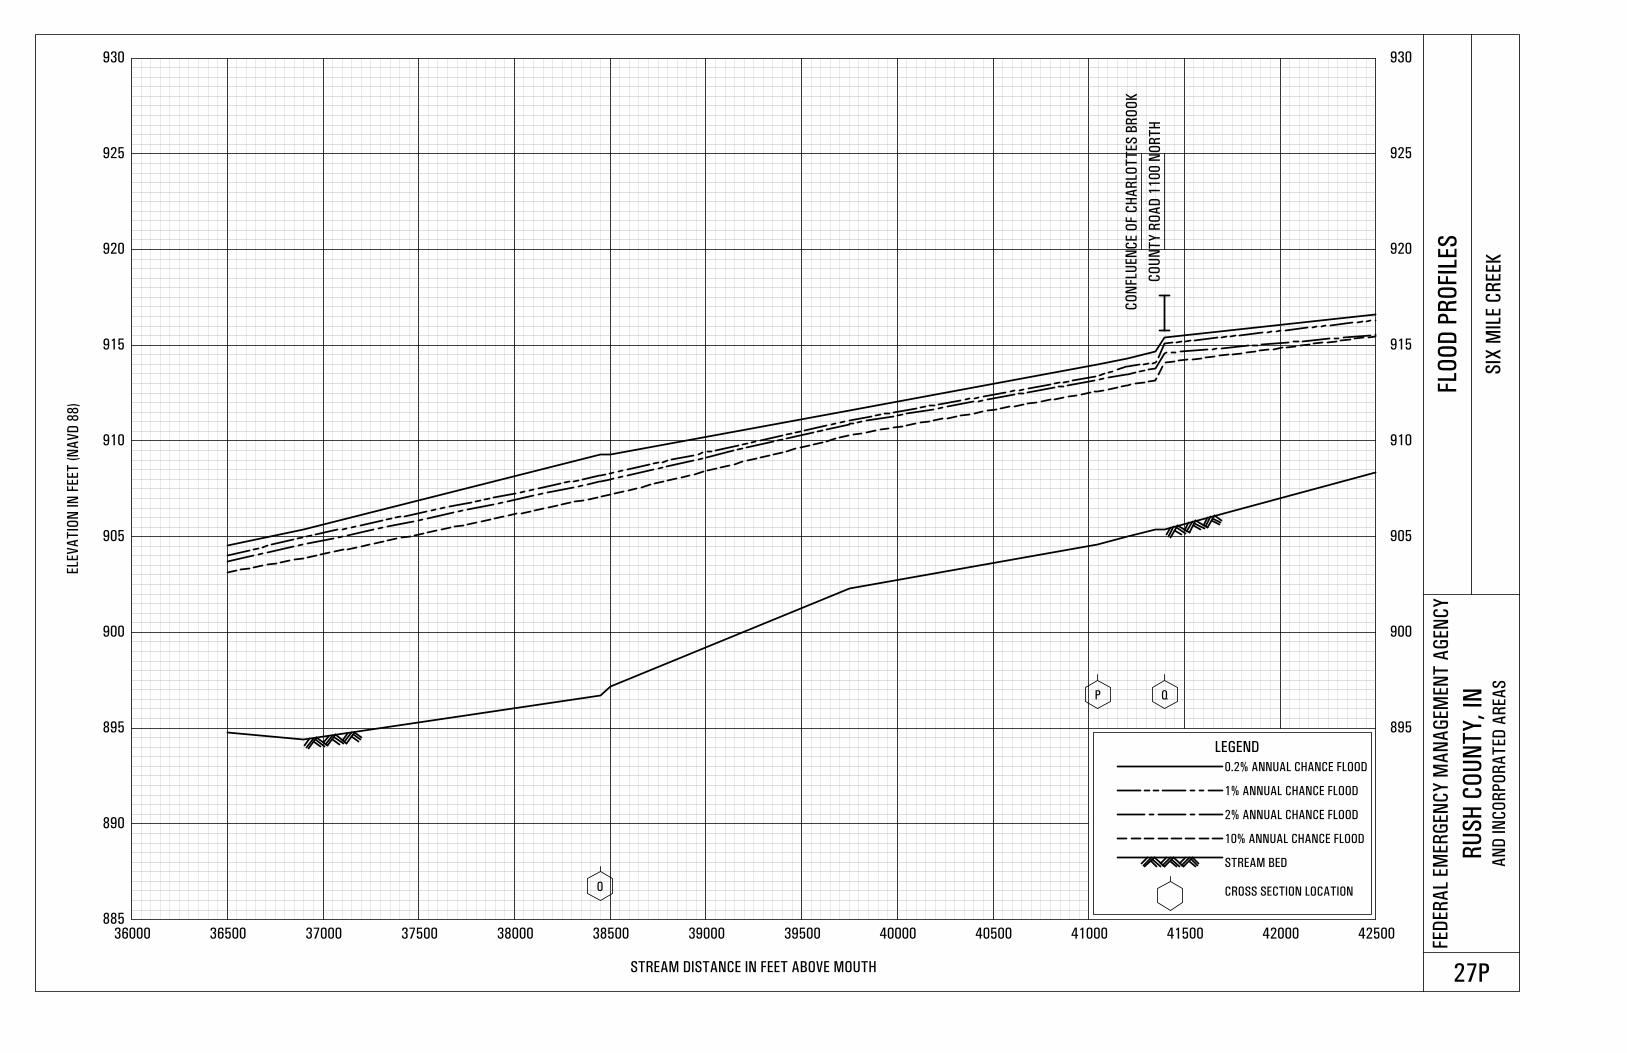
885
890
895 895
900 900
905 905
910 910
915 915
920 920
925 925
930 930
36000 36500 37000 37500 38000 38500 39000 39500 40000 40500 41000 41500 42000 42500
ELE
VA
TIO
N IN
FEET
(N
AV
D 8
8)
STREAM DISTANCE IN FEET ABOVE MOUTH
FED
ER
AL
EM
ER
GEN
CY
MA
NA
GEM
EN
T A
GEN
CY
RU
SH
CO
UN
TY
, IN
AN
D IN
CO
RP
OR
AT
ED
AR
EA
S
FLO
OD
PR
OFI
LES
SIX
MIL
E C
REEK
27P
O
P Q
CO
NFL
UEN
CE O
F C
HA
RLO
TT
ES
BR
OO
K
CO
UN
TY
RO
AD
11
00
NO
RT
H
LEGEND
0.2% ANNUAL CHANCE FLOOD
1% ANNUAL CHANCE FLOOD
2% ANNUAL CHANCE FLOOD
10% ANNUAL CHANCE FLOOD
STREAM BED
CROSS SECTION LOCATION

895
900
905 905
910 910
915 915
920 920
925 925
930 930
935 935
940 940
42000 42500 43000 43500 44000 44500 45000 45500 46000 46500 47000 47500 48000 48500
ELE
VA
TIO
N IN
FEET
(N
AV
D 8
8)
STREAM DISTANCE IN FEET ABOVE MOUTH
FED
ER
AL
EM
ER
GEN
CY
MA
NA
GEM
EN
T A
GEN
CY
RU
SH
CO
UN
TY
, IN
AN
D IN
CO
RP
OR
AT
ED
AR
EA
S
FLO
OD
PR
OFI
LES
SIX
MIL
E C
REEK
28P
R S
CO
UN
TY
BO
UN
DA
RY
LEGEND
0.2% ANNUAL CHANCE FLOOD
1% ANNUAL CHANCE FLOOD
2% ANNUAL CHANCE FLOOD
10% ANNUAL CHANCE FLOOD
STREAM BED
CROSS SECTION LOCATION
LIM
IT O
F D
ET
AIL
ED
ST
UD
Y
T U
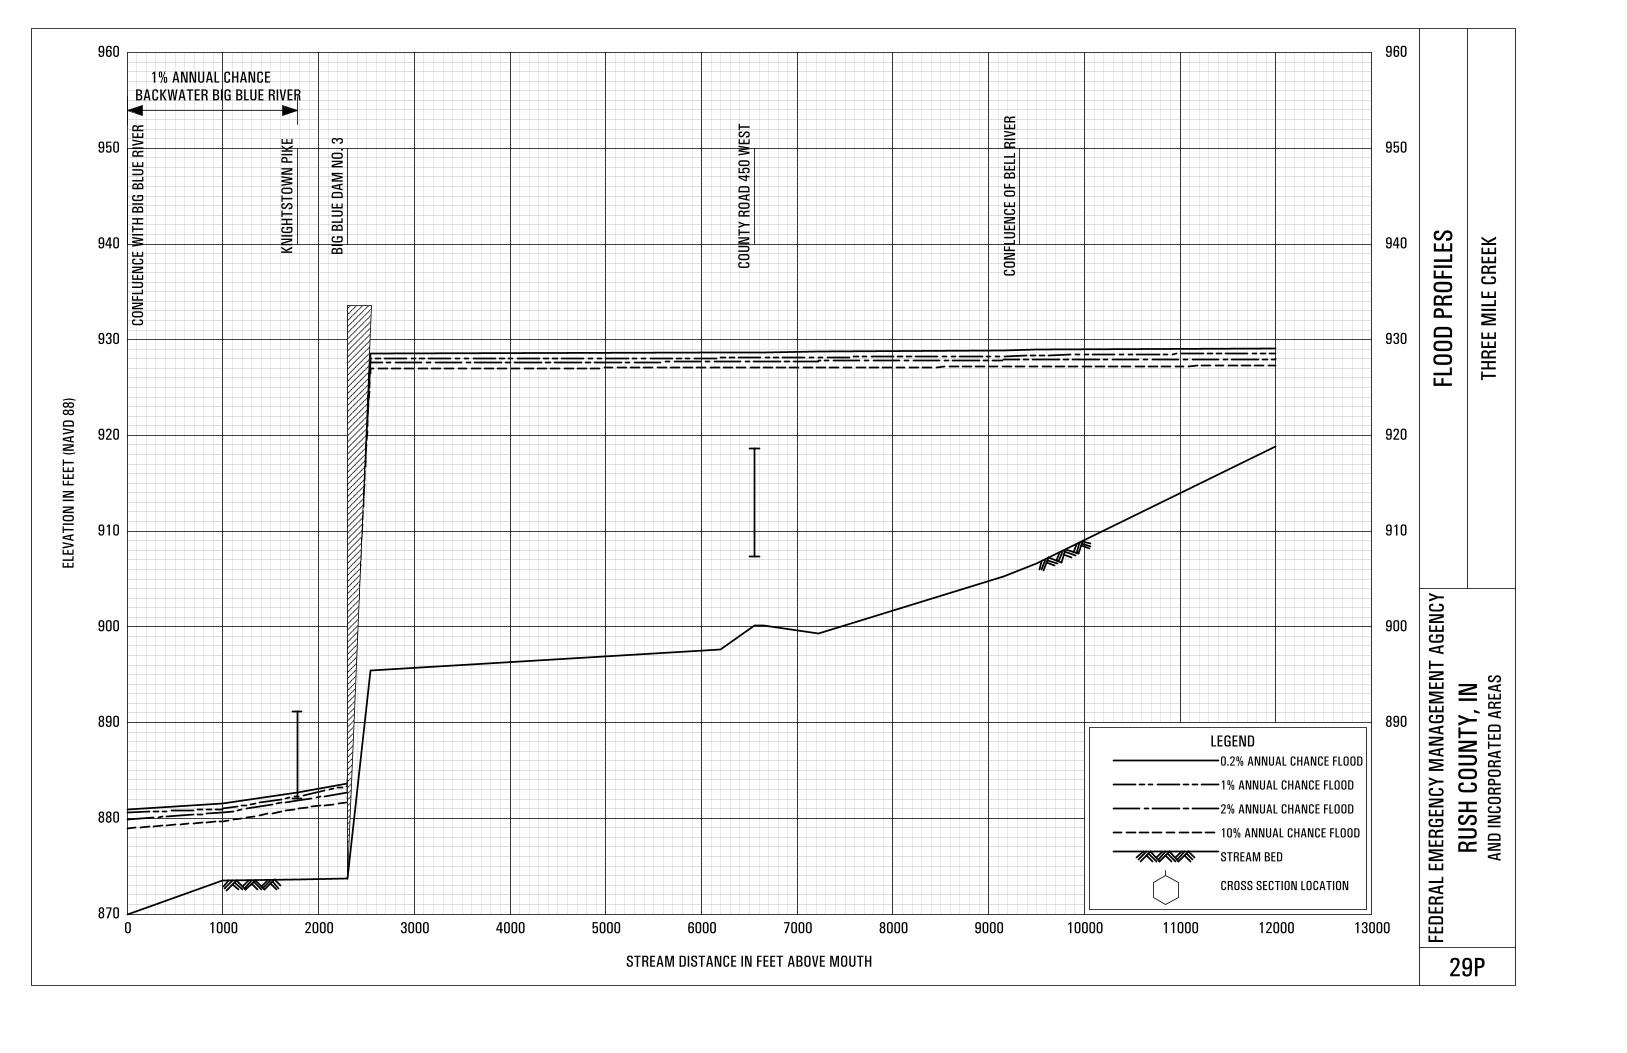
870
880
890 890
900 900
910 910
920 920
930 930
940 940
950 950
960 960
0 1000 2000 3000 4000 5000 6000 7000 8000 9000 10000 11000 12000 13000
ELE
VA
TIO
N IN
FEET
(N
AV
D 8
8)
STREAM DISTANCE IN FEET ABOVE MOUTH
FED
ER
AL
EM
ER
GEN
CY
MA
NA
GEM
EN
T A
GEN
CY
RU
SH
CO
UN
TY
, IN
AN
D IN
CO
RP
OR
AT
ED
AR
EA
S
FLO
OD
PR
OFI
LES
TH
REE M
ILE C
REEK
29P
KN
IGH
TS
TO
WN
PI K
E
BI G
BLU
E D
AM
NO
. 3
CO
UN
TY
RO
AD
45
0 W
ES
T
CO
NFL U
EN
CE O
F B
ELL
RIV
ER
LEGEND
0.2% ANNUAL CHANCE FLOOD
1% ANNUAL CHANCE FLOOD
2% ANNUAL CHANCE FLOOD
10% ANNUAL CHANCE FLOOD
STREAM BED
CROSS SECTION LOCATION
BACKWATER BIG BLUE RIVER
1% ANNUAL CHANCE
CO
NFLU
EN
CE W
ITH
BIG
BLU
E R
IVER

915
920
925 925
930 930
935 935
940 940
945 945
950 950
955 955
960 960
11500 12000 12500 13000 13500 14000 14500 15000 15500 16000 16500 17000 17500 18000
ELE
VA
TIO
N IN
FEET
(N
AV
D 8
8)
STREAM DISTANCE IN FEET ABOVE MOUTH
FED
ER
AL
EM
ER
GEN
CY
MA
NA
GEM
EN
T A
GEN
CY
RU
SH
CO
UN
TY
, IN
AN
D IN
CO
RP
OR
AT
ED
AR
EA
S
FLO
OD
PR
OFI
LES
TH
REE M
ILE C
REEK
30P
A B C D
CA
MP
GR
OU
ND
DA
M
CO
UN
TY
RO
AD
40
0 W
ES
T
LEGEND
0.2% ANNUAL CHANCE FLOOD
1% ANNUAL CHANCE FLOOD
2% ANNUAL CHANCE FLOOD
10% ANNUAL CHANCE FLOOD
STREAM BED
CROSS SECTION LOCATION

930
935
940 940
945 945
950 950
955 955
960 960
965 965
970 970
975 975
17000 17500 18000 18500 19000 19500 20000 20500 21000 21500 22000 22500 23000 23500
ELE
VA
TIO
N IN
FEET
(N
AV
D 8
8)
STREAM DISTANCE IN FEET ABOVE MOUTH
FED
ER
AL
EM
ER
GEN
CY
MA
NA
GEM
EN
T A
GEN
CY
RU
SH
CO
UN
TY
, IN
AN
D IN
CO
RP
OR
AT
ED
AR
EA
S
FLO
OD
PR
OFI
LES
TH
REE M
ILE C
REEK
31P
E F
H
PR
IVA
TE R
OA
D
CO
UN
TY
RO
AD
36
0 W
ES
TLEGEND
0.2% ANNUAL CHANCE FLOOD
1% ANNUAL CHANCE FLOOD
2% ANNUAL CHANCE FLOOD
10% ANNUAL CHANCE FLOOD
STREAM BED
CROSS SECTION LOCATIONG
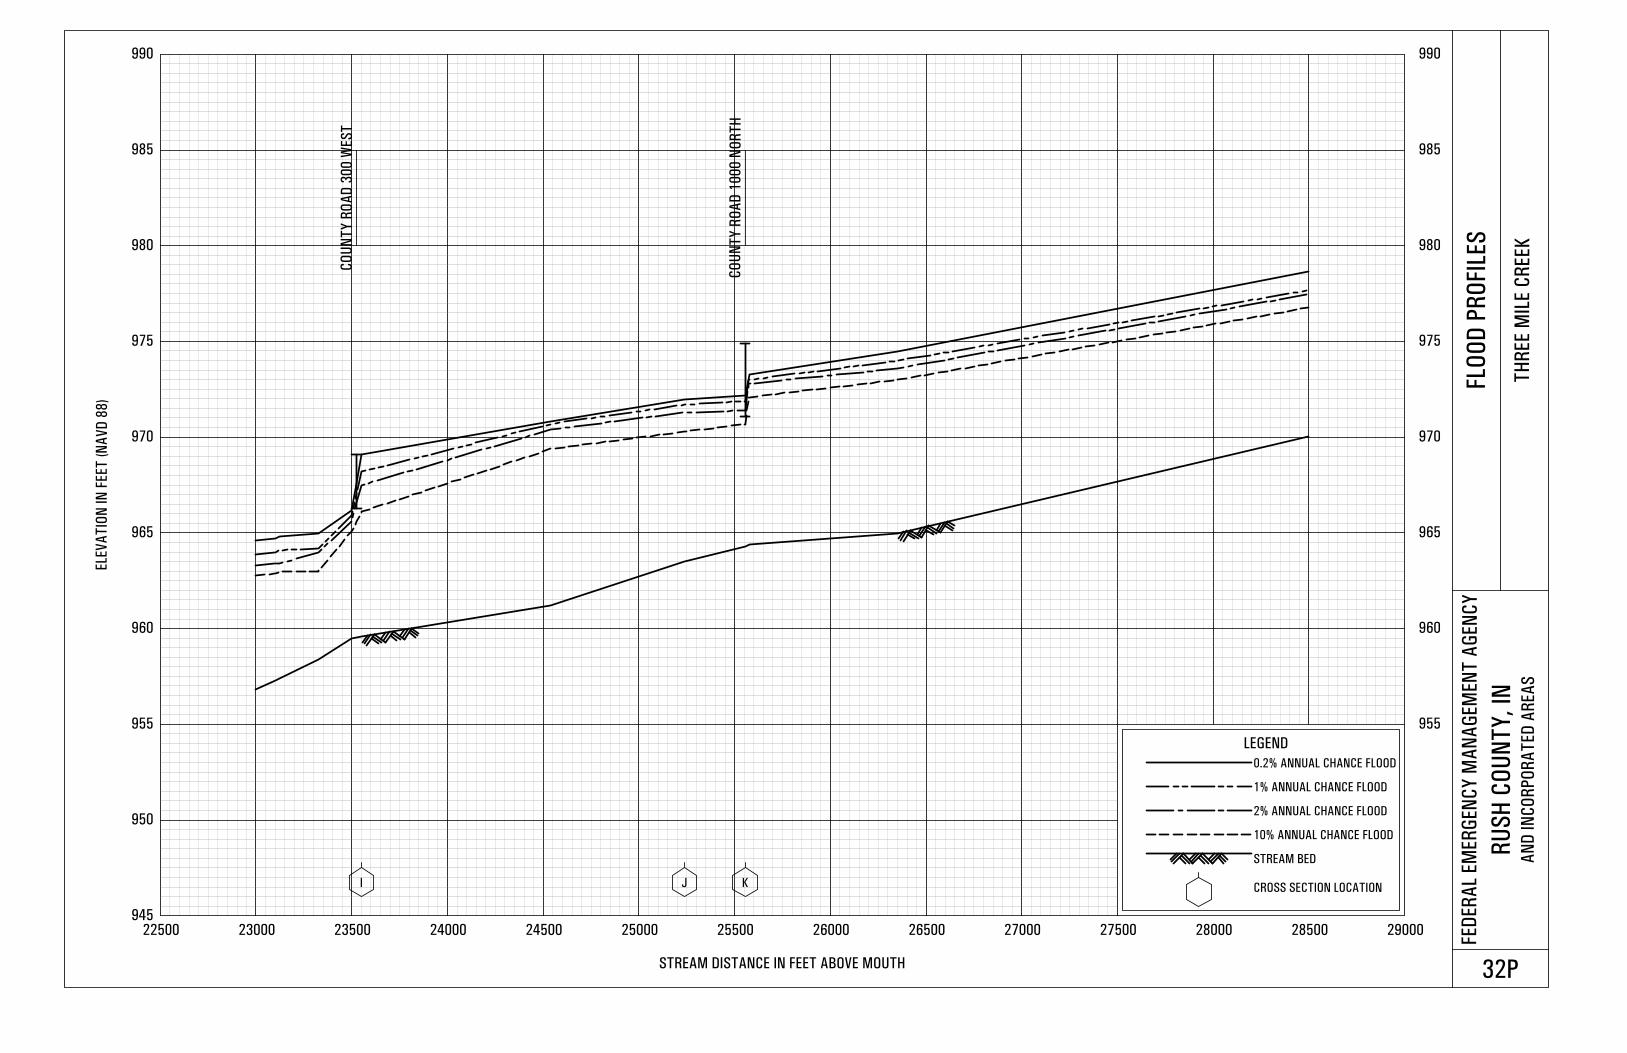
945
950
955 955
960 960
965 965
970 970
975 975
980 980
985 985
990 990
22500 23000 23500 24000 24500 25000 25500 26000 26500 27000 27500 28000 28500 29000
ELE
VA
TIO
N IN
FEET
(N
AV
D 8
8)
STREAM DISTANCE IN FEET ABOVE MOUTH
FED
ER
AL
EM
ER
GEN
CY
MA
NA
GEM
EN
T A
GEN
CY
RU
SH
CO
UN
TY
, IN
AN
D IN
CO
RP
OR
AT
ED
AR
EA
S
FLO
OD
PR
OFI
LES
TH
REE M
ILE C
REEK
32P
I J K
CO
UN
TY
RO
AD
30
0 W
ES
T
CO
UN
TY
RO
AD
10
00
NO
RT
HLEGEND
0.2% ANNUAL CHANCE FLOOD
1% ANNUAL CHANCE FLOOD
2% ANNUAL CHANCE FLOOD
10% ANNUAL CHANCE FLOOD
STREAM BED
CROSS SECTION LOCATION

960
965
970 970
975 975
980 980
985 985
990 990
995 995
1000 1000
1005 1005
28000 28500 29000 29500 30000 30500 31000 31500 32000 32500 33000 33500 34000 34500
ELE
VA
TIO
N IN
FEET
(N
AV
D 8
8)
STREAM DISTANCE IN FEET ABOVE MOUTH
FED
ER
AL
EM
ER
GEN
CY
MA
NA
GEM
EN
T A
GEN
CY
RU
SH
CO
UN
TY
, IN
AN
D IN
CO
RP
OR
AT
ED
AR
EA
S
FLO
OD
PR
OFI
LES
TH
REE M
ILE C
REEK
33P
L M N O P
CO
UN
TY
RO
AD
25
0 W
ES
T
LEGEND
0.2% ANNUAL CHANCE FLOOD
1% ANNUAL CHANCE FLOOD
2% ANNUAL CHANCE FLOOD
10% ANNUAL CHANCE FLOOD
STREAM BED
CROSS SECTION LOCATION
LIM
IT O
F D
ET
AIL
ED
ST
UD
Y