Embed Size (px)
Citation preview
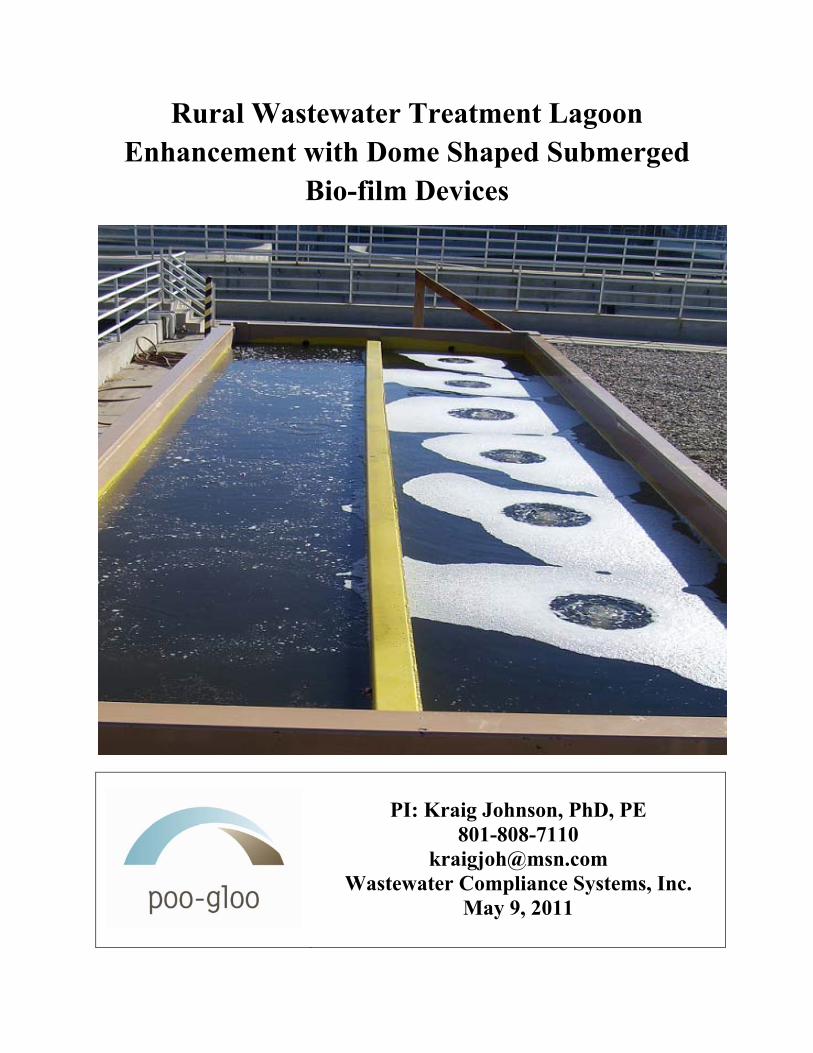
Rural Wastewater Treatment Lagoon Enhancement with Dome Shaped Submerged
Bio-film Devices
PI: Kraig Johnson, PhD, PE
801-808-7110 [email protected]
Wastewater Compliance Systems, Inc. May 9, 2011
Wastewater Compliance Systems, Inc Proprietary Information ©2011 1
Table of Contents
Acknowledgements………………………………………………………………………. 6
Executive Summary……………………………………………………………………… 7
Technical Objectives…………………………………………………………………….. 10
Background………………………………………………………………………………. 11
Results and Accomplishments…………………………………………………………… 14
Commercialization Plan………………………………………………………………….. 48
Conclusions………………………………………………………………………………. 56
Appendices………………………………………………………………………………. 57
Wastewater Compliance Systems, Inc Proprietary Information ©2011 2
List of Acronyms
ALK: Alkalinity
BOD: Biochemical Oxygen Demand
COD: Chemical Oxygen Demand
CVWRF: Central Valley Water Reclamation Facility
DO: Dissolved Oxygen
ORP: Oxidation / Reduction Potential
PG: Poo-Gloo
TN: Total Nitrogen
TP: Total Phosphorus
TSS: Total Suspended Solids
USDA: United States Department of Agriculture
SBIR: Small Business Innovative Research Program
Wastewater Compliance Systems, Inc Proprietary Information ©2011 3
Figures
Figure 1: Cross section of a Poo-Gloo with four nested domes + polypropylene pall rings
Figure 2: Overview of the dual chamber reactor tank
Figure 3: Reactor tanks in operation since mid-October, 2010
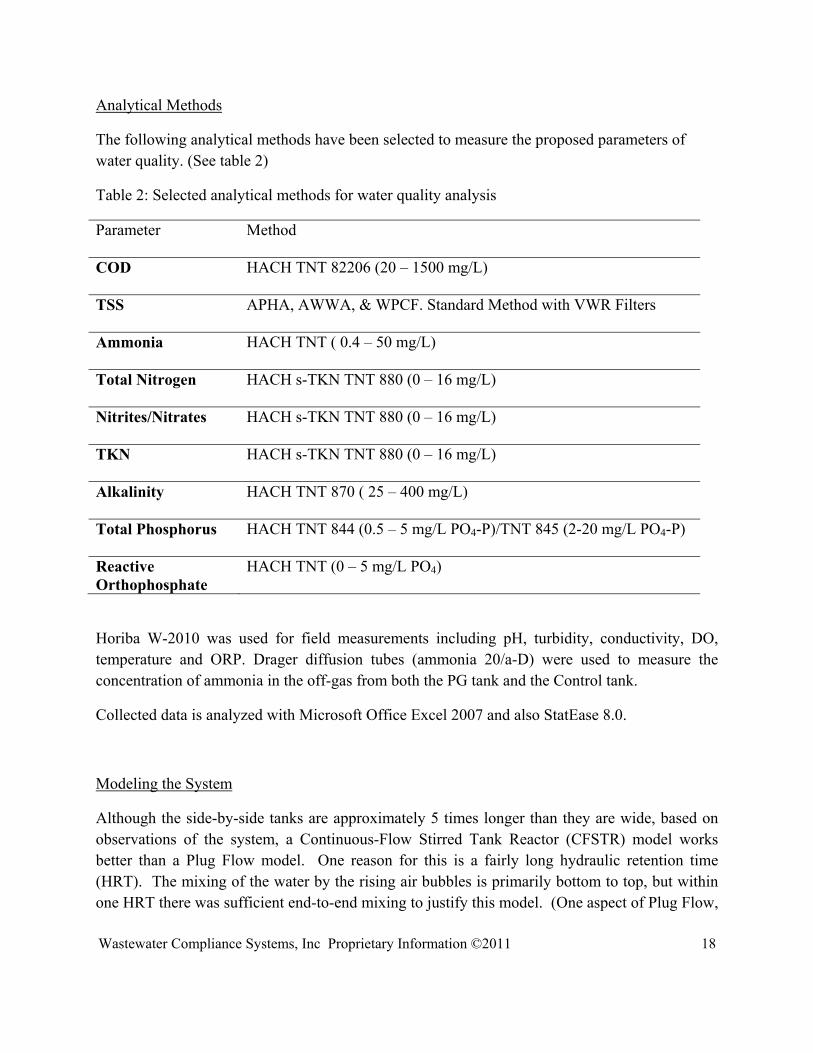
Figure 4: Week 1- 8 of oxygen demand results, measured as COD
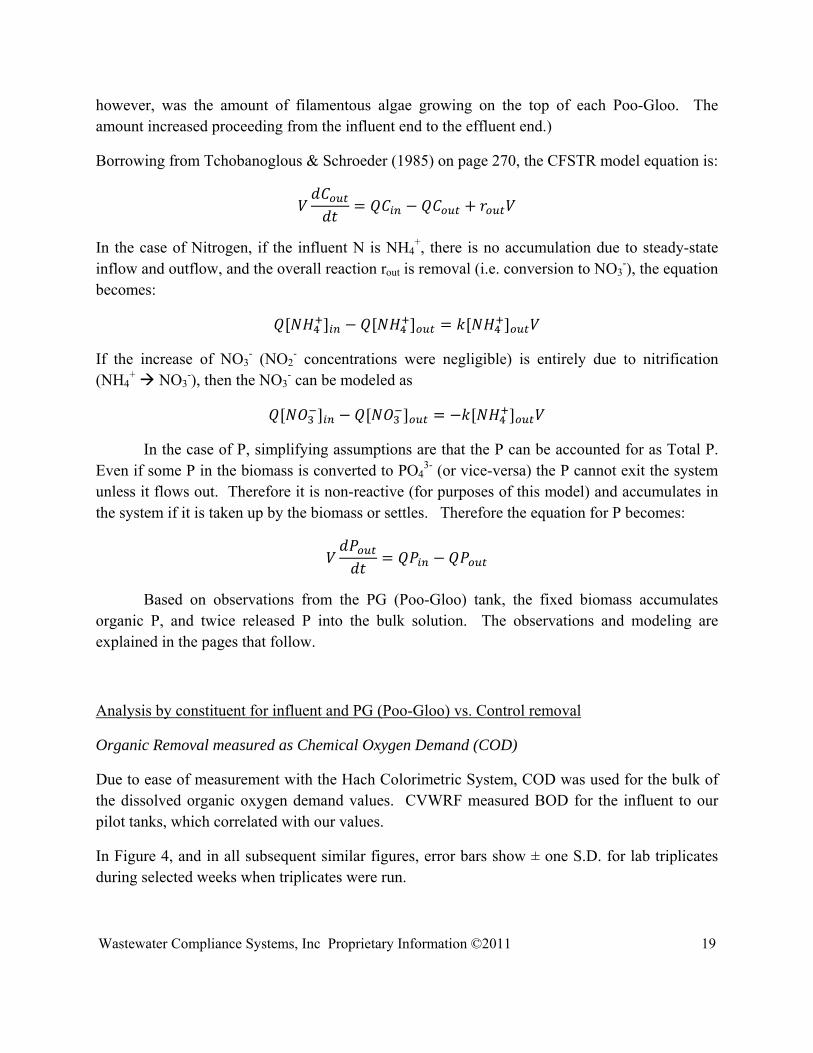
Figure 5: Week 9 - 17 of oxygen demand results, measured as COD
Figure 6: COD percentage removal from influent to effluent, PG vs. Control
Figure 7: Week 1 - 8 of TSS results
Figure 8: Week 9 – 17 of TSS results
Figure 9: TSS percentage removal from influent to effluent PG vs. Control
Figure 10: Measurement of volatized ammonia in off-gas
Figure 11: Week 1 - 8 of ammonium results
Figure 12: Week 9 - 17 of ammonium results
Figure 13: Ammonium percentage removal from influent to effluent, PG tank vs. Control tank
Figure 14: Week 1 - 8 of NO3-/NO2
- results
Figure 15: Week 9 – 17 of NO3-/NO2
- results
Figure 16: Week 1 – 8 of Total Nitrogen results
Figure 17: Week 9 – 17 of Total Nitrogen results
Figure 18: Total Nitrogen percentage removal from influent to effluent, PG vs. Control
Figure 19: Week 1- 10 of Alkalinity results
Figure 20: Wintertime operation - PG tank is on the left, and Control tank is on the right
Figure 21: Week 1 – 8 of Total P results
Figure 22: Week 9 - 17 Total P results
Figure 23: Total Phosphorous percentage removal from influent to effluent, PG vs. Control
Wastewater Compliance Systems, Inc Proprietary Information ©2011 4
Figure 24: Details of PG interior after 17 weeks
Figure 25: Week 1 – 8 of Ortho P results
Figure 26: Week 9 – 17 of Ortho-P results
Figure 27: Side by side PG and Control tanks viewed from effluent end
Figure 28: Close up of filamentous algae on PG farthest from the influent point around week 16
Figure 29: Close up of Control tank at point farthest from influent around week 16
Wastewater Compliance Systems, Inc Proprietary Information ©2011 5
Tables
Table 1: Weekly variations in operational parameters
Table 2: Selected analytical methods for water quality analysis
Table 3: Influent daily loading, PG and Control tank daily removal by week, and 17 week totals for COD and TSS
Table 4: Influent daily loading, PG and Control tank daily removal by week, and 17 week total for Nitrogen compounds
Table 5: Data correlation for nitrification parameters from October, 2010 to February, 2011
Table 6: Influent daily loading, PG and Control tank daily removal by week, and 17 week totals for Phosphorous compounds
Table 7: Marketplace Competition Comparisons
Wastewater Compliance Systems, Inc Proprietary Information ©2011 6
Acknowledgements
This project was completed with funds from a USDA SBIR Phase I grant.
We would like to thank the reviewers and staff at the SBIR office for seeing the value and application of this research, and the USDA for the funding of this project.
We are also grateful to Reed Fisher, and all the workers at Central Valley Water Reclamation Facility, in Salt Lake City, Utah for supporting us with the necessary facilities to perform this research.
Thanks also to Dr. Otakuye Conroy-Ben and her students in the Department of Civil and Environmental Engineering at the University of Utah for lab and logistical support.
Wastewater Compliance Systems, Inc Proprietary Information ©2011 7
Executive Summary:
WCS, Inc, with funding from a USDA SBIR Phase I grant, ran a pilot study from 25 October 2010 to 17 February, 2011. The purpose of this research project was to show that dome shaped, aerated, submerged biofilm devices are a viable retrofit for existing rural wastewater treatment lagoons. A partitioned pilot scale reactor tank was used to test performance of six dome shaped submerged biofilm devices (called Poo-Gloos) alongside six identical concrete bases with bubble releasing tubes (but without domes). Previous research work has confirmed the ability and effectiveness of Poo-Gloos to remove organics and ammonia nitrogen. In this research, more water quality parameters were tested in order to gain better knowledge of the nitrogen balance and phosphorus balance in the process of wastewater treatment using Poo-Gloos. Air cycling on/off in a plug flow reactor (PFR) mode was conducted to enhance nitrogen removal and phosphorus uptake/release as well as a means of saving energy. This research focused on cold wintertime operations, which is a major concern for most wastewater treatment lagoons at higher latitudes.
Lagoon systems that do not meet discharge requirements in the United States are generally replaced with expensive mechanical treatment plants. There is no equivalent product designed to improve the performance of existing lagoon systems. The low cost of the dome structures should allow inexpensive upgrades of existing lagoons and avoid the expensive replacement with a mechanical plant. The proposed work fulfills public interest by providing lagoon operators with a new, cost effective means to remain in regulatory compliance. Initial commercial deployment is targeted to small rural communities with populations of 500-5,000 that cannot afford to amortize high capital and operating cost of conventional mechanical treatment plants among a few hundred households. Another benefit of our system is that it can be incrementally installed within annual operating budgets to meet community growth and/or compliance objectives, without having to incur long term debt or other major bonding issues. Finally, the technical skills required to service and maintain the modules comfortably match existing lagoon operators in small rural communities.
The purpose of this wintertime study was to compare the performance of six scaled Poo-Gloos (PGs) to a Control in cold temperatures. The test unit is the size of a commercial dumpster and is divided lengthwise into two parallel tanks. One tank holds the six PGs, and the other is a Control that consists of six bubble release tubes only on the bottom of the tank in the same position as the bubble release tubes under the PGs. The same air flow rates and the same wastewater influent flow rates were introduced to both tanks. The experiment ran for 17 weeks. The most interesting results were at the startup (weeks 1 - 4) and at a mature bio-film steady state (weeks 12 - 15). Other weeks were spent adjusting the flow rates to determine optimal Hydraulic Detention Time (HRT), resetting the system, and winterizing the tanks. During weeks 1 – 4 the air was on 24 hours per day. During weeks 12 and 13, the air was cycled on 22/off 2 hours per day. During week 14 the air was cycled on 21/off 3 hours per day and during week 15
Wastewater Compliance Systems, Inc Proprietary Information ©2011 8
the air was cycled on 20/off 4 hours per day. The purpose of this was to promote de-nitrification and phosphorous uptake. The results of the pilot study for the removal of organic carbon (measured as COD), total suspended solids (TSS), ammonium (NH4+), total nitrogen (TN) and total phosphorous (TP) during the startup and steady state weeks are shown below.
COD removal:
At the beginning of week 1, the PG Tank and the Control Tank had similar organic carbon (measured as COD) removal rates. As the biofilm developed on the surfaces of the PGs, the performance began to diverge. By weeks 3 and 4, the Control Tank effluent was around 100 mg/L, whereas the PG Tank effluent was around 50 mg/L. During the steady state weeks 12 – 15, the Control Tank effluent increased to around 150 mg/L, but the PG Tank Effluent remained at 50 mg/L. The presence of the aerated biofilm in the domes removed most of the biologically oxidizable material from the wastewater at winter temperatures.
TSS removal:
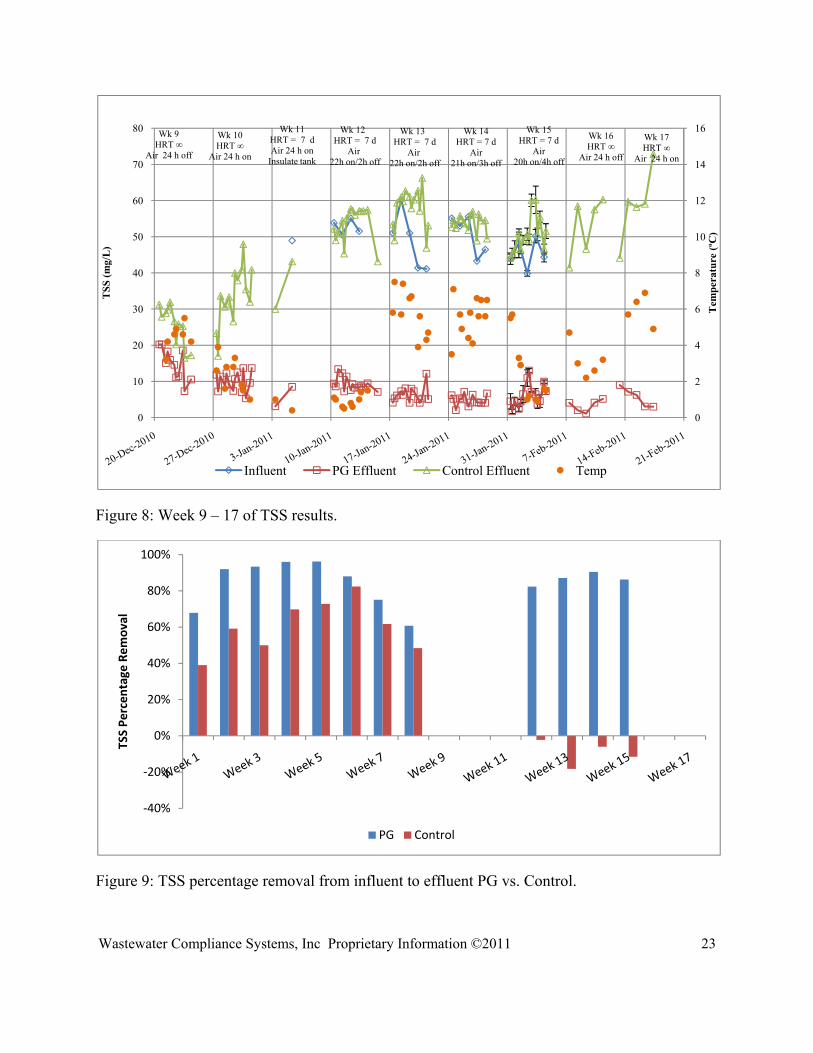
Again, performance at the beginning of week 1 for the PG vs Control Tanks was similar for TSS removal. By week 4 the PG Tank was removing almost all the TSS, while the Control Tank effluent was around 20 mg/L. During weeks 12 – 15, the difference was even more dramatic, with the average PG Tank effluent less than 10 mg/L and the Control Tank effluent between 50 to 60 mg/L. The main reason for the difference is that the Control Tank was full of suspended growth, whereas the PG Tank biomass was fixed inside the domes and didn’t wash out with the effluent.
Ammonium removal:
Biological nitrification is the desired removal mechanism to get rid of ammonium in wastewater, but for suspended growth, the necessary bacteria are suppressed at cold temperatures. The aerated fixed film biomass inside the domes allows nitrifiers to remain active at temperatures down to near freezing. At the start of the experiment the nitrifying biofilm was not well established, but by week 3, there was a dramatic increase in the removal rate, and by week 4, most of the ammonium was removed from the PG Tank effluent. This occurred despite temperatures less than 10 degrees C. Note that the Control Tank effluent showed no removal during week 3 and a slight removal during week 4.
Because nitrification has a high oxygen demand, cycling aeration off decreases the amount of ammonia removed. This is apparent during the steady state period of weeks 12 to 15 when the air off period was increased from 2 to 3 to 4 hours per day. The stair-step effect on the ammonia concentrations in the PG Tank effluent is apparent. Week 12 shows the strength of the biological dome design with moderate air cycling. At temperatures around 1 to 1.5 degrees C, with influent
Wastewater Compliance Systems, Inc Proprietary Information ©2011 9
ammonia at 25 mg/L, the PG Tank effluent was 2 mg/L and the Control Tank effluent was 20 mg/L.
Total Nitrogen removal:
The purpose of air cycling in the Poo-Gloos is to increase the de-nitrification rates. The bacteria that accomplish de-nitrification are suppressed by the presence of oxygen, so the air-off periods allow them to increase their metabolic rate. However, during air-off periods, the metabolic rate of the oxygen dependent nitrifying bacteria is suppressed. The removal of both ammonium and nitrate/nitrite can be accomplished by finding the right balance between the air on and air off periods. Since the Total Nitrogen (TN) value measures ammonium plus nitrate/nitrite (as well as organic N), a minimum value of TN would indicate the optimum air cycling. During weeks 1 – 4 the air was on 24 hours per day and by weeks 3 - 4 the PG Tank effluent TN levels were around 17 to 18 mg/L. For weeks 12 – 15, the air off period was gradually increased from 2 hours off to 4 hours off per day. As the air off period increased, the PG Tank effluent ammonium levels increased 2 to 3 mg/L, but the nitrate/nitrite concentrations dropped 5 to 10 mg/L. The overall effect on TN was that the best removal occurred during week 15, with TN levels of around 14 mg/L. The Control Tank was not responsive to air cycling.
Total Phosphorous uptake/release:
The air cycling during weeks 12 – 15 promoted the uptake of P from the wastewater stream. During this 4 week period, the biofilm in the PGs took up about 20 g of P. During week 16, the air was off for the entire seven days, and the biofilm released 5 g of P. During week 17, the air was turned back on, and the 5 g of P was taken back up by the biofilm. Thus the ability of the bio-film in the Poo-Gloos to uptake P during periods of discharge to a receiving water from a pond, and then release P during periods of diversion of effluent for storage/land application is demonstrated.
Wastewater Compliance Systems, Inc Proprietary Information ©2011 10
Technical Objectives:
Technical Objectives for the Phase I research were:
1. Upgrade pilot plant with 6 new scale Poo-Gloos (outer domes 1.6’ radius) and parallel paths for simultaneous control runs.
Progress: Done. See Figures 2 and 3 on page 15. 2. Verify previous work for CBOD and NH4
+ removal rates while establishing biofilm on new Poo-Gloos.
Progress: Done. Figures 4 through 6 show the carbonaceous oxygen demand removal (as COD), and Figures 11 through 13 show the NH4
+ removal. Removal rates are discussed in the associated text.
3. Begin a series of controlled runs that vary air cycling times, organic and hydraulic loading rates, and temperature.
Progress: We ran the pilot for 17 weeks to begin to understand the proper HRT and air cycling times to get the system to respond with N removal and P uptake and release. Weekly variations in operational parameters are shown in Table 1.
4. Analyze results and modify factors to optimize N removal through nitrification and de-nitrification.
Progress: We have a good start. The results are shown in Figures 16 – 18 for TN removal in this report. Following the Design of Experiment for Phase II should get us a lot closer to optimization.
5. Analyze results and modify factors to optimize P uptake and release. Progress: Maximum TP uptake occurred with an HRT of 7 days and an air cycling regime of
22 hours ON/2 hours OFF during January, 2011. See Figures 21 through 23 for details on P uptake and release.
6. Perform statistical analysis on all results to show significant results. Progress: Paired T-tests were run for each of the constituents measured (TSS, COD, TN,
NH4+, NO2
-/NO3-, ALK, TP, PO4
3-) comparing influent to PG effluent, influent to Control effluent, and PG effluent to Control effluent. The PG (Poo-Gloo) tank out-performed the Control in almost every category. The results of PG effluent to Control effluent are shown on pages 44, 45 and 46 in this document.
7. Write report, and develop preliminary Operations Manual for full-scale applications. Progress: This document is the final Phase-I report, and we are working on the Operations
Manual. 8. Begin preliminary monitoring of full scale application (35 Poo-Gloos, each 6’ diameter at
base and 4’ high dome) in Wellsville, Utah. Progress: Wellsville has agreed to add 40 more PGs for a total of 75. The system should be
ready to run by July, 2011.
Wastewater Compliance Systems, Inc Proprietary Information ©2011 11
Background: Overview
This research fit well with the USDA Air, Water and Soils (Topic Area 8.4) research priorities in the area of water conservation and reuse. The proposed technology that was tested consists of submerged bio-domes (nicknamed Poo-Gloos) that reduce the nutrient load of wastewater discharged from rural municipal treatment lagoons, making this water more suitable for discharge or reuse. While the devices researched have shown good performance in the removal of carbonaceous oxygen demand compounds and nitrogen compounds, the specific area of research for this proposal was the uptake and release of phosphorous compounds. Other potential future applications are dairy and feedlot waste lagoons, and reduction in ammonium concentrations to improve the water quality in fish farms.
The Poo-Gloo devices are efficient biological aerators because they put the air directly against the bio-film. In one potential application, the Poo-Gloo installation would use half the power required by pontoon mounted aerators (a competing technology).
Additionally, the Poo-Gloo devices can be manufactured in rural areas in the United States. The concrete base and plastic dome set manufacture and assembly are ideally suited to small facilities already in existence and underutilized. For example, the ABS plastic domes are currently formed at a small plastics shop in Tooele, Utah, population 30,120. The concrete bases are poured and the devices are assembled at an 11 acre farm in Lehi, Utah, and are installed in Wellsville City, population 3260, located in the rural southwest portion of Cache Valley in northern Utah.
This report is for activities funded by a USDA SBIR Phase I award to WCS, Inc in 2010. Kraig Johnson was the PD, and the title of the application was “Rural Wastewater Treatment Lagoon Enhancement with Dome Shaped Submerged Bio-film Devices.”
Lagoon systems are the primary form of wastewater treatment for rural communities. In the United States, there are approximately 7000 communities with lagoon systems (EPA 2002). As these communities grow, and as discharge requirements become increasingly stringent, the lagoon systems are often unable to meet the new discharge requirements. To protect the surface waterways in the United States, these requirements mandate reductions in nitrogen (N) and phosphorous (P) compounds (usually referred to as nutrients).
Lagoons can be effective at reducing Biochemical Oxygen Demand (BOD) and Total Suspended Solids (TSS), provided they are not overloaded. They often fail to remove nutrients, particularly in cold climates. The bacteria that remove N compounds (through nitrification and de-nitrification) are slower growing, and are out-competed by algae and BOD consuming bacteria (heterotrophs). In suspended growth form, they are also inactive at temperatures below 10˚ C.
Lagoons are also ineffective at removing P compounds, often times due to complicated interactions between aquatic plant growth, benthic cycling and seasonal variations. Beneficial bacteria can take up organic P from the water, and either settle to the bottom or re-release the P
Wastewater Compliance Systems, Inc Proprietary Information ©2011 12
in the water column. Some classes of bacteria will uptake excess P and are referred to as Polyphosphate Accumulating Organisms (PAOs).
Bacteria are the workhorses of the environment, breaking down undesirable compounds and making the resulting elements or simpler compounds available for use by other organisms. The proliferation of these beneficial bacteria can be greatly enhanced in an aquatic environment by the addition of colonizable surface area to promote the growth of bio-film. Ideally this surface area will be blocked from the sunlight to prevent algae growth, will provide for the circulation of nutrients past the bio-film, and in the case of aerobic bacteria, lots of air bubbles to oxygenate the bio-film.
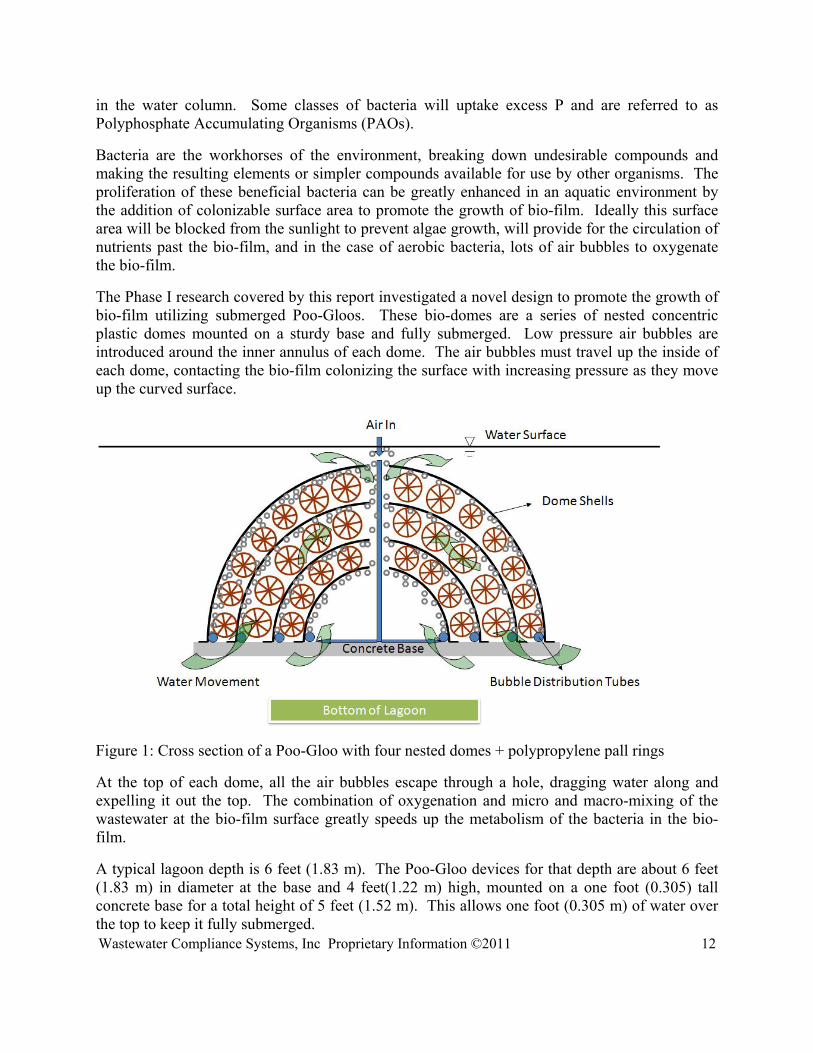
The Phase I research covered by this report investigated a novel design to promote the growth of bio-film utilizing submerged Poo-Gloos. These bio-domes are a series of nested concentric plastic domes mounted on a sturdy base and fully submerged. Low pressure air bubbles are introduced around the inner annulus of each dome. The air bubbles must travel up the inside of each dome, contacting the bio-film colonizing the surface with increasing pressure as they move up the curved surface.
Figure 1: Cross section of a Poo-Gloo with four nested domes + polypropylene pall rings
At the top of each dome, all the air bubbles escape through a hole, dragging water along and expelling it out the top. The combination of oxygenation and micro and macro-mixing of the wastewater at the bio-film surface greatly speeds up the metabolism of the bacteria in the bio-film.
A typical lagoon depth is 6 feet (1.83 m). The Poo-Gloo devices for that depth are about 6 feet (1.83 m) in diameter at the base and 4 feet(1.22 m) high, mounted on a one foot (0.305) tall concrete base for a total height of 5 feet (1.52 m). This allows one foot (0.305 m) of water over the top to keep it fully submerged.
Wastewater Compliance Systems, Inc Proprietary Information ©2011 13
Literature Review
Conventional biological nitrogen removal from wastewater is accomplished by two broad classes of bacteria, the nitrifiers ( , ) and the de-nitrifiers ( , . It has been extensively studied and well established in activated sludge systems. Nitrification is an aerobic process while de-nitrification requires an anoxic environment. The anaerobic ammonium oxidation (ANAMMOX, 2 ) process was first discovered in Dreft, Netherlands about a decade ago and has been studied by numerous researchers, most recently (Schmid et al., 2005; Tsushima, et al., 2007a; Tsushima, et al., 2007b; Kindaichi, et al., 2007; Fernandez, et al., 2008; Szatkowska, et al., 2007; Feng et al., 2008; van der Star, et al., 2007). ANAMMOX gains its attention due to efficiency and cost effectiveness compared with conventional nitrogen removal. However, due to the ANAMMOX slow growth rate with the fastest doubling time reported as 11 days and special sludge seeding needed for a time consuming startup (Schmid et al., 2005), conventional biological removal is still the reliable and manageable process used in current wastewater treatment applications. Simultaneous nitrification and de-nitrification was detected in activated sludge systems with low DO. It occurs because of different microclimates: de-nitrification can occur in the interior of flocs, while nitrifiers work at the exterior of flocs (Metcalf and Eddy Inc, 2003). Different microclimates exist in fixed bio-film systems. Both nitrifiers and de-nitrifers can live in fixed bio-film and occupy different localized micro-climates. High metabolic rates occur when there is micro-fluidic movement of oxygen (in the case of nitrifiers) and wastewater past the surface area. In the proper symbiotic environments, the removal of nitrogen compounds is complete, with the nitrogen released as harmless N2 gas. Biological nitrogen removal in fixed film is well documented in the literature. Our own research on this topic with nitrification in submerged bio-film is published in one University of Utah PhD Dissertation and two peer-reviewed journal articles (Choi, 2005, Choi, et al, 2007, Choi et al. 2008.) Other recent references are: Tarre et al, 2007, Terada et al, 2006, Satoh, et al, 2004, and Hibiya, et al, 2003. Biological phosphorus removal requires alternating anaerobic and aerobic conditions to enrich phosphorus accumulative organisms (PAOs), which release orthophosphate (PO4
3-) during the anaerobic phase and uptake more PO4
3- than released during aerobic phase, therefore removing P from the system (Zeng et al., 2003). Unlike nitrogen, phosphorous cannot escape into the air. PAOs or other organisms will release the phosphorous back into the water, or settle to the bottom as dead cell mass. PAOs are also well documented in the literature, a few recent selected references are: Gu, et al, 2008, Rogalla, et al., 2006, Sriwiriyarat, et al, 2005. Neither de-nitrification nor de-phosphatation can be accomplished without sufficient biodegradable organic compounds, the so-called carbon source (Randall, et al., 1992). In the early research, de-nitrification was considered to interfere with biological phosphorus removal since de-nitrifiers outcompete PAOs for carbon source during the anaerobic process. However, more recent research found that enhanced biological phosphorus removal (EBPR) can occur in the presence of nitrate (Seviour et al., 2003; Oehmen et al., 2005). One of the biggest problems in biological phosphorus removal with activated sludge is management of sludge biomass. Biomass wastes contain excess phosphorus and proper management is required to avoid phosphorus being
Wastewater Compliance Systems, Inc Proprietary Information ©2011 14
released and reintroduced to the wastewater (Rich, 1998). Kuba et al. (1994) reported that de-nitrifying PAOs produce less sludge, reducing the cost of sludge management. Therefore, simultaneous nitrogen and phosphorus removal is considered a more attractive and economical process (Carvalho, et al., 2007; Seviour and McIlroy, 2008). Martinez and Wilderer (1991) demonstrated lab-scale biological phosphorus removal in a fixed bed bio-film reactor. The reactor filled/ drained and the aerator turned on/off periodically to enrich PAOs in bio-film. After several weeks of operation, the steady-state was reached and phosphorus in dry bio-film turned out to be about 5%. In a 1994 publication, Gonçalves, et al. showed that a submerged mass of bio-film could perform nitrification, de-nitrification and also biological phosphorous removal. The key was to cycle the air on then off to promote aerobic to anoxic to anaerobic dominance. Phosphorous removal was effected by flushing the bio-film at the end of an extended anaerobic phase. Cycle times were on the order of nine hours on to three hours off using a fixed film upflow filter. Note from the paper that no external carbon source was needed for either de-nitrification or phosphorous uptake and release, due to the long SRT of the biomass in the filter. In a lagoon environment, phosphorous release could be timed with a diversion of effluent to a holding pond for land application or other phosphorous removal techniques. During the uptake phase, pond effluent could be discharged into the normal receiving water. Improvement of existing lagoon systems is an overlooked area of engineering design. Addition of baffle curtains to prevent short circuiting, addition of fixed film aeration devices such as the Poo-Gloos, and, theoretically, addition of air cycling in the fixed bio-film and diversion of phosphorous laden effluent away from receiving waters are all operational upgrades that would cost a fraction of the cost of conversion to a mechanical plant. Traditional lagoons are constructed to remove biochemical oxygen demand (BOD), suspended solids, and pathogens. Nutrient removal, defined here as nitrogen compounds such as NH4
+, NO3-, NO2
- and organic N, as well as phosphorous compounds such as PO4
3- and organic P has been less successful. Results and Accomplishments:
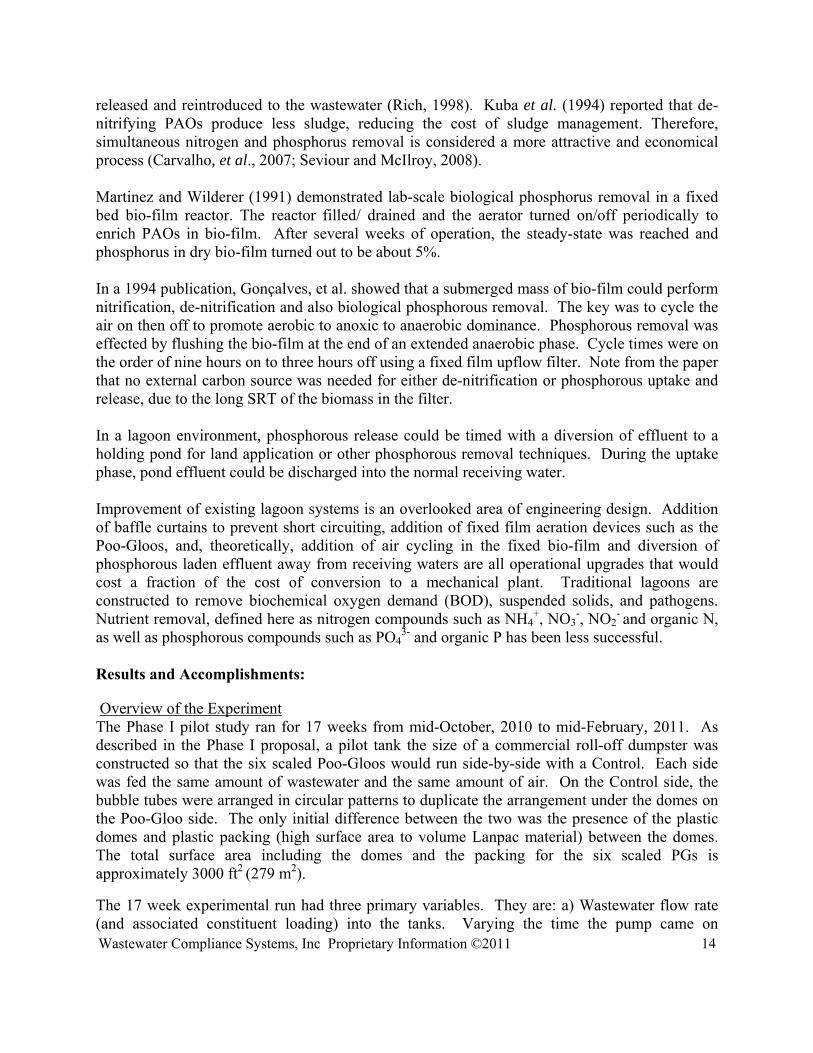
Overview of the Experiment The Phase I pilot study ran for 17 weeks from mid-October, 2010 to mid-February, 2011. As described in the Phase I proposal, a pilot tank the size of a commercial roll-off dumpster was constructed so that the six scaled Poo-Gloos would run side-by-side with a Control. Each side was fed the same amount of wastewater and the same amount of air. On the Control side, the bubble tubes were arranged in circular patterns to duplicate the arrangement under the domes on the Poo-Gloo side. The only initial difference between the two was the presence of the plastic domes and plastic packing (high surface area to volume Lanpac material) between the domes. The total surface area including the domes and the packing for the six scaled PGs is approximately 3000 ft2 (279 m2).
The 17 week experimental run had three primary variables. They are: a) Wastewater flow rate (and associated constituent loading) into the tanks. Varying the time the pump came on
Wastewater Compliance Systems, Inc Proprietary Information ©2011 15
controlled the hydraulic and nutrient loading with a corresponding HRT that varied from 3 days to 9 days. b) Air on/off periods. During the time the air was on, the air flow rate was held constant at around 3 lpm per scaled Poo-Gloo (18 lpm total per side). Air cycling varied from 22 hours ON/2 hours OFF to 19 hours ON/5 hours OFF. Also, twice the air was left off for an entire week to promote the release of stored P. c) Temperature. We allowed the water to follow the weather-induced temperatures, which varied from 12.6 to 0.2 degrees C.
Figure 2: Overview of the dual chamber reactor tank. The Control tank with 6 bubble tube sets is on the left and the PG tank with 6 Poo-Gloos is on the right. (Nearest ones are out of the picture.) The dome structures are about 2.5’ (0.762 m) high. Total tank depth is 3’ (0.914 m), length is 22’ (6.7 m), and overall width is 8’ (2.44 m).
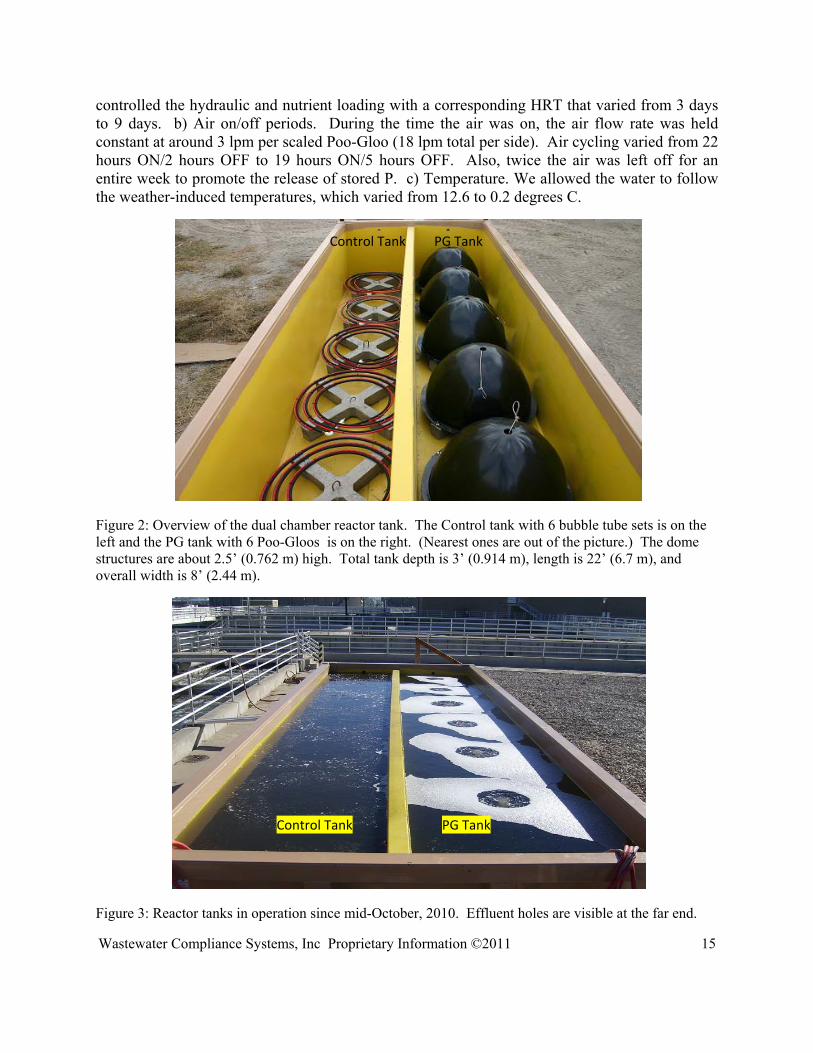
Figure 3: Reactor tanks in operation since mid-October, 2010. Effluent holes are visible at the far end.
Control Tank PG Tank
Control Tank PG Tank
Wastewater Compliance Systems, Inc Proprietary Information ©2011 16
We did insulate the tank to more closely mimic an in-ground pond. The concentration of the wastewater pumped from the transfer ditch at CVWRF varied moderately. Comparing effluents of the two side-by-side tanks helped to cancel the influent concentration variations.
The commercial dumpster is divided lengthwise into two parallel tanks, each holding 1650 gallons (6245 liters). The six PGs in the PG tank have an internal structure that provides a total surface area of about 3000 square feet (279 m2) of colonizable bio-film surface area. The Control tank contains bubble release tubes only. The wastewater was pumped through a flow splitter equally into each tank at one end. At the other end, the effluent spilled out over circular weirs and was returned to the treatment plant downstream of the influent point.
The influent to the tanks was sampled once per day. Values were compared to the lab results at CVWRF for quality control. The PG side and the Control side were each sampled from once to three times per day, depending on the week. During several weeks, lab triplicates were performed for QC and statistical analysis. The standard deviation for the values during those weeks is shown on the associated figures as error bars (± one SD).
Field measurements were taken with a Horiba W-2010 Water Quality Checker. Turbidity, pH, temperature, ORP, DO and conductivity were measured daily, as well as several days where readings were automatically collected every hour. Exiting air bubbles were also checked with an ammonia tube.
At the University of Utah lab, the following parameters were measured: Chemical Oxygen Demand (COD), ionized Ammonia (NH4
+), Total Suspended Solids (TSS), Nitrate/Nitrite (NO3-
/NO2-), Total N (TN), Alkalinity (ALK), Ortho-P (PO43-), and Total P (TP). Concentration of P
in bio-film samples, and filamentous algae samples was also measured. This monitoring produced a wealth of data, with over 5500 field measurement values, and over 4000 lab measurement values. Most of this data is presented in a series of overview figures. Several weeks are also selected for a closer look. The complete excel file for all field and lab measurements is available on our website (www.wcs-utah.com).
Wastewater Compliance Systems, Inc Proprietary Information ©2011 17
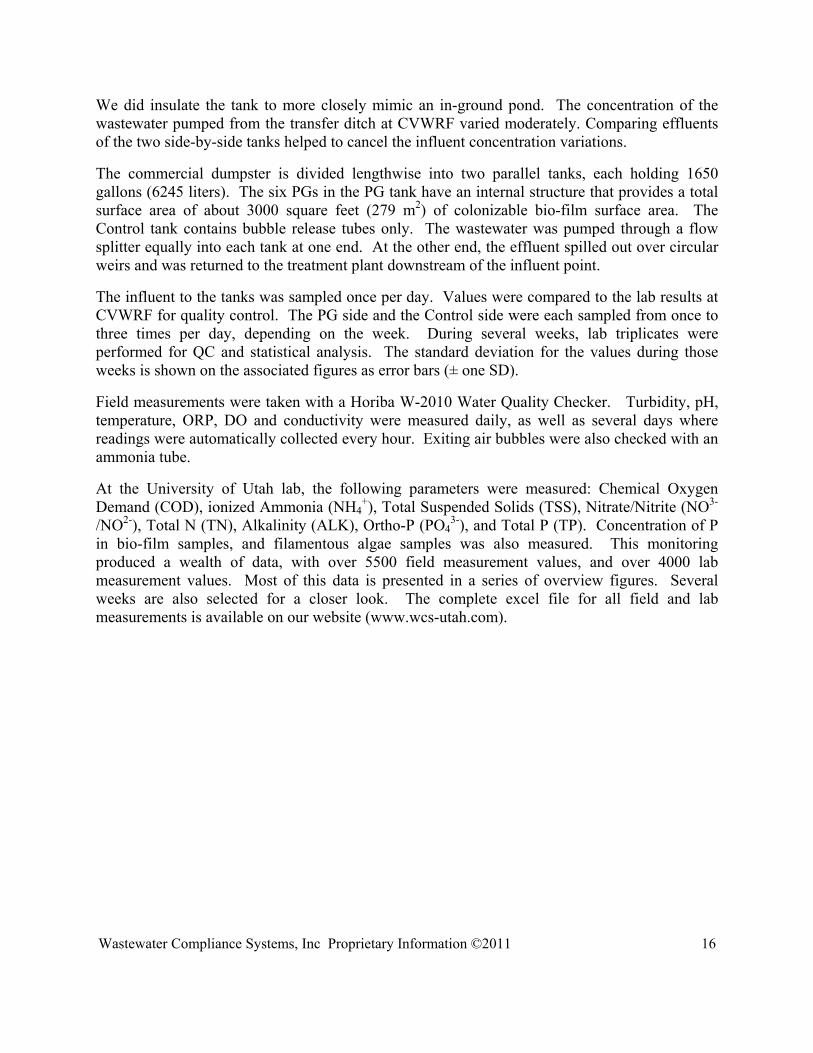
Table 1: Weekly variations in operational parameters
Week Dates Inflow Rate (Liters/day)
HRT (days)
Air Cycling Hrs ON/Hrs OFF Each day
Goal Notes
1 10/25/2010 – 10/29/2010 1938 3 24/0 Establish biofilm
2-4 11/1/2010-11/19/2010 795 7 – 8 24/0 Allow nitrifying & other bacteria to reach steady-state
Well established by week 4
5-6 11/22/2010 – 12/6/2010 696 9 19/5 Air cycling to promote denitrification & possible P uptake
Minimal de-nitrification, No data for week 6 due to bad weather
7-8 12/6/2010 – 12/17/2010 1181 5 – 6 19/5 Reduce loading, continue to promote de-nit and P uptake
Heavy BOD loading, heterotrophs dominate
9 12/20/2010 – 12/24/2010 0 ∞ 0/24* Possible P release * air pulsed on for 5 min. each 6 hrs. for circulation
10 12/27/2010 – 12/31/2010 0 ∞ 24/0 Possible P uptake Air on continuously, release of PO4
11 1/3/2011 – 1/7/2011 863 7 24/0 Return system to steady-state
Insulate tank and winterize feed lines, compressor shed
12-13 1/10/2011 – 1/21/2011 863 7 22/2 Show significant BOD & ammonia removal, possible P uptake
Note huge cold temperature ammonia removal, significant TP uptake.
14 1/24/2011 – 1/28/2011 863 7 21/3 Show significant BOD & ammonia removal, possible P uptake
Significant TP uptake, and possibly some release of PO4.
15 1/31/2011 – 2/4/2011 863 7 20/4 Show significant BOD & ammonia removal, possible P uptake
Consistent removal rates, significant TP uptake from bulk solution into bio-film.
16 2/7/2011 – 2/11/2011 0 ∞ 0/24 Possible P release TP in bulk solution increased from 2.4 to 3.2 mg/L
17 2/14/2011 – 2/17/2011 0 ∞ 24/0 Possible P uptake TP in bulk solution decreased from 3.2 mg/L to 2.65 mg/L
Wastewater Compliance Systems, Inc Proprietary Information ©2011 18
Analytical Methods
The following analytical methods have been selected to measure the proposed parameters of water quality. (See table 2)
Table 2: Selected analytical methods for water quality analysis
Parameter Method
COD HACH TNT 82206 (20 – 1500 mg/L)
TSS APHA, AWWA, & WPCF. Standard Method with VWR Filters
Ammonia HACH TNT ( 0.4 – 50 mg/L)
Total Nitrogen HACH s-TKN TNT 880 (0 – 16 mg/L)
Nitrites/Nitrates HACH s-TKN TNT 880 (0 – 16 mg/L)
TKN HACH s-TKN TNT 880 (0 – 16 mg/L)
Alkalinity HACH TNT 870 ( 25 – 400 mg/L)
Total Phosphorus HACH TNT 844 (0.5 – 5 mg/L PO4-P)/TNT 845 (2-20 mg/L PO4-P)
Reactive Orthophosphate
HACH TNT (0 – 5 mg/L PO4)
Horiba W-2010 was used for field measurements including pH, turbidity, conductivity, DO, temperature and ORP. Drager diffusion tubes (ammonia 20/a-D) were used to measure the concentration of ammonia in the off-gas from both the PG tank and the Control tank.
Collected data is analyzed with Microsoft Office Excel 2007 and also StatEase 8.0.
Modeling the System
Although the side-by-side tanks are approximately 5 times longer than they are wide, based on observations of the system, a Continuous-Flow Stirred Tank Reactor (CFSTR) model works better than a Plug Flow model. One reason for this is a fairly long hydraulic retention time (HRT). The mixing of the water by the rising air bubbles is primarily bottom to top, but within one HRT there was sufficient end-to-end mixing to justify this model. (One aspect of Plug Flow,
Wastewater Compliance Systems, Inc Proprietary Information ©2011 19
however, was the amount of filamentous algae growing on the top of each Poo-Gloo. The amount increased proceeding from the influent end to the effluent end.)
Borrowing from Tchobanoglous & Schroeder (1985) on page 270, the CFSTR model equation is:
In the case of Nitrogen, if the influent N is NH4+, there is no accumulation due to steady-state
inflow and outflow, and the overall reaction rout is removal (i.e. conversion to NO3-), the equation
becomes:
If the increase of NO3- (NO2
- concentrations were negligible) is entirely due to nitrification (NH4
+ NO3-), then the NO3
- can be modeled as
In the case of P, simplifying assumptions are that the P can be accounted for as Total P. Even if some P in the biomass is converted to PO4
3- (or vice-versa) the P cannot exit the system unless it flows out. Therefore it is non-reactive (for purposes of this model) and accumulates in the system if it is taken up by the biomass or settles. Therefore the equation for P becomes:
Based on observations from the PG (Poo-Gloo) tank, the fixed biomass accumulates organic P, and twice released P into the bulk solution. The observations and modeling are explained in the pages that follow.
Analysis by constituent for influent and PG (Poo-Gloo) vs. Control removal
Organic Removal measured as Chemical Oxygen Demand (COD)
Due to ease of measurement with the Hach Colorimetric System, COD was used for the bulk of the dissolved organic oxygen demand values. CVWRF measured BOD for the influent to our pilot tanks, which correlated with our values.
In Figure 4, and in all subsequent similar figures, error bars show ± one S.D. for lab triplicates during selected weeks when triplicates were run.
Wastewater Compliance Systems, Inc Proprietary Information ©2011 20
Figure 4: Week 1- 8 of oxygen demand results, measured as COD.
Figure 5: Week 9 - 17 of oxygen demand results, measured as COD.
0
2
4
6
8
10
12
14
16
0
50
100
150
200
250
300
350
400
450
Tem
pera
ture
(ºC
)
CO
D (m
g/L
)
Influent PG Effluent Control Effluent Temp
Wk 1HRT = 3 d
Air 24 h on
Wk 2HRT = 7 ~ 8 d
Air 24 h on
Wk 3HRT = 7 ~ 8 d
Air 24 h on
Wk 4HRT = 7 ~ 8 d
Air 24 h on
Wk 5HRT = 9 d
Air19h on/5h off
Wk 6
Heavy Snow
Wk 7HRT = 5 ~ 6 d
Air 19h on/5h off
Wk 8HRT = 5 ~ 6 d
Air 19h on/5h off
0
2
4
6
8
10
12
14
16
0
50
100
150
200
250
300
350
Tem
pera
ture
(ºC
)
CO
D (m
g/L
)
Influent PG Effluent Control Effluent Temp
Wk 9HRT ∞
Air 24 h off
Wk 10HRT ∞
Air 24 h on
Wk 11HRT = 7 dAir 24 h on
Insulate tank
Wk 12 HRT = 7 d
Air 22h on/2h off
Wk 13 HRT = 7 d
Air 22h on/2h off
Wk 14HRT = 7 d
Air21h on/3h off
Wk 15HRT = 7 d
Air20h on/4h off
Wk 16HRT ∞
Air 24 h off
Wk 17HRT ∞
Air 24 h on
Wastewater Compliance Systems, Inc Proprietary Information ©2011 21
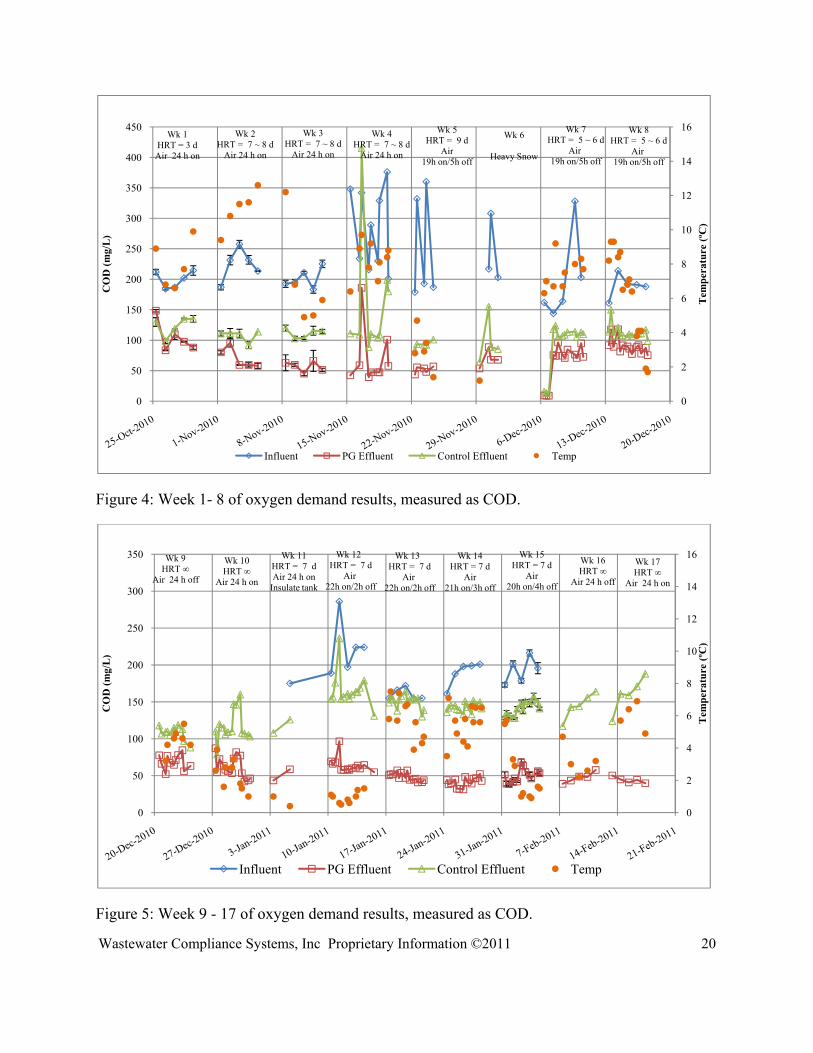
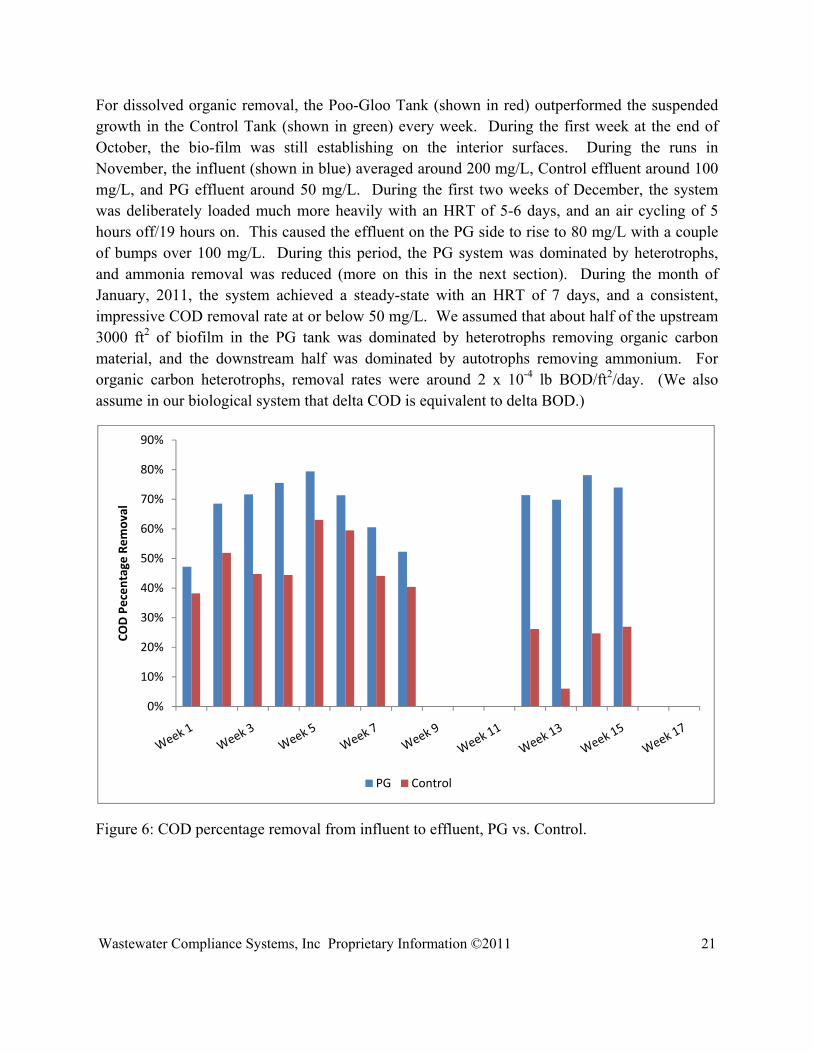
For dissolved organic removal, the Poo-Gloo Tank (shown in red) outperformed the suspended growth in the Control Tank (shown in green) every week. During the first week at the end of October, the bio-film was still establishing on the interior surfaces. During the runs in November, the influent (shown in blue) averaged around 200 mg/L, Control effluent around 100 mg/L, and PG effluent around 50 mg/L. During the first two weeks of December, the system was deliberately loaded much more heavily with an HRT of 5-6 days, and an air cycling of 5 hours off/19 hours on. This caused the effluent on the PG side to rise to 80 mg/L with a couple of bumps over 100 mg/L. During this period, the PG system was dominated by heterotrophs, and ammonia removal was reduced (more on this in the next section). During the month of January, 2011, the system achieved a steady-state with an HRT of 7 days, and a consistent, impressive COD removal rate at or below 50 mg/L. We assumed that about half of the upstream 3000 ft2 of biofilm in the PG tank was dominated by heterotrophs removing organic carbon material, and the downstream half was dominated by autotrophs removing ammonium. For organic carbon heterotrophs, removal rates were around 2 x 10⁻⁴ lb BOD/ft2/day. (We also assume in our biological system that delta COD is equivalent to delta BOD.)
Figure 6: COD percentage removal from influent to effluent, PG vs. Control.
0%
10%
20%
30%
40%
50%
60%
70%
80%
90%
COD Pecen
tage
Rem
oval
PG Control
Wastewater Compliance Systems, Inc Proprietary Information ©2011 22
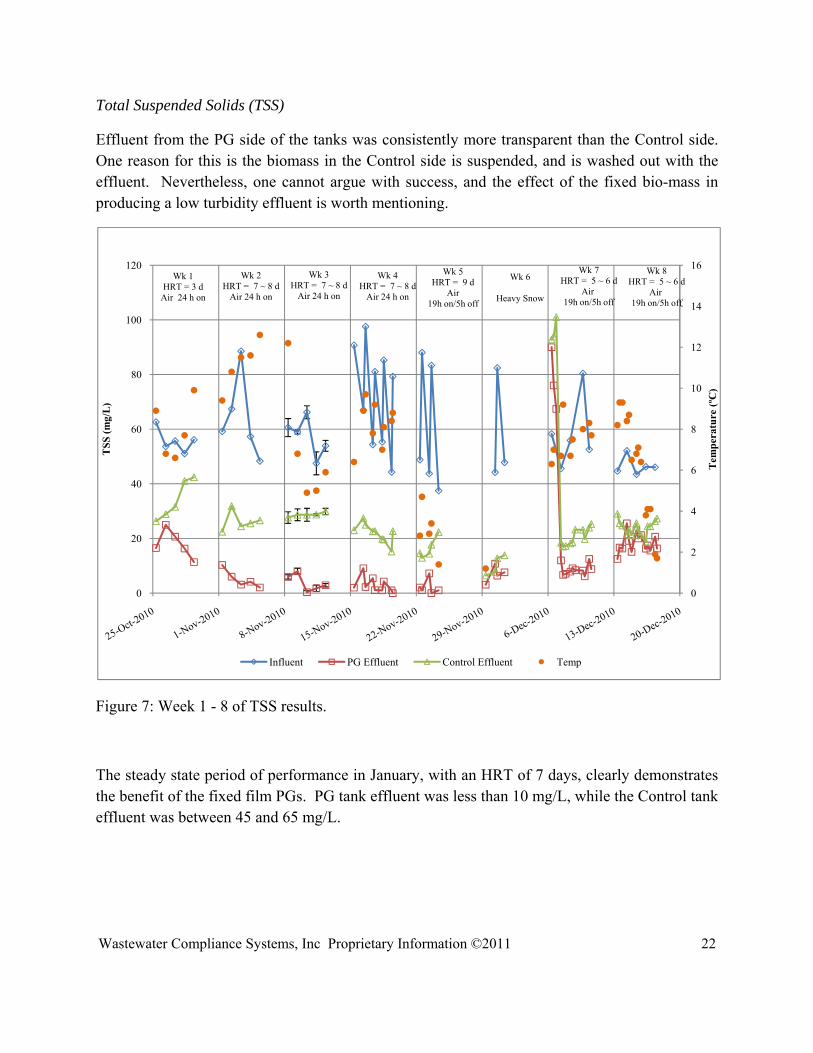
Total Suspended Solids (TSS)
Effluent from the PG side of the tanks was consistently more transparent than the Control side. One reason for this is the biomass in the Control side is suspended, and is washed out with the effluent. Nevertheless, one cannot argue with success, and the effect of the fixed bio-mass in producing a low turbidity effluent is worth mentioning.
Figure 7: Week 1 - 8 of TSS results.
The steady state period of performance in January, with an HRT of 7 days, clearly demonstrates the benefit of the fixed film PGs. PG tank effluent was less than 10 mg/L, while the Control tank effluent was between 45 and 65 mg/L.
0
2
4
6
8
10
12
14
16
0
20
40
60
80
100
120
Tem
pera
ture
(ºC
)
TSS
(mg/
L)
Influent PG Effluent Control Effluent Temp
Wk 1HRT = 3 d
Air 24 h on
Wk 2HRT = 7 ~ 8 d
Air 24 h on
Wk 3HRT = 7 ~ 8 d
Air 24 h on
Wk 4HRT = 7 ~ 8 d
Air 24 h on
Wk 5HRT = 9 d
Air19h on/5h off
Wk 6
Heavy Snow
Wk 7HRT = 5 ~ 6 d
Air 19h on/5h off
Wk 8HRT = 5 ~ 6 d
Air 19h on/5h off
Wastewater Compliance Systems, Inc Proprietary Information ©2011 23
Figure 8: Week 9 – 17 of TSS results.
Figure 9: TSS percentage removal from influent to effluent PG vs. Control.
0
2
4
6
8
10
12
14
16
0
10
20
30
40
50
60
70
80
Tem
pera
ture
(ºC
)
TSS
(mg/
L)
Influent PG Effluent Control Effluent Temp
Wk 9HRT ∞
Air 24 h off
Wk 10HRT ∞
Air 24 h on
Wk 11HRT = 7 dAir 24 h on
Insulate tank
Wk 12 HRT = 7 d
Air 22h on/2h off
Wk 13 HRT = 7 d
Air 22h on/2h off
Wk 14HRT = 7 d
Air21h on/3h off
Wk 15HRT = 7 d
Air20h on/4h off
Wk 16HRT ∞
Air 24 h off
Wk 17HRT ∞
Air 24 h on
‐40%
‐20%
0%
20%
40%
60%
80%
100%
TSS Pe
rcen
tage
Rem
oval
PG Control
Wastewater Compliance Systems, Inc Proprietary Information ©2011 24
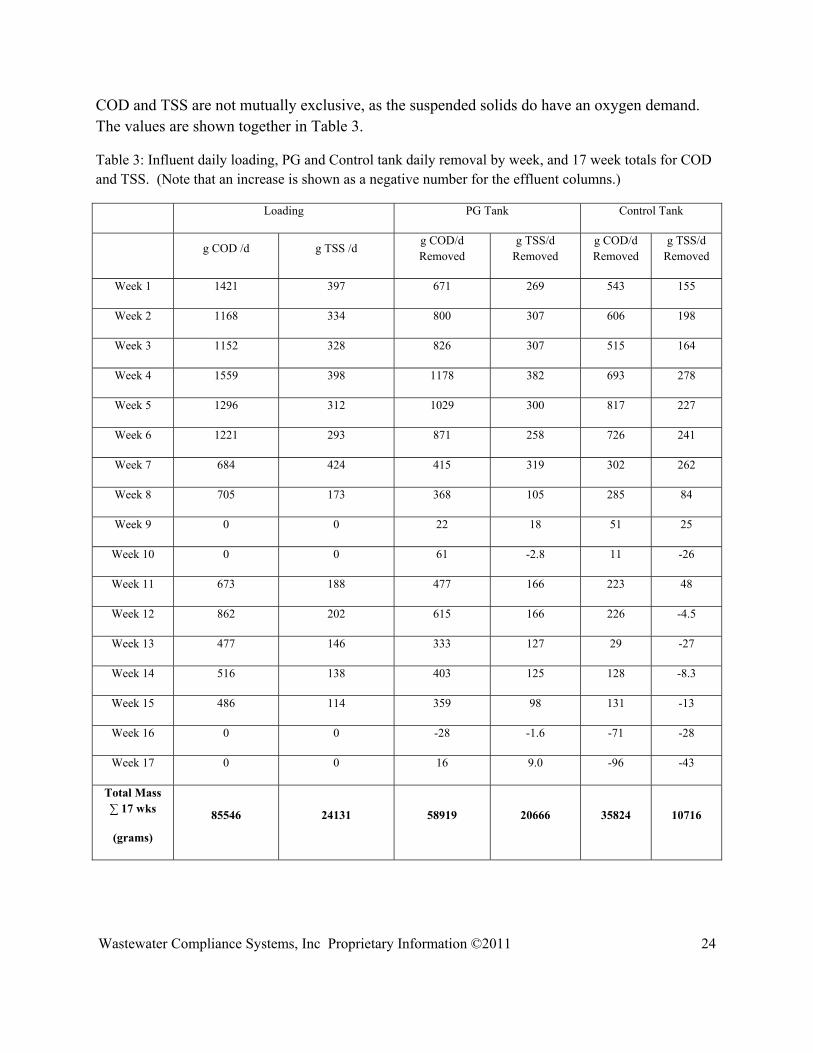
COD and TSS are not mutually exclusive, as the suspended solids do have an oxygen demand. The values are shown together in Table 3.
Table 3: Influent daily loading, PG and Control tank daily removal by week, and 17 week totals for COD and TSS. (Note that an increase is shown as a negative number for the effluent columns.)
Loading PG Tank Control Tank
g COD /d g TSS /d
g COD/d Removed
g TSS/d Removed
g COD/d Removed
g TSS/d Removed
Week 1 1421 397 671 269 543 155
Week 2 1168 334 800 307 606 198
Week 3 1152 328 826 307 515 164
Week 4 1559 398 1178 382 693 278
Week 5 1296 312 1029 300 817 227
Week 6 1221 293 871 258 726 241
Week 7 684 424 415 319 302 262
Week 8 705 173 368 105 285 84
Week 9 0 0 22 18 51 25
Week 10 0 0 61 -2.8 11 -26
Week 11 673 188 477 166 223 48
Week 12 862 202 615 166 226 -4.5
Week 13 477 146 333 127 29 -27
Week 14 516 138 403 125 128 -8.3
Week 15 486 114 359 98 131 -13
Week 16 0 0 -28 -1.6 -71 -28
Week 17 0 0 16 9.0 -96 -43
Total Mass ∑ 17 wks
(grams)
85546 24131 58919 20666 35824 10716
Wastewater Compliance Systems, Inc Proprietary Information ©2011 25
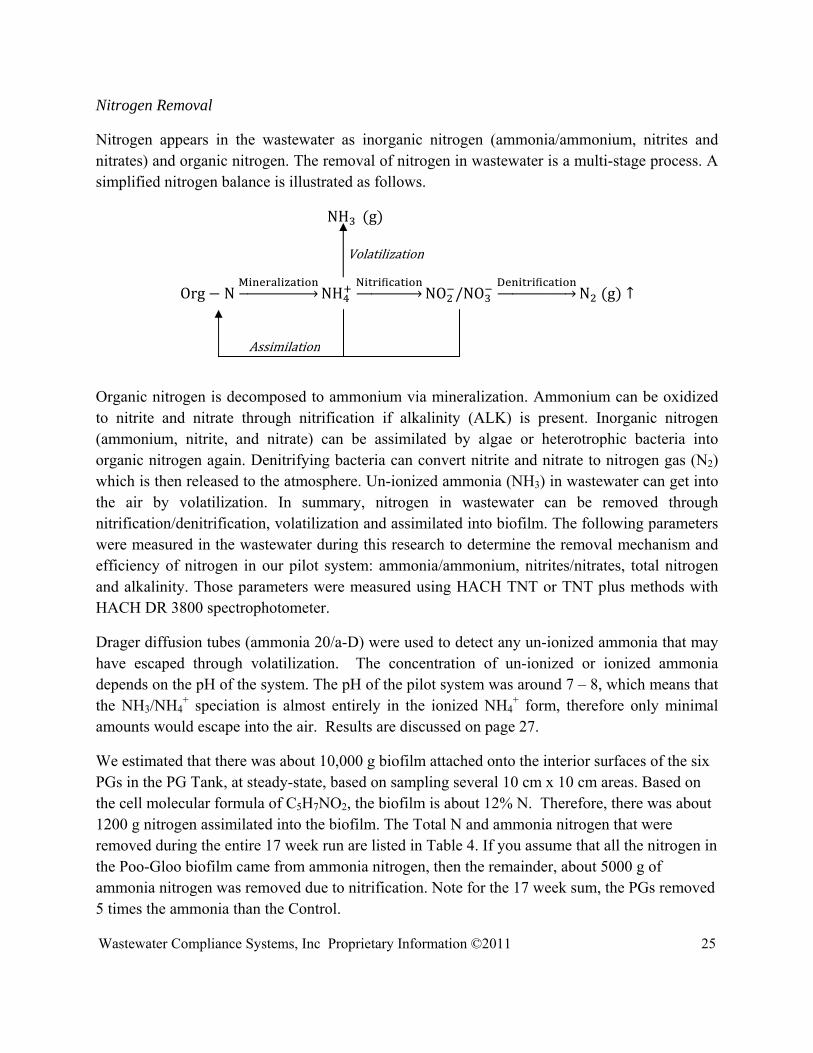
Nitrogen Removal
Nitrogen appears in the wastewater as inorganic nitrogen (ammonia/ammonium, nitrites and nitrates) and organic nitrogen. The removal of nitrogen in wastewater is a multi-stage process. A simplified nitrogen balance is illustrated as follows.
NH g
Org NM
NHN f
NO /NOD f
N g
Organic nitrogen is decomposed to ammonium via mineralization. Ammonium can be oxidized to nitrite and nitrate through nitrification if alkalinity (ALK) is present. Inorganic nitrogen (ammonium, nitrite, and nitrate) can be assimilated by algae or heterotrophic bacteria into organic nitrogen again. Denitrifying bacteria can convert nitrite and nitrate to nitrogen gas (N2) which is then released to the atmosphere. Un-ionized ammonia (NH3) in wastewater can get into the air by volatilization. In summary, nitrogen in wastewater can be removed through nitrification/denitrification, volatilization and assimilated into biofilm. The following parameters were measured in the wastewater during this research to determine the removal mechanism and efficiency of nitrogen in our pilot system: ammonia/ammonium, nitrites/nitrates, total nitrogen and alkalinity. Those parameters were measured using HACH TNT or TNT plus methods with HACH DR 3800 spectrophotometer.
Drager diffusion tubes (ammonia 20/a-D) were used to detect any un-ionized ammonia that may have escaped through volatilization. The concentration of un-ionized or ionized ammonia depends on the pH of the system. The pH of the pilot system was around 7 – 8, which means that the NH3/NH4
+ speciation is almost entirely in the ionized NH4+ form, therefore only minimal
amounts would escape into the air. Results are discussed on page 27.
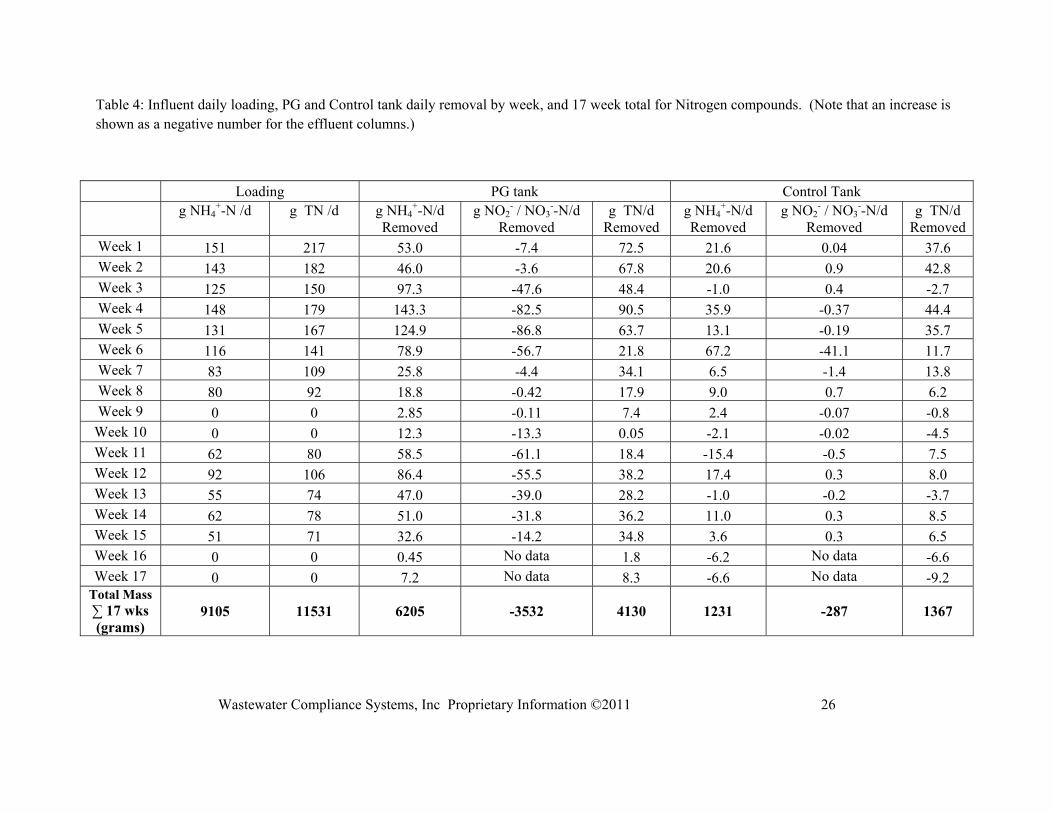
We estimated that there was about 10,000 g biofilm attached onto the interior surfaces of the six PGs in the PG Tank, at steady-state, based on sampling several 10 cm x 10 cm areas. Based on the cell molecular formula of C5H7NO2, the biofilm is about 12% N. Therefore, there was about 1200 g nitrogen assimilated into the biofilm. The Total N and ammonia nitrogen that were removed during the entire 17 week run are listed in Table 4. If you assume that all the nitrogen in the Poo-Gloo biofilm came from ammonia nitrogen, then the remainder, about 5000 g of ammonia nitrogen was removed due to nitrification. Note for the 17 week sum, the PGs removed 5 times the ammonia than the Control.
Volatilization
Assimilation
Wastewater Compliance Systems, Inc Proprietary Information ©2011 26
Table 4: Influent daily loading, PG and Control tank daily removal by week, and 17 week total for Nitrogen compounds. (Note that an increase is shown as a negative number for the effluent columns.)
Loading PG tank Control Tank
g NH4
+-N /d
g TN /d
g NH4+-N/d
Removed g NO2
- / NO3--N/d
Removed g TN/d
Removed g NH4
+-N/d Removed
g NO2- / NO3
--N/d Removed
g TN/d Removed
Week 1 151 217 53.0 -7.4 72.5 21.6 0.04 37.6 Week 2 143 182 46.0 -3.6 67.8 20.6 0.9 42.8 Week 3 125 150 97.3 -47.6 48.4 -1.0 0.4 -2.7 Week 4 148 179 143.3 -82.5 90.5 35.9 -0.37 44.4 Week 5 131 167 124.9 -86.8 63.7 13.1 -0.19 35.7 Week 6 116 141 78.9 -56.7 21.8 67.2 -41.1 11.7 Week 7 83 109 25.8 -4.4 34.1 6.5 -1.4 13.8 Week 8 80 92 18.8 -0.42 17.9 9.0 0.7 6.2 Week 9 0 0 2.85 -0.11 7.4 2.4 -0.07 -0.8
Week 10 0 0 12.3 -13.3 0.05 -2.1 -0.02 -4.5 Week 11 62 80 58.5 -61.1 18.4 -15.4 -0.5 7.5 Week 12 92 106 86.4 -55.5 38.2 17.4 0.3 8.0 Week 13 55 74 47.0 -39.0 28.2 -1.0 -0.2 -3.7 Week 14 62 78 51.0 -31.8 36.2 11.0 0.3 8.5 Week 15 51 71 32.6 -14.2 34.8 3.6 0.3 6.5 Week 16 0 0 0.45 No data 1.8 -6.2 No data -6.6 Week 17 0 0 7.2 No data 8.3 -6.6 No data -9.2
Total Mass ∑ 17 wks (grams)
9105 11531 6205 -3532 4130 1231 -287 1367
Wastewater Compliance Systems, Inc Proprietary Information ©2011 27
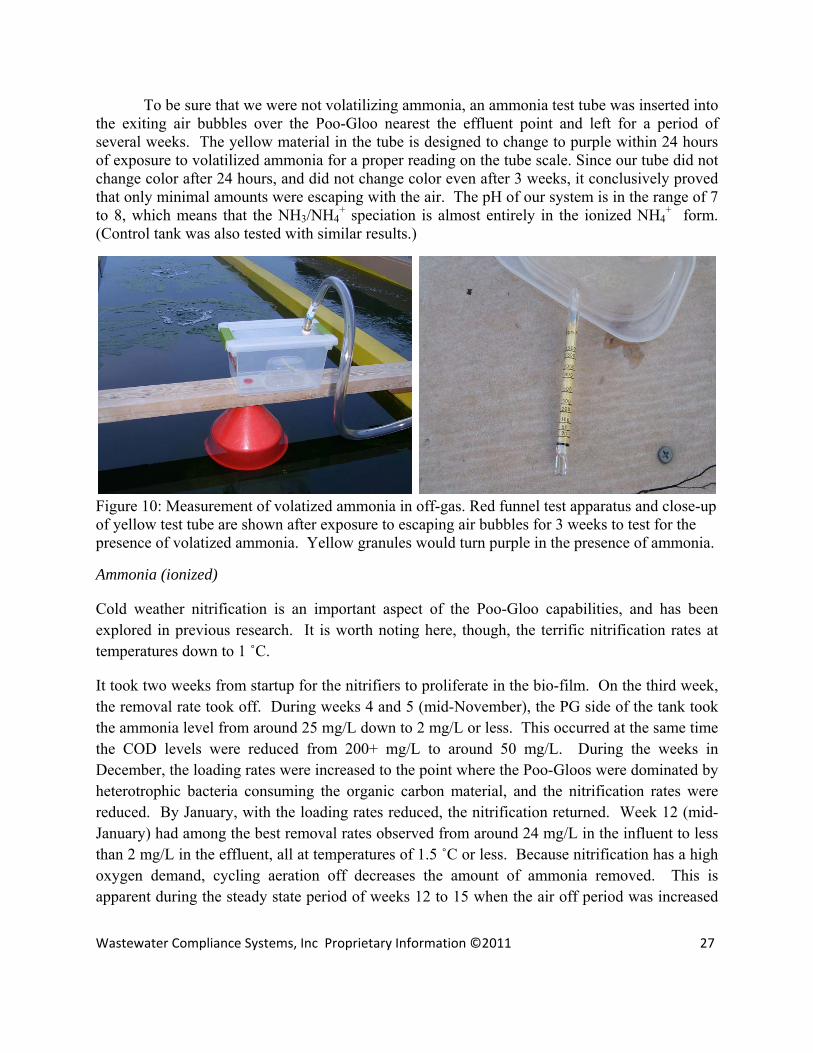
To be sure that we were not volatilizing ammonia, an ammonia test tube was inserted into the exiting air bubbles over the Poo-Gloo nearest the effluent point and left for a period of several weeks. The yellow material in the tube is designed to change to purple within 24 hours of exposure to volatilized ammonia for a proper reading on the tube scale. Since our tube did not change color after 24 hours, and did not change color even after 3 weeks, it conclusively proved that only minimal amounts were escaping with the air. The pH of our system is in the range of 7 to 8, which means that the NH3/NH4
+ speciation is almost entirely in the ionized NH4+ form.
(Control tank was also tested with similar results.)
Figure 10: Measurement of volatized ammonia in off-gas. Red funnel test apparatus and close-up of yellow test tube are shown after exposure to escaping air bubbles for 3 weeks to test for the presence of volatized ammonia. Yellow granules would turn purple in the presence of ammonia.
Ammonia (ionized)
Cold weather nitrification is an important aspect of the Poo-Gloo capabilities, and has been explored in previous research. It is worth noting here, though, the terrific nitrification rates at temperatures down to 1 ˚C.
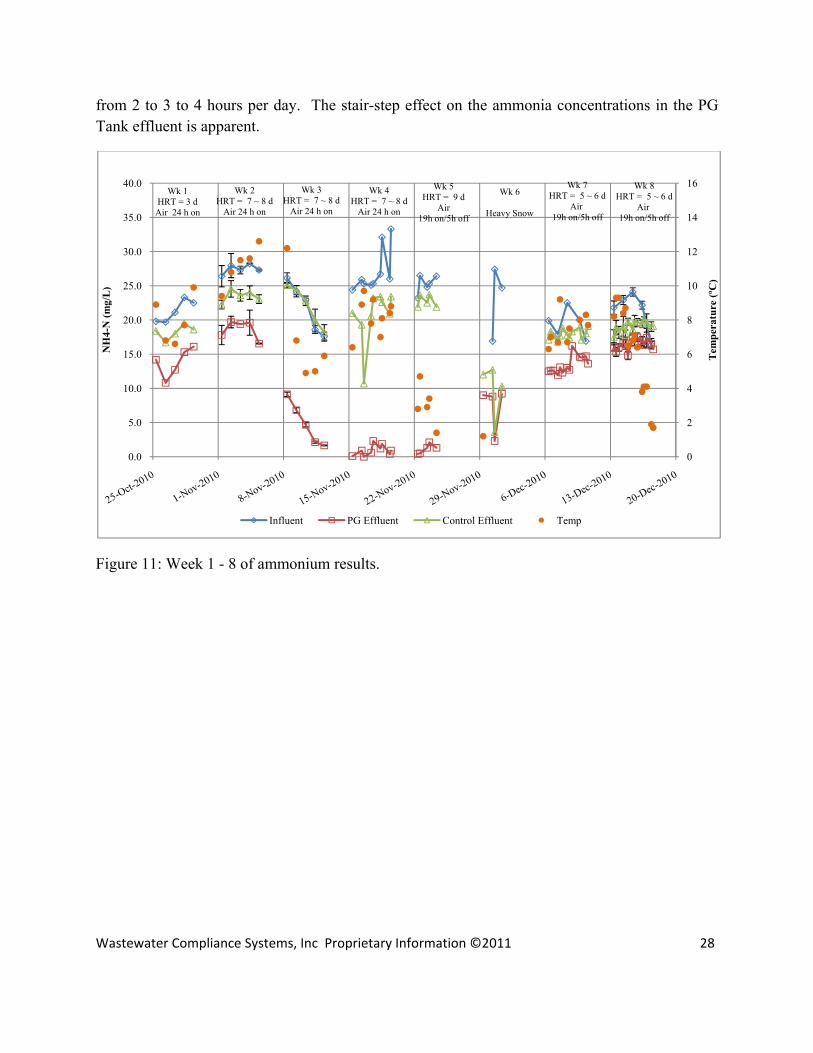
It took two weeks from startup for the nitrifiers to proliferate in the bio-film. On the third week, the removal rate took off. During weeks 4 and 5 (mid-November), the PG side of the tank took the ammonia level from around 25 mg/L down to 2 mg/L or less. This occurred at the same time the COD levels were reduced from 200+ mg/L to around 50 mg/L. During the weeks in December, the loading rates were increased to the point where the Poo-Gloos were dominated by heterotrophic bacteria consuming the organic carbon material, and the nitrification rates were reduced. By January, with the loading rates reduced, the nitrification returned. Week 12 (mid-January) had among the best removal rates observed from around 24 mg/L in the influent to less than 2 mg/L in the effluent, all at temperatures of 1.5 ˚C or less. Because nitrification has a high oxygen demand, cycling aeration off decreases the amount of ammonia removed. This is apparent during the steady state period of weeks 12 to 15 when the air off period was increased
Wastewater Compliance Systems, Inc Proprietary Information ©2011 28
from 2 to 3 to 4 hours per day. The stair-step effect on the ammonia concentrations in the PG Tank effluent is apparent.
Figure 11: Week 1 - 8 of ammonium results.
0
2
4
6
8
10
12
14
16
0.0
5.0
10.0
15.0
20.0
25.0
30.0
35.0
40.0
Tem
pera
ture
(ºC
)
NH
4-N
(mg/
L)
Influent PG Effluent Control Effluent Temp
Wk 1HRT = 3 d
Air 24 h on
Wk 2HRT = 7 ~ 8 d
Air 24 h on
Wk 3HRT = 7 ~ 8 d
Air 24 h on
Wk 4HRT = 7 ~ 8 d
Air 24 h on
Wk 5HRT = 9 d
Air19h on/5h off
Wk 6
Heavy Snow
Wk 7HRT = 5 ~ 6 d
Air 19h on/5h off
Wk 8HRT = 5 ~ 6 d
Air 19h on/5h off
Wastewater Compliance Systems, Inc Proprietary Information ©2011 29
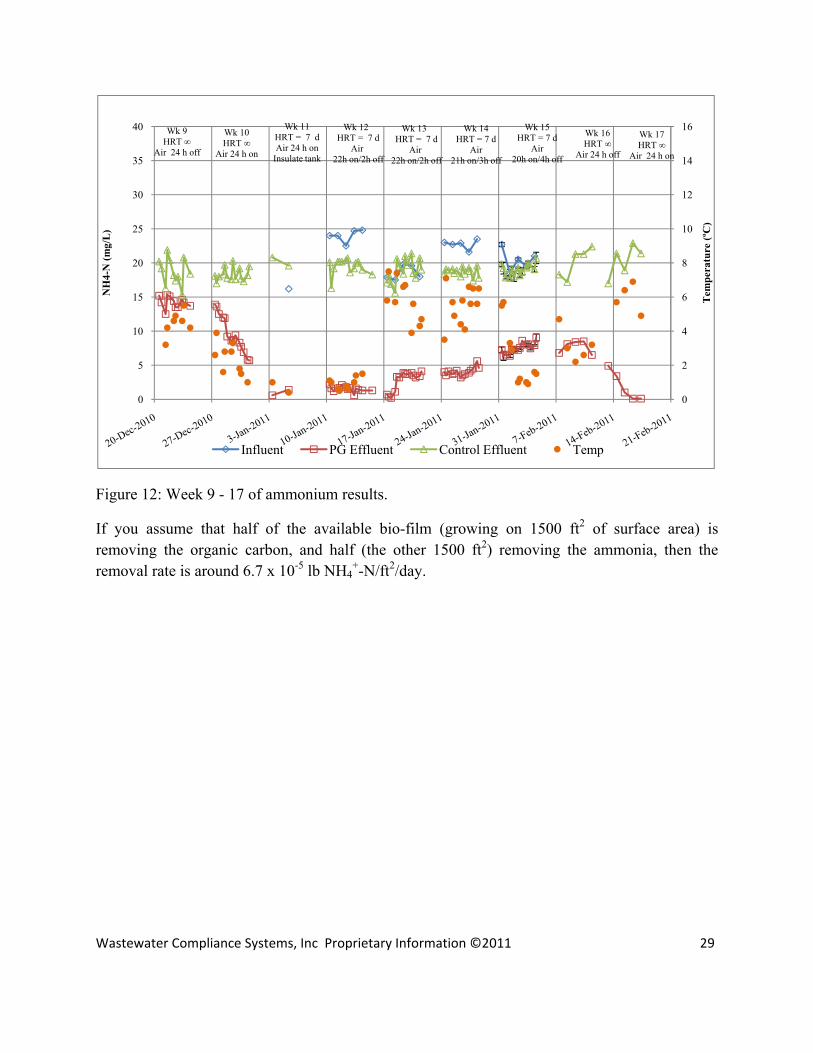
Figure 12: Week 9 - 17 of ammonium results.
If you assume that half of the available bio-film (growing on 1500 ft2 of surface area) is removing the organic carbon, and half (the other 1500 ft2) removing the ammonia, then the removal rate is around 6.7 x 10⁻⁵ lb NH4
+-N/ft2/day.
0
2
4
6
8
10
12
14
16
0
5
10
15
20
25
30
35
40
Tem
pera
ture
(ºC
)
NH
4-N
(mg/
L)
Influent PG Effluent Control Effluent Temp
Wk 9HRT ∞
Air 24 h off
Wk 10HRT ∞
Air 24 h on
Wk 11HRT = 7 dAir 24 h on
Insulate tank
Wk 12 HRT = 7 d
Air 22h on/2h off
Wk 13 HRT = 7 d
Air 22h on/2h off
Wk 14HRT = 7 d
Air21h on/3h off
Wk 15HRT = 7 d
Air20h on/4h off
Wk 16HRT ∞
Air 24 h off
Wk 17HRT ∞
Air 24 h on
Wastewater Compliance Systems, Inc Proprietary Information ©2011 30
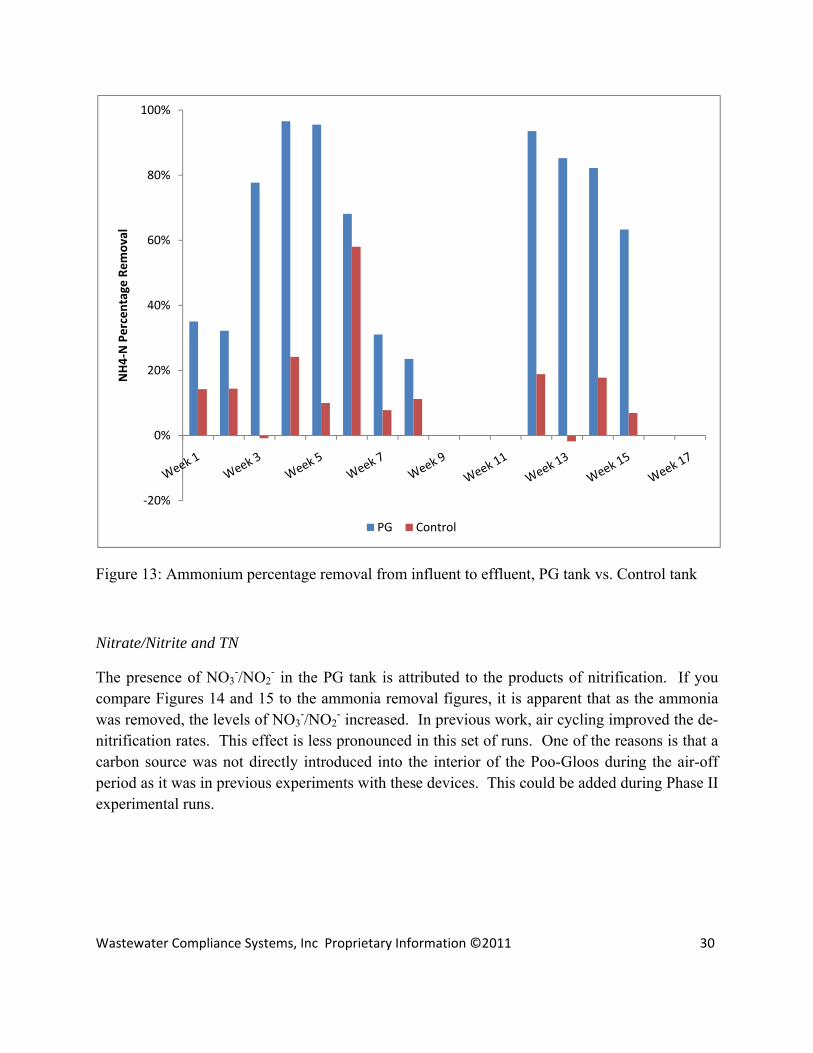
Figure 13: Ammonium percentage removal from influent to effluent, PG tank vs. Control tank
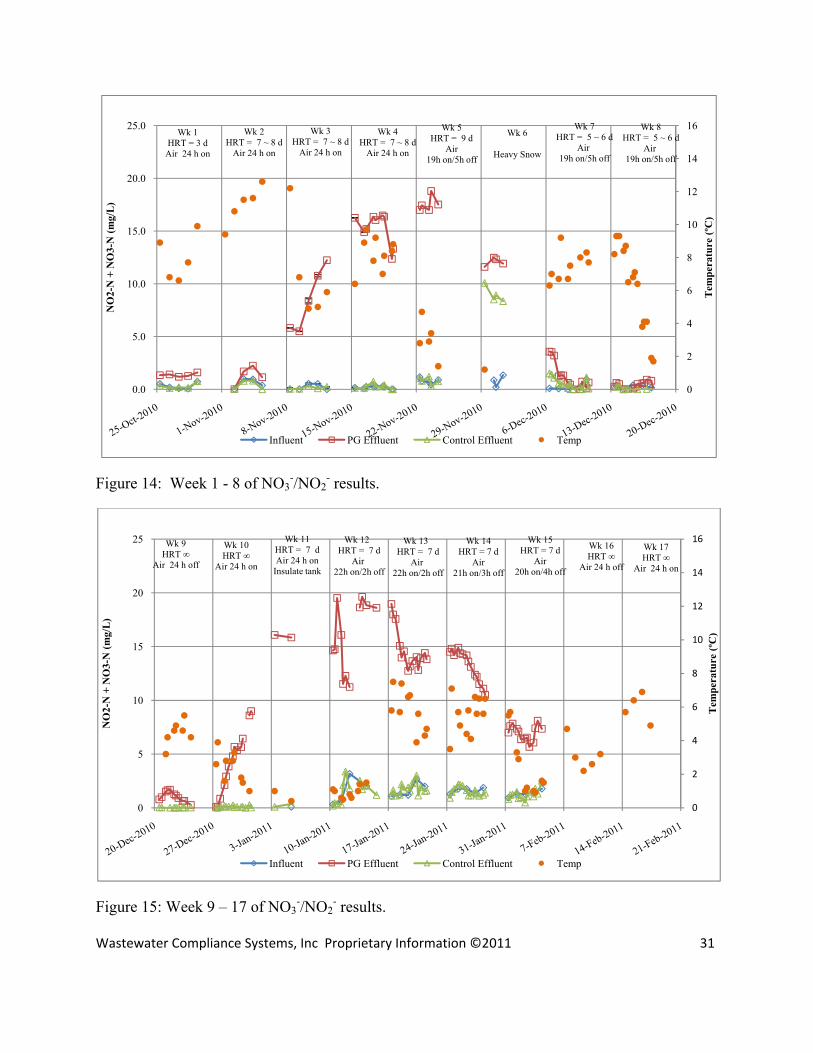
Nitrate/Nitrite and TN
The presence of NO3-/NO2
- in the PG tank is attributed to the products of nitrification. If you compare Figures 14 and 15 to the ammonia removal figures, it is apparent that as the ammonia was removed, the levels of NO3
-/NO2- increased. In previous work, air cycling improved the de-
nitrification rates. This effect is less pronounced in this set of runs. One of the reasons is that a carbon source was not directly introduced into the interior of the Poo-Gloos during the air-off period as it was in previous experiments with these devices. This could be added during Phase II experimental runs.
‐20%
0%
20%
40%
60%
80%
100%NH4‐N Percentage Re
moval
PG Control
Wastewater Compliance Systems, Inc Proprietary Information ©2011 31
Figure 14: Week 1 - 8 of NO3-/NO2
- results.
Figure 15: Week 9 – 17 of NO3-/NO2
- results.
0
2
4
6
8
10
12
14
16
0.0
5.0
10.0
15.0
20.0
25.0
Tem
pera
ture
(ºC
)
NO
2-N
+ N
O3-
N (m
g/L
)
Influent PG Effluent Control Effluent Temp
Wk 1HRT = 3 d
Air 24 h on
Wk 2HRT = 7 ~ 8 d
Air 24 h on
Wk 3HRT = 7 ~ 8 d
Air 24 h on
Wk 4HRT = 7 ~ 8 d
Air 24 h on
Wk 5HRT = 9 d
Air19h on/5h off
Wk 6
Heavy Snow
Wk 7HRT = 5 ~ 6 d
Air 19h on/5h off
Wk 8HRT = 5 ~ 6 d
Air 19h on/5h off
0
2
4
6
8
10
12
14
16
0
5
10
15
20
25
Tem
pera
ture
(ºC
)
NO
2-N
+ N
O3-
N (m
g/L
)
Influent PG Effluent Control Effluent Temp
Wk 9HRT ∞
Air 24 h off
Wk 10HRT ∞
Air 24 h on
Wk 11HRT = 7 dAir 24 h on
Insulate tank
Wk 12 HRT = 7 d
Air 22h on/2h off
Wk 13 HRT = 7 d
Air 22h on/2h off
Wk 14HRT = 7 d
Air21h on/3h off
Wk 15HRT = 7 d
Air20h on/4h off
Wk 16HRT ∞
Air 24 h off
Wk 17HRT ∞
Air 24 h on
Wastewater Compliance Systems, Inc Proprietary Information ©2011 32
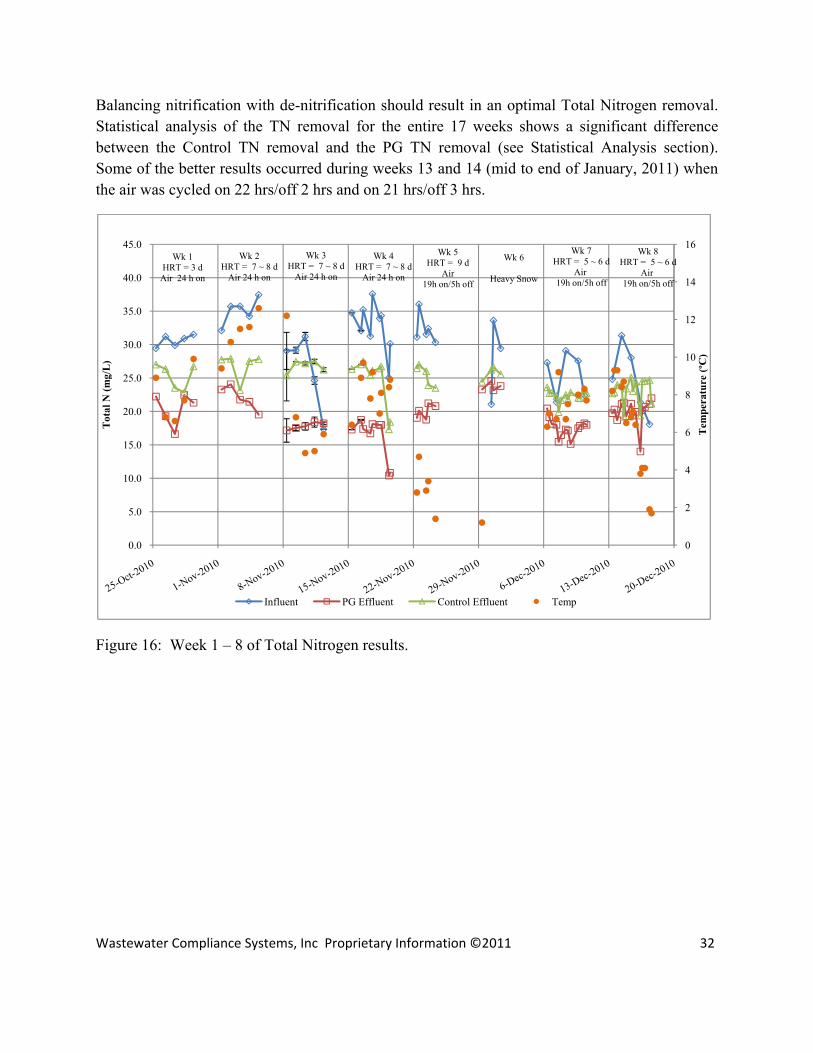
Balancing nitrification with de-nitrification should result in an optimal Total Nitrogen removal. Statistical analysis of the TN removal for the entire 17 weeks shows a significant difference between the Control TN removal and the PG TN removal (see Statistical Analysis section). Some of the better results occurred during weeks 13 and 14 (mid to end of January, 2011) when the air was cycled on 22 hrs/off 2 hrs and on 21 hrs/off 3 hrs.
Figure 16: Week 1 – 8 of Total Nitrogen results.
0
2
4
6
8
10
12
14
16
0.0
5.0
10.0
15.0
20.0
25.0
30.0
35.0
40.0
45.0
Tem
pera
ture
(ºC
)
Tot
al N
(mg/
L)
Influent PG Effluent Control Effluent Temp
Wk 1HRT = 3 d
Air 24 h on
Wk 2HRT = 7 ~ 8 d
Air 24 h on
Wk 3HRT = 7 ~ 8 d
Air 24 h on
Wk 4HRT = 7 ~ 8 d
Air 24 h on
Wk 5HRT = 9 d
Air19h on/5h off
Wk 6
Heavy Snow
Wk 7HRT = 5 ~ 6 d
Air 19h on/5h off
Wk 8HRT = 5 ~ 6 d
Air 19h on/5h off
Wastewater Compliance Systems, Inc Proprietary Information ©2011 33
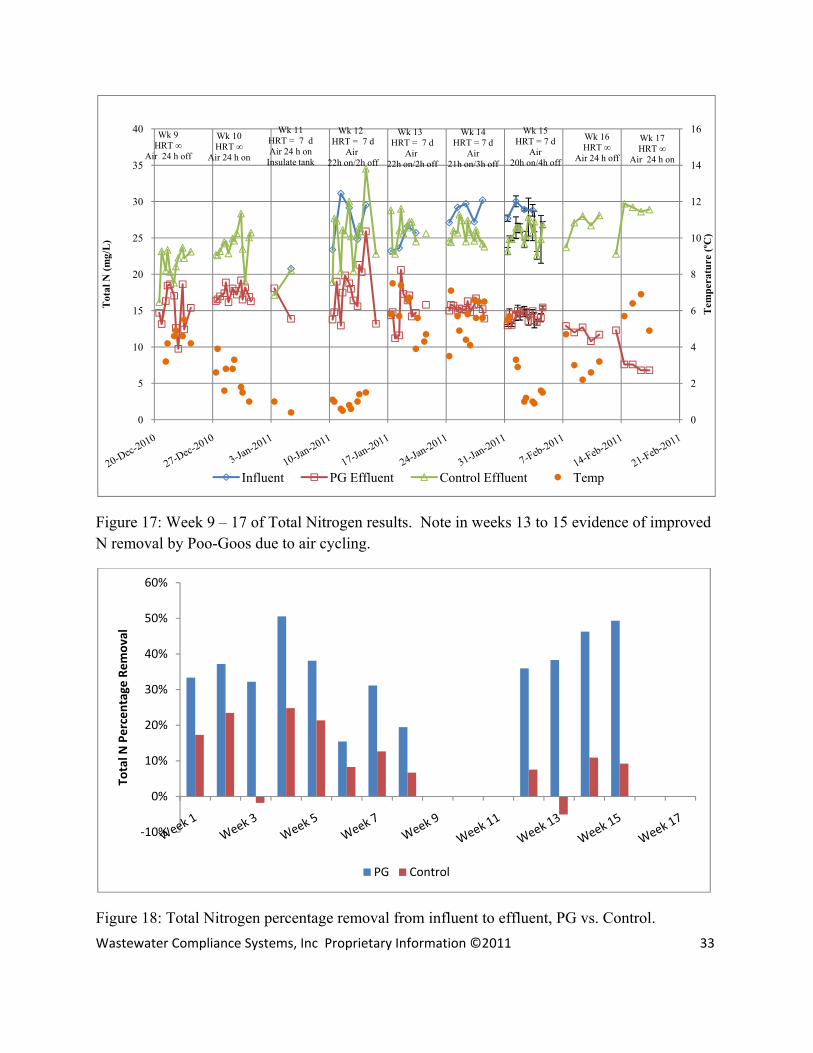
Figure 17: Week 9 – 17 of Total Nitrogen results. Note in weeks 13 to 15 evidence of improved N removal by Poo-Goos due to air cycling.
Figure 18: Total Nitrogen percentage removal from influent to effluent, PG vs. Control.
0
2
4
6
8
10
12
14
16
0
5
10
15
20
25
30
35
40
Tem
pera
ture
(ºC
)
Tot
al N
(mg/
L)
Influent PG Effluent Control Effluent Temp
Wk 9HRT ∞
Air 24 h off
Wk 10HRT ∞
Air 24 h on
Wk 11HRT = 7 dAir 24 h on
Insulate tank
Wk 12 HRT = 7 d
Air 22h on/2h off
Wk 13 HRT = 7 d
Air 22h on/2h off
Wk 14HRT = 7 d
Air21h on/3h off
Wk 15HRT = 7 d
Air20h on/4h off
Wk 16HRT ∞
Air 24 h off
Wk 17HRT ∞
Air 24 h on
‐10%
0%
10%
20%
30%
40%
50%
60%
Total N
Percentage Re
moval
PG Control
Wastewater Compliance Systems, Inc Proprietary Information ©2011 34
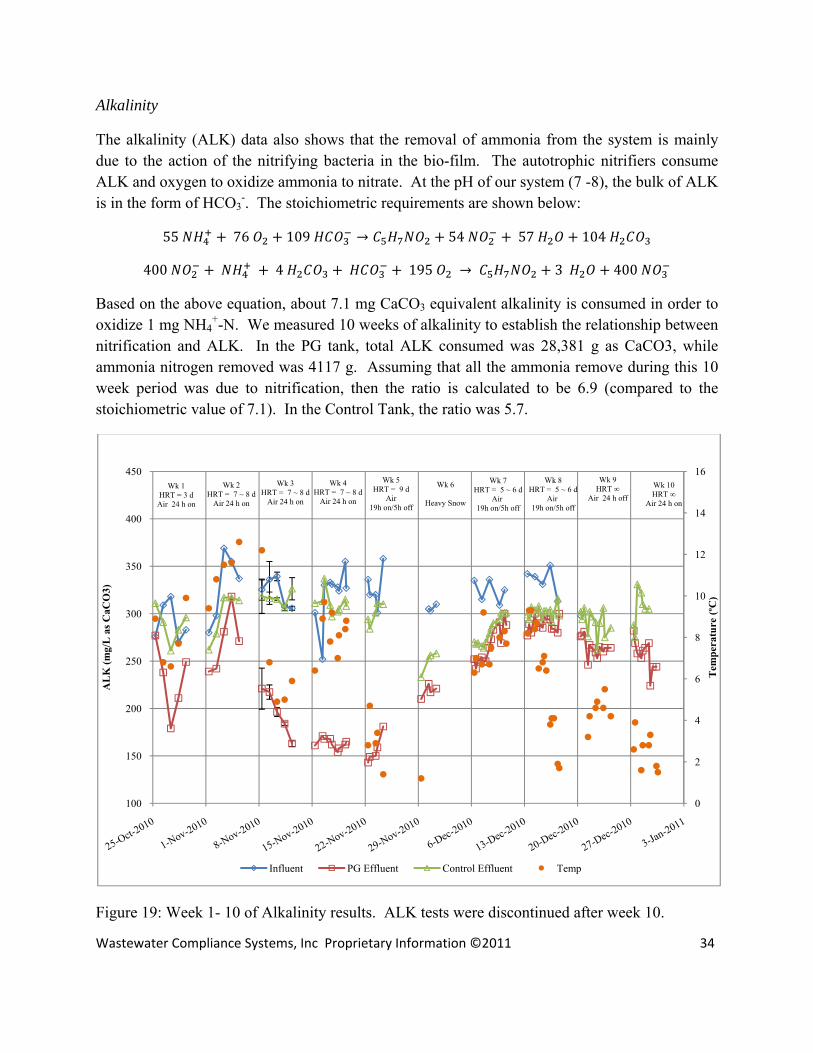
Alkalinity
The alkalinity (ALK) data also shows that the removal of ammonia from the system is mainly due to the action of the nitrifying bacteria in the bio-film. The autotrophic nitrifiers consume ALK and oxygen to oxidize ammonia to nitrate. At the pH of our system (7 -8), the bulk of ALK is in the form of HCO3
-. The stoichiometric requirements are shown below:
55 76 109 54 57 104
400 4 195 3 400
Based on the above equation, about 7.1 mg CaCO3 equivalent alkalinity is consumed in order to oxidize 1 mg NH4
+-N. We measured 10 weeks of alkalinity to establish the relationship between nitrification and ALK. In the PG tank, total ALK consumed was 28,381 g as CaCO3, while ammonia nitrogen removed was 4117 g. Assuming that all the ammonia remove during this 10 week period was due to nitrification, then the ratio is calculated to be 6.9 (compared to the stoichiometric value of 7.1). In the Control Tank, the ratio was 5.7.
Figure 19: Week 1- 10 of Alkalinity results. ALK tests were discontinued after week 10.
0
2
4
6
8
10
12
14
16
100
150
200
250
300
350
400
450
Tem
pera
ture
(ºC
)
AL
K (m
g/L
as C
aCO
3)
Influent PG Effluent Control Effluent Temp
Wk 1HRT = 3 d
Air 24 h on
Wk 2HRT = 7 ~ 8 d
Air 24 h on
Wk 3HRT = 7 ~ 8 d
Air 24 h on
Wk 4HRT = 7 ~ 8 d
Air 24 h on
Wk 5HRT = 9 d
Air19h on/5h off
Wk 6
Heavy Snow
Wk 7HRT = 5 ~ 6 d
Air 19h on/5h off
Wk 8HRT = 5 ~ 6 d
Air 19h on/5h off
Wk 9HRT ∞
Air 24 h offWk 10HRT ∞
Air 24 h on
Wastewater Compliance Systems, Inc Proprietary Information ©2011 35
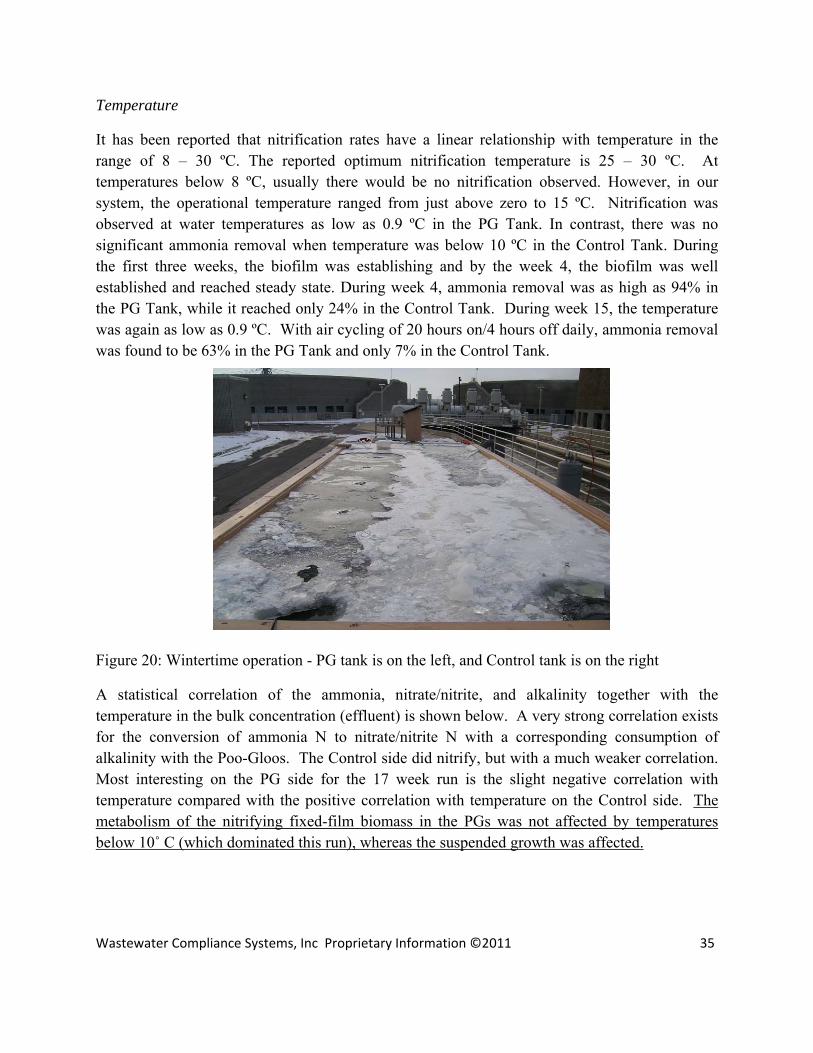
Temperature
It has been reported that nitrification rates have a linear relationship with temperature in the range of 8 – 30 ºC. The reported optimum nitrification temperature is 25 – 30 ºC. At temperatures below 8 ºC, usually there would be no nitrification observed. However, in our system, the operational temperature ranged from just above zero to 15 ºC. Nitrification was observed at water temperatures as low as 0.9 ºC in the PG Tank. In contrast, there was no significant ammonia removal when temperature was below 10 ºC in the Control Tank. During the first three weeks, the biofilm was establishing and by the week 4, the biofilm was well established and reached steady state. During week 4, ammonia removal was as high as 94% in the PG Tank, while it reached only 24% in the Control Tank. During week 15, the temperature was again as low as 0.9 ºC. With air cycling of 20 hours on/4 hours off daily, ammonia removal was found to be 63% in the PG Tank and only 7% in the Control Tank.
Figure 20: Wintertime operation - PG tank is on the left, and Control tank is on the right
A statistical correlation of the ammonia, nitrate/nitrite, and alkalinity together with the temperature in the bulk concentration (effluent) is shown below. A very strong correlation exists for the conversion of ammonia N to nitrate/nitrite N with a corresponding consumption of alkalinity with the Poo-Gloos. The Control side did nitrify, but with a much weaker correlation. Most interesting on the PG side for the 17 week run is the slight negative correlation with temperature compared with the positive correlation with temperature on the Control side. The metabolism of the nitrifying fixed-film biomass in the PGs was not affected by temperatures below 10˚ C (which dominated this run), whereas the suspended growth was affected.
Wastewater Compliance Systems, Inc Proprietary Information ©2011 36
Table 5: Data correlation for nitrification parameters from October, 2010 to February, 2011
Parameter vs. Parameter Correlation PG Ammonia Concentration vs. PG Nitrates/Nitrites - 0.93 PG Ammonia Concentration vs. PG Alkalinity 0.90
PG Ammonia Removal vs. Temperature - 0.13 Control Ammonia Concentration vs. Control Nitrates/Nitrites - 0.40 Control Ammonia Concentration vs. Control Alkalinity 0.44
Control Ammonia Removal vs. Temperature 0.32
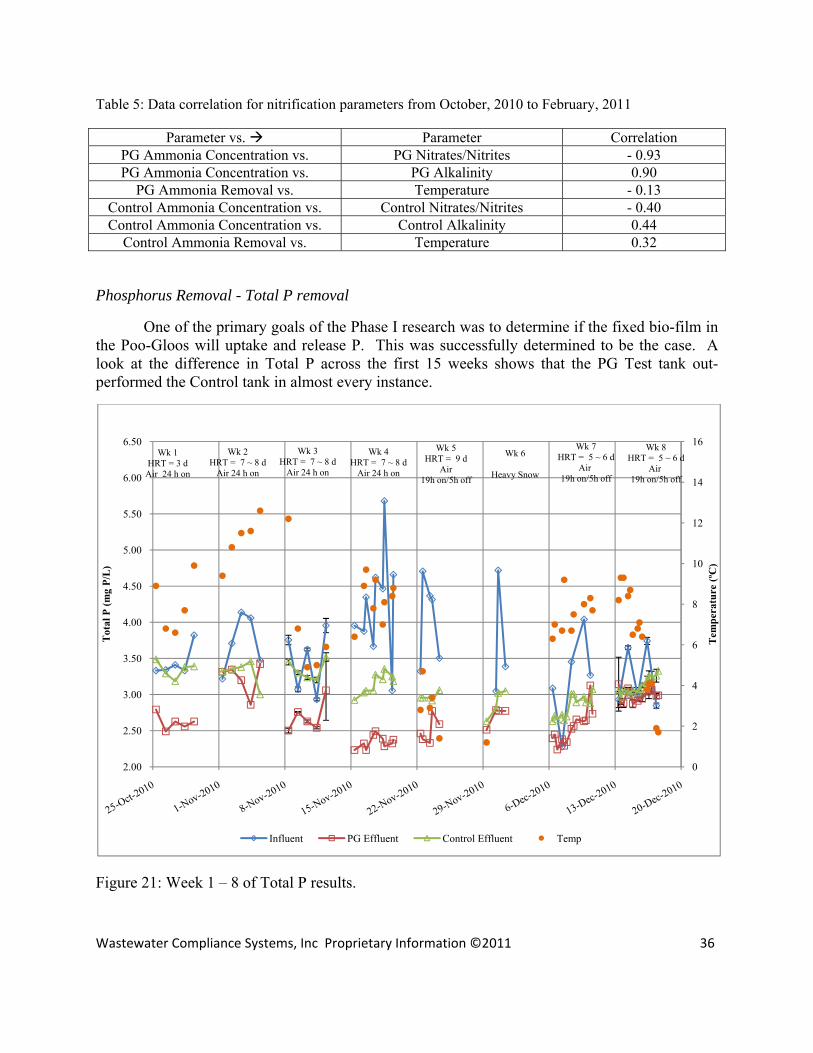
Phosphorus Removal - Total P removal
One of the primary goals of the Phase I research was to determine if the fixed bio-film in the Poo-Gloos will uptake and release P. This was successfully determined to be the case. A look at the difference in Total P across the first 15 weeks shows that the PG Test tank out-performed the Control tank in almost every instance.
Figure 21: Week 1 – 8 of Total P results.
0
2
4
6
8
10
12
14
16
2.00
2.50
3.00
3.50
4.00
4.50
5.00
5.50
6.00
6.50
Tem
pera
ture
(ºC
)
Tot
al P
(mg
P/L
)
Influent PG Effluent Control Effluent Temp
Wk 1HRT = 3 d
Air 24 h on
Wk 2HRT = 7 ~ 8 d
Air 24 h on
Wk 3HRT = 7 ~ 8 d
Air 24 h on
Wk 4HRT = 7 ~ 8 d
Air 24 h on
Wk 5HRT = 9 d
Air19h on/5h off
Wk 6
Heavy Snow
Wk 7HRT = 5 ~ 6 d
Air 19h on/5h off
Wk 8HRT = 5 ~ 6 d
Air 19h on/5h off
Wastewater Compliance Systems, Inc Proprietary Information ©2011 37
Figure 21 shows the results from the first 8 weeks. When wastewater was flowing into (and out of) the tanks, the difference between the Influent TP concentration and the Effluent TP (bulk concentration) multiplied by the flow equals the accumulation of P in each tank. Numerically summing the TP accumulation for weeks 1-8 yields a total of 44.2 grams in the PG Test tank side and 24.2 grams in the Control side. (The first several weeks’ accumulation must be attributed to the anabolic requirements of initial bacterial colonization of the 280 m2 on the PG Test tank side as well as side and bottom accumulation on both sides.) Short HRT during weeks 7-8 overloaded the system and less removal was observed.
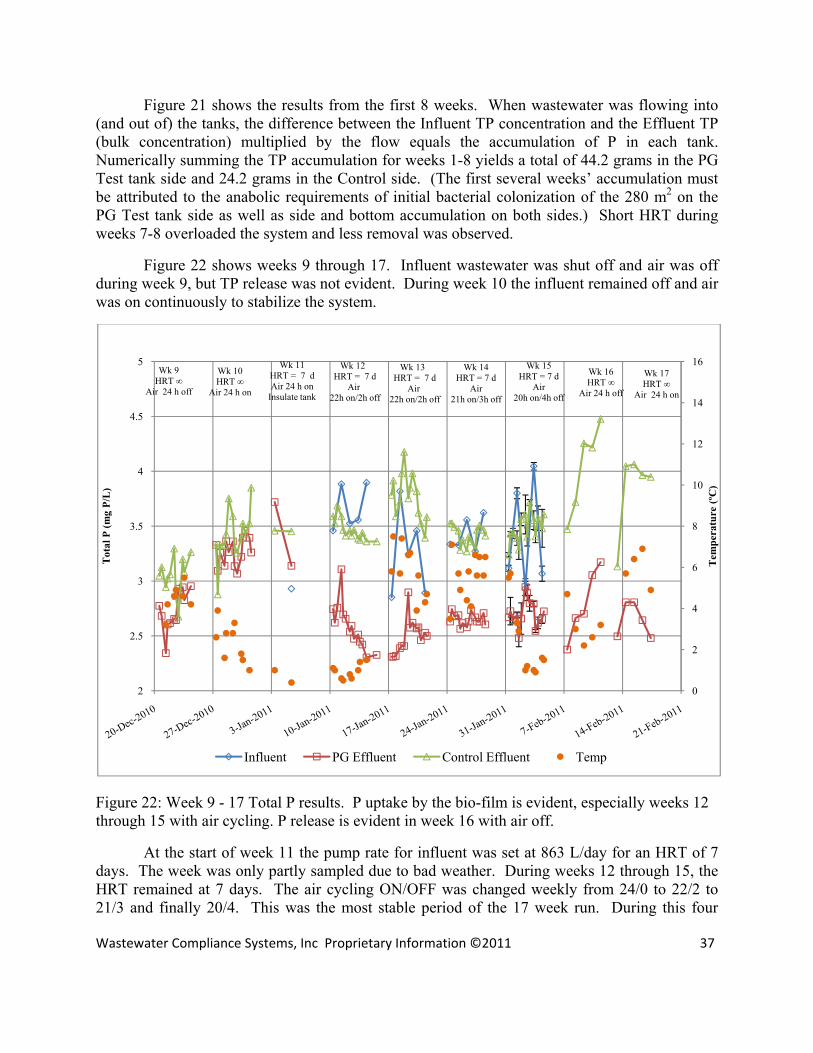
Figure 22 shows weeks 9 through 17. Influent wastewater was shut off and air was off during week 9, but TP release was not evident. During week 10 the influent remained off and air was on continuously to stabilize the system.
Figure 22: Week 9 - 17 Total P results. P uptake by the bio-film is evident, especially weeks 12 through 15 with air cycling. P release is evident in week 16 with air off.
At the start of week 11 the pump rate for influent was set at 863 L/day for an HRT of 7 days. The week was only partly sampled due to bad weather. During weeks 12 through 15, the HRT remained at 7 days. The air cycling ON/OFF was changed weekly from 24/0 to 22/2 to 21/3 and finally 20/4. This was the most stable period of the 17 week run. During this four
0
2
4
6
8
10
12
14
16
2
2.5
3
3.5
4
4.5
5
Tem
pera
ture
(ºC
)
Tot
al P
(mg
P/L
)
Influent PG Effluent Control Effluent Temp
Wk 9HRT ∞
Air 24 h off
Wk 10HRT ∞
Air 24 h on
Wk 11HRT = 7 dAir 24 h on
Insulate tank
Wk 12 HRT = 7 d
Air 22h on/2h off
Wk 13 HRT = 7 d
Air 22h on/2h off
Wk 14HRT = 7 d
Air21h on/3h off
Wk 15HRT = 7 d
Air20h on/4h off
Wk 16HRT ∞
Air 24 h off
Wk 17HRT ∞
Air 24 h on
Wastewater Compliance Systems, Inc Proprietary Information ©2011 38
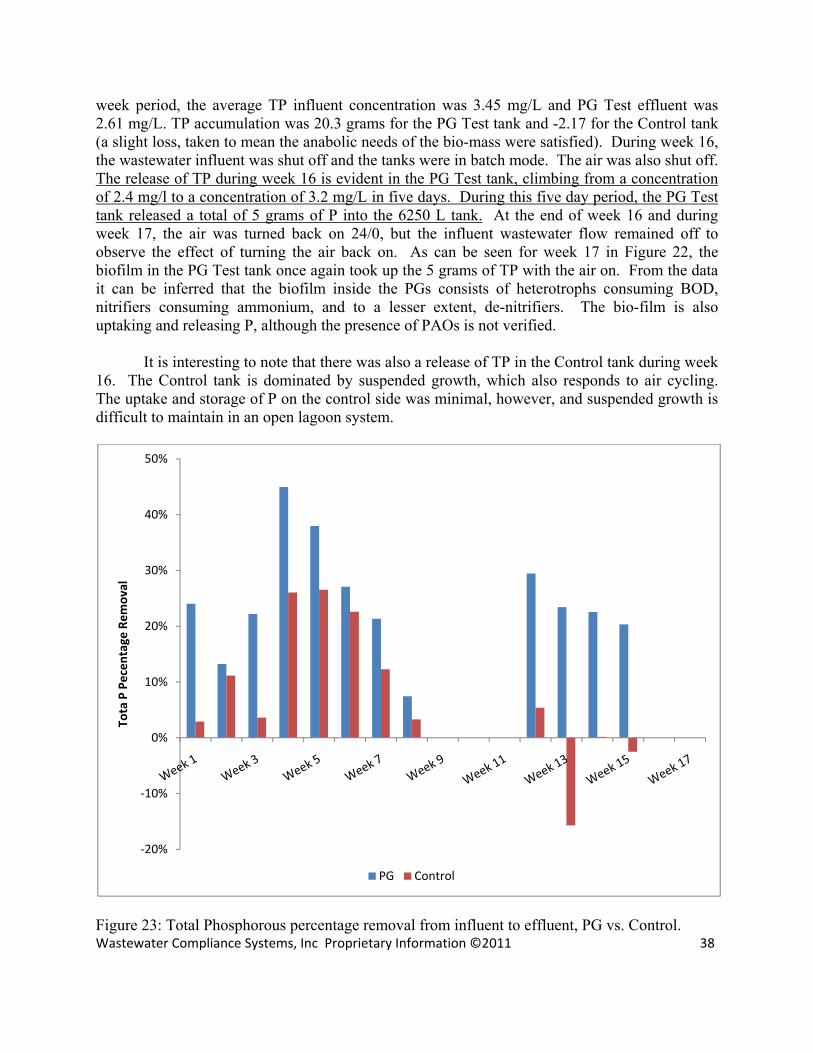
week period, the average TP influent concentration was 3.45 mg/L and PG Test effluent was 2.61 mg/L. TP accumulation was 20.3 grams for the PG Test tank and -2.17 for the Control tank (a slight loss, taken to mean the anabolic needs of the bio-mass were satisfied). During week 16, the wastewater influent was shut off and the tanks were in batch mode. The air was also shut off. The release of TP during week 16 is evident in the PG Test tank, climbing from a concentration of 2.4 mg/l to a concentration of 3.2 mg/L in five days. During this five day period, the PG Test tank released a total of 5 grams of P into the 6250 L tank. At the end of week 16 and during week 17, the air was turned back on 24/0, but the influent wastewater flow remained off to observe the effect of turning the air back on. As can be seen for week 17 in Figure 22, the biofilm in the PG Test tank once again took up the 5 grams of TP with the air on. From the data it can be inferred that the biofilm inside the PGs consists of heterotrophs consuming BOD, nitrifiers consuming ammonium, and to a lesser extent, de-nitrifiers. The bio-film is also uptaking and releasing P, although the presence of PAOs is not verified.
It is interesting to note that there was also a release of TP in the Control tank during week
16. The Control tank is dominated by suspended growth, which also responds to air cycling. The uptake and storage of P on the control side was minimal, however, and suspended growth is difficult to maintain in an open lagoon system.
Figure 23: Total Phosphorous percentage removal from influent to effluent, PG vs. Control.
‐20%
‐10%
0%
10%
20%
30%
40%
50%
Tota P Pecen
tage
Rem
oval
PG Control
Wastewater Compliance Systems, Inc Proprietary Information ©2011 39
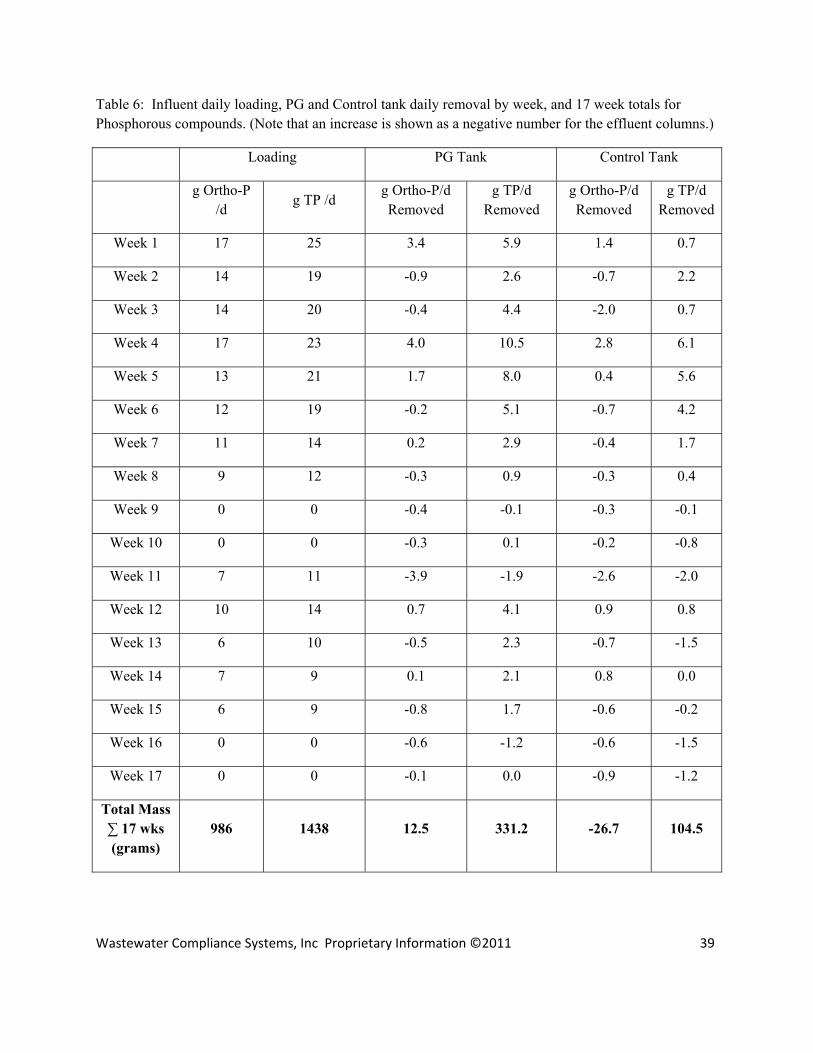
Table 6: Influent daily loading, PG and Control tank daily removal by week, and 17 week totals for Phosphorous compounds. (Note that an increase is shown as a negative number for the effluent columns.)
Loading PG Tank Control Tank
g Ortho-P /d
g TP /d g Ortho-P/d Removed
g TP/d Removed
g Ortho-P/d Removed
g TP/d Removed
Week 1 17 25 3.4 5.9 1.4 0.7
Week 2 14 19 -0.9 2.6 -0.7 2.2
Week 3 14 20 -0.4 4.4 -2.0 0.7
Week 4 17 23 4.0 10.5 2.8 6.1
Week 5 13 21 1.7 8.0 0.4 5.6
Week 6 12 19 -0.2 5.1 -0.7 4.2
Week 7 11 14 0.2 2.9 -0.4 1.7
Week 8 9 12 -0.3 0.9 -0.3 0.4
Week 9 0 0 -0.4 -0.1 -0.3 -0.1
Week 10 0 0 -0.3 0.1 -0.2 -0.8
Week 11 7 11 -3.9 -1.9 -2.6 -2.0
Week 12 10 14 0.7 4.1 0.9 0.8
Week 13 6 10 -0.5 2.3 -0.7 -1.5
Week 14 7 9 0.1 2.1 0.8 0.0
Week 15 6 9 -0.8 1.7 -0.6 -0.2
Week 16 0 0 -0.6 -1.2 -0.6 -1.5
Week 17 0 0 -0.1 0.0 -0.9 -1.2
Total Mass ∑ 17 wks (grams)
986 1438 12.5 331.2 -26.7 104.5
Wastewater Compliance Systems, Inc Proprietary Information ©2011 40
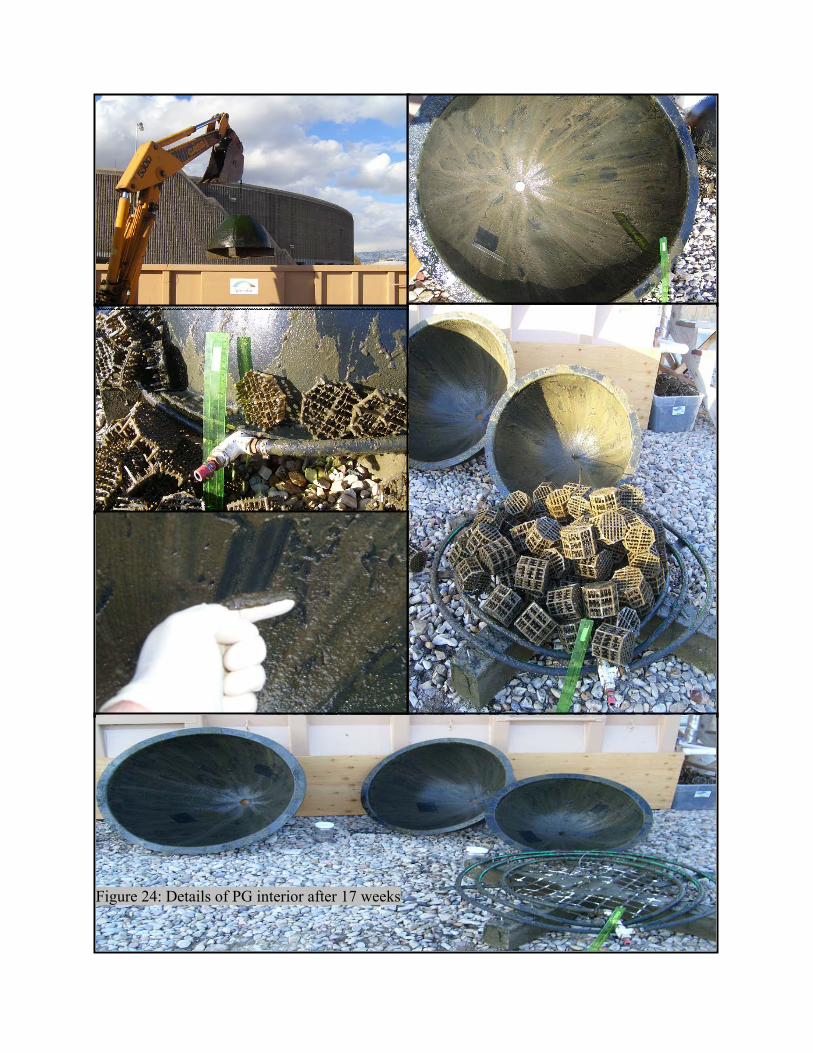
Figure 24: Details of PG interior after 17 weeks
Wastewater Compliance Systems, Inc Proprietary Information ©2011 41
Following week 17, one PG was removed from the mid-point of the PG Test tank and taken apart. Biofilm samples were taken from 9 locations inside the domes. The results show that the dry mass of the biofilm covers a colonized surface at 34.6 g/m2 and the amount of P in the dry mass is 1.4%.
Figure 24 shows photos of the mid-tank PG as it is taken apart, and the biofilm sampling locations. Note striation patterns left by the air bubbles on the inner surface biofilm. Biofilm on the inner surfaces of the domes and on the Lanpac material was about 2 + mm thick. Note also that there is no evidence of clogging. The scrubbed off biofilm seems to land on the outer surface of the next dome under it, then slump off and out the bottom to become part of the bottom sediments.
Weeks 12 to 15 show what is possible for P uptake by the existing biofilm in the six PGs, and week 16 shows what is possible for P release with extended air-off. This is with a biofilm that is 1.4% P, and the presence or absence of specific PAOs is not yet verified.
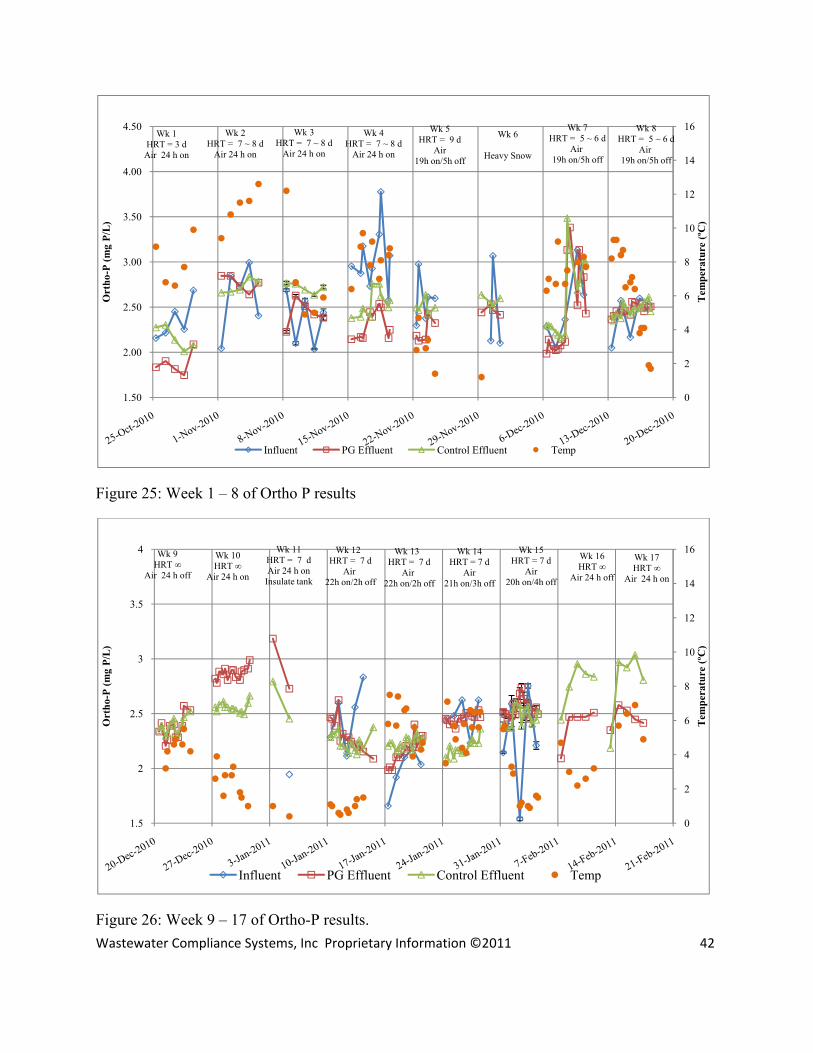
Phosphorous Removal - Ortho-P
Weeks 7, 8, 9 and 10 provide an interesting look at P uptake and release as PO43-. During weeks
7 and 8, the air was cycled 19 hrs on/5 hrs off, and the system was fed 312 gallons (1181 L) per day at an average concentration of 3.23 mg/L. The Total P effluent from the Poo-Gloo side averaged 2.77 mg/L. Total P uptake for this two week (14 day) period was (1181 * (3.23-2.77) * 14) = 7605 mg or 7.6 grams. During week 9, the air was off except for a 5 minute pulse every 6 hours to mix the water. There was also no influent. During week 10, the air was turned on continuously. Influent was still off. Simultaneous to this, there was a significant increase in the Ortho P concentration.
Wastewater Compliance Systems, Inc Proprietary Information ©2011 42
Figure 25: Week 1 – 8 of Ortho P results
Figure 26: Week 9 – 17 of Ortho-P results.
0
2
4
6
8
10
12
14
16
1.50
2.00
2.50
3.00
3.50
4.00
4.50
Tem
pera
ture
(ºC
)
Ort
ho-P
(mg
P/L
)
Influent PG Effluent Control Effluent Temp
Wk 1HRT = 3 d
Air 24 h on
Wk 2HRT = 7 ~ 8 d
Air 24 h on
Wk 3HRT = 7 ~ 8 d
Air 24 h on
Wk 4HRT = 7 ~ 8 d
Air 24 h on
Wk 5HRT = 9 d
Air19h on/5h off
Wk 6
Heavy Snow
Wk 7HRT = 5 ~ 6 d
Air 19h on/5h off
Wk 8HRT = 5 ~ 6 d
Air 19h on/5h off
0
2
4
6
8
10
12
14
16
1.5
2
2.5
3
3.5
4
Tem
pera
ture
(ºC
)
Ort
ho-P
(mg
P/L
)
Influent PG Effluent Control Effluent Temp
Wk 9HRT ∞
Air 24 h off
Wk 10HRT ∞
Air 24 h on
Wk 11HRT = 7 dAir 24 h on
Insulate tank
Wk 12 HRT = 7 d
Air 22h on/2h off
Wk 13 HRT = 7 d
Air 22h on/2h off
Wk 14HRT = 7 d
Air21h on/3h off
Wk 15HRT = 7 d
Air20h on/4h off
Wk 16HRT ∞
Air 24 h off
Wk 17HRT ∞
Air 24 h on
Wastewater Compliance Systems, Inc Proprietary Information ©2011 43
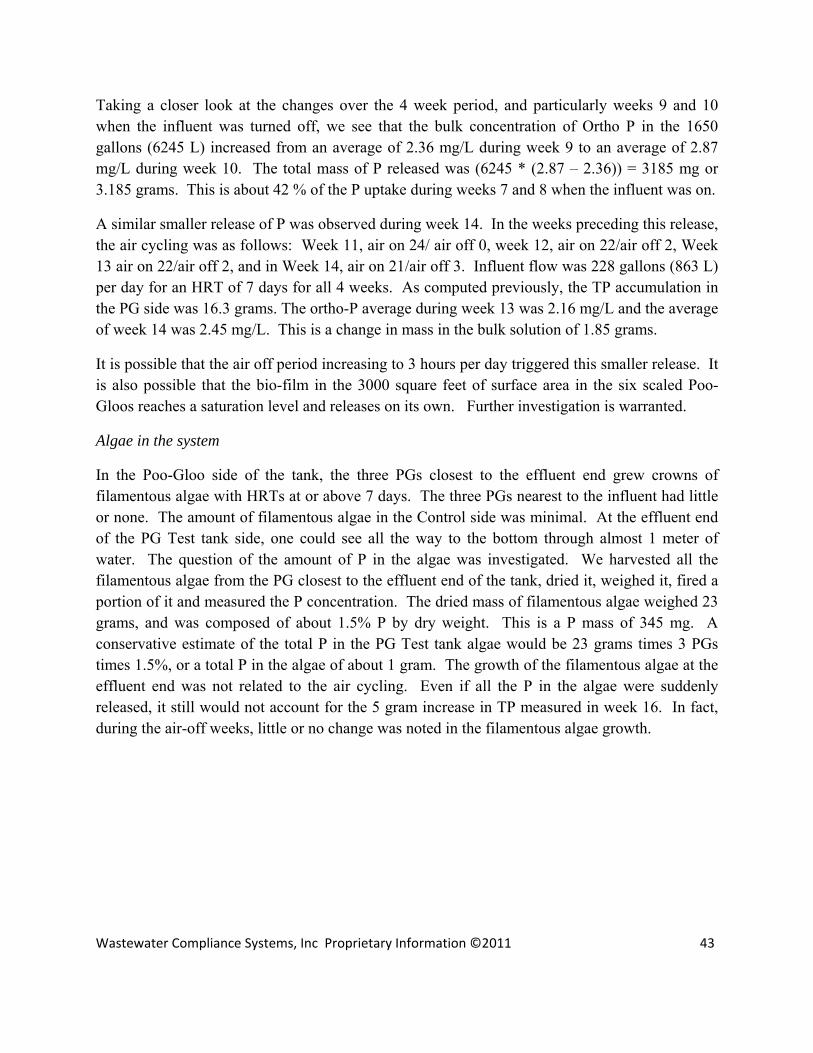
Taking a closer look at the changes over the 4 week period, and particularly weeks 9 and 10 when the influent was turned off, we see that the bulk concentration of Ortho P in the 1650 gallons (6245 L) increased from an average of 2.36 mg/L during week 9 to an average of 2.87 mg/L during week 10. The total mass of P released was (6245 * (2.87 – 2.36)) = 3185 mg or 3.185 grams. This is about 42 % of the P uptake during weeks 7 and 8 when the influent was on.
A similar smaller release of P was observed during week 14. In the weeks preceding this release, the air cycling was as follows: Week 11, air on 24/ air off 0, week 12, air on 22/air off 2, Week 13 air on 22/air off 2, and in Week 14, air on 21/air off 3. Influent flow was 228 gallons (863 L) per day for an HRT of 7 days for all 4 weeks. As computed previously, the TP accumulation in the PG side was 16.3 grams. The ortho-P average during week 13 was 2.16 mg/L and the average of week 14 was 2.45 mg/L. This is a change in mass in the bulk solution of 1.85 grams.
It is possible that the air off period increasing to 3 hours per day triggered this smaller release. It is also possible that the bio-film in the 3000 square feet of surface area in the six scaled Poo-Gloos reaches a saturation level and releases on its own. Further investigation is warranted.
Algae in the system
In the Poo-Gloo side of the tank, the three PGs closest to the effluent end grew crowns of filamentous algae with HRTs at or above 7 days. The three PGs nearest to the influent had little or none. The amount of filamentous algae in the Control side was minimal. At the effluent end of the PG Test tank side, one could see all the way to the bottom through almost 1 meter of water. The question of the amount of P in the algae was investigated. We harvested all the filamentous algae from the PG closest to the effluent end of the tank, dried it, weighed it, fired a portion of it and measured the P concentration. The dried mass of filamentous algae weighed 23 grams, and was composed of about 1.5% P by dry weight. This is a P mass of 345 mg. A conservative estimate of the total P in the PG Test tank algae would be 23 grams times 3 PGs times 1.5%, or a total P in the algae of about 1 gram. The growth of the filamentous algae at the effluent end was not related to the air cycling. Even if all the P in the algae were suddenly released, it still would not account for the 5 gram increase in TP measured in week 16. In fact, during the air-off weeks, little or no change was noted in the filamentous algae growth.
Wastewater Compliance Systems, Inc Proprietary Information ©2011 44
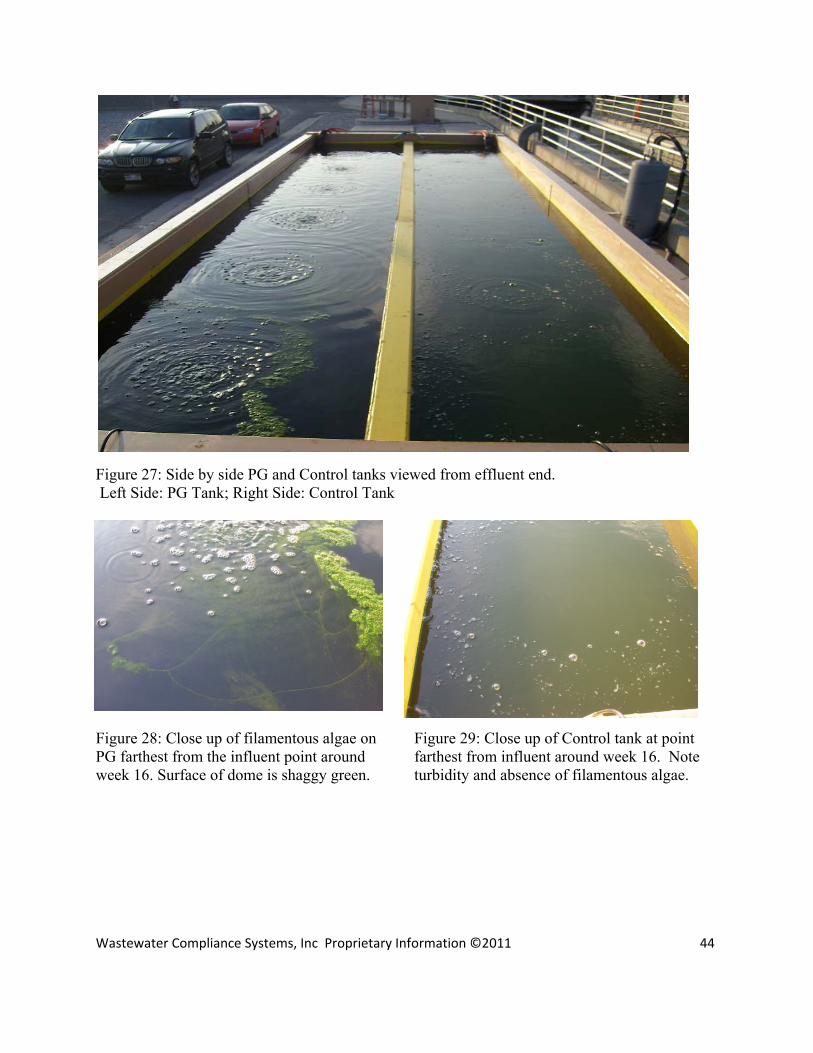
Figure 27: Side by side PG and Control tanks viewed from effluent end. Left Side: PG Tank; Right Side: Control Tank
Figure 28: Close up of filamentous algae on PG farthest from the influent point around week 16. Surface of dome is shaggy green.
Figure 29: Close up of Control tank at point farthest from influent around week 16. Note turbidity and absence of filamentous algae.
Wastewater Compliance Systems, Inc Proprietary Information ©2011 45
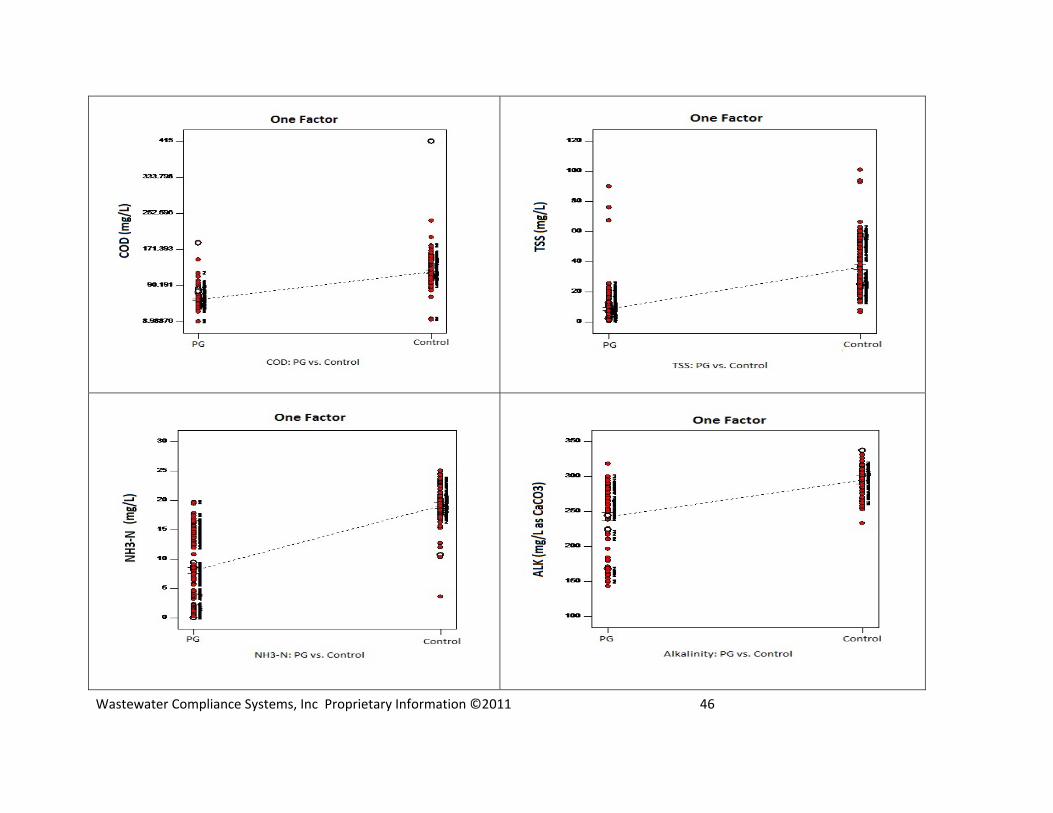
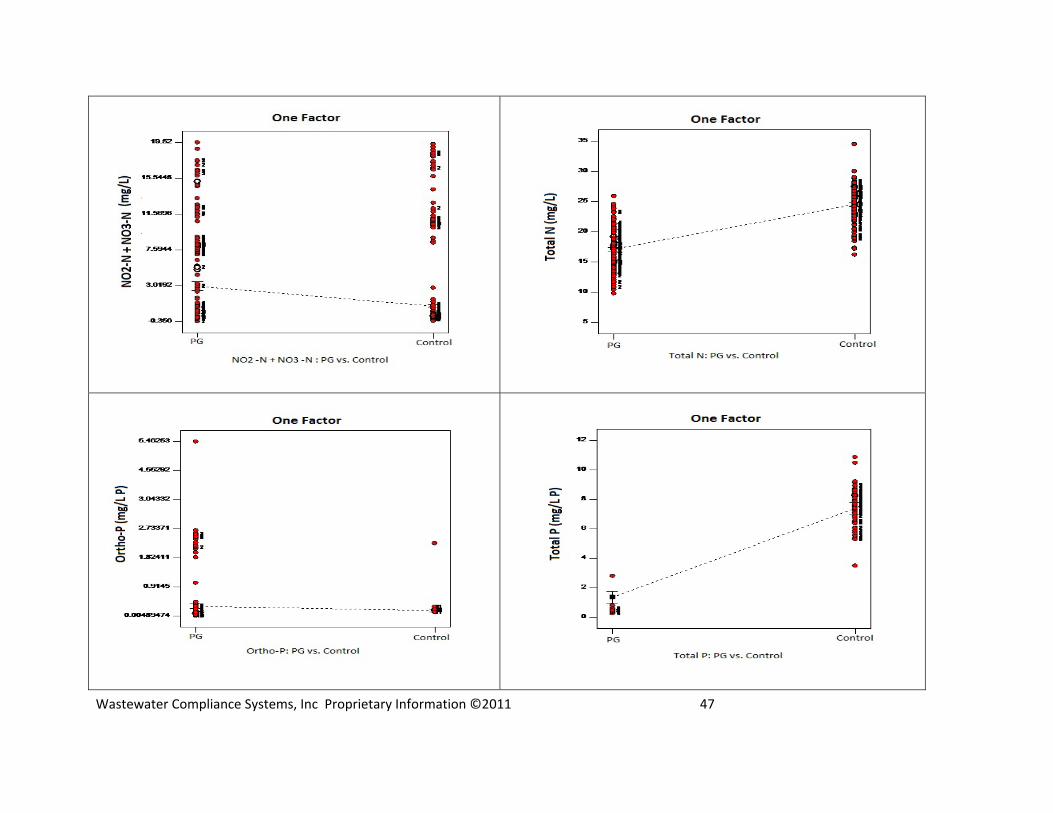
Statistical Analysis
Statistical Anaylsis for the 17 week run, comparing PG effluent to Control effluent
The following is the graphical results of the analysis of the historical data gathered from the WCS - Poo-Gloo (PG) experiment. Analysis was conducted by Design-Expert™ version 8.
The data was collected on the Influent, Control, and the PG effluent. Because the influent make up, inflow rates, and temperature varied from test to test it is likely some of the variation in the responses were related to these uncontrolled inputs. To compensate for this possible effect, day to day variation was adjusted out of the analysis through blocking. The result becomes a one factor analysis as to whether or not the PG treatment is different than the control treatment.
On the graphs the individual observations are displayed along with an estimate of the Least Significant Difference (LSD). When there is a significant ANOVA model, the LSD bars can be compared. If the bounds of two LSD estimates do not overlap (top to bottom) then the means of the treatments are considered significantly different. The results are below:
• TSS is significantly lower on average for the PG installation than it is for the Control. • COD is significantly lower on average for the PG installation than it is for the Control. • Ammonia is significantly lower on average for the PG installation than it is for the Control. • ALK is significantly lower on average for the PG installation than it is for the Control. • Total N is significantly lower on average for the PG installation than it is for the Control. • NO2
-+ NO3- is significantly higher on average for the PG installation than it is for the
Control. • Ortho-P as P is somewhat higher on average for the PG installation than it is for the Control. • Total P as P is significantly lower on average for the PG installation than it is for the
Control.
Wastewater Compliance Systems, Inc Proprietary Information ©2011 46
Wastewater Compliance Systems, Inc Proprietary Information ©2011 47
Wastewater Compliance Systems, Inc Proprietary Information ©2011 48
Commercialization Plan:
Introduction & Background Our commercial plan is designed to profitably scale operations and launch new market applications for an existing product to biologically remove phosphorus (P) from municipal wastewater lagoons located in rural areas. Our existing product, called Poo-Gloo, sells for $3,250 each and installation of only a few dozen of the submerged, igloo-shaped, aerated bio-reactors will remove a variety of regulated contaminants from wastewater lagoons. Since the company’s founding in 2008, WCS sold over 200 Poo-Gloos to reduce regulated contaminants of ammonia, nitrogen, and related compounds by supplying each device with continuous aeration. Our Phase-I SBIR work confirmed that phosphorus reduction can also occur in the existing product when air is cycled on and off at precisely designated intervals. Air cycling for phosphorus removal opens new markets applications, enhances the value of existing devices, and allows municipalities to reduce phosphorus where it is harmful (in lagoon effluent) and make it available where it is valuable (land application for agriculture use). Phosphorus is a regulated contaminant commonly found in wastewater lagoon effluent that promotes uncontrolled growth of undesirable downstream microbes such as harmful algal blooms. Conventional chemical methods for removing phosphorus involve multi-million dollar mechanical plants that small communities (pop 500-5,000) can seldom afford. Our patented technology provides an economical means to increase phosphorus-absorbing bio-films using Poo-Gloos as drop-in retrofit devices that can be readily installed into any existing lagoon on an as-needed, incremental basis. The proprietary aeration devices are submersible plastic domes that are concentrically nested to increase bio-film surface area, and provide all requisite conditions to allow beneficial bacterial colonies to flourish. The domes are mounted on a concrete base and each complete unit sits on the lagoon bottom. Poo-Gloos are aerated by means of introducing low pressure compressed air around the circumference of each dome base which then percolates upward to exit a small top hole. As small air bubbles migrate up the inside of each dome, they provide needed oxygen and micro-mixing of nitrogen and phosphorus nutrients with a bacterial bio-film attached to the protected inner wall in a dark environment. The bottom-to-top flow of bubbles creates an airlift effect that circulates entire lagoon contents to prevent stratification and thermoclines that decrease lagoon effectiveness.
Technology Background & Operation
Shallow lagoon systems are one of the most widely deployed, economical means to treat wastewater from municipalities. Lagoons provide an open body of water exposed to sun and wind to facilitate natural reduction of regulated contaminants such as biochemical oxygen demand (BOD), total suspended solids (TSS), and nutrients (ammonia and nitrogen compounds) by means of physical settling and biological breakdown. Beneficial bacteria are the primary workhorses in consuming harmful compounds in a lagoon, and successful systems use diverse colonies of bacteria to work together in balanced, symbiotic communities.
Wastewater Compliance Systems, Inc Proprietary Information ©2011 49
In most lagoons, there is usually enough capacity for physical settling of solid compounds. Often such lagoons lack diversity of beneficial bacteria to consume all types of dissolved compounds, resulting in non-compliant discharge water. What is needed to enhance the performance of lagoon systems is a way to provide a home for the beneficial bacteria to flourish. Such a home has lots of surface area out of the sunlight for the bacteria to colonize, with oxygenating bubbles and water circulating past the bio-film. Our patented Poo-Gloos provide all the requisite conditions described above.
The proprietary technology enables lagoon operators to maintain sufficient symbiotic bacterial colonies in the form of a fixed bio-film. Fixed film, compared to conventional suspended growth systems, allows the beneficial bacteria to continue working at 1-2 ºC above freezing. Suspended growth systems typically stop working at 10-12 ºC. The advantage of a fixed bio-film is an important consideration for high latitude operators who struggle to meet wintertime regulations when lagoon water temperatures are often in the 2-9 ºC range.
To flourish, fixed bio-film bacterial colonies require a surface (substrate) to adhere to, a variety of micro-climates, access to abundant oxygen and nitrogen-phosphorous rich nutrients, blocked exposure to sunlight, micro-mixing, and anoxic (non-oxygenated) zones. When all these conditions are met, phosphorus can be removed by adding controlled on/off cycling of air to enhance de-nitrification and phosphorous uptake and release.
From an operational viewpoint, existing Poo-Gloos can be used for phosphorus reduction by simply adding the ability to turn the air supply on and off at precise intervals to create a succession of feast-famine cycles. After the bio-film has been subjected to several cycles, air is left on for a period of time to allow the pre-conditioned bacteria to uptake inordinately high levels of phosphorus, called luxury uptake. Once the bacteria are fully gorged, air is turned off for an extended period to kill the phosphorus-bearing bacteria. Dead phosphorus-laden bacteria slough off Poo-Gloo walls and are flushed through the system and channeled to a holding pond for subsequent land application in lieu of purchasing new fertilizer. The on-off-hold cycling pattern can then be repeated to provide a means for continuous uptake, release, and diversion of phosphorus rich water within a managed lagoon flow system.
Technical Objectives
A primary technical objective for scalable, commercially viable biological phosphorous removal is to achieve 2 lbs/day phosphorus removal per 1 million gallons of treated wastewater flow per day (MGPD). The capacity to biologically remove 2 pounds of phosphorus per 1.0 MGPD opens important competitive cost and operating advantages over conventional chemical precipitation methods used in mechanical plants.
Low operating and maintenance (O&M) cost is another important competitive objective. Poo-Gloos have no moving parts, and air systems are designed to last for 10-15 years before servicing. If electricity cost $0.07/kW-hr, estimated O&M cost for each Poo-Gloo is only $0.12/day. Conventional chemical precipitation methods to remove phosphorus from wastewater streams have an associated O&M cost factor much higher for a comparable flow rate, excluding substantial costs for disposing the large volumes of the unusable sludge that is created in the process.
Wastewater Compliance Systems, Inc Proprietary Information ©2011 50
Another technical objective is to divert phosphorus-rich effluent streams to a holding pond for subsequent land application to increase crop yields in lieu of applying conventional, energy-intensive fertilizer.
Product Attributes & Benefits Beneficial design and functional advantages of our patented technology provide an economical means to address all lagoon operating requisites for phosphorus removal compared to partial solutions and/or high cost competitive methods. Furthermore, Poo-Gloos can be incrementally installed over several years and paid from operating budgets to exactly meet fluctuating budget and growth needs of a community, shorten sales cycles, and provide an affordable alternative to small and medium sized towns struggling to remain in regulatory compliance. Large mechanical plants are often designed to meet demand 5-10 years in the future, which requires substantial capital financing and interest expense to pay for an under-utilized plant for a number of years until anticipated flows reach full design capacity. Current Approaches Non-compliant lagoon operators have several choices: (i) do nothing and risk regulatory fines and penalties, (ii) construct additional lagoons to increase capacity at $1-2 million per lagoon, (iii) purchase $1-4 million floatation aerators with high operating costs, but have limited bottom-to-surface churning action and no bio-film support surfaces to remove phosphorus (iv) migrate to conventional central treatment or packaged plants for $1-10 million capital cost, or (v) purchase a PooGloo retrofit system for $0.1-0.5 million to increase aerated bio-film surface area; increase the capacity, utilization, and bio-efficiency of existing lagoons by 50-100%; and achieve important bottom-to-top water circulation patterns required for phosphorus removal. Commercial Applications There are no known, commercially deployed, in-situ products for biological reduction and removal of phosphorus from wastewater lagoons. If our proprietary technology can be successfully scaled, it would represent a new, cost-effective option for lagoon operators seeking to remain in regulatory compliance for phosphorus discharge. Successful results from scaled deployment would position WCS as a leading company to offer innovative new solutions to address the three main problems that prospective clients face regarding cost, compliance, and capacity of lagoon-based systems.
Company Profile
Wastewater Compliance Systems, Inc (WCS) was formed to commercialize technology created at the University of Utah (UU) Center for Wastewater Treatment Technologies. The Company addresses the need of lagoon operators who seek to comply with state and federal environmental regulations by improving efficiency and capacity of existing lagoon systems without dramatically increasing capital or operating costs. Using patented technology exclusively licensed from UU, we assess existing lagoon performance, design-install low maintenance high
Wastewater Compliance Systems, Inc Proprietary Information ©2011 51
efficiency submersible fixed film aeration products, and monitor ongoing performance to ensure continuous regulatory compliance using a cost competitive, turnkey blend of products and services.
History & Objectives
WCS was formed in 2008, and ended the year with profitable beta sales to two Utah municipalities. In 2009, the Company successfully completed a seed investment round with Park City Angel Network. As part of the investment round, the Company re-incorporated in Delaware and implemented related legal-governance measures to facilitate future institutional investment, if needed. The Company expanded commercial sales of existing products in 2010 with installations at Jackpot, NV and a sole-source federal contract at a National Park . During 2010-11, WCS signed agreements with nine regional manufacturer sales rep agencies that cover most of the US and Canada. WCS currently employs nine full and part time employees.
The Company is pursuing an alliance strategy with outside entities for complete supply chain management and external channels to market. The strategy allows WCS to focus resources on its core competency of innovation and product development while providing a means to build a highly scalable organization and conserve capital.
Core Competencies & Milestones The Company’s core competency is product innovation and creation of intellectual property to build a sustainable competitive advantage. Product innovation, under Dr. Johnson’s direction, is pursued internally in concert with sponsored research at the Civil & Environmental Engineering Department at the University of Utah. Since inception in February 2008, the Company subcontracted over $135k of research and technical services to the University of Utah and currently holds exclusive, worldwide license rights to all technology derived from the activity.
Products & Services The 200 Poo-Gloos that were sold to-date can be retrofitted to remove phosphorus without making any physical changes to the product. All Poo-Gloos reduce regulated contaminants of ammonia, nitrogen, and related compounds by supplying each device with a continuous air flow. To add phosphorus removal, the air supply system for existing installations simply needs to be re-configured to provide on-off cycles at designated intervals, combined with a means to divert concentrated outflows of phosphorus-rich water to a holding pond for land application. The inexpensive retrofit for air cycling adds value to existing installations, and opens new market opportunities where phosphorus discharge is a problem. The Company uses a combination of intellectual property, proprietary know-how, and professional engineering services to create a market advantage. We have developed a three part turnkey product-service offering that is intended to deliver seamless, convenient, value to clients in concert with manufacturer rep organizations and locally partnered engineering firms:
Wastewater Compliance Systems, Inc Proprietary Information ©2011 52
• Evaluate-assess: Provide professional engineering services to assess unique needs and circumstances of each lagoon environment, and propose custom-fit solutions including number and cost of proprietary dome structures required to achieve client-owner goals by most cost effective means.
• Design-install: Design and spec code-compliant solutions that fulfill capacity and efficiency requirements. Install proprietary dome structures and associated aeration systems in lagoons to promote fixed-film bacterial growth, or assist client and/or local contractor installations.
• Monitor: Provide systems to monitor and report lagoon performance to ensure continuous compliance with all regulatory codes.
Team
WCS has assembled a complementary team with proven business and technical achievements, skills, and experience including the following:
• Chairman/CEO – Fred Jaeger: Senior management, technology marketing, and commercialization experience in many types of industries, disciplines, and business models. Raised over $10 million private equity capital. Founded and bootstrapped five companies, two of which were acquired by publicly traded corporations and balance profitably exited in private M&A transactions. Experienced with early stage company formation and technology commercialization, university spinouts, IP licensing, government contracting, and grants. BS-chemistry, Harvard MBA.
• VP Research – Kraig Johnson, PhD, PE: Phase-I PI and co-inventor of patented Poo-Gloo technology, Kraig oversees all research and product development activities, including client site analysis and evaluation. Performs targeted pilot studies, conducts field beta tests, handles regulatory approvals, and reviews sales proposals. BS-EE Old Dominion University, MS-Civil & Enviro Engr UC-Berkeley, PhD-Civil & Enviro Engr University of Utah.
• Director of Sales - Taylor Reynolds: Experienced in marketing and sales of highly technical products. Taylor increased WCS's online presence, identified new markets, built and managed sales rep relationships, and developed new lead generation strategies. Taylor also brings prior start-up experience that helped another university spinout company raise over $2.5 million. BS-Chemical Engineering, Brigham Young University.
• Business Development – Lee Saber: Oversees strategic business relationships, commercial transactions, and intellectual property portfolio to ensure maximum value is achieved from the company's products, technology, and commercial assets. Former corporate finance attorney with Wilson Sonsini Goodrich & Rosati, PC and Howrey, LLP. Worked with numerous private and public companies to create value and navigate complex regulatory and environmental proceedings. A.B. from Bowdoin College & Harvard University; J.D. from the University of Texas School of Law.
• Research PostDoc – Hua Xu, PhD: Performs research on effect of aeration cycling to remove nitrogen and phosphorus bearing compounds in wastewater lagoons. Performs laboratory tests and data analysis on field beta samples. PhD-Civil & Enviro Engr University of Utah.
Wastewater Compliance Systems, Inc Proprietary Information ©2011 53
• Project Engineer – Carey Johanson: Performs client site plans, provides sales support, and assists with installations and regulatory approval. Civil engineering degree from the University of Utah; experienced in land surveying and civil engineering.
• Board Member & Angel Investor - Al Rafati: Venture capitalist; former senior executive in nuclear energy industry focusing on strategy and business development for long-term management and disposition of nuclear byproducts. B.S degree in electrical engineering, M.S degree in engineering administration, MBA.
• Board Member Larry Reaveley PhD: Co-inventor, Professional Engineer (NM) and VP of Salt Lake City based Reaveley Engineering for 19 years. Departmental Chair of Civil and Environmental Engineering Dept at UU 1993-2006. B.S. and M.S. Civil Engineering Degree from UU, and PhD from University of New Mexico.
Future Vision
WCS has established itself as having the ability to profitably market continuous air flow products to lagoon operators. The ability to add air cycling techniques to existing products for phosphorus remediation will significantly enhance a proven business model. Market & Segments
The wastewater market is broken into three broad segments: individual (primarily rural) septic tanks, small-medium sized municipal lagoons, and large urban mechanical plants. Small towns with populations of 500 – 10,000 make productive use of lagoons, and serve as the Company’s primary initial target market.
The estimated number of operating lagoons in the Company’s high latitude North American targeted sector (EPA, 2002) for U.S. is 7,000 and 868 in Canada (NRC 2004). The annual addressable market of lagoon operators actively seeking upgrades and renovations for phosphorus and other nutrients at any one time is approximately 25% of the total, or 1,750 US and 220 Canadian lagoons for a total annual target of 1,970 lagoons. WCS projects revenues of $100,000 to $450,000 per lagoon site for the full suite of the Company’s product-service line, resulting in a potential annual addressable North American market opportunity of $197-887 million (1,970 US and Canadian sites x $100-$450k/site).
EPA further estimates 4,500 European lagoons, and over 10,000 in China. We expect to serve such international market via licensing and/or value-added reseller models in coming years.
Targeted Customer
Our targeted customers are the 25% (addressable market) of all lagoon operators who are currently out of compliance or near to being a non-compliant operator. Federal and state regulatory agencies maintain publicly available lists of non-compliant lagoon operators within their jurisdiction. Non-compliant operators are highly motivated to find solutions to reduce regulated contaminants, including phosphorus, to avoid fines and possible shutdown of operations.
Competition
Lagoon competitors are generally small-medium sized companies. Large companies like GE-Water and Siemens concentrate on the multi-million mechanical plant sector and don’t directly
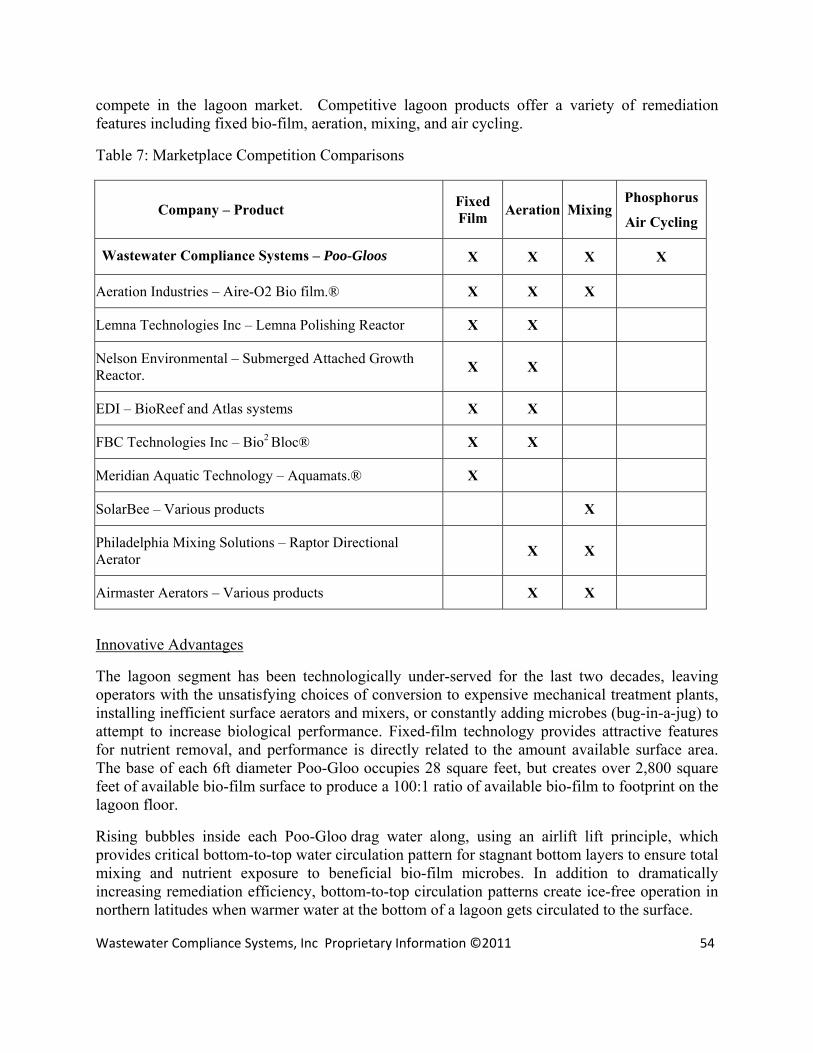
Wastewater Compliance Systems, Inc Proprietary Information ©2011 54
compete in the lagoon market. Competitive lagoon products offer a variety of remediation features including fixed bio-film, aeration, mixing, and air cycling.
Table 7: Marketplace Competition Comparisons
Company – Product Fixed Film Aeration Mixing
Phosphorus
Air Cycling
Wastewater Compliance Systems – Poo-Gloos X X X X
Aeration Industries – Aire-O2 Bio film.® X X X
Lemna Technologies Inc – Lemna Polishing Reactor X X
Nelson Environmental – Submerged Attached Growth Reactor. X X
EDI – BioReef and Atlas systems X X
FBC Technologies Inc – Bio2 Bloc® X X
Meridian Aquatic Technology – Aquamats.® X
SolarBee – Various products X
Philadelphia Mixing Solutions – Raptor Directional Aerator X X
Airmaster Aerators – Various products X X
Innovative Advantages
The lagoon segment has been technologically under-served for the last two decades, leaving operators with the unsatisfying choices of conversion to expensive mechanical treatment plants, installing inefficient surface aerators and mixers, or constantly adding microbes (bug-in-a-jug) to attempt to increase biological performance. Fixed-film technology provides attractive features for nutrient removal, and performance is directly related to the amount available surface area. The base of each 6ft diameter Poo-Gloo occupies 28 square feet, but creates over 2,800 square feet of available bio-film surface to produce a 100:1 ratio of available bio-film to footprint on the lagoon floor.
Rising bubbles inside each Poo-Gloo drag water along, using an airlift lift principle, which provides critical bottom-to-top water circulation pattern for stagnant bottom layers to ensure total mixing and nutrient exposure to beneficial bio-film microbes. In addition to dramatically increasing remediation efficiency, bottom-to-top circulation patterns create ice-free operation in northern latitudes when warmer water at the bottom of a lagoon gets circulated to the surface.
Wastewater Compliance Systems, Inc Proprietary Information ©2011 55
Poo-Gloos are energy efficient. Each unit requires approximately 1 cubic foot of air per minute (CFM) at a pressure of only 3-5 psi. The energy required to supply that amount of air is 0.1 HP, or approximately $0.12/day if electricity cost $0.07/k-W/hr. Low energy consumption opens off-grid opportunities for wind or solar power operation, and WCS is currently pursuing off-grid sales in remote communities and tribal lands in several western states.
Poo-Gloos economically provide air to existing water bodies. Large mechanical plants provide the needed air and bio-film conditions by expending vast energy and capital cost to pump tons of water per minute over a fixed bio-film surface.
Sales Challenges Wastewater remediation equipment sales are driven by increasingly tighter regulations. Conservative operators are resistant to adopting new technology unless they feel severe regulatory pain or new product economic-performance characteristics are so compelling that alternative options become obviously non-competitive. To overcome sales hurdles and to shorten sales cycles, WCS has embarked on a vigorous pilot program whereby a Poo-Gloo is placed in a tank housed in a standard 20ft shipping container. These self-contained modules are sent to prospective client jobsites to demonstrate proven performance, build operator confidence, and to gain empirical data, based on unique water chemistry at each site, to engineer a full scale, custom-fit deployment. Patents & Trademarks Poo-Gloos are covered under issued US patent #7,008,539 and a USPTO registered trademark. A second PCT patent application was filed December, 2009 that covered additional technology. WCS holds exclusive worldwide license rights to all the above described IP from the University of Utah. Patent rights, together with proprietary know-how and focus on innovation provide a basis to create and maintain a sustainable competitive advantage. Final Considerations
WCS has established a solid foundation to profitably sell existing products in competitive lagoon markets. The ability to add phosphorus remediation capabilities, by introducing air cycling techniques to existing products, will significantly enhance a proven business model.
A recap of the company operations and markets includes the following factors:
Large, renewable, motivated, addressable, global market Recession resistant – stable performance & economics Directly addresses client needs for compliance-cost-capacity Effective sales strategy; identify non-compliant operators via public documents Incremental sales, shorten sales cycle, use of operating vs capital budgets Building scalable supply chain and sales channel via mfrg reps Proven IP: issued patent; new applications in pipeline Seasoned & diverse team, institutionally investment-ready; if needed
Wastewater Compliance Systems, Inc Proprietary Information ©2011 56
Conclusions:
The 17 week run of the pilot unit, consisting of a set of six scaled Poo-Gloos parallel with a Control was successful in demonstrating cold temperature biological nitrogen removal and phosphorous uptake and release. The Poo-Gloos out-performed the Control in every significant category, and demonstrate the viability of this technology for cold temperature lagoon nutrient removal enhancement.
The optimum HRT for the system was around 7 days. At 5 days or below, the system became overloaded, and above 9 days, the system was underperforming.
The cold temperature organic carbon removal rates were around 2 x 10⁻⁴ lb BOD/ft2/day (1 g BOD/m2/day).
Total Nitrogen removal was achieved through nitrification and de-nitrification. De-nitrification rates were enhanced by cycling the air on 21 hours/off 3 hours each day. The air off period was cycled in the early morning, just before sunrise, to take advantage of the natural DO dip caused by algae. Maximum nitrification rates were achieved when the air was on 24 hours per day, but the combined N removal was improved by air cycling. The nitrogen removal rate for the submerged fixed film devices was on the order of 7 x 10⁻⁵ lb N/ft2/day (0.34 g N/m2/day). This occurred at temperatures of around 5 ºC and as low as 0.9 ºC.
Daily air cycling also promoted the biological uptake of Total Phosphorous from the wastewater stream. Optimal uptake occurring with air on 22 hours/off 2 hours for this set of runs. For the 4 week period in January, the Poo-Gloos decreased the concentration in the wastewater flow from 3.45 to 2.61 mg/L. The biofilm in the Poo-Gloos released P into the bulk solution after an extended air-off period of 7 days, increasing the concentration from 2.4 to 3.2 mg/L. The P uptake was in the range of the stoichiometric requirements of the bio-film of about 1.4% P. The presence of PAOs was not confirmed, however, the 3000 square feet of bio-film in the 1650 gallon (6245 L) test tank was enough to uptake 20 grams of Total P from the wastewater stream during a 4 week period, and then release 5 grams of Total P during the one week air-off period. The P concentration of the biofilm was on the order of 0.5 g/m2 at wintertime temperatures of below 5 ºC.
Wastewater Compliance Systems, Inc Proprietary Information ©2011 57
Appendices:
• H. Xu, K. Johnson, and Y. Choi. “Air Cycling Enhanced Carbonaceous and Nitrogen Compounds Removal with Pilot Scale Submerged Poo-GlooTM Dome Sets”, Conference Proceeding of Water Environmental Federation (WEF) Impaired Water Symposium, Jan 12 – 13, 2011, Miami, FL. (Forth Coming)
• www.wcs-utah.com • UTES Lead the Way, Kraig Johnson, Salt Lake Magazine, April 2011 Volume 22 No. 2,
66. • Cleanup Crew, Popular Science Magazine, May 2011, 14 – 15.