Embed Size (px)
Citation preview
CENTER FOR AIR TRANSPORTATION SYSTEMS RESEARCHCENTER FOR AIR TRANSPORTATION SYSTEMS RESEARCH
1
RUNWAY OPERATIONS:Computing Runway Arrival Capacity
OR750 /SYST660
USE Runway Capacity Spreadsheet
Spring 2008
Lance Sherry
2
CATSRCATSRBackground
• Air Transportation System Infrastructure is composed of:• Airports
– “Airside” (runways, taxiways, ramps, …)– “Landside” (terminals, passenger lounges, access roads, rental
cars, busses, parking, • Air Traffic Control
– Tower– Terminal Area– En-route
3
CATSRCATSRRunway Capacity
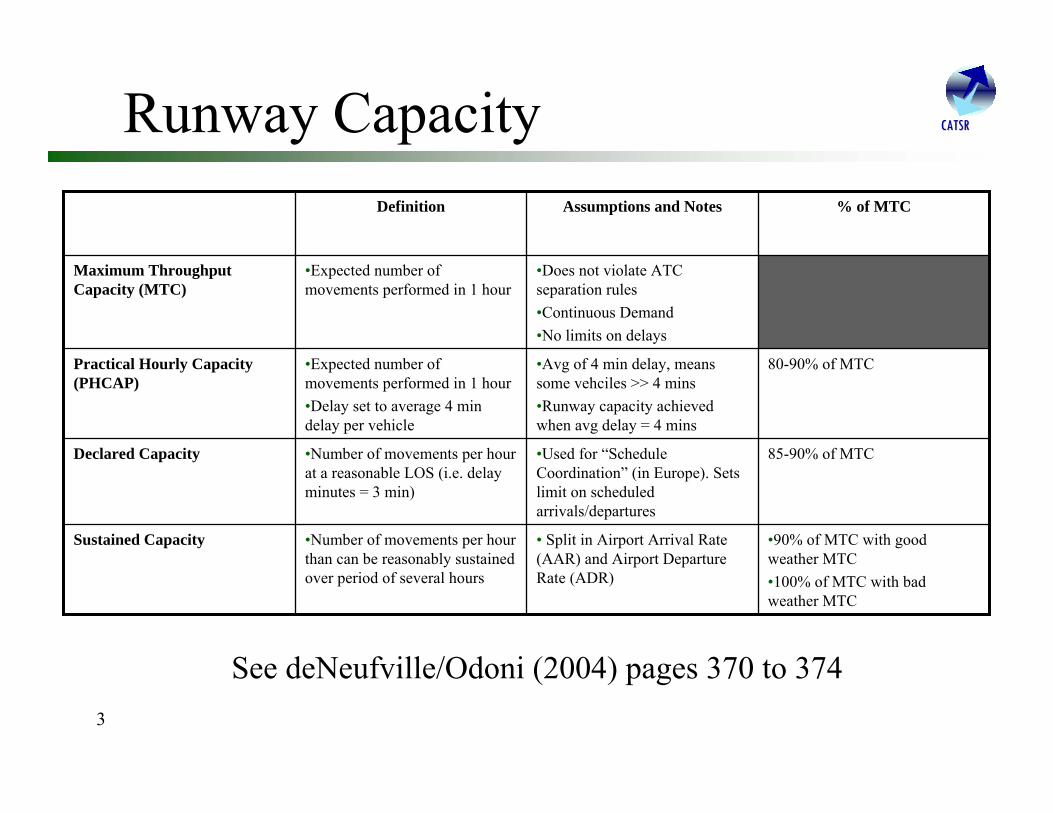
•90% of MTC with good weather MTC•100% of MTC with bad weather MTC
• Split in Airport Arrival Rate (AAR) and Airport Departure Rate (ADR)
•Number of movements per hour than can be reasonably sustained over period of several hours
Sustained Capacity
85-90% of MTC•Used for “Schedule Coordination” (in Europe). Sets limit on scheduled arrivals/departures
•Number of movements per hour at a reasonable LOS (i.e. delay minutes = 3 min)
Declared Capacity
80-90% of MTC•Avg of 4 min delay, means some vehciles >> 4 mins•Runway capacity achieved when avg delay = 4 mins
•Expected number of movements performed in 1 hour•Delay set to average 4 min delay per vehicle
Practical Hourly Capacity (PHCAP)
•Does not violate ATC separation rules•Continuous Demand•No limits on delays
•Expected number of movements performed in 1 hour
Maximum Throughput Capacity (MTC)
% of MTCAssumptions and NotesDefinition
See deNeufville/Odoni (2004) pages 370 to 374
4
CATSRCATSRRunway Operations• Arriving aircraft land• Departing aircraft takeoff• Runway capacity determined by:
• Separation distance between arriving aircraft– Separation Distance Violation
• Separation distance between departing aircraft– Separation Distance Violation
• Only one aircraft on runway at any time– Simultaneous Runway Occupancy
• Separation distance and Runway Occupancy Time (ROT) determined by aircraft type (weight/lift, landing speed, …)
• Heavy (e.g. 747-400)• Large (e.g. 777, 767)• Medium (e.g. 737)• Small (e.g. RJ)
5
CATSRCATSRModel for Runway Arrivals
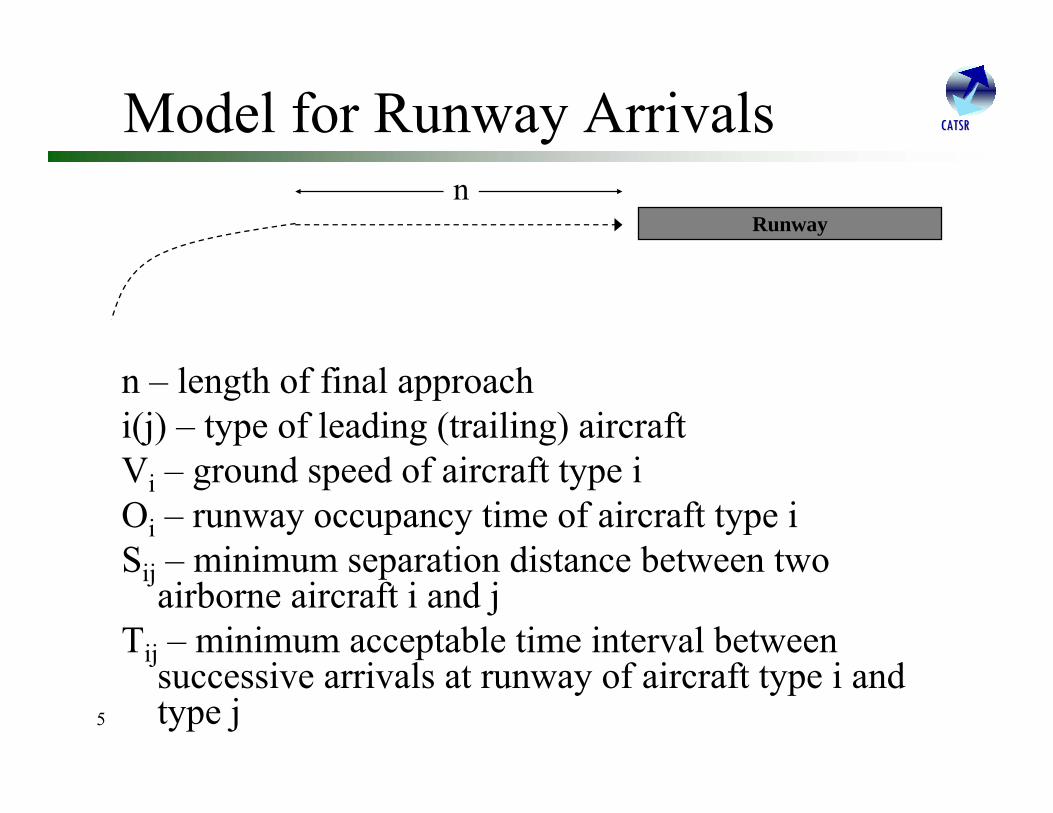
n – length of final approachi(j) – type of leading (trailing) aircraftVi – ground speed of aircraft type iOi – runway occupancy time of aircraft type iSij – minimum separation distance between two
airborne aircraft i and jTij – minimum acceptable time interval between
successive arrivals at runway of aircraft type i and type j
Runwayn
6
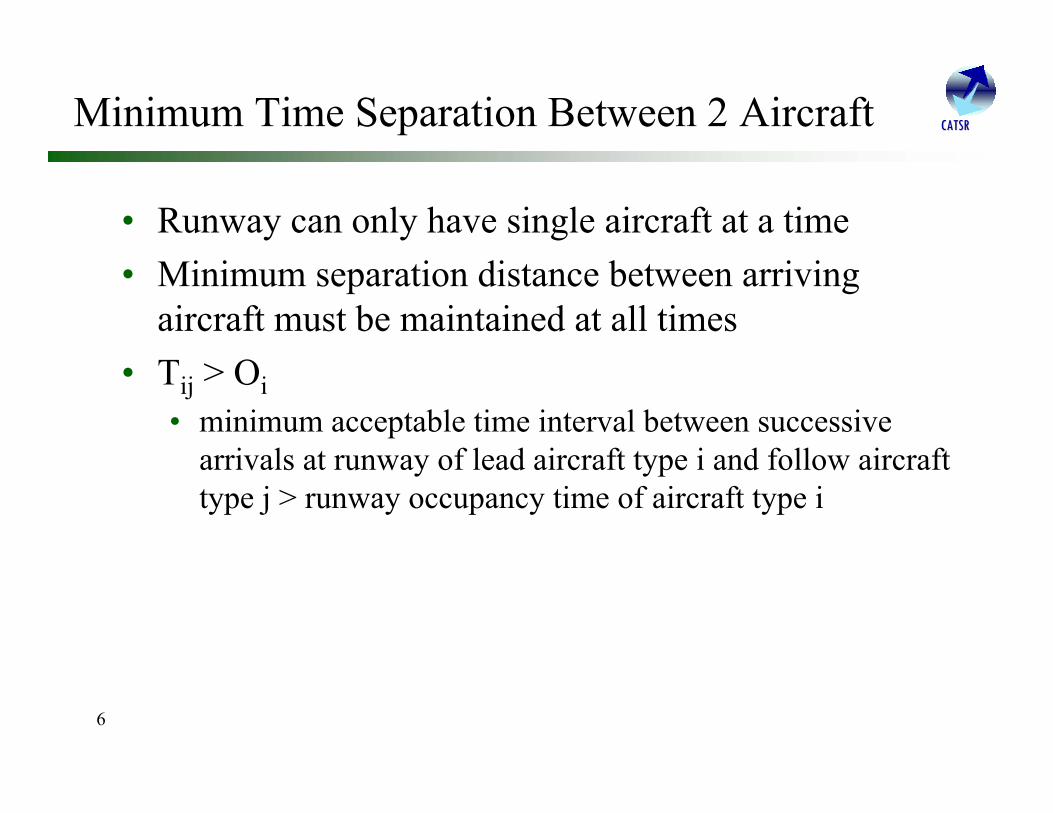
CATSRCATSRMinimum Time Separation Between 2 Aircraft
• Runway can only have single aircraft at a time• Minimum separation distance between arriving
aircraft must be maintained at all times• Tij > Oi
• minimum acceptable time interval between successive arrivals at runway of lead aircraft type i and follow aircraft type j > runway occupancy time of aircraft type i
7
CATSRCATSRArrival Two Cases
• Lead aircraft of type i is faster than follow aircraft of type j• Case: Expanding Separation
• Lead aircraft of type i is slower than follow aircraft of type j• Case: Decreasing Separation
8
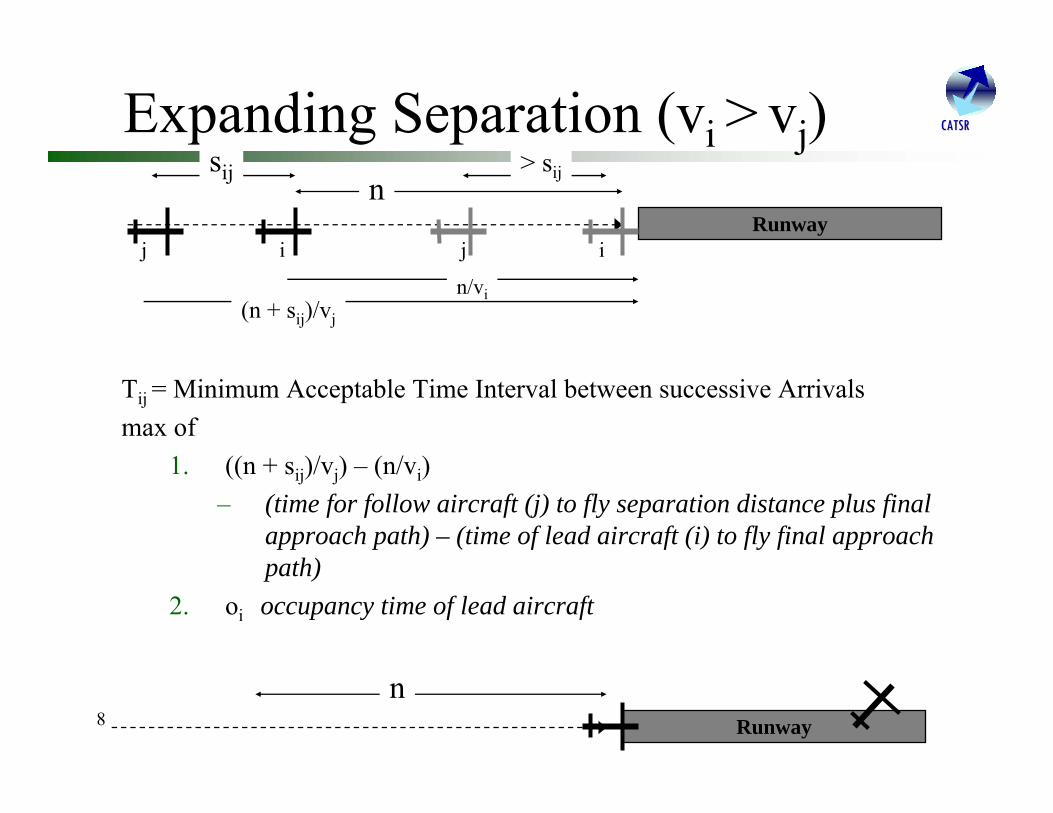
CATSRCATSRExpanding Separation (vi > vj)
Tij = Minimum Acceptable Time Interval between successive Arrivalsmax of
1. ((n + sij)/vj) – (n/vi)– (time for follow aircraft (j) to fly separation distance plus final
approach path) – (time of lead aircraft (i) to fly final approach path)
2. oi occupancy time of lead aircraft
Runway
n
Runwayn
sij
ij
> sij
n/vi(n + sij)/vj
ij
9
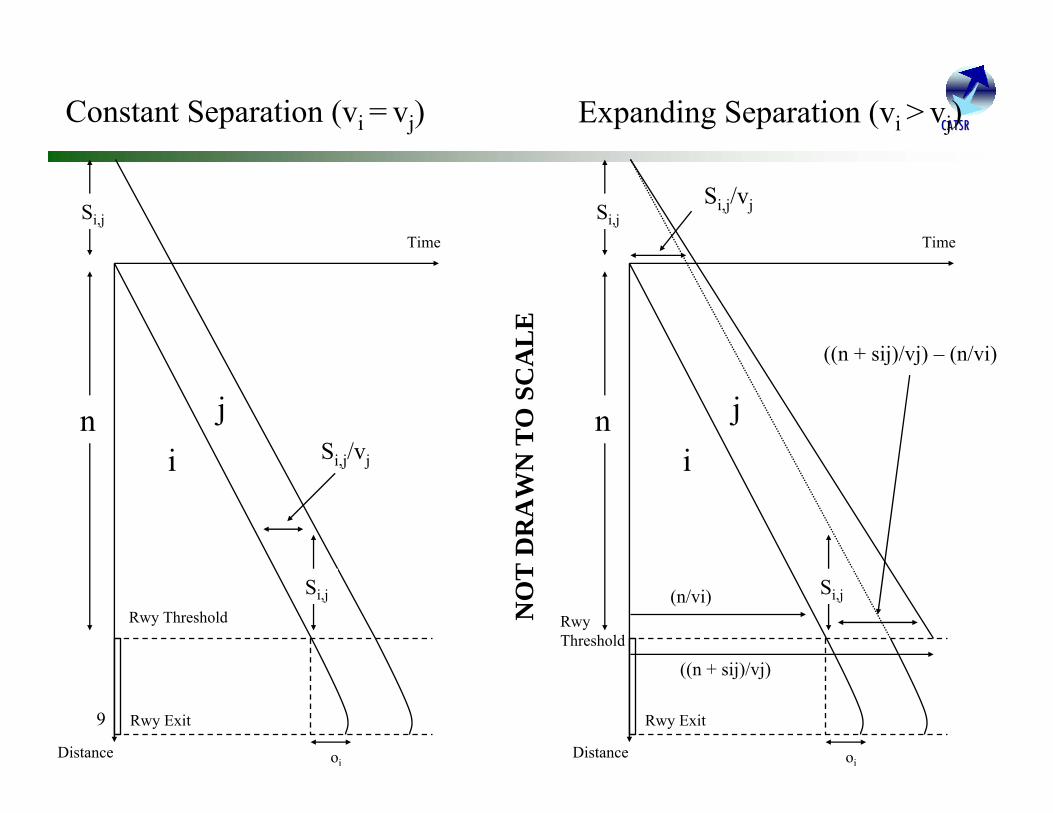
CATSRCATSRExpanding Separation (vi > vj)
((n + sij)/vj) – (n/vi)
n
Si,j
Rwy Threshold
Rwy Exit
Time
Distance oi
Constant Separation (vi = vj)
i j
Si,j
NO
T D
RA
WN
TO
SC
AL
E
Si,j/vj
n
Si,j
RwyThreshold
Rwy Exit
Time
Distance oi
i j
Si,j
Si,j/vj
((n + sij)/vj)
(n/vi)
10
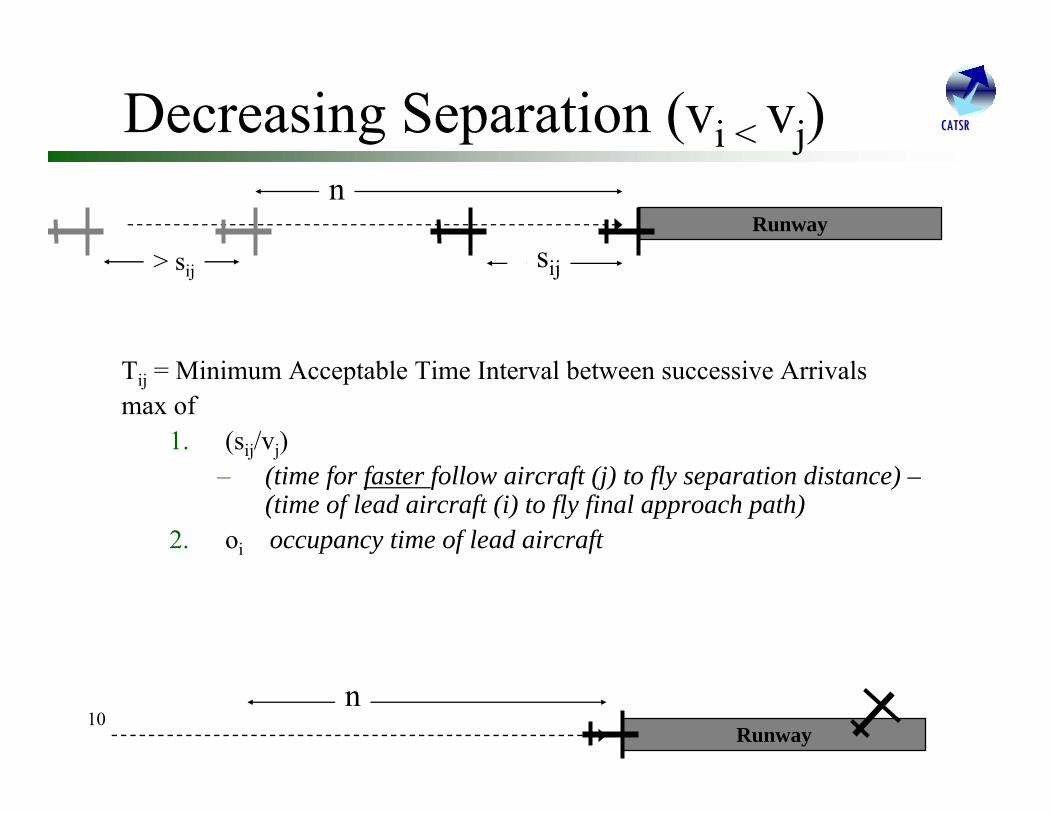
CATSRCATSRDecreasing Separation (vi < vj)
Tij = Minimum Acceptable Time Interval between successive Arrivalsmax of
1. (sij/vj)– (time for faster follow aircraft (j) to fly separation distance) –
(time of lead aircraft (i) to fly final approach path)2. oi occupancy time of lead aircraft
Runwayn
Runway
n
sij> sij
11
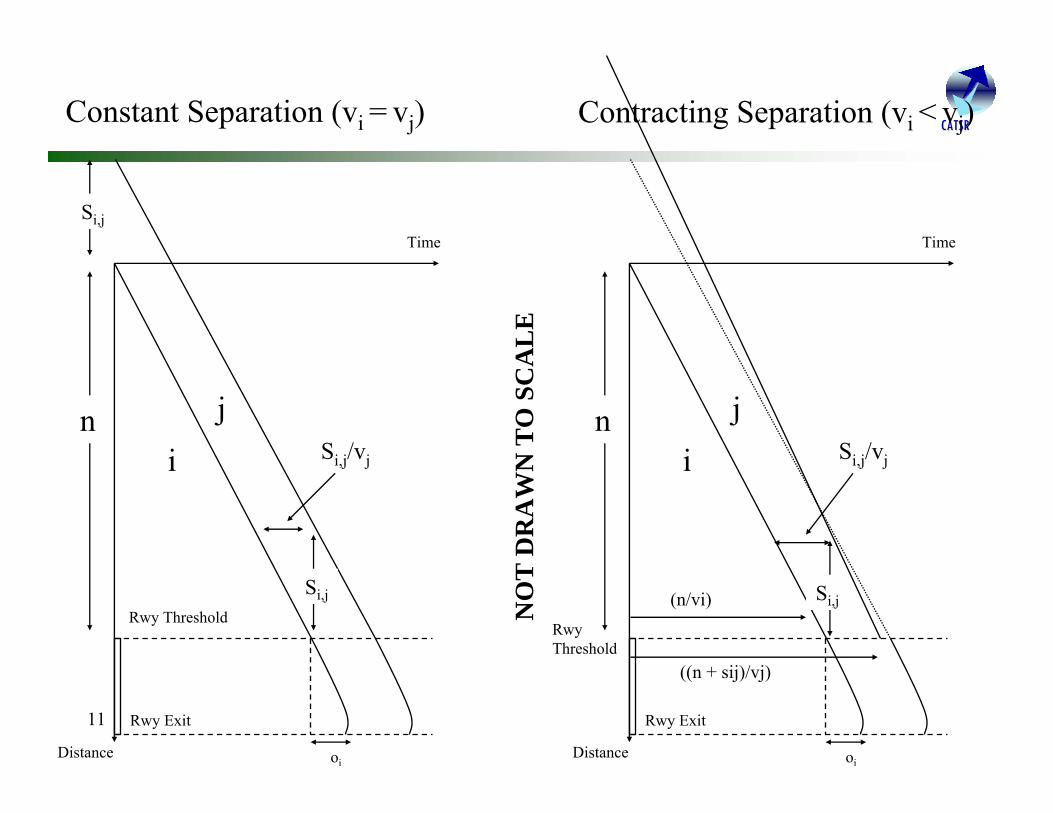
CATSRCATSRContracting Separation (vi < vj)
n
Si,j
Rwy Threshold
Rwy Exit
Time
Distance oi
Constant Separation (vi = vj)
i j n
Si,j
RwyThreshold
Rwy Exit
Time
Distance oi
i j
Si,j
NO
T D
RA
WN
TO
SC
AL
E
Si,j/vjSi,j/vj
((n + sij)/vj)
(n/vi)
12
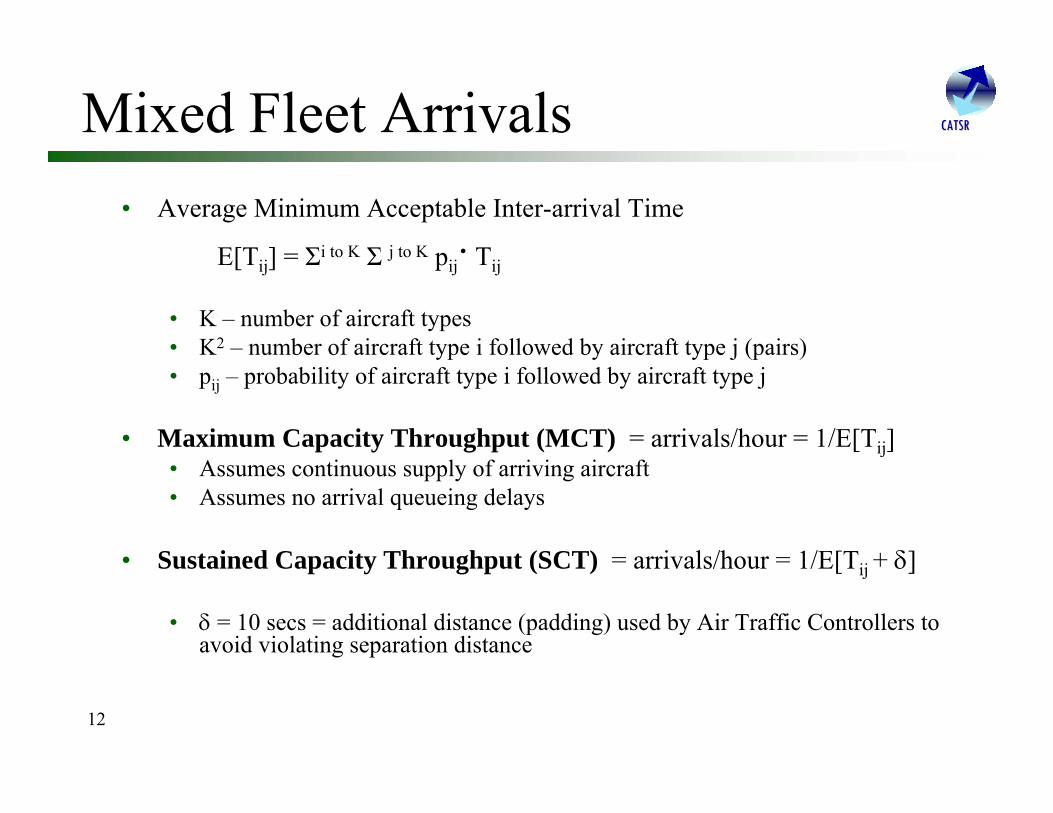
CATSRCATSRMixed Fleet Arrivals• Average Minimum Acceptable Inter-arrival Time
E[Tij] = Σi to K Σ j to K pij· Tij
• K – number of aircraft types• K2 – number of aircraft type i followed by aircraft type j (pairs)• pij – probability of aircraft type i followed by aircraft type j
• Maximum Capacity Throughput (MCT) = arrivals/hour = 1/E[Tij] • Assumes continuous supply of arriving aircraft• Assumes no arrival queueing delays
• Sustained Capacity Throughput (SCT) = arrivals/hour = 1/E[Tij + δ]
• δ = 10 secs = additional distance (padding) used by Air Traffic Controllers to avoid violating separation distance
13
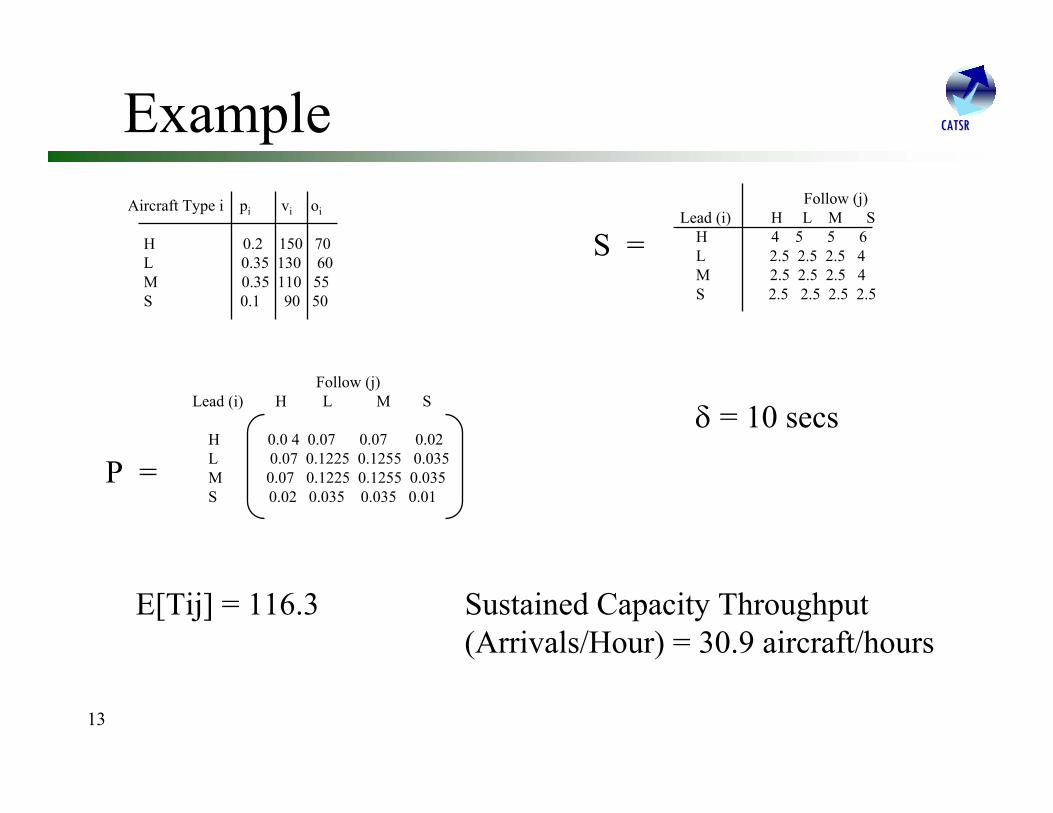
CATSRCATSRExampleAircraft Type i pi vi oi
H 0.2 150 70L 0.35 130 60M 0.35 110 55S 0.1 90 50
Follow (j)Lead (i) H L M S
H 4 5 5 6L 2.5 2.5 2.5 4M 2.5 2.5 2.5 4S 2.5 2.5 2.5 2.5
S =
δ = 10 secsFollow (j)
Lead (i) H L M S
H 0.0 4 0.07 0.07 0.02L 0.07 0.1225 0.1255 0.035M 0.07 0.1225 0.1255 0.035S 0.02 0.035 0.035 0.01
P =
E[Tij] = 116.3 Sustained Capacity Throughput (Arrivals/Hour) = 30.9 aircraft/hours
14
CATSRCATSRLimitations of Model
• Model assumes:• independent runway (no intersections or parallel)• Landing aircraft only• Wind speed and direction• vi and oi should be random variables• Separation distance should be random variables

15
CATSRCATSR
END
16
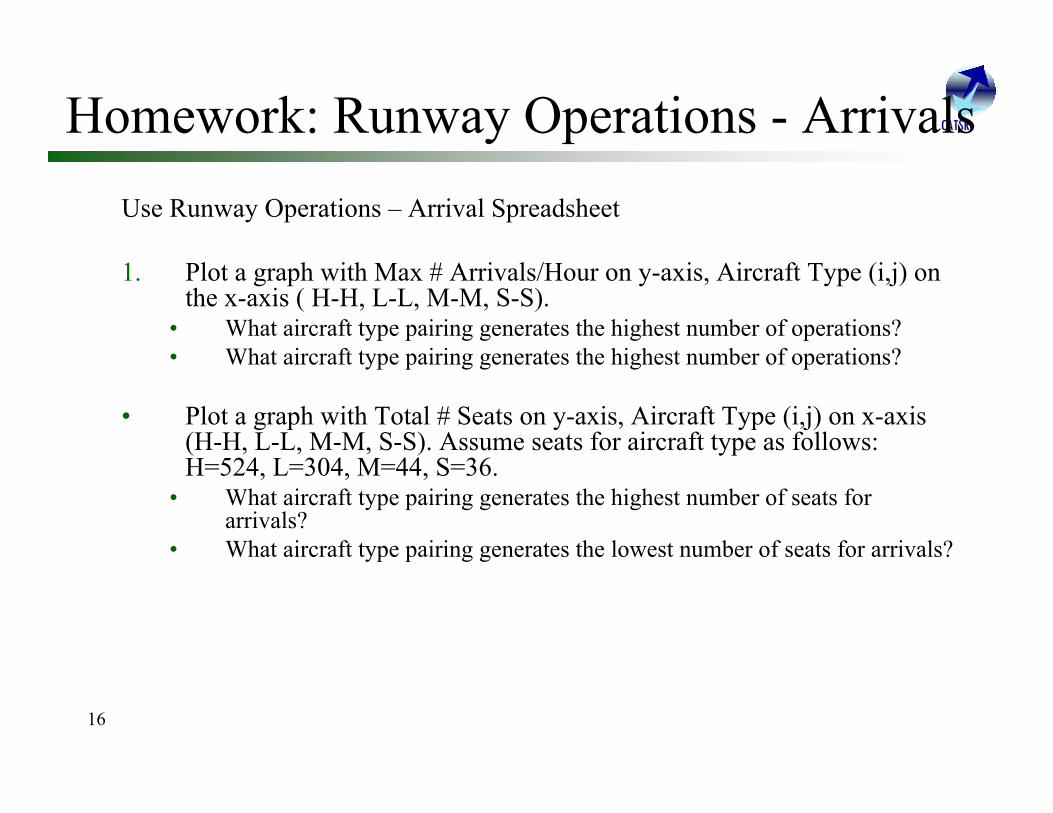
CATSRCATSRHomework: Runway Operations - ArrivalsUse Runway Operations – Arrival Spreadsheet
1. Plot a graph with Max # Arrivals/Hour on y-axis, Aircraft Type (i,j) on the x-axis ( H-H, L-L, M-M, S-S).
• What aircraft type pairing generates the highest number of operations?• What aircraft type pairing generates the highest number of operations?
• Plot a graph with Total # Seats on y-axis, Aircraft Type (i,j) on x-axis (H-H, L-L, M-M, S-S). Assume seats for aircraft type as follows: H=524, L=304, M=44, S=36.
• What aircraft type pairing generates the highest number of seats for arrivals?
• What aircraft type pairing generates the lowest number of seats for arrivals?