Embed Size (px)
Citation preview
SEMI-ANNUAL REPORT
NASA CONTRACT NAS 5-31368
ForMODIS Team Member: Steven W. Running
Assoc. Team Member: Ramakrishna R. NemaniSoftware Engineer: Joseph Glassy
15 July, 1999
OBJECTIVES:
We have defined the following near-term objectives for our MODIS contract:
- Organization of a global biospheric monitoring network with collaboratingU.S. and international science agencies for EOS Land validation.
- Deliver at-launch software for our MODIS products, #15 Leaf Area Index andFraction Absorbed Photosynthetically Active Radiation, and #17 DailyPhotosynthesis - Annual Net Primary Production.
- Develop MODIS applications products for national fire management.
The NTSG lab currently employs:Dr. Steven Running, Director and Professor,Dr. Ramakrishna Nemani, Research Assoc. ProfessorDr. Lloyd Queen, Associate ProfessorDr. John Kimball, Postdoctoral Research AssociateDr. Soizik Laguette, Postdoctoral Research AssociateDr. Peter Thornton, Postdoctoral Research AssociateDr. Jerome Winslow, Postdoctoral ResearcherMr. Joseph Glassy, Software EngineerMr. Petr Votava, ProgrammerMr. Saxon Holbrook, Computer Systems EngineerMr. Andrew Weiss, Programmer, Systems OperatorMr. Mike White, PhD studentMs. Alisa Keyser, PhD studentMr Carl Seielstad, PhD studentMr Jim Plummer, PhD studentMs. Youngee Cho, Office Manager
All of these members contribute to certain aspects of our MODIS work.
ACTIVITIES OF SWRunning (MODIS Team Member)
WORK ACCOMPLISHED:
EOS-IWGI participated in a number of projects to develop both MODLAND, and more
generally EOS Land product validation. These projects are in many ways interrelated,and their efficiency is maximized by regular coordination. Following are brief summariesof current activity for:
BIGFOOT = a field ecological measurement program in the USGTOS-NPP = a global program related to BIGFOOT for GTOSFLUXNET = a global array of CO2 and H20 flux towersPIK-NPP = a global NPP model intercomparisonVEMAP = a US based ecological model intercomparison
BIGFOOT -- Characterizing Land Cover, LAI and NPP at the Landscape Scale forEOS/MODIS Validation:
The BigFoot project has now started as a part of the EOS Validation program.Four sites have been selected for initial field activity, all FLUXNET sites. The BIGFOOTmeasurement protocol is the guide for the international GTOS-NPP project. SoBIGFOOT scaling principles will be propogated globally.
The project website is at:http://www.fsl.orst.edu/larse/bigfoot/slide1.html
FLUXNETThe FLUXNET program is maturing rapidly as the cornerstone of EOS Land
validation, website at:http://daacl.ESD.ORNL.Gov/FLUXNET/There are now 80 sites globally, and substantial international coordination. This networkis ready for EOS launch now.
To accelerate the use of FLUXNET for EOS validation we have just recentlystarted a Real-Time Flux Validation project with Ameriflux. The invitation letter isprinted below, giving science rationale and methodology planned.
29 June 1999
Invitation to Ameriflux members for a Real-time validation program
Dear Ameriflux members;

One of the ongoing justifications for a flux tower network has been theoppurtunity to use the measurements for validation of both satellite data and SVATmodel simulations. Some model validation efforts have now been published for certainsites, however there has not been a coordinated, network wide program. Part of theimpediment has been the assumption that a tower team would be obligated to publiclypost their flux data before having sufficient time to make corrections. I think we candevelop a coordinated validation program and avoid this impediment.
Specifically I would like to invite each tower team to join in a real-time multi-dimensional validation program. The key component will be that each tower teamtransmit their micrometeorology measurements every week, (but NOT their fluxmeasurements) to a central data center. My research group will then ingest that week’sdata and make two calculations,(1) first the weekly Net Primary Production as computed by the standard global NASA
EOS algorithm, see http://www.forestry.umt.edu/ntsg/eos/(2) and second, the daily NPP, NEE and ET as computed by our BIOME-BGC
ecosystem biogeochemistry model, seehttp://www.forestry.umt.edu/ntsg/research/projects/
for examples from the BOREAS project. Incidently, we will also invite any othermodeling teams that want to do these computations weekly to participate.
These calculations will be posted back to the host data center, on an ongoing graph foreach participating tower site within 24hr. Note that we will post these calculationswithout seeing your flux data, so this is a blind validation of the computations on our part(and professional suicide according to some of my friends). We suggest the FLUXNETdata center at the Oak Ridge Lab as host for this activity. We plan to automate all of thedelivery and transmission of datasets. As these are only point (not spatial) datasets, theyare very small.
Specific data requestAir temperatureSoil temperature at 10cmAbsolute humidityIncident PAR or shortwave radiationPrecipitationWindspeed
These measures should be from your top of canopy location at 0.5hr reporting intervals.
To initialize our BIOME-BGC model, we must know something about thevegetation at your site. We need to know the biome type, and the following parameters.Note that we are equally interested in all biome types, not only forests.
Site and Stand ParametersLeaf area index, leaf longevity, specific leaf areaSoil water holding capacity in top 1m
Leaf, stem, litter and soil carbon contentLeaf, litter and soil N content
Much of this data is already established on the Ameriflux website, and we can retrieve itthere. We also plan to use any previous flux data that each site has released to theAmeriflux web site to tune our model before starting the “blind” validation.
We hope to initiate this program on January 1 (avoid Y2K!), presumingsuccessful EOS launch in Sept-Oct 1999. We request each tower site to specificallyrespond with their intentions to participate, or not participate in this activity. Any towerthat wishes to participate, but is limited by hardware, such as remote access to theirdatalogger, should include the equipment requirement they need to participate.
Please respond by 15 July 1999. I think this will be great fun, and an immensescientific challenge. If you have any questions or suggestions about this plan as currentlystated, feel free to comment.
Thank you,Steve RunningUniv. Montana
THE GAIM-NPP model intercomparison studyWe co-authored 3 papers for a special issue of Global Change Biology that came
out in April 1999. See the publication list.
Global Climate and Terrestrial Observing Systems (GCOS/GTOS)The GTOS-NPP project is being initiated to provide coordinated global
measurements of landcover, LAI and NPP for EOS validation. Reports from the ILTERoffice are that international field sites are slow in joining the program. Until real EOSdata is available as an inticement, I expect this reluctance to continue.
VEMAP - Vegetation ecosystem modeling and analysis projectVEMAP is a project to intercompare leading biogeography and biogeochemistry
models in the US for global change and EOS research programs. VEMAP has ahomepage at:
http://www.cgd.ucar.edu:80/vemap/
VEMAP Phase II is currently building the datasets and initialization files for transientsimulations of climate and vegetation response for the continental United States. Thesenew simulations will be executed within the next 6 month period.
COLD REGIONS BIOSPHERIC MONITORINGAs part of our interests in improving biospheric monitoring, we have developed
with JPL the concept of a high repeat cycle SAR for high latitude monitoring. The
following paper (intro reprinted here) in EOS this spring summarizes our currentthinking.
RADAR REMOTE SENSING PROPOSED FOR MONITORING
FREEZE/THAW TRANSITIONS IN BOREAL REGIONS
EOS Transactions Vol 80. No. 19 pp213, 220-221.
S.W. Running, J. S. Kimball and A. R. Keyser
Numerical Terradynamic Simulation Group, University of Montana, Missoula, MT59812
J.B. Way, and K. C. McDonald,
Mail Stop 300-233, Jet Propulsion Lab, California Institute of Technology, Pasadena,CA 91109
S. Frolking
Complex Systems Research Group, University of New Hampshire, Durham, NH 03824
R. ZimmermanBayreuth Institute for Terrestrial Ecosystem Research, University of Bayreuth, Bayreuth,
GERMANY
(Email contact: [email protected])
Recent atmospheric General Circulation Model (GCM) projections summarized inthe 1995 IPCC report indicate an average global warming of the lower troposphere from1 - 3.5°C during the next century, depending on the greenhouse gas emissions scenarioused. Further, the IPCC 1995 report states that “all model simulations show...a maximumwarming in high northern latitudes in winter.” Evidence that high latitude warming hasbegun is accumulating. Our analysis of local weather records across Alaska suggests thatthe growing season has been extended by over 14 days in the last 50 years by increasingspring temperatures (Figure 1).
High latitude warming may have amplified implications on global change ratesbecause the impacts will not necessarily be linear. The state transition of the land surfacefrom a frozen to a thawed condition is abrupt near 0deg, and initiates a number ofterrestrial processes that are nearly dormant during frozen conditions. This statetransition represents the closest analog to a biospheric and hydrologic on/off switchexisting in nature, affecting surface meteorological conditions, ecological trace gasdynamics and hydrologic activity profoundly. This rather abrupt state transition occurseach year over roughly 50 million km2 of the Earth’s terrestrial surface at latitudes above40 degrees. If the timing and/or areal extent of this state transition were to changesignificantly, measurable changes in climate, hydrology and biogeochemistry wouldresult.
Our recent research is finding that satellite based radar remote sensing techniques areparticularly well-suited to quantifying this freeze/thaw transition over broad landscapes,due to specific molecular features of how electromagnetic radiation at radar wavelengthsinteracts with polar water molecules in solid and liquid states. We applied Ku-band (2.1cm) 25 km resolution NASA Scatterometer (NSCAT) data to examine the feasibility ofspaceborne radars for operational mapping of circumpolar freeze/thaw cycles for thenorthern high latitudes (McDonald et al. 1998). We used NSCAT mosaics to derivelandscape scale freeze/thaw maps of Alaska during spring 1997, and compared withinterpolated surface temperature records (Figure 2). The NSCAT temporal responseshows a 3 to 5dB (decibel) shift in measured backscatter, well correlated with landscapespringtime thaw processes. The NSCAT-based maps clearly show the progression of thelandscape from an initial frozen to a thawed state.
The large range of seasonal and interannual variability of the boreal frozen surface,and its broad ranging impact on regional and even global climate, hydrology andbiogeochemistry would suggest that regular, accurate monitoring be a priority in globalchange research. However, the density of reporting surface weather and hydrologicstations in sparsely populated high latitudes is very low, on the order of 1 per millionkm2, especially in Canada and Siberia. Current optical satellite data suffer from cloudcontamination and seasonal illumination problems, while passive microwave data have avery coarse (100-625km2) spatial resolution. At present no adequate monitoring system isin place to document high latitude climate change. An additional benefit is that radarsensors do not rely on solar illumination or cloud free conditions for effective monitoring.
This paper summarizes recent progress in quantifying the land surface freeze/thawtransition regionally by satellite, the broad consequences of the freeze/thaw transition inboreal biogeochemistry, and the potential for future global monitoring of this significantboreal phenomenon.
NASA EOS and Related MEETINGS ATTENDED (SWR)
EOS-SECNASA EOS IWG Vail, CO June 1999MODIS Meeting May 1999VEMAP meeting, April 1999
Publications:
Churkina, G., Running, S.W., Schloss, A.L. (1999) Comparing global models ofterrestrial net primary productivity (NPP): the importance of water availability.Global Change Biology. 5:46-55.
Running, S.W., Collatz, G.J., Washburne, J., Sorooshian, S. (1999) Land Ecosystemsand Hydrology. EOS Science Plan. 5:197-260.
Running, S.W. (1999) A Blueprint for Improved Global Change Monitoring of theTerrestrial Biosphere. Proceedings of International Workshop on Land-SurfaceWater Budget. Tsukuba, Japan. 271-297.
Thornton, P.E., and Running, S.W. (1999) An improved algorithm for estimatingincident daily solar radiation from measurements of temperature, humidity, andprecipitation. Agriculture and Forest Meteorology. 93:211-228.
Waring, R.H., Running, S.W. (1999) Remote Sensing Requirements to Drive EcosystemModels at the Landscape and Regional Scale. Integrating Hydrology, EcosystemDynamics and Biogeochemistry in Complex Landscapes. 2:23-37.
S.W. Running1, D. D. Baldocchi2, W. B. Cohen3, S.T. Gower4, D. P. Turner3, P. S.Bakwin5, K. A. Hibbard6 A GLOBAL TERRESTRIAL MONITORINGNETWORK INTEGRATING TOWER FLUXES WITH ECOSYSTEMMODELING AND EOS SATELLITE DATA. REMOTE SENSING OFENVIRONMENT (in press)
White, J.D., Running, S.W., Thornton, P. (1999) Impact of growing season lengthvariability on carbon assimilation and evapotranspiration over 88 years in theeastern deciduous forest. Int.J. Biometeorol. 42:139-145.
Cienciala, E., Running, S.W., Lindroth, A., Grelle, A., Ryan, M.G. (1998) Analysis ofcarbon and water fluxes from the NOPEX boreal forest: comparison ofmeasurements with FOREST-BGC simulations. Journal of Hydrology. 212-213:62-78
Galina Churkina, Steven W. Running, Annette L. Schloss and the participants of”Potsdam ‘95”; (1999) Comparing global models of terrestrial net primaryproductivity (NPP): The importance of water availability. Global ChangeBiology. 5:46-55.
Wolfgang Cramer, David W. Kicklighter, Alberte Bondeau, Berrien Moore III, GalinaChurkina, Bernard Nemry, Anne Ruimy, Annette L. Schloss and the participantsof “Potsdam ‘95”, (1999). Comparing global models of terrestrial net primaryproductivity (NPP): Global Change Biology. 5:1-15
Galina Churkina and Steven W. Running, (1999) Investigating the balance betweentimber extraction and the productivity of global coniferous forests. ClimaticChange (in press).
Steven W. Running Peter Thornton Ramakrishna Nemani Joseph M. Glassy (1999)GLOBAL TERRESTRIAL GROSS and NET PRIMARY PRODUCTIVITYfrom the EARTH OBSERVING SYSTEM METHODS IN ECOSYSTEMSCIENCE O.SALA, R.JACKSON, H. MOONEY Eds.Springer-Verlag (in press)
University of Montana International EOS Natural Resource Training Center
A. Overview
The University of Montana, EOS Training Center was initiated February 1, 1999.The EOS Training Center consists of two main components; the EOS Natural ResourceProject, which addresses the needs of the natural resource community and the EOSEducation Project, which addresses the needs of the K-16 educational community. Theoverall objectives of the EOS Training Center are:
EOS Natural Resource Project• To produce enhanced EOS land application products for natural resource
management.• To train natural resource land managers to download, display and interpret EOS data
to enhance the utility of EOS in land management.
EOS Education Project• To identify, develop and disseminate EOS-related curricula for K-16 education.• To provide professional development of K-16 pre-service and in-service teachers.
B. Project Partners
The University of Montana, EOS Training Center is actively participating with a numberof project partners. These partners include:
1. USDA Forest Service, Region One Fire Sciences Lab, Rocky Mountain ResearchStation. Contact - Patricia Andrews
The EOS Training Center is coordinating with the Fire Sciences Lab to includecurrent and future EOS data to support wildland fire decision making. We aredeveloping a link between the EOS Training Center World Wide Web site(http://eostc.umt.edu) and the Wildland Fire Assessment System World Wide Web site(http://www.fs.fed.us/land/wfas).
2. University of Alaska - Fairbanks. Contact - Dr. David Verbyla
Under the direction of Dr. Verbyla, curriculum is being developed for EOS dataproducts that will be taught this fall and winter in Fairbanks and Anchorage, Alaska. Theparticipants will include natural resource personnel working in Alaska.
3. University of Missouri - Columbia. Contact - Dr. David Larsen
Under the direction of Dr. Larsen, curriculum is being developed for EOS dataproducts that will be taught this fall and winter at the University of Missouri, Columbia.Dr. Larsen is particularly interested in teaching University personnel to incorporate EOSdata in their curriculum and research.
4. University of Idaho
The EOS Education Project is partnering with the University of Idaho and using theirexpertise in the work they have performed with NASA's GLOBE project.
C. EOS Data Processing and Sample EOS/MODIS Products
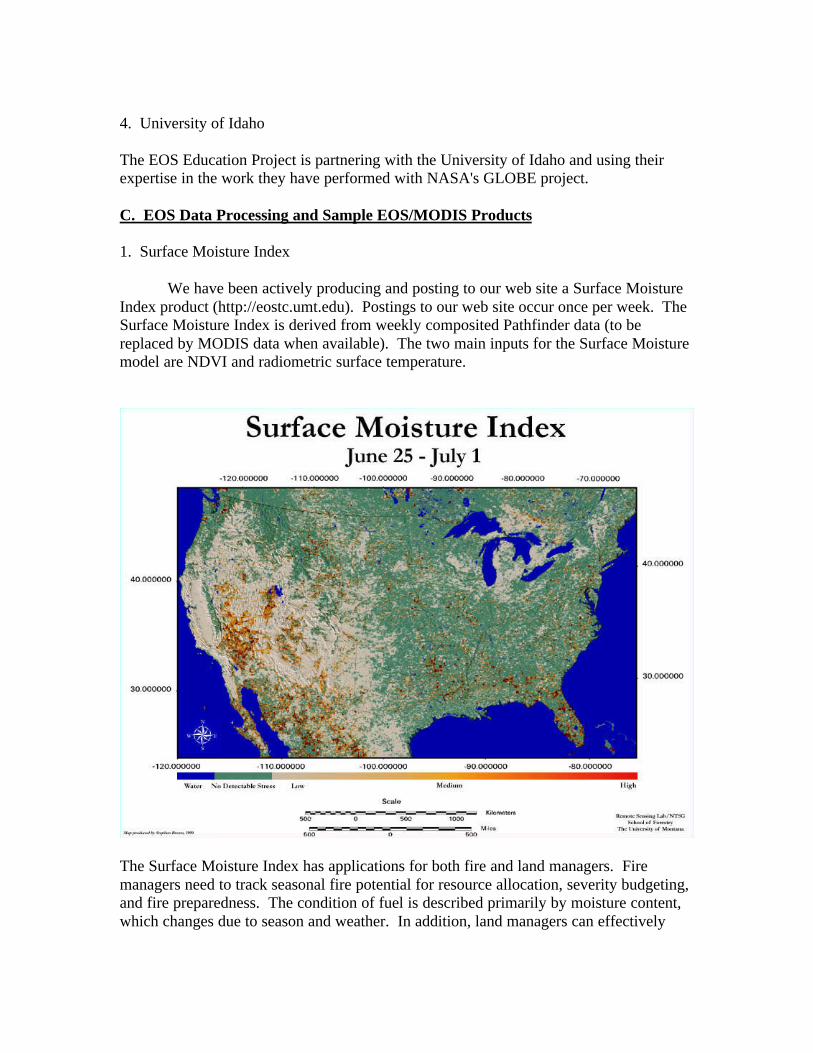
1. Surface Moisture Index
We have been actively producing and posting to our web site a Surface MoistureIndex product (http://eostc.umt.edu). Postings to our web site occur once per week. TheSurface Moisture Index is derived from weekly composited Pathfinder data (to bereplaced by MODIS data when available). The two main inputs for the Surface Moisturemodel are NDVI and radiometric surface temperature.
The Surface Moisture Index has applications for both fire and land managers. Firemanagers need to track seasonal fire potential for resource allocation, severity budgeting,and fire preparedness. The condition of fuel is described primarily by moisture content,which changes due to season and weather. In addition, land managers can effectively
monitor landscape moisture stress levels in the soil/vegetation surface. This data is alsoposted for the 1998 season with plans to provide a full historic data base.
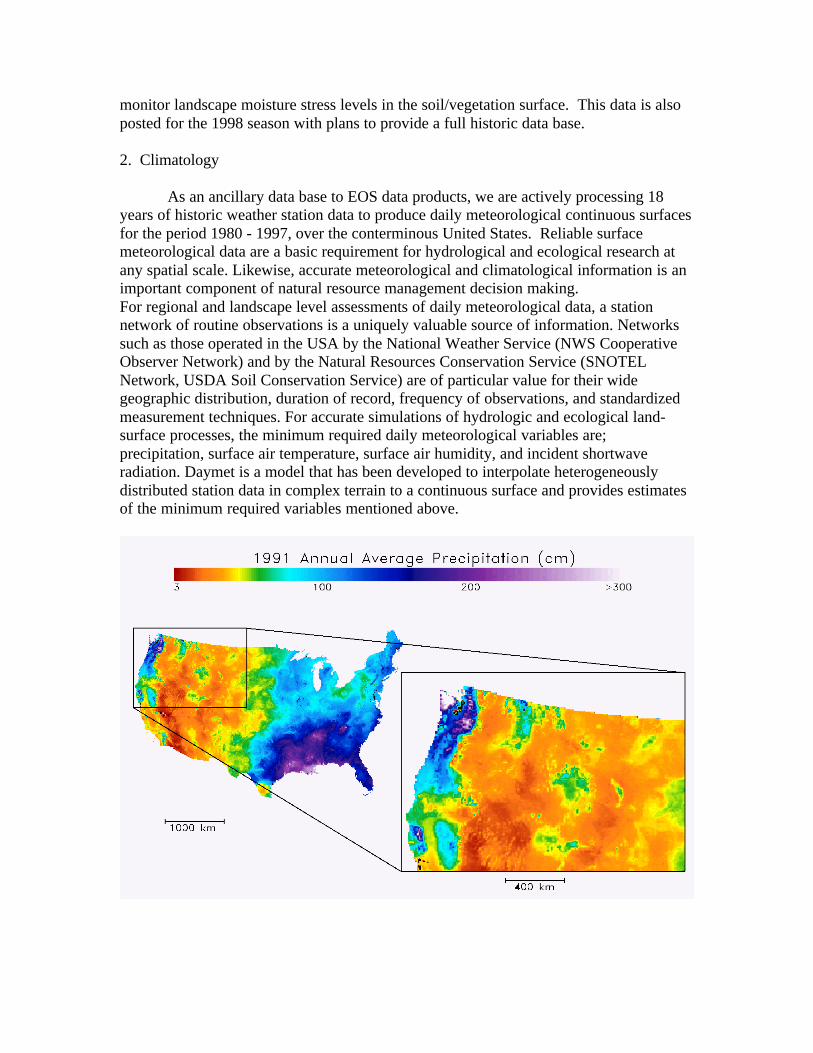
2. Climatology
As an ancillary data base to EOS data products, we are actively processing 18years of historic weather station data to produce daily meteorological continuous surfacesfor the period 1980 - 1997, over the conterminous United States. Reliable surfacemeteorological data are a basic requirement for hydrological and ecological research atany spatial scale. Likewise, accurate meteorological and climatological information is animportant component of natural resource management decision making.For regional and landscape level assessments of daily meteorological data, a stationnetwork of routine observations is a uniquely valuable source of information. Networkssuch as those operated in the USA by the National Weather Service (NWS CooperativeObserver Network) and by the Natural Resources Conservation Service (SNOTELNetwork, USDA Soil Conservation Service) are of particular value for their widegeographic distribution, duration of record, frequency of observations, and standardizedmeasurement techniques. For accurate simulations of hydrologic and ecological land-surface processes, the minimum required daily meteorological variables are;precipitation, surface air temperature, surface air humidity, and incident shortwaveradiation. Daymet is a model that has been developed to interpolate heterogeneouslydistributed station data in complex terrain to a continuous surface and provides estimatesof the minimum required variables mentioned above.
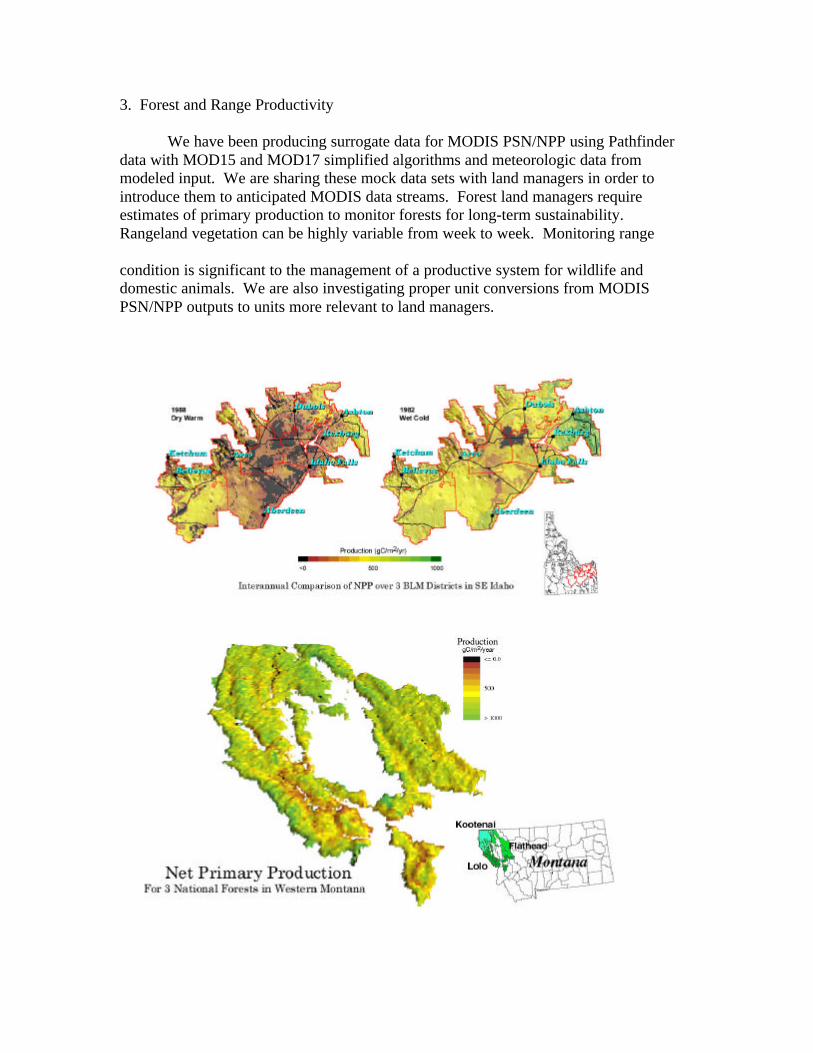
3. Forest and Range Productivity
We have been producing surrogate data for MODIS PSN/NPP using Pathfinderdata with MOD15 and MOD17 simplified algorithms and meteorologic data frommodeled input. We are sharing these mock data sets with land managers in order tointroduce them to anticipated MODIS data streams. Forest land managers requireestimates of primary production to monitor forests for long-term sustainability.Rangeland vegetation can be highly variable from week to week. Monitoring range
condition is significant to the management of a productive system for wildlife anddomestic animals. We are also investigating proper unit conversions from MODISPSN/NPP outputs to units more relevant to land managers.
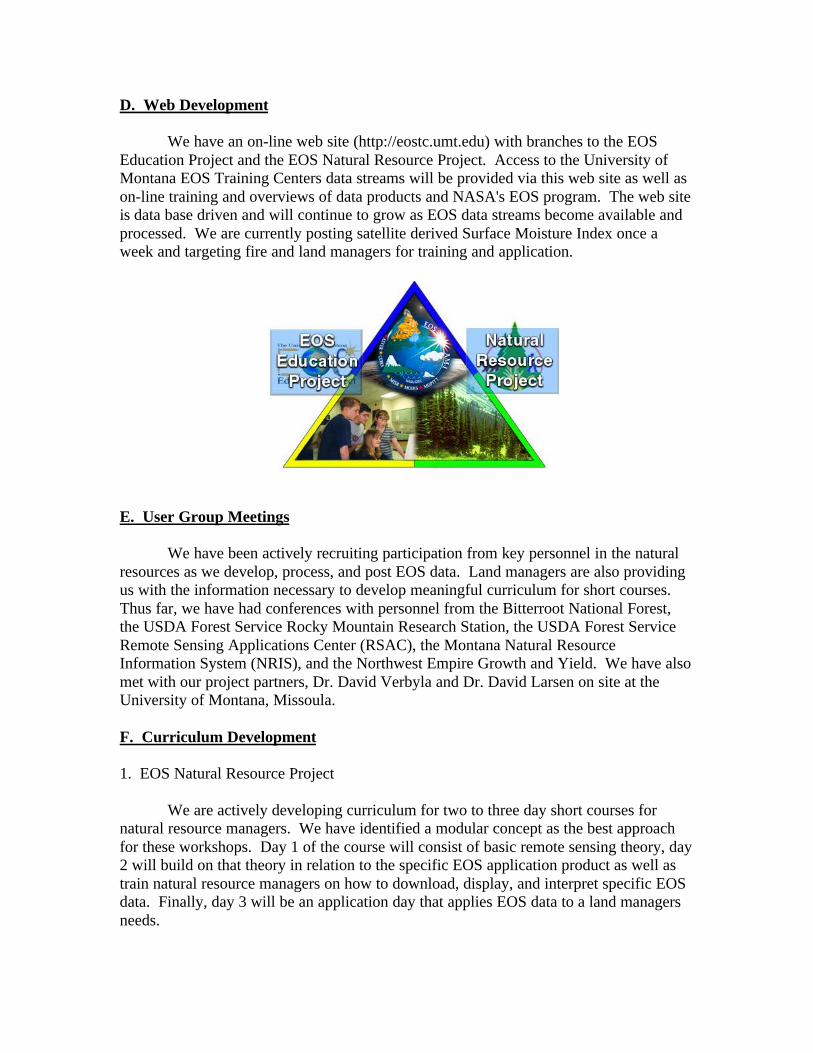
D. Web Development
We have an on-line web site (http://eostc.umt.edu) with branches to the EOSEducation Project and the EOS Natural Resource Project. Access to the University ofMontana EOS Training Centers data streams will be provided via this web site as well ason-line training and overviews of data products and NASA's EOS program. The web siteis data base driven and will continue to grow as EOS data streams become available andprocessed. We are currently posting satellite derived Surface Moisture Index once aweek and targeting fire and land managers for training and application.
E. User Group Meetings
We have been actively recruiting participation from key personnel in the naturalresources as we develop, process, and post EOS data. Land managers are also providingus with the information necessary to develop meaningful curriculum for short courses.Thus far, we have had conferences with personnel from the Bitterroot National Forest,the USDA Forest Service Rocky Mountain Research Station, the USDA Forest ServiceRemote Sensing Applications Center (RSAC), the Montana Natural ResourceInformation System (NRIS), and the Northwest Empire Growth and Yield. We have alsomet with our project partners, Dr. David Verbyla and Dr. David Larsen on site at theUniversity of Montana, Missoula.
F. Curriculum Development
1. EOS Natural Resource Project
We are actively developing curriculum for two to three day short courses fornatural resource managers. We have identified a modular concept as the best approachfor these workshops. Day 1 of the course will consist of basic remote sensing theory, day2 will build on that theory in relation to the specific EOS application product as well astrain natural resource managers on how to download, display, and interpret specific EOSdata. Finally, day 3 will be an application day that applies EOS data to a land managersneeds.

2. EOS Education Project
The EOS Education Project has developed on-line courses for educators thatteaches them the basics of microcomputers. They will also offer an on-line course thatwill result in a GIS certificate. In addition, new protocols and curriculums are beingdeveloped to enhance EOS education in already existing programs such as NASA'sGlobal Learning and Observations to Benefit the Environment (GLOBE) program andthe Montana Geographic Alliance.
G. MODIS Data Stream Preparation
The EOS Training Center benefits from its relationship to the NumericalTerradynamic Simulation Group (NTSG) within the School of Forestry by having anarchive of Pathfinder and Landsat data (current and historic EOS data). We are currentlydeveloping methods and internet capabilities to download EOS data (specificallyMODIS) in an HDF-EOS format. We are also currently developing methods to automatethe downloading and post processing of EOS data products so that natural resourcemanagers have timely access to these data sets.
H. Metrics
We are actively assessing and complimenting the metrics developed and used byNASA specific to Regional Earth Science Applications Centers (RESACs). We willfollow the outline below as identified by NASA:
The Government Performance Results Act (GPRA) requires that all Governmentfunded projects report their accomplishments and the resulting impact theseaccomplishments have on the socio-economic well-being of society and the Nation.
Description:Summary of the project written for an outside audience i.e., reader who is not intimatelyfamiliar with the technology, science, applications and techniques.Project Work Location:Geographic location where the work is actually being performed.Inputs:All the inputs that are needed to complete and carry out the project. This includes humanand physical capital and materials required for the research and applications process. Itdescribes the cost of doing business and includes: budget, number of researchers/teams,participating users, data required, and use of other assets e.g., ancillary data.Outputs:Immediate observable products of the research and applications activity. Describes theefficiency resulting from the use of the resources. Includes data sets and applicationsdeveloped, models developed, number of presentations made, papers published, numberof graduate students supported (if applicable), and other direct results of the project.
Outcome:Longer term results to which the program contributes. Includes understanding gained,applications demonstrated, resulting programmatic decisions enabled as a result of theseapplications. Examples included outcome such as "the rate of growth of the northernforest was accurately measured for the first time".Impact:This section discusses the total consequences of the program, including intended benefitsand unintended positive results. Includes description of utility and socio-economicbenefit to the end users/customers. This section shall answer questions such as: Whywere the results of the projects useful? How were they useful? How were the end results(i.e., applications and data products developed) used in decision-making? What kind ofsignificant economic or policy consequence resulted from the project? Most important ofall-it answers the question: "So what?" Includes assessments such as new knowledgeshared, cost saved, new applications or functions that were done that were not possiblebefore. How did or would the results impact the public good or expandedcommercialization of value-added Earth Science data.
ACTIVITIES OF R. Nemani (MODIS Team Member)
WORK ACCOMPLISHED:
1. MOD17 PSN/NPP Algorithm:
Using monthly LAI/FPAR for 12 years (1983-1994) derived from 8km Pathfinderdata (surrogate for MODIS LAI/FPAR) and daily climatic data gridded at 1x1 lat/lon(surrogate for DAO data), we are testing MOD17 algorithm in the following ways:
1) Ability to handle missing composite periods: When continuous cloud cover orother instrument problems preclude the production of LAI/FPAR, what is the bestway to handle the lack of LAI/FPAR input into the GPP/NPP algorithm? We areexploring various options in this regard: 1) no estimation of GPP/NPP for thatparticular composite period and subsequent exclusion from the annual estimates.2) Using LAI/FPAR from the previous composite period, but flagging theGPP/NPP as less than perfect in the Q/A.
2) Magnitudes and seasonality of GPP/NPP for various biomes: Monthly GPP/NPPcomputed from the historical data will be compared to the estimates reported fromvarious NPP models for Pottsdam global NPP modeling effort. This effortconcentrates on the spatial distribution and seasonality of NPP, to identifygeographic areas or seasons that are clearly not reproduced.
3) Inter-annual variability in terrestrial carbon exchange: 12 years of historical dataprovides a valuable dataset to exercise the MOD17 algorithm for its ability tocapture inter-annual variations in GPP/NPP.
4) Comparing the MOD17 GPP/NPP with carbon fluxes estimated using BIOME-BGC: MOD17 algorithm is a simplified version of BIOME-BGC, an ecosystemmodel that simulates complete daily carbon, water and nitrogen cycles. Bycomparing the outputs of MOD17 with full-up BIOME-BGC estimates, we verifythe loss of accuracy in the estimates and how these losses are distributedseasonally and geographically.
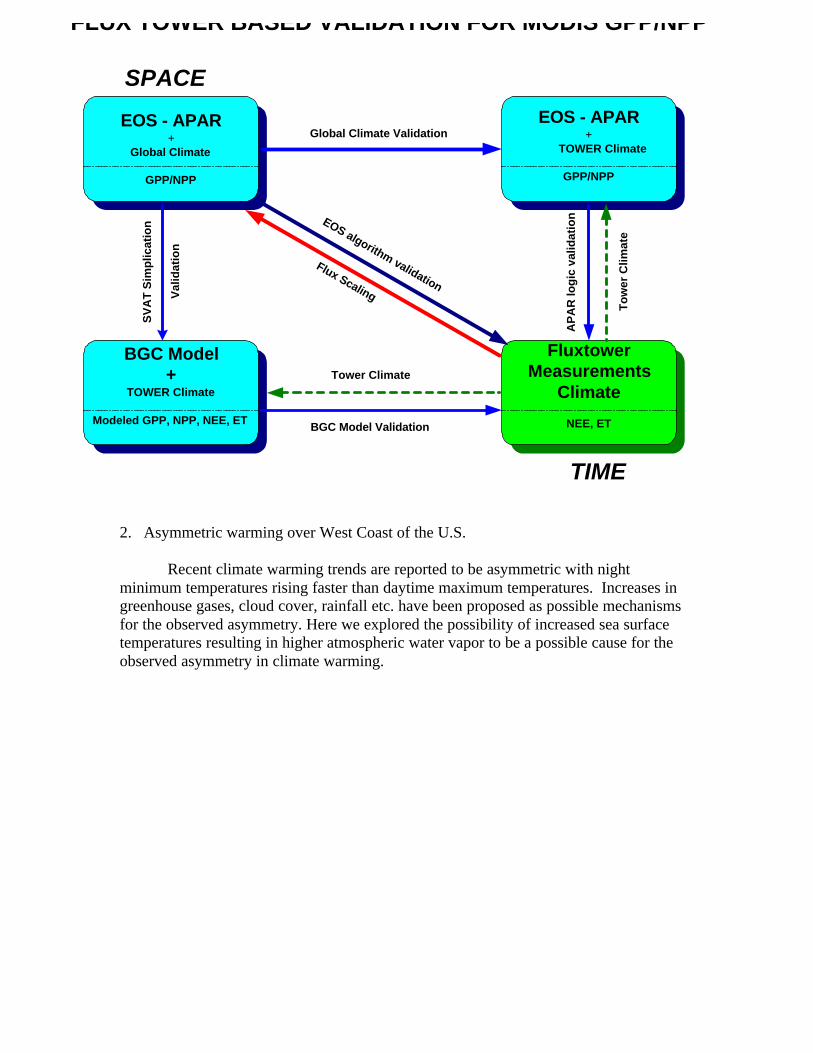
2. Validation of MODIS GPP/NPP
Working details of a flux tower based validation of MODIS GPP/NPP (Figure 1) arebeing finalized. The strength of this validation plan is its ability to provide validationof several key components of MODIS GPP/NPP algorithm. For example, flux towerbased climatic data is useful for checking the climate drivers for MOD17 derivedfrom DAO. Observed climatic conditions are also used to drive an ecosystem modelwhich computes various carbon fluxes useful for interpreting the net ecosystemexchange observations from the eddy correlation measures. Protocols for automateddata exchange are being developed to share observed tower climate data and MODISproducts between MODLAND members and FLUXTOWER scientists. As a part ofthis validation effort, several AMERIFLUX sites have agreed to participate in thiseffort. The proposed validation scheme provides a continuous and near-realtimevalidation of MODIS GPP/NPP products. The tower sites, in turn, receive MODISderived GPP/NPP, leaf area index, FPAR and land cover data around their sites.
2. Asymmetric warming over West Coast of the U.S.
Recent climate warming trends are reported to be asymmetric with nightminimum temperatures rising faster than daytime maximum temperatures. Increases ingreenhouse gases, cloud cover, rainfall etc. have been proposed as possible mechanismsfor the observed asymmetry. Here we explored the possibility of increased sea surfacetemperatures resulting in higher atmospheric water vapor to be a possible cause for theobserved asymmetry in climate warming.
EOS - APAR+
TOWER Climate
GPP/NPP
BGC Model+
TOWER Climate
Modeled GPP, NPP, NEE, ET
FluxtowerMeasurements
Climate
NEE, ET
EOS - APAR+
Global Climate
GPP/NPP
FLUX TOWER BASED VALIDATION FOR MODIS GPP/NPP
EOS algorithm validation
To
wer
Clim
ate
AP
AR
log
ic v
alid
atio
n
Flux Scaling
Tower Climate
BGC Model Validation
Global Climate ValidationS
VA
T S
imp
licat
ion
SPACE
TIME
Val
idat
ion
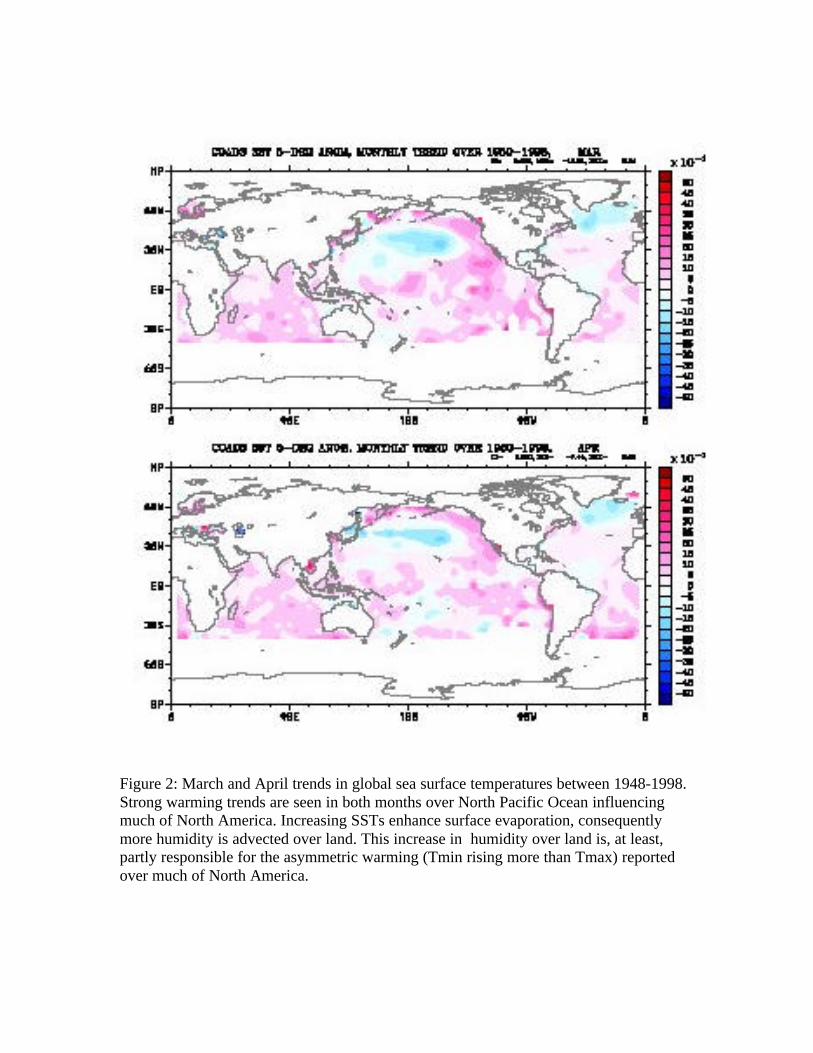
Figure 2: March and April trends in global sea surface temperatures between 1948-1998.Strong warming trends are seen in both months over North Pacific Ocean influencingmuch of North America. Increasing SSTs enhance surface evaporation, consequentlymore humidity is advected over land. This increase in humidity over land is, at least,partly responsible for the asymmetric warming (Tmin rising more than Tmax) reportedover much of North America.
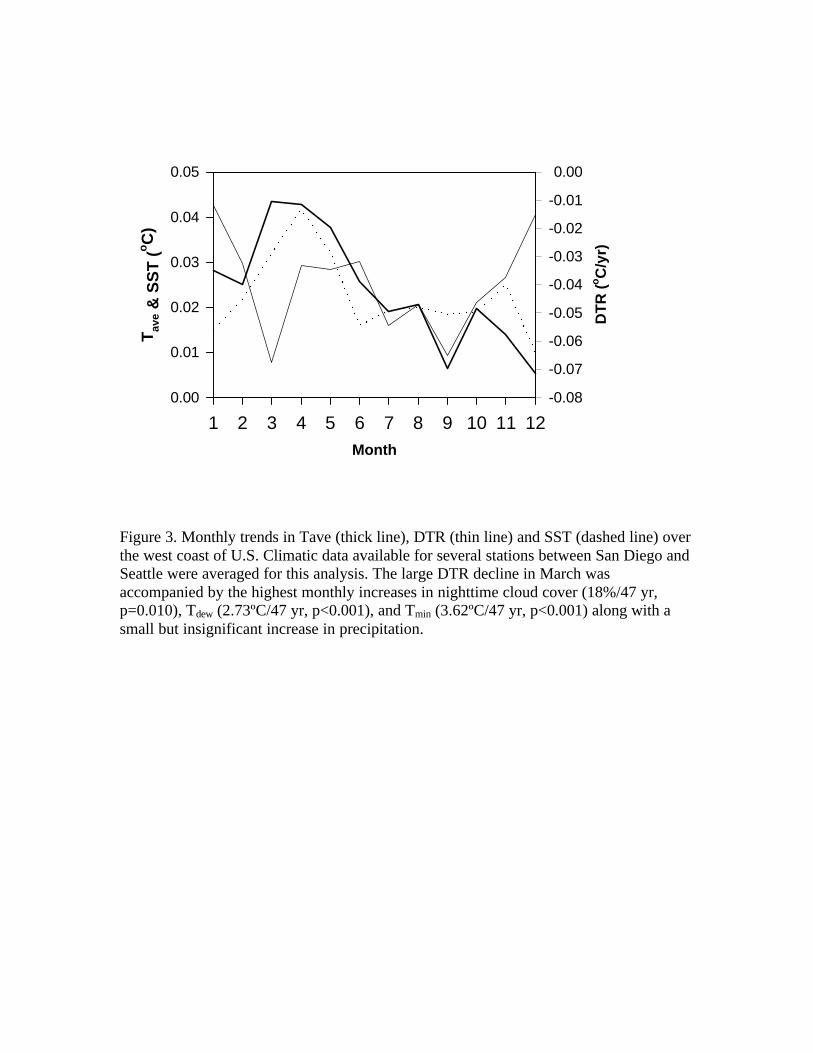
Figure 3. Monthly trends in Tave (thick line), DTR (thin line) and SST (dashed line) overthe west coast of U.S. Climatic data available for several stations between San Diego andSeattle were averaged for this analysis. The large DTR decline in March wasaccompanied by the highest monthly increases in nighttime cloud cover (18%/47 yr,p=0.010), Tdew (2.73ºC/47 yr, p<0.001), and Tmin (3.62ºC/47 yr, p<0.001) along with asmall but insignificant increase in precipitation.
Month
1 2 3 4 5 6 7 8 9 10 11 12
Tav
e &
SS
T (
oC
)
0.00
0.01
0.02
0.03
0.04
0.05
DT
R (o
C/y
r)
-0.08
-0.07
-0.06
-0.05
-0.04
-0.03
-0.02
-0.01
0.00
MEETINGS ATTENDED:
MODIS Science meeting, Greenbelt, MD, MayWorkshop on ‘Long-lead climate forecasts for California’, La Jolla, CA, MayInternational conference on global carbon cycle, Tsukuba, Japan, AprilWorkshop on ‘Data fusion and data mining’, Moffett Field, CA, July
CONFERENCE PRESENTATIONS:
‘Land surface products from the NASA/EOS’, La Jolla, CA‘Monitoring terrestrial net primary production during NASA/EOS era’, Tsukuba, Japan‘Data fusion in EOS/MODIS algorithms’, Moffett Field, CA.
PUBLICATIONS:
Nemani, R.R., S.W. Running, P.E. Thornton and J.G. Glassy. 1999. Monitoringterrestrial net primary production during NASA/EOS era. In: Proceedings of theInternational Conference on global environmental monitoring, Tsukuba, Japan.
Wessman, C., R. Nemani et al. 1999. Remote sensing perspectives and insights for studyof complex landscapes. In: Integrating hydrology, ecosystem dynamics, andbiogeochemistry in complex landscapes, Dahlem workshop report., eds: J.D.Tenhunen and P. Kabat., John&Wiley, NY.
Chase, T.N., R.A. Pielke, Sr., T.G.F. Kittel, R.R. Nemani and S.W. Running. 1999.Simulated impacts of historical land cover changes on global climate in Northernwinter. Climate Dynamics (in press).
Hasenauer, H., R. Nemani, K. Schadauer and S.W. Running. 1999. Forest growthresponse to changing climate between 1961-1990 in Austria. Forest Ecology andManagement (in press)
Keyser, A., J.S. Kimball, R.R.Nemani and S.W. Running. 1999. Simulating the effects ofclimate change on carbon balance of north American high latitude forests. GlobalChange Biology (in press).
Nemani, R.R., M.A. White, D.R. Cayan, G.V. Jones, S.W. Running and J.C. Coughlan.1999. Asymmetric climatic warming in coastal California and its impact on thepremium wine industry. Climate Research (in review)
Nemani, R.R., M.A. White, D.R. Cayan, G.V. Jones, S.W. Running and J.C. Coughlan.1999. Have recent climatic changes helped the California wine industry?California Agriculture (in review).
ACTIVITIES OF J. M.Glassy, MODIS Software Engineer: July 1999
OBJECTIVES
My objectives during the time period January 1999 to July 1999 are summarized next.Details on each of these activity areas follow below.
Algorithm Development
• Implemented an updated PGE-33 (daily FPAR,LAI) algorithm, version 2.1.5 duedeliver to SDST late July 1999. Currently the version 2.1.6 is baselined at MODAPS.
• Implemented an updated PGE-34 (8-day composite) algorithm, version x.y.z, due forSDST delivery mid-July 1999.
• Implemented an updated PGE-36 (daily PSN,NPP) intermediate algorithm, to use arevised "n-day-committed" intermedaite data layer, and to interface to a new subsetDAO file, and to integrate to the newest SDPTK v.5.2.5.
• Implemented updated PGE-37 and PGE-37 algorithm codes.• Maintain the latest versions of the NASA software tools required for algorithm
implementation: (SDPTK, HDFEOS and HDF software libraries)• Updated the MUM API library (now at version 2.3.5) on all supported compute
platforms.• Oversee the development of the MODIS Climate Modeling Grid (CMG) variants of
the above land algorithms, implemented as monthly aggregated products.
Pre-Launch QA and Certification Activities
• Participate with the MODADPS and LDOPE staff in a number of on-going algorithmreadiness tests, including the N-day test, the X-day test and the Y-day test.
• Deployed new versions of COTS tools (IDL and ENVI) with LDOPE supplied QAsoftware scripts.
• Deployed new version (v.1.1) of the Land Data Operational Processing Environment(LDOPE) command line QA tool suite.
SCF Development
• Manage the overall development of the Univ. Montana NASA Science ComputeFacility, to assure effective deployment in the at-launch era.
• Major SCF activities included an entire re-location of our SCF to another room at theUniversity of Montana Science Complex.
• Refined organization of FTP ingest activity to include system redundancy.• Established operational viability of our MTI 2.4Tb DLT tape robot for full 30 cell
robotic operation.• Performed orders for (5) 120Gb Dynamic Raid Factor (DNF) RAID 3/5 units of new
disk storage and a prototype Linux cluster were made.
Collaborations: Science and Data Systems
• Collaborate with Boston University staff on establishing quality assurance practicesand procedures for the MOD15A1 FPAR, LAI product.
• Coordinate with with Dr. Mark Abbot's MODIS Oceanography group (Oregon StateUniversity) in an evolving program to implement a western USA X-band directbroadcast feed from OSU to U.Montana, to allow us a near-real-time feed of keyMODIS products for SCF use.
• Officially enlisted as a NASA SDPTK beta test site/advisory group, in anticipation ofthe migration to the new HDF v.5.0 data standard for HDFEOS and SDPTK.
• Attended NASA MODIS (Science Team and MODLAND/SDST) meetings.
WORK ACCOMPLISHED
From January 1999 to July 1999 we have divided our efforts between QA operationspreparations, implementing a variety of minor ECS algorithm refinements, and initiatingnew collaborations for MODIS related activities.
ALGORITHM DEVELOPMENT
Several minor changes were applied to all Montana SCF PGE's across the board. Theseincluded:• use of a standardized UM_VERSION version-date-time stamp placed as a global file
attribute in all product files• updated ancillary files (MOD15A1_ANC_v21.hdf, MOD15A2_ANC_v21.hdf, and
MOD17A1_ANC_v21.hdf) which now contain all archive product fieldspecifications. This data-driven approach allows minor modifications in the outputproduct gridfields to be made with only a change in the ancillary file and not a re-compilation of the software itself.
• standardized use of an optional within-tile subset scheme whereby the .PCF file for agiven algorithm contains a runtime user parameter specifying the corner points (inraster coordinates) of a rectangular region to restrict processing to. For example forPGE-33, the .PCF parameter would be: "FPAR_PCF_MBR|0,0,100,100" to restrictprocessing to just a 100x100 pixel subset of the tile. In the future we will expand thesyntax to recognize the region described in terms of {latitude,longitude} coordinates.
Updated code deliveries from our SCF to SDST for PGE-33, PGE-34, and PGE-36 areplanned for the mid to late July 1999 timeframe. Assuming launch occurs no earlier thanSeptember 13, 1999, we anticipate there will be enough time to integrate these PGEs intoMODAPS prior to start-up time, approximately launch + two months.
PGE 33 and PGE 34 : (MOD15) FPAR, LAI daily intermediate and 8-dayalgorithms
Changes to the PGE-33 and PGE-34 code sets this period included integration with the
new NASA libraries (SDPTK v.5.2.5 and HDF-EOS v.2.5.1), the most recent MUM APIlibrary (v.2.3.5) as well as some minor refinements involving QA metadata fieldprocessing. Full IS grid (integerized sinusoidal land projection) tile processing for PGE-33 is now (479 sec/tile, 38.45 hours/1 CPU) and for PGE-34 is (59 sec/tile; ca 12.04hours/1 CPU for a global coverage of 289 tiles) as certified on our AIX4.2.x buildplatform. Performance should be slightly better on the SGI production platform.
PGE 36 : (MOD17) PSN, NPP daily algorithm
Changes to PGE-36 primarily involved the addition of a new 2D data plane to the dailyintermediate state file (e.g. MOD17A1.A1996214.h12v04.1998195101215.hdf). Thisnew data plane (Yd_N_Committed) tracks for each pixel/tile combination the number ofyear-days successfully completed by the algorithm, providing a actual-date adjustedannual NPP estimate at the end of the year. This change increased the size of the dailyintermediate file insignificantly-- from ca 11Mb/tile to 14Mb/tile. In response to anSDST request, we have also added a new PGE processing state table (held in the ancillaryfile MOD15_PROCSTATE.hdf) that consists of a 2D matrix of tile/year-daycombinations. As each tile-yearday combination is successfully completed, the 0 in theslot is adjusted to 1. This facility should provide us with a second level check in theevent that the daily intermediate files which accumulate values over the course of theyear become corrupt, and we need to re-start the model at the "last known good date".Performance for the PGE-36, broken down by temporal model events is:• First-in-year event: ca 45 sec/tile/CPU• Eight-day composite event: ca 61 sec/tile/CPU• Annual NPP event: ca 61 sec/tile/CPU
Another major change for PGE-36 made during this period involves the new layout forthe ancillary daily climatology from the NASA GSFC Data Assimilation Office (DAO).The five surface climatology fields we need for PGE-36 are now packaged in a singleHDFEOS file (rather than two before) and contain only these fields instead of the 25 to30 fields present in the earlier scheme. This dramatically reduces the transfer datavolume required to run PGE 36,37, and 38 and should also result in slightly increasedperformances for these PGEs.
PGE-37 and PGE-38 : PSN, NPP 8-day and annual NPP algorithm
The only changes made this period involved those discussed above involving the newyear-day tracking facility. The current version of the PGE 36/37/38 algorithm is nowunder final integration and test at our SCF prior to delivery to SDST. Integrationproblems resulting from the migration to the new single file DAO DAS subset involvedthe way HDF dimension scale objects (masquerading as SDS fields) were interleavedwith the actual 2D grid fields. A patch for this layout was implemented and tested as ofJuly 13, 1999.
CMG Algorithm (PGE 39,63,64) Development
The CMG algorithm development is being led by software engineer Petr Votava. ThreeCMG algorithms are currently under development:
• Monthly FPAR, LAI : PGE 63• Monthly PSN : PGE 39• Annual NPP : PGE 64
The design of the CMG algorithm is completely done using object-oriented techniques.The mapping from the input pixels to the output CMG pixel is done on the fly using aspecial set buffer and a two-level aggregation process. Care has been taken to allow forany possible order of input data – i.e. if not all the inputs are present at once, a specialintermediate file is created which enables us to keep track of the progress of thealgorithm. This is especially important given the fact that pixels from several input tilescan map into single CMG output pixel.
There is a design document that accompanies the implementation. Currently we areworking on much more detailed document, an API guide and a template document. Greatattention has been paid to generality and abstraction of important classes so that thisdesign can be easily used as a template for other teams working on the CMG products.The classes have been also implemented in a way that ensures that there is a lot ofpotential for reuse in other products, so that not only the design, but also theimplementation can be used as a template.
Currently we are at work on a proposal that will add another PGE to the suite that willmake the composition of our inputs (i.e. monthly, yearly) more efficient and simple.Estimated performance of the prototype CMG algorithm for a 0.25 degree globalresolution coverage, all data layers, is 4.5 hours/CPU.
QA ACTIVITIES
The primary QA activities during this time period involved refining QA operationalprocedures involved in querying the LDOPE QA database and working with theMODAPS (MEBDOS) system to practice retrieving data granules for our algorithms.Several successful tests of these activities were conducted, but in general retrieving datafrom MODAPS was difficult due to the extremely short time periods our product datawas available between formal test episodes (e.g. WILT, N-day, X-day, Y-day, MOSS-2etc). We expect to participate more fully in these tests throughout the summer inanticipation of launch readiness. A summary of QA activity progress follows:
• MODAPS accounts were established for Point of Contact Joe Glassy and PetrVotava.
• LDOPE QA database accounts were established and tested for Joe Glassy and PetrVotava.
• MEBS and LDOPE QA database test sessions were conducted in which the ECSmetadata fields SCIENCEQUALITYFLAG and SCIENCEQUALITYFLAG
EXPLANATION granules were adjusted to reflect quality examinations.• Runtime QA assignment procedures for MOD15 were reviewed and improvements
made as problems surfaced. This refinement process is likely to be on-going forsome time with all algorithms.
• New versions of QA COTS software (RSI's IDL and ENVI) were purchased andinstalled on the AIX and SGI platforms. Additional licenses for these available forour SCF for the Linux and NT platforms.
• We built and minimally tested the new version (v.1.1) of LDOPE command line toolsuite, as well as the LDOPE ENVI QA scripts.
• We successfully tested the automated "FTP-push" DAO ingest operational capabilitywith Mark Carle at GSFC DAAC and others at DAO.
• We have successfully setup a dedicated database server (a dual 200mhz SMPworkstation running RedHat Linux 6.0), running the SyBASE SQL Server 11.xrelational database management (RDBMS) software. A set of prototype databasescheme for tracking QA and algorithm performance logs, DAO ingests, and internalSCF model runs will be implemented and tested throughout this next period.
SCF DEVELOPMENT
SCF development continued apace during this period, despite reduced operationalbudgets. The primary facility issue for our SCF involves a wholesale move of our entireMODIS Compute Ring equipment to a new room in the Science Complex. We are nowpreparing for this move which should occur in August, 1999 timeframe. Another keyfacility issue involves our network services migration from the current dedicated T-1NASA interface to a proposed Abilene DS-3 service level, slated for autumn 1999. Weare taking steps to assure continuous network service via the T-1 prior to any switch toAbilene's DS-3. A new CISCO Catalyst C5K module has been installed to facilitate thismigration, opening up additional 100-Base-T ports.
Data Storage and ArchiveAugmenting our current disk store of approximately 500Gb, we have recently takendelivery of an additional (5) 100Gb RAID 3/5 DNF rack units, bringing our on-line diskmedia to ca 1 Tb. Two operational FTP ingest channels have now been designated, onefor standing orders of MODAPS product data, and one for the automated FTP push ofDAO custom DAS data to our SCF. To facilitate a load balanced flow through oursegmented server architecture, we are deploying a 2.4Tb MTI Digital Linear Tape (DLT)30-cell robot. Recently we have tested the viability of the RLM robotics softwarerequired to exploit this high capacity tape service, via a command line
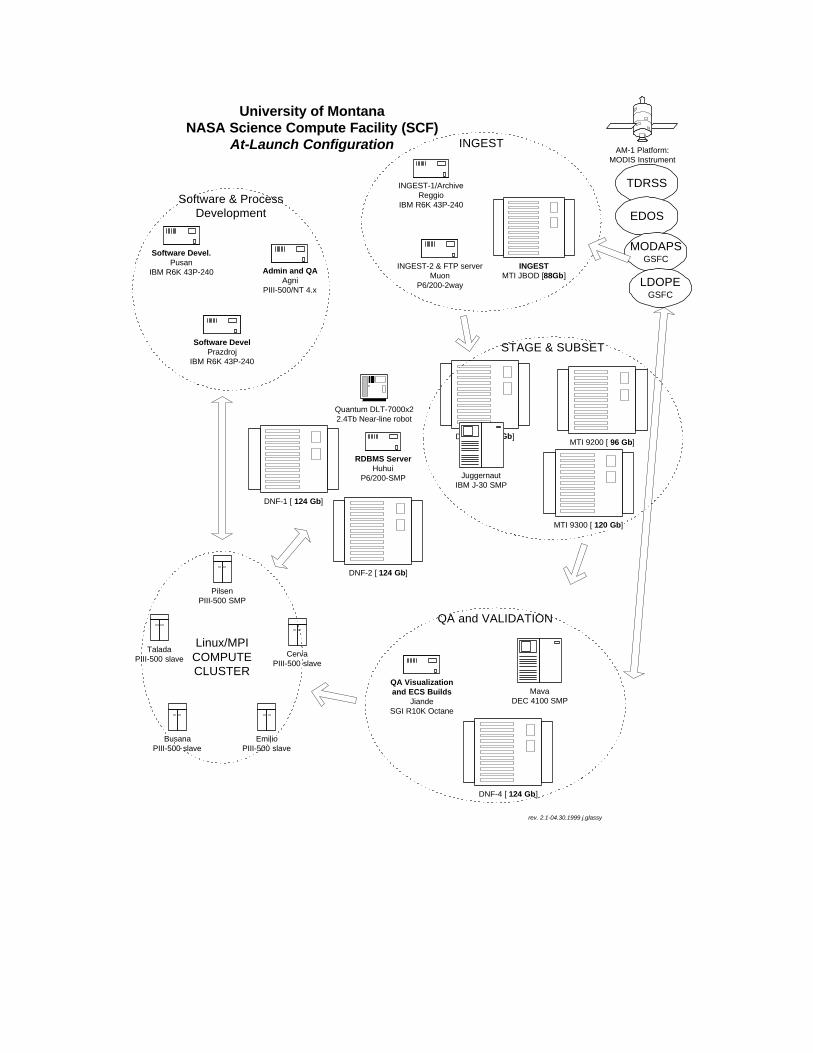
DNF-1 [ 124 Gb]
DNF-2 [ 124 Gb]
Admin and QAAgni
PIII-500/NT 4.x
Software Devel.Pusan
IBM R6K 43P-240
Software DevelPrazdroj
IBM R6K 43P-240
AM-1 Platform:MODIS Instrument
PilsenPIII-500 SMP
CervaPIII-500 slave
EmilioPIII-500 slave
TaladaPIII-500 slave
BusanaPIII-500 slave
Linux/MPICOMPUTECLUSTER
INGESTMTI JBOD [88Gb]
INGEST-2 & FTP serverMuon
P6/200-2way
INGEST-1/ArchiveReggio
IBM R6K 43P-240
INGEST
Software & ProcessDevelopment
DNF-4 [ 124 Gb]
DNF-3 [ 124 Gb]
MavaDEC 4100 SMP
QA Visualizationand ECS Builds
JiandeSGI R10K Octane
QA and VALIDATION
TDRSS
EDOS
MODAPSGSFC
RDBMS ServerHuhui
P6/200-SMP
Quantum DLT-7000x22.4Tb Near-line robot
STAGE & SUBSET
MTI 9300 [ 120 Gb]
MTI 9200 [ 96 Gb]
JuggernautIBM J-30 SMP
LDOPEGSFC
University of MontanaNASA Science Compute Facility (SCF)
At-Launch Configuration
rev. 2.1-04.30.1999 j.glassy
or GUI interface. The RLM system allows us to perform full indexed retrieves on 30 bar-coded DLT tapes (each 35Gb capacity) from the split level jukebox. Our plan is tointegrate the real-time tape indexing into our larger SyBASE RDBMS database schema.
Compute Server Summary
Our current SCF compute server set includes an IBM RS/6000 J-30 (SMP 8-way 166mhzCPUs), and a DEC Alpha Model 4100 2-way SMP workstation. Support workstationsnow include (3) IBM RS/6000 Model 43P-240's (an archive server, and two softwaredevelopment workstations), an SGI/Irix Octane SMP QA workstation, as well as an Intelbased QA workstation. For security reasons, we are planning on segmenting our externalFTP ingest activities off to a high performance Linux workstation, will communicate tothe archive server on a internal network link. For additional compute resources, we arecurrently beginning to investigate the performance and scaling of a limited size Linuxcluster, starting with a prototype 4-way cluster of single CPU P-III 500mhz slaves. Thisprototype cluster is currently at the design phase, with early operational tests estimated tobegin in the late September timeframe.
COLLABORATIONS: SCIENCE AND DATA SYSTEMS
During this period the following collaborations were pursued for MODIS relatedactivities:
• Assisted Boston University staff (Yu Zhang, Yujie Wang, Ranga Myneni) inestablishing QA procedures for the daily FPAR, LAI product (MOD15A1). The nextQA coordination trip is planned to BU for August 1999.
• Established contact with MODIS Oceanographer Dr. Mark Abbott of Oregon StateUniversity to participate in the evolving plan to setup a western USA MODIS X-banddirect broadcast receiving facility at OSU for network feeds of key regional MODISproducts to U.Montana.
• Worked with MODIS GSFC staff Jeff Morrisette, Robert Wolfe and others on settingthe methodology for core validation site product subsetting for MODLAND products.
• Enlisted as a member of the Raytheon/ESDIS SDPTK and HDF-EOS beta test team,in anticipation of the adoption of the new HDF v.5.0 standard in coming versions ofthe SDPTK and HDFEOS libraries.
• Worked in cooperation with NTSG International EOS training center staff (AndyWeiss et al) in formation of a new compute facility and data system for this mission.
MEETINGS ATTENDED
MODIS Science Team Meeting, May 1999MODLAND/SDST Meeting, March 1999
ACTIVITIES OF J by Lloyd P. Queen, Remote Sensing of Biomass Burning
Brief Description of Progress
Research on the two fire products (fire location and surface moisture index) hasprogressed in four main areas. First, we have completed runs for the period April-October for the years 1995 through 1996; completing an 8-year period of record.
This historic archive is the database needed to calibrate model performance to actualranges in historic condition for the satellite moisture index. Second, all model outputshave been posted to an internal web site and documented using Federal Geographic DataCommittee (FGDC) metadata standards. The web site is being accessed by a limitednumber of users from the National Forest System (NFS); and is being used as part of theEOS Training Center activity.
Third, we have compiled GIS databases for the State of Alaska and the eleven westernUS states. These GIS’s contain geographic records of actual fire occurrence, and willprovide the empirical basis for measuring the performance of our model.
Fourth, progress in improving model performance, completion of Phase I model runs, andaccess to the GIS databases have allowed examination of viewing geometry and imagecompositing effects on model performance. Significant variation in samples of NDVI/Tsvalues appear to be driven by viewing angle and timing/duration of AVHRRcompositing. As presented in our ASPRS paper, we have recently adapted the U-Maryland Landcover (1KM) database to segment SDI images by biome type in order totest model sensitivity to landcover class, convolution filter size, water/edge effects, datacompositing, as well as image geometry. As a direct result of that research we haveadopted a new process model that utilizes a trapezoid method to determine surfacemoisture status rather than the former warm-edge extraction technique. A significantimprovement in model performance in areas of mountainous terrain has been achievedthrough implementation of an air-temperature adjustment to the extraction of surfacetemperatures used in calculating SMI values. The historic wet and dry seasons of 1994and 1993, respectively, have been re-compiled using the new trapezoid method, andvalidation of those data using the historic GIS databases of fire occurrence are underway.
Exploratory discussions with the Institute of Chemical Kinetics and Combustion,Siberian Division of the Academy of Science of Russia and the V. N. Sukachev Instituteof Forestry were also initiated during the period. A one-day research workshop was heldat UM in June, 1999 to discuss possible joint activities in application of our remotesensing products for fire and forest productivity assessments. Possible scientist exchangeprograms are being discussed at the current time; and may be in-place by the secondquarter of 2000.
Publications and Presentations“Developing a Computationally Efficient Fire Potential Index from Satellite-derivedEstimates of Surface Moisture Status.” Edited manuscript published in the Proceedings
of the 1999 American Society for Photogrammetry and Remote Sensing Annual MeetingProceedings. Portland, OR. (Also presented as an invited paper at the meetings).
“Fire Potential and Fire Location Mapping Using the Advanced Very High ResolutionRadiometer.” C. Seilestad, J. Plummer, and L. Queen. Presented to the Interior WestFire Council Meetings. Big Sky, MT.
“Remote Sensing of Biomass Burning.” J. Plummer, L. Queen, W. Hao, D. Ward, and S.Running. Presented at the MT/ID GIS User’s Group Meeting. Idaho Falls, ID.
“Implementation of EOS Sensor Data Streams to Forest Fire Detection, Monitoring, andCharacterization.” L. Queen and J. Plummer. Presented to visitors from the USDAForest Service Vegetation Management and Protection Research Group; the Institute ofChemical Kinetics and Combustion, Siberian Division of the Academy of Science ofRussia; and the V. N. Sukachev Institute of Forestry.
Participants Including: Undergraduate Students, Graduate Students,PostdoctoralPositions, Faculty or Research Assistants or Technicians
James Plummer-Riddering, Ph.D. student. UM School of Forestry. This research is thecore of his doctoral dissertation. He has developed the surface moisture index, applied itto current and historic growing seasons, and is now developing a comprehensiveempirical and theoretical validation strategy for the index. Also the recipient of a MSGCFellowship for the second consecutive year. The new Fellowship will allow Riddering towork with Dr. Yoram Kaufman at the GSFC for 11 weeks during the fall/winter of1999/’00.
Carl Seielstad, Ph.D. student. UM School of Forestry. The current SMI modelemphasizes the role of live fuels and portrays spatial and temporal patterns of livevegetation moisture status. Carl’s doctoral thesis will add a complementary element tofire fuels/fire potential assessments by considering dead fuels as well as meteorologicaldata. Co-investigator on a new NASA research project exploring the use of LIDAR datafor forest fuel type characterization.
Steven Brown, M.S. student. UM School of Forestry. A new graduate studentdeveloping change detection and monitoring strategies for historical sequences of SMIimage maps. Also generating image and graphics files for EOS Training Centerdistribution.
Eva Karau, M.S. student. UM School of Forestry. A new graduate student implementingdata translation and documentation protocols for SMI data.
Collaborations Including: NASA Centers, NASA Headquarters, BusinessandIndustry, Other Federal Agencies, State Agencies, Other AgenciesRocky Mountain Research Station/Intermountain Fire Sciences Laboratory (IFSL).USDA Forest Service, Missoula, MT. A one-year Research Joint Venture Agreement
(RJVA) has been signed with the IFSL to use our EOS research to scale estimates ofbiomass burning in time and space.
University of Alaska Fairbanks and the Alaska Fire Service. The State of Alaskaprovides three unique opportunities for validation of our SDI model. First, the highlatitude provides several satellite overpass opportunities per da; second the Alaska FireService has compiled GIS-based databases of actual fire occurrence; and third the scaleof biomass burning in Alaska is such that satellite-derived data have suitable resolution toassess fire occurrence and distribution. I have entered in to a working relationship withUA and the AFS to share data and validation techniques for Alaska for the 1998 growingseason (arranged on a trip to Fairbanks in August, 1998 using RJVA monies from theIFSL).
Goddard Space Flight Center. As part of our RJVA with the Forest Service, I amcollaborating on a project entitled “Biomass Burning and Emissions of Trace gases andAerosols: Validation of EOS Biomass Burning Products.” Investigators include IFSLscientists as well as Y. Kaufman and B. Holben from GSFC. We are developing anAVHRR implementation of two satellite-driven models for fire detection and burn scarcharacterization. This is a three-year project that started in 1998.
Montana Space Grant Consortium. The MSGC funded three proposals aimed atenhancing graduate and undergraduate remote sensing research. The first new program isa PhD Fellowship award that will enable a doctoral student to visit and workcollaboratively with scientists at the GSFC. The second is a new PhD scholarshipprogram that will enable us to recruit high-quality PhD candidates to UM. Third is a newUndergraduate Research Opportunities program which will be run jointly betweenForestry and the UM Honors College. This third program is designed to provide realisticresearch experience for upperclass students intending to pursue a career or further studiesin aerospace-related sciences.