Embed Size (px)
Citation preview

ISSUE: 019
12TH JANUARY, 2019
RULE THE MARKET

From The Desk Of Research Head
Disclaimer: Karvy Stock Broking Limited [KSBL] is registered as a research analyst with SEBI (Registration No INZ000172733). KSBL is also a SEBI registered Stock Broker, Depository Participant, Portfolio Manager and also distributes financial products. The subsidiaries and group companies including associates of KSBL provide services as Registrars and Share Transfer Agents, Commodity Broker, Currency and forex broker, merchant banker and underwriter, Investment Advisory services, insurance repository services, financial consultancy and advisory services, realty services, data management, data analytics, market research, solar power, film distribution and production, profiling and related services. Therefore associates of KSBL are likely to have business relations with most of the companies whose securities are traded on the exchange platform. The information and views presented in this report are prepared by Karvy Stock Broking Limited and are subject to change without any notice. This report is based on information obtained from public sources, the respective corporate under coverage and sources believed to be reliable, but no independent verification has been made nor is its accuracy or completeness guaranteed. The report and information contained herein is strictly confidential and meant solely for the selected recipient and may not be altered in any way, transmitted to, copied or distributed, in part or in whole, to any other person or to the media or reproduced in any form, without prior written consent of KSBL. While we would endeavor to update the information herein on a reasonable basis, KSBL is under no obligation to update or keep the information current. Also, there may be regulatory, compliance or other reasons that may prevent KSBL from doing so. The value and return on investment may vary because of changes in interest rates, foreign exchange rates or any other reason. This report and information herein is solely for informational purpose and shall not be used or considered as an offer document or solicitation of offer to buy or sell or subscribe for securities or other financial instruments. Though disseminated to all the customers simultaneously, not all customers may receive this report at the same time. KSBL will not treat recipients as customers by virtue of their receiving this report. Nothing in this report constitutes investment, legal, accounting and tax advice or a representation that any investment or strategy is suitable or appropriate to your specific circumstances. This material is for personal information and we are not responsible for any loss incurred based upon it. The investments discussed or recommended in this report may not be suitable for all investors. Investors must make their own investment decisions based on their specific investment objectives and financial position and using such independent advice, as they believe necessary. While acting upon any information or analysis mentioned in this report, investors may please note that neither KSBL nor any associate companies of KSBL accepts any liability arising from the use of information and views mentioned in this report. Investors are advised to see Risk Disclosure Document to understand the risks associated before investing in the securities markets. Past performance is not necessarily a guide to future performance. Forward-looking statements are not predictions and may be subject to change without notice. Actual results may differ materially from those set forth in projections. Associates of KSBL might have managed or co-managed public offering of securities for the subject company or might have been mandated by the subject company for any other assignment in the past twelve months. Associates of KSBL might have received compensation from the subject company mentioned in the report during the period preceding twelve months from the date of this report for investment banking or merchant banking or brokerage services from the subject company in the past twelve months or for services rendered as Registrar and Share Transfer Agent, Commodity Broker, Currency and forex broker, merchant banker and underwriter, Investment Advisory services, insurance repository services, consultancy and advisory services, realty services, data processing, profiling and related services or in any other capacity.KSBL encourages independence in research report preparation and strives to minimize conflict in preparation of research report. Compensation of KSBL’s Research Analyst(s) is not based on any specific merchant banking, investment banking or brokerage service transactions. KSBL generally prohibits its analysts, persons reporting to analysts and their relatives from maintaining a financial interest in the securities or derivatives of any companies that the analysts cover.KSBL or its associates collectively or Research Analysts do not own 1% or more of the equity securities of the Company mentioned in the report as of the last day of the month preceding the publication of the research report. KSBL or its analysts did not receive any compensation or other benefits from the companies mentioned in the report or third party in connection with preparation of the research report and have no financial interest in the subject company mentioned in this report. Accordingly, neither KSBL nor Research Analysts have any material conflict of interest at the time of publication of this report. It is confirmed that KSBL and Research Analysts, primarily responsible for this report and whose name(s) is/ are mentioned therein of this report have not received any compensation from the subject company mentioned in the report in the preceding twelve months. It is confirmed that Research Analyst did not serve as an officer, director or employee of the companies mentioned in the report. KSBL may have issued other reports that are inconsistent with and reach different conclusion from the information presented in this report. Neither the Research Analysts nor KSBL have been engaged in market making activity for the companies mentioned in the report. We submit that no material disciplinary action has been taken on KSBL by any Regulatory Authority impacting Equity Research Analyst activities.
From a Reformist Government to Populist Government - Will Modi play his trump card now?Citizens who belong to the middle class are to some extent relieved after the government lately
slashed GST rates on various goods and services. Thereafter, the sense on the street has been pretty
clear that the incumbent government is likely to turn to populist measures over the next few months
to woo those voters who have been most affected by two of the impacting decisions of the Modi
Government, demonetization and the haphazard implementation of GST.
Until recently, the government has been holding onto its nerve by not fiddling too much with its
reformist nature, that it has been known to possess. It all started when the government began to
feel the heat from the opposition and received a lot of flak on the social media, back in October
last year when the prices of crude oil were skyrocketing. The finance ministry had then intervened
and announced a reduction of Rs. 2.5 per liter in the prices of petrol and diesel, out of which, the oil
marketing companies would bear a burden of Rs. 1per liter by compromising on their margins. After
being defeated across the Hindi belt in assembly elections, the BJP has clearly understood that there
is a lot of ire among the citizens and a few sensitive issues need to be addressed to, in the run-up to
the general elections which are to be held anytime around April - May 2019.
Recently, the government cut the GST rates on several products and services, and this move was
welcomed by everyone. This was followed by the 10% reservation in government jobs and education
for economically weaker upper castes. This is over and above the already existent 50% reservation
criteria. This move is very much in line with the ideology of the RSS which has time and again
emphasized on the fact that reservations must be given on the basis of economic parameters and
must not be caste based. This will eventually have the economically weaker sections of the society
favor the incumbent government. Apart from these actions taken by the government, it is likely to
come out with direct benefit transfer scheme in which Rs. 4,000 per acre per season will be provided
to farmers along with an interest-free crop loan up to Rs. 1 lakh per farmer. Mr. Modi is also taking
efforts to come out with more favorable measures for the farmers, indirectly to seek their votes for
the general elections.
Thus, foreign investors and the entire country are waiting to see the government’s next move, which
is most likely to be in favor of the general public. The government will have to be nimble-footed in its
plan to win the general elections as the Congress is already in a combative mood to dethrone them
by claiming that the Rafale Deal has a lot of irregularities and that it is a scam. Despite Modi being a
favorite to reclaim his office as prime minister, he has to understand that people generally tend to
remember the latest happening when they go to cast their vote. Hence the government has to do the
balancing act by turning a little populist while continuing to be a reformist, thereby, flawlessly carrying
out the balancing act.
CONTENTSEquity 1-6
Derivatives 7-8
Commodity 9-12
Currency 13-17
Events 18
TeamDr Ravi Singh
Arun Kumar Mantri
Aditya Kistampally
Deepak Balkrushna Sakure
M V Narasinga Rao
Murad Bapuji Chinoy
Naga Chaitanya
Osho Krishan
Srinivas Krishnan Bobba
Vivek Korkondabhattar
Vivek Ranjan Misra
Munindra Upadhyay
Arvind Vinjamoori
Ankit Soni
Veeresh Hiremath
Siddhesh Ghare
Ravi Pandey
Ramesh Chenchala
Arpit Chandna
Ravikanth Pedapati
Bharath Sunnam
Anup B.P
Amit Kumar
Vinod Jaya Kumar
Karvy Head Office
Karvy Stock Broking Limited, Plot No.31, 6th Floor, Karvy Millennium Towers, Financial District, Nanakramguda, Hyderabad, 500 032, India.
For More updates & Stock ResearchVisit: www.karvyonline.com
Toll free: 1800 419 8283
Email: [email protected]
Analyst CertificationThe following Karvy Research Desk, who is (are) primarily responsible for this report and whose name(s) is/ are mentioned therein, certify (ies) that the views expressed herein accurately reflect his (their) personal view(s) about the subject security (ies) and issuer(s) and that no part of his (their) compensation was, is or will be directly or indirectly related to the specific recommendation(s) or views contained in this research report.
- VIVEK RANJAN MISRA Head - Fundamental Research
EQUITY
Economy
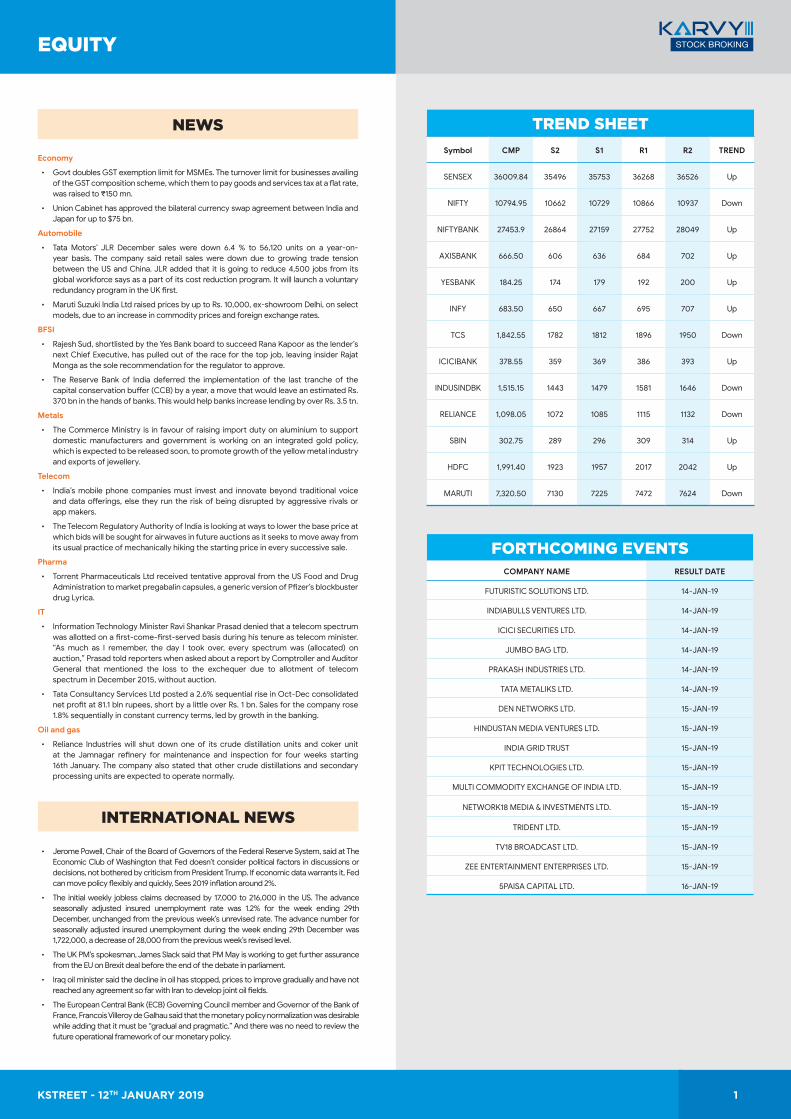
• Govt doubles GST exemption limit for MSMEs. The turnover limit for businesses availing of the GST composition scheme, which them to pay goods and services tax at a flat rate, was raised to ₹150 mn.
• Union Cabinet has approved the bilateral currency swap agreement between India and Japan for up to $75 bn.
Automobile
• Tata Motors’ JLR December sales were down 6.4 % to 56,120 units on a year-on-year basis. The company said retail sales were down due to growing trade tension between the US and China. JLR added that it is going to reduce 4,500 jobs from its global workforce says as a part of its cost reduction program. It will launch a voluntary redundancy program in the UK first.
• Maruti Suzuki India Ltd raised prices by up to Rs. 10,000, ex-showroom Delhi, on select models, due to an increase in commodity prices and foreign exchange rates.
BFSI
• Rajesh Sud, shortlisted by the Yes Bank board to succeed Rana Kapoor as the lender’s next Chief Executive, has pulled out of the race for the top job, leaving insider Rajat Monga as the sole recommendation for the regulator to approve.
• The Reserve Bank of India deferred the implementation of the last tranche of the capital conservation buffer (CCB) by a year, a move that would leave an estimated Rs. 370 bn in the hands of banks. This would help banks increase lending by over Rs. 3.5 tn.
Metals
• The Commerce Ministry is in favour of raising import duty on aluminium to support domestic manufacturers and government is working on an integrated gold policy, which is expected to be released soon, to promote growth of the yellow metal industry and exports of jewellery.
Telecom
• India’s mobile phone companies must invest and innovate beyond traditional voice and data offerings, else they run the risk of being disrupted by aggressive rivals or app makers.
• The Telecom Regulatory Authority of India is looking at ways to lower the base price at which bids will be sought for airwaves in future auctions as it seeks to move away from its usual practice of mechanically hiking the starting price in every successive sale.
Pharma
• Torrent Pharmaceuticals Ltd received tentative approval from the US Food and Drug Administration to market pregabalin capsules, a generic version of Pfizer’s blockbuster drug Lyrica.
IT
• Information Technology Minister Ravi Shankar Prasad denied that a telecom spectrum was allotted on a first-come-first-served basis during his tenure as telecom minister. “As much as I remember, the day I took over, every spectrum was (allocated) on auction,” Prasad told reporters when asked about a report by Comptroller and Auditor General that mentioned the loss to the exchequer due to allotment of telecom spectrum in December 2015, without auction.
• Tata Consultancy Services Ltd posted a 2.6% sequential rise in Oct-Dec consolidated net profit at 81.1 bln rupees, short by a little over Rs. 1 bn. Sales for the company rose 1.8% sequentially in constant currency terms, led by growth in the banking.
Oil and gas
• Reliance Industries will shut down one of its crude distillation units and coker unit at the Jamnagar refinery for maintenance and inspection for four weeks starting 16th January. The company also stated that other crude distillations and secondary processing units are expected to operate normally.
NEWS
INTERNATIONAL NEWS
• Jerome Powell, Chair of the Board of Governors of the Federal Reserve System, said at The Economic Club of Washington that Fed doesn’t consider political factors in discussions or decisions, not bothered by criticism from President Trump. If economic data warrants it, Fed can move policy flexibly and quickly, Sees 2019 inflation around 2%.
• The initial weekly jobless claims decreased by 17,000 to 216,000 in the US. The advance seasonally adjusted insured unemployment rate was 1.2% for the week ending 29th December, unchanged from the previous week’s unrevised rate. The advance number for seasonally adjusted insured unemployment during the week ending 29th December was 1,722,000, a decrease of 28,000 from the previous week’s revised level.
• The UK PM’s spokesman, James Slack said that PM May is working to get further assurance from the EU on Brexit deal before the end of the debate in parliament.
• Iraq oil minister said the decline in oil has stopped, prices to improve gradually and have not reached any agreement so far with Iran to develop joint oil fields.
• The European Central Bank (ECB) Governing Council member and Governor of the Bank of France, Francois Villeroy de Galhau said that the monetary policy normalization was desirable while adding that it must be “gradual and pragmatic.” And there was no need to review the future operational framework of our monetary policy.
TREND SHEETSymbol CMP S2 S1 R1 R2 TREND
SENSEX 36009.84 35496 35753 36268 36526 Up
NIFTY 10794.95 10662 10729 10866 10937 Down
NIFTYBANK 27453.9 26864 27159 27752 28049 Up
AXISBANK 666.50 606 636 684 702 Up
YESBANK 184.25 174 179 192 200 Up
INFY 683.50 650 667 695 707 Up
TCS 1,842.55 1782 1812 1896 1950 Down
ICICIBANK 378.55 359 369 386 393 Up
INDUSINDBK 1,515.15 1443 1479 1581 1646 Down
RELIANCE 1,098.05 1072 1085 1115 1132 Down
SBIN 302.75 289 296 309 314 Up
HDFC 1,991.40 1923 1957 2017 2042 Up
MARUTI 7,320.50 7130 7225 7472 7624 Down
FORTHCOMING EVENTSCOMPANY NAME RESULT DATE
FUTURISTIC SOLUTIONS LTD. 14-JAN-19
INDIABULLS VENTURES LTD. 14-JAN-19
ICICI SECURITIES LTD. 14-JAN-19
JUMBO BAG LTD. 14-JAN-19
PRAKASH INDUSTRIES LTD. 14-JAN-19
TATA METALIKS LTD. 14-JAN-19
DEN NETWORKS LTD. 15-JAN-19
HINDUSTAN MEDIA VENTURES LTD. 15-JAN-19
INDIA GRID TRUST 15-JAN-19
KPIT TECHNOLOGIES LTD. 15-JAN-19
MULTI COMMODITY EXCHANGE OF INDIA LTD. 15-JAN-19
NETWORK18 MEDIA & INVESTMENTS LTD. 15-JAN-19
TRIDENT LTD. 15-JAN-19
TV18 BROADCAST LTD. 15-JAN-19
ZEE ENTERTAINMENT ENTERPRISES LTD. 15-JAN-19
5PAISA CAPITAL LTD. 16-JAN-19
KSTREET - 12TH JANUARY 2019 1

INDIAN INDICES (% CHANGE)
GLOBAL INDICES (% CHANGE)
NIFTY MIDCAP100TOP GAINERS & LOSERS (1W)
SECTORAL INDICES (% CHANGE)
FII/FPI & DII TRADING (IN RS. CRORES)
NSE NIFTY TOP GAINERS & LOSERS (1W)
EQUITY
Source: Bloomberg
-0.20
0.00
0.20
0.40
0.60
0.80
1.00
Nifty 50 SENSEX BSE MidCap
BSE SmallCap
Nifty Next 50
NIFTY Midcap
100 -1.5
-1
-0.5
0
0.5
1
1.5
2
2.5
NSEA
UTO
NSEBA
NK
NSESRV
NSEPH
RM
NSEIT
NSEM
ET
NSEN
RG
NSEC
ON
NSEREA
L
NSEFM
CG
0
1
2
3
4
5
6
7
8
9
NA
SDA
Q
DO
W JO
NES
S&P50
0
NIK
KEI
HA
NG
SENG
SHA
NG
HA
I CO
MP
FTSE 100
CA
C 40
-30
-25
-20
-15
-10
-5
0
5
10
15
20
VA
KRA
NG
EE LTD
MU
THO
OT FIN
AN
CE LTD
RELIAN
CE PO
WER LTD
GM
R INFRA
STRUC
TURE
LTD
AU
SMA
LL FINA
NC
E BAN
K
LTD
BAN
K O
F IND
IA
DILIP BU
ILDC
ON
LTD
PRESTIGE ESTA
TES PRO
JECTS
DEW
AN
HO
USIN
G
FINA
NC
E CO
RP
GRU
H FIN
AN
CE LTD
-8
-6
-4
-2
0
2
4
6
8
10
AX
IS BAN
K LTD
TATA
MO
TORS LTD
ITC LTD
BHA
RTI AIRTEL LTD
ICIC
I BAN
K LTD
HERO
MO
TOC
ORP LTD
ULTRA
TECH
CEM
ENT LTD
GA
IL IND
IA LTD
HIN
DU
STAN
PETROLEU
M
CO
RP
BHA
RAT PETRO
LEUM
C
ORP LTD
-1200
-1000
-800
-600
-400
-200
0
200
400
600
800
1000
04 -0
1-19
05-0
1-19
06-0
1-19
07-0
1-19
08-0
1-19
09-0
1-19
FII/FPI DII
KSTREET - 12TH JANUARY 2019 2

BEAT THE STREET - FUNDAMENTAL ANALYSIS
Menon Bearings Ltd. CMP Rs.86Target Price Rs.120Upside 40%
Investment Rationale
• Considering the order book position, customer demand & traction earnings are expected to grow at a CAGR of 16.5% during FY18-20E along with a healthy EBITDA margin of 27% with >25% RoE.
• Menon enjoys a marquee list of clientele like TATA, VOLVO, Mahindra & Piaggio and boasts about its manufacturing capabilities. Menon undertakes designing, testing, validation & manufacturing of bearings, bushes & thrust washers for a wide range of applications.
• Menon has recently invested towards the enhancement of aluminum division and the facility is expected to be ready by FY20E. With enhanced capacities, Menon is in a good place to de-risk its product mix. Considering the strong clientele & new contracts, we are of the positive view about Menon’s focus on increasing the aluminum segmental share from the current levels of ~30%. We also expect the segment to witness a faster growth ahead.
• Historically, Menon Bearings has been recording a healthy profitability & return ratios (>25% each); we expect the trend to continue in future as well.
VALUE PARAMETERSFace Value (Rs.) 1.0
52 Week High/Low (Rs.) 127/70
M.Cap (Rs. Bn/US $mn) 4.8/68
EPS (Rs.) 3.8
P/E Ratio (times) (FY20E) 17.2
Dividend Yield (%) 1.5
Stock Exchange BSE, NSE
P/E CHART
Valuation
At CMP of Rs. 86, Menon Bearings is trading at 17.2x to FY20E EPS. In view of the capacity enhancements, product mix de-risking and healthy profitability margins, we ascribe a multiple of 24.0x to FY20E EPS (5 year average of one year forward PE) with a “BUY” rating for a target price of Rs. 120 representing an upside of 40%. We believe that on account of high average return on capital at 33.6% over the last 3 years, the company has the potential to be re-rated. The threat of counterfeit products which mainly cater to aftermarket segment (10% of Menon revenues) along with a slowdown in industrial & automotive segments especially tractor & CV sales may pose risk to the call.
EQUITY
% OF SHARE HOLDING
in Rs.Mn ACTUAL ESTIMATE
YE Mar FY 18 FY 19 FY 20
REVENUE 1449 1609 1964
EBITDA 364 425 512
EBITDA(%) 25.1 26.4 26.1
PAT 211 246 280
EPS (Rs.) 3.8 4.4 5.0
RoE (%) 27.3 26.4 24.8
PE (x) 26.1 19.5 17.2
KSTREET - 12TH JANUARY 2019 3

BEAT THE STREET - FUNDAMENTAL ANALYSIS
Bajaj Electricals LtdCMP Rs.482Target Price Rs.670Upside 39%
Investment Rationale
• BJE is one of the oldest and largest distribution networks in the consumer appliances space. It is a leader in several kitchens and domestic appliances with a presence across all price points’ centers. It also has a presence in the hi-end range of appliances with brands like Platini and Morphy-Richards in India.
• Recently the company acquired Nirlep which brings additional kitchen appliances into the retail outlet and company is expecting it to grow at 30% CAGR for the next three-four years.
• Currently, EPC order book stands at Rs 73 bn which is 2.5x of FY19 EPC sales. The strong order book will bring growth in revenue and ensure stable profitability.
• EPC segment has shown excellent performance with a sales growth of 44.1% YoY on the back of timely execution of the projects. The revenue from UP project is expected from next year, set up cost will impact the EBIT margin.
• The RREP program aims to increase reach and range of its products with dealers. It helps to increase the breadth of its products and improvement in inventory management.
• The company boasts of one of the largest distribution networks in the consumer appliance space presence in tier I, II, III & IV cities and smaller towns, giving it much wonder and deep reach compared to peers.
VALUE PARAMETERSFace Value (Rs.) 2.0
52 Week High/Low (Rs.) 706/400
M.Cap (Rs. Bn/US $mn) 49.5/701
EPS (Rs.) 17.1
P/E Ratio (times) (FY20E) 18.7
Dividend Yield (%) 0.7%
Stock Exchange BSE
ValuationAt CMP 482, the stock is currently quoting at PE of 19x FY20E earnings. We reiterate our BUY rating on the stock with price target of Rs. 670 (PER of 25xFY20E).
EQUITY
P/E CHART
% OF SHARE HOLDING
in Rs.Mn ACTUAL ESTIMATE
YE Mar FY 18 FY 19 FY 20
Net Income 47164 56860 66270
EBITDA 2935 3696 4639
EBITDA Margin(%) 6.2 6.5 7.0
Net profit 1730 1995 2598
EPS(Rs) 17.1 19.7 25.7
RoE(%) 18.3 18.0 19.5
PE(x) 29.9 24.3 18.7
KSTREET - 12TH JANUARY 2019 4

EQUITY
BEAT THE STREET - TECHNICAL ANALYSIS
NIIT Technologies Limited
NIITTECH rallied from 457 levels in August 2017 to 1425.20 levels in September 2018 and corrected from there to 1030 levels, which is around 38.2% Fibonacci retracement
level of the said rally and bounced back, indicating the end of the correction. The stock has given a breakout from a falling trendline resistance drawn from 1410 levels,
indicating a fresh leg of the rally from these levels. Adding to it, the Parabolic SAR and Heiken candlesticks are signaling positive trend on the weekly charts reflecting the
stock is well placed to move higher in the coming days. 14 periods RSI is trading above the 9 period averages in the weekly chart, indicating positive momentum. The stock is
trading well above all of its major exponential moving averages on daily as well as weekly charts indicating strong positive momentum in the counter for all major time frames.
On Bollinger bands, daily chart stock has tested the mean and started to move towards upper bands, indicating positive momentum. At the current levels, the stock has given
an excellent opportunity for medium to long term investors to accumulate the stock on dips around 1140-1150 levels for the potential upside targets of 1438-1465 levels over
the next 6-9 months, keeping a stop loss below 940 levels.
Power Grid Corporation of India Limited
Power Grid witnessed a strong rally from 114.8 levels in September 2015 to its all-time high of 220.7 levels in August 2017 and from there retraced by nearly 50% of the said
rally and bounced back, indicating the end of correction in the stock. After the recovery, the stock again went into consolidation mode and has given fresh breakout with a
gap in the weekly chart (186.25-189.7), indicating that the stock is poised to take a fresh leg of the rally from these levels. On the weekly charts, the stock is trading above
all of its 21/50/100/200 period Exponential Moving Averages levels indicating the positive momentum in the counter for all major medium to long term time frames. Among
other leading indicators, parabolic SAR is trading below the current market price and suggests a positive trend in the counter on daily charts as well as weekly charts. Another
indicator, Heiken candlestick also indicates a bullish trend in the counter in daily as well as weekly charts. Among the momentum indicators, MACD is trading above the signal
line in daily charts indicating positive momentum in the stock on medium to long term perspective. The stock has crossed the mean in Bollinger bands (20,2) and moving
towards the upper band and the bands are expanding in weekly charts indicating very strong momentum in the counter.
Stock NIITTECH
CMP 1162.05
Action BUY
Entry 1140-1150
Average 1050
Stop loss 940
Target 1438
Target 2 1465
Time Frame 6-9 Months
Stock POWERGRID
CMP 194.35
Action BUY
Entry 194-195
Average 177
Stop loss 170
Target 227
Target 2 235
Time Frame 6-9 Months
KSTREET - 12TH JANUARY 2019 5

EQUITY
Sentiment
Stop Loss 1039
Target 892
Lot Size 500
Margin 86300
21-DEMA 996
Open Interest Shares 4235000
Change in OI -97500
Cost of Carry (%) 3.40
SECTORAL SNIPPETS
NIFTY IT (14,307.10) traded on a mixed note, settled with gains of nearly 1.17% on a weekly closing basis, exhibiting sideways bias in the index. On the stock front, few stocks managed to outperform the underlying index; INFY 3.47%, TECHM 2.46%, Mindtree 2.33%, WIPRO 1.48%, OFSS 1.02%, HCLTECH 0.7% & KPIT 0.1% while TCS -1.79%, INFIBEAM -3.65% & TATAELXSI -4.17% underperformed the index on a weekly closing basis. From last few trading sessions, USDINR is trading in the range of 69.50-70.50 which is putting mild pressure on IT counters. NIFTY IT index after placing a swing high near 14,593.85 witnessed a correction and continued to consolidate near its major 200-DEMA (14142). Technically, index is holding on brink of its major average, but below its 21 & 50-DEMA which is currently placed near 14,490 & 14,596 levels respectively. On the momentum setup, 14-period RSI found resistance near equilibrium levels and consolidating below it, indicating sideways bias in the index. On the downside, the index has immediate support near 14,000 levels followed by 13,800 levels, while on the higher side 14,500-14,600 will work as an immediate resistance followed by 15,000. Going forward, index on failing to protect 13,950 may correct further towards 13,600 levels, while sustaining above 14,100 index may continue to consolidate between 14,100-14,500 levels.
NIFTY BANK (27,453.90) outperformed Nifty with a gain of 0.95% during the week passed by while the broader index Nifty gained by 0.63%. During the week, the index took resistance at 27,754 levels after surpassing the previous swing high at 27,430 levels. However, on the last trading day of the week, the index took support at 27,217 levels indicating 27200 surround zone as a strong support to the index. Considering the technical setup on the daily charts, the index may trade with a positive bias in the short term ahead until unless 27200 levels are breached. On the stock front, AXISBANK, ICICIBANK and AXISBANK gained by 7.49% to 3.21% during the week. On the other side, YESBANK lost by 3.30% respectively with respect to the weekly closing basis. IndusInd Bank during the week reported a marginal rise in its December-quarter net profit due to higher provisions and contingencies. Net profit for the quarter rose 4.6% to Rs. 985.03 crore from Rs. 936.25 crore a year ago. Technically, Bank Nifty may face crucial resistance at 27,750 and 28,000 levels. For the week ahead, support for the index can be pegged at 27200 levels followed by 26,900 levels. On the momentum setup, 60-period weekly CCI is plotting above its +100 line indicating an underlying bullishness in the index on the index. However, we may expect a subdued movement in the index if it falls below the 27,200 levels.
NIFTY PHARMA (8,902.45) ended the week with a gain of around 1.2% outperforming the benchmark index Nifty which gained by around 0.52%. On the weekly chart, the NIFTY PHARMA index formed a higher high and a higher low for the second consecutive week which is an early indicator of the formation of a rising channel which indicates that the index may find buyers on any dips going forward. The index has closed above its 21 DEMA for the past four trading sessions which indicates that the selling pressure is gradually decreasing. The stocks which have outperformed the NIFTY PHARMA index during the week were AUROPHARMA, BIOCON, DIVISLAB and SUNPHARMA while PEL, GLENMARK, CIPLA, DRREDDY, CADILAHC, LUPIN underperformed the index. On the Momentum oscillator front, the 14-day RSI line is placed above the 9-day signal line on the daily chart and poised with bullish bias reflecting the index may trade with positive bias in the coming trading sessions. Going ahead, the index is expected to trade with sideways to positive bias. The support for the NIFTY PHARMA index is pegged around 8800-8820 levels followed by 8650-8670 levels. While on the higher side, the index may face resistance around its 50 DEMA near 9000-9020 zone followed by its swing resistance at 9100 levels.
NIFTY FMCG (30,759.05) closed in green with around 1.76%, outperforming the benchmark index Nifty which closed in green with a loss of around 0.52% on a weekly basis. Technically, the index is holding above 21/50/100/200 day EMA levels on the daily chart. 14 day RSI is trading at 61.11 above its 9 period averages at 56.72 suggesting positive momentum in the index. Other indicators Parabolic SAR and Heiken candlesticks suggest the positive trend in the index. On daily charts, the index has closed above the mean in Bollinger bands and started to move higher indicating positive momentum. Among the index stocks COLPAL, DABUR, EMAMILTD, GSKCONS, ITC, JUBLFOOD, PGHH, UBL & MARICO closed in green while BRITANNIA, GODREJCP, GODREJIND, HINDUNILVR, MCDOWELL-N & TATAGLOBAL closed in red. Going forward, the supports for the index are placed around 30,300 levels and below it at 29,980 zone, any breach below the level could aggravate selling pressure in the counter while resistance is placed around 30,850 levels and above that around 31,060 levels suggesting a possibility of huge supply at these levels.
BIOCON LIMITED: BUY BUY BIOCON (JAN FUTURE) | CMP: 644.30 SECTOR: PHARMA
BIOCON managed to close with gains of nearly 3.80%, whereas NIFTYPHARM closed with gains of 1.18% on a weekly closing basis exhibiting outperformance of the stock in comparison to the benchmark. Stock price after clocking an all-time high of 718 witnessed price correction, and eventually entered into a consolidation mode, finding support near its major 200-DEMA, which is currently placed near 564 levels. Technically, stock price after placing a swing low near 601 witnessed a recovery and attempted to give a breakout from a consolidation; as of now price is holding above its 21 & 50-DEMA, placed near 626 levels. On the momentum setup 14-period weekly RSI has witnessed positive crossover of its 9-pd signal line above 40-levels, and on daily time frame chart it is approaching overbought territory exhibits gaining strength in the counter and momentum may accelerate further in sessions to come. Prices managed to sustain above its middle the Bollinger Band (20,2) in the last couple of sessions. Hence we recommend Smart Trader to initiate a Long position on dips near 636 levels for the higher target of 685, keeping a stop loss below 604 levels.
Sentiment
Stop Loss 604
Target 685
Lot Size 900
Margin 101100
21-DEMA 626
Open Interest Shares 5285700
Change in OI -84600
Cost of Carry (%) 5.11
BHARAT FINANCIAL INCLUSION LIMITED: SELL BHARATFIN(JAN FUTURE) | CMP: 967.95 SECTOR: BFSI
BHARATFIN witnessed sell-off in last two sessions with a spurt in volume, after a brief consolidation. The stock price lost almost 2.59%, whereas benchmark Index NIFTYFINSE has gained nearly 0.94% on a weekly closing basis, exhibiting underlying weakness in the counter. After placing a swing low near 823 stock witnessed pullback towards its major average, but from last couple of weeks stock price failed to move and sustain above it, and currently, the stock price is consolidating below its major 200-DEMA, which is placed near 1039 levels. Currently, the stock is also holding below its short to medium-term averages. On the momentum setup, oscillator 14-period RSI after finding resistance near 60-levels drifted below equilibrium level and now dropping further lower. On Bollinger Band (20,2) stock price after a squeeze in earlier sessions gave a breakdown below lower band, reflects potential weakness in the counter. Hence we recommend Smart Traders to initiate Short position on the bounce towards 980 levels for the downside target of 892, placing stop loss above 1039 levels.
KSTREET - 12TH JANUARY 2019 6

WEEKLY VIEW OF THE MARKET
NIFTY (10,794.95): Nifty after making a swing low at 10,628 levels witnessed a bounce towards 10,870 levels and closed with a weekly gain of 0.63%.The index recouped some losses accumulated during the early week to close at 10,795 levels due to the positive sentiment in the global markets. However, the gains were capped due to cautiousness among market participants ahead of the key quarterly results season. In the current scenario, 10,935-10,985 zone may act as a hurdle zone which is in confluence with prior swing highs and 50% Fibonacci retracement for the down move of 11,760 levels to the major swing low of 10,030 levels. This indicates that the above resistance zone might act as strong resistance in the short run ahead. Nifty may indicate further strength once the resistance at 10,985 levels is confidently taken out from the downside. For the week ahead to watch, market participants may lay their focus on the CPI and WPI data releasing on 14th January which may decide the further direction in markets along with the corporate earnings release. On the derivatives front, Open interest data suggests that the index is likely to trade in the range of 10,500 to 11,000 levels during the week as the index witnessed highest OI addition at these levels while 10,700 and 10,900 levels may act as minor support and resistance, respectively.
DERIVATIVE STRATEGIES
DERIVATIVES
Type: Buy Call in AXISBANK
First leg Buy AXISBANK 31 Jan 680 CE @ 12.50
BEP 692.50
Max Profit Unlimited
Max Loss 15000
Stop Loss 8.00 (option levels)
Rationale The stock has given a breakout from the multi-month trading range during the first week of the month and it is one of the strongest stocks in banking space, which is also trading near lifetime highs. Hence, buying is recommended.
Type: Bear Put in TATASTEEL
First leg Buy one lot of TATASTEEL 31 JAN 470 PE @ 11.00
Second leg Sell one lot of TATASTEEL 31 JAN 450 PE @ 5.25
BEP 464.25
Max Profit 15119
Max Loss 6101
Rationale The stock has ended the week on a negative note and clocked fresh 52 wk lows. It is one of the weakest stocks in the metal space and resistance for now is placed at 490 levels and next major support is placed near 450 zones. Hence, bearish view for near term.
Type: Sell Put in NIFTY
First leg Sell one lot of NIFTY JAN 10600 PE @ 75
Max Profit 5625
BEP 10525
Max Loss Unlimited
Stop loss 120 (Option levels)
Rationale The index is stuck in a range of 10,600 to 10,950 over last few trading sessions and is sustained above its major moving averages, indicating an uptrend. The range trading indicates the possible pause in the ongoing uptrend. Going forward, the index is likely to move higher unless the support of 10,600 is not broken. Hence, one may build neutral to bullish.
Type: Buy Call in BANKNIFTY
First leg Buy one lot of BANKNIFTY 17 Jan 27500 CE @ 175
Max Profit Unlimited
BEP 27675
Max Loss 3500
Stop loss 140 (Option levels)
Rationale The banking index is outperforming Nifty 50 over last few trading sessions and now has approached key support zones of 27,400-27,500 after witnessing a decent profit booking from the highs of 27,800. The index is trading above its major very short-term moving averages. Hence, buying is recommended for the above mentioned strike.
7KSTREET - 12TH JANUARY 2019

DERIVATIVES
FII ACTIVITY IN INDEX FUTURES FII ACTIVITY IN STOCK FUTURES
TOP 6 LONG BUILD UP
Stock Name LTP % Price Change Open Int % OI Change
BERGEPAINT 325.2 0.65 5561600 117.93
TORNTPHARM 1885.7 3.77 672000 45.61
UBL 1377 0.43 2415000 30.98
SREINFRA 34.7 5.15 15444000 27.43
ARVIND 97.55 1.04 7450000 25.89
DISHTV 40 1.14 63824000 23.25
BANKNIFTY OPTION OI CONCENTRATION (WEEKLY) CHANGE IN BANKNIFTY OPTION OI (WEEKLY)
TOP 6 SHORT CLOSURE
Stock Name LTP % Price Change Open Int % OI Change
RAMCOCEM 628.35 0.20 584000 -17.79
CESC 682.05 3.90 1784200 -17.52
NTPC 148 1.54 37424000 -10.49
NESTLEIND 11273 3.89 258700 -10.24
AXISBANK 666.5 7.57 33752400 -8.63
REPCOHOME 434.25 10.06 1237500 -8.09
TOP 6 SHORT BUILD UP
Stock Name LTP % Price Change Open Int % OI Change
CEATLTD 1266.85 -3.26 1024400 52.99
ZEEL 451.05 -2.78 16179800 29.55
INDUSINDBK 1515.15 -2.13 8957700 28.95
INDIACEM 87.20 -5.88 21960000 28.90
CHENNPETRO 261.20 -9.40 1398600 26.75
VGUARD 206.65 -4.79 3612000 22.61
TOP 6 LONG CLOSURE
Stock Name LTP % Price Change Open Int % OI Change
APOLLOHOSP 1292.70 -0.02 670500 -21.02
GODREJIND 539.95 -0.14 1492500 -17.22
IGL 270.75 -2.63 4361500 -12.38
COALINDIA 232.25 -1.80 27748600 -9.06
NHPC 25.50 -0.20 19872000 -8.11
POWERGRID 194.35 -0.79 24460000 -7.88
NIFTY OPTION OI CONCENTRATION CHANGE IN NIFTY OPTION OI
8KSTREET - 12TH JANUARY 2019

COMMODITIES
BULLIONGold prices on COMEX are heading for fourth consecutive weeks gain on continued buying support from investors. Dollar weakened against major currencies for the fourth week in a row on the expectation. The US central bank will keep interest rates steady. US Federal Reserve Chairman Jerome Powell said that the central bank had the ability to be patient on monetary policy given stable price measures and he downplayed predictions from policymakers suggesting interest rates would be raised twice more this year. During the week ended on 11th January 2019, COMEX gold futures for February expiry traded in the range of $1280.30 - $1298.00 per troy ounce while MCX gold futures for February delivery traded in the range of Rs. 31,448 - Rs. 32,133 per 10 grams. Weekly unemployment claims came at 216,000 against the previous reading of 233,000.
ENERGY COMPLEXWTI crude oil prices gained around 9.7% in a week by the end of the morning session on Friday, whereas prices at MCX futures platform traded above Rs.3700/bbl. The prices went positive during the week as global markets grow increasingly confident amid hopes the US and China may soon end trade disputes that have undermined global economic growth. The US Commerce Secretary Wilbur Ross said that Beijing and Washington could reach a trade deal that “we can live with” as dozens of officials from the world’s two largest economies held talks in a bid to end their trade dispute that has roiled global markets since last year. Separately, EIA’s bearish report which showed the US crude oil stockpiles falling less than expected levels kept the check over prices. As per EIA, Crude inventories fell by 1.7 million barrels in the week to 4th January, compared with markets’ expectations for a decrease of 2.8 million barrels. On the demand side fundamentals, China January crude imports are on track to remain above the 10 million bpd mark for a third straight month, with 41.34 million mt (9.77 million bpd) assessed so far, which comprise of 37.9 million mt of seaborne arrivals and 3.44 million mt of pipeline imports from Russia, Kazakhstan and Mongolia. On the supply side, fuel oil exports from the Middle-East dropped to 606,400 mt last week, after sustaining above the 700,000 mt mark for three prior consecutive weeks. The weekly exports for the first week of the year are well below the 2018 weekly average of 960,260 mt. In the coming week, the market is going to remain on the higher end, whereas the dollar fluctuation will affect the course of direction for the prices.
BASE METALSBase metals started on a relatively positive note after the Chinese government took measures to boost financial lending to industrial growth. However, the optimism was capped by the expectations of outcome from the US-China trade talks held in Beijing. In Tuesday’s session, prices eased, well ahead of the start of trade talks and recovered in Thursday’s session given the optimistic conclusion between the US-China. Trump’s decision to extend the period till 2nd March for the increase in tariffs to 25% from 10% on $200 billion worth goods gave relief to the markets and trade with optimism. But the negative trend remained intact towards the end of the week. During October 2018, total Aluminium exported to India came to 25,800 metric tons, an increase of 174%, or 16,390 metric tons, in the year. October’s total Aluminium imports bested September’s total of 24,600 metric tons by 5%. As per the US Geological Survey (USGS) numbers, unfinished Aluminium and Aluminium alloys imported from India for the year through October totaled 168 thousand metric tons, up from 2017’s ten-month total of 65.2 thousand metric tons. Introduction of 5% import duty on Copper concentrates by African government on Zambia’s Konkola Copper Mines, made its smelter operations downsized from 4th January. Low availability of copper concentrates and low availability of acid as a result of rationalized operations at its Nchanga smelter made the operations to suspend. China’s copper premiums were at $70.50 a ton, up $8 from an 18-month low of $62.50 in early December, indicating stronger immediate demand for physical copper. On the domestic front, Indian Supreme Court on Tuesday cleared the way for Vedanta to reopen its south Indian copper smelter by refusing to stay an order from the country’s environmental court. Copper concentrate exports from Indonesia’s Grasberg mine, the world’s second-largest copper mine, are forecast to plunge this year because of a lag in output as operations move from open pit to underground mining. In 2019, copper concentrate exports are expected to drop to 200,000 tons from about 1.2 million tons in 2018 and production of concentrates shall be around 1.2 million tons of copper concentrate this year, compared to 2.1 million tons in 2018, while domestic consumption will grow to 1 million tons compared to 800,000 tons in 2018.
COTTONCotton futures witnessed huge volatility during the week ending on 11th January due to looming uncertainty over the trade negotiations between the US and China. Prices rose during the beginning of the week in the optimism of renewed buying of the US cotton from China. Moreover, weakness in US dollar index against the basket of currency also bolstered ICE cotton futures prices. After touching the 13 months low of 70.65 cent/lb during last week, ICE cotton futures tried to recover in anticipation of improved import from China and rose up to 73.92 cent/lb in the current week. However, prices could not sustain the gains and started cooling down due to the absence of any sign of fresh export inquiry from China followed by trade talk between the US and China. Moreover, the absence of fresh fundamental figures in the US also prompted speculators to book profit at higher levels. Most of the fundamental reports released by USDA are pending or canceled due to shut down in the US. Similarly, domestic cotton futures traded in a wider range witnessed huge volatility due to changing short-term fundamentals. Improved arrivals at physical market and tepid export demand at prevailing levels weighed on the prices. The increased export disparity of Indian fiber due to the sharp fall in prices amid strengthening of Indian currency triggered selling activities at futures platform. In the meanwhile, Cotton Association of India has reduced the production estimates further due to the limited scope of 3rd and 4th picking of cotton in central and southern regions as farmers have uprooted their cotton plants in about 70-80% cotton area due to moisture deficiency owing to fewer rains. The
CAI has estimated cotton crop for the 2018-19 season at 335 lakh bales of 170 kgs each which are lower by 5.25 lakh bales than its previous estimate of 340.25 lakh bales made during last month.
OILS & OILSEEDSSoybean futures rallied more than 7% in the last five sessions tracking firm cues from the global market. CBOT soybean prices ruled higher for the most part of the week in the optimism of renewed buying of the US soybean from China. Moreover, adverse weather condition Brazil resulting in lower yield prospects for soybean crops in Brazil also added positivity to prices. However, CBOT soybean futures witnessed good profit-booking by the end of the week snapping cumulative gains of prior five sessions due to the absence of any sign of buying from China. Similarly, Domestic soybean futures breached the Rs.3600 levels on reduced supply amid reports of increased meal export from India. Solvent Extractor Association of India (SEA) released its meal export data for December showed soy meal export from India was reported at 240530 MT during December against the 168,865 MT of the prior year for the corresponding month, higher by 42% YoY and 29% MoM. Vietnam was the major buyer of Indian soy meal bought about 45909 MT of Indian meal, wherein, Thailand imported about 20025 of soy meal during December. Average FOB prices of soy meal during Dec was reported at 375 US$ per MT. Similarly, mustard seeds futures at NCDEX platform traded on a weaker note due to higher production outlook for the upcoming season. Moreover, increased sell-off mustard seeds stocks by NAFED in Rajasthan, Haryana and Madhya Pradesh also added negativity to prices. The area under mustard seed cultivation has touched 66.43 lakh hectares as against 64.99 lakh hec till 4th Jan, higher by 2.21% YoY. Malaysian palm oil futures dropped remarkably by the end of the week by wiping out the gains of prior two sessions on bearish official data on December inventories, production and exports. Malaysian Palm Oil Board (MPOB showed end-stocks rising 6.9% from the previous month to 3.21 million tons. Inventory levels are at their highest in at least 19 years, according to Reuters.
GUAR SEEDGuar seed and gum futures traded sideways to downward during the week due selling pressure in the market tracking negative fundamental outlook such as low gum demand outlook in market due to weakness in the Indian rupee against the US dollar which put pressure on gum prices in the futures market. Spot markets also witnessed low demand amid adequate supply in major trading center put pressure on prices. However, Prices may take some recovery due to the anticipation of bargain buying at lower levels the week. Low production in the year 2018-19, while shrinking in the arrivals in major physical center in Rajasthan is likely supportive of prices. India exported around 32758 MT in November 2018 which is lower by 13.9% from the previous month but higher by 11% of the prior year same month. Hence, subdued buying by stockiest and millers and weaker export outlook could weigh on prices. For the week Rs. 4091 and Rs. 4214 are the strong support and resistance level for the guar seed while in guar gum Rs. 7200 is strong support level for the week.
SPICESCardamom futures broke out from their broader trading range of 1450-1560 during the week as the prices gained over 4% and hitting almost two year high of Rs.1610 per kg. Emerging export inquiries from Afghanistan and Bangladesh and lower stock inventory at North Indian markets supported gains. At the spot markets, arrivals were good compared to last week and were at 418 MTs until Friday, while the prices noted weekly gains of Rs. 52-80 per kg due to improvement in buying activities ahead of Sankranthi and Pongal festival. Arrivals were mainly from stockiest and big farmers, indicating fewer stocks in the market due to lower crop size. Turmeric futures traded in a narrow range with slight negativity, however, struggled for the proper direction due to lack of a trend. As the cold conditions are slowly receding, arrivals at the spot market were of slightly better moisture levels; arrivals of new crop gradually increased during the week as harvesting activities are progressing at a rapid pace. Buying activities of the crop increased due to the festival. Overall crop is estimated to be lower than earlier projections of the very large crop after the yield concerns in growing states due to extreme drought. Jeera futures traded mostly negative resuming negative trend during the week. However, it noted some recovery later part of the week. Improvement in sowing activities was seen in December. However, it has reached its final stages and as per latest data, sowing in Gujarat is completed in 345443 hec of land that was 382599 hec last year during the corresponding period. Area is lower by 10% YoY, while it is 108% of the normal area of 318926 hec. However, concerns are raised on the growth of crop due to not so favorable weather conditions. Current stocks available at the production center are lower and have to meet the demand until new crop arrival in February. Dhaniya futures traded mostly in a negative note during the week with slight recovery shown during the midweek. Lack of active buying at the spot market amid sufficient availability of stocks weighed down the prices. However, major fall was capped on expectations of the lower area under dhaniya during the upcoming sowing season to support prices as this will decline crop size. Progress is very slow in the major growing states; as per latest data, sowing in Gujarat is completed in only 29630 hec of land which was 69863 hec last year during the corresponding period; area is lower by 58% YoY while it is covered just 32% of the normal area. Further, extreme cold conditions have reported to damage crop in Rajasthan.
9KSTREET - 12TH JANUARY 2019

COPPER
COMMODITIES
TREND SHEET
Commodities 4-Jan 11-Jan % Change 52 Week High% Change from 52
Week High52 Week Low
% Change from 52 Week Low
MCX Gold (Rs/10 gms) 31456.00 31926.00 1.5% 32311.00 -1.19% 29268.00 9.08%
MCX Silver (Rs/Kg) 39173.00 39335.00 0.4% 41698.00 -5.67% 34981.00 12.45%
MCX Crude Oil (Rs/bbl) 3348.00 3642.00 8.8% 5669.00 -35.76% 2993.00 21.68%
MCX Natural Gas (Rs/mmBtu) 210.10 216.80 3.2% 358.70 -39.56% 162.50 33.42%
MCX Copper (Rs/kg) 409.60 415.75 1.5% 493.25 -15.71% 397.40 4.62%
MCX Lead (Rs/kg) 136.60 140.05 2.5% 172.50 -18.81% 133.15 5.18%
MCX Zinc (Rs/kg) 171.55 176.15 2.7% 232.70 -24.30% 163.80 7.54%
MCX Nickel (Rs/kg) 773.10 805.30 4.2% 1095.20 -26.47% 735.00 9.56%
MCX Aluminium (Rs/kg) 130.15 128.75 -1.1% 178.85 -28.01% 124.75 3.21%
NCDEX Soybean (Rs/Quintal) 3442.00 3580.00 4.0% 3895.00 -8.09% 3149.00 13.69%
NCDEX Refined Soy Oil (Rs/10 kg) 743.80 764.00 2.7% 796.35 -4.06% 713.60 7.06%
NCDEX RM Seed (Rs/Quintal) 3935.00 3890.00 -1.1% 4262.00 -8.73% 3727.00 4.37%
MCX CPO (Rs/10 kg) 532.60 545.20 2.4% 673.00 -18.99% 483.40 12.78%
NCDEX Castor Seed (Rs/Quintal) 5272.00 5176.00 -1.8% 6300.00 -17.84% 3831.00 35.11%
NCDEX Turmeric (Rs/Quintal) 6614.00 6606.00 -0.1% 7722.00 -14.45% 5978.00 10.51%
NCDEX Jeera (Rs/Quintal) 17580.00 17400.00 -1.0% 21700.00 -19.82% 14010.00 24.20%
NCDEX Dhaniya (Rs/Quintal) 6341.00 6010.00 -5.2% 6892.00 -12.80% 4186.00 43.57%
MCX Cardamom (Rs/kg) 1506.10 1570.00 4.2% 1575.00 -0.32% 818.50 91.81%
NCDEX Wheat (Rs/Quintal) 2077.00 1990.00 -4.2% 2162.00 -7.96% 1614.00 23.30%
NCDEX Guar Seed (Rs/Quintal) 4337.50 4152.00 -4.3% 4869.50 -14.73% 3494.50 18.82%
NCDEX Guar Gum (Rs/Quintal) 8579.00 8180.00 -4.7% 10510.00 -22.17% 7200.00 13.61%
MCX Cotton (Rs/Bale) 21070.00 20670.00 -1.9% 24280.00 -14.87% 19400.00 6.55%
NCDEX Cocud (Rs/Quintal) 1958.00 1892.00 -3.4% 2043.00 -7.39% 1166.00 62.26%
NCDEX Kapas (Rs/20 kg) 868.00 868.00 0.0% 938.50 -7.51% 854.00 1.64%
MCX Mentha Oil (Rs/kg) 1599.00 1609.00 0.6% 1846.10 -12.84% 1106.00 45.48%
TECHNICAL RECOMMENDATIONS
CMP Weekly EMA RSI Direction
LME $5960 8 626039 Down (Sell)
MCX Rs 416 13 6160
SILVER
NICKEL
Exchange Entry Target SL
LME $6060-6070 $5800 $6180
MCX Rs 420-422 Rs 404 Rs 432
CMP Weekly EMA RSI Direction
COMEX $15.73/Ounce 8 $15.1839 Sideways (Sell)
MCX Rs 39500/Kg 13 $15.00
Exchange Entry Target SL
COMEX $15.80-15.82 $15.40 $16.00
MCX Rs 39700-39750 Rs 38500 Rs 40200
CMP Weekly EMA RSI Direction
LME $11460/Mt 8 $1145049 Up (Buy)
MCX Rs 806/Kg 13 $11150
Exchange Entry Target SL
LME $11300 $11900 $11000
MCX Rs 800-795 Rs 840 Rs 770
10KSTREET - 12TH JANUARY 2019

COMMODITIES
NEWS DIGEST
• Brazil soybean production in 2018-19 will fall to 115.72 million mt, from 120.8 million mt last season, analyst Safras & Mercado forecast Friday. In its last forecast for the 2018-19 crop, Safras had called for a record 122.22 million mt. The 5.3% revision lower was due to unfavorable drought in some producing states, Safras said. “Weather issues seen starting in December brought relevant losses to yields in states like Parana and Mato Grosso do Sul. Fields that suffered the most were the ones planted earlier, which were at a relevant development stage [when hit by the dryness],” it said.
• Plantation crops such as rubber, coffee and pepper are facing a bleak prospect in 2019 even as India looks to extend its dominance in spices like chilli, cumin (jeera) and turmeric during the year. Rubber production in 2018-19 is likely to fall below the revised target of 6 lakh tons set by the Rubber Board as there has been a drop in latex yield even before the lean season in summer. This is attributed to heavy rainfall during monsoon months.
• Following economic sanctions by the US, Iran has turned to India for its soymeal imports. Per the latest data, exports to Iran registered a phenomenal growth from about 23,000 tons last year to about 3 lakh tons between April and December 2018. “The Iranian market has opened up for Indian soybean meal. From April to December 2018, about 3 lakh tons of soybean meal shipped against last year’s 23,000 tons. The favorable factor is rupee transactions for trade with Iran,” said B V Mehta, executive director, Solvent Extractors’ Association of India (SEA).
• A shortfall in the planting of wheat, pulses and coarse cereals pulled down cumulative rabi planting by almost 29 lakh hectares (lh) this week, as compared to the corresponding period last year, per the sowing data released by the Agriculture Ministry on Friday. The total planted area till the end of the week remained at 581.5 lh, 4.75% lower than the 610.5 lh in the same period during the previous rabi season.
WEEKLY COMMENTARY
• EIA reported a storage draw of 91 Bcf for the week ending 4th January. This compares to the -85 Bcf we projected and consensus average of -69 Bcf. The -91 Bcf was considerably smaller than the five-year average of -182 Bcf and last year’s -359 Bcf. For the week ending 1/11, we currently have a forecast of -100 Bcf. We have April 2019 storage at 1.4 Tcf, down from 1.45 Tcf last week. January storage draws will be disappointing, but the market has already priced it in. The bulls need a bullish shift in the weather models.
• Oil prices fell more than 1% on Friday but were on track for weekly gains after financial markets strengthened on hopes the US and China may soon resolve their trade dispute. Crude futures began falling shortly after US crude hit a five-week high above $53 a barrel and moved above its 50-day moving average for the first time since mid-October. “The move above $53 engendered some profit-taking, as it should,” said John Kilduff, founding partner at energy hedge fund Again Capital.
• The US Department of Agriculture will delay the release of key crop reports because of the partial government shutdown, leaving investors and farmers without vital information during an already tumultuous time for agricultural markets. USDA had planned to release reports Friday to detail the size of the 2018 harvests of corn, soybean, wheat and other crops and give an early estimate for what farmers will plant in the upcoming season. A more immediate concern for area farmers may be the shutdown of the USDA Farm Service Agency offices and the services offered there.
• The Indian rupee Friday weakened by 8 paise to close at 70.49 against the US dollarNSE 1.54 % on rise in demand for the American currency from exporters coupled with an unabated rise in global crude oil prices. Besides, foreign fund outflows and a stronger dollar against its key rival currencies impacted the rupee trading pattern. At the Interbank Foreign Exchange, the rupee opened strong at 70.38 a dollar against the previous close of 70.41. The local unit moved in a range of 70.34 to 70.59, before finally ending at 70.49, showing a loss of 8 paise.
• Gold prices gained for the fourth straight session on Thursday when it crossed the Rs. 33,000 mark. Gold rates rose Rs. 270 to Rs. 33,070 per 10 gram amid increased demand from local jewelers, according to All India Sarafa Association. Tracking gold, silver rates surged Rs. 410 to Rs. 40,510 per kg on fresh buying by industrial units and coin makers. Steady global rates also supported domestic gold prices. Gold prices had risen nearly Rs 300 over the past three days.
MCX CRUDE MCX NATURAL GAS
MCX CRUDE- PRICE, VOLUME & OPEN INTEREST MCX NATURAL GAS – PRICE, VOLUME & OPEN INTEREST
0.28
0.29
0.3
0.31
0.32
0.33
0.34
31-Dec 2-Jan 4-Jan 6-Jan 8-Jan 10-Jan
$/B
BL
-0.18
-0.16
-0.14
-0.12
-0.1
-0.08
-0.06
-0.04
-0.02
0 28-Dec
29-Dec
30-D
ec
31-Dec
1-Jan
2-Jan
3-Jan
4-Jan
5-Jan
6-Jan
7-Jan
8-Jan
9-Jan
10-Jan
11-Jan
$/M
MB
tu
250
300
350
400
450
500
0
10000
20000
30000
40000
50000
60000
70000
26-Dec 28-Dec 1-Jan 3-Jan 7-Jan 9-Jan
Open Interest Volume Price (INR/MMBTU)
3500
3550
3600
3650
3700
3750
0
50000
100000
150000
200000
250000
300000
350000
26-Dec
27-Dec
28-Dec
31-Dec
1-Jan
2-Jan
3-Jan
4-Jan
7-Jan
8-Jan
9-Jan
10-Jan
Volume Open Interest Price (INR/Bbl)
11KSTREET - 12TH JANUARY 2019

COMMODITIES
PRICES OF METALS IN LME/ COMEX/ NYMEX (IN US $)
Commodity Exchange Contract 04-Jan 11-Jan % change
Aluminium LME 3M 1868.00 1852.00 -0.86%
Copper LME 3M 5936.00 5916.50 -0.33%
Lead LME 3M 1956.00 1976.50 1.05%
Nickel LME 3M 11125.00 11230.00 0.94%
Zinc LME 3M 2448.00 2454.50 0.27%
Gold CME FEB 1286.20 1287.10 0.07%
Silver CME MAR 15.76 15.61 -0.95%
WTI Crude oil CME FEB 48.31 52.32 8.30%
Natural Gas CME FEB 3.03 2.97 -2.18%
INTERNATIONAL COMMODITY PRICES
Commodity Exchange Contract 04-Jan 11-Jan % change
Soybean CBOT JAN 935.25 920.25 -1.60%
Soy oil CBOT JAN 28.35 27.88 -1.66%
CPO BMD MAR 2171.00 2173.00 0.09%
Cotton ICE MAR 72.46 72.82 0.50%
SPOT PRICES (% CHANGE)
LME WAREHOUSE STOCKS (IN TONS)
Commodity Previous week This week Change % Change
Copper 132400 133700 1300 0.98%
Zinc 128450 126800 -1650 -1.28%
Aluminium 1278500 1284725 6225 0.49%
Lead 107300 104525 -2775 -2.59%
Nickel 205752 201096 -4656 -2.26%
SHANGHAI WAREHOUSE STOCKS (IN TONS)*
Commodity Previous week This week Change % Change
Copper 118686 108890 -9796 -8.25%
Zinc 20103 27898 7795 38.78%
Aluminium 672185 672326 141 0.02%
*Until Wednesday
WEEKLY STOCK POSITION IN LME (IN TONS)
Progress of area coverage under Rabi crops as on 11.01.2019
COMEX WAREHOUSE STOCKS (IN TONS)
Commodity Previous week This week Change % Change
Copper 109145 104493 -4652 -4.26%
-5.85%
-5.37%
-4.35%
-3.95%
-3.63%
-2.09%
-1.85%
-1.82%
-1.58%
-1.51%
-1.04%
-0.15%
0.42%
0.88%
1.50%
1.54%
2.46%
2.53%
2.66%
2.74%
3.28%
3.72%
4.17%
4.33%
8.48%
-8.00% -6.00% -4.00% -2.00% 0.00% 2.00% 4.00% 6.00% 8.00% 10.00%
Dhaniya
Guar Gum
Guar Seed
Wheat
Cotton Seed Oil Cake
Barley
Cotton
Castor Seed
RM Seed
Jeera
Aluminum
Turmeric
Silver
Mentha Oil
Gold
Copper
CPO
Lead
Soy Oil
Zinc
Natural Gas
Soybean
Nickel
Cardamom
Crude Oil
CropArea Sown Covered Difference
over 2018-19 over 2017-18
Yr-on-yr Change
Normal Rabi Area2017-18 Contract
Wheat 294.07 300.51 -6.44 -2.14% 306.29
Rice 16.57 20.88 -4.31 -20.64% 41.59
Pulses 147.91 156.9 -8.99 -5.73% 140.84
Gram 94.61 105.28 -10.67 -10.13% 89.45
Lentil 16.77 17.1 -0.33 -1.93% 13.94
Fieldpea 10.29 9.26 1.03 11.12% 9.33
Kulthi 5.27 4.21 1.06 25.18% 2.09
Urdbean 6.74 7.49 -0.75 -10.01% 8.13
Moongbean 4.86 4.88 -0.02 -0.41% 9.62
Lathyrus 3.58 3.22 0.36 11.18% 4.58
Other Pulses 5.8 5.46 0.34 6.23% 3.69
Coarse Cereals 44.98 53.47 -8.49 -15.88% 64.53
Jowar 23.54 30.08 -6.54 -21.74% 37.4
Bajra 0.11 0.2 -0.09 -45.00% 3.66
Ragi 0.58 0.65 -0.07 -10.77% 0.32
Maize 13.61 15.13 -1.52 -10.05% 16.51
Barley 7.13 7.4 -0.27 -3.65% 6.64
Oilseeds 77.97 78.75 -0.78 -0.99% 80.6
Rapeseed & Mustard 68.28 66.6 1.68 2.52% 61.25
Groundnut 4.07 5.05 -0.98 -19.41% 7.85
Safflower 0.4 0.78 -0.38 -48.72% 1.62
Sunflower 1.04 1.59 -0.55 -34.59% 3.78
Sesamum 0.54 0.44 0.1 22.73% 3.04
Linseed 3.36 3.95 -0.59 -14.94% 2.93
Other Oilseeds 0.28 0.34 -0.06 -17.65% 0.15
Total Crops 581.5 610.5 -29 -4.75% 633.85
Source: Ministry of Agriculture.
12KSTREET - 12TH JANUARY 2019

USD/INR
USDINR is currency trading at 70.49. During the week, it made a high of 70.64 and low of 69.23. The RSI is at 50.56. The moving average of 13 is at 70.83 and 55 is at 61.11. The trend is looking positive for the week. Hence, recommend buying at 70.40-70.30 for a target price of 71.50 with stop loss 70.10.
EUR/INR
EURINR is currency trading at 81.29. During the week, it made a high of 81.61 and low of 79.10. The RSI is trading at 50.47. The moving average of 13 is at 81.29 and 55 is at 80.20. The trend is looking positive for the week. Hence, recommend buying at 80.40-80.30 for a target price of 82.30 with stop loss 79.90.
GBP/INR
GBPINR is currency trading at 90.42. During the week, it made a high of 90.50 and low of 88.25. The RSI is trading at 47.05. The moving average of 13 is at 90.72 and 32 is at 90.47. The trend is looking positive for the week. Hence, recommend buying at 89.40-89.30 for a target price of 92.00 with stop loss 88.90.
JPY/INR
JPYINR is currency trading at 65.07. During the week, it made a high of 65.44 and low of 64.00. The RSI is at 60.49. The moving average of 13 is at 63.73 and 32 is at 62.23. The trend is looking bullish for the week. Hence, recommend buying at 64.50-64.40 for a target price of 66.00 with stop loss of 64.00.
TECHNICAL RECOMMENDATIONMARKET STANCE
As anticipated by the majority of the market participants Fed turned data dependent over its balance sheet tightening program in 2019. This has been evident by the comments from Fed members during the week. Minutes of Federal Reserve December meeting pointed that almost all of the council members hinted for a prolong rate hike pause by Federal Reserve. Fed chair Jerome Powell said that the “Fed can be patient given inflation data” He also mentioned that the Fed has no particular plan to raise rates a specific number of times. Adding to this positive air from US-Sino trade war negotiations also built pressure on Dollar Index which remained weaker throughout the week, to recover during the final trading sessions of the week. The European Central Bank December meeting minutes noted that the Governing Council’s decision to wind up its lavish asset purchase program was unanimous. But a new policy named targeted longer-term refinancing operation (TLTRO) was brought forward by some governing council members (which would provide banks with new multi-year loans). If implemented, this would introduce additional monetary stimulus and help banks meet their multi-year funding requirements. This move would again mitigate the benefits of winding up asset purchase program for Euro. In UK Prime Minister Theresa May continued to suffer setbacks in parliament on amendments to her Brexit deal. Certainly, May do not have any plan- B if her initial deal fails to get approval. The uncertainty over Brexit deal is not giving any legs to pound rally despite a weaker Dollar. Most of the emerging market currencies added marginal gains during the week followed by weaker Dollar, but Rupee remained an outlier from the pack tracking strong crude oil prices.
NEWS FLOWS OF LAST WEEK
• Fed vice chair Richard Clarida said any headwinds to the US economy should be offset by policy. It will not hesitate to make adjustments to asset-offloading strategy.
• Fed policymakers, according to the minutes of December meeting, indicate they may be open to tweaking a longstanding plan to shrink the central bank’s balance sheet, including by shedding housing-backed bonds earlier than anticipated or keeping a bigger-than-expected portfolio of assets.
• The US dollar’s rally is halted as according to a poll by Reuters the fall in expectations of a rate hike has diminished the greenback’s edge over its peers.
• UK PM Theresa May said to be weighing whether to accept a plan drafted by pro-EU politicians who want to make it harder to leave the bloc with no divorce agreement in place.
• The UK parliament returns from Christmas holidays and PM Theresa May might again push back a final vote on her Brexit deal, less than three months before the UK is due to exit the EU.
CURRENCY
CURRENCY TABLE
Currency Pair Open High Low Close
USDINR 69.42 70.64 69.23 70.48
EURINR 79.29 81.61 79.10 81.23
GBPINR 88.48 90.50 88.25 90.17
JPYINR 64.02 65.44 64.00 65.07
DXY 97.43 97.46 96.17 96.95
13KSTREET - 12TH JANUARY 2019

ECONOMIC GAUGE FOR THE NEXT WEEK
Local Start Date Local Time Country Indicator Name Period Reuters Poll Prior Unit
14 Jan 2019 12:00 India WPI Inflation YY Dec 4.42% 4.64% Percent
14 Jan 2019 12:00 India WPI Food Index Dec -1.96% Percent
14 Jan 2019 12:00 India WPI Food Articles YY Dec -3.31% Percent
14 Jan 2019 12:00 India WPI Fuel YY Dec 16.28% Percent
14 Jan 2019 12:00 India WPI Mfg Inflation Dec 4.21% Percent
14 Jan 2019 15:30 Euro Zone Industrial Production MM Nov -1.3% 0.2% Percent
14 Jan 2019 15:30 Euro Zone Industrial Production YY Nov -2.1% 1.2% Percent
14 Jan 2019 17:30 India CPI Inflation YY Dec 2.20% 2.33% Percent
14 Jan 2019 18:30 United States Build Permits R Numb Nov 1.328M Number of
14 Jan 2019 18:30 United States Build Permits R Chg MM Nov 5.0% Percent
14 Jan 2019 19:00 United States Adv Goods Trade Balance Nov -76.98B USD
14 Jan 2019 19:00 United States Wholesale Inventories Adv Nov 0.8% Percent
14 Jan 2019 19:00 United States Retail Inventories Ex-Auto Adv Nov 0.7% Percent
14 Jan 2019 20:30 United States Construction Spending MM Nov 0.2% -0.1% Percent
14 Jan 2019 20:30 United States Durables Ex-Def, R MM Nov -0.1% Percent
14 Jan 2019 20:30 United States Durable Goods, R MM Nov 0.8% Percent
14 Jan 2019 20:30 United States Factory Orders MM Nov 0.2% -2.1% Percent
14 Jan 2019 20:30 United States Durables Ex-Transpt R MM Nov -0.3% Percent
14 Jan 2019 20:30 United States Nondef Cap Ex-Air R MM Nov -0.6% Percent
14 Jan 2019 20:30 United States Factory Ex-Transp MM Nov 0.3% Percent
14 Jan 2019 20:30 United States New Home Sales-Units Nov 0.560M 0.544M Number of
14 Jan 2019 20:30 United States New Home Sales Chg MM Nov 2.9% -8.9% Percent
14 Jan 2019 20:30 United States Wholesale Invt(y), R MM Nov 0.5% Percent
14 Jan 2019 20:30 United States Wholesale Sales MM Nov -0.1% -0.2% Percent
14 Jan 2019 21:30 United States Export Wheat Inspected 10 Jan, w/e 260.134k Ton
14 Jan 2019 21:30 United States Export Corn Inspected 10 Jan, w/e 501.541k Ton
14 Jan 2019 21:30 United States Exp Soybean Inspected 10 Jan, w/e 673.172k Ton
14 Jan 2019 22:30 United States Qtrly Grain Stocks-Wheat Dec 1.960B 2.379B Bushel (56lb)
14 Jan 2019 22:30 United States Qtrly Grain Stocks-Corn Dec 12.097B 2.140B Bushel (56lb)
14 Jan 2019 22:30 United States Qtrly Grain Stocks-Soy Dec 3.725B 0.438B Bushel (56lb)
14 Jan 2019 22:30 United States Fla Orange Output 18/19 Jan 77M Number of
14 Jan 2019 22:30 United States WSD-Wheat Output 18/19 Jan 1.884B Bushel (56lb)
14 Jan 2019 22:30 United States WSD-Wheat Endstocks18/19 Jan 0.987B 0.974B Bushel (56lb)
14 Jan 2019 22:30 United States WSD-Corn Output 18/19 Jan 14.626B Bushel (56lb)
14 Jan 2019 22:30 United States WSD-Corn Endstocks 18/19 Jan 1.694B 1.781B Bushel (56lb)
14 Jan 2019 22:30 United States WSD-Soybean Output 18/19 Jan 4.600B Bushel (56lb)
14 Jan 2019 22:30 United States WSD-Soybn Endstocks18/19 Jan 904.000M 955.000M Bushel (56lb)
14 Jan 2019 22:30 United States WSD-Cotton Output 18/19 Jan 18.590M 480 Pound Bale
14 Jan 2019 22:30 United States WSD-Cottn Endstocks18/19 Jan 4.400M 480 Pound Bale
14 Jan 2019 22:30 United States WSD-Beef Output 2019 Jan 27.848B Pound
14 Jan 2019 22:30 United States WSD-Pork Output 2019 Jan 27.729B Pound
14 Jan 2019 22:30 United States WSD-Poultry Output 2019 Jan 49.238B Pound
14 Jan 2019 22:30 United States WSD-Corn Yield 18/19 Jan 178.90 Bushel (56lb)
14 Jan 2019 22:30 United States WSD-Corn Exports 18/19 Jan 2.45B Bushel (56lb)
14 Jan 2019 22:30 United States World Corn E/S 18/19 Jan 307.32M 308.80M Ton
14 Jan 2019 22:30 United States WSD-Corn Endstock 17/18 Jan 2.140B Bushel (56lb)
14 Jan 2019 22:30 United States WSD-Soybean Yield 18/19 Jan 52.1 Bushel (56lb)
14 Jan 2019 22:30 United States WSD-Soybean Exp 18/19 Jan 1.90B Bushel (56lb)
CURRENCY
14KSTREET - 12TH JANUARY 2019

CURRENCY
14 Jan 2019 22:30 United States World Soy E/S 18/19 Jan 114.36M 115.33M Ton
14 Jan 2019 22:30 United States WSD-Soybean E/S 17/18 Jan 438.00M Bushel (56lb)
14 Jan 2019 22:30 United States World Wheat E/S 18/19 Jan 268.22M 268.10M Ton
14 Jan 2019 22:30 United States WSD-Wheat Endstocks17/18 Jan 1.099B Bushel (56lb)
14 Jan 2019 China (Mainland) Exports YY Dec 3.0% 5.4% Percent
14 Jan 2019 China (Mainland) Imports YY Dec 5.0% 3.0% Percent
14 Jan 2019 China (Mainland) Trade Balance USD Dec 51.53B 44.71B USD
14 Jan 2019 China (Mainland) Yuan-Denominated Exports Dec 10.3% Percent
14 Jan 2019 China (Mainland) Yuan-Denominated Imports Dec 7.9% Percent
14 Jan 2019 China (Mainland) Yuan-Denominated Trade Ba Dec 306.04B CNY
14 Jan 2019 China (Mainland) FDI (YTD) Dec -1.30% Percent
15 Jan 2019 00:30 United States Federal Budget,$ Dec -12.00B -205.00B USD
15 Jan 2019 15:30 Euro Zone Eurostat Trade NSA, Eur Nov 14.0B EUR
15 Jan 2019 19:00 United States NY Fed Manufacturing Jan 12.00 10.90 Index
15 Jan 2019 19:00 United States PPI Final Demand YY Dec 2.5% 2.5% Percent
15 Jan 2019 19:00 United States PPI Final Demand MM Dec -0.1% 0.1% Percent
15 Jan 2019 19:00 United States PPI exFood/Energy YY Dec 3.0% 2.7% Percent
15 Jan 2019 19:00 United States PPI exFood/Energy MM Dec 0.2% 0.3% Percent
15 Jan 2019 19:00 United States PPI ex Food/Energy/Tr YY Dec 2.8% Percent
15 Jan 2019 19:00 United States PPI ex Food/Energy/Tr MM Dec 0.3% Percent
15 Jan 2019 19:25 United States Redbook MM 12 Jan, w/e 0.8% Percent
15 Jan 2019 19:25 United States Redbook YY 12 Jan, w/e 8.9% Percent
15 Jan 2019 22:30 United States NOPA-Soy Crush Dec 166.959M Bushel (56lb)
15 Jan 2019 22:30 United States Bean Oil Stocks Dec 1.484B Pound
16 Jan 2019 03:00 United States API weekly crude stocks 7 Jan, w/e #N/P #N/P Number of
16 Jan 2019 03:00 United States API weekly gasoline stk 7 Jan, w/e #N/P #N/P Number of
16 Jan 2019 03:00 United States API weekly dist. stocks 7 Jan, w/e #N/P #N/P Number of
16 Jan 2019 03:00 United States API weekly heating oil 7 Jan, w/e #N/P #N/P Number of
16 Jan 2019 03:00 United States API weekly crude imports 7 Jan, w/e #N/P #N/P Number of
16 Jan 2019 03:00 United States API weekly product imports 7 Jan, w/e #N/P #N/P Number of
16 Jan 2019 03:00 United States API weekly crude runs 7 Jan, w/e #N/P #N/P Number of
16 Jan 2019 03:00 United States API Cushing number 7 Jan, w/e #N/P #N/P Number of
16 Jan 2019 07:00 China (Mainland) China House Prices YY Dec 9.3% Percent
16 Jan 2019 12:30 United Kingdom Car Registration MM Dec 3.3% Percent
16 Jan 2019 12:30 United Kingdom Car Registration YY Dec -3.0% Percent
16 Jan 2019 15:00 United Kingdom Core CPI MM Dec 0.3% 0.3% Percent
16 Jan 2019 15:00 United Kingdom Core CPI YY Dec 1.8% 1.8% Percent
16 Jan 2019 15:00 United Kingdom CPI MM Dec 0.2% 0.2% Percent
16 Jan 2019 15:00 United Kingdom CPI YY Dec 2.2% 2.3% Percent
16 Jan 2019 15:00 United Kingdom RPI MM Dec 0.5% 0.0% Percent
16 Jan 2019 15:00 United Kingdom RPI YY Dec 2.9% 3.2% Percent
16 Jan 2019 15:00 United Kingdom RPI-X (Retail Prices) MM Dec 0.0% Percent
16 Jan 2019 15:00 United Kingdom RPIX YY Dec 3.1% Percent
16 Jan 2019 15:00 United Kingdom RPI Index Dec 284.6 Index
16 Jan 2019 15:00 United Kingdom CPI NSA Dec 106.97 Index
16 Jan 2019 15:00 United Kingdom PPI Input Prices MM NSA Dec -1.7% -2.3% Percent
16 Jan 2019 15:00 United Kingdom PPI Input Prices YY NSA Dec 3.5% 5.6% Percent
16 Jan 2019 15:00 United Kingdom PPI Output Prices MM NSA Dec 0.0% 0.2% Percent
16 Jan 2019 15:00 United Kingdom PPI Output Prices YY NSA Dec 2.9% 3.1% Percent
16 Jan 2019 15:00 United Kingdom PPI Core Output MM NSA Dec 0.1% 0.1% Percent
16 Jan 2019 15:00 United Kingdom PPI Core Output YY NSA Dec 2.4% 2.4% Percent
16 Jan 2019 17:00 India M3 Money Supply 4 Jan, w/e 10.2% Percent
15KSTREET - 12TH JANUARY 2019

CURRENCY
16 Jan 2019 17:30 United States MBA Mortgage Applications 11 Jan, w/e 23.5% Percent
16 Jan 2019 17:30 United States Mortgage Market Index 11 Jan, w/e 362.7 Index
16 Jan 2019 17:30 United States MBA Purchase Index 11 Jan, w/e 255.2 Index
16 Jan 2019 17:30 United States Mortgage Refinance Index 11 Jan, w/e 987.9 Index
16 Jan 2019 17:30 United States MBA 30-Yr Mortgage Rate 11 Jan, w/e 4.74% Percent
16 Jan 2019 19:00 United States Import Prices MM Dec -1.2% -1.6% Percent
16 Jan 2019 19:00 United States Export Prices MM Dec -0.6% -0.9% Percent
16 Jan 2019 19:00 United States Retail Sales Ex-Autos MM Dec 0.1% 0.2% Percent
16 Jan 2019 19:00 United States Retail Sales MM Dec 0.2% 0.2% Percent
16 Jan 2019 19:00 United States Retail Ex Gas/Autos Dec 0.5% Percent
16 Jan 2019 19:00 United States Retail Control Dec 0.5% 0.9% Percent
16 Jan 2019 19:00 United States Retail Sales YoY Dec 4.22% Percent
16 Jan 2019 20:30 United States Business Inventories MM Nov 0.3% 0.6% Percent
16 Jan 2019 20:30 United States Retail Inventories Ex-Auto Rev Nov Percent
16 Jan 2019 20:30 United States NAHB Housing Market Indx Jan 56 56 Index
16 Jan 2019 21:00 United States EIA Weekly Crude Stocks 11 Jan, w/e -1.680M Barrel
16 Jan 2019 21:00 United States EIA Weekly Dist. Stocks 11 Jan, w/e 10.611M Barrel
16 Jan 2019 21:00 United States EIA Weekly Gasoline Stk 11 Jan, w/e 8.066M Barrel
16 Jan 2019 21:00 United States EIA Weekly Crude Imports 11 Jan, w/e 0.626M Barrel
16 Jan 2019 21:00 United States EIA Weekly Rfg Stocks 11 Jan, w/e 0.000M Barrel
16 Jan 2019 21:00 United States EIA Weekly Heatoil Stock 11 Jan, w/e 0.224M Barrel
16 Jan 2019 21:00 United States EIA Weekly Prods Imports 11 Jan, w/e 0.469M Barrel/Day
16 Jan 2019 21:00 United States EIA Weekly Dist Output 11 Jan, w/e -0.028M Barrel/Day
16 Jan 2019 21:00 United States EIA Weekly Crude Runs 11 Jan, w/e -0.194M Barrel/Day
16 Jan 2019 21:00 United States EIA Weekly Refining Util 11 Jan, w/e -1.1% Percent
16 Jan 2019 21:00 United States EIA Wkly Crude Cushing 11 Jan, w/e 0.330M Barrel
16 Jan 2019 21:00 United States EIA Weekly Gasoline O/P 11 Jan, w/e -0.141M Barrel/Day
17 Jan 2019 00:00 United States EIA Ethanol Ref Stk 11 Jan, w/e 23,254k Barrel
17 Jan 2019 00:00 United States EIA Ethanol Fuel Total 11 Jan, w/e 1,000k Barrel per day
17 Jan 2019 02:30 United States Net L-T Flows,Exswaps Nov 31.3B USD
17 Jan 2019 02:30 United States Foreign Buying, T-Bonds Nov 1.7B USD
17 Jan 2019 02:30 United States Overall Net Capital Flows Nov 42.0B USD
17 Jan 2019 02:30 United States Net L-T Flows,Incl.Swaps Nov -18.3B USD
17 Jan 2019 05:00 Australia Consumer Sentiment Jan 0.1% Percent
17 Jan 2019 05:31 United Kingdom RICS Housing Survey Dec -11 Net balance
17 Jan 2019 06:00 Australia Housing Finance Nov -1.5% 2.2% Percent
17 Jan 2019 06:00 Australia Invest Housing Finance Nov 0.6% Percent
17 Jan 2019 06:00 Australia Reserve Assets Total Dec 59,295M AUD
17 Jan 2019 15:30 Euro Zone Construction Output MM Nov -1.63% Percent
17 Jan 2019 15:30 Euro Zone HICP Final MM Dec 0.0% -0.2% Percent
17 Jan 2019 15:30 Euro Zone HICP Final YY Dec 1.6% 1.6% Percent
17 Jan 2019 15:30 Euro Zone HICP-X F&E MM Dec 0.4% -0.2% Percent
17 Jan 2019 15:30 Euro Zone HICP-X F&E Final YY Dec 1.1% 1.1% Percent
17 Jan 2019 15:30 Euro Zone HICP-X Tobacco MM Dec -0.2% Percent
17 Jan 2019 15:30 Euro Zone HICP-X tobacco YY Dec 1.9% Percent
17 Jan 2019 15:30 Euro Zone HICP-X F, E, A, T Final MM Dec 0.5% 0.5% Percent
17 Jan 2019 15:30 Euro Zone HICP-X F,E,A&T Final YY Dec 1.0% 1.0% Percent
17 Jan 2019 15:30 Euro Zone Inflation Ex-Tobacco Idx Dec 104.10 Index
17 Jan 2019 15:30 Euro Zone HICP Excl Tobacco Unrevised Dec #N/P #N/P Index
17 Jan 2019 19:00 United States Building Permits: Number Dec 1.290M Number of
17 Jan 2019 19:00 United States Build Permits: Change MM Dec Percent
17 Jan 2019 19:00 United States Housing Starts Number Dec 1.261M 1.256M Number of
16KSTREET - 12TH JANUARY 2019

CURRENCY
17 Jan 2019 19:00 United States House Starts MM: Change Dec 3.2% Percent
17 Jan 2019 19:00 United States Initial Jobless Claims 12 Jan, w/e 220k 216k Person
17 Jan 2019 19:00 United States Jobless Claims 4-Wk Avg 12 Jan, w/e 221.75k Person
17 Jan 2019 19:00 United States Continued Jobless Claims 5 Jan, w/e 1.722M Person
17 Jan 2019 19:00 United States Philly Fed Business Indx Jan 11.0 9.4 Index
17 Jan 2019 19:00 United States Philly Fed 6M Index Jan 31.70 Index
17 Jan 2019 19:00 United States Philly Fed Capex Index Jan 35.70 Index
17 Jan 2019 19:00 United States Philly Fed Employment Jan 18.30 Index
17 Jan 2019 19:00 United States Philly Fed Prices Paid Jan 38.00 Index
17 Jan 2019 19:00 United States Philly Fed New Orders Jan 14.50 Index
17 Jan 2019 21:00 United States EIA- Nat Gas, Change Bcf 7 Jan, w/e -91B Cubic foot
17 Jan 2019 21:00 United States Nat Gas-EIA Implied Flow 7 Jan, w/e -87B Cubic foot
18 Jan 2019 14:30 Euro Zone Current Account NSA,EUR Nov 26.6B EUR
18 Jan 2019 14:30 Euro Zone Current Account SA, EUR Nov 22.993B EUR
18 Jan 2019 15:00 United Kingdom Retail Sales MM Dec -0.7% 1.4% Percent
18 Jan 2019 15:00 United Kingdom Retail Sales Ex-Fuel MM Dec -0.5% 1.2% Percent
18 Jan 2019 15:00 United Kingdom Retail Sales YY Dec 3.5% 3.6% Percent
18 Jan 2019 15:00 United Kingdom Retail Sales Ex-Fuel YY Dec 4.0% 3.8% Percent
18 Jan 2019 17:00 India Bank Loan Growth 31 Dec, w/e Percent
18 Jan 2019 17:00 India Deposit Growth 31 Dec, w/e Percent
18 Jan 2019 17:00 India FX Reserves, USD 7 Jan, w/e 396.08B USD
18 Jan 2019 19:45 United States Industrial Production MM Dec 0.3% 0.6% Percent
18 Jan 2019 19:45 United States Capacity Utilization SA Dec 78.6% 78.5% Percent
18 Jan 2019 19:45 United States Manuf Output MM Dec 0.3% 0.0% Percent
18 Jan 2019 19:45 United States Industrial Production YoY Dec 3.89% Percent
18 Jan 2019 20:30 United States U Mich Sentiment Prelim Jan 97.0 98.3 Index
18 Jan 2019 20:30 United States U Mich Conditions Prelim Jan 116.1 Index
18 Jan 2019 20:30 United States U Mich Expectations Prelim Jan 87.0 Index
18 Jan 2019 20:30 United States U Mich 1Yr Inf Prelim Jan 2.7% Percent
18 Jan 2019 20:30 United States U Mich 5-Yr Inf Prelim Jan 2.5% Percent
17KSTREET - 12TH JANUARY 2019

Activity@Mallasamudram Branch Activity@Union Bank, Bareilly
Activity@Canara Bank, Salem Activity@Union Bank, Bilaspur
Activity@Mannapuram Activity@Nainital Bank
With Governor of Rajasthan IAP@Khatima, Uttarakhand


![RULE THE MARKET - Karvy Onlinecontent.karvyonline.com/contents/kstreetissue011.pdfDisclaimer: Karvy Stock Broking Limited [KSBL] is registered as a research analyst with SEBI (Registration](https://img.pdfslide.us/doc/110x75/5e404854af860e4d7b4ee7ef/rule-the-market-karvy-disclaimer-karvy-stock-broking-limited-ksbl-is-registered.jpg)