Embed Size (px)
Citation preview

2012 AOF Test Check Program Monthly Report
Round 8 August 2012
01/08/2012 – 31/08/2012
CBH_DMS_PROD#1209676-v8 AOF Test Check Program Monthly Report
Result Receival Dates
Lab Code Date A 22/08/2012 B 31/08/2012 C 31/08/2012 D 31/08/2012 E 15/08/2012 F 23/08/2012 G 31/08/2012 H 30/08/2012 I 13/08/2012 J 13/08/2012 K 15/08/2012 L 31/08/2012 M 22/08/2012 N 22/08/2012
Discussion of Results
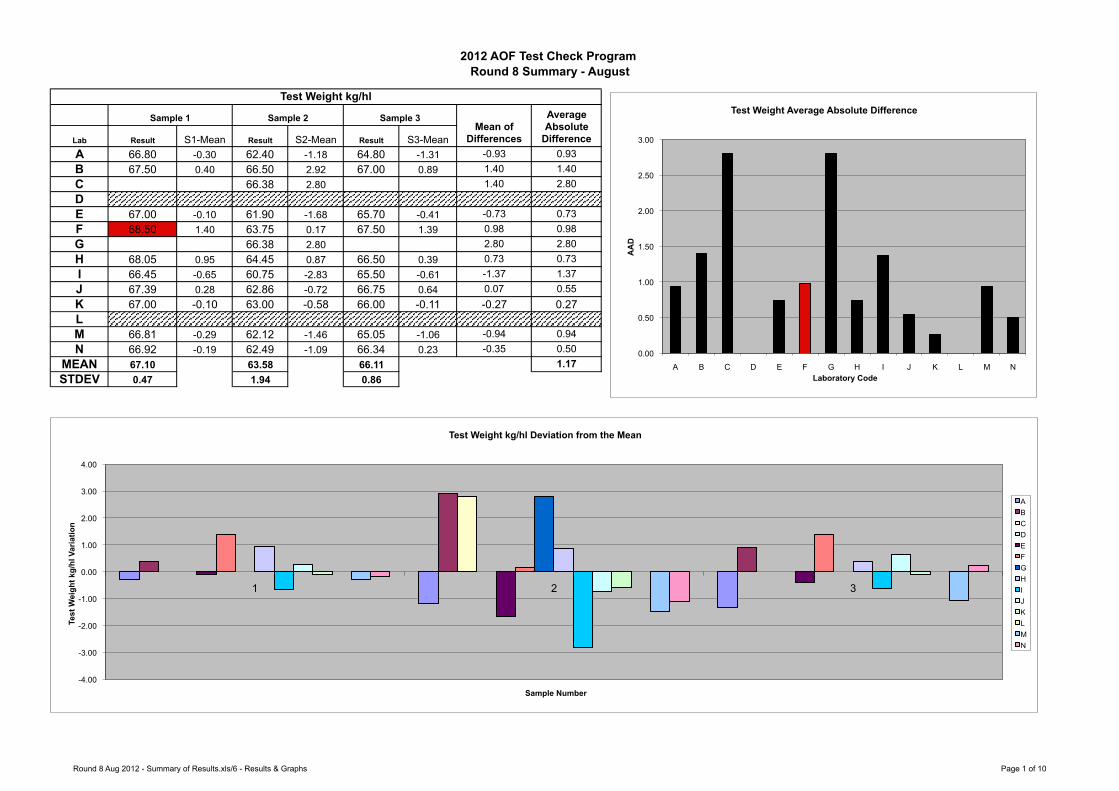
Test Weight
Sample 1 – One outlier was identified for Lab F with a 0.08 percent discrepancy from the upper (68.43%) quartile limit.
Sample 2 – No outliers were observed. Sample 3 – No outliers were observed.
Impurities
Sample 1 – No outliers were observed. Sample 2 – No outliers were observed. Sample 3 – One outlier was identified for Lab M with a 0.18 percent discrepancy from the
upper (1.28%) quartile limit.
2012 AOF Test Check Program Monthly Report
Round 8 August 2012
01/08/2012 – 31/08/2012
CBH_DMS_PROD#1209676-v8 AOF Test Check Program Monthly Report
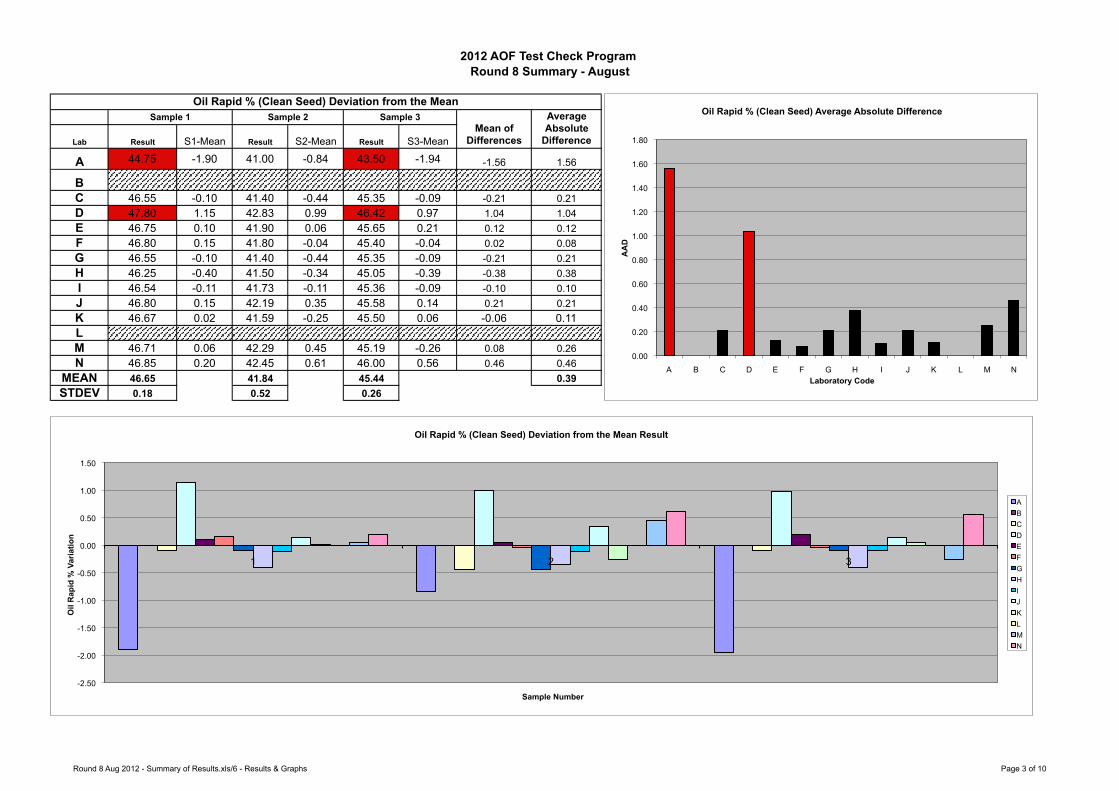
Oil Rapid
Sample 1 – Outliers were identified for Lab A and D. Lab A results were 1.42 of a percent discrepancy from the lower (46.17%) quartile limit. Lab D results were 0.62 of a percent discrepancy from the upper (47.18%) quartile limit.
Sample 2 – No outliers were observed. Sample 3 – Outliers were identified for Lab A and D. Lab A results were 1.38 of a percent
discrepancy from the lower (44.88%) quartile limit. Lab D results were 0.39 of a percent discrepancy from the upper (46.03%) quartile limit.
Oil Solvent (ISO 659)
No outliers were observed for this analysis.
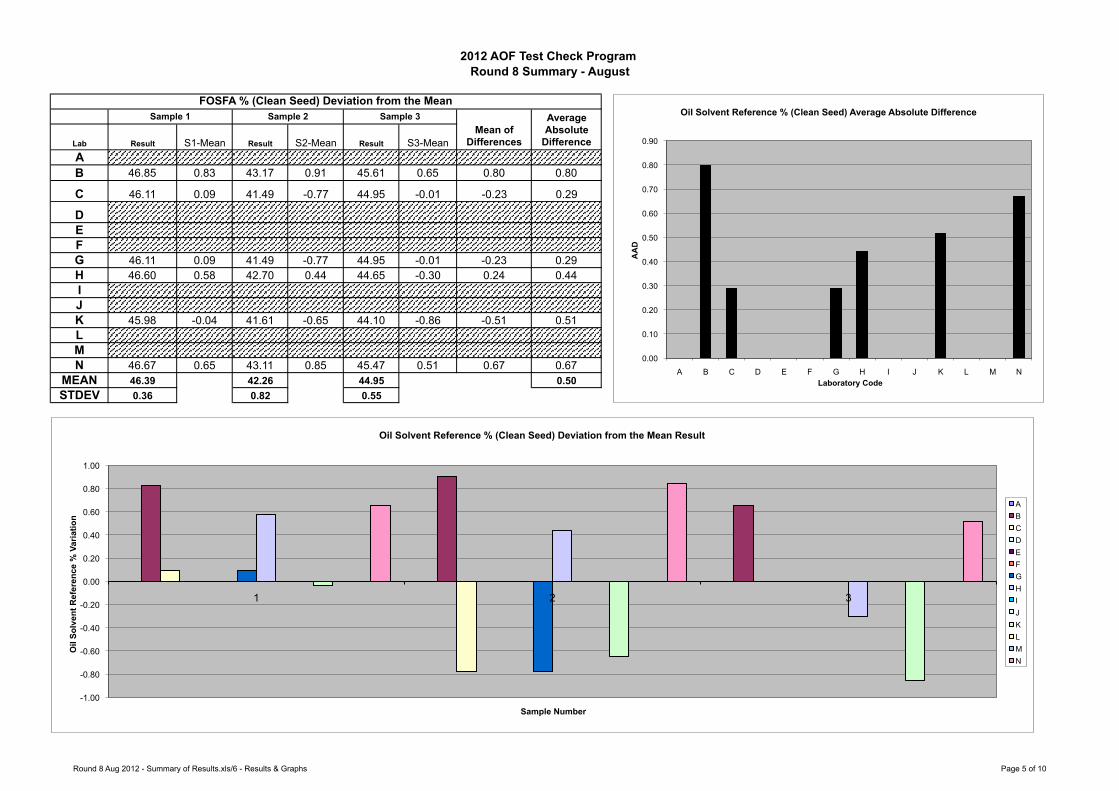
Oil Solvent Reference (AOCS Method Am 2-93 - FOSFA)
No outliers were observed for this analysis.
Moisture Oven
Sample 1 – One outlier was identified for Lab D with a 0.85 percent discrepancy from the upper (5.40%) quartile limit.
Sample 2 – One outlier was identified for Lab D with a 0.33 percent discrepancy from the
upper (6.28%) quartile limit. Sample 3 – Outliers were identified for Lab D and E. Lab D results were 0.37 of a percent
discrepancy from the upper (6.93%) quartile limit. Lab E results were 0.23 of a percent discrepancy from the lower (6.27%) quartile limit.
Moisture Rapid
No outliers were observed for this analysis.

2012 AOF Test Check Program Monthly Report
Round 8 August 2012
01/08/2012 – 31/08/2012
CBH_DMS_PROD#1209676-v8 AOF Test Check Program Monthly Report
Oleic Oil
Sample 1 – One outlier was identified for Lab H with a 1.04 of a percent discrepancy from the lower (60.85%) quartile limit.
Sample 2 – One outlier was identified for Lab H with a 0.82 of a percent discrepancy from
the lower (53.47%) quartile limit. Sample 3 – One outlier was identified for Lab H with a 1.19 of a percent discrepancy from
the lower (57.34%) quartile limit.
Linoleic Oil
Sample 1 – Outliers were identified for Lab F and L. Lab F results were 0.10 of a percent discrepancy from the lower (17.85%) quartile limit. Lab L results were 0.25 of a percent discrepancy from the upper (18.28%) quartile limit.
Sample 2 – No outliers were observed. Sample 3 – No outliers were observed.
Free Fatty Acid
No outliers were observed for this analysis.
Round 8 Aug 2012 - Summary of Results.xls/6 - Results & Graphs Page 1 of 10
Lab Result S1-Mean Result S2-Mean Result S3-MeanA 66.80 -0.30 62.40 -1.18 64.80 -1.31 -0.93 0.93B 67.50 0.40 66.50 2.92 67.00 0.89 1.40 1.40C 66.38 2.80 1.40 2.80DE 67.00 -0.10 61.90 -1.68 65.70 -0.41 -0.73 0.73F 68.50 1.40 63.75 0.17 67.50 1.39 0.98 0.98G 66.38 2.80 2.80 2.80H 68.05 0.95 64.45 0.87 66.50 0.39 0.73 0.73I 66.45 -0.65 60.75 -2.83 65.50 -0.61 -1.37 1.37J 67.39 0.28 62.86 -0.72 66.75 0.64 0.07 0.55K 67.00 -0.10 63.00 -0.58 66.00 -0.11 -0.27 0.27LM 66.81 -0.29 62.12 -1.46 65.05 -1.06 -0.94 0.94N 66.92 -0.19 62.49 -1.09 66.34 0.23 -0.35 0.50
MEAN 67.10 63.58 66.11 1.17STDEV 0.47 1.94 0.86
2012 AOF Test Check Program Round 8 Summary - August
Mean of Differences
Average Absolute
Difference
Test Weight kg/hl
Sample 1 Sample 2 Sample 3
-4.00
-3.00
-2.00
-1.00
0.00
1.00
2.00
3.00
4.00
1 2 3
Test
Wei
ght k
g/hl
Var
iatio
n
Sample Number
Test Weight kg/hl Deviation from the Mean
A B C D E F G H I J K L M N
0.00
0.50
1.00
1.50
2.00
2.50
3.00
A B C D E F G H I J K L M N
AA
D
Laboratory Code
Test Weight Average Absolute Difference

Round 8 Aug 2012 - Summary of Results.xls/6 - Results & Graphs Page 2 of 10
2012 AOF Test Check Program Round 8 Summary - August
Lab Result S1-Mean Result S2-Mean Result S3-Mean
A 0.55 0.00 1.55 -0.28 1.00 0.14 -0.05 0.14B 0.36 -0.19 1.33 -0.50 0.69 -0.17 -0.29 0.29C 0.45 -0.10 1.62 -0.22 0.99 0.13 -0.06 0.15D 0.55 0.00 2.53 0.70 0.86 0.00 0.23 0.24E 0.70 0.15 1.88 0.04 0.74 -0.12 0.02 0.11F 0.55 0.00 2.15 0.32 0.80 -0.06 0.09 0.13G 0.45 -0.10 1.62 -0.22 0.99 0.13 -0.06 0.15H 0.25 -0.30 1.55 -0.28 0.60 -0.26 -0.28 0.28I 0.65 0.10 1.20 -0.63 0.85 -0.01 -0.18 0.25J 0.79 0.24 1.89 0.06 0.91 0.05 0.11 0.11K 0.50 -0.05 1.85 0.02 0.80 -0.06 -0.03 0.04LM 0.65 0.10 2.30 0.47 1.45 0.59 0.39 0.39N 0.72 0.17 2.37 0.53 1.10 0.24 0.31 0.31
MEAN 0.55 1.83 0.86 0.20STDEV 0.15 0.41 0.15
Impurities %Sample 1 Sample 2 Sample 3
Mean of Differences
Average Absolute
Difference
-0.80
-0.60
-0.40
-0.20
0.00
0.20
0.40
0.60
0.80
1 2 3
Impu
ritie
s %
Var
iatio
n
Sample Number
Impurities % Deviation from the Mean Result
A B C D E F G H I J K L M N
0.00
0.05
0.10
0.15
0.20
0.25
0.30
0.35
0.40
0.45
A B C D E F G H I J K L M N
AA
D
Laboratory Code
Impurities Average Absolute Difference
Round 8 Aug 2012 - Summary of Results.xls/6 - Results & Graphs Page 3 of 10
2012 AOF Test Check Program Round 8 Summary - August
Lab Result S1-Mean Result S2-Mean Result S3-Mean
A 44.75 -1.90 41.00 -0.84 43.50 -1.94 -1.56 1.56
BC 46.55 -0.10 41.40 -0.44 45.35 -0.09 -0.21 0.21D 47.80 1.15 42.83 0.99 46.42 0.97 1.04 1.04E 46.75 0.10 41.90 0.06 45.65 0.21 0.12 0.12F 46.80 0.15 41.80 -0.04 45.40 -0.04 0.02 0.08G 46.55 -0.10 41.40 -0.44 45.35 -0.09 -0.21 0.21H 46.25 -0.40 41.50 -0.34 45.05 -0.39 -0.38 0.38I 46.54 -0.11 41.73 -0.11 45.36 -0.09 -0.10 0.10J 46.80 0.15 42.19 0.35 45.58 0.14 0.21 0.21K 46.67 0.02 41.59 -0.25 45.50 0.06 -0.06 0.11LM 46.71 0.06 42.29 0.45 45.19 -0.26 0.08 0.26N 46.85 0.20 42.45 0.61 46.00 0.56 0.46 0.46
MEAN 46.65 41.84 45.44 0.39STDEV 0.18 0.52 0.26
Oil Rapid % (Clean Seed) Deviation from the MeanSample 1 Sample 2 Sample 3
Mean of Differences
Average Absolute
Difference
-2.50
-2.00
-1.50
-1.00
-0.50
0.00
0.50
1.00
1.50
1 2 3
Oil
Rap
id %
Var
iatio
n
Sample Number
Oil Rapid % (Clean Seed) Deviation from the Mean Result
A B C D E F G H I J K L M N
0.00
0.20
0.40
0.60
0.80
1.00
1.20
1.40
1.60
1.80
A B C D E F G H I J K L M N
AA
D
Laboratory Code
Oil Rapid % (Clean Seed) Average Absolute Difference

Round 8 Aug 2012 - Summary of Results.xls/6 - Results & Graphs Page 4 of 10
2012 AOF Test Check Program Round 8 Summary - August
Lab Result S1-Mean Result S2-Mean Result S3-MeanA
B 46.78 0.76 42.99 1.04 45.81 0.85 0.88 0.88
C 45.02 -1.00 40.38 -1.57 44.29 -0.67 -1.08 1.08DEF 46.90 0.88 42.80 0.85 45.10 0.14 0.63 0.63G 45.02 -1.00 40.38 -1.57 44.29 -0.67 -1.08 1.08HI 45.83 -0.19 42.15 0.20 44.81 -0.15 -0.05 0.18JKLMN 46.59 0.57 42.99 1.04 45.46 0.50 0.70 0.70
MEAN 46.02 41.95 44.96 0.76STDEV 0.86 1.25 0.62
Oil Solvent % (Clean Seed) - ISO Deviation from the MeanSample 1 Sample 2 Sample 3
Mean of Differences
Average Absolute
Difference
-2.00
-1.50
-1.00
-0.50
0.00
0.50
1.00
1.50
1 2 3
Oil
Solv
ent %
Var
iatio
n
Sample Number
Oil Solvent % (Clean Seed) Deviation from the Mean Result
A B C D E F G H I J K L M N
0.00
0.20
0.40
0.60
0.80
1.00
1.20
A B C D E F G H I J K L M N
AA
D
Laboratory Code
Oil Rapid % (Clean Seed) Average Absolute Difference
Round 8 Aug 2012 - Summary of Results.xls/6 - Results & Graphs Page 5 of 10
2012 AOF Test Check Program Round 8 Summary - August
Lab Result S1-Mean Result S2-Mean Result S3-MeanAB 46.85 0.83 43.17 0.91 45.61 0.65 0.80 0.80
C 46.11 0.09 41.49 -0.77 44.95 -0.01 -0.23 0.29
DEFG 46.11 0.09 41.49 -0.77 44.95 -0.01 -0.23 0.29H 46.60 0.58 42.70 0.44 44.65 -0.30 0.24 0.44IJK 45.98 -0.04 41.61 -0.65 44.10 -0.86 -0.51 0.51LMN 46.67 0.65 43.11 0.85 45.47 0.51 0.67 0.67
MEAN 46.39 42.26 44.95 0.50STDEV 0.36 0.82 0.55
FOSFA % (Clean Seed) Deviation from the MeanSample 1 Sample 2 Sample 3
Mean of Differences
Average Absolute
Difference
-1.00
-0.80
-0.60
-0.40
-0.20
0.00
0.20
0.40
0.60
0.80
1.00
1 2 3
Oil
Solv
ent R
efer
ence
% V
aria
tion
Sample Number
Oil Solvent Reference % (Clean Seed) Deviation from the Mean Result
A B C D E F G H I J K L M N
0.00
0.10
0.20
0.30
0.40
0.50
0.60
0.70
0.80
0.90
A B C D E F G H I J K L M N
AA
D
Laboratory Code
Oil Solvent Reference % (Clean Seed) Average Absolute Difference

Round 8 Aug 2012 - Summary of Results.xls/6 - Results & Graphs Page 6 of 10
2012 AOF Test Check Program Round 8 Summary - August
Lab Result S1-Mean Result S2-Mean Result S3-MeanAB 5.11 -0.17 5.93 -0.10 6.48 -0.12 -0.13 0.13C 5.17 -0.12 6.16 0.12 6.79 0.19 0.07 0.14
D 6.25 0.97 6.60 0.57 7.30 0.70 0.75 0.75
E 5.13 -0.16 6.04 0.01 6.04 -0.56 -0.24 0.24F 5.12 -0.16 6.02 -0.01 6.56 -0.04 -0.07 0.07G 5.17 -0.12 6.16 0.12 6.79 0.19 0.07 0.14H 5.25 -0.03 6.05 0.02 6.55 -0.05 -0.02 0.03I 5.26 -0.03 6.00 -0.04 6.58 -0.02 -0.03 0.03J 5.23 -0.06 6.06 0.02 6.57 -0.03 -0.02 0.03K 5.18 -0.11 5.95 -0.09 6.49 -0.11 -0.10 0.10LMN 5.25 -0.03 6.00 -0.03 6.55 -0.05 -0.04 0.04
MEAN 5.28 6.03 6.60 0.15STDEV 0.33 0.08 0.12
Moisture Oven % Deviation from the MeanSample 1 Sample 2 Sample 3
Mean of Differences
Average Absolute
Difference
-0.80
-0.60
-0.40
-0.20
0.00
0.20
0.40
0.60
0.80
1.00
1.20
1 2 3
Moi
stur
e O
ven
% V
aria
tion
Sample Number
Moisture Oven % Deviation from the Mean Result
A
B
C
D
E
F
G
H
I
J
K
L
M
N
0.00
0.10
0.20
0.30
0.40
0.50
0.60
0.70
0.80
A B C D E F G H I J K L M N
AA
D
Laboratory Code
Moisture Oven % Average Absolute Difference

Round 8 Aug 2012 - Summary of Results.xls/6 - Results & Graphs Page 7 of 10
2012 AOF Test Check Program Round 8 Summary - August
Lab Result S1-Mean Result S2-Mean Result S3-MeanA 5.20 0.07 5.90 -0.05 6.65 0.24 0.09 0.12BC 5.00 -0.13 6.05 0.10 6.60 0.19 0.05 0.14D
E 5.05 -0.08 5.90 -0.05 6.05 -0.36 -0.16 0.16
F 5.15 0.02 6.15 0.20 6.50 0.09 0.10 0.10G 5.00 -0.13 6.05 0.10 6.60 0.19 0.05 0.14H 5.35 0.22 6.35 0.40 6.50 0.09 0.24 0.24I 5.36 0.23 5.82 -0.13 6.35 -0.07 0.01 0.14J 5.07 -0.06 5.66 -0.29 6.09 -0.32 -0.23 0.23K 4.82 -0.31 5.86 -0.09 6.17 -0.25 -0.22 0.22LM 5.08 -0.05 5.82 -0.14 6.47 0.05 -0.05 0.08N 5.35 0.22 5.90 -0.05 6.60 0.19 0.12 0.15
MEAN 5.13 5.95 6.42 0.16STDEV 0.17 0.19 0.22
Moisture Rapid % Deviation from the MeanSample 1 Sample 2 Sample 3
Mean of Differences
Average Absolute
Difference
-0.50
-0.40
-0.30
-0.20
-0.10
0.00
0.10
0.20
0.30
0.40
0.50
1 2 3
Moi
stur
e R
apid
% V
aria
tion
Sample Number
Moisture Rapid % Deviation from the Mean Result
A
B
C
D
E
F
G
H
I
J
K
L
M
N
0.00 0.05 0.10 0.15 0.20 0.25 0.30 0.35 0.40 0.45 0.50 0.55 0.60 0.65 0.70 0.75 0.80 0.85 0.90 0.95 1.00
A B C D E F G H I J K L M N
AA
D
Laboratory Code
Moisture Rapid % Average Absolute Difference

Round 8 Aug 2012 - Summary of Results.xls/6 - Results & Graphs Page 8 of 10
2012 AOF Test Check Program Round 8 Summary - August
Lab Result S1-Mean Result S2-Mean Result S3-MeanAB 63.83 -0.77 56.42 -0.72 60.06 -0.56 -0.68 0.68C 65.61 1.01 57.76 0.62 61.11 0.49 0.71 0.71DE
F 64.50 -0.10 57.85 0.71 61.35 0.74 0.45 0.51
G 65.61 1.01 57.76 0.62 61.11 0.49 0.71 0.71H 59.80 -4.80 52.65 -4.49 56.15 -4.46 -4.58 4.58IJKL 63.44 -1.16 55.92 -1.22 59.45 -1.17 -1.18 1.18MN
MEAN 64.60 57.14 60.61 1.40STDEV 1.00 0.91 0.82
Oleic % Oil Deviation from the MeanSample 1 Sample 2 Sample 3
Mean of Differences
Average Absolute
Difference
-6.00
-5.00
-4.00
-3.00
-2.00
-1.00
0.00
1.00
2.00
1 2 3
Ole
ic %
Oil
Varia
tion
Sample Number
Oleic % Oil Deviation from the Mean Result
A B C D E F G H I J K L M N
0.00
0.50
1.00
1.50
2.00
2.50
3.00
3.50
4.00
4.50
5.00
A B C D E F G H I J K L M N
AA
D
Laboratory Code
Oleic Oil % Average Absolute Difference

Round 8 Aug 2012 - Summary of Results.xls/6 - Results & Graphs Page 9 of 10
2012 AOF Test Check Program Round 8 Summary - August
Lab Result S1-Mean Result S2-Mean Result S3-MeanAB 18.02 -0.03 21.11 -0.29 19.41 -0.18 -0.17 0.17C 18.01 -0.04 21.59 0.18 19.69 0.10 0.08 0.11DEF 17.75 -0.30 21.30 -0.10 19.25 -0.34 -0.25 0.25
G 18.01 -0.04 21.59 0.18 19.69 0.10 0.08 0.11
H 18.15 0.10 21.15 -0.25 19.55 -0.04 -0.06 0.13IJKL 18.53 0.48 21.68 0.28 19.98 0.38 0.38 0.38MN
MEAN 18.05 21.40 19.59 0.19STDEV 0.07 0.25 0.25
Linoleic % Oil Deviation from the MeanSample 1 Sample 2 Sample 3
Mean of Differences
Average Absolute
Difference
-0.40
-0.30
-0.20
-0.10
0.00
0.10
0.20
0.30
0.40
0.50
0.60
1 2 3 Lino
leic
% O
il Va
riatio
n
Sample Number
Linoleic % Oil Deviation from the Mean Result
A
B
C
D
E
F
G
H
I
J
K
L
M
N
0.00
0.05
0.10
0.15
0.20
0.25
0.30
0.35
0.40
A B C D E F G H I J K L M N
AA
D
Laboratory Code
Linoleic Oil % Average Absolute Difference

Round 8 Aug 2012 - Summary of Results.xls/6 - Results & Graphs Page 10 of 10
2012 AOF Test Check Program Round 8 Summary - August
Lab Result S1-Mean Result S2-Mean Result S3-MeanAB 0.06 -0.21 0.11 -0.48 0.12 -0.19 -0.29 0.29C 0.43 0.16 1.32 0.73 0.28 -0.04 0.29 0.31DE 0.42 0.15 0.54 -0.04 0.70 0.39 0.17 0.19F 0.41 0.14 0.55 -0.03 0.61 0.30 0.14 0.16G 0.43 0.16 1.32 0.73 0.28 -0.04 0.29 0.31
H 0.09 -0.19 0.09 -0.49 0.08 -0.23 -0.30 0.30
IJK 0.06 -0.21 0.16 -0.42 0.12 -0.20 -0.28 0.28LMN
MEAN 0.27 0.58 0.31 0.26STDEV 0.19 0.54 0.25
Free Fatty Acid % Oil Deviation from the MeanSample 1 Sample 2 Sample 3
Mean of Differences
Average Absolute
Difference
-0.60
-0.40
-0.20
0.00
0.20
0.40
0.60
0.80
1 2 3
Free
Fat
ty A
cid
% O
il Va
riatio
n
Sample Number
Free Fatty Acid % Oil Deviation from the Mean Result
A B C D E F G H I J K L M N
0.00
0.05
0.10
0.15
0.20
0.25
0.30
0.35
A B C D E F G H I J K L M N
AA
D
Laboratory Code
Free Fatty Acid % Average Absolute Difference


![Sketchnotes-SF Meetup :: Round 27 :: Capture, Iterate, Refine [Thu Aug 11, 2015]](https://img.pdfslide.us/doc/110x75/589cb98d1a28abbe4a8b752b/sketchnotes-sf-meetup-round-27-capture-iterate-refine-thu-aug-11.jpg)
![Sketchnotes-SF Meetup :: Round 21 :: Capture, Iterate, Refine [Wed Aug 19, 2015]](https://img.pdfslide.us/doc/110x75/5886a5cd1a28ab0c1d8b70ff/sketchnotes-sf-meetup-round-21-capture-iterate-refine-wed-aug-19.jpg)