Embed Size (px)
Citation preview
The Outlook for Natural Gas in North AmericaRotary Club of Calgary April 6, 2010
Hal Kvisle, President and CEOTransCanada Corporation
Forward-Looking Information
This presentation may contain certain information that is forward looking and is subject to important risks and uncertainties. The words ‘anticipate’, ‘expect’, ‘believe’, ‘may’, ‘should’, ‘estimate’, ‘project’, ‘outlook’, ‘forecast’ or other similar words are used to identify such forward-looking information. Forward-looking statements in this document are intended to provide TransCanada security holders and potential investors with information regarding TransCanada and its subsidiaries, including management’s assessment of TransCanada’s and its subsidiaries’ future financial and operational plans and outlook. Forward-looking statements in this document may include, among others, statements regarding the anticipated business prospects and financial performance of TransCanada and its subsidiaries, expectations or projections about the future, and strategies and goals for growth and expansion. All forward-looking statements reflect TransCanada’s beliefs and assumptions based on information available at the time the statements were made. Actual results or events may differ from those predicted in these forward-looking statements. Factors that could cause actual results or events to differ materially from current expectations include, among others, the ability of TransCanada to successfully implement its strategic initiatives and whether such strategic initiatives will yield the expected benefits, the operating performance of TransCanada’s pipeline and energy assets, the availability and price of energy commodities, capacity payments, regulatory processes and decisions, changes in environmental and other laws and regulations, competitive factors in the pipeline and energy sectors, construction and completion of capital projects, labour, equipment and material costs, access to capital markets, interest and currency exchange rates, technological developments and economic conditions in North America. By its nature, forward-looking information is subject to various risks and uncertainties, which could cause TransCanada's actual results and experience to differ materially from the anticipated results or expectations expressed. Additional information on these and other factors is available in the reports filed by TransCanada with Canadian securities regulators and with the U.S. Securities and Exchange Commission (SEC). Readers are cautioned to not place undue reliance on this forward-looking information, which is given as of the date it is expressed in this presentation or otherwise, and to not use future-oriented information or financial outlooks for anything other than their intended purpose. TransCanada undertakes no obligation to update publicly or revise any forward-looking information, whether as a result of new information, future events or otherwise, except as required by law.
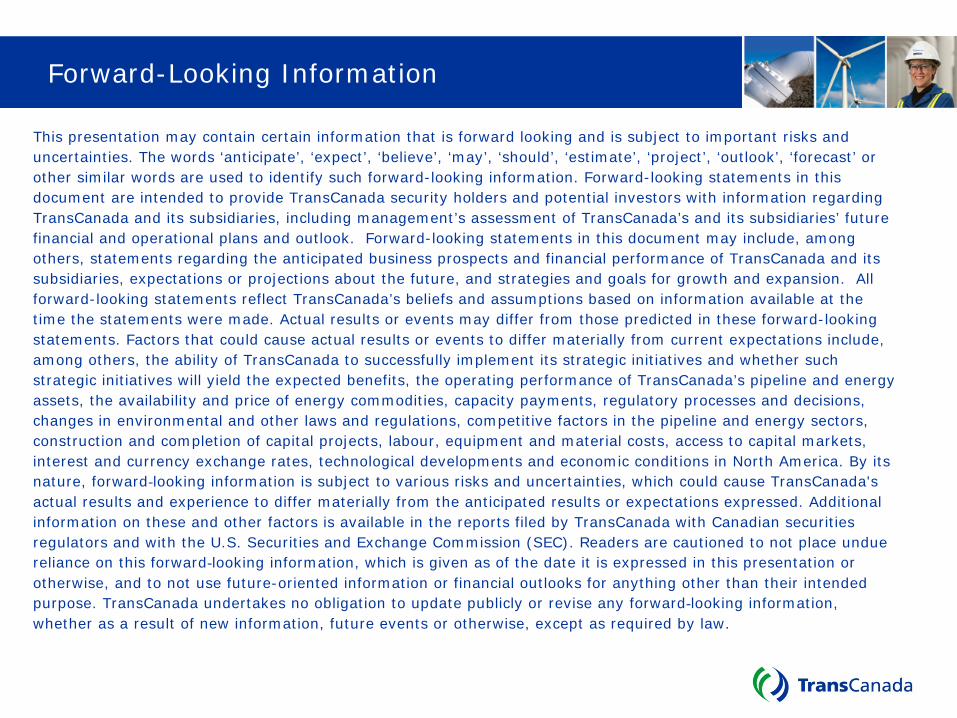
Our Competitive Position
North America’s Largest Natural Gas Pipeline Network
• 60,000 km (37,000 mi) wholly-owned
• 8,800 km (5,500 mi) partially-owned
• Average volume of 15 Bcf/d
North America’s 2nd Largest Natural Gas Storage Operator• 380 Bcf of capacity
Canada’s Largest Private Sector Power Generator• 20 power plants, 11,700 MW
Premier North American Oil Pipeline Under Construction• 1.1 million Bbl/d
4,000 Talented Employees• In 7 provinces and 34 states
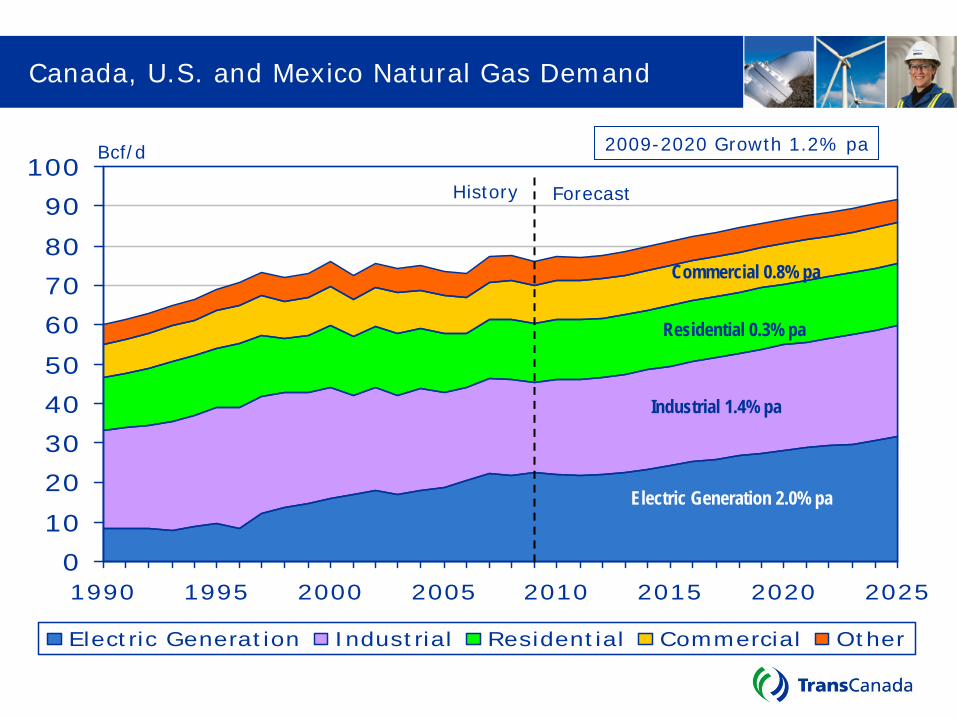
Canada, U.S. and Mexico Natural Gas Demand
0
10
20
30
40
50
60
70
80
90
100
1990 1995 2000 2005 2010 2015 2020 2025
Electric Generation Industrial Residential Commercial Other
Bcf/d
History Forecast
2009-2020 Growth 1.2% pa
Industrial 1.4% pa
Electric Generation 2.0% pa
Residential 0.3% pa
Commercial 0.8% pa
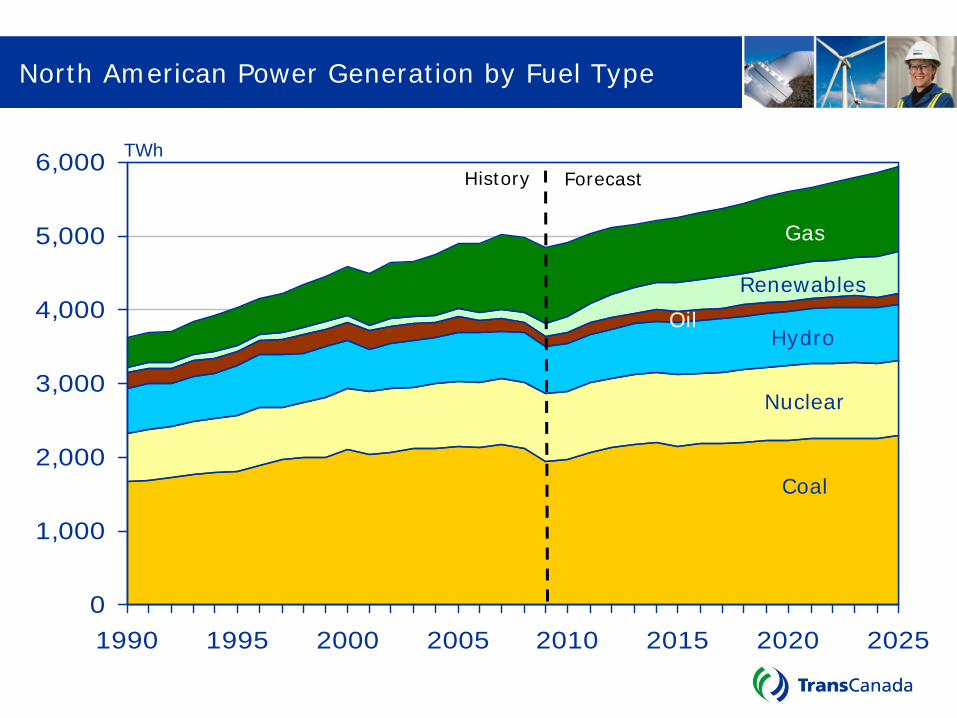
North American Power Generation by Fuel Type
0
1,000
2,000
3,000
4,000
5,000
6,000
1990 1995 2000 2005 2010 2015 2020 2025
TWhHistory Forecast
Gas
Coal
Renewables
OilHydro
Nuclear
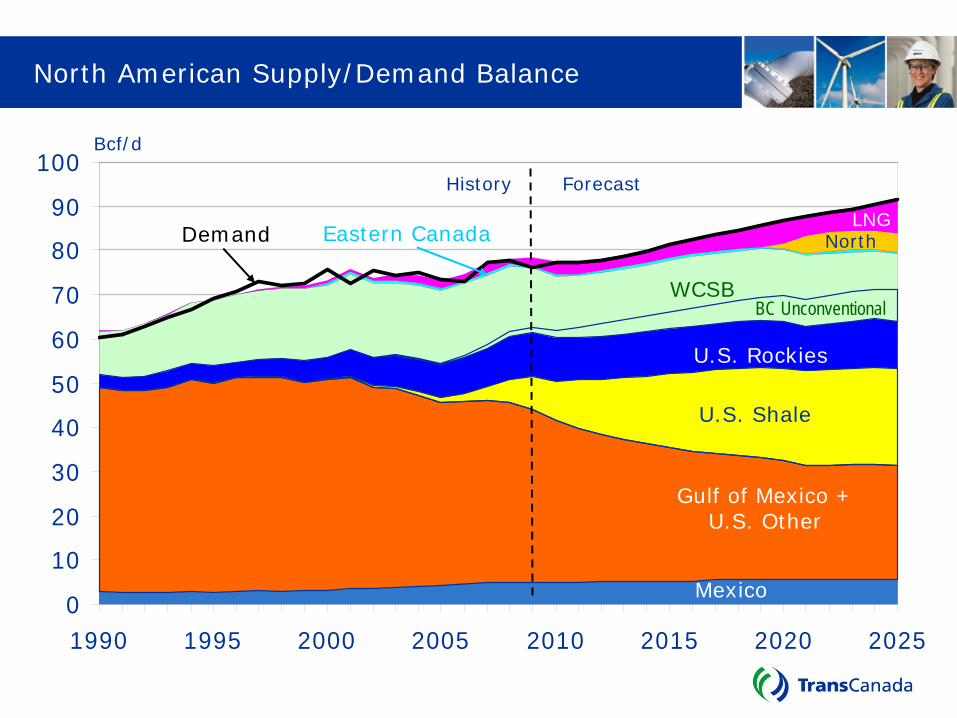
North American Supply/Demand Balance
0
10
20
30
40
50
60
70
80
90
100
1990 1995 2000 2005 2010 2015 2020 2025
Gulf of Mexico + U.S. Other
WCSB
U.S. Rockies
Eastern Canada
Bcf/d
LNG
Mexico
Demand
History Forecast
U.S. Shale
BC Unconventional
North
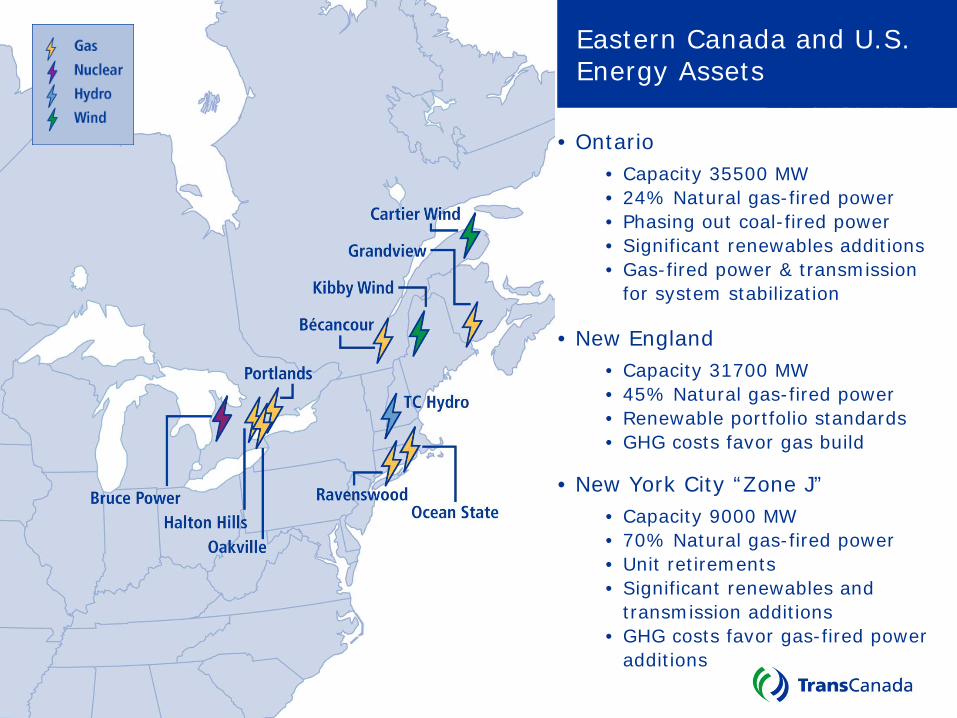
Eastern Canada and U.S. Energy Assets
• Ontario• Capacity 35500 MW• 24% Natural gas-fired power• Phasing out coal-fired power• Significant renewables additions• Gas-fired power & transmission
for system stabilization
• New England• Capacity 31700 MW• 45% Natural gas-fired power• Renewable portfolio standards • GHG costs favor gas build
• New York City “Zone J”• Capacity 9000 MW • 70% Natural gas-fired power• Unit retirements• Significant renewables and
transmission additions• GHG costs favor gas-fired power
additions
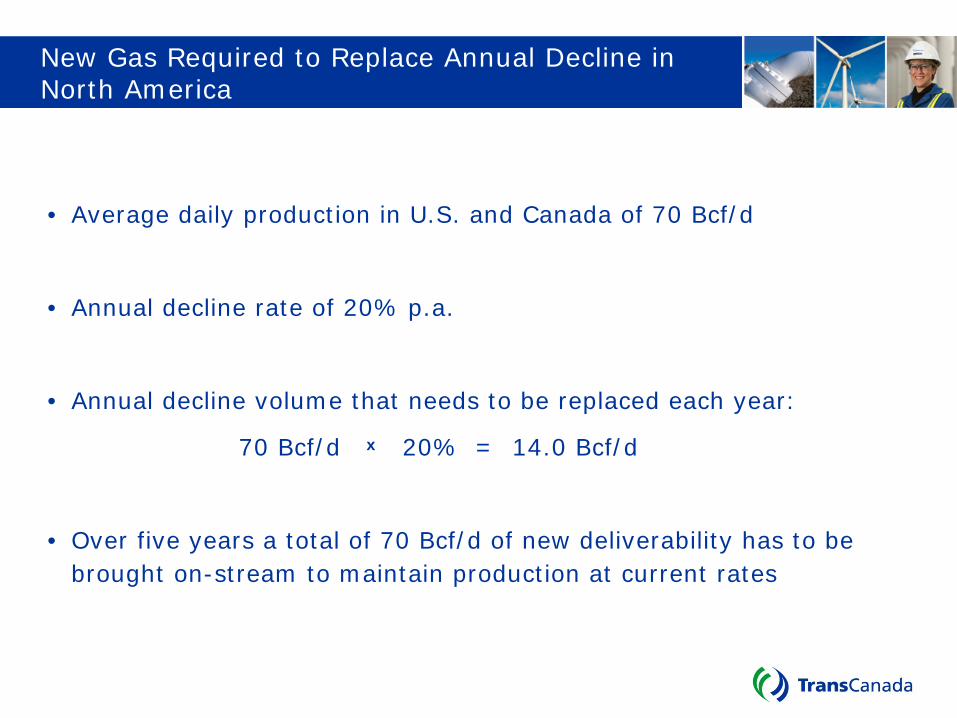
New Gas Required to Replace Annual Decline in North America
• Average daily production in U.S. and Canada of 70 Bcf/d
• Annual decline rate of 20% p.a.
• Annual decline volume that needs to be replaced each year:
70 Bcf/d x 20% = 14.0 Bcf/d
• Over five years a total of 70 Bcf/d of new deliverability has to be brought on-stream to maintain production at current rates
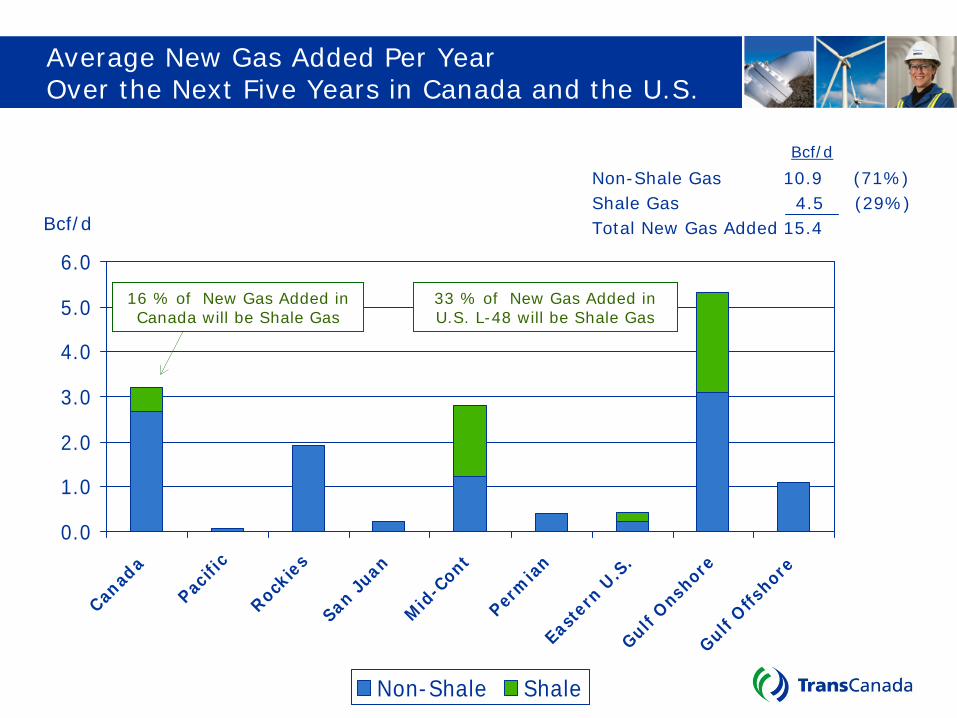
Average New Gas Added Per Year Over the Next Five Years in Canada and the U.S.
0.0
1.0
2.0
3.0
4.0
5.0
6.0
Canad
a
Pacifi
c
Rocki
es
San
Juan
Mid
-Con
t
Perm
ian
Easte
rn U
.S.
Gulf O
nsho
reGul
f Offs
hore
Non-Shale Shale
Bcf/d
33 % of New Gas Added in U.S. L-48 will be Shale Gas
16 % of New Gas Added in Canada will be Shale Gas
Non-Shale Gas 10.9 (71%)Shale Gas 4.5 (29%)Total New Gas Added 15.4
Bcf/d
16,00012,0002,000 10,000 14,0004,0000
6.00
5.00
4.00
6,000
3.00
7.00
1.00
0.00
MMcf/d8,000
US$/Mcf
2.00
9.00
10.00
8.00
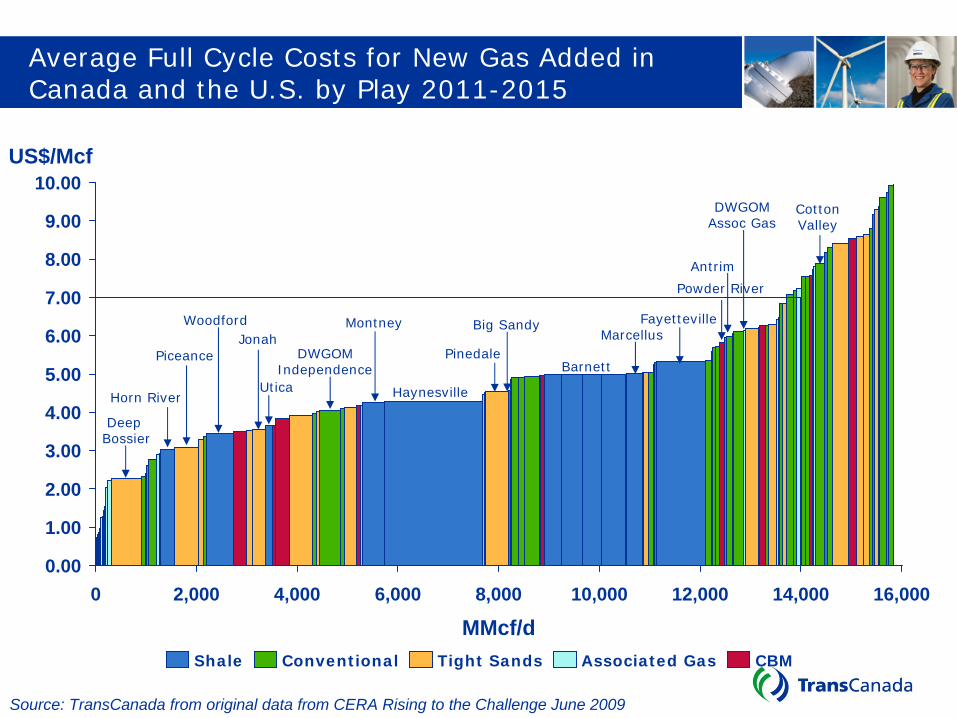
Source: TransCanada from original data from CERA Rising to the Challenge June 2009
Average Full Cycle Costs for New Gas Added in Canada and the U.S. by Play 2011-2015
Shale Conventional CBMAssociated GasTight Sands
Antrim
DWGOM Assoc Gas
FayettevilleMarcellus
Pinedale
Big Sandy
Barnett
Haynesville
Montney
DWGOM Independence
Jonah
Utica
Woodford
Piceance
Horn River
Deep Bossier
Cotton Valley
Powder River
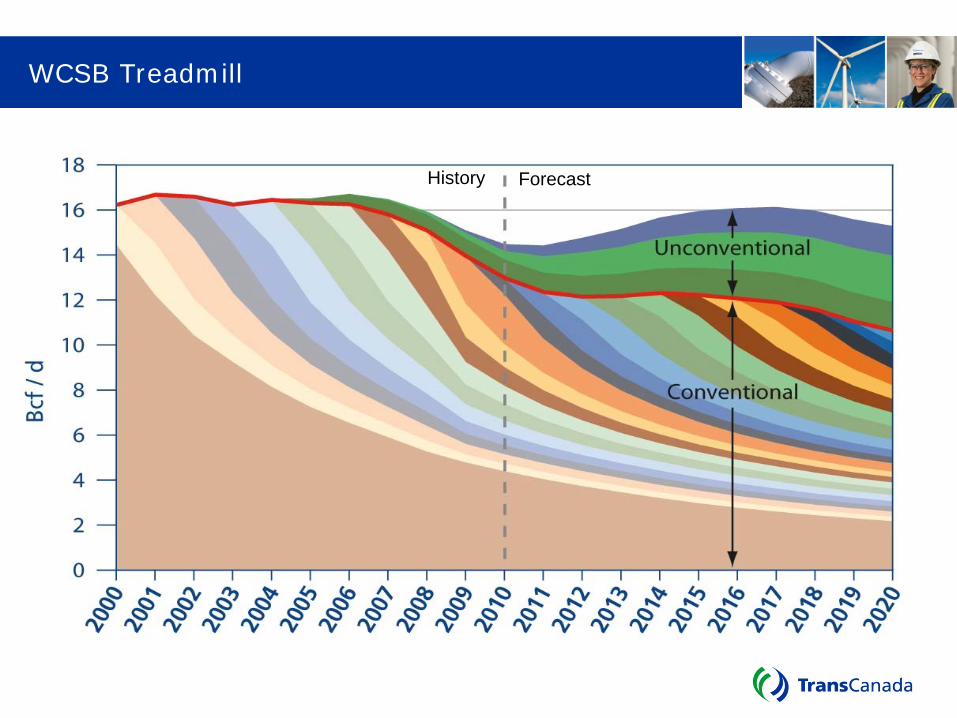
WCSB Treadmill
History Forecast
MMcf/d
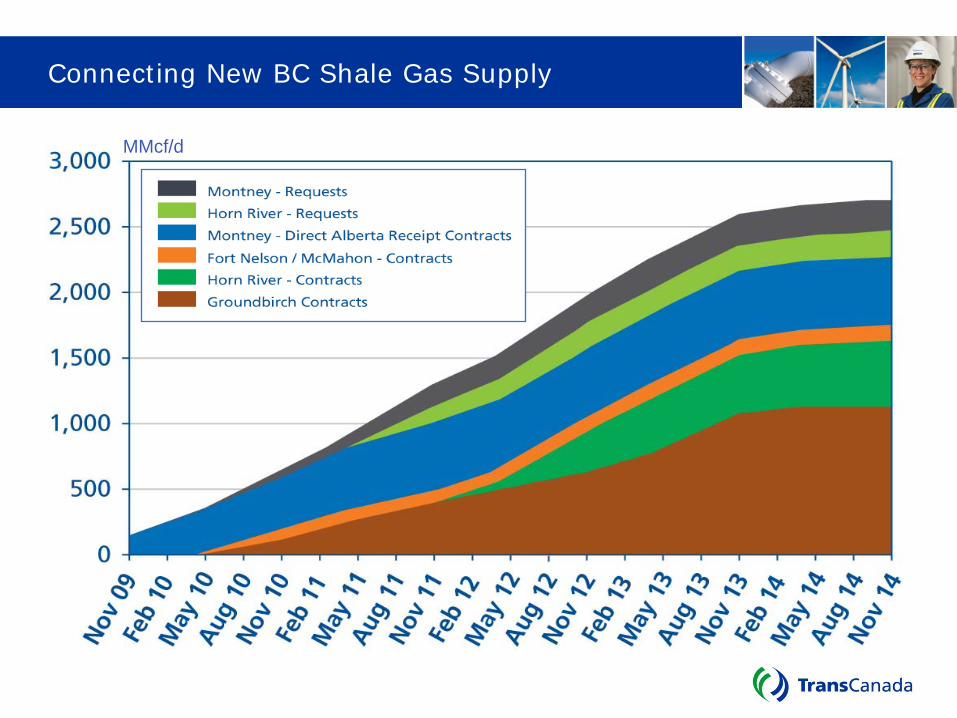
Connecting New BC Shale Gas Supply
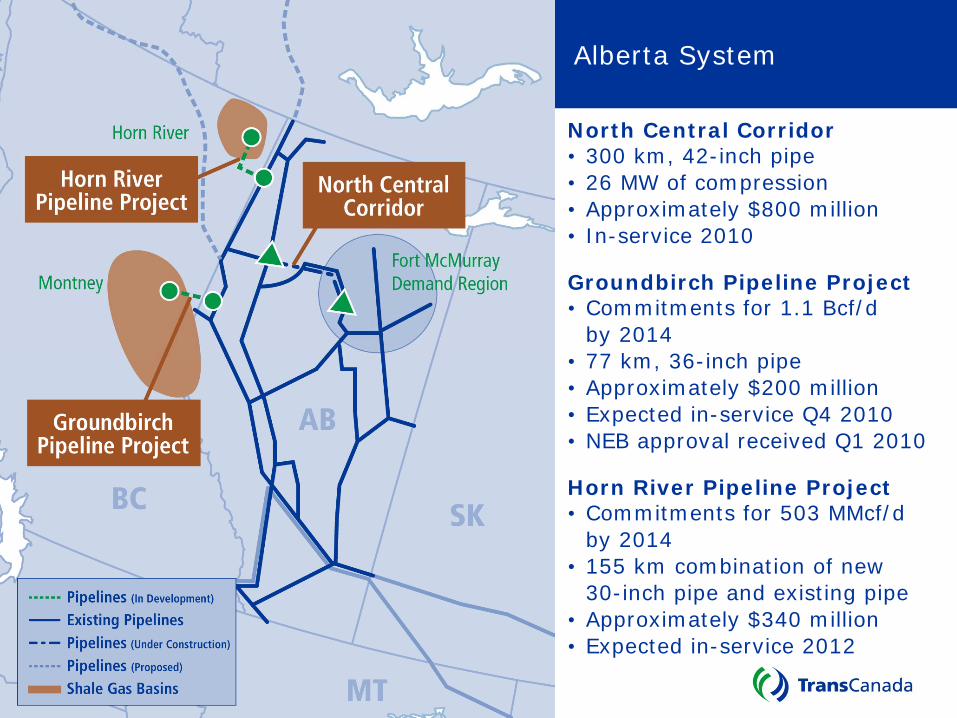
North Central Corridor • 300 km, 42-inch pipe• 26 MW of compression• Approximately $800 million• In-service 2010
Groundbirch Pipeline Project• Commitments for 1.1 Bcf/d
by 2014• 77 km, 36-inch pipe• Approximately $200 million• Expected in-service Q4 2010• NEB approval received Q1 2010
Horn River Pipeline Project• Commitments for 503 MMcf/d
by 2014• 155 km combination of new
30-inch pipe and existing pipe• Approximately $340 million• Expected in-service 2012
Alberta System
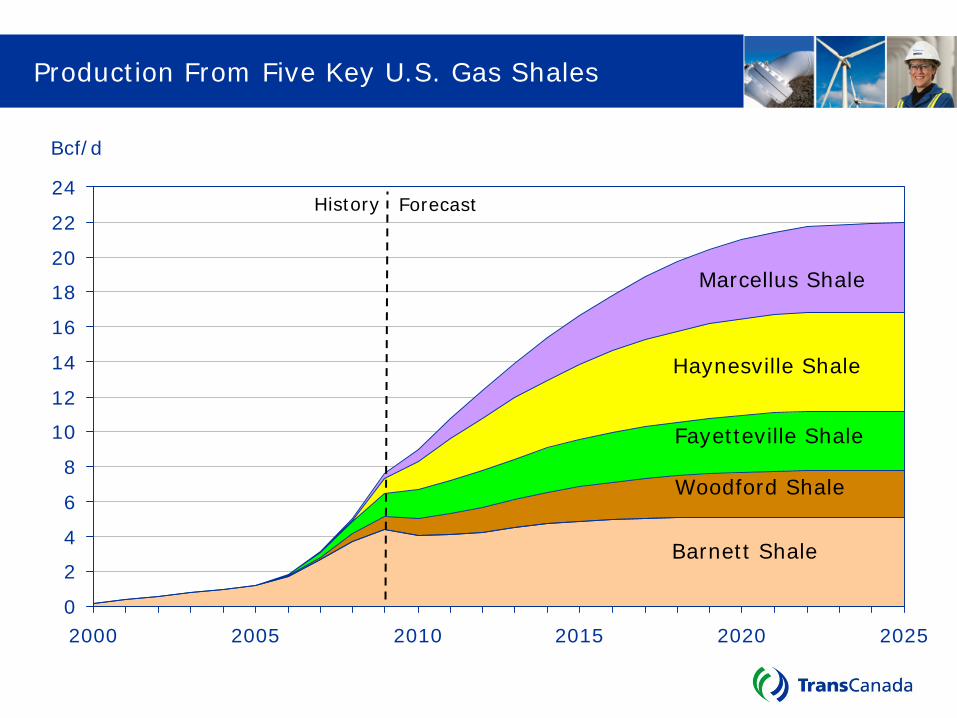
Production From Five Key U.S. Gas Shales
0
2
4
6
8
10
12
14
16
18
20
22
24
2000 2005 2010 2015 2020 2025
Bcf/d
Fayetteville Shale
History Forecast
Woodford Shale
Barnett Shale
Haynesville Shale
Marcellus Shale
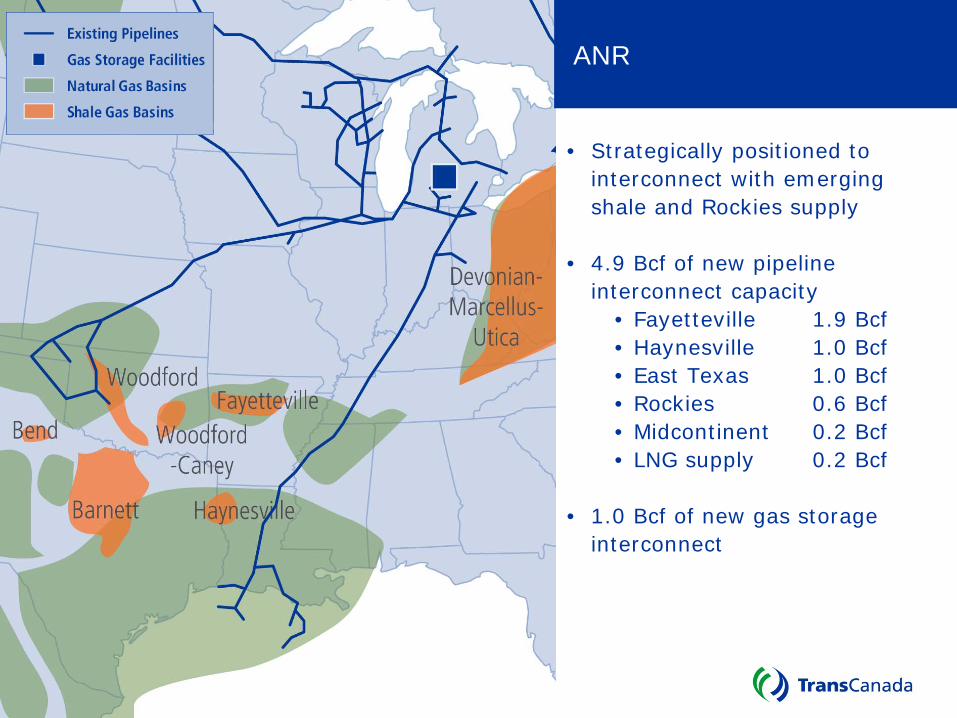
ANR
• Strategically positioned to interconnect with emerging shale and Rockies supply
• 4.9 Bcf of new pipeline interconnect capacity
• Fayetteville 1.9 Bcf• Haynesville 1.0 Bcf• East Texas 1.0 Bcf• Rockies 0.6 Bcf• Midcontinent 0.2 Bcf• LNG supply 0.2 Bcf
• 1.0 Bcf of new gas storage interconnect
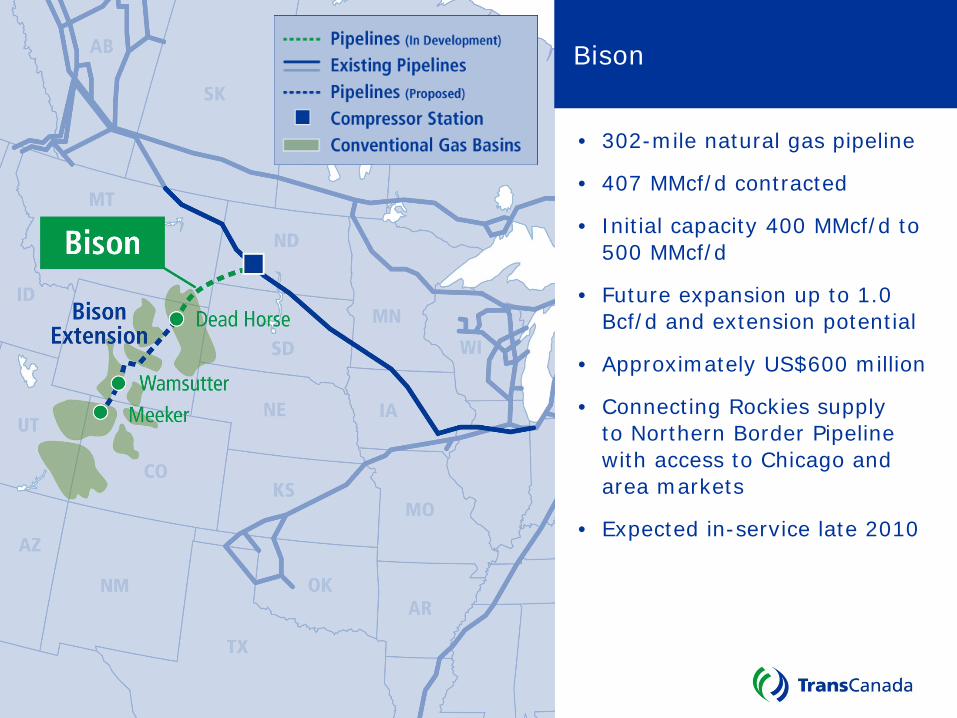
• 302-mile natural gas pipeline
• 407 MMcf/d contracted
• Initial capacity 400 MMcf/d to 500 MMcf/d
• Future expansion up to 1.0 Bcf/d and extension potential
• Approximately US$600 million
• Connecting Rockies supply to Northern Border Pipeline with access to Chicago and area markets
• Expected in-service late 2010
Bison
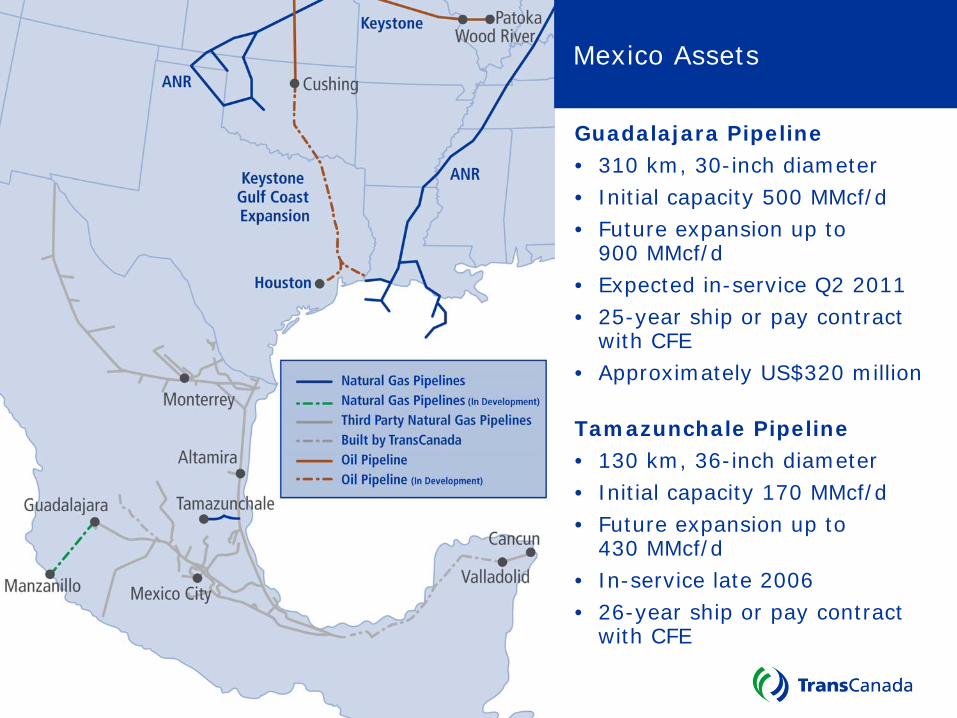
Guadalajara Pipeline• 310 km, 30-inch diameter• Initial capacity 500 MMcf/d• Future expansion up to
900 MMcf/d• Expected in-service Q2 2011• 25-year ship or pay contract
with CFE• Approximately US$320 million
Tamazunchale Pipeline• 130 km, 36-inch diameter• Initial capacity 170 MMcf/d• Future expansion up to
430 MMcf/d• In-service late 2006• 26-year ship or pay contract
with CFE
Mexico Assets
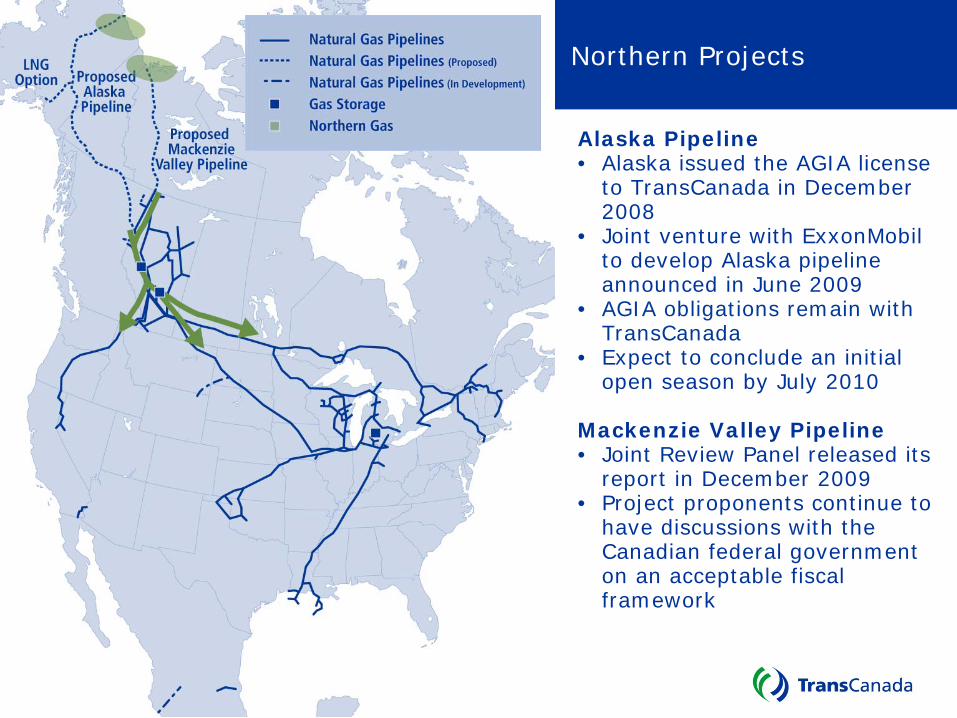
Alaska Pipeline • Alaska issued the AGIA license
to TransCanada in December 2008
• Joint venture with ExxonMobil to develop Alaska pipeline announced in June 2009
• AGIA obligations remain with TransCanada
• Expect to conclude an initial open season by July 2010
Mackenzie Valley Pipeline• Joint Review Panel released its
report in December 2009• Project proponents continue to
have discussions with the Canadian federal government on an acceptable fiscal framework
Northern Projects
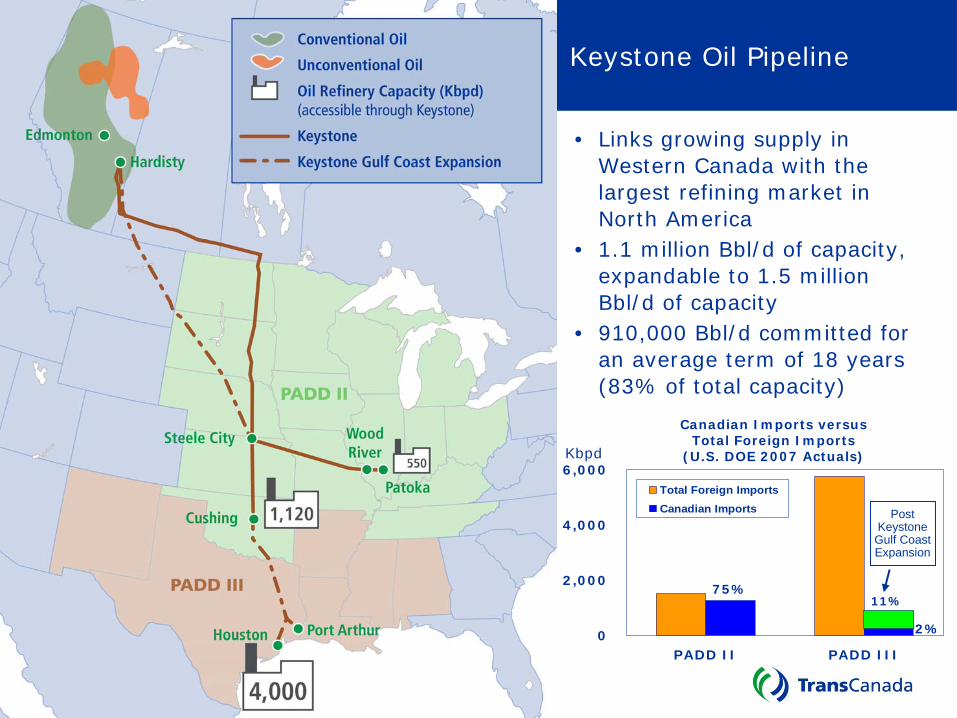
• Links growing supply in Western Canada with the largest refining market in North America
• 1.1 million Bbl/d of capacity, expandable to 1.5 million Bbl/d of capacity
• 910,000 Bbl/d committed for an average term of 18 years (83% of total capacity)
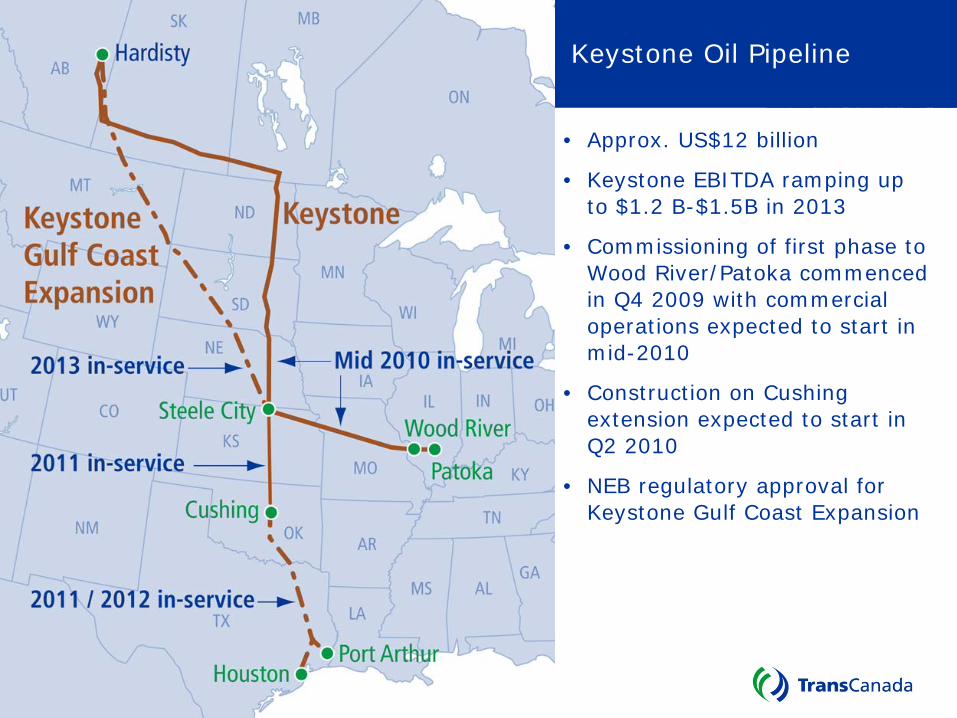
Keystone Oil Pipeline
75%
2% 0
2,000
4,000
6,000
PADD II PADD III
Total Foreign ImportsCanadian Imports
Canadian Imports versus Total Foreign Imports
(U.S. DOE 2007 Actuals)Kbpd
Post Keystone
Gulf Coast Expansion
11%
Keystone Oil Pipeline
• Approx. US$12 billion
• Keystone EBITDA ramping up to $1.2 B-$1.5B in 2013
• Commissioning of first phase to Wood River/Patoka commenced in Q4 2009 with commercial operations expected to start in mid-2010
• Construction on Cushing extension expected to start in Q2 2010
• NEB regulatory approval for Keystone Gulf Coast Expansion
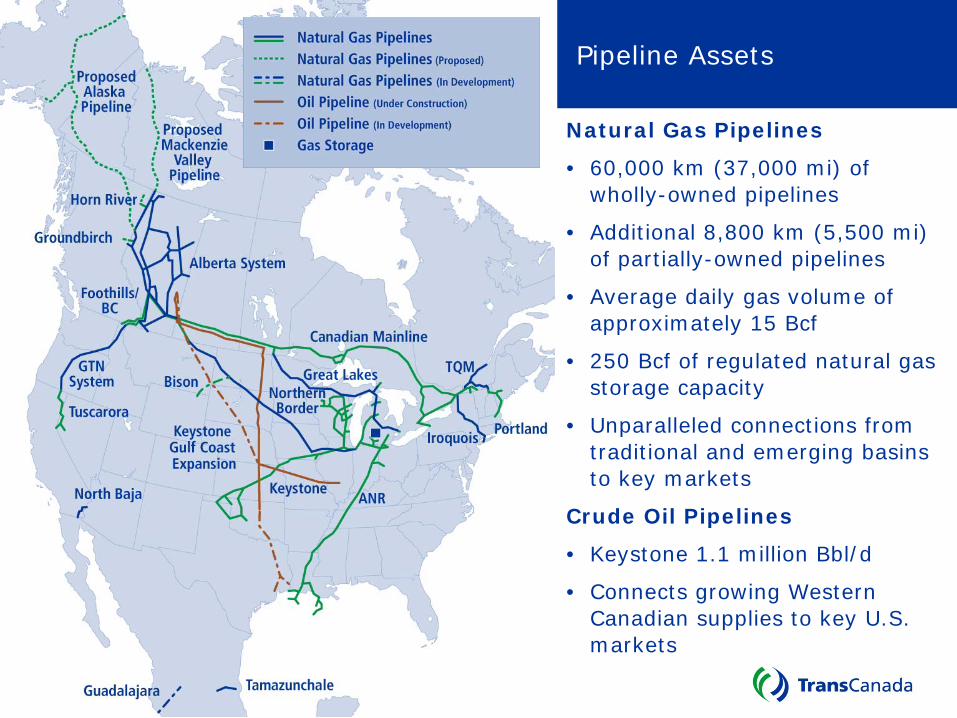
Natural Gas Pipelines
• 60,000 km (37,000 mi) of wholly-owned pipelines
• Additional 8,800 km (5,500 mi) of partially-owned pipelines
• Average daily gas volume of approximately 15 Bcf
• 250 Bcf of regulated natural gas storage capacity
• Unparalleled connections from traditional and emerging basins to key markets
Crude Oil Pipelines
• Keystone 1.1 million Bbl/d
• Connects growing Western Canadian supplies to key U.S. markets
Pipeline Assets