Embed Size (px)
Citation preview

ISSN 2457 – 5275 (Online, English) ISSN 1842 – 4074 (Print, Online, Romanian)
March 2016 Volume 22 Number 1 4 th Series
RoJAE
Romanian Journal of Automotive Engineering
The Journal of the Society of Automotive Engineers of Romania www.siar.ro www.ro-jae.ro
SIAR – Society of Automotive Engineers of Romania is member of:
FISITA - International Federation of Automotive Engineers Societies www.fisita.com
EAEC - European Automotive Engineers Cooperation
RoJAE
Romanian Journal of Automotive Engineering
Societatea Inginerilor de Automobile din România Society of Automotive Engineers of Romania
www.siar.ro SIAR – The Society of Automotive Engineers of Romania is the professional organization of automotive engineers, an independent legal entity, non-profit, active member of FISITA (Fédération Internationale des Sociétés d'Ingénieurs des Techniques de l'Automobile - International Federation of Automotive Engineering Societies) and EAEC (European Cooperation Automotive Engineers). Founded in January 1990 as a professional association, non-governmental, SIAR’s main objectives are: development and increase the exchange of professional information, promoting Romanian scientific research results, new technologies specific to automotive industry, international cooperation. Shortly after its constitution, SIAR was affiliated to FISITA - International Federation of Automotive Engineers and EAEC - European Conference of Automotive Engineers, thus ensuring full involvement in specific activities undertaken globally. In order to help promoting the science and technology in the automotive industry, SIAR is issuing 4 times a year RIA - Journal of Automotive Engineers (on paper in Romanian and electronically in Romanian and English). The organization of national and international scientific meetings with a large participation of experts from universities and research institutes and economic environment is an important part of SIAR’s. In this direction, SIAR holds an annual scientific event with a wide international participation. The SIAR annual congress is hosted successively by large universities that have ongoing programs of study in automotive engineering. Developing relationships with the economic environment is a constant concern. The presence in Romania of OEMs and their suppliers enables continuous communication between industry and academia. Actually, a constant priority in SIAR’s activity is to ensure optimal framework for collaboration between universities and research, industry and business specialists.
Honorary Committee of SIAR
Pascal CANDAU Renault Technologie Roumanie
www.renault-technologie-roumanie.com George-Adrian DINCA
Romanian Automotive Register www.rarom.ro
Florian MIHUT The National Union of Road Hauliers from Romania
www.untrr.ro Werner MOSER AVL Romania www.avl.com
The Society of Automotive Engineers of Romania President Adrian Constantin CLENCI University of Pitesti, Romania E-mail: Honorary President Mihai Eugen NEGRUS University „Politehnica” of Bucharest, Romania Vice-Presidents Cristian Nicolae ANDREESCU University „Politehnica” of Bucharest, Romania Nicolae BURNETE Technical University of Cluj-Napoca, Romania Anghel CHIRU „Transilvania” University of Brasov, Romania Victor OTAT University of Craiova, Romania Ion TABACU University of Pitesti, Romania General Secretary Minu MITREA Military Technical Academy of Bucharest, Romania

RoJAE
Romanian Journal of Automotive Engineering
CONTENTS
Volume 22, Issue No. 1 March 2016
Modelling and Simulation of Semi-Active Hybrid Control of Vehicle Suspension System with Magneto-Rheological Dampers Anjani Prasad Reddy BADAM, Lakshmi Annamalai KUMARASWAMIDHAS, Dipen Kumar RAJAK ++++++++++++++++++++++++++++++++++++..........
5
CO2 Emission Determination in Accord with European Regulation for Old and Today Cars Powered by Diesel Engines Nicolae ISPAS, Mircea NASTASOIU .........................................................................................
13
A CFD Approach for the Study of the In-Cylinder Air Motion Characteristics in a Motored Gasoline Engine George TRICA, Victor IORGA-SIMAN, Adrian CLENCI, Rodica NICULESCU, Alina TRICA ......
19
Computational Elements for Designing a Piston Steel Type Marius BARBU, Bogdan RADU, Radu CHIRIAC .........................................................................
31
Pollution Level Produced at Engine Start for a Hybrid Vehicle Bogdan BENEA .............................................................................................................................
39
Upon a Simple Method for Generating Transversal Profile of the Volumic Blower Rotor Used in Supercharging Internal Combustion Engines Iulian AGAPE, Lidia GAIGINSCHI, Radu GAIGINSCHI, Daniel BALTAGIU .................................
43
The collections of the journals of the Society of Automotive Engineers of Romania are avaibles at the Internet website www.ro-jae.ro. The Romanian Journal of Automotive Engineering is indexed/abstracted in Directory of Science, WebInspect, GIF - Institute for Information Resources, MIAR - Information Matrix for the Analysis of Journals - Barcelona University, Georgetown University Library, SJIF - Scientific Journal Impact Factor - Innovative Space of Scientific Research, DRJI - Directory of Research Journal Indexing - Solapur University, Platforma Editorială Română SCIPIO – UEFISCU, International Society of Universal Research in Sciences, Pak Academic Search, Index Copernicus International RoJAE 22(1) 1 – 52 (2016) ISSN 2457 – 5275 (Online, English) ISSN 1842 – 4074 (Print, Online, Romanian)
RoJAE
Romanian Journal of Automotive Engineering Editor in Chief Cornel STAN West Saxon University of Zwickau, Germany E-mail: [email protected] Executive Editor Nicolae ISPAS „Transilvania” University of Brasov, Romania E-mail: [email protected] Deputy Executive Editor Radu CHIRIAC University „Politehnica” of Bucharest, Romania E-mail: [email protected] Ion COPAE Military Technical Academy of Bucharest, Romania E-mail: [email protected] Stefan TABACU University of Pitesti, Romania E-mail: [email protected] Editors Ilie DUMITRU University of Craiova, Romania E-mail: [email protected] Marin Stelian MARINESCU Military Technical Academy of Bucharest, Romania E-mail: [email protected] Adrian SACHELARIE „Gheorghe Asachi” Technical University of Iasi, Romania E-mail: [email protected] Marius BATAUS University „Politehnica” of Bucharest, Romania E-mail: [email protected] Cristian COLDEA Technical University of Cluj-Napoca, Romania E-mail: [email protected] George DRAGOMIR University of Oradea, Romania E-mail: [email protected]
Advisory Editorial Board Dennis ASSANIS
University of Michigan, USA Rodica A. BARANESCU
Chicago College of Engineering, USA Michael BUTSCH
University of Applied Sciences, Konstanz, Germany Nicolae BURNETE
Technical University of Cluj-Napoca, Romania Giovanni CIPOLLA
Politecnico di Torino, Italy Felice E. CORCIONE
Engines Institute of Naples, Italy Georges DESCOMBES
Conservatoire National des Arts et Metiers de Paris, France Cedomir DUBOKA
University of Belgrade, Serbia Pedro ESTEBAN
Institute for Applied Automotive Research Tarragona, Spain Radu GAIGINSCHI
„Gheorghe Asachi” Technical University of Iasi, Romania Eduard GOLOVATAI-SCHMIDT
Schaeffler AG & Co. KG Herzogenaurach, Germany Peter KUCHAR
University for Applied Sciences, Konstanz, Germany Ioan-Mircea OPREAN
University „Politehnica” of Bucharest, Romania Nicolae V. ORLANDEA
University of Michigan, USA Victor OTAT
University of Craiova, Romania Andreas SEELINGER
Institute of Mining and Metallurgical Engineering, Aachen, Germany
Ulrich SPICHER Kalrsuhe University, Karlsruhe, Germany
Cornel STAN West Saxon University of Zwickau, Germany
Dinu TARAZA Wayne State University,USA
The Journal of the Society of Automotive Engineers of Romania www.ro-jae.ro www.siar.ro Copyright © SIAR Production office: The Society of Automotive Engineers of Romania (Societatea Inginerilor de Automobile din România) Universitatea „Politehnica” din Bucuresti, Facultatea de Transporturi, Splaiul Independentei Nr. 313 060042 Bucharest ROMANIA Tel.: +4.021.316.96.08 Fax: +4.021.316.96.08 E-mail: [email protected] Staff: Prof. Minu MITREA, General Secretary of SIAR Subscriptions: Published quarterly. Individual subscription should be ordered to the Production office. Annual subscription rate can be found at SIAR website http://www.siar.ro. The members of the Society of Automotive Engineers of Romania receive free a printed copy of the journal (in Romanian).
RoJAE vol. 22 no. 1 / March 2016 ISSN 2457 – 5275 (Online, English) Romanian Journal of Automotive Engineering ISSN 1842 – 4074 (Print, Online, Romanian)
5
MODELLING AND SIMULATION OF SEMI-ACTIVE HYBRID CONTROL OF VEHICLE
SUSPENSION SYSTEM WITH MAGNETO-RHEOLOGICAL DAMPERS
Anjani Prasad Reddy BADAM, Lakshmi Annamalai KUMARASWAMIDHAS, Dipen Kumar RAJAK*
Indian School of Mines, Dhanbad-826004 JH (INDIA)
(Received 17 December 2015; Revised 11 January 2016; Accepted 20 January 2016)
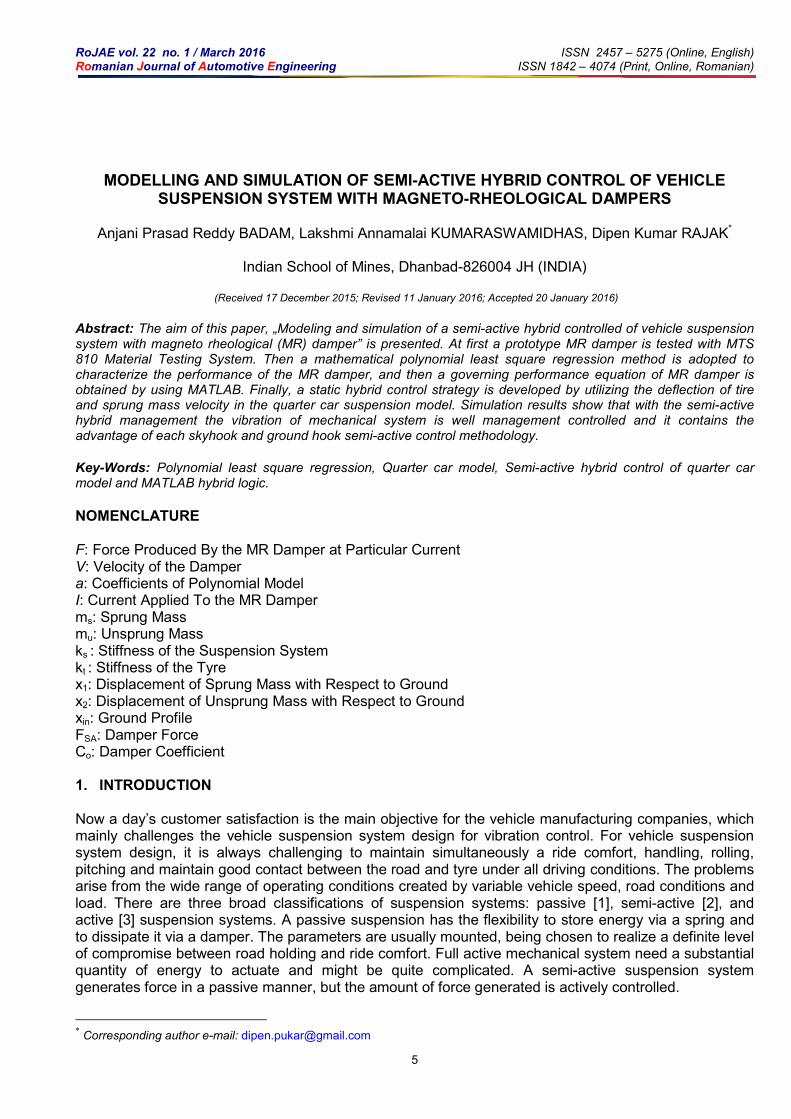
Abstract: The aim of this paper, „Modeling and simulation of a semi-active hybrid controlled of vehicle suspension system with magneto rheological (MR) damper” is presented. At first a prototype MR damper is tested with MTS 810 Material Testing System. Then a mathematical polynomial least square regression method is adopted to characterize the performance of the MR damper, and then a governing performance equation of MR damper is obtained by using MATLAB. Finally, a static hybrid control strategy is developed by utilizing the deflection of tire and sprung mass velocity in the quarter car suspension model. Simulation results show that with the semi-active hybrid management the vibration of mechanical system is well management controlled and it contains the advantage of each skyhook and ground hook semi-active control methodology.
Key-Words: Polynomial least square regression, Quarter car model, Semi-active hybrid control of quarter car model and MATLAB hybrid logic.
NOMENCLATURE
F: Force Produced By the MR Damper at Particular Current V: Velocity of the Damper a: Coefficients of Polynomial Model I: Current Applied To the MR Damper ms: Sprung Mass mu: Unsprung Mass ks : Stiffness of the Suspension System kt : Stiffness of the Tyre x1: Displacement of Sprung Mass with Respect to Ground x2: Displacement of Unsprung Mass with Respect to Ground xin: Ground Profile FSA: Damper Force Co: Damper Coefficient
1. INTRODUCTION
Now a day’s customer satisfaction is the main objective for the vehicle manufacturing companies, which mainly challenges the vehicle suspension system design for vibration control. For vehicle suspension system design, it is always challenging to maintain simultaneously a ride comfort, handling, rolling, pitching and maintain good contact between the road and tyre under all driving conditions. The problems arise from the wide range of operating conditions created by variable vehicle speed, road conditions and load. There are three broad classifications of suspension systems: passive [1], semi-active [2], and active [3] suspension systems. A passive suspension has the flexibility to store energy via a spring and to dissipate it via a damper. The parameters are usually mounted, being chosen to realize a definite level of compromise between road holding and ride comfort. Full active mechanical system need a substantial quantity of energy to actuate and might be quite complicated. A semi-active suspension system generates force in a passive manner, but the amount of force generated is actively controlled.
* Corresponding author e-mail: [email protected]

RoJAE vol. 22 no. 1 / March 2016 ISSN 2457 – 5275 (Online, English) Romanian Journal of Automotive Engineering ISSN 1842 – 4074 (Print, Online, Romanian)
6
The damping control is typically accomplished with an adjustable orifice or, as in this study, with a fixed orifice and a fluid with adjustable viscosity, such as a magneto-rheological (MR) fluid and electro-rheological (ER) fluid. Each of these types of suspension has different advantages and disadvantages. Active and semi active suspension provides good performance over passive suspension system. As the active suspension system requires heavy amount of power, demand is decreased. Since 1970s, semi-active suspensions have received much attention because of achieving desirable performance than passive suspensions and consume much less amount of power than that of active suspensions with same performance, especially when some controllable dampers such as electro-rheological (ER) dampers and magneto-rheological (MR) dampers are available in practice. Specially, MR dampers have found considerable attraction in vibration reduction of buildings, helicopter rotors, bridges, and vehicle suspensions [4] etc. In addition to this theoretical and experimental researches [5] have demonstrated that the choice of control strategy is very important in the performance of semi-active suspension system. These dampers are controlled electronically which increases the freedom such that one can specify the characteristics of handling and ride quality independently. Basically three types of control strategies are developed Skyhook, Ground hook; Hybrid semi active control strategies [6-10] are developed. Skyhook control strategy is effective in eliminating the compromise between resonance control and high frequency isolation. Ground hook control strategy is effective in controlling dynamic axle loading which results in excessive tire force and pavement damage. Ground hook controller strategy has found receiving within the space of serious truck vehicle dynamics. Recently, a Hybrid management strategy has developed that utilizes the linear combination of skyhook and ground hook ways, therefore Hybrid management strategy contain the advantages of each Sky hook and Ground hook. Hybrid control uses the deflection of tyre and velocity of sprung mass and gives required amount of damping force. Ride characteristics of a vehicle suspension system can be characterized by considering 2 degree of freedom quarter car model which can be used to investigate the performance of passive, semi-active and active suspension systems. In order to characterize the performance of MR damper several models have been proposed to describe their behaviour. These models are classified into parametric models which are represented by a mathematical functions whose coefficients are determined rheologically, i.e., the parametric values are manipulated until the quantitative results of the model closely matches the experimental data, and non-parametric models [11-12] which are entirely based on the elevated amount of the experimental data, obtained by observing the MR damper response to different excitations under varying operating conditions. Polynomial least square regression [13-18] model which is the curve fitting model is one of the best non-parametric models which depend exactly on the performance of MR damper [9, 14] so it gives the exact performance of the damper.
2. EXPERIMENTING AND MODELLING
Firstly magneto rheological fluid damper is tested with MTS 810 Material Testing System then a mathematical polynomial least square regression curve fitting method is used to characterize the performance of the MR damper using an experimental data. 2.1. EXPERIMENTAL TECHNIQUES The prototype MR damper used in this study is RD-1005-3. The MR damper is tested by using the MTS 810 Material Testing System. It has an upper and lower head with clampers that can hold the damper in place. The lower head is attached to the hydraulic cylinder that can move up and down. The upper head contains a load cell which is used to measure the force applied to the MR damper. The MR damper is first mounted in position by the clampers; primary tests are then conducted to measure the response of the damper under various loading conditions. In each test, the hydraulic actuator drives the lower head with a sinusoidal varying displacement of fixed frequency and constant amplitude, and the input current to the MR damper is maintained at constant level, while the upper head is held fixed. The excitation frequencies are 5, 10, 15, and 20Hz and the displacement amplitudes are 2.5, 5, 10 and 15mm, respectively. The applied input current is from 0 to 1A with increments of 0.25A. The damper force is measured and fed to a personal computer. For simple analysis, only the responses of the MR damper at 20 Hz and 15 mm excitation under five different input current is considered in this paper for calculating force versus displacement as shown in figure 1(a).

RoJAE vol. 22 no. 1 / March 2016 ISSN 2457 – 5275 (Online, English) Romanian Journal of Automotive Engineering ISSN 1842 – 4074 (Print, Online, Romanian)
7
The force versus velocity graph which is used to measure the force required for particular velocity of the vehicle suspension system can be obtained by differentiating displacement graph with respect to time, shown in figure 1(b). In the force versus velocity of the MR damper characteristics, we can see the hysteresis loop which depicts the properties of magnetic fields in the MR damper, with the increase of the applied electric current the damping force will increase, It can be seen that the increase of the damping force with the increase of applied electric current is high below 0.75A when compared to after 0.75A. It is also noted that the damper force is not exactly centred at zero. This is owing to presence of an accumulator in the MR damper, which is occupied with highly compressed air and because of the existence of air in the cylinder, the damper cannot be entirely engaged with MR fluid.
Figure 1. a) Experimental results (20Hz, 15mm) Force versus Displacement;
b) Experimental results (20Hz, 15mm) Force versus Velocity
2.2. POLYNOMIAL LEAST SQUARE REGRESSION
Polynomial least square regression model is used to study the experimental results of the magneto rheological fluid dampers. In this model hysteresis loop of MR damper’s force versus velocity graph is divided into upper loop and lower loop. Different polynomial models are developed for both upper and lower loops. Equations (1)-(8) are used for the generating polynomial model. Different Polynomial model with power of piston velocity is developed for each loop as follows [13, 15]:
∑=
==
nj
j
jj vaF
0
(1)
In the above equation, ‘a’ depends upon the current linearly so
jjj Icba += (2)
Now take n points on the both loops i=1, 2, 3I.n
∑=
==
nj
j
jiji vaF
0
(3)
201
)( ∑∑ ==
== −= mj
jjij
nii ir vaFS (4)
b) a)

RoJAE vol. 22 no. 1 / March 2016 ISSN 2457 – 5275 (Online, English) Romanian Journal of Automotive Engineering ISSN 1842 – 4074 (Print, Online, Romanian)
8
Find the coefficients j=0, 1, 2, 3...m to minimise
0)(201
=⋅−−=∂
∂∑∑ =
===
ki
mjj
jij
nii i
k
r vvaFa
S (5)
k=0, 1, 2, 3, 4I..m
jmj
jni
iki
ji
ki
nii i avvvF ∑ ∑∑ =
===
== =
0 11 (6)
FVVAV TA = (7)
=
mnnn
m
m
vvv
vvv
vvv
V
L
MMM
L
L
10
212
02
111
01
(8)
A = Coefficients matrix; F = Force matrix; V= velocity matrix. More points on the loop more the accuracy of the polynomial equation. In this paper we considered 17 points (m=16) in the upper and lower loops respectively and calculated the coefficients Matrix “A” for each loop using MATLAB, and generated the polynomial model for each loop. The results obtained through the polynomial models are shown below which depicts the same graph obtained through experiment (Figure 2).
Figure 2. Polynomial least square regression model results (20Hz, 15mm) Force versus Velocity

RoJAE vol. 22 no. 1 / March 2016 ISSN 2457 – 5275 (Online, English) Romanian Journal of Automotive Engineering ISSN 1842 – 4074 (Print, Online, Romanian)
9
3. SIMULATION OF SEMI-ACTIVE HYBRID CONTROL
3.1. QUARTER CAR VEHICLE SUSPENSION Semi active control policy known as hybrid control have been considered to take advantage of both skyhook and ground hook control. With hybrid control, the user has the ability to specify how closely the controller emulates skyhook or ground hook. The hybrid control configuration in quarter car suspension model is shown in Figure 3.
Figure 3. Schematic representation of hybrid configuration As the above configuration is not possible practically by attaching damper to both spring and unsprung mass separately to the reference point which is fixed to with respect to ground and translate with vehicle, but the same results are obtained by attaching semi active MR damper between the spring and unsprung mass and the configuration is depicted in Figure 4.
Figure 4. Schematic representation of modified hybrid configuration The force equations on the spring and unsprung masses are given below [16]
SAsos FxxkxxCxm −=−+−+ )()( 21211 &&&& (9)
SAintsou FxxkxxkxxCxm =−+−−−− )()()( 221212 &&&& (10)
By simulating the above equations in MATLAB Simulink the velocities of sprung ( ) and unsprung ( )
are obtained.
RoJAE vol. 22 no. 1 / March 2016 ISSN 2457 – 5275 (Online, English) Romanian Journal of Automotive Engineering ISSN 1842 – 4074 (Print, Online, Romanian)
10
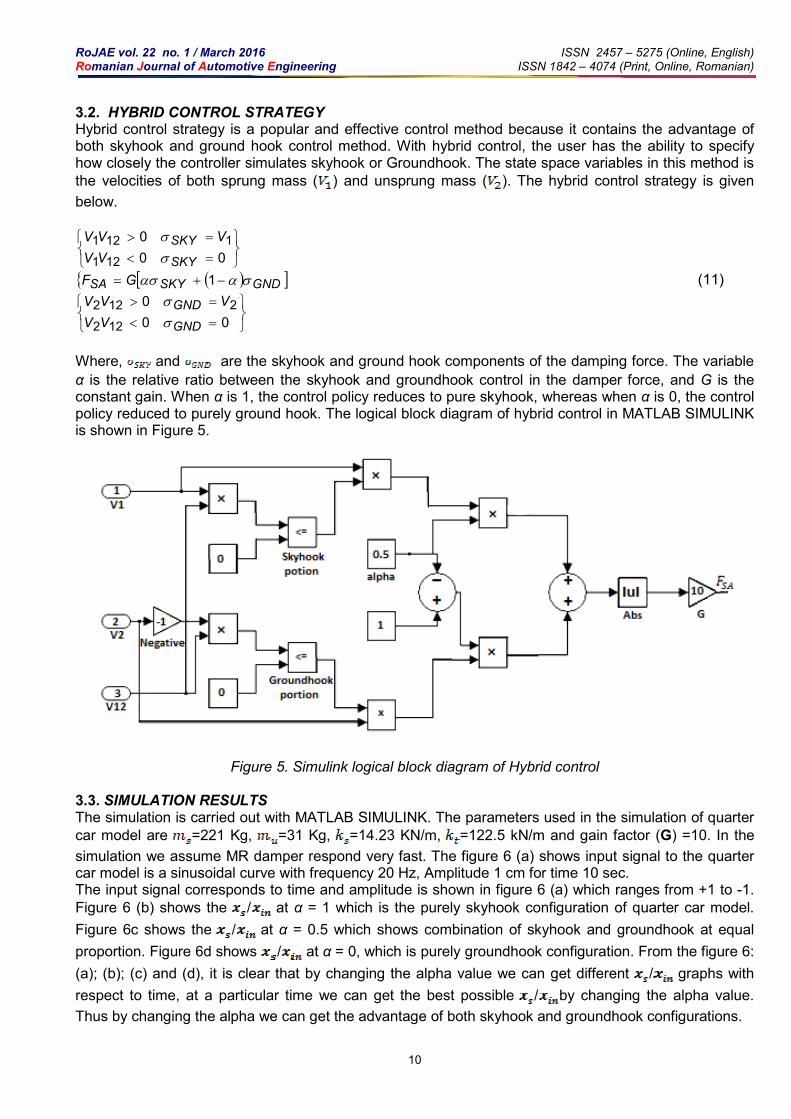
3.2. HYBRID CONTROL STRATEGY Hybrid control strategy is a popular and effective control method because it contains the advantage of both skyhook and ground hook control method. With hybrid control, the user has the ability to specify how closely the controller simulates skyhook or Groundhook. The state space variables in this method is
the velocities of both sprung mass ( ) and unsprung mass ( ). The hybrid control strategy is given
below.
=
=
<
>
00
0 1
121
121
SKY
SKY V
VV
VV
σ
σ
( )[ ]{ GNDSKYSA GF σαασ −+= 1 (11)
=
=
<
>
00
0 2
122
122
GND
GND V
VV
VV
σ
σ
Where, and are the skyhook and ground hook components of the damping force. The variable
α is the relative ratio between the skyhook and groundhook control in the damper force, and G is the constant gain. When α is 1, the control policy reduces to pure skyhook, whereas when α is 0, the control policy reduced to purely ground hook. The logical block diagram of hybrid control in MATLAB SIMULINK is shown in Figure 5.
Figure 5. Simulink logical block diagram of Hybrid control 3.3. SIMULATION RESULTS The simulation is carried out with MATLAB SIMULINK. The parameters used in the simulation of quarter
car model are =221 Kg, =31 Kg, =14.23 KN/m, =122.5 kN/m and gain factor (G) =10. In the
simulation we assume MR damper respond very fast. The figure 6 (a) shows input signal to the quarter car model is a sinusoidal curve with frequency 20 Hz, Amplitude 1 cm for time 10 sec. The input signal corresponds to time and amplitude is shown in figure 6 (a) which ranges from +1 to -1.
Figure 6 (b) shows the / at α = 1 which is the purely skyhook configuration of quarter car model.
Figure 6c shows the / at α = 0.5 which shows combination of skyhook and groundhook at equal
proportion. Figure 6d shows / at α = 0, which is purely groundhook configuration. From the figure 6:
(a); (b); (c) and (d), it is clear that by changing the alpha value we can get different / graphs with
respect to time, at a particular time we can get the best possible / by changing the alpha value.
Thus by changing the alpha we can get the advantage of both skyhook and groundhook configurations.

RoJAE vol. 22 no. 1 / March 2016 ISSN 2457 – 5275 (Online, English) Romanian Journal of Automotive Engineering ISSN 1842 – 4074 (Print, Online, Romanian)
11
Figure 6. a): Input signal; b): / response at α = 1;
c): / response at α = 0.5; d): / response at α = 0
4. CONCLUSION
Based on the experiment investigation for the MR damper, it has been shown that the MR damper has a very broad changeable damping force range under magnetic field and the damping coefficient increases with the electric current, but decreases with excitation amplitude. The polynomial least square model is the easiest curve fitting model. The polynomial least square model obtained from the experimental results correctly fit into the performance of the MR damper. The semi-active hybrid control scheme developed for vehicle suspension with MR damper can be realized more conveniently in practice. It contains the advantage of both Skyhook and Groundhook control method at a time. The proper selection of MR damper model together with a suitable chosen control strategy will make the application of MR dampers successful in various fields.
c) d)
a) b)
RoJAE vol. 22 no. 1 / March 2016 ISSN 2457 – 5275 (Online, English) Romanian Journal of Automotive Engineering ISSN 1842 – 4074 (Print, Online, Romanian)
12
REFERENCES
[1] Sharp, R. S. and Hassan, S. A., Evaluation of passive automotive suspension systems with variable stiffness and damping parameters, Vehicle System Dynamics, vol. 15(6), pag. 335-350, 1986. [2] Cebon, D., Besinger, F. H., and Cole, D. J., Control strategies for semi active lorry suspensions, Procedia of the Institution of Mechanical Engineers, Part D: Journal of Automobile Engineering, vol. 210, pag. 161-178, 1996. [3] Wilson, D. A., Sharp, R. S., and Hassan, S. A., The application of linear optimal control theory to the design of active automotive suspension, Vehicle. System Dynamics, vol. 15, pag. 105– 118, 1986. [4] Yao, G. Z., Yap, F. F., Chen, G., Li, W. H., and Yeo, S. H., MR damper and it application for semi-active control of vehicle suspension system, Mechatronics, vol. 12, pag. 963-973, 2012. [5] Winslow, W. M., Methods and means of translating electrical impulses into mechanical force, US Patent, 21 47 750, 1947. [6] Boelter, R., and Janocha, H., Performance of long-stroke and low-stroke MR fluid damper, Proceedings of SPIE, Passive Damping and Isolation, pag. 303-313, 1998. [7] Pare, C. A., Experimental evaluation of semi active magneto rheological suspensions for passenger vehicles, Master’s Thesis, 17-29, 1998. [8] Shen, Y., Golnaraghi, M. F., and Heppler, G. R., Semi-active Vibration Control Schemes for Suspension Systems Using Magneto rheological Dampers, Journal of Vibration and Control, vol. 12(1), pag. 3–24, 2006. [9] Jansen, L. M., and Dyke, S. J., Semi active control strategies for MR dampers: comparative study, Journal of Engineering Mechanics, vol. 126 (8), pag. 795–803, 2000. [10] Du, H., Sze, K. Y., and Lam, J., Semi active hybrid control of vehicle suspension with magneto-rheological dampers, Journal of sound and vibration, vol. 283, pag. 981-996, 2005. [11] Du, H., Lam, J., and Zhang, N., Modelling of a magneto-rheological damper by evolving radial basis function networks, Engineering Applications of Artificial Intelligence, vol. 19, pag. 869–88, 2006. [12] Patel, C. B., Gohil, P. P., and Borhade, B., Modelling and vibration analysis of a road Profile measuring system, Mechanical Engineering, vol. 1, pag. 13-28, 2010. [13] Butz, T., and Stryk, O. V., Modelling and Simulation of ER and MR Fluid Dampers, Journal of Applied Mathematics and Mechnaics, vol. 82, pag. 3-20, 2002. [14] Spencer, B. F., Dyke, S. J., Sain, M. K., and Carlson, J. D., Phenomenological model for magneto rheological dampers, Journal of Engineering Mechanics, vol. 123(3), pag. 230-238, 1997. [15] Kreyszig, E., Advanced Engineering mathematics, 10th edition, 872-876. [16] Dong, X., Yu, M., Liao, C., and Chen, W., Comparative research on semi-active control strategies for magneto-rheological suspension, Nonlinear Dyn, vol. 59, pag. 433–453, 2010. [17] Grewal, B. S., Higher Engineering Mathematics, 41st edition, 908-912. [18] Nigam, N.C., and Narayanan, S., Applications of random vibrations, Berlin, Springer, 1994.

RoJAE vol. 22 no. 1 / March 2016 ISSN 2457 – 5275 (Online, English) Romanian Journal of Automotive Engineering ISSN 1842 – 4074 (Print, Online, Romanian)
13
CO2 EMISSION DETERMINATION IN ACCORD WITH EUROPEAN REGULATION FOR OLD
AND TODAY CARS POWERED BY DIESEL ENGINES
Nicolae ISPAS*, Mircea NASTASOIU
Transilvania University of Brasov, Str. Politehnica, No. 1, 500024 Brasov, Romania
(Received 15 July 2015; Revised 08 September 2015; Accepted 29 January 2016)
Abstract: The paper analyzes multiple regulate relationships between combustion in car’s engines, emissions limits (including CO2 emissions) and fuel consumption. The investigation was extending both to older engines powered cars and today engines Diesel powered cars. Fuel quality specifications were also correlated to emissions and fuel consumption of actual and older cars with Diesel engines. Different fuel proprieties were used in experimental research for estimate the influence over Diesel engine CO2 emissions and fuel consumption. One main contribution of this paper is a new procedure to determine a better estimation of the carbon dioxide limits for cars with Diesel engines in accordance with car engine generation and European emission legal framework. The paper’s conclusions can be used in future regulation development for a better determination of the CO2 emissions.
Key-Words: Carbon dioxide emissions, Fuel consumptions, European regulations, Atmospheric pollutants
1. INTRODUCTION European emission standards define the acceptable limits for exhaust emissions of new vehicles sold in EU member states. The emission standards are defined in a series of European Union Directives staging the progressive introduction of increasingly stringent standards (Directive 715/2007/EC). Currently, emissions of carbon monoxide (CO), nitrogen oxides (NOx), hydrocarbon plus nitrogen oxides (HC+NOx) and particulate matter (PM) are regulated for most terrestrial vehicle types. For each vehicle type, different standards apply. Compliance is determined by running the vehicle at a standardized test cycle. Non-compliant vehicles cannot be sold in the EU, but new standards do not apply to vehicles already on the roads. No use of specific technologies is mandated to meet the standards, though available technology is considered when setting the standards. New models introduced must meet current or planned standards, but minor lifecycle model revisions may continue to be offered with pre-compliant engines. The vehicles chemical toxic emission stages and European legal framework are brief describes in the followings: The stages are typically referred to as Euro 1, Euro 2, Euro 3, Euro 4, Euro 5 and Euro 6 for Light Duty Vehicle standards. The corresponding series of standards for Heavy Duty Vehicles use Roman, uses rather than Arabic numerals (Euro I, Euro II, etc.) (Directive 715/2007/EC). The legal framework consists in a series of directives, each one as amendment to the 1970 Directive 70/220/EEC.
Below is a summary list (Directive 715/2007/EC) of the standards, when they come into force, what they apply to, and which EU directives provide the definition of the standard.
• Euro 1 (1993): for passenger cars - Directive 91/441/EEC; Also for passenger cars and light trucks - Directive 93/59/EEC.
• Euro 2 (1996): for passenger cars - Directive 94/12/EC (& Directive 96/69/EC); For motorcycle - Directive 2002/51/EC - Directive 2006/120/EC.
• Euro 3 (2000): for any vehicle - Directive 98/69/EC; For motorcycle - Directive 2002/51/EC - Directive 2006/120/EC.
• Euro 4 (2005): for any vehicle - Directive 98/69/EC (&Directive 2002/80/EC).
• Euro 5 (2008/9) and Euro 6 (2014): for light passenger and commercial vehicles - Directive 715/2007/EC.
In the table 1 are presented the chemical emission limits in respect for each directive above mentioned, for passenger cars powered by Diesel Engine.
* Corresponding author e-mail: [email protected]
RoJAE vol. 22 no. 1 / March 2016 ISSN 2457 – 5275 (Online, English) Romanian Journal of Automotive Engineering ISSN 1842 – 4074 (Print, Online, Romanian)
14
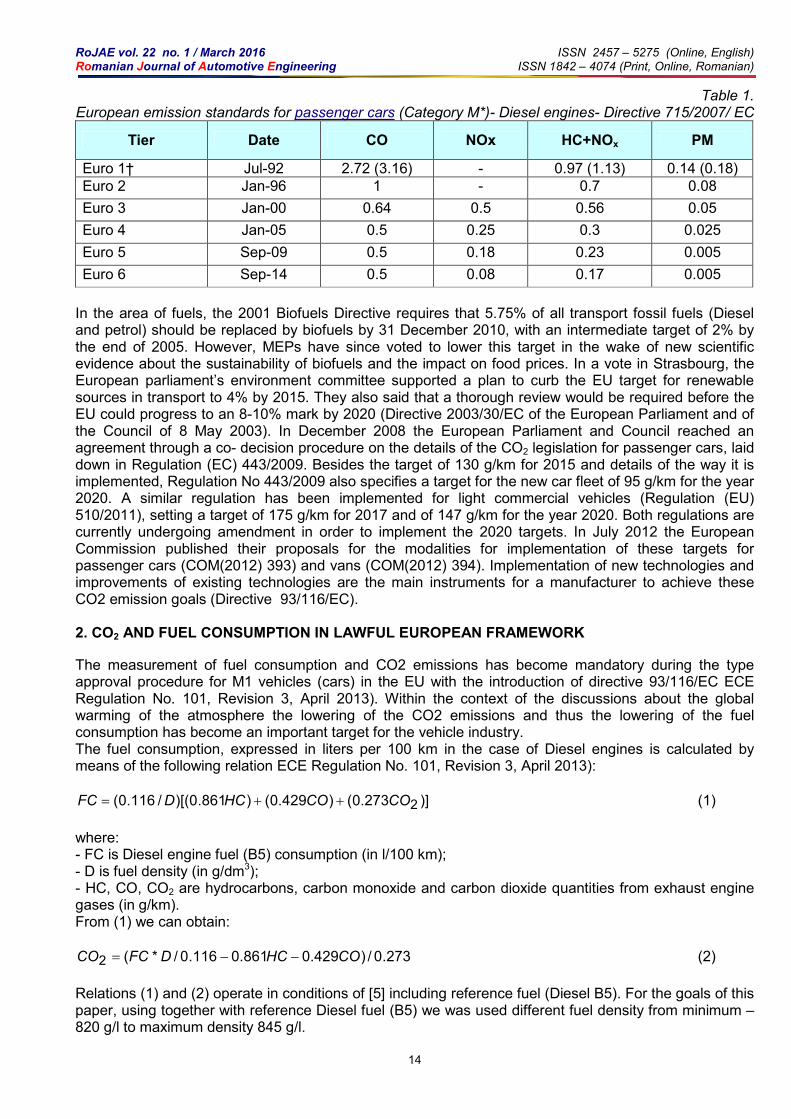
Table 1. European emission standards for passenger cars (Category M*)- Diesel engines- Directive 715/2007/ EC
Tier Date CO NOx HC+NOx PM
Euro 1† Jul-92 2.72 (3.16) - 0.97 (1.13) 0.14 (0.18)
Euro 2 Jan-96 1 - 0.7 0.08
Euro 3 Jan-00 0.64 0.5 0.56 0.05
Euro 4 Jan-05 0.5 0.25 0.3 0.025
Euro 5 Sep-09 0.5 0.18 0.23 0.005
Euro 6 Sep-14 0.5 0.08 0.17 0.005
In the area of fuels, the 2001 Biofuels Directive requires that 5.75% of all transport fossil fuels (Diesel and petrol) should be replaced by biofuels by 31 December 2010, with an intermediate target of 2% by the end of 2005. However, MEPs have since voted to lower this target in the wake of new scientific evidence about the sustainability of biofuels and the impact on food prices. In a vote in Strasbourg, the European parliament’s environment committee supported a plan to curb the EU target for renewable sources in transport to 4% by 2015. They also said that a thorough review would be required before the EU could progress to an 8-10% mark by 2020 (Directive 2003/30/EC of the European Parliament and of the Council of 8 May 2003). In December 2008 the European Parliament and Council reached an agreement through a co- decision procedure on the details of the CO2 legislation for passenger cars, laid down in Regulation (EC) 443/2009. Besides the target of 130 g/km for 2015 and details of the way it is implemented, Regulation No 443/2009 also specifies a target for the new car fleet of 95 g/km for the year 2020. A similar regulation has been implemented for light commercial vehicles (Regulation (EU) 510/2011), setting a target of 175 g/km for 2017 and of 147 g/km for the year 2020. Both regulations are currently undergoing amendment in order to implement the 2020 targets. In July 2012 the European Commission published their proposals for the modalities for implementation of these targets for passenger cars (COM(2012) 393) and vans (COM(2012) 394). Implementation of new technologies and improvements of existing technologies are the main instruments for a manufacturer to achieve these CO2 emission goals (Directive 93/116/EC). 2. CO2 AND FUEL CONSUMPTION IN LAWFUL EUROPEAN FRAMEWORK
The measurement of fuel consumption and CO2 emissions has become mandatory during the type approval procedure for M1 vehicles (cars) in the EU with the introduction of directive 93/116/EC ECE Regulation No. 101, Revision 3, April 2013). Within the context of the discussions about the global warming of the atmosphere the lowering of the CO2 emissions and thus the lowering of the fuel consumption has become an important target for the vehicle industry. The fuel consumption, expressed in liters per 100 km in the case of Diesel engines is calculated by means of the following relation ECE Regulation No. 101, Revision 3, April 2013):
)]273.0()429.0()861.0)[(/116.0( 2COCOHCDFC ++= (1)
where: - FC is Diesel engine fuel (B5) consumption (in l/100 km); - D is fuel density (in g/dm3); - HC, CO, CO2 are hydrocarbons, carbon monoxide and carbon dioxide quantities from exhaust engine gases (in g/km). From (1) we can obtain:
273.0/)429.0861.0116.0/*(2 COHCDFCCO −−= (2)
Relations (1) and (2) operate in conditions of [5] including reference fuel (Diesel B5). For the goals of this paper, using together with reference Diesel fuel (B5) we was used different fuel density from minimum – 820 g/l to maximum density 845 g/l.

RoJAE vol. 22 no. 1 / March 2016 ISSN 2457 – 5275 (Online, English) Romanian Journal of Automotive Engineering ISSN 1842 – 4074 (Print, Online, Romanian)
15
For the aim of this paper we calculate CO2 emissions for both older (after 1993) cars and today cars in followings assumptions:
• All the cars are powered by Diesel engines.
• All the cars are in good technical condition, emission for each one do not exceed correspondent EURO limits.
• For CO2 emission calculus each engine operates with HC and CO values in engine exhaust gases like EURO correspondent Table 1 values.
• Each vehicle was link with an amount of fuel consumption. Fuel consumption was varied from 2 to 14 (l/100 km) with 0.5 l/km steep.
• CO2 emission was calculating for both B5 Diesel fuel (with density 820 g/l)) and B Diesel fuel (with density 845 g/l).
• We assume not engine trouble by feed of B5 Diesel fuel even for older cars.
3. RESULTS AND DISCUSSIONS
In figures 1 - 6 we presents the results of CO2 emissions calculus (for cars with engines fuelled by Diesel B5 with 820 g/l and 845 g/l densities.
Figure 1. CO2 emissions for EURO 1 cars
Figure 2. CO2 emissions for EURO 2 cars

RoJAE vol. 22 no. 1 / March 2016 ISSN 2457 – 5275 (Online, English) Romanian Journal of Automotive Engineering ISSN 1842 – 4074 (Print, Online, Romanian)
16
Figure 3. CO2 emissions for EURO 3 cars
Figure 4. CO2 emissions for EURO 4 cars
Figure 5. CO2 emissions for EURO 5 cars

RoJAE vol. 22 no. 1 / March 2016 ISSN 2457 – 5275 (Online, English) Romanian Journal of Automotive Engineering ISSN 1842 – 4074 (Print, Online, Romanian)
17
Figure 6. CO2 emissions for EURO 6 cars If each amount of fuel consumption is associate by a car, in above hypothesis, the amount of calculate CO2 was representing “best case” for each vehicle operating CO2 emission. Finally, the paper analyzes multiple regulate relationships between car-engines positive ignitions emissions limits (including CO2 emissions) and fuel consumption. The investigation was extending both to older Diesel engines powered cars and today Diesel engines powered cars. Fuel quality specifications were also correlated to emissions and fuel consumption of actual and older cars with Diesel engines. If all carbon of fuel combustion into CO2, in cylinder engine, the combustion of air-fuel is complete and engine efficiency is a maximum value. In this case in exhaust gasses can find only carbon dioxide, water and nitrous oxides. This is an ideal case a “worst case” from point of view of CO2 emissions. 4. CONCLUSION
The main conclusion of paper are:
• For an older car, with same fuel consumption as a new car, the CO2 emissions are lowest than CO2 emissions of new car.
• New technologies and materials can reduce fuel consumption and, in the same time, CO2 emissions.
• Reference drives cycle affect CO2 emissions. Gear shift strategy, driver behavior an use of air conditioning system also have influence on CO2 emissions.
• Fuel qualities affect direct the amount of CO2 emissions. For older car, using B5 of fuels, if no technical trouble occurs, feeding by B5 can mean an important reduction of CO2 emissions.
• The main way for reduce CO2 emissions remain the diminishing of engine fuel consumption.
REFERENCES
[1] *** Directive 715/2007/EC. [2] *** Directive 2003/30/EC of the European Parliament and of the Council of 8 May 2003, On the promotion of the use of biofuels or other renewable fuels for transport. [3] *** Directive 93/116/EC, 2009. [4] *** ECE Regulation No. 101, Revision 3, April 2013. The work was presented at the European Automotive Congress - EAEC-ESFA 2015, 25 – 27 November 2015, Bucharest, Romania.

RoJAE vol. 22 no. 1 / March 2016 ISSN 2457 – 5275 (Online, English) Romanian Journal of Automotive Engineering ISSN 1842 – 4074 (Print, Online, Romanian)
18
RoJAE vol. 22 no. 1 / March 2016 ISSN 2457 –5275 (Online, English) Romanian Journal of Automotive Engineering ISSN 1842 – 4074 (Print, Online, Romanian)
19
A CFD APPROACH FOR THE STUDY OF THE IN-CYLINDER AIR MOTION CHARACTERISTICS IN A MOTORED GASOLINE ENGINE
George TRICĂ1)2)*, Victor IORGA-SIMAN1), Adrian CLENCI1)3), Rodica NICULESCU1), Alina TRICĂ1)2)
1) University of Piteşti, Str. Târgu din Vale No. 1, 110040 Pitesti, Romania
2) Renault Technologie Roumanie, Bucharest, Romania 3) Le CNAM Paris, France
(Received 23 December 2015; Revised 20 January 2016; Accepted 30 January 2016)
Abstract: The improvement of spark ignition engine efficiency plays a fundamental role in order to meet regulatory and customer demands. Given this context, the optimization of the in-cylinder flow organization is of paramount importance. Coupling a 3D Computational Fluid Dynamics (CFD) tool with a rigorous method of decision making is becoming indispensable in the design process of complex systems, as internal combustion engines. In the present study, the internal aerodynamics and gas exchange phenomena of a motored single-cylinder transparent gasoline engine are examined. For this purpose, a three dimensional CFD approach with dynamic mesh was used. Experimentation was also performed in order to obtain data to set the initial and boundary conditions and to validate the CFD model. The results provide important insights into the internal flow circulation: how the air charge is inducted into the engine, what the flow characteristics are and how they change with time and geometry in the engine. Thus, by resuming this paper’s objective is to present a CFD approach for assessing the internal aerodynamics of a particular engine.
Key-Words: gasoline engine, internal aerodynamics, gas exchange phenomena, CFD simulation
NOMENCLATURE BC Boundary Condition CFD Computational Fluid Dynamics LDV Laser Doppler Velocimetry PIV Particle Image Velocimetry GUI Graphical User Interface FEP Fame Engine Plus ºCA Crank angle degree TKE Turbulence kinetic energy EVO Exhaust valve opening IVO Intake valve opening EVC Exhaust valve closing IVC Intake valve closing TDC Top dead center BDC Bottom dead center Turbulence model notations: ζ Normalized wall-normal velocity scale κ Turbulent Kinetic Energy, TKE [m2.s-2] ν Fluid kinematic viscosity ω Turbulent dissipation f Elliptic relaxation function LES Large Eddy Simulation RANS Reynolds-Averaged Navier Stokes RNG Re-Normalisation Group SST Shear Stress Transport y Dimensionless wall distance
* Corresponding author e-mail: [email protected]

RoJAE vol. 22 no. 1 / March 2016 ISSN 2457 –5275 (Online, English) Romanian Journal of Automotive Engineering ISSN 1842 – 4074 (Print, Online, Romanian)
20
1. INTRODUCTION The worldwide concern about the environmental impact of energy conversion systems is the cause of the imposition of strict government regulations relevant to pollutant emissions and fuel-efficiency standards of vehicles. Nowadays, one of the preferred route towards the reduction of both engine exhaust noxious emissions and fuel consumption remains the control of the mixture formation and combustion processes taking place within the engine’s cylinders. This is a very complicated task, affected by many variables, amongst which we mention only the ones that affects the engine’s internal aerodynamics: design of the manifolds, combustion chamber shape, piston, stroke value etc. To investigate an engine’s internal aerodynamics, experimental and numerical approaches can be used. An overview of the types of measurements employed in this field is given in Refs. [1][2]. Thus, measurements of the velocity field in steady flow test rigs or transparent engine test benches, using single-point systems, such as hot-wire anemometry or Laser Doppler velocimetry (LDV) and/or full field endoscopic imaging for particle image velocimetry (PIV) are quite often employed. Generally, these techniques are able to provide high quality results (even the spatial structure and the temporal revolution of the velocity field [3]) but require good optical access (quartz piston window and cylinder ring) for large fields of view, high speed photography, innovative data analysis methods, and state-of-the-art equipment, which makes them quite expensive. Performing flow measurements in an engine can therefore be difficult because of the complexity of the equipment involved. The high cost and time needed to achieve optimization through bench testing alone has drawn interest of engine developers towards the use of Computational Fluid Dynamics (CFD), codes relying on RANS (Reynolds-Averaged Navier Stokes) analyses. The advantage of numerical investigations is that an expensive and time-consuming measurement set-up is not necessary. Thanks to the increasing power of computers, nowadays the processes occurring in an internal combustion engine can be modeled more and more accurately and simulated faster. This particular study is part of a larger research program, which concerns the improvement of the gasoline engine’s operation by improving the internal aerodynamics. Experimental and numerical approaches are equally employed. For the experimental part, PIV technique is used on a single cylinder transparent motored engine. A first stage of this program is to see the agreement between the numerical results obtained via CFD approach and the experimental data given by PIV technique [4]. In the present study, only the results of a 3D CFD simulation of the motored/driven engine are examined. The gas exchange phenomena (i.e. normal flow, backflow, internal EGR (exhaust gas recirculation)) and internal aerodynamics of the engine submitted to test are analyzed for one particular case. The results provide important insights into the internal flow circulation: how the air charge is inducted into the engine, what the flow characteristics are and how they change with time and geometry in the engine. 2. EXPERIMENTATION The study was conducted on a single cylinder engine prototype with the main parameters presented in Table 1.
Table 1. Engine main parameters [5]

RoJAE vol. 22 no. 1 / March 2016 ISSN 2457 –5275 (Online, English) Romanian Journal of Automotive Engineering ISSN 1842 – 4074 (Print, Online, Romanian)
21
A graphical representation of the valve laws is given in figure 1. The experimental apparatus for this particular study consisted of the prototype engine, instrumented to enable accurate acquisition of the instantaneous in-cylinder, intake and exhaust pressure evolutions (fig. 2).
Figure 1. Valve laws
Data acquisition for in-cylinder pressure, intake and exhaust pressures, was performed with AVL’s Indimodul 621 hardware and conducted over 500 complete engine cycles at the specified engine speed (see table 1). Analysis of cycle-related parameters was done with AVL’s Concerto software.
Figure 2. Sensor positions for pressure acquisitions According to Ref.[2], a challenge to CFD simulation is sometimes the limited availability of suitable experimental data to guide the development and assess the accuracy of the methodology. In order to mitigate the aforementioned drawback, the following is underlined: the experimentation presented above was performed to generate valuable information to define boundary and initial conditions during the CFD simulation and to validate the CFD model. 3. CFD SIMULATION 3.1. The engine geometrical modelling The main goal of this paper was to perform a 3D CFD simulation of the single cylinder engine prototype. The CFD simulation performed in AVL Fire aims to provide quantitative information about the engine’s internal aerodynamics for an entire engine cycle. The 3D geometrical shapes of the engine were built using CATIA software.

RoJAE vol. 22 no. 1 / March 2016 ISSN 2457 –5275 (Online, English) Romanian Journal of Automotive Engineering ISSN 1842 – 4074 (Print, Online, Romanian)
22
In order to obtain the geometric model needed for the numerical simulation, taking into account the positions of the intake and exhaust pressure sensors (see figure 2), from the initial geometry, we renounced to the outer parts of the intake and exhaust manifolds. Thus, as seen in figure 3, only the following elements were kept: parts of the intake and exhaust manifolds; intake and exhaust ducts within the cylinder head, intake and exhaust valves, combustion chamber and cylinder.
Figure 3. CATIA model of the engine
3.2. The turbulence model The chosen turbulence model is the κ – ζ – f recently developed by Hanjalic, Popovac and Hadziabdic [6]. It is a robust modification of the elliptic relaxation model.
The aim is to improve numerical stability of the original model by proposing an eddy viscosity
model, which solves a transport equation for the normalized wall-normal velocity scale instead of
. This turbulence variable (ζ) can be regarded as the ratio of the two time scales: scalar k/ε (isotropic),
and lateral (anisotropic). It also introduces a more robust wall boundary condition for f equation, this
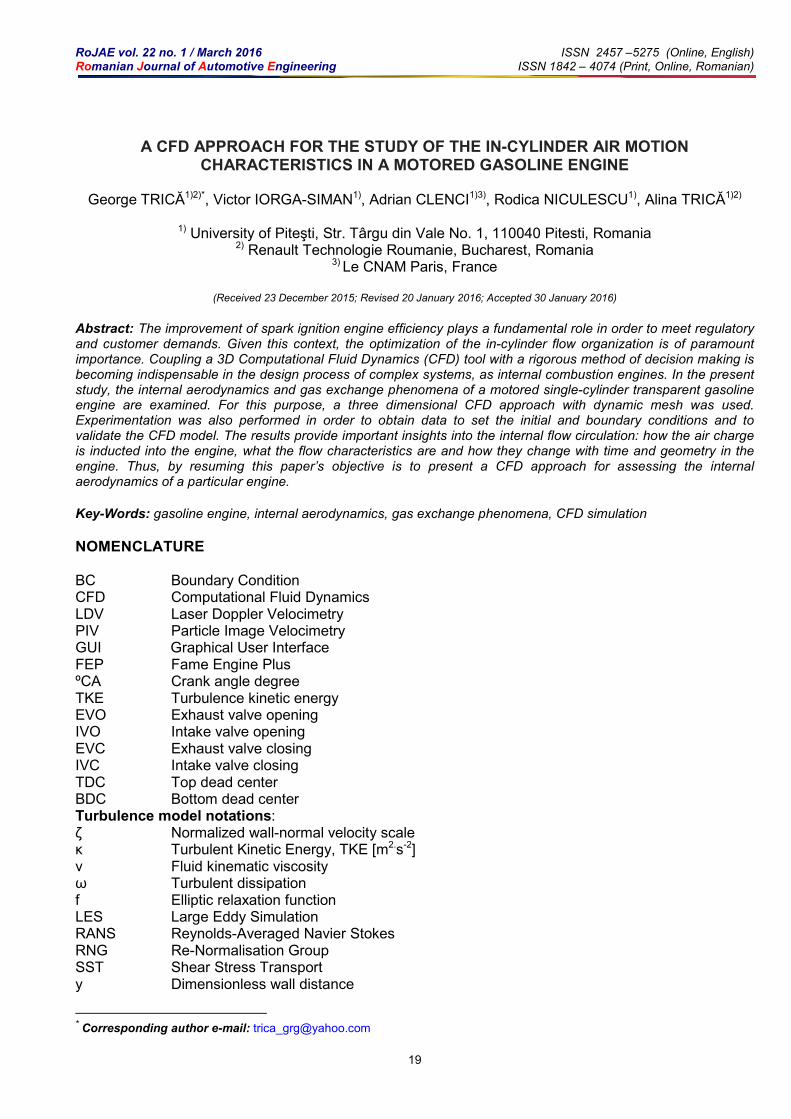
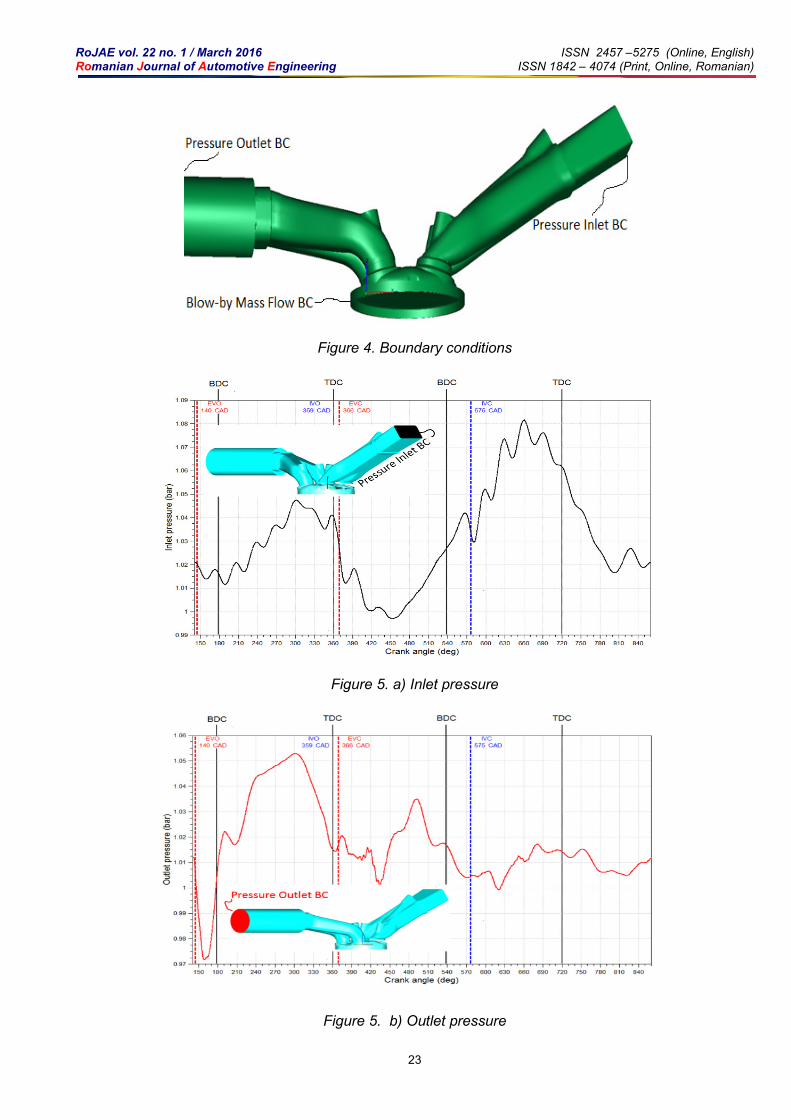
time fwall is proportional to (y is a dimensionless wall distance) instead of in the original model. Since there are numerous turbulence modeling approaches (e.g. k – ω model with its two declinations: k – ω standard and k – ω SST and k – ε model with its three declinations: k – ε standard, realizable k – ε and k – ε RNG, LES – large eddy simulation), in order to sustain the one chosen, usually, several CFD simulations should have been carried out to see which the best is [4]. However, taking into account the good correlation with the experimental data (figure 7), we have decided for this stage to not explore the results of other turbulence models. 3.3. Boundary and initial conditions The pressure signals to be used as boundary conditions (BC) at the computational domain inlet and outlet are obtained from experimental measurements performed in the intake and exhaust ducts at a known distance from the cylinder head (Fig. 2). According to figure 4, the pressure inlet BC was applied at 42 mm from the cylinder head inlet and a pressure outlet BC was imposed at 34 mm from surface of the exhaust cylinder head outlet. Also, we apply a BC of mass flow type for the first piston ring to take into consideration the blow-by effect, which in the case of the transparent engine used in the experimentation is more intense due to the special graphite type of ring used to avoid scratching of the engine’s transparent cylinder. The rest of the geometry is considered as an impenetrable adiabatic wall. In the simulation, air is assumed to be an ideal gas. Its density is variable. However, viscosity, thermal conductivity and specific heat at constant pressure remain constant. The values used for the above mentioned BCs are presented in fig. 5 and were taken from the experimental data presented in section 2.
RoJAE vol. 22 no. 1 / March 2016 ISSN 2457 –5275 (Online, English) Romanian Journal of Automotive Engineering ISSN 1842 – 4074 (Print, Online, Romanian)
23
Figure 4. Boundary conditions
Figure 5. a) Inlet pressure
Figure 5. b) Outlet pressure

RoJAE vol. 22 no. 1 / March 2016 ISSN 2457 –5275 (Online, English) Romanian Journal of Automotive Engineering ISSN 1842 – 4074 (Print, Online, Romanian)
24
Figure 5. Experimental data used for boundary conditions. c) Blow-by mass flow 3.4. The mesh The discretization of the engine computational domain is made through the pre-processing software included in the AVL FireTM graphical user interface (GUI), namely the Fame Engine Plus module (FEP). The computational domain was divided into sub-volumes, each meshed according to its geometry complexity. This allows realizing a semi-automatic moving mesh generation. The user can control the cell size of the grid at each crank angle by local thickening nodes where particular geometric conformations of the outer surfaces are present, or where intense gradients of the thermo-fluid variables are expected. In order to maintain the computational time within reasonable limits, the various grid zones are considered active only in physical domains of interest. When the intake and exhaust valves are closed, the grid is built only in the cylinder, while the intake and exhaust ducts are added geometrically and numerically solved only at the crank angles for which these zones are actually put into contact with the cylinder by the valves opening. For this mesh, unstructured and structured meshes were used. The unstructured mesh is only necessary for the opening and closing of the valves because the grid has to be re-meshed to avoid degenerated grid cells. The cell shape is hexahedral (for the volumes where structured mesh type was used) and tetrahedral (for the volumes where specific, complicated, geometry was used).
Figure 6. Moving mesh

RoJAE vol. 22 no. 1 / March 2016 ISSN 2457 –5275 (Online, English) Romanian Journal of Automotive Engineering ISSN 1842 – 4074 (Print, Online, Romanian)
25
As the mesh is a moving and deformable one, the number of volume type elements varies: 3,179,669 when the piston is at TDC and 2,500,000 when it is at BDC (fig. 6) with a minimum 1,277,854 cells for a less-interest zone. Table 2 gives an idea of the size and conformation of the grid of figure 6.
Table 2. Characteristic data of the computational grid of figure 6.
CELL TYPE PERCENTAGE OF THEIR USE
HEXAHEDRAL CELLS 75 % PRISMATIC CELLS 15% PYRAMIDAL CELLS 9% TETRAHEDRAL CELLS 1%
Generally, the mesh is a trade-off resulted from the need to obtain good results in reasonable simulation time. Taking into account the agreement between the in-cylinder pressure evolution in the experimentation and in the CFD simulation (fig. 7) obtained after about 5 days of simulation on an Intel Xeon machine (2.66 GHz six core processor and 24 GB of RAM), the decision was taken not to refine the mesh. Another reason which supported this decision was the fact that it was only about airflow simulation (i.e. other more complex phenomena such as air fuel interaction were not at issue). 3.5. Validation of CFD results As already mentioned above, the validation of the CFD model was carried out by analyzing the agreement between the in-cylinder pressure evolution in the experimentation and in the CFD simulation. As seen from figure 7, the trend predicted by the CFD model is very close to the experimental results, although there are some minor differences, which can be observed on the expansion stroke. These differences may be attributed to the blow-by effect which was not measured but predicted by 1D simulation. Anyway, in the first two strokes the concordance is almost complete. Therefore, the CFD results on the engine’s internal aerodynamics can be considered trustworthy.
Figure 7. In cylinder pressure evolution. Experiment – CFD correlation

RoJAE vol. 22 no. 1 / March 2016 ISSN 2457 –5275 (Online, English) Romanian Journal of Automotive Engineering ISSN 1842 – 4074 (Print, Online, Romanian)
26
4. RESULTS AND DISCUTIONS The analysis of CFD results provide important insights into the internal flow circulation: how the air charge is inducted into the engine, what the flow characteristics are and how they change with time and geometry in the engine. A first analysis focuses on gas exchange (fig. 8). Three particular phenomena will be subsequently investigated and explained.
Figure 8. Gas exchange
Area A shows a particularity: the in-cylinder pressure (CYL_pres) is smaller than the the exhaust manifold pressure (EX_pres), which causes a reverse flow from exhaust duct into the cylinder. Two possible explanations were found: on the one hand, the blow-by effect which during the exhaust stroke becomes important in the area A (figure 5, c), thus generating a certain decrease of in-cylinder pressure and thereby, a reverse flow; on the other hand, the occurrence of some flow movements that could sustain the observed local “depression”: when analyzing the swirl (fig. 9), one can see that in the exact time frame of area A, it reaches a maximum. This swirl movement is somehow unexpected as the engine geometry was not designed to induce this type of large scale movement.
Figure 9. Swirl Ratio

RoJAE vol. 22 no. 1 / March 2016 ISSN 2457 –5275 (Online, English) Romanian Journal of Automotive Engineering ISSN 1842 – 4074 (Print, Online, Romanian)
27
Area B shows the effect of the internal EGR due to exhaust and intake valve overlapping: the opening of the intake valves before TDC allows to some part of the exhaust gases to be pushed into the intake manifold, generating an increase in the inlet pressure (IN_pres). These are to be reaspirated back to the cylinder during the intake stroke, figure 10.
Figure 10. Reverse flow towards the intake manifold
Area C shows a backflow firstly, due to some kind of a boosting effect (between 510 and 525 ºCA) and secondly, due to the beginning of the compression stroke. The phenomenon appears 20 ºCA before the piston reaches the BDC and ends with the intake valve closing. Now, coming back to the large scale movements and turbulence, figure 11 shows the evolution of tumble ratio and turbulence kinetic energy (TKE) during the whole cycle.
Figure 11. Tumble and turbulence kinetic energy development during the entire engine cycle

RoJAE vol. 22 no. 1 / March 2016 ISSN 2457 –5275 (Online, English) Romanian Journal of Automotive Engineering ISSN 1842 – 4074 (Print, Online, Romanian)
28
On the intake stroke, at the time of maximum tumble intensity, one may see there are 2 tumble vortexes (figure 12, a): a larger one, which moves counterclockwise and a smaller one moving clockwise. At the beginning of compression stroke the tumble is more organized than before and features only one large vortex involving the whole volume of air (figure 12, b).
a) intake stroke b) compression stroke Figure 12. Tumble evolution
Another factor to take into consideration when talking about the engine’s internal aerodynamics is the turbulence kinetic energy (TKE) which is the kinetic energy per unit mass of the turbulent fluctuations in a turbulent flow. During the first two engine strokes, it helps the atomization of the fuel, which in its turn generates a better combustion. When analyzing the TKE evolution (figure 11), one may see two peaks: the first one is occurring in the beginning of the second half of the intake stroke; the second one happens towards the end of compression stroke. Concerning the first peak, it supports the statement according to which the main source of turbulence within an engine is the flow during the intake stroke. What’s good is that during the compression stroke, the turbulence recovers somehow reaching a second peak as stated before. Enough charge kinetic energy prior to spark has a direct impact on the combustion process and on cyclic dispersion. Therefore, when designing an engine, the purpose is to choose those parameters that ensure enough internal aerodynamics even at the end of compression stroke [4]. Unfortunately, in this particular case, towards the end of compression stroke, the tumble and the TKE are on a decreasing course. Figure 13 presents a chronological evolution of TKE’s during the important moments of the first two strokes: intake valve opening (IVO), maximum piston speed moment (Wp_max), intake valve closing (IVC), end of compression stroke. As already mentioned, this figure shows how turbulence is created by the downward piston movement during the intake stroke and then how it decays towards the end of compression.
Figure 13. TKE’s chronological evolution

RoJAE vol. 22 no. 1 / March 2016 ISSN 2457 –5275 (Online, English) Romanian Journal of Automotive Engineering ISSN 1842 – 4074 (Print, Online, Romanian)
29
Usually, there is a compromise which has to be done between turbulence and performance: too much turbulence may cause a drop in engine performance because of the negative effect upon the filling efficiency. Figure 14 shows that at the end of the intake stroke, a maximum filling efficiency is achieved, which slightly decreases until the intake valve closing. The boosting effect mentioned when explaining the phenomenon happening in the area C (see figure 8) is noticeable in figure 14, as well, through a filling efficiency which slightly exceeds 100% at the end of the intake stroke. Concerning the decrease of the in-cylinder air mass that follows, it is generated by the blow-by effect presented in figure 5, c.
Figure 14. In-cylinder air mass evolution 5. CONCLUSION AND PERSPECTIVES Nowadays, in spite of the still numerous unknowns regarding the turbulence, CFD simulations are frequently employed in order to see the effects of some engine parameters upon different aspects, such as gas exchange and internal aerodynamics. Our CFD study performed on a motored engine has provided important insight into the engine’s gas exchange and internal aerodynamics phenomena over an engine cycle. This initial study is part of a larger research program aiming at finding the correlation degree between the parameters characterizing the internal aerodynamics of an engine found by CFD simulation and by using PIV technique. Certainly, additional studies are needed to be able to draw a clear conclusion on this matter: accurate comparison of the flow velocities inside the cylinder on both of the above presented situations. Once found a satisfactory correlation, the CFD simulation could be really considered as trustworthy and could be used extensively. 6. REFERENCES [1] P. V Farrell, “Examples of in-cylinder velocity measurements for internal combustion engines,” Proc. Inst. Mech. Eng. Part D J. Automob. Eng., vol. 221, pp. 675–697, 2007. [2] D. Ramajo, A. Zanotti, and N. Nigro, “In-cylinder flow control in a four-valve spark ignition engine: numerical and experimental steady rig tests,” Proc. Inst. Mech. Eng. Part D-Journal Automob. Eng., vol. 225, no. D6, pp. 813–828, 2011. [3] D. Liu, T. Wang, M. Jia, and G. Wang, “Cycle-to-cycle variation analysis of in-cylinder flow in a gasoline engine with variable valve lift,” Exp. Fluids, vol. 53, no. 3, pp. 585–602, 2012.

RoJAE vol. 22 no. 1 / March 2016 ISSN 2457 –5275 (Online, English) Romanian Journal of Automotive Engineering ISSN 1842 – 4074 (Print, Online, Romanian)
30
[4] A. C. Clenci, V. Iorga-Simǎn, M. Deligant, P. Podevin, G. Descombes, and R. Niculescu, “A CFD (computational fluid dynamics) study on the effects of operating an engine with low intake valve lift at idle corresponding speed,” Energy, vol. 71, pp. 202–217, 2014. [5] “Calculation of unsteady in-cylinder flow of Gasoline engines with FIRE software,” Sci. Coop. between Univ. Pitești, Renault, AVL, 2015-2017. [6] Hanjalic, Popovac, and Hadziabdic, “About the κ – ζ – f turbulence model,” AVL Fire Doc., 2004.
RoJAE vol. 22 no. 1 / March 2016 ISSN 2457 –5275 (Online, English) Romanian Journal of Automotive Engineering ISSN 1842 – 4074 (Print, Online, Romanian)
31
COMPUTATIONAL ELEMENTS FOR DESIGNING A PISTON STEEL TYPE
Marius BARBU, Bogdan RADU∗, Radu CHIRIAC
Politehnica University of Bucharest, Splaiul Independentei No. 313, 060042 Bucharest, Romania
(Received 5 December 2015; Revised 14 January 2016; Accepted 29 January 2016)
Abstract: Increasing the specific output for a turbocharged Diesel engine will generate very high pressure and temperature in cylinder. The usual aluminum alloy pistons can not cope and it is necessary to replace it with a more resistant material. The paper defines two piston shapes, one for the aluminum alloy and the other one for steel, that will be analysed with finite elements at mechanical and thermal stresses. The input data are the same, considering that both pistons works at the same engine, load and speed.
Keywords: Diesel engines, Steel Pistons, Finite Element Method
1. INTRODUCTION The actual piston materials are the aluminum alloys and the high strength steels are yet in an experimental phase. Increasing the specific power through supercharging ( by single or multiple stage compressing) generates the necessity for the use of higher strength capacity materials. Actually the maximum cylinder pressures exceed 20 MPa and in such conditions the mean temperature of cylinder charge generates higher heat convection transfer to the piston surface, so that the boundary conditions for the mechanical and thermal stresses will be larger as for the regular diesel engines. In paper [1] Federal-Mogul company states that at maximum pressure higher than 22 MPa and specific power larger than 100 kW /L it is necessary to replace the classical aluminum alloy piston material with steel. For an Opel Diesel engine with 70 kW/L, that replace its predecessor with 62 KW/L, it was registered an increase in global average temperature of the piston of about 15 degrees, which required a special thermal treatment at the edge of the combustion chamber, to improve the material properties in that area [6]. Another comparative study between two types of pistons was accomplished by Mahle company [4]. The researchers prepared two pistons, one made from steel and one from aluminum alloy which were tested on the same engine in terms of friction and thermodynamic losses, keeping the engine emission values in the same range. The differences between the allowable stresses of the two materials lead to very different geometries of the piston, with smaller wall thickness for steel version. Also, to ensure proper functioning of the engine aluminum alloy piston, it had to be strongly cooled. In terms of piston temperature (measured at the outer edge of the combustion chamber) it was noticed an increase for the steel version by about 17 degrees for the same operating condition of the engine and the difference was relatively constant regardless of the temperature of the cooling oil . Due to lower friction losses and complete combustion generated by the reduced distance to the first, piston ring resulted a decrease in the brake specific fuel consumption for steel piston by 5 g / kWh. The current work aims to present a comparative stress analysis between two types of pistons (one made from aluminum alloy and other made from steel), operating under the same conditions in a turbocharged diesel engine. Since the classical works [2], [3] can not consider the major changes in form and dimensions between the two versions it was selected as useful method the finite elements analysis. In the first step have been defined the geometric shapes of the both pistons, in view of the same engine bore. Cylinder processes were modeled using AVL BOOST program and were considered identical in both cases. The heat released to the piston head and heat transfer coefficients between the piston and the surrounding areas were used to define a temperature piston field. This was superposed with the mechanical stress caused by the maximum pressure in the cylinder in order to define a system of mechanical and thermal stresses, which allowed the assessment of the most loaded areas and of the existing differences up to the permissible values.
∗ Corresponding author e-mail : [email protected]

RoJAE vol. 22 no. 1 / March 2016 ISSN 2457 –5275 (Online, English) Romanian Journal of Automotive Engineering ISSN 1842 – 4074 (Print, Online, Romanian)
32
2.PISTON SHAPE FOR BOTH MATERIALS For aluminum piston was chosen the maximum strength aluminum alloy, type MAHLE 142, and for the steel, was proposed an alloy steel, 16MnCr5. The required properties are shown in Table 1, and they are relatively similar for all the components of the steels family, differing only in tensile strength.
Table 1. Mechanical properties for piston materials
Coefficient of Linear Thermal
Expansion K-1]
Tensile strenght [MPa]
Density [kg/m3]
Thermal conductivity [W/mK]
MAHLE 142 21 x 10-6 350 2700 150 16MnCr5 12 x 10-6 1000 7850 52
Figure 1. Aluminum (left) and steel pistons [4] The different mechanical properties and manufacturing technology will generate specific forms for each type of piston. The pistons steel wall thickness can be reduced considerably, resulting in a thus smaller material volume relative to the piston aluminum alloy version. Under these conditions the mass of the steel piston may not be much higher than that of the aluminum alloy, which is a favorable aspect from the point of view of the inertial forces. Also, the compression height of the steel piston is lower, allowing the extension of the connecting rod, with positive effects in the reduction of the piston–liner contact forces, or a decrease in the height of the engine (Figure 1). Another property that must be taken into account is the coefficient of thermal expansion. It is lower for steel, allowing more precise adjustment control, with positive effects on cold start and emissions that occur due to clearance existing between piston and liner. A disadvantage is the reduced thermal conductivity of the steel, which leads to larger higher piston temperatures. 3. ENGINE PERFORMANCE To perform a theoretical study that will compare the two proposed types of pistons, an engine model was chosen for Mercedes OM 651 2.2 L, S / D 99/83 mm, four-cylinder, brake output 150 kW at 4200 rpm, with power per unit volume of 70 kW / L. For its simulation analysis, made in AVL BOOST (Figure 2), it was developed a model composed from four cylinders (C1..C4), a supercharger (TC1), an intermediate cooler (CO1), an intake manifold (PL1), two exhaust manifolds (PL2, PL3), several measuring points (MP1, MP2 ..), two border elements, the system boundaries, that connect to the external environment (SB1, SB2) and pipelines between the components.
RoJAE vol. 22 no. 1 / March 2016 ISSN 2457 –5275 (Online, English) Romanian Journal of Automotive Engineering ISSN 1842 – 4074 (Print, Online, Romanian)
33
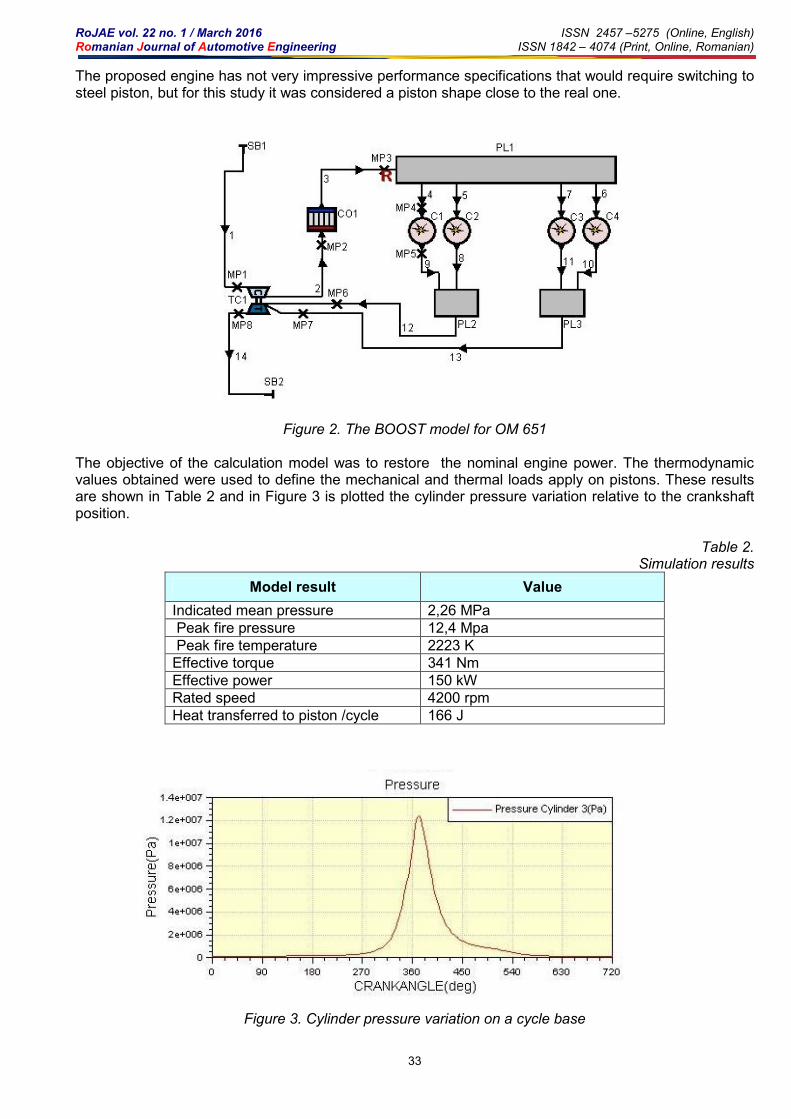
The proposed engine has not very impressive performance specifications that would require switching to steel piston, but for this study it was considered a piston shape close to the real one.
Figure 2. The BOOST model for OM 651 The objective of the calculation model was to restore the nominal engine power. The thermodynamic values obtained were used to define the mechanical and thermal loads apply on pistons. These results are shown in Table 2 and in Figure 3 is plotted the cylinder pressure variation relative to the crankshaft position.
Table 2. Simulation results
Model result Value
Indicated mean pressure 2,26 MPa Peak fire pressure 12,4 Mpa Peak fire temperature 2223 K Effective torque 341 Nm Effective power 150 kW Rated speed 4200 rpm Heat transferred to piston /cycle 166 J
Figure 3. Cylinder pressure variation on a cycle base

RoJAE vol. 22 no. 1 / March 2016 ISSN 2457 –5275 (Online, English) Romanian Journal of Automotive Engineering ISSN 1842 – 4074 (Print, Online, Romanian)
34
4. PISTONS DESIGN The geometric shapes of the analyzed pistons are shown in Figure 4, taken into account the recommendations made in [1] and [3]. For steel piston the walls are thinner and total length was shortened by reducing the length of the skirt and the distance to the top ring.
Figure 4. The pistons shapes (steel left) The combustion chamber architecture from the piston crown has been kept identical for both versions, considering that the mixture formation process and combustion must be the same. For the piston made from aluminum alloy its mass is 0.6 kg and of 1.4 kg for the piston made by steel, with the existing possibility to decrease its weight by reducing the piston walls thickness for steel version. In figure 5 there are presented the cross sections for both pistons.
Figure 5. Pistons cross sections (steel left)

RoJAE vol. 22 no. 1 / March 2016 ISSN 2457 –5275 (Online, English) Romanian Journal of Automotive Engineering ISSN 1842 – 4074 (Print, Online, Romanian)
35
5. HEAT TRANSFER AND TEMPERATURE DISTRIBUTION In order to estimate the piston temperature field, the convection coefficient values at different areas of the piston have been selected from reference [7] (Fig. 6).
Figure 6. The heat transfer coefficients and the isothermal lines for a piston [7] These values were used as input for each area of the pistons and it was thus possible to determine the field temperature. It has also been considered, that on the surface which define the combustion chamber, is introduced a heat amount of 166J, which corresponds to a 6 kW heat power on cycle representing 1.4% of the available heat. The results for the piston version of the aluminum alloy are symmetrical relative to the center of the piston, because all the data are symmetrical, with a reached maximum temperature of 420°C (Figure 7).
Figure 7. Temperature distribution on the aluminum piston
1
MN
MX
XYZ
File: pist_al_v3
109.724143.778
177.832211.886
245.94279.993
314.047348.101
382.155416.209
JUN 19 201308:58:37
NODAL SOLUTION
STEP=1SUB =1TIME=1TEMP (AVG)RSYS=0SMN =109.724SMX =416.209
RoJAE vol. 22 no. 1 / March 2016 ISSN 2457 –5275 (Online, English) Romanian Journal of Automotive Engineering ISSN 1842 – 4074 (Print, Online, Romanian)
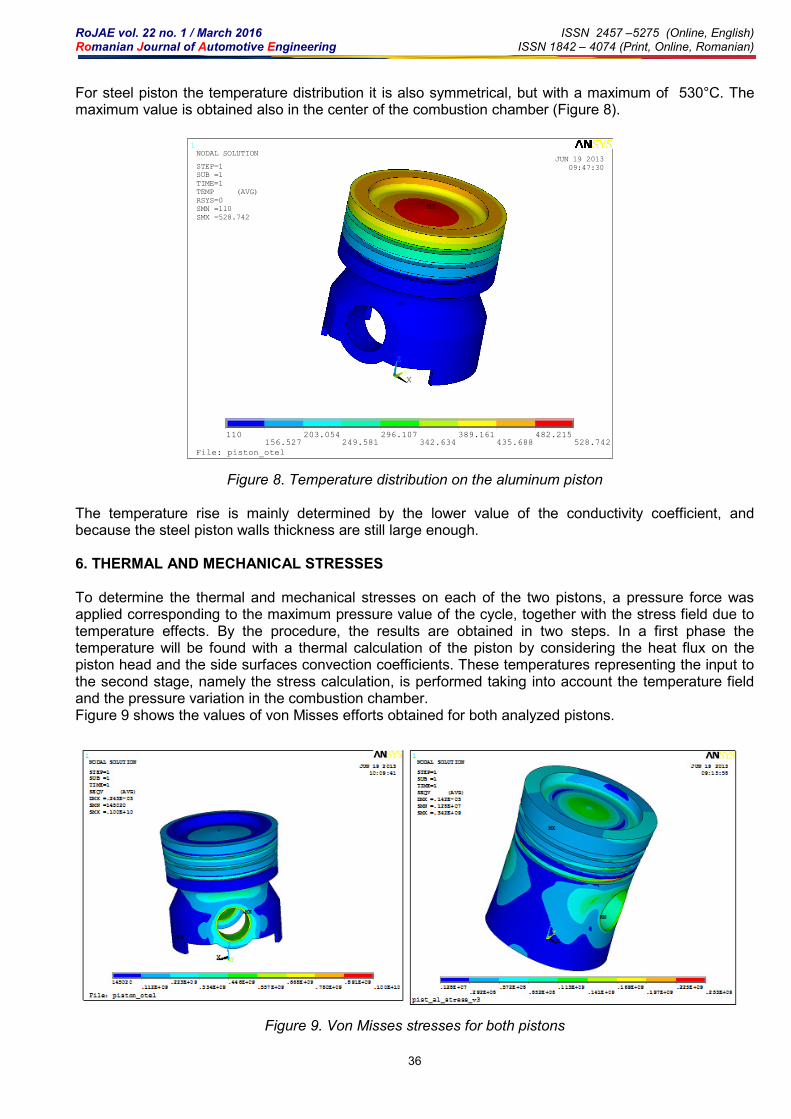
36
For steel piston the temperature distribution it is also symmetrical, but with a maximum of 530°C. The maximum value is obtained also in the center of the combustion chamber (Figure 8).
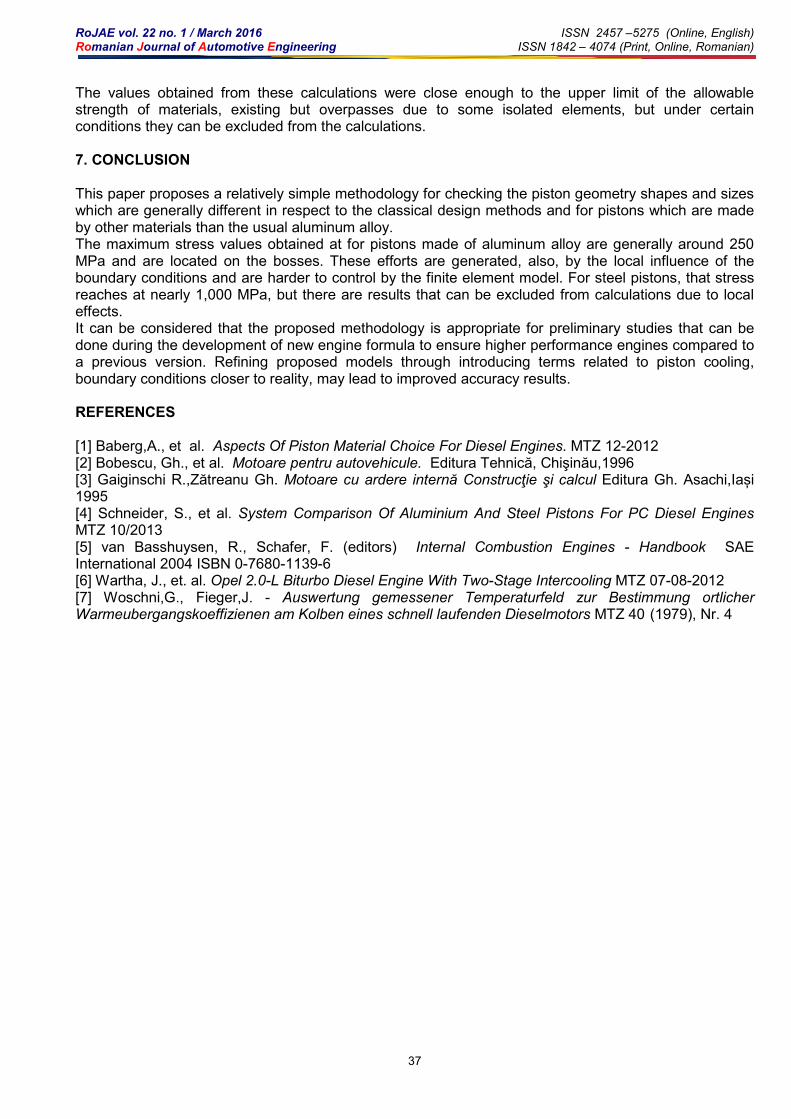
Figure 8. Temperature distribution on the aluminum piston The temperature rise is mainly determined by the lower value of the conductivity coefficient, and because the steel piston walls thickness are still large enough. 6. THERMAL AND MECHANICAL STRESSES To determine the thermal and mechanical stresses on each of the two pistons, a pressure force was applied corresponding to the maximum pressure value of the cycle, together with the stress field due to temperature effects. By the procedure, the results are obtained in two steps. In a first phase the temperature will be found with a thermal calculation of the piston by considering the heat flux on the piston head and the side surfaces convection coefficients. These temperatures representing the input to the second stage, namely the stress calculation, is performed taking into account the temperature field and the pressure variation in the combustion chamber. Figure 9 shows the values of von Misses efforts obtained for both analyzed pistons.
Figure 9. Von Misses stresses for both pistons
1
MN
MX
XY
Z
File: piston_otel
110156.527
203.054249.581
296.107342.634
389.161435.688
482.215528.742
JUN 19 201309:47:30
NODAL SOLUTION
STEP=1SUB =1TIME=1TEMP (AVG)RSYS=0SMN =110SMX =528.742
RoJAE vol. 22 no. 1 / March 2016 ISSN 2457 –5275 (Online, English) Romanian Journal of Automotive Engineering ISSN 1842 – 4074 (Print, Online, Romanian)
37
The values obtained from these calculations were close enough to the upper limit of the allowable strength of materials, existing but overpasses due to some isolated elements, but under certain conditions they can be excluded from the calculations. 7. CONCLUSION This paper proposes a relatively simple methodology for checking the piston geometry shapes and sizes which are generally different in respect to the classical design methods and for pistons which are made by other materials than the usual aluminum alloy. The maximum stress values obtained at for pistons made of aluminum alloy are generally around 250 MPa and are located on the bosses. These efforts are generated, also, by the local influence of the boundary conditions and are harder to control by the finite element model. For steel pistons, that stress reaches at nearly 1,000 MPa, but there are results that can be excluded from calculations due to local effects. It can be considered that the proposed methodology is appropriate for preliminary studies that can be done during the development of new engine formula to ensure higher performance engines compared to a previous version. Refining proposed models through introducing terms related to piston cooling, boundary conditions closer to reality, may lead to improved accuracy results. REFERENCES [1] Baberg,A., et al. Aspects Of Piston Material Choice For Diesel Engines. MTZ 12-2012 [2] Bobescu, Gh., et al. Motoare pentru autovehicule. Editura Tehnică, Chişinău,1996 [3] Gaiginschi R.,Zătreanu Gh. Motoare cu ardere internă Construcţie şi calcul Editura Gh. Asachi,Iași 1995 [4] Schneider, S., et al. System Comparison Of Aluminium And Steel Pistons For PC Diesel Engines MTZ 10/2013 [5] van Basshuysen, R., Schafer, F. (editors) Internal Combustion Engines - Handbook SAE International 2004 ISBN 0-7680-1139-6 [6] Wartha, J., et. al. Opel 2.0-L Biturbo Diesel Engine With Two-Stage Intercooling MTZ 07-08-2012 [7] Woschni,G., Fieger,J. - Auswertung gemessener Temperaturfeld zur Bestimmung ortlicher Warmeubergangskoeffizienen am Kolben eines schnell laufenden Dieselmotors MTZ 40 (1979), Nr. 4

RoJAE vol. 22 no. 1 / March 2016 ISSN 2457 –5275 (Online, English) Romanian Journal of Automotive Engineering ISSN 1842 – 4074 (Print, Online, Romanian)
38

RoJAE vol. 22 no. 1 / March 2016 ISSN 2457 – 5275 (Online, English) Romanian Journal of Automotive Engineering ISSN 1842 – 4074 (Print, Online, Romanian)
39
INFLUENCE OF BIODIESEL ON CO2 EMISSIONS FROM DIESEL ENGINES
Bogdan BENEA*
Transilvania University of Brasov, Str. Politehnicii Nr. 1, 500024 Brasov, Romania
(Received 15 September 2015; Revised 8 October 2015; Accepted 29 January 2016)
Abstract: European legislation requires lower emissions of greenhouse gases by 2020 (Decision 406/2009/EC). Also, by 2020 the proportion of biofuels in fossil fuels should reach 10% (Directive 2009/28/EC). This paper shows the influence of increased percentage of biofuel on the CO2 emissions of a diesel engine. In the tests it was used a Renault K9K engine, with displacement of 1461 cm
3. There have been used three methyl ester produced from
sunflower, corn and used oil, in concentrations of 6% and 10% and CO2 emissions were compared with CO2 emission of diesel engine fueled with regular diesel, without any additives. Tests were performed for a load of 100% between 1200 and 3700 rpm and at a constant speed of 2700 rpm (maximum torque speed) for load between 20% and 100%. Results obtained from tests showed a higher emission of CO2 for all mixtures of methyl ester with diesel.
Key-Words: biofuels, greenhouse gas, renewable energy.
1. INTRODUCTION Pollution from vehicles has become a global problem due to continuous increase in their number. Reducing emissions has become a major technical challenge. A solution for reducing polluting emissions is the fuel produced from renewable raw materials. Burning of fossil fuels contributes to air pollution. Pollutant emissions are generated from all economic and social activities. In recent years, emissions of certain pollutants have decreased in Europe: sulfur dioxide (SO2), carbon monoxide (CO), benzene (C6H6), while other pollutants remain at a level that can endanger the health. The pollutants contained elements that are naturally present in the atmosphere. One of these is carbon dioxide (CO2). Carbon dioxide is the main greenhouse gas effect emitted due to human activities: burning fossil fuels (coal, gas, oil) for energy and transport, industrial processes and agricultural land use change. In 2010, 43% of the CO2 emissions were produced by burning coal, 36% by burning oil and 20% by burning natural gas [7][8]. Greenhouse gas emissions from transport continues to grow, in contrast with other areas such as industry, energy production. Emissions of CO2 from air and sea transport between 2006-2007 recorded a slow growth of 0.9% and 2.6% compared to 2005-2006, when they had an increase of 6.4% 5.3% respectively. In 2008 the average CO2 emissions of cars were 154 g CO2 / km, above the target of 140 g CO2 / km but smaller than those recorded in 2007 (159 g CO2 / km) [1][4][5][6]. Directive 2009/28 /EC provides for a 10% biofuel use in transport fossil fuels by 2020. This paper aims to investigate the influence of biodiesel on CO2emissions [9][10]. 2. TEST DESCRIPTION The tests were made on an Renault K9K engine having the characteristics presented in Table 1. Tests were conducted on engine test bench Horiba Titan 250, which is fitted as Transilvania University of Brasov, Faculty of Mechanical Engineering, Vehicles and Transport Department, presented in Figure 1. The stand is equipped with an electric brake that is designed to oppose of the crankshaft rotation. During operation appears an electromagnetic field that links the stator and rotor brake. The advantage of electric brake is the possibility of instantaneous changing of the electromagnetic coupling. The tests have been made for 7 fuels (diesel fuel, biodiesel with diesel fuel mixed with 6% and 10% methyl ester of corn oil, sunflower oil, and used cooking oil).
*Corresponding author e-mail: [email protected]

RoJAE vol. 22 no. 1 / March 2016 ISSN 2457 – 5275 (Online, English) Romanian Journal of Automotive Engineering ISSN 1842 – 4074 (Print, Online, Romanian)
40
Table 1. Characteristics engine Renault K9KP732
Engine displacement 1451 cm3
Bore x stroke 76 x 80,5 mm
No. of cylinders 4/line/supercharged
Order of injection 1-3-4-2
Injection type Direct injection, common-rail
Compression ratio 15,3:1
Number of valves/cylinder 2
Maximum power 78 kW/4000 rot/min
Maximum torque 240 Nm/2000 rot/min
Emission class Euro4
Methyl esters were synthesized according to the conventional equation for the transesterification of vegetable oils in the presence of methanol using KOH as a catalyst. The transesterification took place in the following standard conditions: reaction temperature 60°C, pressure 1 bar, the ratio methanol / vegetable oil 6: 1, 1% of potassium hydroxide, mixing speed 550 rev / min, 120 min of reaction time. Tests were performed for a load of 100% between 1200 and 3700 rpm and at a constant speed of 2700 rpm (maximum torque speed) for load between 20% and 100%. In table 2 are presented the characteristics of fuels used in the tests. The CO2 emission was measured with AVL Sesam FTIR 137. The SESAM FTIR creates an infrared broadband spectrum that can be used to detect all spectrum information of the exhaust gas sample at the same time.
Table 2. Physico-chemicals properties of fuels
Results
Diesel fuel Sunflower oil Corn oil Used oil Properties
B6 B10 B6 B10 B6 B10
Density (20oC), kg/m3
840,2 841,9 843,1 841,7 842,7 842,7 844,4
Viscozity (20oC), mm2/s
5,34 5,27 5,10 5,04 4,99 5,27 6,15
Cetanice number 51,1 54,5 57,6 57,6 62,1 54,2 58,9
Flash point, oC 67 67,2 67,8 71,4 67,3 70,8 71,2
Aromatics, % vol 17,6 11,9 5 11,2 7,9 9,1 10,5
Polyaromatics, % vol 1,5 1,2 0 0 0 0,8 0,9
Heating value MJ/kg 43,16 42,58 42,19 42,63 42,27 42,56 42,19
Pour point, oC -17 -14 -13 -16 -15 -14 -13
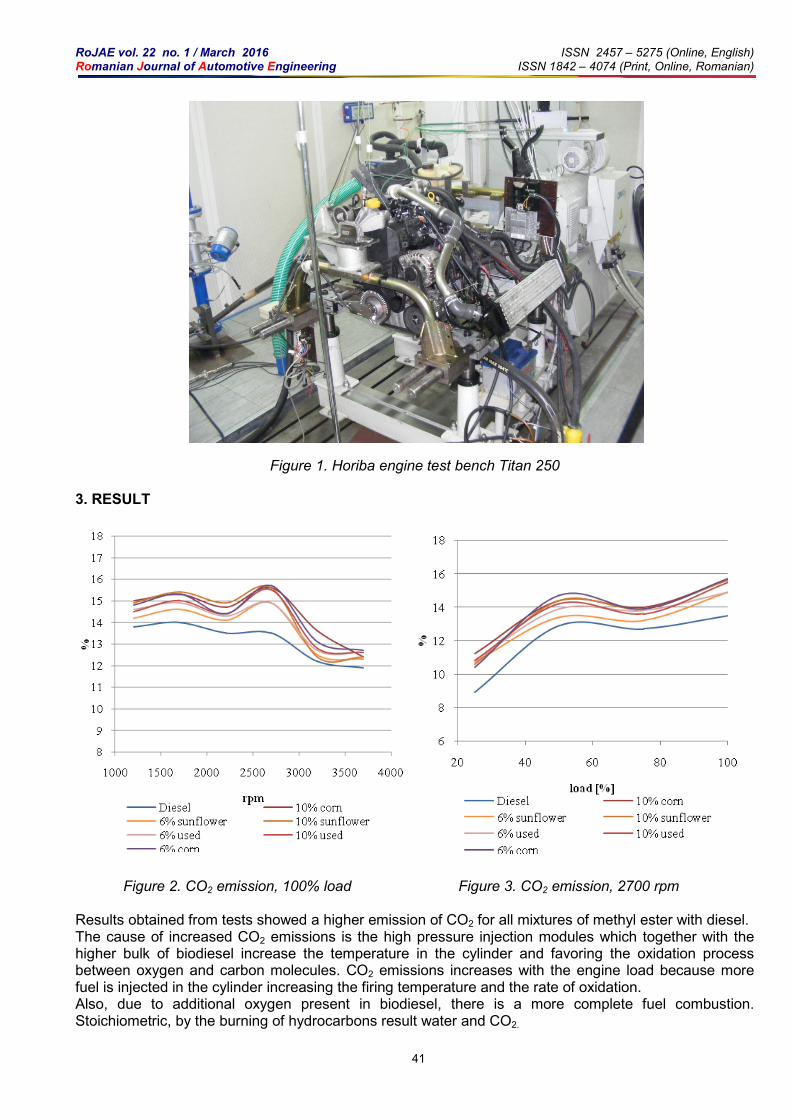
RoJAE vol. 22 no. 1 / March 2016 ISSN 2457 – 5275 (Online, English) Romanian Journal of Automotive Engineering ISSN 1842 – 4074 (Print, Online, Romanian)
41
Figure 1. Horiba engine test bench Titan 250 3. RESULT Figure 2. CO2 emission, 100% load Figure 3. CO2 emission, 2700 rpm Results obtained from tests showed a higher emission of CO2 for all mixtures of methyl ester with diesel. The cause of increased CO2 emissions is the high pressure injection modules which together with the higher bulk of biodiesel increase the temperature in the cylinder and favoring the oxidation process between oxygen and carbon molecules. CO2 emissions increases with the engine load because more fuel is injected in the cylinder increasing the firing temperature and the rate of oxidation. Also, due to additional oxygen present in biodiesel, there is a more complete fuel combustion. Stoichiometric, by the burning of hydrocarbons result water and CO2.

RoJAE vol. 22 no. 1 / March 2016 ISSN 2457 – 5275 (Online, English) Romanian Journal of Automotive Engineering ISSN 1842 – 4074 (Print, Online, Romanian)
42
4. CONCLUSIONS Global warming climate caused by the use of fossil fuels has contributed to the expansion of research and use of alternative fuels. There is scientific evidence that global warming is accelerating due to greenhouse gas emissions. The main greenhouse gases are carbon dioxide (CO2), nitrous oxide (N2O) and methane (CH4). Biodiesel has the advantage that it is less polluting water and soil. There was a degradation of biodiesel by about 88% compared to only 26% for diesel in the same period of time (28 days).In addition, biodiesel is more soluble in water, which is an advantage if accidental discharges into waters inhabited by fish, which may survive at higher concentrations. This is an advantage both in shipping and in agriculture in terms of drinking water and groundwater fauna biodiversity. However, the leakage should be avoided, because biodiesel is obtained by trans-esterification, in which vegetable oil is reacted with methanol, which is toxic (Rutz&Janssen 2008). Because biofuels are made from plants, CO2 emissions from direct combustion is considered to be zero (by burning is released the same amount of CO2 as the plant processed in the process of photosynthesis). If energy crops are made in arid unproductive areas, conventional plants can reduce greenhouse gas emissions. Greenhouse emissions of biofuels can be reduced by using agricultural residues as feedstock for biofuels. This goal requires technologies that are in the research phase. REFERENCES [1] Benea B C (2014) Researches on the usage of biofuels for vehicles engines, PhD Thesis, 2014 [2] Rutz D, Janssen R (2008) Biofuel Technology Handbook, WIP Renewable Energies [3] Ajav EA, Singh B, Bhattacharya T.K. (1998) Performance of a stationary diesel engine using vaporized ethanol as supplementary fuel, Biomass Energy, 12/1998;15(6):493-502 [4] Esteban, B., Riba JR, Baquero G, et.al (2012)Temperature dependence of density and viscosity of vegetable oils, Biomass and Bioenergy, vol. 42:164-171 [5] Franco, Z., Nguyen, Q.D. (2011) Flow properties of vegetable oil–diesel fuel blends, Fuel, vol. 90: 838-843 [6] Guibet, J.C. (1997) Carburantsetmoteurs, L’InstitutFrancais du Petrole [7] Gumus M., Sayin C, Canakci M (2012), The impact of fuel injection pressure on the exhaust emissions of a direct injection diesel engine fueled with biodiesel–diesel fuel blends,Fuel, vol. 95: 486-494 [8] Schönborn A. (2009) Influence of the molecular structure of biofuels on combustion in a compression ignition engine, University College London [9] ***-http://eur-lex.europa.eu/legal-content/EN/TXT/?uri=uriserv:OJ.L_.2009.140.01.0136.01.ENG [10] ***-http://eur-lex.europa.eu/legal-content/EN/TXT/?uri=celex:32009L0028 This work was presented at the European Congress of Automotive, EAEC-ESFA 2015 25.11.-27.11.2015, Bucharest, Romania.
RoJAE vol. 22 no. 1 / March 2016 ISSN 2457 – 5275 (Online, English) Romanian Journal of Automotive Engineering ISSN 1842 – 4074 (Print, Online, Romanian)
43
UPON A SIMPLE METHOD FOR GENERATING TRANSVERSAL PROFILE OF THE
VOLUMIC BLOWER ROTOR USED IN SUPERCHARGING INTERNAL COMBUSTION
ENGINES
Iulian AGAPE*, Lidia GAIGINSCHI, Radu GAIGINSCHI, Daniel BALTAGIU
Technical University „Gh.Asachi” Iasi, Bd.Mangeron No. 61-63, 700050 Iasi, Romania
(Received 20 August 2015; Revised 12 October 2015; Accepted 19 January 2016)
Abstract: Blowers with Roots profiled rotors play an important role in supercharging the internal combustion engines, especially in the current context in which there are developed propulsion solutions of vehicles with spark ignition engines of small displacement, supercharged, and with considerable power. Transverse rotor profile is one of the key performance improvement of these blowers. Improving these mechanical compressors is conditioned by the technological limits of the generation and execution of the rotor profiles on specialized machine tools. On the other hand, in terms of influence on the performance of the blower, rotor profile plays a secondary role compared to the amount of functional gap of rotor in the blower body. In this context, justifiably in this paper is proposed a simple rotor profile, consisting of two distinct segments on half of the lobe, generated respectively by a epicyclic for the lobe foot and a hypocycloid at the lobe head. EH-type profile, inspired by specific methodology for generating flank gear with small number of teeth is remarkable in terms of technological accessibility. Developed algorithm is applied to generate the transverse profile of the lobe of the rotor with three lobes.
Key-Words: Roots, profile, lobe, epicyclic, hypocycloid
1. INTRODUCTION
Profiled rotors (Roots) blower is actually a volumic rotary compressor with outer compression. It has two rotors with parallel axes, mounted in a sealed housing, rotors that rotate in opposite directions. The working fluid is transported in the spaces between the rotor lobes bounded by blower sections of intake and discharge. Compression occurs only when the fluid translated between the two sections is connected with the fluid found in the discharge manifold, at high pressure. The fluid in the discharge manifold, flows inside the blower. Subsequently, the compressed fluid is discharged through the mechanical effect of the rotor lobes, moving in rotation. Utilizing no alternative translation motion mechanisms, resulting construction is dynamically balanced and can operate at high speeds. Efficiency and flow coefficients are fundamentally superior to other solutions. Functional gaps between the rotors and respectively between them and the blower housing eliminates the need for blower internal lubrication. Wear rotors is null and therefore volumetric efficiency of the blower is not affected along the exploitation. Relative to applications in the field of internal combustion engines, the advantages of using the supercharging solutions are important. Both the engine and the blower are volumic machines and allow the optimal accord between their functional regimes; therefore it is maintained a quasi-constant supercharger pressure for the compressor unit on the entire engine speed range. Compared to other supercharging solutions, the obtained torque characteristics are more favorable for auto traction, also generated by the slower decrease of the boost pressure at lower speeds. Regarding the dynamic regime, Roots blowers enjoy a response time in transient regime extremely short: boost pressure compensation occurs immediately so that momentary torque drops are insignificant. Investigation of blower rotor profile has generated great interest in recent research. It was raised the issue of an arch profile (Tsay 1987, Chen 1988), in involute arch (Hsieh and Meng, 1989), in a succession of five different circle arches (Fong and Wang, 1999), in cycloid extended with an arch (Hang, 2000) and even in cycloid arch connected with a variable radius trohoida (Hwang, 2006).
* Corresponding author e-mail: [email protected]

RoJAE vol. 22 no. 1 / March 2016 ISSN 2457 – 5275 (Online, English) Romanian Journal of Automotive Engineering ISSN 1842 – 4074 (Print, Online, Romanian)
44
All these studies have the credit that identify concrete possibilities for improving the performances of these blowers. On the other hand research efforts lead to the same conclusion, namely that, at least in terms of energy, the possibilities of developing these blowers are limited. It is thus recognized the absolutely negative role of functional games between the two rotors and between them and the housing, in determining the level of aggregate gaso-dynamic losses. Constructive features and default blower functional gaps generates a reflux motion of the fluid current from discharge to the inlet, through the specified gaps. In the first phase is affected the blower flow coefficient which reflects negatively upon the other energy parameters (flow discharged, discharge pressure, real compression ratio, volumetric efficiency). This is the main cause for the pressure ratio to reach for top achievements values of 1.5-1.8 and for the discharge pressures to place Roots blowers in low-pressure turbocharger class solutions. Not at last, it is not yet fully elucidated the influence of the number of rotor lobes on blower performances. It usually is imposed as a compromise between decreasing discharged flow at the increasing number of lobes and attenuation of the inherent pulsating phenomena of the fluid discharged from changes in the number of lobes in the same direction (by decreasing the pressure wave amplitude and increase it’s frequency). The problems caused by the generation and execution (manufacturing) of rotors and also the reduction and control of functional gaps are serious technological impediments. Given the limitation of performances and technological barriers, author’s efforts to set up a simple rotor profile (achievable on simple machine tools currently used in the production of gears) is absolutely justified. 2. THE ANALYTIC MODEL OF THE PROFILE The rotor profile is generated in the hypothesis of null functional gap between the two rotors. The two rotors, each with three lobes, are identical in dimensional geometric layout and rotate in opposite directions with equal angular speeds. The determined rotor profiles can be subsequently corrected with the consideration of the functional gap by reducing heights of profiles of the two rotors, in radial direction and on their whole circumference with half of the absolute value of the imposed gap. The rotor profile study will be reduced to functional and design unit level, respectively the lobe rotor. Each rotor has and n = 3 lobes so it will thus subtend at the center an angle of 2π / 3 = 120°. Each lobe is symmetrical in transverse plane about a radial axis passing through top and through the geometric center of the rotor. Thus, the profile is symmetricall to geometrical radial axis of the head lobe; symmetry is preserved at the bottom of profile of the two lobes on the same radial direction. Heads lobe axes profile, respectively bottom profiles between the lobes are arranged equiangularly to rotor center, with an angle of 2π / n = 2π / 3 = 120°. Each lobe in part will be subtended between two successive centers of the bottoms of the lobes profiles at an angle to the center of 2π / n = 2π / 3 = 120°. Each half lobe will return therefore a central angle of 120° / 2 = 60 °. For reasons of simplicity of calculation and considering the symmetry of lobe along the radial direction, profiling algorithm will be determined only for half a lobe. For head lobe and respectively for the bottom of the lobe will be imposed distinct profiling laws. The separation of the two areas, namely the head and the bottom will be equiangularly at the center, each having the angle of π/6 = 30°. It will be initially considered two basic circles, tangent, with equal radius R. Profile bottom, at the foot of lobe will be epicyclic and subtended therefore at the center by an angle π/6 = 30°. It is generated by a fixed point of a smaller circle of radius r (r <R), which runs without sliding on the circumference of the circle of radius R, inside it. Head profile lobe will be hypocycloidal and subtended to center of the rotor at an angle π/6 = 30 ° and is generated by a fixed point of a smaller circle of radius r (the same as for the foot), which runs without sliding on the circumference of the circle of radius R, outside it. At initial moment of the generation, to draw the epicyclic for example, it will be considered a current generator point M on the circle of radius „r”, diametrally opposed to the tangential point of the two circles, large and small (of radius „R”, respectively „r”, with the small circle inside the larger). For reasons of geometric continuity of profile, drawing subsequently the hypocycloids arc will be by assuming the position of the current generator point N in the tangent point of the circles large and small (radius „R”, respectively „r”, with the small circle outside the larger). To simplify the problem is considered a condition of kinematic nature, namely, that in order to cover by rolling without slipping the circle of radius „R” circumference corresponding to angular sector at the center of π/6 (epicyclic or hypocycloids arcs considered), the small circle of radius „r” will use half of its circumference.

RoJAE vol. 22 no. 1 / March 2016 ISSN 2457 – 5275 (Online, English) Romanian Journal of Automotive Engineering ISSN 1842 – 4074 (Print, Online, Romanian)
45
This condition has the form:
ππ
⋅=⋅ rR6
(1)
6
Rr = (2)
According to this hypothesis, for a given value of the radius "R" of the basic circle, cycloidal three-lobe rotor has a small dimensional geometric profile.
Figure 1. Generation of epicyclic profile For the profile at the bottom (foot) lobe, it will be considered the circle of radius r = R / 6 with the current generator point M in two different positions (Figure 1), respectively in the initial position (with the center point in A0) and a subsequent position (characterized by the position of the center of the circle of radius „r” in point A1) arranged at an centre angle ϕ on the radius „R” circle. Between the two considered positions the circle of radius „r” rotated at center with angle α, the generator current point radius performing a plan – parallel movement between initial A0M and final positions A1B. In these conditions:
rROA −=1 and
rBA =1 (3)
By applying in the triangle OA1B the generalized Pythagoras Theorem relative to the angle will get the side |OB| :
αcos10266
⋅−=R
OB (4)
Noting and applying sine theorem in ∆A1OB, is obtained:
⋅−=
α
αβ
cos1026
sinarcsin (5)

RoJAE vol. 22 no. 1 / March 2016 ISSN 2457 – 5275 (Online, English) Romanian Journal of Automotive Engineering ISSN 1842 – 4074 (Print, Online, Romanian)
46
According to previous kinematic conditions, α = 6φ. Finally, in the right triangle ∆OBE are obtained:
( ) ( )βϕβϕ +⋅=+⋅= cos@sin OByOBx FF (6)
These coordinates can also be written as:
⋅−+⋅⋅−=
⋅−+⋅⋅−=
α
αϕα
α
αϕα
cos1026
sinarcsincoscos1026
6
cos1026
sinarcsincoscos1026
6
Ry
Rx
F
F
(7)
where ϕ∈[0, π/6] and α = 6ϕ. These are the parametric equations at the foot of lobe profile. Analogously is generated the head profile lobe (Figure 2).
Figure 2. Generation of the hypocycloidal profile It is taken into consideration that at the initial moment of generating the profile, the center of the circle of radius "r" is disposed at an angle at the center on the circle of radius „R”, equal to π / 6. The current generator angle has in this position the value φ = 0, so the hypocycloid arc in this case will be generated for ϕ∈[0, 30°]. Based on a similar algorithm, it is obtained:
αcos14506
⋅−=R
OC (8)
αβ sinsin2 OCCB= (9)
rCB =2 rROB +=2 6
Rr = (10)

RoJAE vol. 22 no. 1 / March 2016 ISSN 2457 – 5275 (Online, English) Romanian Journal of Automotive Engineering ISSN 1842 – 4074 (Print, Online, Romanian)
47
α
αβ
cos1450
sinarcsin
⋅−= (11)
−+⋅= βϕ
π6
sinOCxC (12)
−+⋅= βϕ
π6
cosOCyC (13)
And finally head lobe’s profile parametric equations are:
⋅−−+⋅⋅−=
α
αϕ
πα
cos1450
sinarcsin
6sincos1450
6
RxC (14)
⋅−−+⋅⋅−=
α
αϕ
πα
cos1450
sinarcsin
6coscos1450
6
RyC (15)
The profile coordinates x, y are relative to an orthogonal system with the origin in the center O of the circle of radius "R" (respectively in the geometric center of the cross section through one of the rotors) and having the axis Oy disposed by the initial position of the current generator point (M), corresponding to the initial point of the epicyclic profile of the foot. The epicyclic arc equation for the foot is:
( )
∈
⋅−=
+
6
,,36
6cos102622 π
ϕϕ
oR
y
R
x ff (16)
The hypocycloid arc equation for the head is:
( )
∈
⋅−=
+
6
,,36
6cos145022 π
ϕϕ
oR
y
R
x cc (17)
We notice analytical continuity of rotor profile at the limit in the junction point of the two cycloid arcs:
( ) Ryxyx ccff =+=
+
→→
22
0
22
6
limlimϕπ
ϕ
(18)
The maximum height of the lobe profile on radial direction is obtained at the top (ϕ = π/6) in the form:
3
4
66
22
maxR
yxh CC =
+
=
ππ (19)
The minimum height of the lobe profile on radial direction is obtained in the initial point of the lobe foot (ϕ = 0) in the form:
( )[ ] ( )[ ]3
200 22
minR
yxh FF =+= (20)
The distance between the geometric centers of rotors profiles on the move synchronous coordinated can be determined as the sum of the maximum and minimum heights previously determined as:
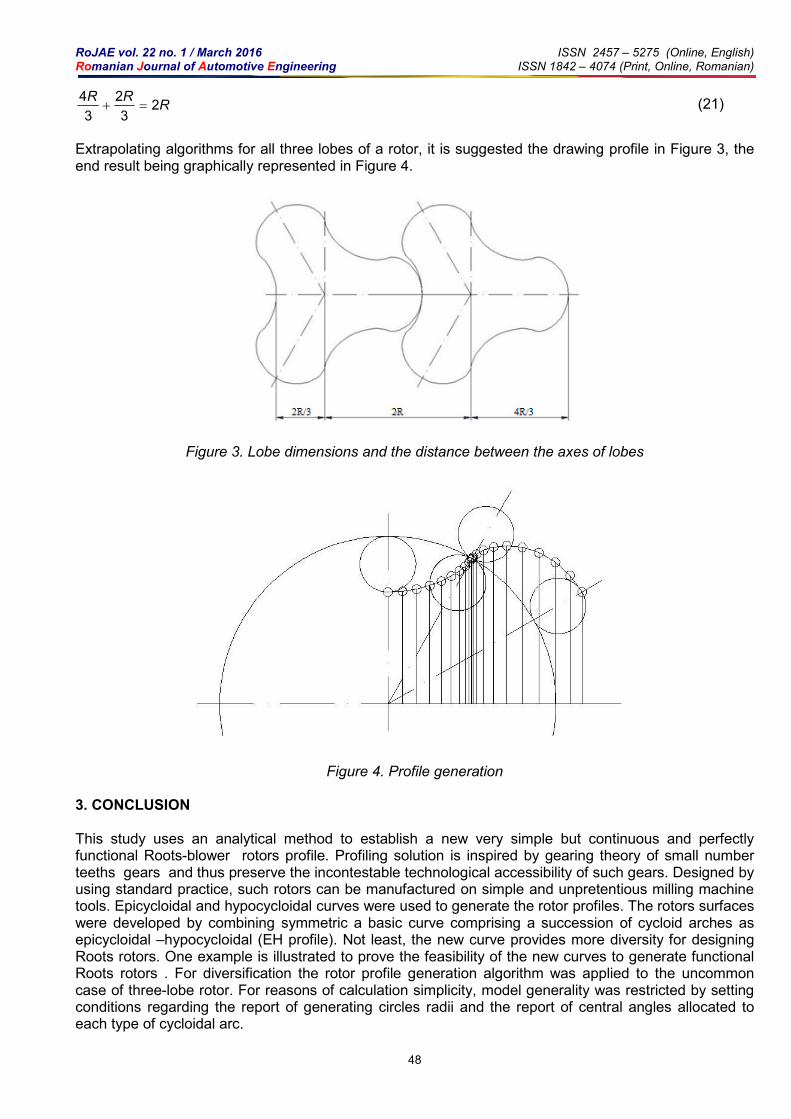
RoJAE vol. 22 no. 1 / March 2016 ISSN 2457 – 5275 (Online, English) Romanian Journal of Automotive Engineering ISSN 1842 – 4074 (Print, Online, Romanian)
48
RRR
23
2
3
4=+ (21)
Extrapolating algorithms for all three lobes of a rotor, it is suggested the drawing profile in Figure 3, the end result being graphically represented in Figure 4.
Figure 3. Lobe dimensions and the distance between the axes of lobes
Figure 4. Profile generation 3. CONCLUSION
This study uses an analytical method to establish a new very simple but continuous and perfectly functional Roots-blower rotors profile. Profiling solution is inspired by gearing theory of small number teeths gears and thus preserve the incontestable technological accessibility of such gears. Designed by using standard practice, such rotors can be manufactured on simple and unpretentious milling machine tools. Epicycloidal and hypocycloidal curves were used to generate the rotor profiles. The rotors surfaces were developed by combining symmetric a basic curve comprising a succession of cycloid arches as epicycloidal –hypocycloidal (EH profile). Not least, the new curve provides more diversity for designing Roots rotors. One example is illustrated to prove the feasibility of the new curves to generate functional Roots rotors . For diversification the rotor profile generation algorithm was applied to the uncommon case of three-lobe rotor. For reasons of calculation simplicity, model generality was restricted by setting conditions regarding the report of generating circles radii and the report of central angles allocated to each type of cycloidal arc.
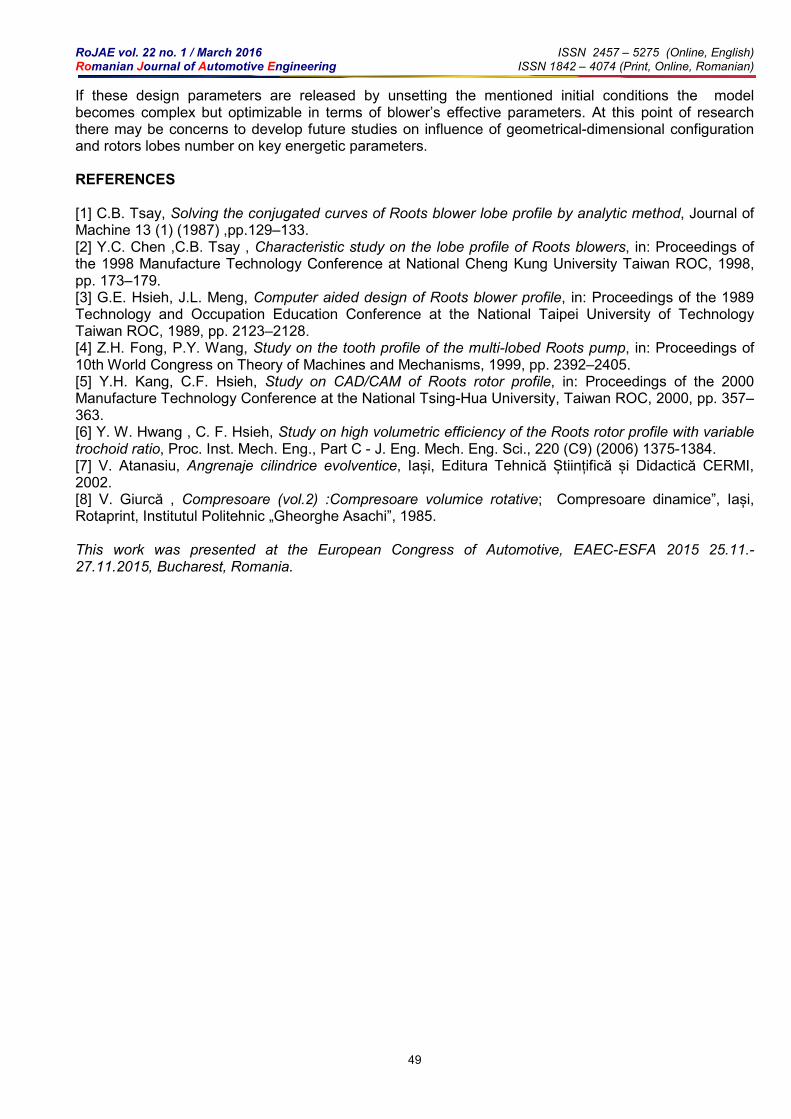
RoJAE vol. 22 no. 1 / March 2016 ISSN 2457 – 5275 (Online, English) Romanian Journal of Automotive Engineering ISSN 1842 – 4074 (Print, Online, Romanian)
49
If these design parameters are released by unsetting the mentioned initial conditions the model becomes complex but optimizable in terms of blower’s effective parameters. At this point of research there may be concerns to develop future studies on influence of geometrical-dimensional configuration and rotors lobes number on key energetic parameters. REFERENCES
[1] C.B. Tsay, Solving the conjugated curves of Roots blower lobe profile by analytic method, Journal of Machine 13 (1) (1987) ,pp.129–133. [2] Y.C. Chen ,C.B. Tsay , Characteristic study on the lobe profile of Roots blowers, in: Proceedings of the 1998 Manufacture Technology Conference at National Cheng Kung University Taiwan ROC, 1998, pp. 173–179. [3] G.E. Hsieh, J.L. Meng, Computer aided design of Roots blower profile, in: Proceedings of the 1989 Technology and Occupation Education Conference at the National Taipei University of Technology Taiwan ROC, 1989, pp. 2123–2128. [4] Z.H. Fong, P.Y. Wang, Study on the tooth profile of the multi-lobed Roots pump, in: Proceedings of 10th World Congress on Theory of Machines and Mechanisms, 1999, pp. 2392–2405. [5] Y.H. Kang, C.F. Hsieh, Study on CAD/CAM of Roots rotor profile, in: Proceedings of the 2000 Manufacture Technology Conference at the National Tsing-Hua University, Taiwan ROC, 2000, pp. 357–363. [6] Y. W. Hwang , C. F. Hsieh, Study on high volumetric efficiency of the Roots rotor profile with variable trochoid ratio, Proc. Inst. Mech. Eng., Part C - J. Eng. Mech. Eng. Sci., 220 (C9) (2006) 1375-1384. [7] V. Atanasiu, Angrenaje cilindrice evolventice, Iași, Editura Tehnică Științifică și Didactică CERMI, 2002. [8] V. Giurcă , Compresoare (vol.2) :Compresoare volumice rotative; Compresoare dinamice”, Iași, Rotaprint, Institutul Politehnic „Gheorghe Asachi”, 1985.
This work was presented at the European Congress of Automotive, EAEC-ESFA 2015 25.11.-27.11.2015, Bucharest, Romania.
International CONgress of Automotive and Transport Engineering 26 - 29 October 2016, Brașov, Romania
Congress Subject: AUTOMOTIVE VEHICLES AND FUTURE TECHNOLOGIES Congress Themes: 1. Innovative Solutions for Motor Vehicles Advanced powertrain Chassis systems Transmission systems New solutions for vehicle body design Electric and Hybrid Vehicles Comfort and Ergonomics
4. Advanced Engineering Methods Styling and aerodynamics Design for manufacturing and maintenance Simulation and testing for vehicle and components Vehicle dynamics Virtual reality
2. Automotive and Environment Reduction of gas emissions / chemical pollutants Vibration and noise reduction Hybrid and electrical vehicles Alternative fuels Electromagnetic compatibility Renewable energy sources
5. Heavy and Special Vehicles Concept cars Race cars Buses, trucks and heavy vehicles Tractors, industrial and agricultural vehicles Working equipment
3. Advanced Transport Systems and Road Traffic Intelligent transport systems Advanced traffic control systems Systems for driver assistance Human and vehicle interface Traffic pollution and noise impact assessment Autonomous Ground Vehicles
6. New Materials, Manufacturing Technologies and Logistics New materials Prototyping Manufacturing trends Quality, reliability and maintenance Life/Cycle analysis Supplying chain and logistics Automotive Recycling
7. Accident Research and Analysis Traffic safety and accident statistics and analysis Traffic accident, tests and reconstruction Pedestrian and bikers protection Crashworthiness and biomechanics
Deadlines
20.03.2016: Submission of abstract 30.04.2016: Notification of acceptance 02.07.2016: Final paper 09.09.2016: Draft Congress program
SOCIETATEA INGINERILOR DE AUTOMOBILE DIN ROMÂNIA SOCIETY OF AUTOMOTIVE ENGINEERS OF ROMANIA www.siar.ro www.ingineria-automobilului.ro
http://conat.unitbv.ro

RoJAE
Romanian Journal of Automotive Engineering
AIMS AND SCOPE The Romanian Journal of Automotive Engineering has as its main objective the publication and dissemination of original research in all fields of „Automotive Technology, Science and Engineering”. It fosters thus the exchange of ideas among researchers in different parts of the world and also among researchers who emphasize different aspects regarding the basis and applications of the field. Standing as it does at the cross-roads of Physics, Chemistry, Mechanics, Engineering Design and Materials Sciences, automotive engineering is experiencing considerable growth as a result of recent technological advances. The Romanian Journal of Automotive Engineering, by providing an international medium of communication, is encouraging this growth and is encompassing all aspects of the field from thermal engineering, flow analysis, structural analysis, modal analysis, control, vehicular electronics, mechatronics, electro-mechanical engineering, optimum design methods, ITS, and recycling. Interest extends from the basic science to technology applications with analytical, experimental and numerical studies. The emphasis is placed on contribution that appears to be of permanent interest to research workers and engineers in the field. If furthering knowledge in the area of principal concern of the Journal, papers of primary interest to the innovative disciplines of „Automotive Technology, Science and Engineering” may be published. No length limitations for contributions are set, but only concisely written papers are published. Brief articles are considered on the basis of technical merit. Discussions of previously published papers are welcome. Notes for contributors Authors should submit an electronic file of their contribution to the Production office: www. siar.ro. All the papers will be
reviewed and assessed by a series of independent referees. Copyright
A copyright transfer form will be send to the author. All authors must sign the ”Transfer of Copyright” agreement before the article can be published. Upon acceptance of an article by the journal, the author(s) will be asked to transfer copyright of the article to the publisher. The transfer will ensure the widest possible dissemination of information. This Journal and the individual contributions contained in it are protected by the copyright of the SIAR, and the following terms and conditions apply to their use: Photocopying Single Photocopies of single articles may be made for personal use as allowed by international copyright laws. Permission of the publisher and payment of a fee is required for all other photocopying including multiple or systematic copying, copying for institutions that wish to make photocopies for non-profit educational classroom use. Derivative Works Subscribers may reproduce table of contents or prepare lists of article including abstracts for internal circulation within their institutions. Permission of the publisher is required for resale or distribution outside the institution. Permission of publisher is required for all other derivative works, including compilations and translations. Electronic Storage Permission of the publisher is required to store electronically and material contained in this journal, including any article or part of article. Contact the publisher at the address indicated. Except as outlined above, no part of this publication may be reproduced, stored in a retrieval system or transmitted in any form or by any means, electronic, mechanical, photocopying, recording or otherwise, without prior written permission of the publisher. Notice No responsibility is assumed by the publisher for any injury and or damage to persons or property as a matter of products liability; negligence or otherwise, or from any use or operation of any methods, products, instructions or ideas contained in the material herein. Although all advertising material is expected to conform to ethical (medical) standards, inclusion in this publication does not constitute a guarantee or endorsement of the quality or value of such product or of the claims made of it by its manufacturer.
The Journal of the Society of Automotive Engineers of Romania
www.ro-jae.ro www.siar.ro ISSN 2457 – 5275 (Online, English)
ISSN 1842 – 4074 (Print, Online, Romanian)
RoJAE
Romanian Journal of Automotive Engineering
Societatea Inginerilor de Automobile din România Society of Automotive Engineers of Romania
www.siar.ro www.ro-jae.ro
ISSN 2457 – 5275 (Online, English) ISSN 1842 – 4074 (Print, Online, Romanian)
The Scientific Journal of SIAR A Short History
The engineering of vehicles represents the engine of the global development of the economy. SIAR tracks the progress of the automotive engineering in Romania by: the development of automotive engineering, the development of technologies, and road transport services; supporting the work of the haulers, supporting the technical inspection and of the garage; encouraging young people to have a career in the automotive engineering and road haulage; stimulation and coordination of activities that promote an environment that is suitable for continuous education and improving of knowledge of the engineers; active exchange of ideas and experience, in particular for students, master students, PhD students, and young engineers, and dissemination of knowledge in the field of automotive engineering; cooperation with other technical and scientific organizations, employers’ and socio-professional associations through organization of joint actions, of mutual interest. By the accession to FISITA (International Federation of Automotive Engineering Societies) since its establishment, SIAR has been involved in achieving an overall professional community that is homogeneous in competence and performance, interactive, dynamic, and competitive at the same time, oriented towards a balanced and friendly relationship between people and the environment; this action will be constituted as a challenge worthy of effort and recognition. The insurance of a favorable framework for the initiation and the development of cooperation of the specialists in this field of activity allows for an efficient and easy exchange of information, specific knowledge and experience; it supports the cooperation between universities and between research centers and industry; it speeds up the process of implementing the new technologies, it simplifies the identification of training and specialization needs of the personnel involved in the engineering of motor vehicles, transport, and road safety. In order to succeed, ever since its founding, SIAR has considered that the stress should be put on the production and distribution, at national and international level, of a publication of scientific quality. Under these circumstances, the development of the scientific magazine of SIAR had the following evolution: 1. RIA – Revista inginerilor de automobile (in English: Journal of Automotive Engineers) ISSN 1222 – 5142 Period of publication: 1990 – 2000 Format: print, Romanian
Frequency: Quarterly Electronic publication on: www.ro-jae.ro
Total number of issues: 30 Type: Open Access
The above constitutes series nr. 1 of SIAR scientific magazine.
2. Ingineria automobilului (in English: Automotive Engineering) ISSN 1842 – 4074
Period of publication: as of 2006 Format: print and online, Romanian
Frequency: Quarterly Electronic publication on: www.ingineria-automobilului.ro
Total number of issues: 38
(including the March 2016 issue)
Type: Open Access
The above constitutes series nr. 2 of SIAR scientific magazine (Romanian version).
3. Ingineria automobilului (in English: Automotive Engineering) ISSN 2284 – 5690
Period of publication: 2011 – 2014 Format: online, English
Frequency: Quarterly Electronic publication on: www.ingineria-automobilului.ro
Total number of issues: 16
(including the December 2014 issue)
Type: Open Access
The above constitutes series nr. 3 of SIAR scientific magazine (English version).
4. Romanian Journal of Automotive Engineering ISSN 2457 – 5275
Period of publication: from 2015 Format: online, English
Frequency: Quarterly Electronic publication on: www.ro-jae.ro
Total number of issues: 5 (March 2016) Type: Open Access
The above constitutes series nr. 4 of SIAR scientific magazine (English version).
Summary – on March 31, 2016 Total of series: 4 Total years of publication: 22 (11=1990 – 2000; 11=2006-2016) Publication frequency: Quarterly Total issues published: 68 (Romanian), out of which, the last 21 were also published in English