Embed Size (px)
Citation preview

Trusted to deliver excellence
Rolls-Royce plcDirectors’ report and financial statements 2011

Directors’ Report1 Introduction2 Chief Executive’s review4 Our business model and strategy6 Our business segments7 Market opportunities over the
next 20 years8 Key performance indicators12 Finance Director’s review16 Civil aerospace18 Defence aerospace20 Marine22 Energy24 Excellence in technology26 Excellence in operations28 Sustainability32 Principal risks and uncertainties34 Additional financial information36 Board of directors38 Internal control and risk
management39 Shareholders and share capital39 Other statutory information40 Annual report and financial
statements
Financial statementsContents listed on page 41
Other matters111 Subsidiaries, jointly controlled
entities and associates114 Independent Auditor’s report
Directors’ reportThe Directors’ report which includes the Business review is set out on pages 1 to 40.
Forward-looking statementsThis Directors’ report and financial statements contains forward-looking statements. Any statements that express forecasts, expectations and projections are not guarantees of future performance and will not be updated. By their nature, these statements involve risk and uncertainty, and a number of factors could cause material differences to the actual results or developments.
This report is intended to provide information to shareholders, is not designed to be relied upon by any other party, or for any other purpose and the Company and its directors accept no liability to any other person other than under English law.
Contents

Rolls-Royce plc Directors’ report and financial statements 2011
1
Directors’ report
Dire
ctor
s’ re
port
Rolls-Royce is a global company providing power solutions for customers in civil and defence aerospace, marine and energy markets. We support our customers through a worldwide network of offices, manufacturing and service facilities in over 50 countries.
Our ability to design and develop high-technology products and then integrate these into sophisticated systems for use on land, sea and air, provides us with access to global markets.
Introduction
2010 2011 % change
Order book – firm and announced £59.2bn £62.2bn +5%
Underlying revenues £10,866m £11,277m +4%
Profit before financing £1,134m £1,189m +5%
Underlying profit before tax £956m £1,158m +21%
Rolls-Royce plc Directors’ report and financial statements 2011
2
Directors’ report
Demand for our products and services in 2011 remained strong. Despite the global economic turbulence of recent years, Rolls-Royce has continued to grow.
Delivering for customers and investing in the business
In my first year as Chief Executive, I have spent much of my time visiting Rolls-Royce sites around the world to meet employees, customers, suppliers and investors to hear what they have to say about your company. Without exception, the employees I have met are dedicated, professional and committed to delivering our brand promise – ‘trusted to deliver excellence’. Our customers are supportive and enthusiastic about our technology and, of course, they want even better performance both from our products and our team. Our suppliers are excited by the opportunity for growth and understand our requirement for better quality, on time delivery and lower cost. Investors express support for our strategy and naturally share our desire for still better financial performance in the future.
At the Rolls-Royce Group plc 2011 AGM, I confirmed that we will continue to follow the strategy that has been in place for many years, and can be summarised as:
1. addressing four global markets: civil aerospace, defence aerospace, marine and energy;
2. investing in technology, capability and infrastructure;3. developing a competitive portfolio of products and services;4. focusing on growing market share and our installed product base; and5. adding value for our customers through product-related services.
This strategy has stood the test of time and has proved itself in battle. Since 2007, and despite the turbulence of recent years, Rolls-Royce has grown underlying revenue by 44 per cent and underlying profits by 45 per cent. We have doubled our revenues in the past decade and, through organic growth alone, we are confident that we will do the same in the decade ahead.
While we continue to follow this strategy, in the coming years, I see three main priorities:
Chief Executive’s review

Rolls-Royce plc Directors’ report and financial statements 2011
3
Directors’ report
Dire
ctor
s’ re
port
1. Delivering the promises we have madeWith a record order book of £62.2 billion, our customers have placed a huge amount of trust in us and it is essential we meet our commitments. This will require a very significant increase in capacity. To put this growth into perspective, since we started building Trent engines 18 years ago we have delivered just over 2,000 units. We will deliver the next 2,000 in just five years which means more than doubling our current rate of production. To achieve this we continue to invest in new facilities around the world. These investments include our new plants at Crosspointe in Virginia, USA where we are making discs for civil jet engines and Seletar, in Singapore, where we will make wide-chord fan blades and assemble and test Trent engines. We are also expanding and renewing our facilities in the UK where we still invest half of our capital expenditure and more than half of our research and development budget. As well as investing in our own facilities, we are working hard with our suppliers and partners to make sure our global supply chain can support our growth and keep pace with demand.
2. Deciding where we invest for future growthWe can see opportunity in all areas of our business but we need to concentrate our resources and decide which opportunities we are going to pursue and which we are not.
3. Continuing to improve the financial performance of the business Although we are subject to inflationary pressures and tough competition we will benefit from the growth of the business, from investments that will improve efficiency and from an increasing focus on cost performance and cash conversion.
In support of our strategy, during 2011 we made three very important decisions for the future.
The first was our acquisition of the German industrial engines group Tognum, our biggest acquisition, that we made in a joint offer with Daimler. It will bring together highly complementary product and technology portfolios and creates significant new opportunities for our marine and energy businesses.
Second, we signed an exclusive deal with Airbus to power the long-range Airbus A350-1000 aircraft, for which we will develop an enhanced Trent XWB engine.
Third, we agreed to sell our equity stake in International Aero Engines (IAE) to Pratt & Whitney, at the same time announcing our intention to form a new joint venture to develop engines for the next generation of mid-size aircraft. This agreement builds on a long and successful partnership with Pratt & Whitney, and charts a clear course for our future in this important market segment.
In addition, we have continued to extend our portfolio and have advanced a number of important programmes. These are described in greater detail later in the directors’ report, but it is encouraging to note progress in each of our customer facing businesses.
Our strategy has stood the test of time and has proved itself in battle.
In civil aerospace, we celebrated the first commercial flight of the Boeing 787 Dreamliner, operated by All Nippon Airways (ANA) and powered by Trent 1000 engines. The Trent XWB engine programme for the Airbus A350 XWB is progressing well with over 1,500 test hours completed. Our BR725 engine, developed for Gulfstream’s new flagship executive jet, the G650, is due to enter service later this year.
In defence, our LiftFan™ system for the Joint Strike Fighter has performed well during intensive flight tests that included more than 70 short take-offs and vertical landings on board the aircraft carrier USS Wasp. The TP400 engine for the Airbus A400M is on course to enter service in 2013, further strengthening our position in the military transport market.
In our marine business, we have secured the first orders for our award- winning Environship, a cargo vessel powered by liquid natural gas that substantially increases fuel efficiency through a combination of innovative hull design and power systems. In May 2011, the UK Government awarded Rolls-Royce the contract to develop a new propulsion system for the next generation of nuclear-powered submarines.
Our energy business signed its biggest ever single contract to supply Petrobras, Brazil’s leading oil company, with 32 gas turbine generation packages to support its offshore operations. Within our civil nuclear business we have continued to expand our instrumentation and controls business while strategic relationships with reactor vendors and utility operators were further strengthened during 2011 through a number of cooperation agreements.
In 2011, Rolls-Royce performed well in difficult market conditions. We have a £62.2 billion order book, underlying revenue has grown to £11.3 billion and underlying profit has increased 21 per cent to £1.2 billion. This success is due to the extraordinary team of over 40,000 people that work for Rolls-Royce. I thank all of them for their support and effort in 2011. Their skills, the breadth of our portfolio, the strength of our order book and the access we have to parts of the world where demand for our products and services remain strong, make your company increasingly resilient.
Chief Executive’s review

Rolls-Royce plc Directors’ report and financial statements 2011
4
Directors’ report
Rolls-Royce is a global company providing power solutions for customers in civil and defence aerospace, marine and energy markets. The Group has an ongoing commitment to investing in research and development (R&D)which provides the technologies and intellectual property that allow us to compete on a global basis and creates high barriers for entry to our markets.
Our business model and strategy
Develop world-class products
Provide services that add value
Develop close customer
relationships globally
Manufacture efficiently
Invest in leading technologies and
skilled people
Trusted to deliver excellence
Two-thirds of our annual R&D funding is aimed at improving the environmental performance of our products. We maximise our R&D investment through our approach of ‘invest once use many times’ in products across the four major segments. Our manufacturing operations and supply bases are integrated and global.

Rolls-Royce plc Directors’ report and financial statements 2011
5
Directors’ report
Dire
ctor
s’ re
port
Our business model and strategy
We have 40 major engineering programmes under management. We continue to introduce major new products, including the Trent 1000 in 2011. Our key projects will help define the power systems markets for many years ahead.
Develop a competitive portfolio of
products and services
We invest close to £1 billion annually in R&D and during 2011 we invested £467 million in capital projects to grow our global capability and productivity.
Invest in technology
infrastructure and capability
A leading producer of mission-critical, integrated power systems and services for use in civil and defence aerospace, marine and energy segments.
Revenue 2011 (£m)
1. £5,572m civil aerospace2. £2,235m defence aerospace3. £2,271m marine4. £1,199m energy
Address four global markets
Across the Group the growing installed product base and integrated systems will generate attractive returns for many decades. Grow market
share and our installed product base
Over half our revenues come from services. We seek to develop our customer relationships, through long-term service contracts where we can grow strong business collaboration.
Add value for customers through the provision of
product-related services
1
2
3
4

Rolls-Royce plc Directors’ report and financial statements 2011
6
Directors’ report
OVERVIEW OF BUSINESS We are a world leader in power for the offshore and onshore oil and gas industry. We supply gas turbines and diesel engines for power generation and are developing a strong capability in the civil nuclear power market.
MAIN OPERATIONAL LOCATIONS – Mount Vernon, US – Montreal, Canada – Bergen, Norway
OVERVIEW OF BUSINESS Our marine business serves more than 4,000 customers and has equipment installed on over 30,000 vessels, including those of 70 navies.
MAIN OPERATIONAL LOCATIONS – Singapore – Bristol, Derby, UK – Ulsteinvik, Ålesund,
Bergen, Norway– Kristinehamn, Sweden– Rauma, Finland– Hamburg, Germany – Shanghai, China – Pusan, Korea – Vung Tau City, Vietnam – Walpole, US
OVERVIEW OF BUSINESS We are the world’s second largest provider of defence aero-engine products and services with 160 customers in over 100 countries.
MAIN OPERATIONAL LOCATIONS – Bristol, UK – Indianapolis, US – Virginia, US – Dahlewitz, Germany
OVERVIEW OF BUSINESS Our civil aerospace business provides the power for more than 30 types of commercial aircraft and supports customers around the world. We have a good presence in narrowbody and a strong position in widebody, corporate and regional aircraft.
MAIN OPERATIONAL LOCATIONS – Derby, UK – Indianapolis, US – Virginia, US – Singapore – Dahlewitz, Germany
Civil aerospace
Defence aerospace
Marine
Energy
Our business segments (charts show business segment revenue as a percentage of total revenue)
11%
20%
20%
49%

Rolls-Royce plc Directors’ report and financial statements 2011
7
Directors’ report
Dire
ctor
s’ re
port
The Group’s forecast predicts faster growth rates for long-haul markets and those markets to, from and within Asia. Factors affecting demand include GDP growth, aircraft productivity, operating costs, environmental issues and the number of aircraft retirements. We forecast a demand for civil aero engines of US$800 billion over the next 20 years and for services of US$600 billion over the same period.
With traditional defence markets under budget pressures there may be delays in new programmes but these will be offset by longer term services on current programmes where we are well placed. Demand for military engines over the next 20 years is estimated at US$155 billion and for services and support equipment we estimate a market of US$260 billion over the same period.
The Group forecasts a demand for marine power and propulsion systems valued at US$215 billion over the next 20 years. Marine aftermarket services are expected to generate significant opportunities with demand forecast at US$125 billion over the same period.
US$215bnMarine equipment market
US$125bnMarine services market
US$120bnEnergy engine and services market
US$640bnCivil nuclear equipment and services market
US$155bnDefence engine market
US$260bnDefence services market
US$800bnCivil engine market
US$600bnCivil services market
The Group’s 20-year forecast values the total aero-derivative gas turbines sales in the oil and gas and power generation sectors at more than US$70 billion. Over this period, demand for associated services is expected to be around US$50 billion.
Based on the International Energy Agency forecasts, the Group has conservatively estimated that demand for mission-critical equipment, systems and engineering services for the nuclear island could reach US$390 billion over the next 20 years while demand for associated reactor support services could amount to US$250 billion over the same period.
Market opportunities over the next 20 years

Rolls-Royce plc Directors’ report and financial statements 2011
8
Directors’ report
The Board uses a range of financial and non-financial indicators to monitor Group and segmental performance in line with the strategy.
Key performance indicators
UNDERLYING REVENUE
CASH FLOW
UNDERLYING PROFIT BEFORE FINANCING
RETURN ON CAPITAL EMPLOYED
+4%
-523%
+19%
+0.4%
Monitoring of revenues provides a measure of business growth. Underlying revenue is used in order to eliminate the effect of the decision not to adopt hedge accounting and to provide a clearer year-on-year measure. The Group measures foreign currency sales
at the actual exchange rate achieved as a result of settling foreign exchange contracts from forward cover.
Underlying profit before financing is presented on a basis that shows the economic substance of the Group’s hedging strategies in respect of the transactional exchange rate and commodity price movements. In particular: (a) revenues and costs denominated in US dollars and euros are presented on the basis of the exchange rates achieved during
the year; (b) similar adjustments are made in respect of commodity derivatives; and (c) consequential adjustments are made to reflect the impact of exchange rates on trading assets and liabilities and long-term contracts on a consistent basis. The derivation of underlying profit before financing is shown in note 2 on page 54 of the consolidated financial statements.
The figure for 2011 includes investment of £1,496 million in Tognum.
In a business requiring significant investment, the Board monitors cash flow to ensure that profitability is converted into cash generation, both for future investment and as a reward for shareholders. The Group measures cash flow as the
movement in net funds/debt during the year, after taking into account the value of derivatives held to hedge the value of balances denominated in foreign currencies. The figure in 2007 includes a £500 million special contribution to the Group’s UK pension schemes, as part of the restructuring of these pension schemes.
Return on capital employed is calculated as the after-tax underlying profit, divided by the average net assets during the year, adjusted for net cash, net post-retirement deficit and goodwill
previously written off. It represents a measure of the return the Group is making on its investments.
07 08 09 10 11
7,8179,147
10,108 10,866 11,277
0
4,000
8,000
12,000
£m
07 08 09 10 11
17.2 17.1 17.4 17.5 17.9
0
6
12
18
%
07 08 09 10 11
62569
(183)-350
0
700
£m
-700
-1050
-1400
350
(1,376)
325
07 08 09 10 11
832919 983 1,010
1,206
0
400
800
1,200
£m

Rolls-Royce plc Directors’ report and financial statements 2011
9
Directors’ report
Dire
ctor
s’ re
port
-2%
Key performance indicators
NET RESEARCH AND DEVELOPMENT CHARGE
NET RESEARCH AND DEVELOPMENT EXPENDITURE AS A PROPORTION OF UNDERLYING REVENUE
GROSS RESEARCH AND DEVELOPMENT EXPENDITURE
CAPITAL EXPENDITURE
+10%
-2%
+29%
Investment in research and development underpins all the elements of the Group’s strategy. Programme expenditure is monitored in conjunction with
a gated review process on each programme and progress is reviewed at key milestones.
The Group’s research and development activities comprise both self-funded and customer funded programmes. Gross expenditure measures total research and development activity
and is an indicator of the actions taken to enhance the Group’s intellectual property.
R&D is measured as the self-funded expenditure both before amounts capitalised in the year and amortisation of previously capitalised balances. The Group expects to spend approximately five per cent of revenues on research and development although this proportion will fluctuate depending
on the stage of development of current programmes. This measure reflects the need to generate current returns as well as to invest for the future.
To deliver on its commitments to customers, the Group invests significant amounts in its infrastructure. All proposed investments are subject to rigorous review to ensure that they are consistent with forecast activity and will provide value for money.
Annual capital expenditure is measured as the cost of property, plant and equipment acquired during the period.
Underlying revenueUnderlying profit before financingCash flowReturn on capital employedNet research and development chargeGross research and development expenditureNet research and development expenditure as a proportion of underlying revenueCapital expenditure
Order bookTraining and developmentUnderlying revenue per employeeEngine deliveriesInstalled thrust – civil aerospacePercentage of civil fleet under managementUnderlying services revenueEmissions
07 08 09 10 11
304 283 291361
467
0
250
375
500
£m
125
07 08 09 10 11
5.85.4
4.7 4.7 4.6
0
4
6
%
2
07 08 09 10 11
381 403 379422
463
0
250
375
500
£m
125
07 08 09 10 11
824 885 864 923 908
0
500
750
1,000
£m
250

Rolls-Royce plc Directors’ report and financial statements 2011
10
Directors’ reportKey performance indicators
ORDER BOOK
UNDERLYING REVENUE PER EMPLOYEE
TRAINING AND DEVELOPMENT
ENGINE DELIVERIES
+5%
+6%
+15%
+12%
The order book provides an indicator of future business. It is measured at constant exchange rates and list prices and includes both firm and announced orders. In civil aerospace, it is common for a customer to take options for future orders in addition to firm orders placed. Such options are excluded from the order book. In defence aerospace, long-term programmes
are often ordered for only one year at a time. In such circumstances, even though there may be no alternative engine choice available to the customer, only the contracted business is included in the order book. Only the first seven years’ revenue of long-term aftermarket contracts is included.
Training and development is a core element of the Group’s investment in its capability and is measured as the expenditure on the training and development of employees, customers and suppliers.
Effectiveness is monitored by using a range of external and internal sources and by gathering user feedback.
A measure of personnel productivity, this indicator measures underlying revenue generated per employee on a three-year rolling basis.
The Group’s installed engine base represents an opportunity to generate future aftermarket business. This is measured as the number of Group products delivered during the year within
each business except for marine, as its products do not lend themselves to this measure due to their diversity.
07 08 09 10 11
1,4391,621 1,600 1,657
1,853
0
1,500
2,000
1,000
500
Engines
07 08 09 10 11
194 211233
259 274
0
200
300
£000
100
07 08 09 10 11
45.9
55.5 58.3 59.2 62.2
0
40
60
£bn
20
07 08 09 10 11
30 3024
3338
0
30
40
£m
20
10

Rolls-Royce plc Directors’ report and financial statements 2011
11
Directors’ report
Dire
ctor
s’ re
port
Key performance indicators
INSTALLED THRUST – CIVIL AEROSPACE
UNDERLYING SERVICES REVENUE
PERCENTAGE OF CIVIL FLEET UNDER MANAGEMENT
EMISSIONS
+5%
+9%
-3%
Installed thrust is the indicator of the amount of product in use by our customers and therefore the scale of opportunity this presents for our services business.
Long-term contracts are an important way of generating value for customers. The percentage of fleet under management gives a measure of the proportion of the installed engine base where the future aftermarket arrangements are agreed under long-term contracts.
Underlying services revenue shows the amount of business during the year that has been generated from the installed engine base. This is measured as the revenue derived from spare parts, overhaul services and long-term service agreements.
Around two-thirds of our research and development expenditure is focused on reducing emissions of the Group’s products. The Group measures both the emissions of its products and the emissions of its manufacturing operations. These measures are described in detail in
the environment report, ‘Powering a better world’, which is available on the Group’s website at www.rolls-royce.com.
07 08 09 10 11
4,2654,755 4,927
5,5446,019
0
4,000
6,000
£m
2,000
07 08 09 10 11
334 348 367 382 400
0
300
400
m lbs
200
100
07 08 09 10 11
55 57 5970 68
0
60
80
%
40
20

Rolls-Royce plc Directors’ report and financial statements 2011
12
Directors’ report
SummarySummary data – £ million 2011 2010 Change
Order book 62,201 59,153 +5%Underlying revenue* 11,277 10,866 +4%Underlying profit before tax* 1,158 956 +21%Reported revenue 11,124 11,085 0%Reported profit before financing 1,189 1,134 +5%Net funds 222 1,598Average net funds 341 969
* See explanation in note 2 on page 54
The difficulties faced by the global economy, by the Eurozone and by those governments with budgetary imbalances are well publicised. However, demand for our products and services remains robust, particularly in developing markets. This demand results from the breadth and diversity of our businesses, customers and programmes, the competitive strength of our products and the relative youth of our installed base.
The visibility of significant growth in the next decade provided by the record order book underpins our continued investment in technology, operations and services. These investments safeguard our competitive advantage, support delivery on our commitments to customers and improve our operational effectiveness. The Group’s 2011 performance was achieved after absorbing a ten per cent increase in net R&D expense to £463 million and a 29 per cent increase in capital expenditure to £467 million.
The Group’s joint venture with Daimler now owns over 99 per cent of Tognum for which Rolls-Royce paid cash consideration of £1.5 billion in 2011. This joint venture investment made a £30 million net contribution (after costs and financing) to underlying profit before tax but did not impact the Group’s 2011 revenues. On January 2, 2012, the Group contributed its Bergen Diesels business to the joint venture, resulting in a cash benefit to the Group of €200 million.
The Group’s proposed sale of its 32.5 per cent shareholding in IAE is subject to regulatory approval and did not impact 2011 financial performance. Rolls-Royce will continue to play an active role as a first tier supplier to IAE of high-pressure compressors and fan blades and remains responsible for the final assembly of 50 per cent of the production engines. The announced new joint venture with Pratt & Whitney to develop an engine to power the next generation of mid-size aircraft is also subject to regulatory approval and had no effect on 2011 financial performance.
A strong performance
Finance Director’s review
Demand for our products and services remains robust.

Rolls-Royce plc Directors’ report and financial statements 2011
13
Directors’ report
Dire
ctor
s’ re
port
Underlying figures are considered more representative of the trading performance by excluding the impact of year end mark-to-market adjustments of outstanding financial instruments on the reported performance, principally relating to the GBP/USD hedge book. In addition the net post-retirement financing is excluded and, in 2011, adjustments have been made to exclude one-off past-service credits on post-retirement schemes and the effect of acquisition accounting. The adjustments between the underlying income statement and the reported income statement are set out in more detail in note 2 of the financial statements. This basis of presentation has been applied consistently since the transition to IFRS in 2005.
Underlying income statementUnderlying income statement extracts – £ million 2011 2010 Change
Revenue 11,277 10,866 +4% civil aerospace 5,572 4,919 +13% defence aerospace 2,235 2,123 +5% marine 2,271 2,591 -12% energy 1,199 1,233 -3%Profit before financing costs and taxation 1,206 1,010 +19% civil aerospace 499 392 +27% defence aerospace 376 309 +22% marine 323 332 -3% energy 24 27 -11% engine holding (Tognum JV) 36 – – central costs (52) (50) -4%Net financing costs (48) (54) +11%Profit before taxation 1,158 956 +21%Taxation (261) (236) +11%Profit for the year 897 720 +25%Other itemsOther operating income 70 87 -20%Gross R&D investment 908 923 -2%Net R&D charged to the income statement 463 422 +10%
Underlying revenue increased four per cent to £11.3 billion. This includes a nine per cent growth in services revenue to £6.0 billion that more than offset a one per cent reduction in Original Equipment (OE) revenue to £5.3 billion. OE performance included strong 18 per cent growth in civil aerospace offset by a greater than anticipated reduction of 23 per cent in marine OE revenue. Underlying services revenue continues to represent more than half (53 per cent) of the Group’s underlying revenues. In 2011, growth in underlying services revenue was due to a number of factors: the installed base of products grew and the services network expanded; defence aerospace benefited from one-off contract termination settlements resulting from the Strategic Defence and Security Review (SDSR) of the UK Ministry of Defence (MoD); and marine services saw further growth of nine per cent.
Finance Director’s review
Underlying profit before financing costs and taxation increased 21 per cent to £1.16 billion. This was due to a number of factors, a better mix between OE and services, a significant improvement in productivity resulting from the focus on cost, net foreign exchange (FX) benefits of £54 million including an eight cent improvement in the achieved rate on selling USD income, £30 million from Tognum net of the costs of the acquisition and a number of one-off items, the most significant which relates to a £60 million benefit from the SDSR settlements referred to earlier.
Further discussion of trading is included in the business segment reports on page 16 to 23.
Underlying financing costs reduced 11 per cent to £48 million, including a small reduction in financial Risk & Revenue Sharing Partnerships (RRSPs) costs and lower funding costs due to the settlement of the Group’s €750 million Eurobond during the year.
Underlying taxation was £261 million, an underlying tax rate of 22.6 per cent compared with 24.7 per cent in 2010. This reduction reflects increased profits from joint ventures (which are accounted for on a post-tax basis) and some adjustments to prior year estimates.
Other operating income relates to programme receipts from RRSPs, which reimburse past R&D costs. These receipts decreased by 20 per cent in 2011 due to the phasing of major programmes such as the Trent XWB.
Net R&D charged to the income statement increased by ten per cent to £463 million. The Group recruited an additional 1,000 engineers to develop the products of the future and to help improve the in-service performance of the existing installed base of products. This investment and the 29 per cent increase in capital expenditure to £467 million will prepare our infrastructure and global supply chain for significant growth in the next decade. The Group continues to expect net R&D investment to remain within four to five per cent of Group underlying revenue.

Rolls-Royce plc Directors’ report and financial statements 2011
14
Directors’ report
Balance sheetSummary balance sheet – £ million 2011 2010
Intangible assets 2,882 2,884Property, plant and equipment 2,338 2,136Net post-retirement scheme deficits (397) (856)Net working capital (942) (1,223)Net funds 222 1,598Provisions (502) (544)Net financial assets and liabilities (714) (604)Share of results of joint ventures and associates 1,680 393Assets held for sale 178 9Other net assets and liabilities (67) 24Net assets 4,678 3,817Other itemsUSD hedge book (US$ million) 22,000 20,900Net TotalCare assets 956 920Gross customer finance contingent liabilities 612 633Net customer finance contingent liabilities 124 121
Intangible assets relate to goodwill, certification costs, participation fees, development expenditure, recoverable engine costs, software and other costs that represent long-term assets of the Group. In aggregate, these assets remained broadly unchanged at £2.9 billion: this was largely due to increased development, certification and software costs being offset by the reclassification of V2500 assets on the balance sheet as assets held for sale. The carrying values of the intangible assets are assessed for impairment against the present value of forecast cash flows generated by the intangible asset. The principal risks remain: reductions in assumed market share; programme timings; increases in unit cost assumptions; and adverse movements in discount rates. There have been no impairments in 2011. Further details are given in note 7 of the financial statements.
Property, plant and equipment increased by nine per cent to £2.3 billion due to the ongoing development and refreshment of facilities and tooling as the Group prepares for increased production volumes.
Net post-retirement scheme deficits decreased 54 per cent to £397 million, including: (i) the impact of the change in pensions’ indexing to CPI in the UK (£130 million); (ii) revised healthcare benefits in certain overseas schemes (£74 million); and (iii) the reduction in discount rates having a larger impact on the value of the assets than the obligations (calculated on an IAS 19 basis).
Overall funding across the schemes has improved in recent years as the Group has adopted a lower risk investment strategy that reduces volatility going forward and enables the funding position to remain stable: interest rate and inflation risks are largely hedged; exposure to equities has reduced to around 20 per cent of scheme assets, this has been achieved against the headwind of increasing life expectancy assumptions.
In 2011, the Group made further arrangements to reduce volatility and enable future funding to be predicted with more certainty. A longevity swap was transacted with a third party to eliminate the risk of increasing life expectancy of pensioners in the largest UK defined benefit scheme. No significant change is expected to the ongoing funding levels of the UK pension schemes in 2012.
Finance Director’s review
Net funds decreased by 86 per cent to £222 million largely due to the £1.5 billion consideration paid during the year for the Group’s shared investment in Tognum. As a result, average net funds fell by £628 million to £341 million (£826 million excluding acquisitions).
Investment – joint ventures and associates increased in the year as a result of the investment in Tognum.
Assets held for sale represent the assets and liabilities expected to be derecognised of as a result of the anticipated restructuring of IAE.
Provisions largely relate to warranties and guarantees provided to secure the sale of OE and services. These provisions reduced modestly during the year.
Net financial assets and liabilities relate to financial RRSPs and the fair value of foreign exchange, commodity and interest rate contracts, set out in detail in note 16 to the financial statements. The change largely reflects the impact of the change in the GBP/USD exchange rate on the valuation of foreign exchange contracts.
The USD hedge book increased five per cent to US$22.0 billion. This represents around four and a half years of net exposure and has an average book rate of £1 to US$1.60. Current forward market exchange rates are similar to current average book rates.
Net TotalCare® assets relate to long-term service agreement (LTSA) contracts in the civil aerospace business, including the flagship services product TotalCare. These assets represent the timing difference between the recognition of income and costs in the income statement and cash receipts and payments.
Customer financing facilitates the sale of OE and services by providing financing support to certain customers. Where such support is provided by the Group, it is generally to customers of the civil aerospace business and takes the form of various types of credit and asset value guarantees. These exposures produce contingent liabilities that are outlined in note 22 to the financial statements. The contingent liabilities represent the maximum aggregate discounted gross and net exposure in respect of delivered aircraft, regardless of the point in time at which such exposures may arise.
During 2011, the Group’s exposure remained stable with gross and net exposures of £612 million and £124 million respectively. As has been well-publicised, some banks that have been active in recent years in providing funds for aircraft financing have chosen during 2011 to substantially reduce their exposure in this market segment. Although this may have some effect on the terms and pricing of new aircraft finance transactions in the near future, the Group expects that other providers of USD funding and ongoing support from the export credit agencies will largely fill the gap left by these banks.

Rolls-Royce plc Directors’ report and financial statements 2011
15
Directors’ report
Dire
ctor
s’ re
port
Finance Director’s review
Group 2012 guidanceExcluding the impact of the Tognum acquisition and the proposed IAE transaction, in 2012 the Group expects to see good growth in underlying revenue and underlying profit with a cash flow around breakeven as we continue to invest for future growth.
In civil aerospace, we anticipate good growth in underlying revenue and strong growth in underlying profit. In defence aerospace, we expect modest growth in underlying revenue and profit. In marine, we expect a modest increase in underlying revenue, with underlying profit broadly flat. And in energy, we see growth in revenue and some improvement in profit.
Other relevant dataForeign exchange: neutral.
Taxation: the underlying tax rate is expected to be around 24 per cent.
R&D: a modest increase in expenditure combined with lower net capitalisation and higher amortisation due to the phasing of new programmes.
Capital expenditure: a modest increase, including increased investment in IT.
Pensions: no material changes expected to funding levels.
Intangible assets: modest increase compared with 2011 due to a modest increase in recoverable engine costs partially offset by a decrease in development costs due to the phasing of new programmes.
Property, plant and equipment: modest increase compared with 2011 as we continue to invest in capability and infrastructure.
TognumTognum is expected to contribute in the first half to the Group’s share of results of joint ventures and associates. Tognum’s results are expected to be fully consolidated around the half year with Daimler’s 50 per cent share of the result recorded as a non-controlling interest. For 2012, Tognum will be reported separately. As Tognum remains a listed company and will issue its preliminary results on March 8, 2012, the Group is not providing guidance at this time.
IAEThe sale of the Group’s 32.5 per cent shareholding in IAE is expected to receive regulatory approval during 2012, at which time the initial cash consideration of US$1.5 billion will be received. For the first full year following settlement, the impact of the sale on subsequent trading will have a small negative effect on underlying revenue and a positive effect of around £140 million on underlying profit. The impact on the order book will be a reduction of around £4 billion.
Additional financial information can be found on pages 34 and 35.
Rolls-Royce plc Directors’ report and financial statements 2011
16
Directors’ report
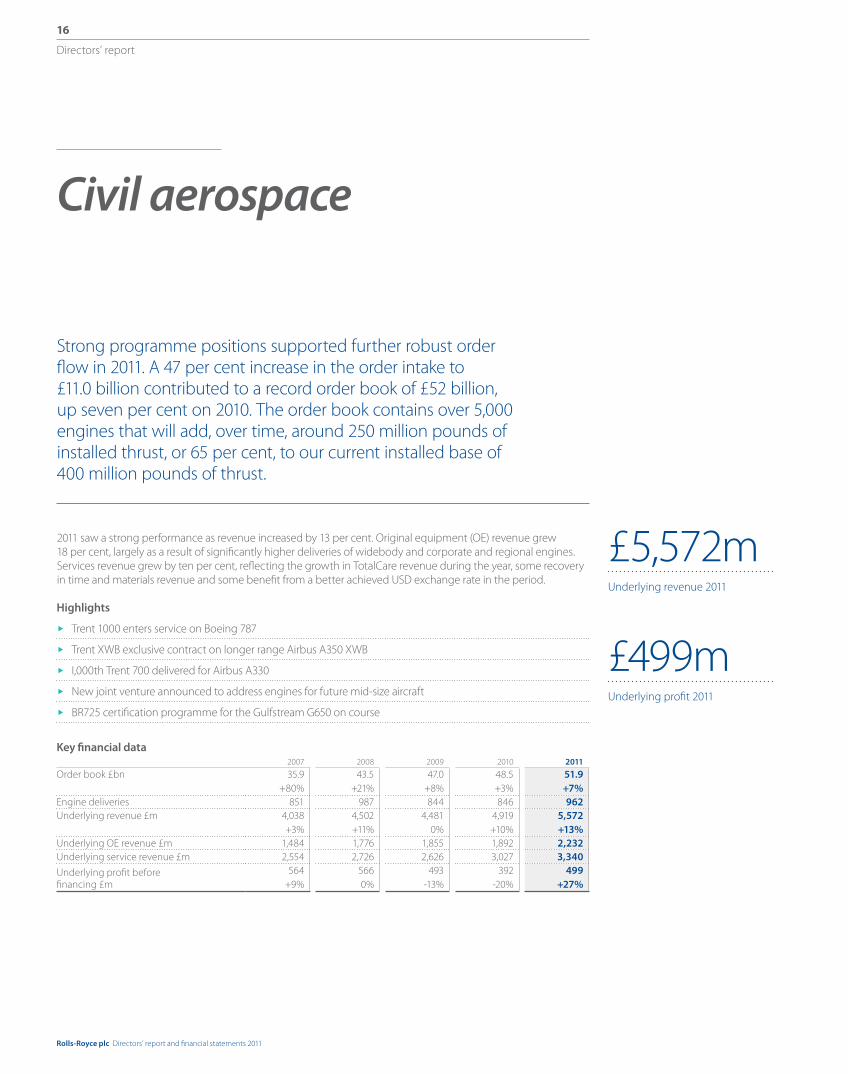
Civil aerospace
Strong programme positions supported further robust order flow in 2011. A 47 per cent increase in the order intake to £11.0 billion contributed to a record order book of £52 billion, up seven per cent on 2010. The order book contains over 5,000 engines that will add, over time, around 250 million pounds of installed thrust, or 65 per cent, to our current installed base of 400 million pounds of thrust.
2011 saw a strong performance as revenue increased by 13 per cent. Original equipment (OE) revenue grew 18 per cent, largely as a result of significantly higher deliveries of widebody and corporate and regional engines. Services revenue grew by ten per cent, reflecting the growth in TotalCare revenue during the year, some recovery in time and materials revenue and some benefit from a better achieved USD exchange rate in the period.
£5,572mUnderlying revenue 2011
£499mUnderlying profit 2011
Highlights
Trent 1000 enters service on Boeing 787
Trent XWB exclusive contract on longer range Airbus A350 XWB
I,000th Trent 700 delivered for Airbus A330
New joint venture announced to address engines for future mid-size aircraft
BR725 certification programme for the Gulfstream G650 on course
Key financial data 2007 2008 2009 2010 2011
Order book £bn 35.9+80%
43.5+21%
47.0+8%
48.5+3%
51.9+7%
Engine deliveries 851 987 844 846 962Underlying revenue £m 4,038
+3%4,502+11%
4,4810%
4,919+10%
5,572+13%
Underlying OE revenue £m 1,484 1,776 1,855 1,892 2,232Underlying service revenue £m 2,554 2,726 2,626 3,027 3,340
Underlying profit before financing £m
564+9%
5660%
493-13%
392-20%
499+27%

Rolls-Royce plc Directors’ report and financial statements 2011
17
Directors’ report
Dire
ctor
s’ re
port
The civil aerospace business is a major manufacturer of aero engines for all sectors of the airliner and corporate jet market. Rolls-Royce powers more than 30 types of commercial aircraft and over 13,000 engines are in service with customers around the world.
In 2011, the airline industry continued a slow but steady recovery despite continued economic uncertainty. Passenger traffic continued to show above average growth but the cargo market slackened. Whilst the small and mid-size business jet market remained flat, Rolls-Royce continued to benefit from the resilience of the market for large-cabin business aircraft.
Widebody2011 was an important year for the Trent family of engines. In September 2011, Rolls-Royce was proud to power the entry into service of the Boeing 787 Dreamliner with launch customer ANA. During the year two new customers placed orders for Trent 1000s to power their Dreamliners.
Development of the Trent XWB continued apace, with the test programme yielding exceptional results in terms of fuel efficiency and reliability. The Trent XWB for the Airbus A350 XWB, is the fastest ever selling member of the Trent family of engines. Over 1,100 Trent XWBs have been ordered so far, more than the total number of Trent 700s currently in service. Market successes in 2011 included significant orders from Thai Airways International and Air France. Entry into service is now expected in the first half of 2014. In June 2011, Rolls-Royce announced an exclusive engine provider agreement with Airbus for Rolls-Royce to produce a higher-thrust version of the Trent XWB, enabling Airbus to offer increased range and capacity for the A350-1000.
In October 2011, the 1,000th Trent 700 engine was delivered for the A330 programme. During the year, further orders were received for approximately 150 Trent 700 engines from customers around the world including major orders from Cathay Pacific, Saudi Arabian Airlines and Singapore Airlines. There are three engine options for the A330 and the Trent 700 won 75 per cent of the orders contested in 2011.
The Trent 900 continues to be the leading engine for the Airbus A380 in terms of through-life fuel burn and emissions. The Trent 900 has been selected by 11 of the 16 airlines that have so far made an engine choice. China Southern is the latest customer to place Rolls-Royce powered A380s into service. New order announcements in 2011 came from Asiana of Korea and Skymark of Japan.
In November 2011, American Airlines entered Chapter 11 bankruptcy protection. The Group has equipment in service and a joint venture repair and overhaul business with the airline and remains in close contact with the customer as the airline manages this process. There was no significant impact on the financial results.
NarrowbodyA new joint venture with Pratt & Whitney was announced in October 2011 to develop engines for future generation mid-size aircraft. This move enhances the strong position of Rolls-Royce in the mid-size airliner market.
Rolls-Royce is also to sell its shareholding in IAE, manufacturer of the V2500 engine, to Pratt & Whitney. The relevant agreements remain subject to various closing conditions including regulatory approvals. Rolls-Royce will remain a key supplier, responsible for the engineering support and manufacture of high-pressure compressors and the final assembly of 50 per cent of the V2500 engine. Orders for over 150 V2500-powered aircraft were taken in 2011.
Corporate and regionalIn March 2011, Rolls-Royce delivered the 2,000th BR710 engine from the Dahlewitz plant in Germany where the engine was developed. The BR710 powers a number of Bombardier and Gulfstream business jets. The certification programme for the Gulfstream G650 powered by Rolls-Royce BR725 engines remains on course despite the tragic accident suffered by one of the test aircraft in April 2011. Service entry is expected in mid-2012. The development programme for the AE 3007C engine for the Cessna Citation TEN is on plan and the first flight took place in December 2011. Entry into service is planned by the end of 2013.
ServicesRevenue and engine flying hours from TotalCare improved during 2011, driven by the growth of aircraft in service and increased utilisation of existing fleets.
Civil aerospace
Rolls-Royce plc Directors’ report and financial statements 2011
18
Directors’ report
Defence aerospace
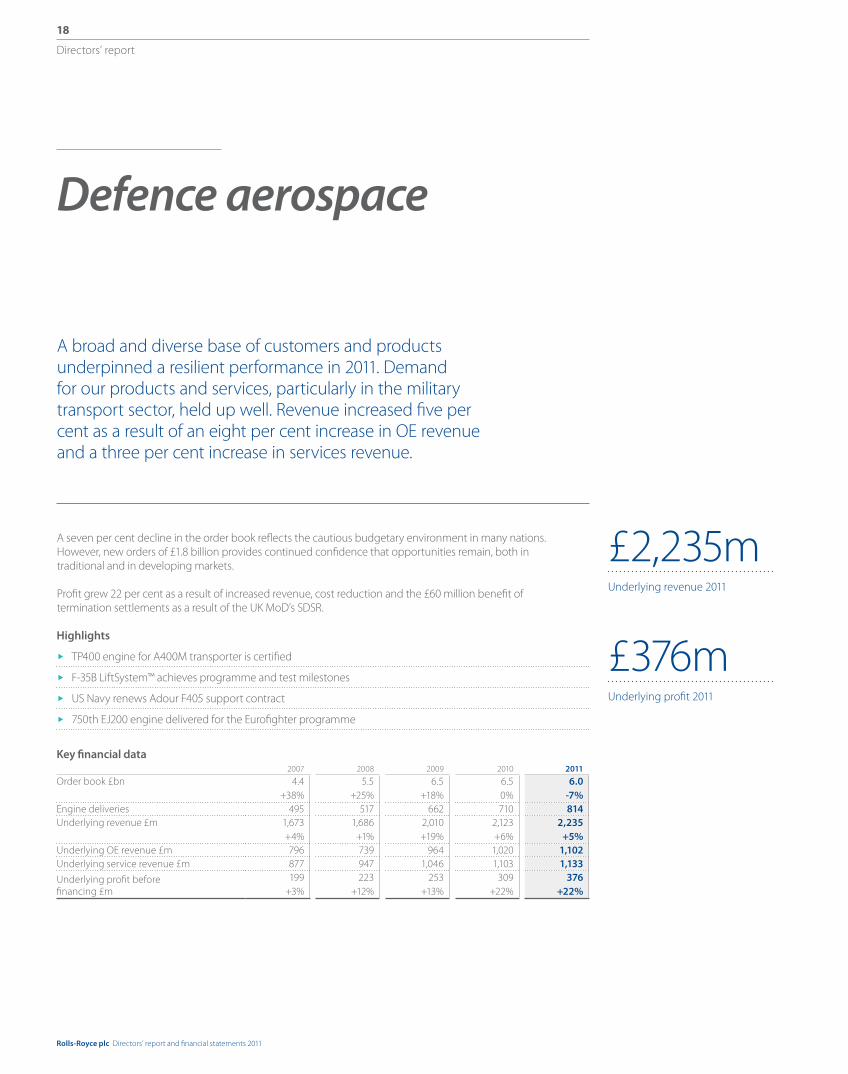
A broad and diverse base of customers and products underpinned a resilient performance in 2011. Demand for our products and services, particularly in the military transport sector, held up well. Revenue increased five per cent as a result of an eight per cent increase in OE revenue and a three per cent increase in services revenue.
Highlights
TP400 engine for A400M transporter is certified
F-35B LiftSystem™ achieves programme and test milestones
US Navy renews Adour F405 support contract
750th EJ200 engine delivered for the Eurofighter programme
Key financial data 2007 2008 2009 2010 2011
Order book £bn 4.4+38%
5.5+25%
6.5+18%
6.50%
6.0-7%
Engine deliveries 495 517 662 710 814Underlying revenue £m 1,673
+4%1,686+1%
2,010+19%
2,123+6%
2,235+5%
Underlying OE revenue £m 796 739 964 1,020 1,102Underlying service revenue £m 877 947 1,046 1,103 1,133
Underlying profit before financing £m
199+3%
223+12%
253+13%
309+22%
376+22%
£2,235mUnderlying revenue 2011
£376mUnderlying profit 2011
A seven per cent decline in the order book reflects the cautious budgetary environment in many nations. However, new orders of £1.8 billion provides continued confidence that opportunities remain, both in traditional and in developing markets.
Profit grew 22 per cent as a result of increased revenue, cost reduction and the £60 million benefit of termination settlements as a result of the UK MoD’s SDSR.

Rolls-Royce plc Directors’ report and financial statements 2011
19
Directors’ report
Dire
ctor
s’ re
port
Rolls-Royce is the world’s second largest provider of defence aero-engine products and services, with 18,000 engines in service for 160 customers in 103 countries. Our engines power aircraft in all sectors: transport, combat, reconnaissance, training, helicopters, and unmanned aerial vehicles.
TransportWe are a world leader in the military transport market with over 6,700 engines in service.
The global fleet of AE 2100 engines, which powers both the Lockheed Martin C-130J and the Alenia C-27J transport aircraft, continues to expand. The Emirate of Qatar and the Indian Air Force both received their first C-130Js in 2011. The global AE 2100 fleet also passed the three million flight hour milestone during the year.
The TP400 engine for the Airbus A400M military transport aircraft received civil certification from EASA in May 2011 and has amassed over 8,000 flying hours as part of the flight-test programme. Delivery of the engines for the first production aircraft are due to begin in early 2012, part of the initial order of 180 aircraft.
Important milestones were achieved in the T56 upgrade programme for legacy variants of the C-130 and P-3 Orion aircraft. This engine variant provides significant fuel and operating cost savings.
CombatIn the combat sector the Rolls-Royce LiftSystem® for the short take-off and vertical landing (STOVL) variant of Lockheed Martin’s F-35 Lightning II Joint Strike Fighter achieved its ‘Initial Service Release’.
In October 2011, two F-35B aircraft accomplished 72 STOVLs on the USS Wasp during a successful three-week testing period of sea trials. In the same month, the first LiftFan™ to be assembled at our new dedicated state-of-the-art factory in Indianapolis, USA, rolled off the production line. In January 2012 , probationary status was lifted for the F-35B and the first STOVL aircraft were delivered to the customer.
Funding for the development programme of the F136 engine, in which Rolls-Royce is a 40 per cent partner, for the F-35 Joint Strike Fighter was terminated by the US Department of Defense in February 2011, despite strong continuing Congressional support.
During 2011, we delivered the 750th EJ200 engine on behalf of Eurojet for the Eurofighter programme.
The Eurofighter Typhoon was deployed on combat operations for the first time as part of the NATO operation in Libya, displaying outstanding levels of performance and reliability. The Typhoon is a contender for the KF-X programme in South Korea.
We continue to make good progress on the US Air Force Adaptive Versatile Engine Technology (ADVENT) demonstrator programme. It is designed to significantly reduce fuel consumption, enabling extended mission ranges and loiter times for future generations of military aircraft.
Unmanned vehiclesIn the unmanned air systems sector we successfully completed a US Air Force funded flight-test programme for the growth variant of the AE 3007H engine for Global Hawk.
Small enginesGippsAero of Australia selected the M250 turboprop engine to power its new ten seat passenger aircraft, the GA10.
In the helicopter market, the Apache fleet of the UK Army Air Corps, powered by the RTM322 engine, reached 200,000 flying hours.
ServicesThe success of our services business continued in 2011, with MissionCare™ contracts secured to provide availability-based engine support for the C-130 fleets of the UK and US air forces. The US Navy again renewed its US$100 million support agreement for Adour F405 engines in the T-45 Goshawk trainer.
Rolls-Royce also earned praise for its support of the frontline operations of the UK armed forces air campaign over Libya which involved eight different types of Rolls-Royce powered aircraft.
Defence aerospace

Rolls-Royce plc Directors’ report and financial statements 2011
20
Directors’ report
Marine
Despite the uncertain market and macro-economic conditions, a resilient performance was achieved in 2011, as demand for our products and services gradually returns. New order intake during the year was strong, up 15 per cent to £2.1 billion, although the order book decreased largely due to the slower than expected conversion of OE bid activity to new orders.
Highlights
Significant increase in new orders and continued growth in offshore oil and gas sector
First contract secured for award-winning NVC 405 Environship liquid natural gas-powered cargo vessels
Service centres in Europe, Africa and Asia opened or expanded
Customer training and simulator centres opened in Norway and Singapore
Tognum acquisition largely completed
Key financial data 2007 2008 2009 2010 2011
Order book £bn 4.7+96%
5.2+11%
3.5-33%
3.0-16%
2.7 -8%
Underlying revenue £m 1,548+19%
2,204+42%
2,589+17%
2,591+0%
2,271-12%
Underlying OE revenue £m 1,003 1,492 1,804 1,719 1,322Underlying service revenue £m 545 712 785 872 949
Underlying profit before financing £m
113+12%
183+62%
263+44%
332+26%
323-3%
£2,271mUnderlying revenue 2011
£323mUnderlying profit 2011
Revenue decreased 12 per cent, impacted mainly by slow second half OE revenue that resulted in OE revenue for the full year down 23 per cent. This slower than expected recovery of OE revenue was partially offset by a nine per cent increase in underlying service revenue. Our expanding network of service centres continues to take advantage of the growth in recent years of the global fleet of vessels equipped with our products, engines and propulsion systems.
Profit declined by three per cent relative to a fall in revenue of 12 per cent, reflecting an improved revenue mix and an increased focus on costs and operational performance.

Rolls-Royce plc Directors’ report and financial statements 2011
21
Directors’ report
Dire
ctor
s’ re
port
Rolls-Royce has a world-leading range of capabilities in the marine market, encompassing vessel design, the integration of complex systems and the supply and support of power and propulsion equipment. We are leaders in mission-critical systems for offshore oil and gas, merchant and naval vessels.
OffshoreMarine performed strongly in the offshore oil and gas sector. This was largely based on the proven success of our specialist UT vessel design capabilities and our proficiency at integrating sophisticated systems into complex ships.
As the industry continues to explore ever deeper waters, like those in the South Atlantic off the coast of Brazil, we will continue to be a strong partner for our customers for offshore oil and gas exploration, production, service and support.
MerchantWe continue to invest in technology that addresses the need for more efficient and environmentally sustainable power and propulsion systems.
Our successful design and systems integration approach was validated in 2011 through an order by NorLines for two award-winning NVC 405 Environship short sea cargo vessels. These vessels incorporate a wave-piercing hull, a liquid natural gas engine and an integrated rudder and propeller system, which, in combination, reduces fuel consumption and cuts CO2 emissions by up to 40 per cent compared to conventional vessels.
NavalPower and propulsion equipment was delivered for the UK’s Queen Elizabeth class aircraft carriers. In early 2011, we received an order from Lockheed Martin for the provision of MT30s, the world’s most powerful marine gas turbine, to power a further ten US Navy Littoral Combat Ships. The MT30’s success on this programme is generating interest from navies in Europe, Asia and South America.
We have established a naval ship design team, specifically to address the growing opportunity in the patrol craft and support ship market. The business now has ship design teams for each of the offshore, merchant and naval sectors.
The submarines business celebrated the UK Government’s decision in May 2011, to replace the UK’s Vanguard class nuclear submarine with a new design of submarine utilising the Group’s Pressurised Water Reactor (PWR) Generation 3 reactor technology.
ServicesWe expanded our service capacity to better realise the significant opportunity that our large installed base of equipment represents. Five facilities in Namibia, the Netherlands, Poland, Germany and Hong Kong were either constructed or expanded during the year. We also continued developing our service related capabilities by enhancing our spare parts delivery network and opening customer training facilities in Norway and Singapore.
TognumThrough our joint venture with Daimler, we largely completed the acquisition of Tognum, which owns world-class high-speed reciprocating engine manufacturer MTU Friedrichshafen and subsequently, in January 2012, contributed our Bergen medium-speed engines business into the new entity. The benefits of these complementary technologies create greater design and power and propulsion systems integration opportunities across marine, particularly for our naval and merchant businesses.
Access to a large installed base of equipment, and a mature customer support network, creates further growth opportunities.
Marine
Rolls-Royce plc Directors’ report and financial statements 2011
22
Directors’ report
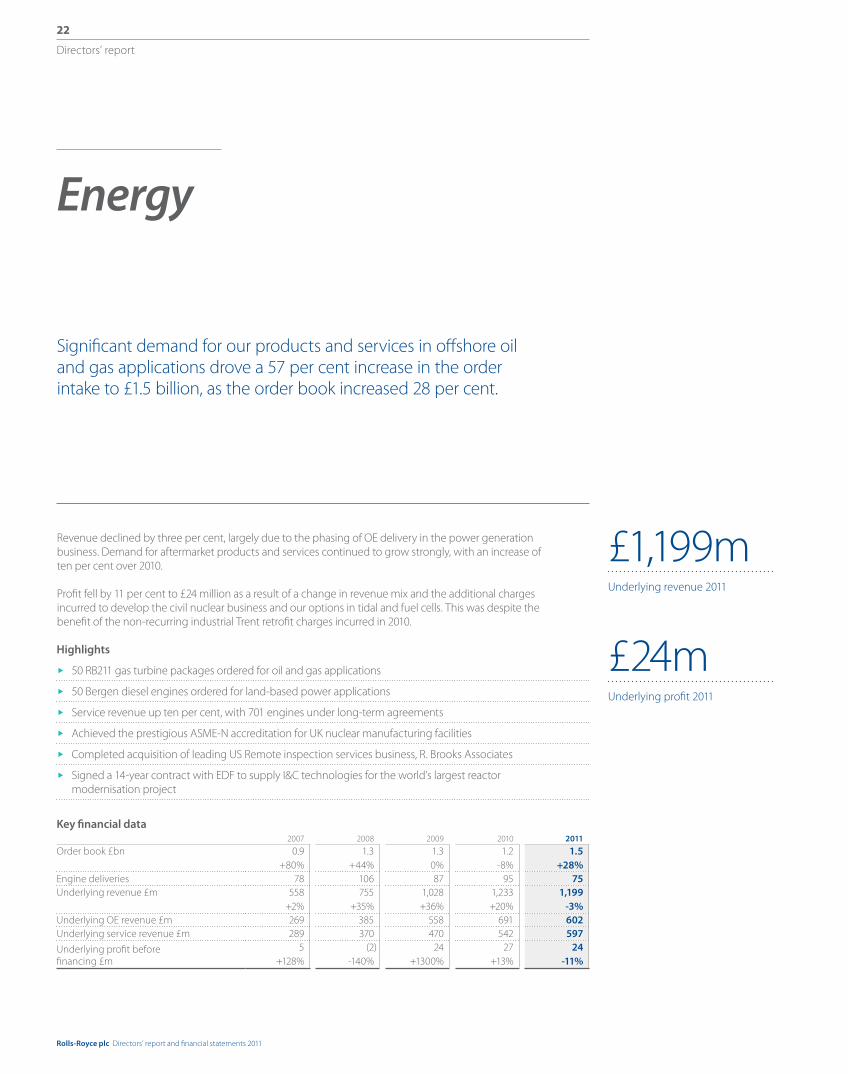
Energy
Significant demand for our products and services in offshore oil and gas applications drove a 57 per cent increase in the order intake to £1.5 billion, as the order book increased 28 per cent.
Highlights
50 RB211 gas turbine packages ordered for oil and gas applications
50 Bergen diesel engines ordered for land-based power applications
Service revenue up ten per cent, with 701 engines under long-term agreements
Achieved the prestigious ASME-N accreditation for UK nuclear manufacturing facilities
Completed acquisition of leading US Remote inspection services business, R. Brooks Associates
Signed a 14-year contract with EDF to supply I&C technologies for the world’s largest reactor modernisation project
Key financial data 2007 2008 2009 2010 2011
Order book £bn 0.9+80%
1.3+44%
1.30%
1.2-8%
1.5 +28%
Engine deliveries 78 106 87 95 75Underlying revenue £m 558
+2%755
+35%1,028+36%
1,233+20%
1,199-3%
Underlying OE revenue £m 269 385 558 691 602Underlying service revenue £m 289 370 470 542 597
Underlying profit before financing £m
5+128%
(2)-140%
24+1300%
27+13%
24-11%
£1,199mUnderlying revenue 2011
£24mUnderlying profit 2011
Revenue declined by three per cent, largely due to the phasing of OE delivery in the power generation business. Demand for aftermarket products and services continued to grow strongly, with an increase of ten per cent over 2010.
Profit fell by 11 per cent to £24 million as a result of a change in revenue mix and the additional charges incurred to develop the civil nuclear business and our options in tidal and fuel cells. This was despite the benefit of the non-recurring industrial Trent retrofit charges incurred in 2010.

Rolls-Royce plc Directors’ report and financial statements 2011
23
Directors’ report
Dire
ctor
s’ re
port
Our energy business supplies customers with gas turbines, compressors, reciprocating engines, and related services to support the efficient production of oil and gas, and power generation around the world. We are establishing a strong position in the civil nuclear sector for the provision of mission-critical equipment, systems and engineering services.
The balanced nature of our portfolio has enabled us to deliver solid revenues of £1.2 billion, broadly in line with 2010. While the power generation sector in mature economies remains suppressed, due to excess generating capacity and low industrial demand, we continue to see growth in developing countries. The demand for oil and gas remains high, driven by a resilient oil price and global demand growth. In the second half of the year we secured significant oil and gas orders, increasing market share in the key Brazilian offshore market.
Oil and gasIn total, 50 RB211 packages were ordered during the year for oil and gas applications, 38 of which were for offshore.
The high price of oil continues to drive capital investment in the sector, particularly in deepwater exploration and production environments where the Group has technologies and expertise that are applicable. The business was awarded a new contract, valued at up to US$650 million to supply 32 RB211 gas turbine power generation packages and related services to Petrobras to support its long-term production activities offshore Brazil. This order increases the number of Rolls-Royce RB211-powered industrial gas turbine units installed in Brazil over the past ten years to 62.
In February 2011, we announced plans for the construction of a new purpose-built packaging, assembly and test facility in Rio de Janeiro, Brazil. The facility, expected to become operational in the first quarter of 2013, will strengthen our support of Petrobras’ exploration and production activities in the rapid growth pre-salt deepwater oil fields offshore Brazil.
In addition, we expanded our role in China’s gas pipeline industry with contracts to supply PetroChina, the largest oil and gas producer in China, with six RB211 gas turbine compressor packages for Line 2 of the West-East China Pipeline Project.
Power generationThe power generation sector remains suppressed in the developed world, the traditional market for the Trent gas turbine, which resulted in three new Trent unit orders.
Demand for Bergen reciprocating engines remains strong, reflected by an order intake of 50 units, of which 30 are for Bangladesh to help address the country’s power shortfalls, bringing total Bergen engines orders in Bangladesh to 82.
ServicesDemand for aftermarket products and services again grew strongly, delivering revenue of £597 million, an increase of ten per cent over 2010. Including the land-based reciprocating engines, there are now a total of 701 units, or 35 per cent of the engine fleet, under long-term service agreements. In 2012, we will launch the RB211 Gzero, an aftermarket upgrade product for the RB211-G gas generator that increases power by a nominal ten per cent.
TognumAs with the marine business, our energy business will benefit from the acquisition of Tognum through our joint venture with Daimler. By combining our medium-speed diesel and gas Bergen engines business with Tognum’s high-speed reciprocating engines, we will create a world leading reciprocating engines offering in the energy industry, significantly enhancing our core product and systems portfolio and global network of sales and service facilities. This will benefit customers across high-growth applications, including offshore and shale gas fracturing, as well as primary, standby and rental land-based power generation. In January 2012, the ownership of Bergen Engines transferred from Rolls-Royce to Engine Holding GmbH, the 50/50 joint venture company formed with Daimler.
Civil nuclearRolls-Royce made significant progress in developing its nuclear business in 2011, securing the prestigious ASME-N stamp accreditation at our UK nuclear manufacturing facilities. Plans for a new UK civil manufacturing facility progressed throughout 2011 and the business received outline planning permission for a potential site in South Yorkshire.
Strategic relationships with reactor vendors and utility operators were further strengthened. An important cooperation agreement was signed with Areva in March 2011, to cover the manufacture of complex components for the first European Pressurised Water Reactors (PWR) to be built in the UK.
Enhanced MoUs were also signed with Nuclear Power Delivery UK and EDF, the world’s largest utility operator. Additionally, the business entered into a landmark agreement with Rosatom, the Russian state-owned nuclear company, for the development of global civil nuclear programmes.
As a key step in growing its reactor services business, Rolls-Royce completed the acquisition of US-based R. Brooks Associates, a world leader in remote visual inspection.
We signed a €250 million contract with EDF to supply instrumentation and control (I&C) technologies to the world’s largest reactor upgrade programme, being carried out in France. We also opened a dedicated I&C service centre to enhance our operations for customers in China.
Energy

Rolls-Royce plc Directors’ report and financial statements 2011
24
Directors’ report
Excellence in technology
Research and technologyThe Group’s 12,400 engineers are an increasingly integrated global resource, whose activities include research and technology, product development and in-service support.
Our successful model of collaboration, through a network of 28 University Technology Centres and seven advanced manufacturing research centres, provides access to world-class research.
With the opening of three advanced manufacturing research centres in the UK during 2011, a total of five are now operational. The next two are due to be opened in the US in 2012 and Singapore in 2013. These centres bring companies, industrial sectors and universities around the world together, in a common endeavour to develop step-change improvements across a portfolio of manufacturing technologies.
In addition, the Advanced Simulation Research Centre was opened in Bristol, UK, in March 2011 and is now enabling Rolls-Royce and member organisations to access the latest simulation technologies for product development, reducing the need for costly physical testing and improving product design efficiency.
Civil aerospaceThe year was notable for the successful entry into service of our latest large engine, the Trent 1000, as launch engine for the Boeing 787 Dreamliner. The Trent 1000 completed 670 flights in service with launch customer ANA by the year end.
Flight testing of the BR725-powered Gulfstream G650 recovered from the tragic loss of a test aircraft in April to achieve Provisional Type Certification from the Federal Aviation Authority in November 2011.
The Trent XWB development programme continued successfully, with several key functional, maturity and certification tests completed at sites in four countries. The engine is the only option for the Airbus A350 airliner family. The Trent XWB promises to be the most efficient, large aero gas turbine ever produced.
Our ongoing work to improve the environmental performance of our products continued with key technology demonstrators. The Environmentally Friendly Engine (EFE) completed successful testing of an advanced ‘lean burn’ combustor. Meanwhile, the latest E3E medium-size, two-shaft demonstrator core completed testing at the University of Stuttgart’s altitude facility during the year.
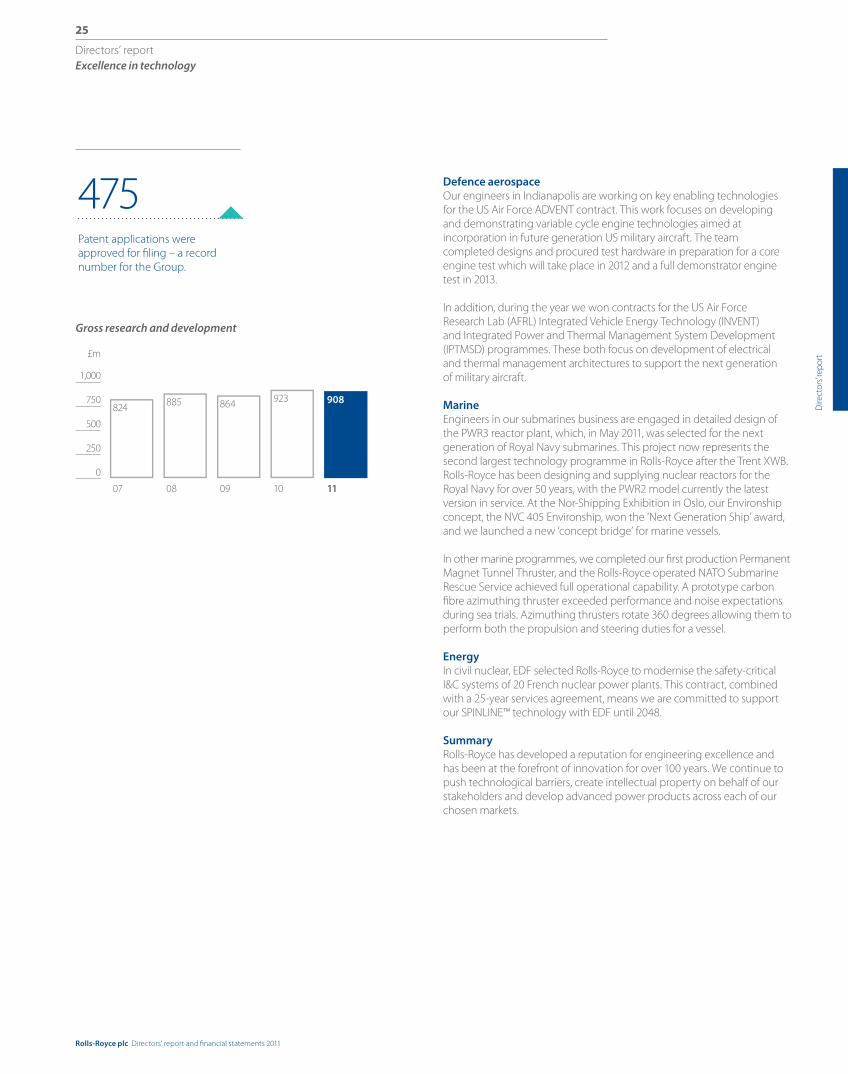
In 2011, Rolls-Royce invested £908 million in gross research and development, of which £520 million was funded from Group resources. Globally, 475 new patent applications were approved for filing – a record number for the Group.
Our research and development investment represents both a commitment to continuous improvement of our existing portfolio and a long-term investment in future technology.
Rolls-Royce plc Directors’ report and financial statements 2011
25
Directors’ report
Dire
ctor
s’ re
port
Defence aerospaceOur engineers in Indianapolis are working on key enabling technologies for the US Air Force ADVENT contract. This work focuses on developing and demonstrating variable cycle engine technologies aimed at incorporation in future generation US military aircraft. The team completed designs and procured test hardware in preparation for a core engine test which will take place in 2012 and a full demonstrator engine test in 2013.
In addition, during the year we won contracts for the US Air Force Research Lab (AFRL) Integrated Vehicle Energy Technology (INVENT) and Integrated Power and Thermal Management System Development (IPTMSD) programmes. These both focus on development of electrical and thermal management architectures to support the next generation of military aircraft.
MarineEngineers in our submarines business are engaged in detailed design of the PWR3 reactor plant, which, in May 2011, was selected for the next generation of Royal Navy submarines. This project now represents the second largest technology programme in Rolls-Royce after the Trent XWB. Rolls-Royce has been designing and supplying nuclear reactors for the Royal Navy for over 50 years, with the PWR2 model currently the latest version in service. At the Nor-Shipping Exhibition in Oslo, our Environship concept, the NVC 405 Environship, won the ‘Next Generation Ship’ award, and we launched a new ‘concept bridge’ for marine vessels.
In other marine programmes, we completed our first production Permanent Magnet Tunnel Thruster, and the Rolls-Royce operated NATO Submarine Rescue Service achieved full operational capability. A prototype carbon fibre azimuthing thruster exceeded performance and noise expectations during sea trials. Azimuthing thrusters rotate 360 degrees allowing them to perform both the propulsion and steering duties for a vessel.
EnergyIn civil nuclear, EDF selected Rolls-Royce to modernise the safety-critical I&C systems of 20 French nuclear power plants. This contract, combined with a 25-year services agreement, means we are committed to support our SPINLINE™ technology with EDF until 2048.
SummaryRolls-Royce has developed a reputation for engineering excellence and has been at the forefront of innovation for over 100 years. We continue to push technological barriers, create intellectual property on behalf of our stakeholders and develop advanced power products across each of our chosen markets.
Excellence in technology
Gross research and development
07 08 09 10 11
824 885 864 923 908
0
500
750
1,000
£m
250
475Patent applications were approved for filing – a record number for the Group.
Rolls-Royce plc Directors’ report and financial statements 2011
26
Directors’ report
Excellence in operations
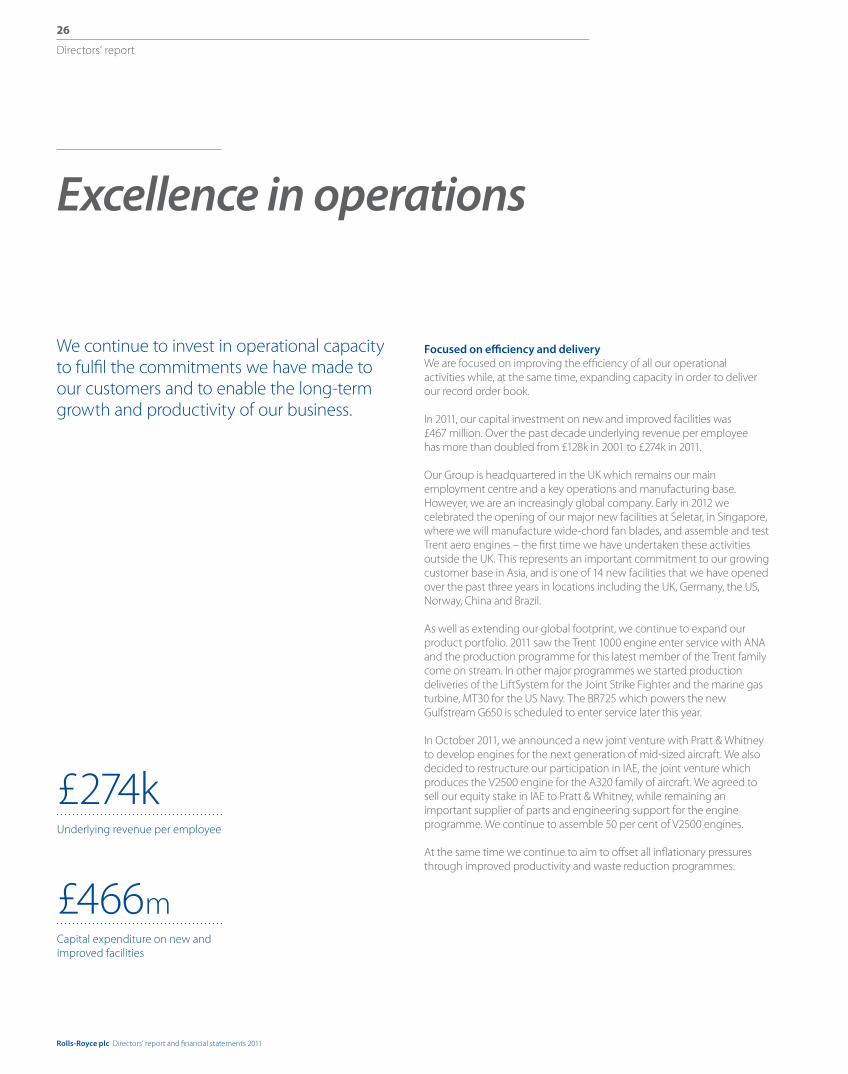
Focused on efficiency and deliveryWe are focused on improving the efficiency of all our operational activities while, at the same time, expanding capacity in order to deliver our record order book.
In 2011, our capital investment on new and improved facilities was £467 million. Over the past decade underlying revenue per employee has more than doubled from £128k in 2001 to £274k in 2011.
Our Group is headquartered in the UK which remains our main employment centre and a key operations and manufacturing base. However, we are an increasingly global company. Early in 2012 we celebrated the opening of our major new facilities at Seletar, in Singapore, where we will manufacture wide-chord fan blades, and assemble and test Trent aero engines – the first time we have undertaken these activities outside the UK. This represents an important commitment to our growing customer base in Asia, and is one of 14 new facilities that we have opened over the past three years in locations including the UK, Germany, the US, Norway, China and Brazil.
As well as extending our global footprint, we continue to expand our product portfolio. 2011 saw the Trent 1000 engine enter service with ANA and the production programme for this latest member of the Trent family come on stream. In other major programmes we started production deliveries of the LiftSystem for the Joint Strike Fighter and the marine gas turbine, MT30 for the US Navy. The BR725 which powers the new Gulfstream G650 is scheduled to enter service later this year.
In October 2011, we announced a new joint venture with Pratt & Whitney to develop engines for the next generation of mid-sized aircraft. We also decided to restructure our participation in IAE, the joint venture which produces the V2500 engine for the A320 family of aircraft. We agreed to sell our equity stake in IAE to Pratt & Whitney, while remaining an important supplier of parts and engineering support for the engine programme. We continue to assemble 50 per cent of V2500 engines.
At the same time we continue to aim to offset all inflationary pressures through improved productivity and waste reduction programmes.
We continue to invest in operational capacity to fulfil the commitments we have made to our customers and to enable the long-term growth and productivity of our business.
£274k
£466m
Underlying revenue per employee
Capital expenditure on new and improved facilities

Rolls-Royce plc Directors’ report and financial statements 2011
27
Directors’ report
Dire
ctor
s’ re
port
Excellence in operations
Integrated global approachAs we expand around the world, our operations strategy demands an integrated approach across activities, time zones and locations.
We continue to develop local capabilities to meet our customer requirements where appropriate. Brazil is a good example of this. We have had an aero repair and overhaul business there for over 50 years.
In 2009, we opened a service centre to support our growing marine business and, in 2011, we announced plans for the construction of a new US$100 million-plus gas turbine package, assembly and test facility for our energy business. This is expected to become operational in the first quarter of 2013.
These investments not only grow our global footprint but bring us closer to our customers in Brazil, adding significantly to our capabilities in a key growth market and enabling us to pursue further opportunities.
Supply partnerships and new programmesClose collaboration with our suppliers is critical to our continued success. Around 70 per cent of our manufacturing is conducted within our supply chain. As we continually develop intellectual property in technology, manufacturing, materials and processes we decide which elements of our programmes we produce ourselves and those which will be subcontracted to our suppliers. Our relationship is open, analytical and collaborative. We estimate that our supply base is currently investing at around twice the level of Rolls-Royce in order to accommodate growth and deliver greater efficiency.
As well as working with suppliers, we partner with universities and manufacturing research centres around the world to develop new technologies and processes which are more effective, efficient and robust.
Rolls-Royce is a long-term business in which consistent investment sustained over many years has delivered expanding global capability, accompanied by steadily improving productivity and performance. These factors coupled with a high focus on product integrity, enable us to effectively address both our customers’ current needs and their future requirements.

Rolls-Royce plc Directors’ report and financial statements 2011
28
Directors’ report
Business in the Community Corporate Responsibility Index (BitC)The BitC Index assesses the extent to which corporate strategy is integrated into business practice throughout an organisation. In 2011, Rolls-Royce retained its Gold status with an overall score of 91 per cent. We also scored 94 per cent in the Environmental Index component of the overall survey.
Dow Jones Sustainability World and European Indexes (DJSI)Rolls-Royce has retained its position in the DJSI for the tenth consecutive year, with an overall score of 78 per cent (aviation and defence sector average 49 per cent).
Carbon Disclosure Project (CDP)Rolls-Royce continues to be one of the leading companies in the CDP Index. Although our disclosure score in 2011 was lower than the previous year (75 vs 79 per cent in 2010) we remain committed to improving and reporting the carbon footprint of our operations.
2011
EnvironmentOur environment strategy focuses on three key areas:
1. maintain our drive to reduce the environmental impact of all our business activities;
2. further reduce the environmental impact of our products; and
3. develop entirely new low emission and renewable energy products.
1. Maintain our drive to reduce the environmental impact of all our business activitiesGreenhouse gas emissions We recognise the need to reduce the global greenhouse gas emissions (GHG) within our operations. For the past two years individual reduction targets and budgets have been agreed for our top 25 energy consuming sites. This has resulted in a further five per cent reduction (normalised on turnover) during 2011 in total GHG emissions (1) (including product test and development). Emissions from our facilities (excluding product test and development) have reduced by six per cent since 2009 compared with our five per cent reduction target by 2012 (2). In absolute terms, total GHG emissions have increased to 586.5 kt CO2e (scope 1 and 2). (1) Following further validation in 2012, the Group GHG emissions for 2009 have been re-stated. (2) Energy/GHG data for 2011 has been forecast based on data collected during January to October
2011. For details of the methodology see our ‘Basis of Reporting’ available at www.rolls-royce.com.
In 2011, we invested over £3.5 million in energy improvement projects including the upgrade of lighting, boiler controls and metering.
Our new facility at Seletar received the Singapore Government’s Building Construction Authority (BCA) Green Mark (Platinum) award in construction, for having a reduced environmental footprint.
Progress on certification Rolls-Royce continues to maintain accredited third-party certification to ISO 14001 for its environmental management systems, achieving full global re-certification in 2011.
Global supply chain In 2011, we led Global and Regional Supplier Forums, which focused on near-term and long-term improvements. We also hosted regional supplier groups, culminating in a global best practice sharing event aimed at promoting the application of lean techniques across the supply chain.
Sustainability
We remain committed to working with all our stakeholders to develop new approaches and technologies that will help provide solutions to sustainable economic growth.
We are striving to power a better world and recognise that we have a key part to play. We will continue to invest for the long term; we have a strong track record of innovation, and a long-standing commitment to research and development. Our sustainability programmes address: the environment; our people; and, the communities in which we operate.
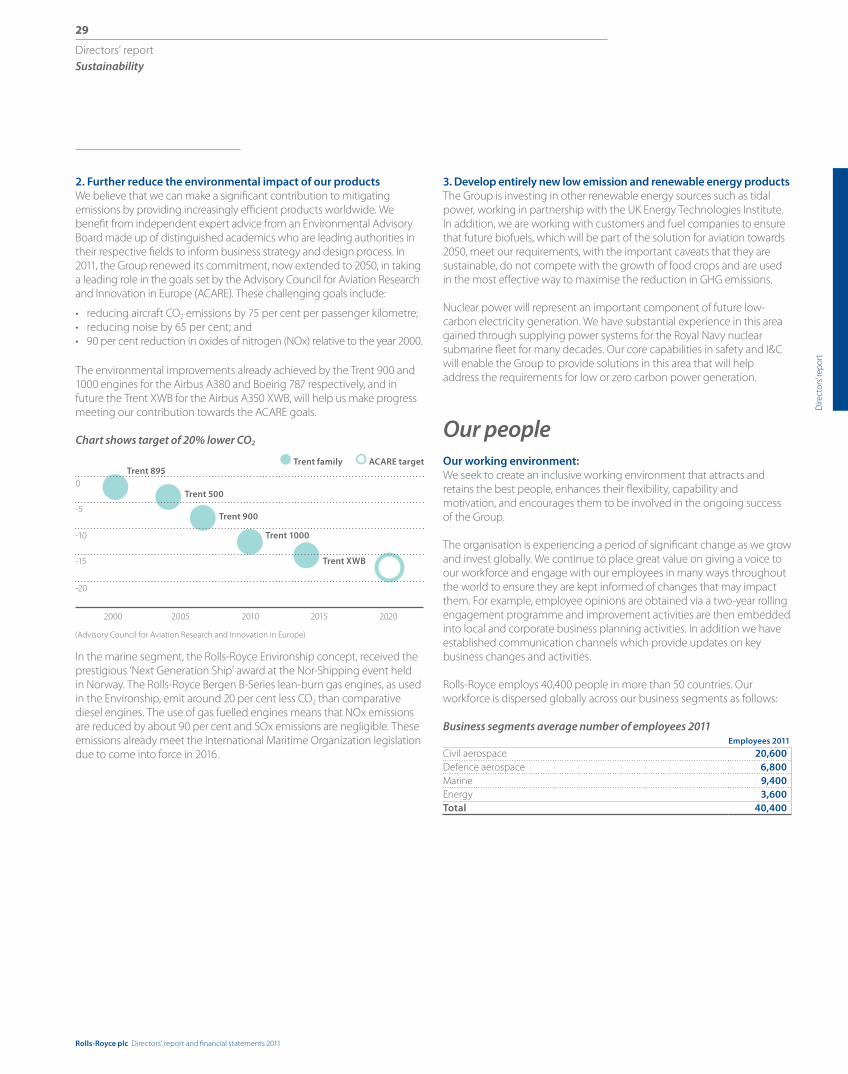
Rolls-Royce plc Directors’ report and financial statements 2011
29
Directors’ report
Dire
ctor
s’ re
port
2. Further reduce the environmental impact of our productsWe believe that we can make a significant contribution to mitigating emissions by providing increasingly efficient products worldwide. We benefit from independent expert advice from an Environmental Advisory Board made up of distinguished academics who are leading authorities in their respective fields to inform business strategy and design process. In 2011, the Group renewed its commitment, now extended to 2050, in taking a leading role in the goals set by the Advisory Council for Aviation Research and Innovation in Europe (ACARE). These challenging goals include:
• reducing aircraft CO2 emissions by 75 per cent per passenger kilometre;• reducing noise by 65 per cent; and• 90 per cent reduction in oxides of nitrogen (NOx) relative to the year 2000.
The environmental improvements already achieved by the Trent 900 and 1000 engines for the Airbus A380 and Boeing 787 respectively, and in future the Trent XWB for the Airbus A350 XWB, will help us make progress meeting our contribution towards the ACARE goals.
Chart shows target of 20% lower CO2
In the marine segment, the Rolls-Royce Environship concept, received the prestigious ‘Next Generation Ship’ award at the Nor-Shipping event held in Norway. The Rolls-Royce Bergen B-Series lean-burn gas engines, as used in the Environship, emit around 20 per cent less CO2 than comparative diesel engines. The use of gas fuelled engines means that NOx emissions are reduced by about 90 per cent and SOx emissions are negligible. These emissions already meet the International Maritime Organization legislation due to come into force in 2016.
3. Develop entirely new low emission and renewable energy productsThe Group is investing in other renewable energy sources such as tidal power, working in partnership with the UK Energy Technologies Institute. In addition, we are working with customers and fuel companies to ensure that future biofuels, which will be part of the solution for aviation towards 2050, meet our requirements, with the important caveats that they are sustainable, do not compete with the growth of food crops and are used in the most effective way to maximise the reduction in GHG emissions.
Nuclear power will represent an important component of future low-carbon electricity generation. We have substantial experience in this area gained through supplying power systems for the Royal Navy nuclear submarine fleet for many decades. Our core capabilities in safety and I&C will enable the Group to provide solutions in this area that will help address the requirements for low or zero carbon power generation.
Our peopleOur working environment:We seek to create an inclusive working environment that attracts and retains the best people, enhances their flexibility, capability and motivation, and encourages them to be involved in the ongoing success of the Group.
The organisation is experiencing a period of significant change as we grow and invest globally. We continue to place great value on giving a voice to our workforce and engage with our employees in many ways throughout the world to ensure they are kept informed of changes that may impact them. For example, employee opinions are obtained via a two-year rolling engagement programme and improvement activities are then embedded into local and corporate business planning activities. In addition we have established communication channels which provide updates on key business changes and activities.
Rolls-Royce employs 40,400 people in more than 50 countries. Our workforce is dispersed globally across our business segments as follows:
Business segments average number of employees 2011 Employees 2011
Civil aerospace 20,600Defence aerospace 6,800Marine 9,400Energy 3,600Total 40,400
Sustainability
(Advisory Council for Aviation Research and Innovation in Europe)
2000 2005 2010 2015 2020
-15
-10
-5
0
-20
Trent 500
Trent family ACARE target
Trent 900
Trent 1000
Trent XWB
Trent 895

Rolls-Royce plc Directors’ report and financial statements 2011
30
Directors’ report
EthicsThe Global Code of Business Ethics (Global Code) supports the Group’s approach to business conduct and defines its ethical principles and behaviours. Internal and external assessments of the Global Code during 2011 confirmed that it represents best-in-class standards.
During the year, the Group completed a review of its anti-bribery and corruption related policies and procedures. This review considered applicable law, including the UK Bribery Act, which came into force on July 1, 2011. We also put in place a compliance organisation, led by a Chief Compliance Officer. We issued a number of new and updated global policies in multiple languages including: raising concerns, conflicts of interest, competitive intelligence and, sponsorships and charitable donations. Training was developed to support these as required.
Rolls-Royce actively supports aerospace and defence industry initiatives to drive responsible business behaviour in the sector. We are represented on the Business Ethics Committee of the Aerospace and Defence Industries Association of Europe (ASD) and we are one of the international companies on the task force managing the International Forum for Business Ethics (IFBEC), a body which brings together US and European aerospace and defence companies to share best practice and develop common standards.
Encouraging diversityOur global governance framework for diversity includes a senior executive Global Diversity Steering Group that provides leadership and shapes strategic direction.
During 2011, our most senior executives have been reverse mentored by a colleague who is junior to them in the organisation. The reverse mentors are a diverse group in terms of gender, nationality, business, function and their working location. The aim is to give senior executives a different perspective from a colleague who can share diverse experiences and ideas.
Lord Davies of Abersoch, on behalf of the UK Government, outlined a number of recommendations in 2011 to improve gender diversity in UK boardrooms. We will take opportunities to increase diversity at Board level, and have committed to make demonstrable progress on this by 2015.
Overall female representation across our global workforce is 15 per cent, seven per cent at the senior executive level and six per cent in our Group Leadership Team (GLT). Approximately two thirds of our workforce is in engineering or manufacturing roles where female representation has been historically low. We continue to counter this through active involvement in education outreach along with recruitment and development planning in order to maximise the potential of diverse talent across our global business. We are encouraged by some of the progress we are making in graduate recruitment where female representation has steadily increased over recent years. 25 per cent of participants in our graduate development programmes are female and this increases significantly in functions outside of engineering and manufacturing.
We participate in the FTSE 100 Cross Company Mentoring Programme, the objective of which is for the chairmen and chief executives to provide advice and guidance to senior females with the aim of attaining a non-executive and/or an executive director role. Our Chairman is a mentor and three of our female executives have participated to date.
The Group is committed to developing a diverse workforce and equal opportunities for all. Our policy is to provide, wherever possible, employment training and development opportunities for disabled people. We are committed to supporting employees who become disabled during employment and helping disabled employees make the best use of their skills and potential.
Learning During 2011, we provided over 3,500 learning solutions to our employees from all of our 57 countries, resulting in 35,500 employees undertaking more than 105,000 days of learning. We also built new Learning and Development Centres in Singapore and Ålesund, Norway. The centres will deliver training to both customers and employees in the regions.
Learning investment for 2011 was £38 million.
RecruitmentIn 2011, over 2,500 experienced professionals were recruited to support the growth of our business, more than double the previous year. More than 50 per cent were recruited from outside of the UK and 34 per cent came from countries outside the UK/US. We ran major recruitment campaigns across engineering, manufacturing and purchasing and these constituted the majority (61 per cent) of our hiring in 2011.
During 2011, more than 400 young graduates joined Rolls-Royce. Our campus teams actively engaged with more than 60 universities in the UK, Europe, Asia, and Americas and we recruited 242 graduates (up nine per cent) on to our graduate programme from 43 universities and 25 nations globally. We have plans to significantly increase our graduate programme size to 389 (60 per cent increase) in 2012 to accommodate our long-term growth objectives.
In addition, we recruited 295 apprentices in Europe and were awarded top 100 apprenticeship employer status in the UK.
Health and safety at workOver the past five years our focus on improving our health, safety and environment (HS&E) performance has resulted in the number of significant injuries that occur each year being almost halved from 1.31 total reportable injuries (TRI) per 100 employees in 2006, to 0.66 TRI per 100 employees in 2011.
Performance improvement is delivered through the implementation of a focused global HS&E strategy covering: leadership; capability; management systems; risk; assurance; learning from incidents and informed decision making.
Sustainability

Rolls-Royce plc Directors’ report and financial statements 2011
31
Directors’ report
Dire
ctor
s’ re
port
As part of a global safety programme, we have invested more than £20 million to further enhance the safety standards of our machinery. More than 11,000 machines have been reviewed worldwide and for around 2,500 machines, opportunities to enhance safety still further were identified such as improving guarding and the fitting of additional safety features.
A global programme of review and corrective action is also underway to improve our control of lifting operations. Similarly, a global programme to improve process safety management is focusing on our management of operational processes with hazards.
‘Leading excellence in HS&E’ workshops have been held with leadership teams from all of our sectors and businesses. ‘Leadership in Action’ days were also held for some 700 senior leaders with HS&E being one of the topics covered.
Engaging with our communitiesWorking with governmentsRolls-Royce seeks to build strategic relationships with host governments in our key market countries. Governments are often our direct customers. They set the legislative and policy framework within which our business must be conducted. They are a potential source of funding and support for R&T, R&D, manufacturing, education and training initiatives, as well as for certain capital projects. And finally, on occasion, they support or sponsor our partners, suppliers and competitors.
We engage in dialogue and negotiation to try to align the business needs of Rolls-Royce with the political, social, economic, industrial and commercial requirements of the national government. Where we can achieve such alignment, for example in Singapore, the benefits for both the Group and the country can be considerable.
On March 6, 2011, we hosted a meeting of the UK Cabinet in Derby. Sir John Rose addressed the Cabinet before their meeting and later that day, Prime Minister David Cameron performed the official opening of the new technology centre on site.
On October 25 and 26, 2011, Rolls-Royce along with the University of Sheffield and Boeing led a series of high profile events in Westminster to highlight the importance of high-value manufacturing. These events generated considerable interest from Government Ministers, Parliamentarians and officials.
With a majority of legislation affecting our European operations emanating from the European Union, we are now building extra capacity in our EU Affairs team. Throughout 2011, our key challenge in the EU has been to monitor the EU legislation on financial regulatory reform and its impact on the real economy and potential unintended consequences for non-financial companies like Rolls-Royce. Other policy areas have also required our attention, such as the inclusion of marine emissions in EU’s GHG commitment; new noise regulation in the field of aviation; alternative fuel policies; and renewable energy. We contributed to the development of the Commission’s proposal for ‘Horizon 2020’ – a new Research and Innovation funding framework for 2014-2021, and also ‘Flightpath 2050 – Europe’s vision for Aviation’.
Community investmentRolls-Royce has a firm, long-standing commitment to the communities in which we operate around the world. During 2011, the Group’s total contributions (including money, employee time and gifts in kind) were £7.1 million.
Our community investment activities support the Group’s strategy and future success, particularly in the areas of: recruitment and employee retention, employee engagement, professional development and the Group’s reputation in the community.
During the year, the Group approved a new global charitable contributions and social sponsorships policy and procedure, confirming our major areas of support as:
• education and skills, particularly in the areas of STEM which are key to our future success;
• environment, adding value to the Group’s environment strategy;• social investment, making a positive difference to the communities
in which we operate;• arts and culture, contributing to the cultural vibrancy in geographic
areas in which we operate; and• requests relating to the Group’s business such as armed services
related, engineering and aviation. The new policy and procedure also sets out a clear structure for global governance, ensuring consistency of approach and global visibility of contributions.
Charitable contributions and sponsorship £m
Charitable contributions and social sponsorships – UK– Asia and Middle East £0.3m, Americas £0.7m, Europe £0.6m
2.11.6
Commercial sponsorship 0.7Employee time 2.6
Gifts in kind 0.1Total 7.1Payroll giving UK £0.5m and North America £0.3m 0.8
Sustainability
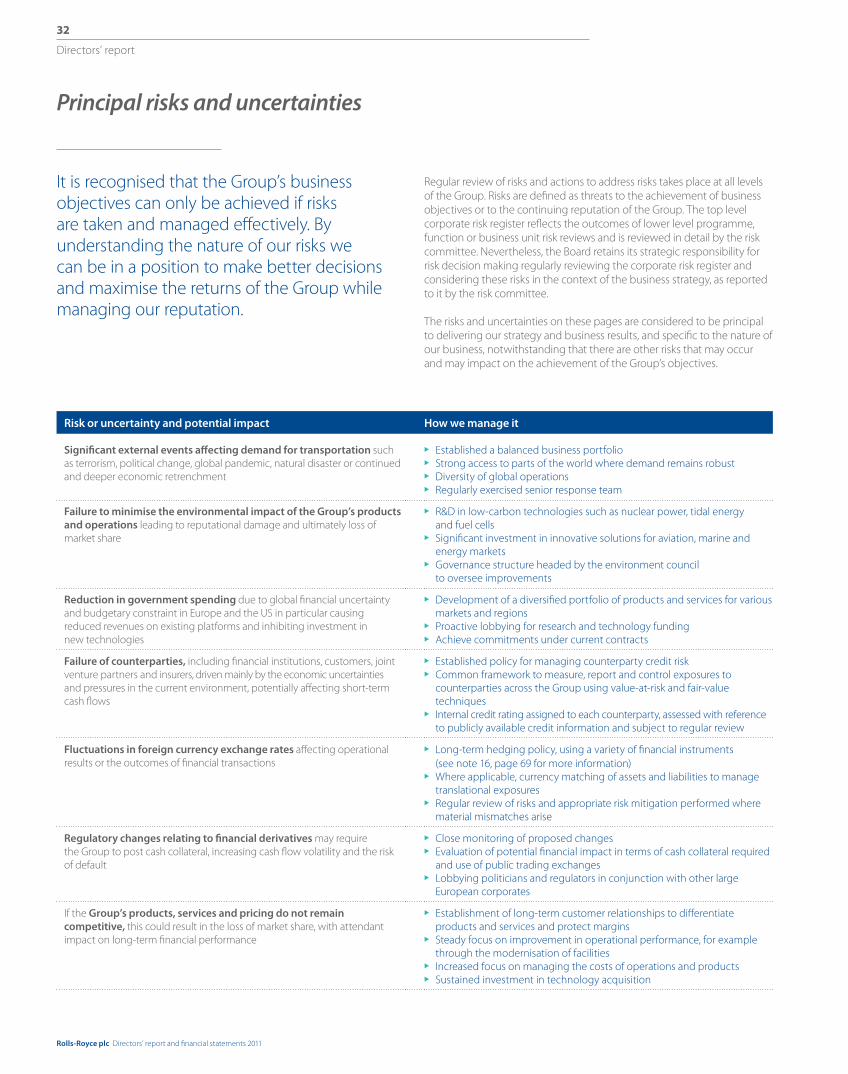
Rolls-Royce plc Directors’ report and financial statements 2011
32
Directors’ report
Risk or uncertainty and potential impact How we manage it
Significant external events affecting demand for transportation such as terrorism, political change, global pandemic, natural disaster or continued and deeper economic retrenchment
Established a balanced business portfolio Strong access to parts of the world where demand remains robust Diversity of global operations Regularly exercised senior response team
Failure to minimise the environmental impact of the Group’s products and operations leading to reputational damage and ultimately loss of market share
R&D in low-carbon technologies such as nuclear power, tidal energy and fuel cells
Significant investment in innovative solutions for aviation, marine and energy markets
Governance structure headed by the environment council to oversee improvements
Reduction in government spending due to global financial uncertainty and budgetary constraint in Europe and the US in particular causing reduced revenues on existing platforms and inhibiting investment in new technologies
Development of a diversified portfolio of products and services for various markets and regions
Proactive lobbying for research and technology funding Achieve commitments under current contracts
Failure of counterparties, including financial institutions, customers, joint venture partners and insurers, driven mainly by the economic uncertainties and pressures in the current environment, potentially affecting short-term cash flows
Established policy for managing counterparty credit risk Common framework to measure, report and control exposures to
counterparties across the Group using value-at-risk and fair-value techniques
Internal credit rating assigned to each counterparty, assessed with reference to publicly available credit information and subject to regular review
Fluctuations in foreign currency exchange rates affecting operational results or the outcomes of financial transactions
Long-term hedging policy, using a variety of financial instruments (see note 16, page 69 for more information)
Where applicable, currency matching of assets and liabilities to manage translational exposures
Regular review of risks and appropriate risk mitigation performed where material mismatches arise
Regulatory changes relating to financial derivatives may require the Group to post cash collateral, increasing cash flow volatility and the risk of default
Close monitoring of proposed changes Evaluation of potential financial impact in terms of cash collateral required
and use of public trading exchanges Lobbying politicians and regulators in conjunction with other large
European corporates
If the Group’s products, services and pricing do not remain competitive, this could result in the loss of market share, with attendant impact on long-term financial performance
Establishment of long-term customer relationships to differentiate products and services and protect margins
Steady focus on improvement in operational performance, for example through the modernisation of facilities
Increased focus on managing the costs of operations and products Sustained investment in technology acquisition
It is recognised that the Group’s business objectives can only be achieved if risks are taken and managed effectively. By understanding the nature of our risks we can be in a position to make better decisions and maximise the returns of the Group while managing our reputation.
Regular review of risks and actions to address risks takes place at all levels of the Group. Risks are defined as threats to the achievement of business objectives or to the continuing reputation of the Group. The top level corporate risk register reflects the outcomes of lower level programme, function or business unit risk reviews and is reviewed in detail by the risk committee. Nevertheless, the Board retains its strategic responsibility for risk decision making regularly reviewing the corporate risk register and considering these risks in the context of the business strategy, as reported to it by the risk committee.
The risks and uncertainties on these pages are considered to be principal to delivering our strategy and business results, and specific to the nature of our business, notwithstanding that there are other risks that may occur and may impact on the achievement of the Group’s objectives.
Principal risks and uncertainties
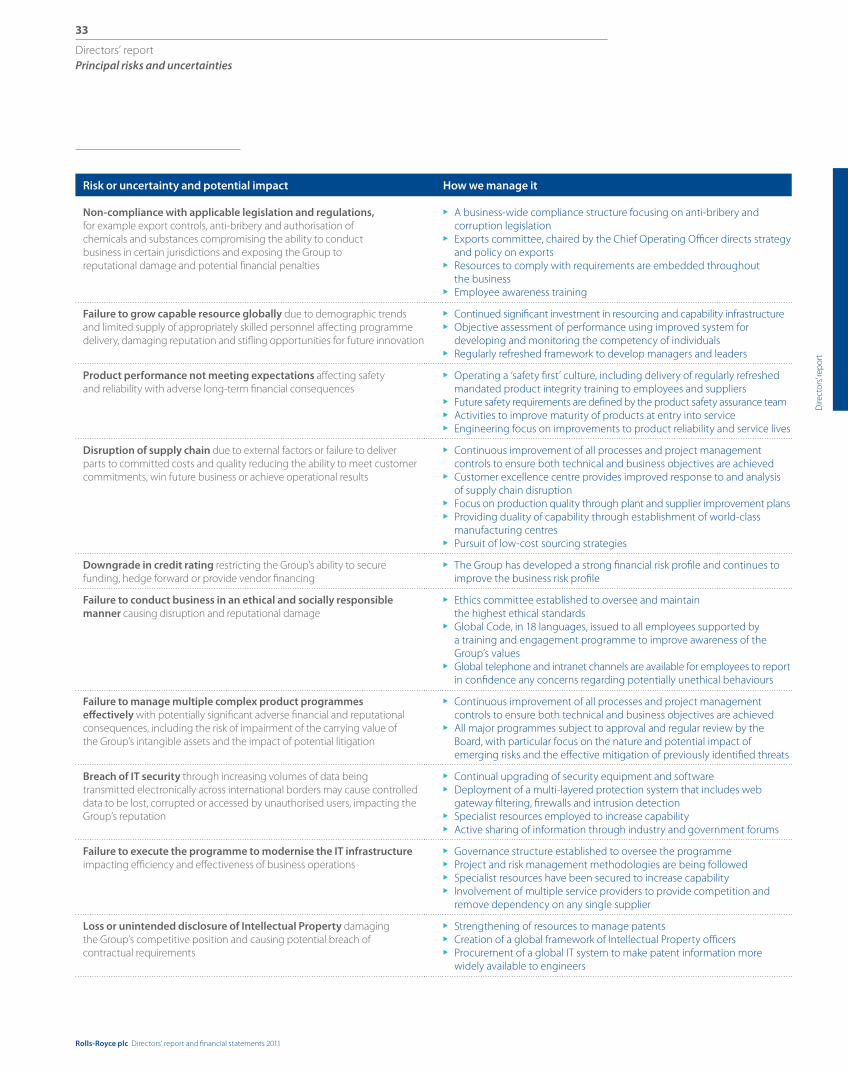
Rolls-Royce plc Directors’ report and financial statements 2011
33
Directors’ report
Dire
ctor
s’ re
port
Risk or uncertainty and potential impact How we manage it
Non-compliance with applicable legislation and regulations, for example export controls, anti-bribery and authorisation of chemicals and substances compromising the ability to conduct business in certain jurisdictions and exposing the Group to reputational damage and potential financial penalties
A business-wide compliance structure focusing on anti-bribery and corruption legislation
Exports committee, chaired by the Chief Operating Officer directs strategy and policy on exports
Resources to comply with requirements are embedded throughout the business
Employee awareness training
Failure to grow capable resource globally due to demographic trends and limited supply of appropriately skilled personnel affecting programme delivery, damaging reputation and stifling opportunities for future innovation
Continued significant investment in resourcing and capability infrastructure Objective assessment of performance using improved system for
developing and monitoring the competency of individuals Regularly refreshed framework to develop managers and leaders
Product performance not meeting expectations affecting safety and reliability with adverse long-term financial consequences
Operating a ‘safety first’ culture, including delivery of regularly refreshed mandated product integrity training to employees and suppliers
Future safety requirements are defined by the product safety assurance team Activities to improve maturity of products at entry into service Engineering focus on improvements to product reliability and service lives
Disruption of supply chain due to external factors or failure to deliver parts to committed costs and quality reducing the ability to meet customer commitments, win future business or achieve operational results
Continuous improvement of all processes and project management controls to ensure both technical and business objectives are achieved
Customer excellence centre provides improved response to and analysis of supply chain disruption
Focus on production quality through plant and supplier improvement plans Providing duality of capability through establishment of world-class
manufacturing centres Pursuit of low-cost sourcing strategies
Downgrade in credit rating restricting the Group’s ability to secure funding, hedge forward or provide vendor financing
The Group has developed a strong financial risk profile and continues to improve the business risk profile
Failure to conduct business in an ethical and socially responsible manner causing disruption and reputational damage
Ethics committee established to oversee and maintain the highest ethical standards
Global Code, in 18 languages, issued to all employees supported by a training and engagement programme to improve awareness of the Group’s values
Global telephone and intranet channels are available for employees to report in confidence any concerns regarding potentially unethical behaviours
Failure to manage multiple complex product programmes effectively with potentially significant adverse financial and reputational consequences, including the risk of impairment of the carrying value of the Group’s intangible assets and the impact of potential litigation
Continuous improvement of all processes and project management controls to ensure both technical and business objectives are achieved
All major programmes subject to approval and regular review by the Board, with particular focus on the nature and potential impact of emerging risks and the effective mitigation of previously identified threats
Breach of IT security through increasing volumes of data being transmitted electronically across international borders may cause controlled data to be lost, corrupted or accessed by unauthorised users, impacting the Group’s reputation
Continual upgrading of security equipment and software Deployment of a multi-layered protection system that includes web
gateway filtering, firewalls and intrusion detection Specialist resources employed to increase capability Active sharing of information through industry and government forums
Failure to execute the programme to modernise the IT infrastructure impacting efficiency and effectiveness of business operations
Governance structure established to oversee the programme Project and risk management methodologies are being followed Specialist resources have been secured to increase capability Involvement of multiple service providers to provide competition and
remove dependency on any single supplier
Loss or unintended disclosure of Intellectual Property damaging the Group’s competitive position and causing potential breach of contractual requirements
Strengthening of resources to manage patents Creation of a global framework of Intellectual Property officers Procurement of a global IT system to make patent information more
widely available to engineers
Principal risks and uncertainties

Rolls-Royce plc Directors’ report and financial statements 2011
34
Directors’ report
Additional financial information
Foreign exchangeForeign exchange rate movements influence the reported income statement, the cash flow and closing net cash balance. The average and spot rates for the principal trading currencies of the Group are shown in the table below:
2011 2010 Change
USD per GBPYear end spot rate 1.55 1.57 -1%Average spot rate 1.60 1.54 +4%
EUR per GBPYear end spot rate 1.20 1.17 +3%Average spot rate 1.15 1.17 -2%
TaxationThe Group believes that it has a duty to shareholders to seek to minimise its tax burden but to do so in a manner which is consistent with its commercial objectives and meets its legal obligations and ethical standards. Every effort is made to maximise the tax efficiency of business transactions and this includes taking advantage of available tax incentives and exemptions. However, the Group has regard for the intention of the legislation concerned rather than just the wording itself.
The Group is committed to building open relationships with tax authorities and to following a policy of full disclosure in order to effect the timely settlement of its tax affairs and to remove uncertainty in its business transactions. Where appropriate, the Group enters into consultation with tax authorities to help shape proposed legislation and future tax policy.
Transactions between Rolls-Royce subsidiaries and associates in different jurisdictions are conducted on an arms-length basis and priced as if the transactions were between unrelated entities, in compliance with the OECD Model Tax Convention and the laws of the relevant jurisdictions.
Investments and capital expenditureThe Group subjects all major investments and capital expenditure to a rigorous examination of risks and future cash flows to ensure that they create shareholder value. All major investments require Board approval.
The Group has a portfolio of projects at different stages of their life cycles. Discounted cash flow analysis of the remaining life of projects is performed on a regular basis.
Sales of engines in production are assessed against criteria in the original development programme to ensure that overall value is enhanced.
Financial risk managementThe Board has an established and structured approach to financial risk management. The Financial Risk Committee (Frc) is accountable for managing, reporting and mitigating the Group’s financial risks and exposures. These risks include the Group’s principal counterparty, currency, interest rate, commodity price, liquidity and credit rating risks outlined in more depth in note 16 to the financial statements. The Frc is chaired by the Finance Director. The Group has a comprehensive financial risk policy that advocates the use of financial instruments to manage and hedge business operations risks that arise from movements in financial, commodities, credit or money markets. The Group’s policy is not to engage in speculative financial transactions. The Frc sits quarterly to review and assess the key risks and agree any mitigating actions required.
Capital structureCapital summary – £ million 2011 2010
Total equity 4,678 3,817 Cash flow hedges 52 37 Group capital 4,730 3,854 Net funds 222 1,598
Operations are funded through various shareholders’ funds, bank debt, bonds, notes and finance leases. The capital structure of the Group reflects the judgement of the Board as to the appropriate balance of funding required.
Funding is secured by the Group’s continued access to the global debt markets. Borrowings are funded in various currencies using derivatives where appropriate to achieve a required currency and interest rate profile. The Board’s objective is to retain sufficient financial investments and undrawn facilities to ensure that the Group can both meet its medium-term operational commitments and cope with unforeseen obligations and opportunities.
The Group holds cash and short-term investments which, together with the undrawn committed facilities, enable it to manage its liquidity risk.
After repayment from cash resources of the €750 million Eurobond, the Group retained at year end aggregate liquidity of £2.5 billion. This liquidity comprised net funds of £222 million and aggregate borrowing facilities of £2.3 billion, of which £1.2 billion remained undrawn. This represents a 34 per cent decrease in net drawn borrowing facilities during the year.
The maturity profile of the borrowing facilities is regularly reviewed to ensure that refinancing levels are manageable in the context of the business and market conditions. No facilities mature in 2012. There are no rating triggers in any borrowing facility that would require the facility to be accelerated or repaid due to an adverse movement in the Group’s credit rating.

Rolls-Royce plc Directors’ report and financial statements 2011
35
Directors’ report
Dire
ctor
s’ re
port
During 2011, the £250 million bank revolving credit facility (RCF) due in 2012 and £750 million RCF due in 2013 were both refinanced with a new £1 billion RCF due in 2016 provided by a syndicate of relationship banks. The borrowing margin for this new RCF varies for a given credit rating. Depending on the extent drawn, the current margin would be 0.40 per cent to 0.70 per cent over sterling LIBOR.
The Group conducts some of its business through a number of joint ventures. A major proportion of the debt of these joint ventures is secured on the assets of the respective companies and is non-recourse to the Group. This non-recourse debt is further outlined in note 9 to the financial statements.
Credit ratingRating agency Rating Outlook Grade
Moody’s Investors Service A3 Stable InvestmentStandard & Poor’s A- Positive Investment
The Group’s holding company, Rolls-Royce Holdings plc, subscribes to both Moody’s Investors Service and Standard & Poor’s for independent long-term credit ratings. At December 31, 2011, it maintained investment grade ratings from both agencies.
As a capital-intensive business making long-term commitments to our customers, the Group attaches significant importance to maintaining or improving these current investment grade credit ratings.
Accounting and regulatory The consolidated financial statements have been prepared in accordance with International Financial Reporting Standards (IFRS), as adopted by the EU.
In 2011, there were no changes that have had a significant effect on the Group’s financial statements.
A summary of changes which have not been adopted in 2011 is included within the accounting policies in note 1 to the financial statements.
Governments and regulators around the world continue to consider reforms to the financial markets with the aim of improving transparency and reducing systemic risk. Although the proposed reforms are predominantly directed at financial institutions, they will also affect non-financial institutions such as the Group. In particular, proposals by both US and European regulators to reform the Over-the-counter (OTC) derivatives market may have adverse implications for the Group. If, as is being contemplated, parties to future OTC derivative transactions are required to use an exchange to clear the transactions and post cash collateral to reduce counterparty risk, the Group’s future funding requirements could be adversely affected and cash flow more volatile.
Additional financial information

Rolls-Royce plc Directors’ report and financial statements 2011
Directors’ report
36
Board of directors
Sir Simon Robertson (70) Non-executive Chairman, appointed January 2005
Skills and experience: Sir Simon brings to the Board a background in international corporate advisory with a wealth of experience in mergers and acquisitions, merchant banking, investment banking and financial markets. During his career he has worked in France, Germany, the UK and the US. In June 2010, he was honoured with a knighthood in recognition of his services to business.
External appointments: Sir Simon is the founder member of Simon Robertson Associates LLP and Deputy Chairman of HSBC Holdings plc. He is a non-executive director of Berry Bros & Rudd Limited and The Economist Newspaper Limited. Sir Simon is a director of The Royal Opera House Covent Garden Limited and a Trustee of The Eden Project and of the Royal Opera House Endowment Fund.
John Rishton (53) Chief Executive, appointed March 2011
Skills and experience: John is the former Chief Executive Officer of Royal Ahold. He began his career in 1979 at Ford Motor Company and held a variety of positions both in the UK and in Europe. In 1994 he joined British Airways Plc, where he was Chief Financial Officer from 2001 to 2005. Prior to his appointment as Chief Executive, John had been appointed as a non-executive director of the Company in 2007 and served as Chairman of the audit committee and a member of the ethics and nominations committees of Rolls-Royce Group plc. He is a former non-executive director of Allied Domecq.
Iain Conn (49) Senior Independent Director, appointed January 2005
Skills and experience: Iain joined the BP group in 1986 and has held a number of executive positions within the BP group worldwide.
External appointments: Iain is a Group Managing Director and Chief Executive of Refining and Marketing, BP p.l.c. He is also Chairman of the Advisory Board of The Imperial College Business School and a member of Imperial College Council.
Dame Helen Alexander (54) Non-executive director, appointed September 2007
Skills and experience: Dame Helen is currently involved with a number of not-for-profit organisations in media, the internet, the arts and education. She has also been a non-executive director of Northern Foods Limited, Centrica PLC and BT Group PLC. She was Chief Executive of the Economist Group till 2008, having joined the company in 1985.
External appointments: Dame Helen is Deputy President of the CBI, where she was President until June 2011. She is Chairman of the Port of London Authority (PLA), Incisive Media and Deputy Chairman of esure Group Holdings, and senior adviser to Bain Capital. Dame Helen is Chancellor of the University of Southampton.
Lewis Booth (63) Non-executive director, appointed May 2011
Skills and experience: Lewis has held a series of senior positions within the Ford Motor Company in Europe, Asia, Africa and the United States. Lewis began his career with British Leyland, before joining Ford in 1978.
External appointments: Lewis is executive Vice President and Chief Financial Officer of Ford Motor Company, a position he has held since November 2008.
Peter Byrom (67) Non-executive director, appointed January 1997
Skills and experience: Peter was a director of AMEC plc from 2005 to 2011 and of NM Rothschild & Sons Limited from 1977 to 1996. He is a Fellow of the Royal Aeronautical Society.
External appointments: Peter is Chairman of Domino Printing Sciences plc.
Sir Frank Chapman (58) Non-executive director, appointed November 2011
Skills and experience: Sir Frank has worked in the oil and gas industry for 37 years, including operational and business development roles within Royal Dutch Shell plc and BP p.l.c. Sir Frank graduated with first class honours in Mechanical Engineering from Queen Mary College, London University, and is a Fellow of the Institution of Mechanical Engineers. He was knighted in 2011 for services to the oil and gas industries.
External appointments: Sir Frank has been Chief Executive of BG Group plc for the past 11 years, managing the Group through a period of transformational growth and international diversification.
Sir Peter Gregson (54) Non-executive director, appointed March 2007
Skills and experience: Appointed to the academic staff at the University of Southampton in 1983, Sir Peter became Professor of Aerospace Materials in 1995 and Deputy Vice-Chancellor in 2000. He is a Fellow of the Royal Academy of Engineering and a Member of the Royal Irish Academy and has served on the Councils of the Royal Academy of Engineering and the Central Laboratory of the Research Councils. He was knighted in 2011 for services to higher education.
External appointments: Sir Peter is President and Vice-Chancellor of Queen’s University Belfast; he serves on the Council of CBI Northern Ireland and is a member of the Board of the UK Universities and Colleges Employers Association. He is Deputy Lieutenant of Belfast.

Rolls-Royce plc Directors’ report and financial statements 2011
Directors’ report
Dire
ctor
s’ re
port
37
Board of directors
John McAdam (63) Non-executive director, appointed February 2008
Skills and experience: John was the Chief Executive of ICI plc until ICI’s acquisition by Akzo Nobel. He has held a number of positions at Unilever, within its Birds Eye, Walls, Quest International and Unichema International businesses.
External appointments: John is Chairman of United Utilities Group PLC and of Rentokil Initial plc, the Senior Independent Director of J Sainsbury plc and a non-executive director of Sara Lee Corporation.
John Neill CBE (64) Non-executive director, appointed November 2008
Skills and experience: John is a member of the Council and Board of Business in the Community, is Vice President of the Society of Motor Manufacturers and Traders, BEN, the automotive industry charity and The Institute of the Motor Industry. He was awarded a CBE in June 1994 for his services to industry.
Ian Strachan (68) Non-executive director, appointed September 2003
Skills and experience: Ian is the former Chief Executive of BTR plc, former Deputy Chief Executive and Chief Financial Officer of Rio Tinto plc, former non-executive Chairman of Instinet Group Inc and a former non-executive director of Johnson Matthey plc, Commercial Union and Reuters Group plc.
External appointments: Ian is a non-executive director of Xstrata plc, Transocean Inc and Caithness Petroleum Limited.
James Guyette (66) President and Chief Executive Officer of Rolls-Royce North America Inc., appointed January 1998
Skills and experience: Before joining the Company, Jim was Executive Vice President, Marketing and Planning of United Airlines.
External appointments: Jim is Chairman of PrivateBancorp, Inc., of Chicago, Illinois and he is a director of priceline.com Inc., of Norwalk, Connecticut. Jim is Chairman of the Smithsonian National Air and Space Museum, Washington DC.
Mark Morris (48) Finance Director, appointed January 2012
Skills and experience: Mark joined Rolls-Royce in 1986. He has held a number of senior positions throughout the Group and, prior to his appointment as Finance Director, was Group Treasurer from 2001.
Colin Smith (56) Director – Engineering and Technology, appointed July 2005
Skills and experience: Colin joined Rolls-Royce in 1974. He has held a variety of key positions within the Company, including Director – Research and Technology and Director of Engineering and Technology – Civil Aerospace. Colin is a Fellow of the Royal Academy of Engineering, the Royal Aeronautical Society and the Institution of Mechanical Engineers.
Mike Terrett (55) Chief Operating Officer, appointed September 2007
Skills and experience: Mike joined Rolls-Royce in 1978. He has held a variety of senior positions in the development of new aero-engine programmes including Managing Director of Airlines and President and Chief Executive Officer of IAE based in the United States. Prior to his appointment as Chief Operating Officer he was President – Civil Aerospace. Mike is a Member of the Institute of Mechanical Engineers and a Fellow of the Royal Aeronautical Society.
Paul Davies (56) Acting Company Secretary
Skills and experience: Paul joined Rolls-Royce in 2008. He began his career in the secretariat of Ford Motor Company in 1980 and progressed via roles with Burberrys and Hunter Saphir plc. He was appointed Company Secretary of Norwest Holst plc in 1991, of Kingsbury Group plc in 1997 and, after the takeover of Kingsbury, of Galliford plc. He then worked for United Utilities plc (for seven years) as both Deputy Company Secretary, and acting Company Secretary, before joining Rolls-Royce as Deputy Company Secretary.
At December 31, 2011, all the directors were also directors of Rolls-Royce Holdings plc, the ultimate parent company. As directors of the ultimate parent company, there is no requirement to disclosure their remuneration or their interests in the shares of Rolls-Royce group companies in this Directors’ report, as they are included in the Annual report of Rolls-Royce Holdings plc.

Rolls-Royce plc Directors’ report and financial statements 2011
38
Directors’ report
Internal control and risk management
The Board’s responsibility for internal control and risk managementThe directors are responsible for the Group’s system of internal control and for maintaining and reviewing its effectiveness from both a financial and an operational perspective. The system of internal control is designed to manage, rather than eliminate, the risk of failure to achieve business objectives and to provide reasonable but not absolute assurance against material misstatement or loss.
The Group’s approach to internal control is based on the underlying principle of line management’s accountability for control and risk management. In reviewing the effectiveness of the system of internal control, the Board has taken account of the results of the work carried out to audit and review the activities of the Group.
There is an ongoing process to identify, assess and manage risk, including those risks affecting the Group’s reputation. This process is subject to continuous improvement and has been in place throughout the financial year to which these statements apply and up to the date of their approval.
In 2011, the effectiveness and consistency of risk management at all levels of the organisation has been measured, improved and reported via the sector and function assurance framework.
Financial reportingThe Group has a comprehensive budgeting system with an annual budget approved by the Board. Revised forecasts for the year are reported at least quarterly. Actual results, at both a business and Group level, are reported monthly against budget and variances reviewed.
Financial managers are required to acknowledge in writing that their routine financial reporting is based on reliable data and that their results are properly stated in accordance with Group requirements.
In addition, for annual reporting, business presidents and finance directors are required to acknowledge that their business has complied with the Group Finance Manual.
The audit committeeThe Rolls-Royce Holdings plc audit committee recommends the financial statements to the Board and reviews the Group’s financial reporting and accounting policies, including formal announcements and trading statements relating to the Company’s financial performance. It oversees the relationship with KPMG and the role and effectiveness of the internal audit function (business assurance). The committee reviews the Group’s procedures for detecting, monitoring and managing the risk of fraud and the Group’s internal controls and systems for assessing and mitigating risk. The committee’s terms of reference are available on the Group’s website at www.rolls-royce.com.
Annually, the committee reviews the effectiveness and performance of the external auditors with feedback from committee members, business assurance and group finance. The lead audit partner is required to rotate every five years and other key audit partners are required to rotate every seven years. The current lead audit partner has served four years of his term. No contractual obligations restrict the committee’s choice of external auditors. The committee and the Board has recommended the reappointment of the existing auditors.
Accordingly, resolutions to reappoint the external auditors, KPMG Audit Plc, and to authorise the directors to determine the auditors’ remuneration, will be proposed at the AGM.
The risk committeeThe Rolls-Royce Holdings plc risk committee is responsible for developing and, following Board review and approval, implementing the Group’s risk management strategy and mitigation policy. Its full terms of reference can be found on our website at www.rolls-royce.com.
In 2011, the committee continued to discuss and agree proposed additions, deletions and amendments to the top level corporate risk register and considered the mitigation of those risks. This is the committee’s principal item of business at each meeting.
At its meeting in June 2011, the Director of the Product Introduction and Lifecycle Management (PILM) programme gave a presentation on the PILM process, which applies across all product programmes covering all of our business sectors and geographical locations. The committee also reviewed an initiative to improve the Group’s intelligence on political and country risks as it enters new territories. In addition, it discussed the Group’s preparedness in respect of business continuity and crisis management.
In November 2011, the committee considered a report from the Director of Security on data privacy. In addition, it reviewed the Group’s insurance programme. It also reviewed and recommended certain minor changes to its terms of reference. The committee also considered the format of its annual report on risk to the Board which:
• set out the significant risks that it considered might have a financial or reputational impact to the Group and described the associated plans to manage/mitigate the risks;
• described changes that had been made to the nature and extent of risks since 2010;
• illustrated the movements in the Group’s risk profile over the past five years;
• described improvements that had been made to the risk process, tools and reports;
• reported on the status of the business continuity programme; and• provided an overview of the Group’s insurance programmes.
The Board, with the assistance of the risk and audit committees, has determined the Group’s approach to the management of risk. The risk committee ensures all of the risks on the register are discussed at Board meetings, either in the normal course of business or through specific reports. The Group’s key risks and uncertainties are described in the table on pages 32 and 33, together with highlights of how the risk will be managed.

Rolls-Royce plc Directors’ report and financial statements 2011
39
Directors’ report
Dire
ctor
s’ re
port
Risk managementWe recognise that managing risks is a vital part of delivering our business results. Risks are defined as threats to the achievement of business objectives or to the continuing reputation of the Group and may arise from a variety of internal or external sources. Our managers are responsible for applying the global risk policy in their day-to-day management activities and promoting a culture of learning from and sharing prior experience within their teams. The quality of decisions is improved by employees taking responsibility for communicating key risks to appropriate levels of management.
The risk policy and risk management process form a key element of the Group’s internal control system. The structured process is used to identify, assess, communicate and manage risks at all levels of the organisation, aided by an enterprise-wide software solution. A dedicated enterprise risk management team, now reporting to the General Counsel, is responsible for disseminating the risk management process and tools throughout the organisation. A global network of risk champions, mentors and facilitators helps share and embed best practice.
The top level corporate risk register reflects the outcomes of business unit, programme and function risk reviews. Risks and associated actions are owned by a senior executive, reviewed and discussed by the risk committee and communicated to the Board. The risk management process is continually improving and has been in place throughout 2011 and up to, and including, the date of approval of this directors’ report.
Shareholders and share capitalShare capital Throughout 2011, the Company’s authorised share capital was £400 million, comprising 2,000,000,000 ordinary shares of 20p. On December 31, 2011, there were 1,630,996,508 ordinary shares in issue.
The ordinary shares are not listed.
DividendsNo dividend was paid during the year.
Other statutory informationPolitical donations In line with its established policy, the Group made no political donations pursuant to the authority granted at the Rolls-Royce Group plc 2011 AGM. Although the Company does not make, and does not intend to make, donations to political parties, within the normal meaning of that expression, the definition of political donations under the Companies Act 2006 is very broad and includes expenses legitimately incurred as part of the process of talking to members of parliament and opinion formers to ensure that the issues and concerns of the Group are considered and addressed. These activities are not intended to support any political party and the Group’s policy is not to make any donations for political purposes in the normally accepted sense.
A resolution will therefore be proposed at the Rolls-Royce Holdings plc 2012 AGM seeking shareholder approval for the directors to be given authority to make donations and incur expenditure which might otherwise be caught by the terms of the Companies Act 2006. The authority sought will be limited to a maximum amount of £25,000 per Group company but so as not to exceed £50,000 for the entire Group in aggregate.
During the year, the business expenses incurred by Rolls-Royce North America Inc. towards the operation of the Rolls-Royce North America Political Action Committee (RRNAPAC) in the USA was US$44,436 (2010: nil). PACs are a common feature of the US political system and are governed by the Federal Election Campaign Act.
The PAC is independent of the Company and independent of any political party. The PAC funds are contributed voluntarily by employees and the Company cannot affect how they are applied, although under US Law, the business expenses are paid by the Company.
Such contributions do not require authorisation by shareholders under the Companies Act 2006 and therefore do not count towards the £25,000 and £50,000 limits for political donations and expenditure for which shareholder approval will be sought at the 2012 Rolls-Royce Holdings plc AGM.
Payment to suppliersWhen dealing with suppliers, the Group is guided by the Supply Chain Relationships in Aerospace (SCRIA) initiative. It seeks the best possible terms from suppliers and when entering into binding purchasing contracts, gives consideration to quality, delivery, price and the terms of payment. In the event of disputes, efforts are made to resolve them quickly.
The company had the equivalent of 56 days’ purchases outstanding at December 31, 2011, based on the average daily amount invoiced by suppliers during the year.
IndemnityRolls-Royce Holdings plc has entered into separate Deeds of Indemnity in favour of the Company’s directors. The deeds provide substantially the same protection as that already provided to directors under the indemnity in Article 216 of the Rolls-Royce Holdings plc’s Articles of Association. Rolls-Royce Holdings plc has also reviewed, arranged and maintains appropriate insurance cover for any legal action taken against the Company’s directors and officers.
Material litigationDuring the year, the litigation with United Technologies Corporation in connection with an alleged patent infringement was withdrawn, without financial impact.
Internal control and risk management

Rolls-Royce plc Directors’ report and financial statements 2011
40
Directors’ report
Annual report and financial statements
Statement of directors’ responsibilities in respect of the Annual report and the financial statements The directors are responsible for preparing the Annual report and the Group and parent company financial statements in accordance with applicable law and regulations.
Company law requires the directors to prepare Group and parent company financial statements for each financial year. Under that law they are required to prepare the Group financial statements in accordance with IFRS as adopted by the EU and applicable law and have elected to prepare the parent company financial statements in accordance with UK Accounting Standards and applicable law (UK Generally Accepted Accounting Practice).
Under company law the directors must not approve the financial statements unless they are satisfied that they give a true and fair view of the state of affairs of the Group and parent company and of their profit or loss for that period.
In preparing each of the Group and parent company financial statements, the directors are required to:
• select suitable accounting policies and then apply them consistently;• make judgements and estimates that are reasonable and prudent;• for the Group financial statements, state whether they have been
prepared in accordance with IFRSs as adopted by the EU;• for the parent company financial statements, state whether applicable
UK Accounting Standards have been followed, subject to any material departures disclosed and explained in the parent company financial statements; and
• prepare the financial statements on the going concern basis unless it is inappropriate to presume that the Group and the parent company will continue in business.
The directors are responsible for keeping adequate accounting records that are sufficient to show and explain the parent Group’s transactions and disclose with reasonable accuracy at any time the financial position of the parent company and enable them to ensure that its financial statements comply with the Companies Act 2006. They have general responsibility for taking such steps as are reasonably open to them to safeguard the assets of the group and to prevent and detect fraud and other irregularities.
Under applicable law and regulations, the directors are also responsible for preparing a Directors’ report that complies with that law and those regulations.
The directors are responsible for the maintenance and integrity of the corporate and financial information included on the Group’s website. Legislation in the UK governing the preparation and dissemination of financial statements may differ from legislation in other jurisdictions.
Going concernThe Group’s business activities, together with the factors likely to affect its future development, performance and position are set out on pages 1 to 27 of the directors’ report and a summary of the principal risks affecting the business are shown on pages 32 to 33.
The financial position of the Group, its cash flows, liquidity position, borrowing facilities and financial risks are described in pages 12 to 15 and 34 to 35 of the business review.
In addition, notes 1, 12, 14 and 16 of the consolidated financial statements include the Group’s objectives, policies and processes for financial risk management, details of its cash and cash equivalents, indebtedness and borrowing facilities and its financial instruments, hedging activities and its exposure to counterparty credit risk, liquidity risk, currency risk, interest rate risk and commodity pricing risk.
As described on page 34, the Group meets its funding requirements through a mixture of shareholders’ funds, bank borrowings, bonds, notes and finance leases. The Group has facilities of £2.3 billion of which £1.1 billion was drawn at the year end. None of these facilities expire in 2012.
The Group’s forecasts and projections, taking into account reasonably possible changes in trading performance, show that the Group has sufficient financial resources. As a consequence, the directors have a reasonable expectation that the Company and the Group are well placed to manage their business risks and to continue in operational existence for the foreseeable future, despite the current uncertain global economic outlook.
Accordingly, the directors continue to adopt the going concern basis (in accordance with the guidance ‘Going Concern and Liquidity Risk: Guidance for Directors of UK Companies 2009’ issued by the FRC) in preparing the consolidated financial statements.
Disclosure of information to auditorsEach of the persons who is a director at the date of approval of this report confirms that:
i) so far as the director is aware, there is no relevant information of which the Company’s auditors are unaware; and
ii) the director has taken all steps that he or she ought to have taken as a director in order to make himself or herself aware of any relevant audit information and to establish that the Company’s auditors are aware of that information.
This confirmation is given, and should be interpreted, in accordance with the provisions of Section 418 of the Companies Act 2006.
Responsibility statementEach of the persons who is a director at the date of approval of this report confirms that to the best of his or her knowledge:
i) each of the Group and parent company financial statements, prepared in accordance with IFRS and UK Accounting Standards respectively, gives a true and fair view of the assets, liabilities, financial position and profit or loss of the issuer and the undertakings included in the consolidation taken as a whole; and
ii) the Directors’ report on pages 1 to 40 includes a fair review of the development and performance of the business and the position of the Company and the undertakings included in the consolidation taken as a whole, together with a description of the principal risks and uncertainties that they face.
By order of the Board
Paul DaviesActing Company Secretary
February 8, 2012
Rolls-Royce plc Directors’ report and financial statements 2011
41
Financial statements
Fina
ncia
l sta
tem
ents
Other statutory information
Financial statements
90 COMPANY BALANCE SHEET91 STATEMENT OF TOTAL RECOGNISED GAINS AND LOSSES 91 RECONCILIATION OF MOVEMENTS IN SHAREHOLDERS’ FUNDS
Company financial statements
Consolidated financial statements
42 CONSOLIDATED INCOME STATEMENT42 CONSOLIDATED STATEMENT OF COMPREHENSIVE INCOME43 CONSOLIDATED BALANCE SHEET44 CONSOLIDATED CASH FLOW STATEMENT46 CONSOLIDATED STATEMENT OF CHANGES IN EQUITY
47 NOTES TO THE CONSOLIDATED FINANCIAL STATEMENTS47 1 Accounting policies54 2 Segmental analysis58 3 Net financing58 4 Taxation61 5 Employee information61 6 Auditor’s remuneration62 7 Intangible assets64 8 Property, plant and equipment65 9 Investments66 10 Inventories66 11 Trade and other receivables67 12 Cash and cash equivalents67 13 Assets held for sale68 14 Borrowings68 15 Trade and other payables69 16 Financial instruments78 17 Provisions for liabilities and charges79 18 Post-retirement benefits84 19 Share capital84 20 Share-based payments87 21 Operating leases88 22 Contingent liabilities89 23 Related party transactions89 24 Acquisitions
92 NOTES TO THE COMPANY FINANCIAL STATEMENTS92 1 Accounting policies96 2 Emoluments of directors96 3 Intangible assets97 4 Tangible assets98 5 Investments98 6 Stocks98 7 Debtors99 8 Other financial assets and liabilities100 9 Borrowings100 10 Other creditors101 11 Provisions for liabilities and charges101 12 Deferred taxation102 13 Post-retirement benefits106 14 Share capital106 15 Movements in capital and reserves106 16 Operating lease annual commitments107 17 Share-based payments109 18 Contingent liabilities110 19 Related party transactions110 20 Ultimate holding company

Rolls-Royce plc Annual report 2011
42
Financial statements
Consolidated income statementFor the year ended December 31, 2011
Notes 2011
£m 2010
£m
Revenue 2 11,124 11,085 Cost of sales (8,676) (8,885)Gross profit 2,448 2,200 Other operating income 69 95 Commercial and administrative costs (984) (836)Research and development costs (463) (422)Share of results of joint ventures and associates 9 116 93 Operating profit 1,186 1,130 Profit on disposal of businesses 3 4 Profit before financing and taxation 2 1,189 1,134
Financing income 3 456 453 Financing costs 3 (539) (884)Net financing (83) (431)
Profit before taxation 1,106 703 Taxation 4 (257) (159)Profit for the year 849 544
Attributable to: Ordinary shareholders 851 540 Non-controlling interests (2) 4 Profit for the year 849 544
Consolidated statement of comprehensive income For the year ended December 31, 2011
Notes 2011
£m 2010
£m
Profit for the year 849 544 Other comprehensive income (OCI) Foreign exchange translation differences on foreign operations (102) 22 Movements in post-retirement schemes 18 123 (94) Share of other comprehensive income of joint ventures and associates 9 (10) (16) Related tax movements 4 (54) 29 Total comprehensive income for the year 806 485
Attributable to: Ordinary shareholders 809 481 Non-controlling interests (3) 4 Total comprehensive income for the year 806 485

Rolls-Royce plc Annual report 2011
43
Financial statements
Fina
ncia
l sta
tem
ents
Consolidated balance sheet At December 31, 2011
Notes 2011
£m 2010
£m
ASSETS Non-current assets Intangible assets 7 2,882 2,884 Property, plant and equipment 8 2,338 2,136 Investments – joint ventures and associates 9 1,680 393 Investments – other 9 10 11 Other financial assets 16 327 371 Deferred tax assets 4 368 451 Post-retirement scheme surpluses 18 503 164
8,108 6,410 Current assets Inventories 10 2,561 2,429 Trade and other receivables 11 4,205 3,943 Taxation recoverable 20 6 Other financial assets 16 91 250 Short-term investments 11 328 Cash and cash equivalents 12 1,309 2,858 Assets held for sale 13 313 9
8,510 9,823 Total assets 16,618 16,233
LIABILITIES Current liabilities Borrowings 14 (20) (651)Other financial liabilities 16 (107) (82)Trade and other payables 15 (6,276) (6,160)Current tax liabilities (138) (170)Provisions for liabilities and charges 17 (276) (276)Liabilities associated with assets held for sale 13 (135) –
(6,952) (7,339)Non-current liabilities Borrowings 14 (1,184) (1,135)Other financial liabilities 16 (919) (945)Trade and other payables 15 (1,314) (1,271)Deferred tax liabilities 4 (445) (438)Provisions for liabilities and charges 17 (226) (268)Post-retirement scheme deficits 18 (900) (1,020)
(4,988) (5,077)Total liabilities (11,940) (12,416)
Net assets 4,678 3,817
EQUITY Equity attributable to ordinary shareholders Called-up share capital 19 326 326 Share premium account 631 631 Cash flow hedging reserve (52) (37)Other reserves 430 524 Retained earnings 3,342 2,369
4,677 3,813 Non-controlling interests 1 4 Total equity 4,678 3,817
The financial statements on pages 42 to 89 were approved by the Board on February 8, 2012 and signed on its behalf by:
Sir Simon Robertson Chairman Mark Morris Finance Director

Rolls-Royce plc Annual report 2011
44
Financial statements
Consolidated cash flow statementFor the year ended December 31, 2011
Notes 2011
£m
* Restated2010
£m
Reconciliation of cash flows from operating activities Profit before taxation 1,106 703 Share of results of joint ventures and associates 9 (116) (93)Profit on disposal of businesses (3) (4)Profit on disposal of property, plant and equipment (8) (10)Net financing 3 83 431 Taxation paid (208) (168)Amortisation of intangible assets 7 169 130 Depreciation of property, plant and equipment 8 241 237 Impairment of investments 9 – 3 (Decrease)/increase in provisions (28) 99 (Increase)/decrease in inventories (140) 41 (Increase)/decrease in trade and other receivables (258) 90 Increase in trade and other payables 172 489 Movement in other financial assets and liabilities 68 (298)Net defined benefit post-retirement (credit)/cost recognised in profit before financing (43) 147Cash funding of defined benefit post-retirement schemes (304) (282)Share-based payments 20 59 50 Dividends received from joint ventures and associates 9 76 68 Net cash inflow from operating activities 866 1,633
Cash flows from investing activities Additions of unlisted investments – (1)Disposals of unlisted investments 1 46 Additions of intangible assets (363) (321)Disposals of intangible assets 6 – Purchases of property, plant and equipment (412) (354)Government grants received 38 38Disposals of property, plant and equipment 31 38 Acquisitions of businesses (19) (150)Disposals of businesses 7 2 Investments in joint ventures and associates (1,329) (19)Loan to Engine Holding GmbH (167) –Net cash outflow from investing activities (2,207) (721)
Cash flows from financing activities Repayment of loans (501) (108)Proceeds from increase in loans – 2 Net cash flow from decrease in borrowings (501) (106)Interest received 19 23 Interest paid (49) (76)Decrease/(increase) in short-term investments 316 (326)Dividend paid – (550) Net cash outflow from financing activities (215) (1,035)
Net decrease in cash and cash equivalents (1,556) (123)Cash and cash equivalents at January 1 2,850 2,956 Exchange (losses)/gains on cash and cash equivalents (4) 17 Cash and cash equivalents at December 31 1,290 2,850
*Restated to show government grants, previously included in trade and other payables, separately.

Rolls-Royce plc Annual report 2011
45
Financial statements
Fina
ncia
l sta
tem
ents
Consolidated cash flow statement (continued)For the year ended December 31, 2011
2011 £m
2010 £m
Reconciliation of movements in cash and cash equivalents to movements in net funds Decrease in cash and cash equivalents (1,556) (123)Cash flow from decrease in borrowings 501 106 Cash flow from (decrease)/increase in short-term investments (316) 326Change in net funds resulting from cash flows (1,371) 309 Net funds (excluding cash and cash equivalents) of businesses acquired – (1)Exchange (losses)/gains on net funds (5) 17 Fair value adjustments 92 26 Movement in net funds (1,284) 351 Net funds at January 1 excluding the fair value of swaps 1,400 1,049 Net funds at December 31 excluding the fair value of swaps 116 1,400 Fair value of swaps hedging fixed rate borrowings 106 198 Net funds at December 31 222 1,598
The movement in net funds (defined by the Group as including the items shown below) is as follows:
At January 1,
2011£m
Fundsflow
£m
Exchangedifferences
£m
Fair valueadjustments
£m
AtDecember 31,
2011 £m
Cash at bank and in hand 1,265 26 (7) – 1,284 Money-market funds 381 (370) – – 11 Short-term deposits 1,212 (1,201) 3 – 14 Overdrafts (8) (11) – – (19)Cash and cash equivalents 2,850 (1,556) (4) – 1,290 Short-term investments 328 (316) (1) – 11 Other current borrowings (643) 500 – 142 (1)Non-current borrowings (1,134) 1 – (50) (1,183)Finance leases (1) – – – (1)
1,400 (1,371) (5) 92 116 Fair value of swaps hedging fixed rate borrowings 198 (92) 106
1,598 (1,371) (5) – 222

Rolls-Royce plc Annual report 2011
46
Financial statements
Consolidated statement of changes in equity For the year ended December 31, 2011
Attributable to ordinary shareholders
Notes
Share capital
£m
Share premium
£m
Cash flowhedging
reserve1 £m
Translation reserve
£m
Retained earnings
£m Total
£m
Non-controlling
interests £m
Totalequity
£m
At January 1, 2010 326 631 (19) 503 2,423 3,864 – 3,864 Total comprehensive income for the year – – (18) 21 478 481 4 485 Dividend paid – – – – (550) (550) – (550) Share-based payments – direct to equity 2 – – – – 13 13 – 13 Related tax movements 4 – – – – 5 5 – 5 Other changes in equity in the year – – – – (532) (532) – (532)At January 1, 2011 326 631 (37) 524 2,369 3,813 4 3,817 Total comprehensive income for the year – – (15) (94) 918 809 (3) 806 Share-based payments – direct to equity 2 – – – – 43 43 – 43 Related tax movements 4 – – – – 12 12 – 12 Other changes in equity in the year – – – – 55 55 – 55At December 31, 2011 326 631 (52) 430 3,342 4,677 1 4,678
1 See accounting policies note 1. 2 Share-based payments – direct to equity is the net of the credit to equity in respect of the share-based payment charge to the income statement and the actual cost to the group.

Rolls-Royce plc Annual report 2011
47
Financial statementsNotes to the consolidated financial statements
Fina
ncia
l sta
tem
ents
Notes to the consolidated financial statements
1 Accounting policies
The CompanyRolls-Royce plc (the ‘Company’) is a company domiciled in the United Kingdom. The consolidated financial statements of the Company for the year ended December 31, 2011 comprise the Company and its subsidiaries (together referred to as the ‘Group’) and the Group’s interest in jointly controlled and associated entities. The financial statements were authorised for issue by the directors on February 8, 2012.
Basis of preparation and statement of complianceIn accordance with European Union (EU) regulations, these financial statements have been prepared in accordance with International Financial Reporting Standards (IFRS) issued by the International Accounting Standards Board (IASB), as adopted for use in the EU effective at December 31, 2011 (Adopted IFRS). The Company has elected to prepare its parent company accounts under UK Generally Accepted Accounting Practices (GAAP).
The financial statements have been prepared on the historical cost basis except where Adopted IFRS requires the revaluation of financial instruments to fair value and certain other assets and liabilities on an alternative basis – most significantly post-retirement scheme liabilities are valued on the basis required by IAS 19 Employee Benefits, and on a going concern basis as set out page 40.
The preparation of financial statements in conformity with Adopted IFRS requires the use of certain critical accounting judgements and estimates, which are set out below.
The Group’s significant accounting policies are set out below. These accounting policies have been applied consistently to all periods presented in these consolidated financial statements and by all Group entities.
Key areas of judgementThe directors consider the potential key areas of judgements required to be made in applying the Group’s accounting policies to be:
• A large proportion of the Group’s activities relate to long-term aftermarket contracts. The determination of appropriate accounting policies for recognising revenue and costs in respect of these contracts requires judgement, in particular (i) whether an aftermarket contract is linked, for accounting purposes, to the related sale of original equipment and (ii) the appropriate measure of stage of completion of the contract.
• As set out in note 7, the Group has significant intangible assets. The decision as to when to commence capitalisation of development costs and whether sales of original equipment give rise to recognisable recoverable engine costs is a key judgement.
• As set out in note 22, the Group has contingent liabilities in respect of financing support provided to customers. Judgement is required to assess the likelihood of these crystallising, in order to assess whether a provision should be recognised.
Key sources of estimation uncertaintyIn applying the above accounting policies, management has made appropriate estimates in many areas, and the actual outcome may differ from those calculated. The key sources of estimation uncertainty at the balance sheet date, that have a significant risk of causing material adjustment to the carrying amounts of assets and liabilities within the next financial year are set out below. The estimation of the relevant assets and liabilities involves the combination of a number of assumptions. Where appropriate and practicable, sensitivities are disclosed in the relevant notes.
Current economic environmentThe current economic environment could impact a number of estimates necessary to prepare the financial statements, in particular, the recoverable amount of assets and contingent liabilities. The Group has taken these factors into account in assessing the estimates set out below.

Rolls-Royce plc Annual report 2011
48
Financial statementsNotes to the consolidated financial statements
1 Accounting policies (continued)
Forecasts and discount ratesThe carrying values of a number of items on the balance sheet are dependent on the estimates of future cash flows arising from the Group’s operations, in particular:
• The assessment as to whether there are any indications of impairment of development, participation, certification and recoverable engine costs recognised as intangible assets is dependent on forecasts of cash flows generated by the relevant assets (carrying values at December 31, 2011 £1,442m, December 31, 2010 £1,472m).
• The financial liabilities arising from financial risk and revenue sharing partnerships are valued at each reporting date using the amortised cost method (carrying values at December 31, 2011 £230m, December 31, 2010 £266m). This involves calculating the present value of the forecast cash flows of the arrangement using the internal rate of return at the inception of the arrangement as the discount rate.
• The realisation of the deferred tax assets (carrying values at December 31, 2011 £368m, December 31, 2010 £451m) recognised is dependent on the generation of sufficient future taxable profits. The Group recognises deferred tax assets where it is more likely than not that the benefit will be realised.
Assessment of long-term contractual arrangementsThe Group has long-term contracts that fall into different accounting periods. In assessing the allocation of revenues and costs to individual accounting periods, and the consequential assets and liabilities, the Group estimates the total revenues and costs forecast to arise in respect of the contract and the stage of completion based on an appropriate measure of performance as described in the revenue recognition accounting policy below.
Post-retirement benefitsThe Group’s defined benefit pension schemes and similar arrangements are assessed annually in accordance with IAS 19. The accounting valuation, which was based on assumptions determined with independent actuarial advice, resulted in a net deficit of £397m before deferred taxation being recognised on the balance sheet at December 31, 2011 (December 31, 2010 £856m). The size of the net deficit is sensitive to the market value of the assets held by the schemes and to actuarial assumptions, which include price inflation, pension and salary increases, the discount rate used in assessing actuarial liabilities, mortality and other demographic assumptions and the levels of contributions. Further details are included in note 18.
ProvisionsAs described in the accounting policy below, the Group measures provisions (carrying value at December 31, 2011 £502m, December 31, 2010 £544m) at the directors’ best estimate of the expenditure required to settle the obligation at the balance sheet date. These estimates are made, taking account of information available and different possible outcomes.
TaxationThe tax payable on profits is determined based on tax laws and regulations that apply in each of the numerous jurisdictions in which the Group operates. Where the precise impact of these laws and regulations is unclear then reasonable estimates may be used to determine the tax charge included in the financial statements.
Basis of consolidationThe Group financial statements include the financial statements of the Company and all of its subsidiary undertakings made up to December 31, together with the Group’s share of the results of joint ventures and associates up to December 31.
A subsidiary is an entity controlled by the Company. Control exists when the Company has the power, directly or indirectly, to govern the financial and operating policies of the entity so as to derive benefits from its activities.
A joint venture is an entity in which the Group holds a long-term interest and which is jointly controlled by the Group and one or more other venturers under a contractual arrangement. An associate is an entity, being neither a subsidiary nor a joint venture, in which the Group holds a long-term interest and where the Group has a significant influence. The results of joint ventures and associates are accounted for using the equity method of accounting.
Any subsidiary undertakings, joint ventures or associates sold or acquired during the year are included up to, or from, the dates of change of control.
All intra-group transactions, balances, income and expenses are eliminated on consolidation. Adjustments are made to eliminate the profit or loss arising on transactions with joint ventures and associates to the extent of the Group’s interest in the entity.
Rolls-Royce plc Annual report 2011
49
Financial statementsNotes to the consolidated financial statements
Fina
ncia
l sta
tem
ents
1 Accounting policies (continued)
Significant accounting policiesRevenue recognitionRevenues comprise sales to outside customers after discounts, excluding value added tax.
Sales of products are recognised when the significant risks and rewards of ownership of the goods are transferred to the customer, the sales price agreed and the receipt of payment can be assured. On occasion, the Group may participate in the financing of engines in conjunction with airframe manufacturers, most commonly by the provision of guarantees as described in note 22. In such circumstances, the contingent obligations arising under these arrangements are taken into account in assessing whether significant risks and rewards of ownership have been transferred to the customer.
Sales of services are recognised by reference to the stage of completion based on services performed to date. The assessment of the stage of completion is dependent on the nature of the contract, but will generally be based on: costs incurred to the extent these relate to services performed up to the reporting date; achievement of contractual milestones where appropriate; or flying hours or equivalent for long-term aftermarket arrangements.
Linked sales of products and services are treated as a single contract where these components have been negotiated as a single commercial package and are so closely interrelated that they do not operate independently of each other and are considered to form a single project with an overall profit margin. Revenue is recognised on the same basis as for other sales of products and services as described above.
Provided that the outcome of construction contracts can be assessed with reasonable certainty, the revenues and costs on such contracts are recognised based on stage of completion and the overall contract profitability.
Full provision is made for any estimated losses to completion of contracts, having regard to the overall substance of the arrangements.
Progress payments received, when greater than recorded revenue, are deducted from the value of work in progress except to the extent that payments on account exceed the value of work in progress on any contract where the excess is included in trade and other payables. The amount by which recorded revenue of long-term contracts is in excess of payments on account is classified as amounts recoverable on contracts and is separately disclosed within trade and other receivables.
Risk and revenue sharing partnerships (RRSPs)From time to time, the Group enters into arrangements with partners who, in return for a share in future programme revenues or profits, make cash payments that are not refundable. Cash sums received, which reimburse the Group for past expenditure, are credited to other operating income. The arrangements also require partners to undertake development work and/or supply components for use in the programme at their own expense. No accounting entries are recorded where partners undertake such development work or where programme components are supplied by partners because no obligation arises unless and until programme sales are made. Instead, payments to partners for their share in the programme are charged to cost of sales as programme revenues arise.
The Group has arrangements with partners who do not undertake development work or supply parts. Such arrangements are considered to be financial instruments as defined by IAS 32 Financial Instruments: Presentation and are accounted for using the amortised cost method.
Government investmentWhere a government or similar body has previously invested in a development programme, the Group treats payments to that body as royalty payments, which are matched to related sales.
Government grantsGovernment grants are recognised in the income statement so as to match them with the related expenses that they are intended to compensate. Where grants are received in advance of the related expenses, they are included in the balance sheet as deferred income. Non-monetary grants are recognised at fair value.
InterestInterest receivable/payable is credited/charged to the income statement using the effective interest method. Where borrowing costs are attributable to the acquisition, construction or production of a qualifying asset, such costs are capitalised as part of the specific asset.

Rolls-Royce plc Annual report 2011
50
Financial statementsNotes to the consolidated financial statements
1 Accounting policies (continued)
TaxationThe tax charge on the profit or loss for the year comprises current and deferred tax. Current tax is the expected tax payable for the year, using tax rates enacted or substantively enacted at the balance sheet date, and any adjustment to tax payable in respect of previous years.
Deferred tax is provided using the balance sheet liability method, providing for temporary differences between the carrying amounts of the assets and liabilities for financial reporting purposes and the amounts used for taxation purposes.
Deferred tax liabilities are recognised for taxable temporary differences arising on investments in subsidiaries and joint ventures, except where the Group is able to control the reversal of the temporary difference and it is probable that the temporary difference will not reverse in the foreseeable future. Deferred tax is not recognised on taxable temporary differences arising on the initial recognition of goodwill or for temporary differences arising from the initial recognition of assets and liabilities in a transaction that is not a business combination and that affects neither accounting nor taxable profit.
Deferred tax is calculated using the enacted or substantively enacted rates that are expected to apply when the asset or liability is settled. Deferred tax is charged or credited in the income statement or statement of comprehensive income as appropriate, except when it relates to items credited or charged directly to equity in which case the deferred tax is also dealt with in equity.
Deferred tax assets are recognised only to the extent that it is probable that future taxable profits will be available against which the assets can be utilised.
Foreign currency translationTransactions in overseas currencies are translated into local currency at the exchange rates ruling on the date of the transaction. Monetary assets and liabilities denominated in foreign currencies are translated into local currency at the rate ruling at the year end. Exchange differences arising on foreign exchange transactions and the retranslation of assets and liabilities into sterling at the rate ruling at the year end are taken into account in determining profit before taxation.
The trading results of overseas undertakings are translated at the average exchange rates for the year. The assets and liabilities of overseas undertakings, including goodwill and fair value adjustments arising on acquisition, are translated at the exchange rates ruling at the year end. Exchange adjustments arising from the retranslation of the opening net investments, and from the translation of the profits or losses at average rates, are taken to equity.
Financial instrumentsIAS 39 Financial Instruments: Recognition and Measurement requires the classification of financial instruments into separate categories for which the accounting requirement is different. The Group has classified its financial instruments as follows:
• Short-term investments are classified as available for sale.• Short-term deposits (principally comprising funds held with banks and other financial institutions), trade receivables and short-term investments
not designated as available for sale are classified as loans and receivables.• Borrowings, trade payables and financial RRSPs are classified as other liabilities.• Derivatives, comprising foreign exchange contracts, interest rate swaps and commodity swaps are classified as held for trading.
Financial instruments are recognised at the contract date and initially measured at fair value. Their subsequent measurement depends on their classification:• Loans and receivables and other liabilities are held at amortised cost and not revalued (except for changes in exchange rates which are included in
the income statement) unless they are included in a fair value hedge accounting relationship. Where such a relationship exists, the instruments are revalued in respect of the risk being hedged, with the change in value included in the income statement.
• Available for sale assets are held at fair value. Changes in fair value arising from changes in exchange rates are included in the income statement. All other changes in fair value are taken to equity. On disposal, the accumulated changes in value recorded in equity are included in the gain or loss recorded in the income statement.
• Held for trading instruments are held at fair value. Changes in fair value are included in the income statement unless the instrument is included in a cash flow hedge. If the instruments are included in a cash flow hedging relationship, which is effective, changes in value are taken to equity. When the hedged forecast transaction occurs, amounts previously recorded in equity are recognised in the income statement.
Financial instruments are derecognised on expiry or when all contractual rights and obligations are transferred.
Rolls-Royce plc Annual report 2011
51
Financial statementsNotes to the consolidated financial statements
Fina
ncia
l sta
tem
ents
1 Accounting policies (continued)
Hedge accountingThe Group does not generally apply hedge accounting in respect of forward foreign exchange contracts held to manage the cash flow exposures of forecast transactions denominated in foreign currencies. In 2011, the Group has applied cash flow hedge accounting in respect of foreign exchange contracts entered into to hedge the cost of its investment in Engine Holding GmbH.
The Group does not apply hedge accounting in respect of commodity swaps held to manage the cash flow exposures of forecast transactions in those commodities.
The Group applies hedge accounting in respect of transactions entered into to manage the fair value and cash flow exposures of its borrowings. Forward foreign exchange contracts are held to manage the fair value exposures of borrowings denominated in foreign currencies and are designated as fair value hedges. Interest rate swaps are held to manage the interest rate exposures and are designated as fair value or cash flow hedges of fixed and floating rate borrowings respectively.
Changes in the fair values of derivatives designated as fair value hedges and changes in fair value of the related hedged item are recognised directly in the income statement.
Changes in the fair values of derivatives that are designated as cash flow hedges and are effective are recognised directly in equity. Any ineffectiveness in the hedging relationships is included in the income statement. The amounts deferred in equity are recognised in the income statement to match the recognition of the hedged item or, in the case of the cash flow hedges of the investment in Engine Holding GmbH, included in the initial carrying value of the joint venture.
Hedge accounting is discontinued when the hedging instrument expires or is sold, terminated, exercised, or no longer qualifies for hedge accounting. At that time, for cash flow hedges and if the forecast transaction remains probable, any cumulative gain or loss on the hedging instrument recognised in equity is retained in equity until the forecast transaction occurs. If a hedged transaction is no longer expected to occur, the net cumulative gain or loss previously recognised in equity is transferred to the income statement.
The portion of a gain or loss on an instrument used to hedge a net investment in a foreign operation that is determined to be an effective hedge is recognised directly in equity. The ineffective portion is recognised immediately in the income statement.
Purchased goodwillGoodwill represents the excess of the fair value of the purchase consideration for shares in subsidiary undertakings, joint ventures and associates over the fair value to the Group of the net of the identifiable assets acquired and the liabilities assumed.
i) To December 31, 1997: Goodwill was written off to reserves in the year of acquisition.ii) From January 1, 1998: Goodwill was recognised within intangible assets in the year in which it arose and amortised on a straight-line basis over its
useful economic life, up to a maximum of 20 years.iii) From January 1, 2004, in accordance with IFRS 3 Business Combinations, goodwill is recognised as per (ii) above but is no longer amortised.
Certification costs and participation feesCosts incurred in respect of meeting regulatory certification requirements for new civil aero-engine/aircraft combinations and payments made to airframe manufacturers for this, and participation fees, are carried forward in intangible assets to the extent that they can be recovered out of future sales and are charged to the income statement over the programme life, up to a maximum of 15 years from the entry into service of the product.
Research and developmentIn accordance with IAS 38 Intangible Assets, expenditure incurred on research and development, excluding known recoverable amounts on contracts, and contributions to shared engineering programmes, is distinguished as relating either to a research phase or to a development phase.
All research phase expenditure is charged to the income statement. For development expenditure, this is capitalised as an internally generated intangible asset only if it meets strict criteria, relating in particular to technical feasibility and generation of future economic benefits.
Expenditure that cannot be classified into these two categories is treated as being incurred in the research phase. The Group considers that, due to the complex nature of new equipment programmes, it is not possible to distinguish reliably between research and development activities until relatively late in the programme.
Expenditure capitalised is amortised over its useful economic life, up to a maximum of 15 years from the entry into service of the product.
Rolls-Royce plc Annual report 2011
52
Financial statementsNotes to the consolidated financial statements
1 Accounting policies (continued)
Recoverable engine costsOn occasion, the Group may sell original equipment to customers at a price below its cost, on the basis that this deficit will be recovered from future aftermarket sales to the original customer. Where the Group has a contractual right to supply aftermarket parts to the customer and its intellectual rights, warranty arrangements and statutory airworthiness requirements provide reasonable control over this supply, these arrangements are considered to meet the definition of an intangible asset. Such intangible assets are recognised to the extent of the deficit and amortised on a straight-line basis over the expected period of utilisation by the original customer.
SoftwareThe cost of acquiring software that is not specific to an item of property, plant and equipment is classified as an intangible asset and amortised over its useful economic life, up to a maximum of five years.
Property, plant and equipmentProperty, plant and equipment assets are stated at cost less accumulated depreciation and any provision for impairment in value.
Depreciation is provided on a straight-line basis to write off the cost, less the estimated residual value, of property, plant and equipment over their estimated useful lives. No depreciation is provided on assets in the course of construction. Estimated useful lives are as follows:i) Land and buildings, as advised by the Group’s professional advisors:
a) Freehold buildings – five to 45 years (average 24 years).b) Leasehold buildings – lower of advisor’s estimates or period of lease.c) No depreciation is provided on freehold land.
ii) Plant and equipment – five to 25 years (average 13 years).iii) Aircraft and engines – five to 20 years (average 16 years).
Operating leasesPayments made and rentals received under operating lease arrangements are charged/credited to the income statement on a straight-line basis.
Impairment of non-current assetsImpairment of non-current assets is considered in accordance with IAS 36 Impairment of Assets. Where the asset does not generate cash flows that are independent of other assets, impairment is considered for the cash-generating unit to which the asset belongs.
Goodwill and intangible assets not yet available for use are tested for impairment annually. Other intangible assets, property, plant and equipment and investments are assessed for any indications of impairment annually. If any indication of impairment is identified, an impairment test is performed to estimate the recoverable amount.
Recoverable amount is the higher of value in use or fair value less costs to sell, if this is readily available. The value in use is the present value of future cash flows using a pre-tax discount rate that reflects the time value of money and the risk specific to the asset.
If the recoverable amount of an asset (or cash-generating unit) is estimated to be below the carrying value, the carrying value is reduced to the recoverable amount and the impairment loss recognised as an expense.
InventoriesInventories and work in progress are valued at the lower of cost and net realisable value on a first-in, first-out basis. Cost comprises direct materials and, where applicable, direct labour costs and those overheads, including depreciation of property, plant and equipment, that have been incurred in bringing the inventories to their present location and condition. Net realisable value represents the estimated selling prices less all estimated costs of completion and costs to be incurred in marketing, selling and distribution.
Cash and cash equivalentsCash and cash equivalents include cash at bank and in hand, investments in money-market funds and short-term deposits with a maturity of three months or less on inception. The Group considers overdrafts (repayable on demand) to be an integral part of its cash management activities and these are included in cash and cash equivalents for the purposes of the cash flow statement.
ProvisionsProvisions are recognised when the Group has a present obligation as a result of a past event, and it is probable that the Group will be required to settle that obligation. Provisions are measured at the director’s best estimate of the expenditure required to settle the obligation at the balance sheet date, and are discounted to present value where the effect is material.
Rolls-Royce plc Annual report 2011
53
Financial statementsNotes to the consolidated financial statements
Fina
ncia
l sta
tem
ents
1 Accounting policies (continued)
Post-retirement benefitsPensions and similar benefits (principally healthcare) are accounted for under IAS 19 Employee Benefits. For defined benefit plans, obligations are measured at discounted present value whilst plan assets are recorded at fair value. The service and financing costs of such plans are recognised separately in the income statement; current service costs are spread systematically over the lives of employees and financing costs are recognised in the periods in which they arise. Actuarial gains and losses are recognised immediately in the statement of comprehensive income.
Surpluses in schemes are recognised as assets only if they represent economic benefits available to the Group in the future. A liability is recognised to the extent that the minimum funding requirements in respect of past service will give rise to an unrecognisable surplus. Movements in unrecognised surpluses and minimum funding liabilities are included in the statement of comprehensive income.
Payments to defined contribution schemes are charged as an expense as they fall due.
Share-based paymentsThe Group provides share-based payment arrangements to certain employees. These are principally equity-settled arrangements and are measured at fair value (excluding the effect of non-market based vesting conditions) at the date of grant. The fair value is expensed on a straight-line basis over the vesting period. The amount recognised as an expense is adjusted to reflect the actual number of shares or options that will vest, except where additional shares vest as a result of the TSR performance condition in the PSP.
Cash-settled share options (grants in the International ShareSave plan) are measured at fair value at the balance sheet date. The Group recognises a liability at the balance sheet date based on these fair values, taking into account the estimated number of options that will actually vest and the relative completion of the vesting period. Changes in the value of this liability are recognised in the income statement for the year.
The fair values of the share-based payment arrangements are measured as follows:i) ShareSave plans – using the binomial pricing model;ii) PSP – using a pricing model adjusted to reflect non-entitlement to dividends (or equivalent) and the TSR market-based performance condition;
andiii) APRA plan deferred shares – share price on the date of the award.
See note 20 for a further description of the share-based payment plans.
Contingent liabilitiesIn connection with the sale of its products, the Group will, on occasion, provide financing support for its customers. These arrangements fall into two categories: credit-based guarantees and asset-value guarantees. In accordance with the requirements of IAS 39 and IFRS 4 Insurance Contracts, credit-based guarantees are treated as insurance contracts. The Group considers asset-value guarantees to be non-financial liabilities and accordingly these are also treated as insurance contracts. Provision is made as described above.
The Group’s contingent liabilities relating to financing arrangements are spread over many years and relate to a number of customers and a broad product portfolio, and are reported on a discounted basis.
Revisions to Adopted IFRS in 2011There were no revisions to Adopted IFRS that became applicable in 2011 which had a significant impact on the Group’s financial statements.
Revisions to IFRS not applicable in 2011Standards and interpretations issued by the IASB are only applicable if endorsed by the EU. • IFRS 9 Financial Instruments will simplify the classification of financial assets for measurement purposes, but is not anticipated to have a significant
impact on the financial statements. If endorsed, this will be effective for 2015.• Amendments to IAS 19 Employee Benefits will require the financing on post-retirement benefits to be calculated on the net surplus or deficit using
an ‘AA’ corporate bond rate. This will increase the net post-retirement scheme financing cost. This will be effective for 2013.• IFRS 11 Joint Arrangements may result in certain entities currently classified as joint ventures being classified as joint operations. This would result in
the Group’s share of the individual assets and liabilities of these entities being included in the financial statements rather than the equity method accounting adopted under the requirements of IAS 31 Interests in Joint Ventures. This will not affect the Group’s net assets or profit for the period. This will be effective for 2013.
The Group does not consider that any other standards, amendments or interpretations issued by the IASB, but not yet applicable, will have a significant impact on the financial statements.

Rolls-Royce plc Annual report 2011
54
Financial statementsNotes to the consolidated financial statements
2 Segmental analysis
The analysis by business segment is presented in accordance with IFRS 8 Operating Segments, on the basis of those segments whose operating results are regularly reviewed by the Board (the Chief Operating Decision Maker as defined by IFRS 8), as follows:
Civil aerospace – development, manufacture, marketing and sales of commercial aero engines and aftermarket services.Defence aerospace – development, manufacture, marketing and sales of military aero engines and aftermarket services.Marine – development, manufacture, marketing and sales of marine power and propulsion systems and aftermarket services.Energy – development, manufacture, marketing and sales of power systems for the offshore oil and gas industry and electrical power
generation and aftermarket services.
Technology and operations, discussed in the business review, operate on a Group-wide basis across all the above segments. The equity accounted share of the Engine Holding GmbH business acquired during the year is shown separately.
The operating results reviewed by the Board are prepared on an underlying basis, which the Board considers reflects better the economic substance of the Group’s trading during the year. The principles adopted to determine underlying results are:
Underlying revenue – Where revenues are denominated in a currency other than the functional currency of the Group undertaking, these reflect the achieved exchange rates arising on settled derivative contracts. There is no inter-segment trading and hence all revenue is from external customers.
Underlying profit before financing – Where transactions are denominated in a currency other than the functional currency of the Group undertaking, this reflects the transactions at the achieved exchange rates on settled derivative contracts. In addition, adjustments have been made to exclude one-off past-service credits on post-retirement schemes and the effect of acquisition accounting.
Underlying profit before taxation – In addition to those adjustments in underlying profit before financing:• Includes amounts realised from settled derivative contracts and revaluation of relevant assets and liabilities to exchange rates forecast to be
achieved from future settlement of derivative contracts.• Excludes unrealised amounts arising from revaluations required by IAS 39 Financial Instruments: Recognition and Measurement, changes in value of
financial RRSP contracts arising from changes in forecast payments and the net impact of financing costs related to post-retirement scheme benefits.
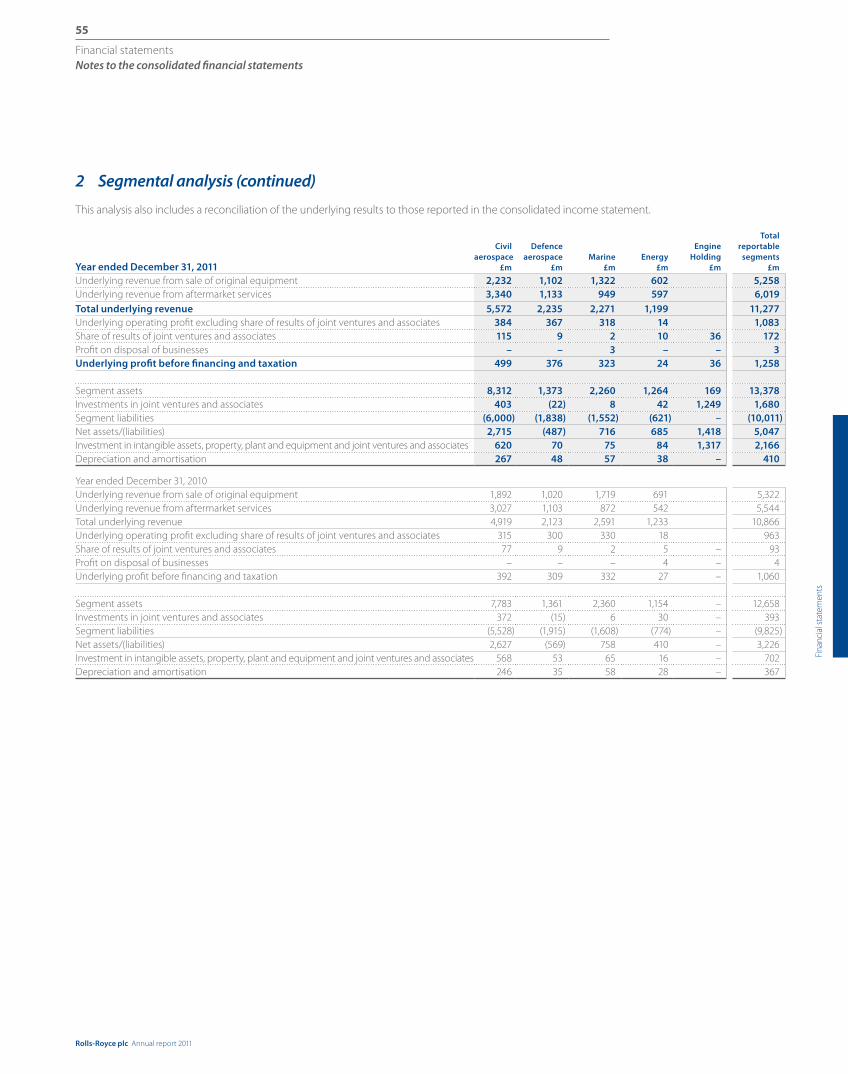
Rolls-Royce plc Annual report 2011
55
Financial statementsNotes to the consolidated financial statements
Fina
ncia
l sta
tem
ents
2 Segmental analysis (continued)
This analysis also includes a reconciliation of the underlying results to those reported in the consolidated income statement.
Year ended December 31, 2011
Civil aerospace
£m
Defence aerospace
£mMarine
£mEnergy
£m
EngineHolding
£m
Total reportable
segments £m
Underlying revenue from sale of original equipment 2,232 1,102 1,322 602 5,258 Underlying revenue from aftermarket services 3,340 1,133 949 597 6,019 Total underlying revenue 5,572 2,235 2,271 1,199 11,277 Underlying operating profit excluding share of results of joint ventures and associates 384 367 318 14 1,083 Share of results of joint ventures and associates 115 9 2 10 36 172 Profit on disposal of businesses – – 3 – – 3 Underlying profit before financing and taxation 499 376 323 24 36 1,258
Segment assets 8,312 1,373 2,260 1,264 169 13,378 Investments in joint ventures and associates 403 (22) 8 42 1,249 1,680 Segment liabilities (6,000) (1,838) (1,552) (621) – (10,011)Net assets/(liabilities) 2,715 (487) 716 685 1,418 5,047 Investment in intangible assets, property, plant and equipment and joint ventures and associates 620 70 75 84 1,317 2,166 Depreciation and amortisation 267 48 57 38 – 410
Year ended December 31, 2010 Underlying revenue from sale of original equipment 1,892 1,020 1,719 691 5,322 Underlying revenue from aftermarket services 3,027 1,103 872 542 5,544 Total underlying revenue 4,919 2,123 2,591 1,233 10,866 Underlying operating profit excluding share of results of joint ventures and associates 315 300 330 18 963 Share of results of joint ventures and associates 77 9 2 5 – 93 Profit on disposal of businesses – – – 4 – 4 Underlying profit before financing and taxation 392 309 332 27 – 1,060
Segment assets 7,783 1,361 2,360 1,154 – 12,658 Investments in joint ventures and associates 372 (15) 6 30 – 393 Segment liabilities (5,528) (1,915) (1,608) (774) – (9,825)Net assets/(liabilities) 2,627 (569) 758 410 – 3,226 Investment in intangible assets, property, plant and equipment and joint ventures and associates 568 53 65 16 – 702 Depreciation and amortisation 246 35 58 28 – 367

Rolls-Royce plc Annual report 2011
56
Financial statementsNotes to the consolidated financial statements
2 Segmental analysis (continued)
Reconciliation to reported results
Year ended December 31, 2011
Total reportable
segments £m
Underlying central
items £m
Total underlying
£m
Underlyingadjustments
£mGroup
£m
Revenue from sale of original equipment 5,258 – 5,258 (19) 5,239 Revenue from aftermarket services 6,019 – 6,019 (134) 5,885 Total revenue 11,277 – 11,277 (153) 11,124 Operating profit excluding share of results of joint ventures and associates 1,083 (52)1 1,031 39 1,070 Share of results of joint ventures and associates 172 172 (56) 116 Profit on disposal of businesses 3 3 – 3 Profit before financing and taxation 1,258 (52) 1,206 (17) 1,189 Net financing (48) (48) (35) (83)Profit before taxation (100) 1,158 (52) 1,106 Taxation (261) (261) 4 (257)Profit for the year (361) 897 (48) 849
Year ended December 31, 2010 Revenue from sale of original equipment 5,322 – 5,322 112 5,434 Revenue from aftermarket services 5,544 – 5,544 107 5,651 Total revenue 10,866 – 10,866 219 11,085 Operating profit excluding share of results of joint ventures and associates 963 (50)1 913 124 1,037 Share of results of joint ventures and associates 93 – 93 – 93 Profit on disposal of businesses 4 – 4 – 4 Profit before financing and taxation 1,060 (50) 1,010 124 1,134 Net financing (54) (54) (377) (431)Profit before taxation (104) 956 (253) 703 Taxation (236) (236) 77 (159)Profit for the year (340) 720 (176) 544
1 Central corporate costs
Underlying adjustments 2011 2010
Revenue£m
Profit before
financing £m
Net financing
£m Taxation
£m Revenue
£m
Profit before
financing £m
Net financing
£m Taxation
£m
Underlying performance 11,277 1,206 (48) (261) 10,866 1,010 (54) (236)Revenue recognised at exchange rate on date of transaction (153) – – – 219 – – – Realised (gains)/losses on settled derivative contracts 1 – (116) 24 – – 180 (7) – Net unrealised fair value changes to derivative contracts 2 – (5) (49) – – – (341) – Effect of currency on contract accounting – 4 – – – (56) – – Revaluation of trading assets and liabilities – – – – – – 8 – Financial RRSPs – foreign exchange differences and changes in forecast payments – – 2 – – – (6) – Effect of acquisition accounting 3 – (64) – – – – – –Post-retirement scheme past-service credits 4, 5 – 164 – – – – – –Net post-retirement scheme financing – – (12) – – – (31) – Related tax effect – – – 4 – – – 77 Total underlying adjustments (153) (17) (35) 4 219 124 (377) 77 Reported per consolidated income statement 11,124 1,189 (83) (257) 11,085 1,134 (431) (159)
1 Realised losses/(gains) on settled derivative contracts include adjustments to reflect the (gains)/losses in the same period as the related trading cash flows.2 Unrealised fair value changes to derivative contracts include those included in equity accounted joint ventures and exclude those for which the related trading contracts have been cancelled when the
fair value changes are recognised immediately in underlying profit.3 The adjustment eliminates charges recognised as a result of recognising assets in acquired businesses at fair value.4 In 2010, the UK Government announced changes to the basis of the statutory indexation for pension increases. As a result, the relevant arrangements have been amended, resulting in a gain in the
income statement of £130m, which has been excluded from underlying profit.5 The Group has agreed revised post-retirement healthcare arrangements on certain of its overseas schemes. This has resulted in a net gain in the income statement of £34m which has been excluded
from underlying profit.

Rolls-Royce plc Annual report 2011
57
Financial statementsNotes to the consolidated financial statements
Fina
ncia
l sta
tem
ents
2 Segmental analysis (continued)2011
£m2010
£m
Reportable segment assets 13,378 12,658 Investments in joint ventures and associates 1,680 393 Eliminations (757) (823)Cash and cash equivalents and short-term investments 1,320 3,186 Fair value of swaps hedging fixed rate borrowings 106 198 Income tax assets 388 457 Post-retirement scheme surpluses 503 164 Total assets 16,618 16,233 Reportable segment liabilities (10,011) (9,825)Eliminations 757 823 Borrowings (1,204) (1,786)Income tax liabilities (583) (608)Post-retirement scheme deficits (900) (1,020)Total liabilities (11,941) (12,416)Net assets 4,677 3,817
Geographical segmentsThe Group’s revenue by destination is shown below:
2011 £m
2010 £m
United Kingdom 1,361 1,594 Norway 374 486 Germany 409 413 Spain 189 231 Italy 183 187France 143 101Russia 143 133Rest of Europe 547 830 USA 3,578 3,096 Canada 301 299 China 934 890 South Korea 210 355 Middle East and South East Asia 1,778 1,585 Rest of Asia 290 228 Africa 261 109 Australasia 228 153 Other 195 395
11,124 11,085
In 2011, revenue (included in all reportable segments) of £1,143m (2010 £1,131m) was received from a single customer.
The carrying amounts of the Group’s non-current assets, excluding financial instruments, deferred tax assets and post-employment benefit surpluses, by the geographical area in which the assets are located, are as follows:
2011 £m
2010 £m
United Kingdom 2,980 2,925 North America 670 611 Nordic countries 902 908 Germany 1,907 625 Other 441 344
6,900 5,413
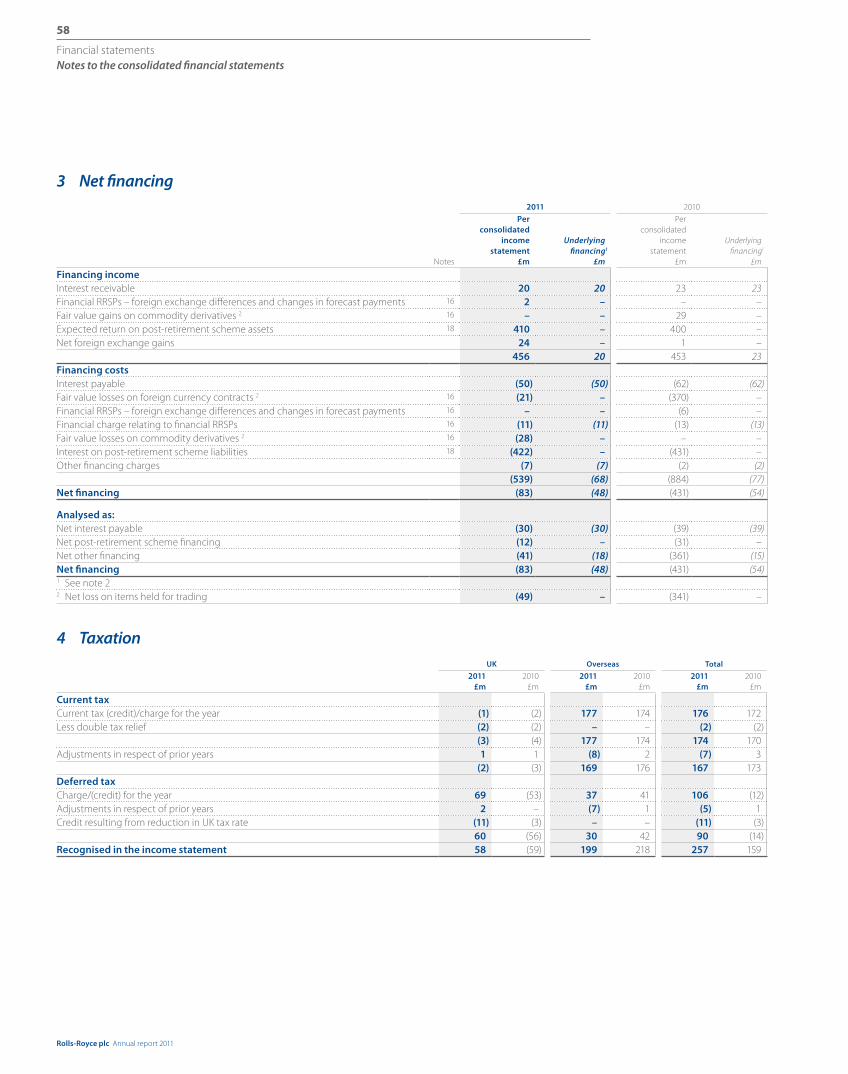
Rolls-Royce plc Annual report 2011
58
Financial statementsNotes to the consolidated financial statements
3 Net financing 2011 2010
Notes
Per consolidated
income statement
£m
Underlying financing1
£m
Per consolidated
income statement
£m
Underlying financing1
£m
Financing incomeInterest receivable 20 20 23 23 Financial RRSPs – foreign exchange differences and changes in forecast payments 16 2 – – – Fair value gains on commodity derivatives 2 16 – – 29 – Expected return on post-retirement scheme assets 18 410 – 400 – Net foreign exchange gains 24 – 1 –
456 20 453 23 Financing costsInterest payable (50) (50) (62) (62)Fair value losses on foreign currency contracts 2 16 (21) – (370) – Financial RRSPs – foreign exchange differences and changes in forecast payments 16 – – (6) – Financial charge relating to financial RRSPs 16 (11) (11) (13) (13)Fair value losses on commodity derivatives 2 16 (28) – – – Interest on post-retirement scheme liabilities 18 (422) – (431) – Other financing charges (7) (7) (2) (2)
(539) (68) (884) (77)Net financing (83) (48) (431) (54)
Analysed as:Net interest payable (30) (30) (39) (39)Net post-retirement scheme financing (12) – (31) – Net other financing (41) (18) (361) (15)Net financing (83) (48) (431) (54)1 See note 22 Net loss on items held for trading (49) – (341) –
4 TaxationUK Overseas Total
2011 £m
2010 £m
2011 £m
2010 £m
2011 £m
2010 £m
Current taxCurrent tax (credit)/charge for the year (1) (2) 177 174 176 172 Less double tax relief (2) (2) – – (2) (2)
(3) (4) 177 174 174 170 Adjustments in respect of prior years 1 1 (8) 2 (7) 3
(2) (3) 169 176 167 173 Deferred taxCharge/(credit) for the year 69 (53) 37 41 106 (12)Adjustments in respect of prior years 2 – (7) 1 (5) 1 Credit resulting from reduction in UK tax rate (11) (3) – – (11) (3)
60 (56) 30 42 90 (14)Recognised in the income statement 58 (59) 199 218 257 159
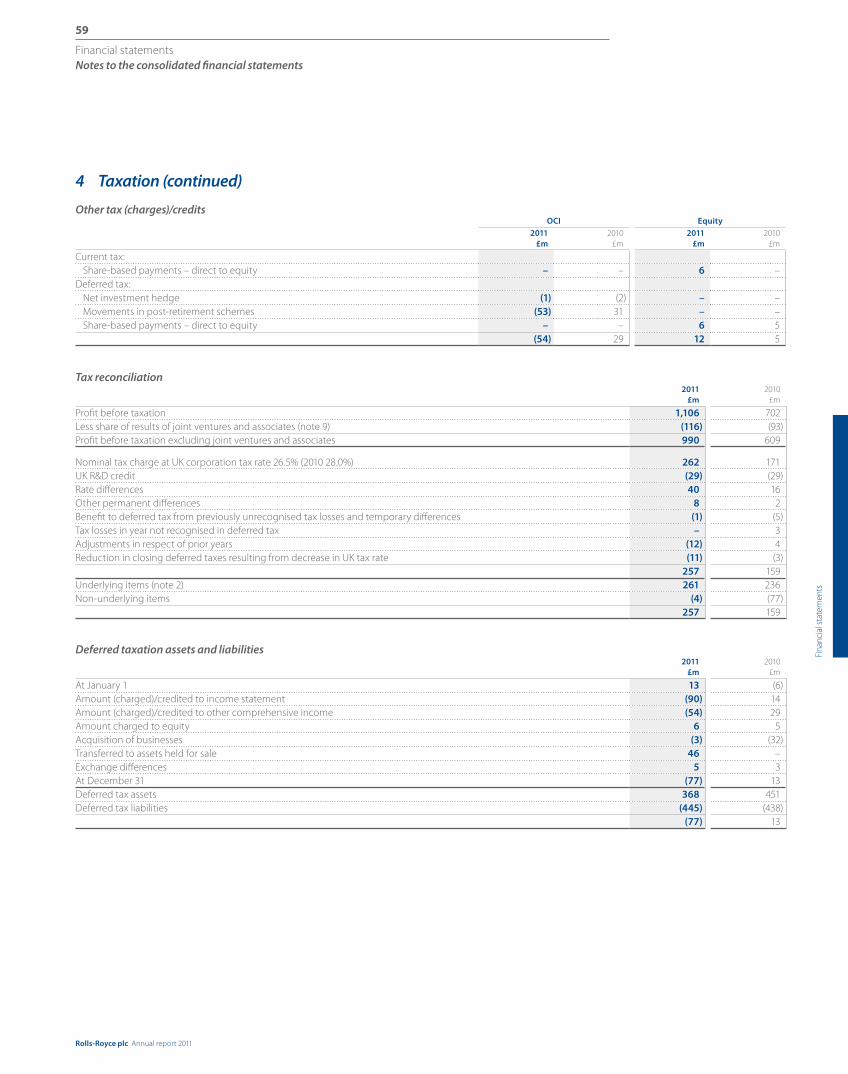
Rolls-Royce plc Annual report 2011
59
Financial statementsNotes to the consolidated financial statements
Fina
ncia
l sta
tem
ents
4 Taxation (continued)
Other tax (charges)/creditsOCI Equity
2011 £m
2010 £m
2011 £m
2010 £m
Current tax: Share-based payments – direct to equity – – 6 –Deferred tax: Net investment hedge (1) (2) – – Movements in post-retirement schemes (53) 31 – – Share-based payments – direct to equity – – 6 5
(54) 29 12 5
Tax reconciliation2011
£m 2010
£m
Profit before taxation 1,106 702 Less share of results of joint ventures and associates (note 9) (116) (93)Profit before taxation excluding joint ventures and associates 990 609
Nominal tax charge at UK corporation tax rate 26.5% (2010 28.0%) 262 171 UK R&D credit (29) (29)Rate differences 40 16 Other permanent differences 8 2 Benefit to deferred tax from previously unrecognised tax losses and temporary differences (1) (5)Tax losses in year not recognised in deferred tax – 3 Adjustments in respect of prior years (12) 4 Reduction in closing deferred taxes resulting from decrease in UK tax rate (11) (3)
257 159 Underlying items (note 2) 261 236 Non-underlying items (4) (77)
257 159
Deferred taxation assets and liabilities2011
£m 2010
£m
At January 1 13 (6)Amount (charged)/credited to income statement (90) 14 Amount (charged)/credited to other comprehensive income (54) 29 Amount charged to equity 6 5 Acquisition of businesses (3) (32)Transferred to assets held for sale 46 – Exchange differences 5 3 At December 31 (77) 13 Deferred tax assets 368 451 Deferred tax liabilities (445) (438)
(77) 13

Rolls-Royce plc Annual report 2011
60
Financial statementsNotes to the consolidated financial statements
4 Taxation (continued)
The analysis of the deferred tax position is as follows:
AtJanuary 1,
2011£m
Recognisedin income
statement£m
Recognisedin OCI
£m
Recognisedin equity
£m
Acquisition of
businesses£m
Transferred to assets
held for sale£m
Exchange differences
£m
AtDecember 31,
2011£m
Intangible assets (282) (9) – – – 46 2 (243)Property, plant and equipment (150) 16 – – – – (1) (135)Other temporary differences (64) (3) (1) 6 (3) – 4 (61)Amounts recoverable on contracts (229) (21) – – – – – (250)Pensions and other post-retirement scheme benefits 263 (111) (53) – – – – 99 Foreign exchange and commodity financial assets and liabilities 94 27 – – – – – 121 Losses 317 11 – – – – – 328 Advance corporation tax 64 – – – – – - 64
13 (90) (54) 6 (3) 46 5 (77)
AtJanuary 1,
2010£m
Recognisedin incomestatement
£m
Recognisedin OCI
£m
Recognisedin equity
£m
Acquisition of businesses
£m
Transferredto assets
held for sale£m
Exchange differences
£m
AtDecember 31,
2010£m
Intangible assets (250) (19) – – (11) – (2) (282)Property, plant and equipment (160) 10 – – – – – (150)Other temporary differences (22) (25) – 5 (21) – (1) (64)Amounts recoverable on contracts (243) 14 – – – – – (229)Pensions and other post-retirement scheme benefits 265 (39) 31 – – – 6 263 Foreign exchange and commodity financial assets and liabilities 54 40 – – – – – 94 Losses 286 33 (2) – – – – 317 Advance corporation tax 64 – – – – – – 64
(6) 14 29 5 (32) – 3 13
2011 £m
2010 £m
Advance corporation tax 118 118 Losses and other unrecognised deferred tax assets 41 51 Deferred tax not recognised on unused tax losses and other items on the basis that future economic benefit is uncertain 159 169
The 2010 Emergency Budget and the 2011 Budget announced that the UK corporation tax rate will reduce from 28 per cent to 23 per cent over a period of four years from 2011. The reductions to 26 per cent effective from April 1, 2011 and 25 per cent effective from April 1, 2012 were substantively enacted on March 29, 2011 and July 5, 2011 respectively. As the rate change to 25 per cent was substantively enacted prior to the year end, the closing deferred tax assets and liabilities have been calculated at this rate. The resulting charges or credits have been recognised in the income statement except to the extent that they relate to items previously charged or credited to OCI or equity. Accordingly, in 2011, £11m has been credited to the income statement, £5m has been charged to the OCI and £3m has been charged directly to equity.
Had the further tax rate changes been substantively enacted on or before the balance sheet date it would have had the effect of reducing the deferred tax asset by £23m and reducing the deferred tax liability by £22m.
There are no unrecognised deferred tax liabilities arising on the aggregate temporary differences associated with investments in subsidiaries, branches, associates and joint ventures (2010: £nil). Any withholding tax due on the remittance of future earnings is expected to be insignificant.

Rolls-Royce plc Annual report 2011
61
Financial statementsNotes to the consolidated financial statements
Fina
ncia
l sta
tem
ents
5 Employee information2011
Number2010
Number
Average number of employeesUnited Kingdom 21,600 21,000 Rest of the world 18,800 17,900
40,400 38,900 Civil aerospace 20,600 19,500 Defence aerospace 6,800 6,900 Marine 9,400 9,000 Energy 3,600 3,500
40,400 38,900
£m £m
Group employment costs 1
Wages and salaries 2,037 1,847 Social security costs 245 212 Share-based payments (note 20) 59 50 Pensions and other post-retirement scheme benefits (note 18) 23 221
2,364 2,330
1 Remuneration of key management personnel is shown in note 23.
6 Auditor’s remuneration
Fees payable to the Company’s auditors and its associates were as follows:
2011 £m
2010 £m
Fees payable to the Company’s auditors for the audit of the Company’s annual financial statements 1 1.6 1.7 Fees payable to the Company’s auditors and its associates for the audit of the Company’s subsidiaries pursuant to legislation 2.7 2.6 Total fees payable for audit services 4.3 4.3 Fees payable to the Company’s auditors and its associates for other services: Other services pursuant to legislation 0.2 0.2 Other services relating to taxation 0.5 0.5 All other services 0.2 –
5.2 5.0 Fees payable in respect of the Group’s pension schemes: Audit 0.2 0.2 Other services relating to taxation – 0.1

Rolls-Royce plc Annual report 2011
62
Financial statementsNotes to the consolidated financial statements
7 Intangible assets
Goodwill£m
Certificationcosts and
participationfees
£m
Developmentexpenditure
£m
Recoverableengine
costs £m
Softwareand other
£mTotal
£m
Cost:At January 1, 2010 991 631 751 586 273 3,232 Exchange differences 6 (2) – – (1) 3 Additions – 57 111 111 46 325 Acquisitions of businesses 118 – – – 96 214 Disposals – – – – (1) (1)At January 1, 2011 1,115 686 862 697 413 3,773 Exchange differences (20) (2) (1) – (2) (25)Additions – 44 93 135 95 367 Acquisitions of businesses 11 – – – 8 19 Transferred to assets held for sale – – – (368) – (368)Disposals – (8) – – (24) (32)At December 31, 2011 1,106 720 954 464 490 3,734
Accumulated amortisation:At January 1, 2010 7 177 205 296 75 760 Charge for the year 1 – 13 27 55 35 130 Disposals – – – – (1) (1)At January 1, 2011 7 190 232 351 109 889 Charge for the year 1 – 15 36 62 56 169 Transferred to assets held for sale – – – (182) – (182)Disposals – (8) – – (16) (24)At December 31, 2011 7 197 268 231 149 852
Net book value:At December 31, 2011 1,099 523 686 233 341 2,882At December 31, 2010 1,108 496 630 346 304 2,884 At January 1, 2010 984 454 546 290 198 2,472
1 Charged to cost of sales except development costs, which are charged to research and development costs.

Rolls-Royce plc Annual report 2011
63
Financial statementsNotes to the consolidated financial statements
Fina
ncia
l sta
tem
ents
7 Intangible assets (continued)
GoodwillIn accordance with the requirements of IAS 36 Impairment of Assets, goodwill is allocated to the Group’s cash-generating units (CGUs), or groups of CGUs, that are expected to benefit from the synergies of the business combination that gave rise to the goodwill as follows:
CGU or group of CGUsPrimary
reporting segment
2011 £m
2010 £m
Rolls-Royce Deutschland Ltd & Co KG Civil aerospace 230 236 Commercial marine – arising from the acquisitions of Vinters plc and Scandinavian Electric Holding AS Marine 645 657 Commercial marine – arising from the acquisition of ODIM ASA Marine 112 114 Other Various 112 101
1,099 1,108
Goodwill has been tested for impairment during 2011 on the following basis:• The carrying value of goodwill has been assessed by reference to value in use. These have been estimated using cash flows from the most recent
forecasts prepared by management, which are consistent with past experience and external sources of information on market conditions. Given the long-term and established nature of many of the Group’s products (product lives are often measured in decades), these forecast the next ten years. Growth rates for the period not covered by the forecasts are based on a range of growth rates (2.0-2.5 per cent) that reflect the products, industries and countries in which the relevant CGU or group of CGUs operate.
• The key assumptions for the impairment tests are the discount rate and, in the cash flow projections, the programme assumptions, the growth rates and the impact of foreign exchange rates on the relationship between selling prices and costs. Impairment tests are performed using prevailing exchange rates.
• The pre-tax cash flow projections have been discounted at 13 per cent (2010 13 per cent), based on the Group’s weighted average cost of capital.
The principal value in use assumptions for goodwill balances considered to be individually significant are:• Rolls-Royce Deutschland Ltd & Co KG – Volume of engine deliveries, flying hours of installed fleet and cost escalation, these are based on current
and known future programmes, estimates of customers’ fleet requirements and long-term economic forecasts. The principal foreign exchange exposure is on translating US dollar income into euros. For the purposes of the impairment test only, cash flows beyond the ten-year forecasts are assumed to grow at 2.5 per cent (2010 2.5 per cent). The directors do not consider that any reasonably possible change in the key assumptions would cause the value in use of the goodwill to fall below its carrying value. The overall level of business would need to reduce by more than 75 per cent to cause an impairment of this balance.
• Vinters plc – Volume of equipment deliveries, capture of aftermarket and cost escalation, these are based on current and known future programmes, estimates of customers’ fleet requirements and long-term economic forecasts. The principal foreign exchange exposures are on translating income in a variety of non-functional currencies into Norwegian kroner. For the purposes of the impairment test only, cash flows beyond the ten-year forecasts are assumed to grow at 2.5 per cent (2010 four per cent). The directors do not consider that any reasonably possible change in the key assumptions would cause the value in use of the goodwill to fall below its carrying value. The overall level of business would need to reduce by more than 80 per cent to cause an impairment of this balance.
Other intangible assetsCertification costs and participation fees, development costs and recoverable engine costs have been reviewed for impairment in accordance with the requirements of IAS 36 Impairment of Assets. Where an impairment test was considered necessary, it has been performed on the following basis:• The carrying values have been assessed by reference to value in use. These have been estimated using cash flows from the most recent forecasts
prepared by management, which are consistent with past experience and external sources of information on market conditions over the lives of the respective programmes.
• The key assumptions underlying cash flow projections are assumed market share, programme timings, unit cost assumptions, discount rates, and foreign exchange rates.
• The pre-tax cash flow projections have been discounted at 11 per cent (2010 11 per cent), based on the Group’s weighted average cost of capital.• No impairment is required on this basis. However, a combination of changes in assumptions and adverse movements in variables that are outside
the Group’s control (discount rate, exchange rate and airframe delays), could result in impairment in future years.

Rolls-Royce plc Annual report 2011
64
Financial statementsNotes to the consolidated financial statements
8 Property, plant and equipmentLand andbuildings
£m
Plant and equipment
£m
Aircraft and engines
£m
In course of construction
£mTotal
£m
Cost:At January 1, 2010 806 2,387 163 276 3,632 Exchange differences 6 16 – 1 23 Additions 11 94 35 221 361 Acquisitions of businesses 17 7 – – 24 Reclassifications 41 108 5 (154) – Disposals/write-offs (4) (74) (14) (2) (94)At January 1, 2011 877 2,538 189 342 3,946 Exchange differences (4) (13) – 1 (16)Additions 17 80 52 318 467 Acquisitions of businesses – 2 – – 2 Reclassifications 78 123 5 (206) – Transferred from/(to) assets held for sale 15 – (13) – 2 Disposals/write-offs (2) (84) (17) (1) (104)At December 31, 2011 981 2,646 216 454 4,297
Accumulated depreciation:At January 1, 2010 231 1,358 34 – 1,623 Exchange differences 4 11 – – 15 Charge for the year 1 37 190 10 – 237 Disposals/write-offs (1) (62) (2) – (65)At January 1, 2011 271 1,497 42 – 1,810 Exchange differences (2) (7) – – (9)Charge for the year 1 39 185 15 – 239 Impairment – – – 2 2 Reclassifications 3 (3) – – – Transferred from/(to) assets held for sale 6 – (7) – (1)Disposals/write-offs (2) (74) (6) – (82)At December 31, 2011 315 1,598 44 2 1,959
Net book value:At December 31, 2011 666 1,048 172 452 2,338 At December 31, 2010 606 1,041 147 342 2,136 At January 1, 2010 575 1,029 129 276 2,009
1 Depreciation charged during the year is presented in the income statement or included in the cost of inventory as appropriate.
Property, plant and equipment includes:
2011 £m
2010 £m
Net book value of finance leased assets:Land and buildings 7 8 Plant and equipment 5 5 Assets held for use in operating leases:Cost 235 159 Depreciation (60) (35)Net book value 175 124 Capital expenditure commitments 196 215 Cost of fully depreciated assets 655 584
The Group’s share of equity accounted entities capital commitments is £25m (2010 £24m).

Rolls-Royce plc Annual report 2011
65
Financial statementsNotes to the consolidated financial statements
Fina
ncia
l sta
tem
ents
9 InvestmentsJoint
ventures £m
Associates £m
Total equity accounted
£m
Other – unlisted
£m
At January 1, 2010 363 74 437 58 Exchange differences 4 2 6 – Additions 16 – 16 1 Taxation paid by the Group 3 – 3 – Impairment (1) – (1) (2)Share of retained profit 24 1 25 – Transferred to subsidiary – (77) (77) – Disposals – – – (46)Share of OCI of joint ventures and associates (16) – (16) – At January 1, 2011 393 – 393 11 Exchange differences (62) – (62) – Additions 1 1,329 – 1,329 – Taxation paid by the Group 3 – 3 – Share of retained profit 40 – 40 – Transferred to assets held for sale (13) – (13) –Disposals – – – (1)Share of OCI of joint ventures and associates (10) – (10) – At December 31, 2011 1,680 – 1,680 10
1 On August 25, 2011, Rolls-Royce and Daimler AG (Daimler) received all the relevant regulatory approvals for the acquisition of Tognum AG (Tognum). The public tender offer by Engine Holding GmbH (Engine Holding – the jointly held acquisition vehicle) was concluded in September 2011. At December 31, 2011, Engine Holding held 99 per cent of the Tognum shares, giving the Group an effective interest of 49.5 per cent. The results for the four month period from September 2011 have been included, after taking account of acquisition fair value adjustments. Subject to certain conditions being fulfilled, the Group has the option to exercise rights that would result in Engine Holding being classified as a subsidiary and consolidated. It is anticipated that these conditions will be fulfilled during 2012. As part of the Engine Holding shareholders’ agreement, Daimler has the option to sell, for a specified period at a specified price, its shares in Engine Holding to Rolls-Royce. The value of this option was not significant at December 31, 2011
The summarised aggregated financial information of the Group’s share of equity accounting investments is as follows:
Joint ventures Associates TotalEngine
Holding Other2011
£m2010
£m2011
£m2010
£m2011
£m2010
£m
Assets: Non-current assets 1,687 1,529 3,216 1,405 – – 3,216 1,405 Current assets 818 891 1,709 1,161 – – 1,709 1,161 Liabilities: 2
Current liabilities (477) (793) (1,270) (1,151) – – (1,270) (1,151) Non-current liabilities (779) (1,196) (1,975) (1,022) – – (1,975) (1,022)
1,249 431 1,680 393 – – 1,680 393 2 Liabilities include borrowings of: (176) (1,176) (1,352) (1,043) – – (1,352) (1,043)
Revenue 491 3,055 3,546 2,914 – 26 3,546 2,940 Profit before financing and taxation (13) 165 152 128 – 1 152 129 Net financing (12) (19) (31) (19) – – (31) (19)Taxation 10 (15) (5) (17) – – (5) (17)Results recognised in the consolidated income statement (15) 131 116 92 – 1 116 93 Dividends received – (76) (76) (68) – – (76) (68)Retained profit (15) 55 40 24 – 1 40 25
The principal joint ventures at December 31, 2011 are listed on pages 112 and 113.

Rolls-Royce plc Annual report 2011
66
Financial statementsNotes to the consolidated financial statements
10 Inventories2011
£m 2010
£m
Raw materials 319 377 Work in progress 921 943 Long-term contracts work in progress 12 42 Finished goods 1,267 1,024 Payments on account 42 43
2,561 2,429
Inventories stated at net realisable value 169 202Amount of inventory write-down 114 135 Reversal of inventory write-down 3 2
11 Trade and other receivables2011
£m 2010
£m
Trade receivables 1,123 1,210 Amounts recoverable on contracts 1 1,665 1,580 Amounts owed by joint ventures and associates 421 518 Loan to Engine Holding GmbH 169 –Amounts owed by parent undertaking 196 –Other receivables 475 449 Prepayments and accrued income 156 186
4,205 3,943
Analysed as:Financial Instruments (note 16): Trade receivables and similar items 1,655 1,801 Other non-derivative financial assets 550 419 Non-financial instruments 2,000 1,723
4,205 3,943
Trade and other receivables expected to be recovered in more than one year: Trade receivables 4 7 Amounts recoverable on contracts 1,314 1,176 Amounts owed by joint ventures and associates 20 5 Amounts owed by parent undertaking – – Other receivables 60 56 Prepayments and accrued income 28 27
1,426 1,271
1 The balance at December 31, 2011 includes an allowance of £63m (2010 £55m), being the directors’ best estimate of the loss that will occur from the Group’s contract with EPI Europrop International GmbH to participate in the development of the TP400 engine for the Airbus A400M military transport aircraft.

Rolls-Royce plc Annual report 2011
67
Financial statementsNotes to the consolidated financial statements
Fina
ncia
l sta
tem
ents
12 Cash and cash equivalents2011
£m 2010
£m
Cash at bank and in hand 1,284 1,265 Money-market funds 11 381 Short-term deposits 14 1,212
1,309 2,858
Overdrafts (note 14) (19) (8)Cash and cash equivalents per cash flow statement (page 44) 1,290 2,850 Cash held as collateral against third party obligations (note 22) 67 68
13 Assets held for sale 2011
£m 2010
£m
Intangible assets – Recoverable engine costs 186 – Property, plant and equipment 6 9 Investment in joint venture 13 – Amounts recoverable on contracts 59 – Amounts owed by joint ventures 49 – Assets held for sale 313 9
Accruals and deferred income (54) –Other payables (26) – Provisions for liabilities and charges (9) – Deferred tax liabilities (46) – Liabilities associated with assets held for sale (135) –
On October 12, 2011, the Group announced an agreement to form a new partnership with Pratt & Whitney, a United Technologies Corporation company, to develop new engines for the next generation of mid-size aircraft (120-230 seats). As part of this agreement, the Group and Pratt & Whitney will restructure their participation in IAE, which produces the V2500 engine from the Airbus A320 family of aircraft. Under the terms of the agreement, which is subject to regulatory approvals, the Group will sell its equity, programme share and related goodwill in IAE to Pratt & Whitney for US$1.5 billion.
The assets and liabilities shown above are those, included in the civil aerospace segment, that will be derecognised on the completion of the transaction. However, as Rolls-Royce will continue to be responsible for the manufacture of high-pressure compressors, fan blades as well as the provision of engine support and final assembly of 50 per cent of V2500 engines, the transaction is not considered to give rise to a discontinued operation.

Rolls-Royce plc Annual report 2011
68
Financial statementsNotes to the consolidated financial statements
14 Borrowings Current Non-current Total
2011 £m
2010 £m
2011 £m
2010 £m
2011 £m
2010 £m
UnsecuredOverdrafts 19 8 – – 19 8 Bank loans 1 1 204 206 205 207 73/8% Notes 2016 £200m – – 200 200 200 200 6.38% Notes 2013 US$230m 1 – – 160 162 160 162 6.55% Notes 2015 US$83m 1 – – 62 60 62 60 41/2% Notes 2011 €750m 2 – 642 – – – 642 6.75% Notes 2019 £500m – – 557 506 557 506 SecuredObligations under finance leases 3 – – 1 1 1 1
20 651 1,184 1,135 1,204 1,786
1 These notes are the subject of interest rate swap agreements under which the Group has undertaken to pay floating rates of interest, and currency swaps which form a fair value hedge. 2 These notes are the subject of swap agreements under which counterparties have undertaken to pay amounts at fixed rates of interest and exchange in consideration for amounts payable at variable
rates of interest and at fixed exchange rates.3 Obligations under finance leases are secured by related leased assets.
15 Trade and other payablesCurrent Non-current
2011 £m
2010 £m
2011 £m
2010 £m
Payments received on account 1 1,396 1,560 487 475 Trade payables 1,028 891 – – Amounts owed to parent undertaking 40 250 – – Amounts owed to joint ventures and associates 215 267 1 7 Other taxation and social security 88 81 – – Other payables 1,623 1,294 58 94 Accruals and deferred income 1,886 1,817 768 695
6,276 6,160 1,314 1,271 1 Includes payments received on account from joint ventures and associates 358 258 147 243
Included within trade and other payables are government grants of £104m (2010 £44m). During the year, £2m (2010 £2m) of government grants were released to the income statement.
Trade and other payables are analysed as follows:
2011£m
2010£m
Financial instruments (note 16): Trade payables and similar items 2,356 2,212 Other non-derivative financial liabilities 718 521Non-financial instruments 4,516 4,698
7,590 7,431

Rolls-Royce plc Annual report 2011
69
Financial statementsNotes to the consolidated financial statements
Fina
ncia
l sta
tem
ents
16 Financial instruments
Carrying values and fair values of financial instruments Assets Liabilities Total
Notes
Basis for determining
fair value
Held fortrading
£m
Loans and receivables
£m
Available for sale
£mCash
£m
Held for trading
£mOther
£m £m
At December 31, 2011Unlisted non-current asset investments 9 A – 10 – – – – 10 Trade receivables and similar items 11 B – 1,655 – – – – 1,655 Other non-derivative financial assets 11 B – 550 – – – – 550 Derivative financial assets C 418 – – – – – 418 Short-term investments B – 11 – – – – 11 Cash and cash equivalents 12 B – 14 11 1,284 – – 1,309 Borrowings 14 D – – – – – (1,204) (1,204)Derivative financial liabilities C – – – – (796) – (796)Financial RRSPs D – – – – – (230) (230)Trade payables and similar items 15 B – – – – – (2,356) (2,356)Other non-derivative financial liabilities 15 B – – – – – (718) (718)
418 2,240 11 1,284 (796) (4,508) (1,351)
At December 31, 2010Unlisted non-current asset investments 9 A – 11 – – – – 11 Trade receivables and similar items 11 B – 1,801 – – – – 1,801 Other non-derivative financial assets 11 B – 419 – – – – 419 Derivative financial assets C 621 – – – – – 621
Short-term investments B – 328 – – – – 328 Cash and cash equivalents 12 B – 1,212 381 1,265 – – 2,858 Borrowings 14 D – – – – – (1,786) (1,786)Derivative financial liabilities C – – – – (761) – (761)Financial RRSPs D – – – – – (266) (266)Trade payables and similar items 15 B – – – – – (2,212) (2,212)Other non-derivative financial liabilities 15 B – – – – – (521) (521)
621 3,771 381 1,265 (761) (4,785) 492
Fair values equate to book values for both 2011 and 2010, with the following exceptions:
2011 2010Book value
£mFair value
£mBook value
£mFair value
£m
Borrowings (1,204) (1,371) (1,786) (1,897)Financial RRSPs (230) (254) (266) (296)
The fair value of a financial instrument is the price at which an asset could be exchanged, or a liability settled, between knowledgeable, willing parties in an arms-length transaction. Fair values have been determined with reference to available market information at the balance sheet date, using the methodologies described below.
A These primarily comprise floating rate convertible loan stock. The conversion conditions are such that fair value approximates to the book value.
B Fair values are assumed to approximate to cost either due to the short-term maturity of the instruments or because the interest rate of the investments is reset after periods not exceeding six months.
C Fair values of derivative financial assets and liabilities are estimated by discounting expected future contractual cash flows using prevailing interest rate curves. Amounts denominated in foreign currencies are valued at the exchange rate prevailing at the balance sheet date. These financial instruments are included on the balance sheet at fair value, derived from observable market prices (Level 2 as defined by IFRS 7 Financial Instruments: Disclosures).
D Borrowing and financial RRSPs are carried at amortised cost. Fair values are estimated by discounting expected future contractual cash flows using prevailing interest rate curves. Amounts denominated in foreign currencies are valued at the exchange rate prevailing at the balance sheet date. For financial RRSPs, the contractual cash flows are based on future trading activity, which is estimated based on latest forecasts.
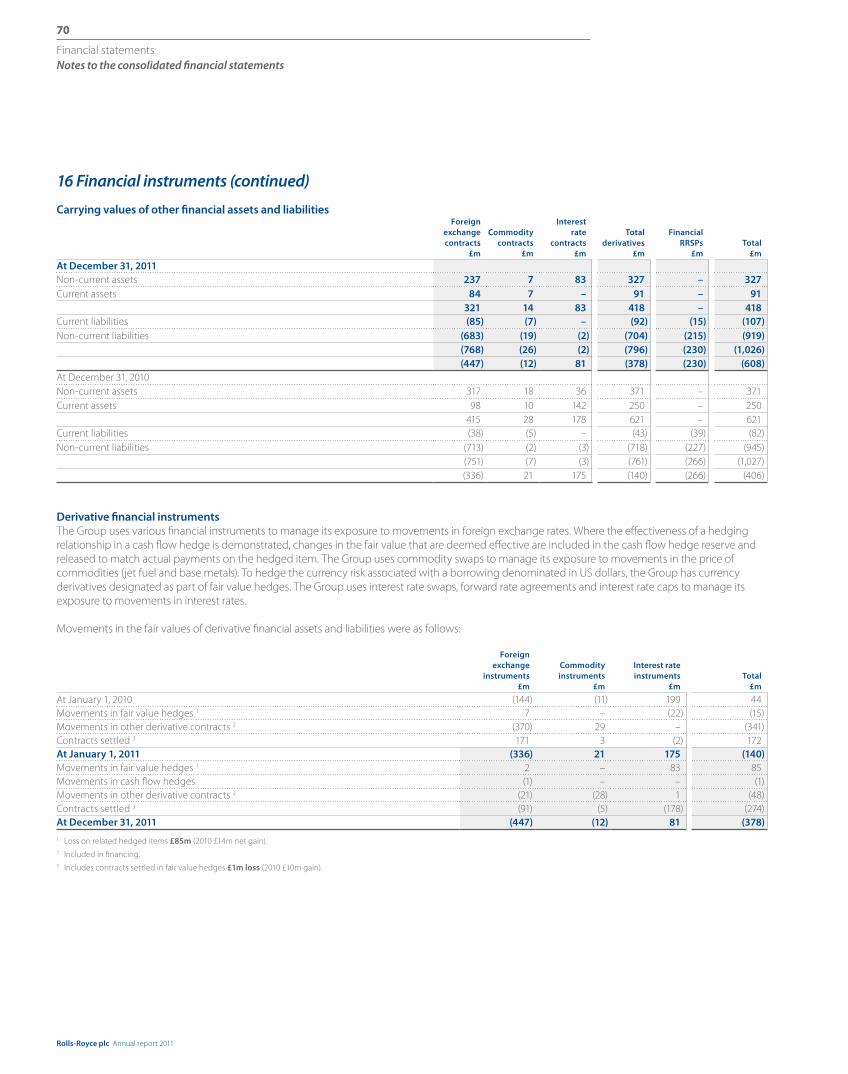
Rolls-Royce plc Annual report 2011
70
Financial statementsNotes to the consolidated financial statements
16 Financial instruments (continued)
Carrying values of other financial assets and liabilitiesForeign
exchange contracts
£m
Commodity contracts
£m
Interest rate
contracts £m
Total derivatives
£m
Financial RRSPs
£mTotal
£m
At December 31, 2011 Non-current assets 237 7 83 327 – 327 Current assets 84 7 – 91 – 91
321 14 83 418 – 418 Current liabilities (85) (7) – (92) (15) (107)Non-current liabilities (683) (19) (2) (704) (215) (919)
(768) (26) (2) (796) (230) (1,026)(447) (12) 81 (378) (230) (608)
At December 31, 2010 Non-current assets 317 18 36 371 – 371 Current assets 98 10 142 250 – 250
415 28 178 621 – 621 Current liabilities (38) (5) – (43) (39) (82)Non-current liabilities (713) (2) (3) (718) (227) (945)
(751) (7) (3) (761) (266) (1,027)(336) 21 175 (140) (266) (406)
Derivative financial instruments The Group uses various financial instruments to manage its exposure to movements in foreign exchange rates. Where the effectiveness of a hedging relationship in a cash flow hedge is demonstrated, changes in the fair value that are deemed effective are included in the cash flow hedge reserve and released to match actual payments on the hedged item. The Group uses commodity swaps to manage its exposure to movements in the price of commodities (jet fuel and base metals). To hedge the currency risk associated with a borrowing denominated in US dollars, the Group has currency derivatives designated as part of fair value hedges. The Group uses interest rate swaps, forward rate agreements and interest rate caps to manage its exposure to movements in interest rates.
Movements in the fair values of derivative financial assets and liabilities were as follows:
Foreign exchange
instruments £m
Commodity instruments
£m
Interest rate instruments
£m Total
£m
At January 1, 2010 (144) (11) 199 44 Movements in fair value hedges 1 7 – (22) (15)Movements in other derivative contracts 2 (370) 29 – (341)Contracts settled 3 171 3 (2) 172 At January 1, 2011 (336) 21 175 (140)Movements in fair value hedges 1 2 – 83 85 Movements in cash flow hedges (1) – – (1)Movements in other derivative contracts 2 (21) (28) 1 (48)Contracts settled 3 (91) (5) (178) (274)At December 31, 2011 (447) (12) 81 (378)
1 Loss on related hedged items £85m (2010 £14m net gain).2 Included in financing.3 Includes contracts settled in fair value hedges £1m loss (2010 £10m gain).

Rolls-Royce plc Annual report 2011
71
Financial statementsNotes to the consolidated financial statements
Fina
ncia
l sta
tem
ents
16 Financial instruments (continued)
Financial risk and revenue sharing partnerships (RRSPs)The Group has financial liabilities arising from financial RRSPs. These financial liabilities are valued at each reporting date using the amortised cost method. This involves calculating the present value of the forecast cash flows of the arrangements using the internal rate of return at the inception of the arrangements as the discount rate.
Movements in the amortised cost values of financial RRSPs were as follows:
2011 £m
2010 £m
At January 1 (266) (363)Cash paid to partners 46 114 Exchange adjustments included in OCI (1) 2 Financing charge 1 (11) (13)Excluded from underlying profit: Exchange adjustments1 1 (6) Changes in forecast payments1 1 –At December 31 (230) (266)
1 Included in financing
Risk management policies and hedging activities The principal financial risks to which the Group is exposed are: foreign currency exchange rate risk; liquidity risk; credit risk; interest rate risk; and commodity price risk. The Board has approved policies for the management of these risks.
Foreign currency exchange rate risk – The Group has significant cash flows (most significantly US dollars, followed by the euro) denominated in currencies other than the functional currency of the relevant trading entity. To manage its exposures to changes in values of future foreign currency cash flows, so as to maintain relatively stable long-term foreign exchange rates on settled transactions, the Group enters into derivative forward foreign currency transactions. For accounting purposes, these derivative contracts are not designated as hedging instruments.
The Group also has exposures to the fair values of non-derivative financial instruments denominated in foreign currencies. To manage the risk of changes in these fair values, the Group enters into derivative forward foreign exchange contracts, which are designated as fair value hedges for accounting purposes.
The Group regards its interests in overseas subsidiary companies as long-term investments. The Group aims to match its translational exposures by matching the currencies of assets and liabilities. Where appropriate, foreign currency financial liabilities may be designated as hedges of the net investment.
Liquidity risk – The Group’s policy is to hold financial investments and maintain undrawn committed facilities at a level sufficient to ensure that the Group has available funds to meet its medium-term capital and funding obligations and to meet any unforeseen obligations and opportunities. The Group holds cash and short-term investments, which together with the undrawn committed facilities, enable the Group to manage its liquidity risk. The profile of the maturity of the Group’s committed facilities is discussed in additional financial information on page 34.
Credit risk – The Group is exposed to credit risk to the extent of non-payment by either its customers or the counterparties of its financial instruments. The effective monitoring and controlling of credit risk is a key component of the Group’s risk management activities. The Group has credit policies covering both trading and financial exposures. Credit risks arising from treasury activities are managed by a central treasury function in accordance with the Group credit policy. The objective of the policy is to diversify and minimise the Group’s exposure to credit risk from its treasury activities by ensuring the Group transacts strictly with ‘BBB+’ or higher rated financial institutions based on pre-established limits per financial institution. At the balance sheet date, there were no significant concentrations of credit risk to individual customers or counterparties. The maximum exposure to credit risk at the balance sheet date is represented by the carrying value of each financial asset, including derivative financial instruments.
Interest rate risk – The Group’s interest rate risk is primarily in relation to its fixed rate borrowings (fair value risk), floating rate borrowings and cash and cash equivalents (cash flow risk). Interest rate derivatives are used to manage the overall interest rate profile within the Group policy, which is to maintain a higher proportion of net debt at floating rates of interest as a natural hedge to the net cash position. These are designated as either fair value or cash flow hedges as appropriate.
Commodity risk – The Group has exposures to the price of jet fuel and base metals arising from business operations. To minimise its cash flow exposures to changes in commodity prices, the Group enters into derivative commodity transactions. For accounting purposes, these derivative contracts are not designated as hedging instruments.
Other price risk – The Group’s cash equivalent balances represent investments in money-market instruments, with a term of up to three months. The Group does not consider that these are subject to significant price risk.

Rolls-Royce plc Annual report 2011
72
Financial statementsNotes to the consolidated financial statements
16 Financial instruments (continued)
Derivative financial instrumentsThe nominal amounts, analysed by year of expected maturity, and fair values of derivative financial instruments are as follows:
Expected maturity Fair value
Nominalamount
£m
Withinone year
£m
Betweenone and
two years £m
Betweentwo and
five years £m
Afterfive years
£mAssets
£mLiabilities
£m
At December 31, 2011 Foreign exchange contracts: Fair value hedges 175 – 129 46 – 23 – Non-hedge accounted 17,563 5,438 3,625 7,568 932 298 (768)Interest rate contracts: Fair value hedges 701 – 148 53 500 83 – Non-hedge accounted 43 – – 43 – – (2)Commodity contracts: Non-hedge accounted 220 68 59 93 – 14 (26)
18,702 5,506 3,961 7,803 1,432 418 (796)At December 31, 2010 Foreign exchange contracts: Fair value hedges 175 – – 175 – 20 – Non-hedge accounted 15,561 3,806 3,285 7,427 1,043 395 (751)Interest rate contracts: Fair value hedges 1,200 500 – 200 500 178 – Non-hedge accounted 46 – – 46 – – (3)Commodity contracts: Non-hedge accounted 138 60 43 35 – 28 (7)
17,120 4,366 3,328 7,883 1,543 621 (761)
As described above, all derivative financial instruments are entered into for risk management purposes, although these may not be designated into hedging relationships for accounting purposes.
Currency analysisDerivative financial instruments related to foreign exchange risks are denominated in the following currencies:
Currencies purchased forwardSterling
£mUS dollar
£mEuro
£mOther
£mTotal
£m
At December 31, 2011 Currencies sold forward: Sterling – 814 – 147 961 US dollar 14,401 – 1,193 834 16,428 Euro – – – 197 197 Other 36 26 67 23 152 At December 31, 2010 Currencies sold forward: Sterling – 175 – 35 210 US dollar 13,195 – 1,161 642 14,998 Euro – – – 285 285 Other 76 35 106 26 243

Rolls-Royce plc Annual report 2011
73
Financial statementsNotes to the consolidated financial statements
Fina
ncia
l sta
tem
ents
16 Financial instruments (continued)
Other derivative financial instruments are denominated in the following currencies:
2011 £m
2010 £m
Sterling 510 514US dollar 421 337Euro – 500Other 33 33
Non-derivative financial instruments Non-derivative financial instruments are denominated in the following currencies:
Sterling £m
US dollar£m
Euro£m
Other£m
Total£m
At December 31, 2011AssetsUnlisted non-current investments 1 – 4 5 10 Trade receivables and similar items 204 1,201 133 117 1,655 Other non-derivative financial assets 112 87 217 134 550 Short-term investments 5 – – 6 11 Cash and cash equivalents 50 656 367 236 1,309
372 1,944 721 498 3,535 LiabilitiesBorrowings (977) (222) (5) – (1,204)Financial RRSPs – (173) (57) – (230)Trade payables and similar items (1,095) (812) (275) (174) (2,356)Other non-derivative financial liabilities (252) (308) (18) (140) (718)
(2,324) (1,515) (355) (314) (4,508)(1,952) 429 366 184 (973)
At December 31, 2010 AssetsUnlisted non-current investments 1 – 4 6 11 Trade receivables and similar items 312 1,120 210 159 1,801 Other non-derivative financial assets 155 46 40 178 419 Short-term investments 325 – – 3 328 Cash and cash equivalents 1,298 634 473 453 2,858
2,091 1,800 727 799 5,417 LiabilitiesBorrowings (906) (222) (656) (2) (1,786)Financial RRSPs – (208) (58) – (266)Trade payables and similar items (1,040) (705) (219) (248) (2,212)Other non-derivative financial liabilities (211) (166) (35) (109) (521)
(2,157) (1,301) (968) (359) (4,785)(66) 499 (241) 440 632

Rolls-Royce plc Annual report 2011
74
Financial statementsNotes to the consolidated financial statements
16 Financial instruments (continued)
Currency exposures The Group’s actual currency exposures after taking account of derivative foreign currency contracts, which are not designated as hedging instruments for accounting purposes are as follows:
Functional currency of Group operationSterling
£mUS dollar
£mEuro
£mOther
£mTotal
£m
At December 31, 2011 Sterling – 1 – 3 4 US dollar 3 – (2) 10 11 Euro (1) (1) – – (2)Other 1 4 1 3 9 At December 31, 2010 Sterling – 3 1 1 5 US dollar 1 – (1) 16 16 Euro – (1) – (1) (2)Other 1 – 1 2 4
Ageing beyond contractual due dateThe ageing beyond contractual due date of the Group’s financial assets is:
Withinterms
£m
Up tothree
monthsoverdue
£m
Betweenthree
months andone yearoverdue
£m
More thanone yearoverdue
£mTotal
£m
At December 31, 2011 Unlisted non-current asset investments 10 – – – 10 Trade receivables and similar items 1,377 184 68 26 1,655 Other non-derivative financial assets 532 15 – 3 550 Derivative financial assets 418 – – – 418 Short-term investments 11 – – – 11 Cash and cash equivalents 1,309 – – – 1,309
3,657 199 68 29 3,953 At December 31, 2010 Unlisted non-current asset investments 11 – – – 11 Trade receivables and similar items 1,505 180 86 30 1,801 Other non-derivative financial assets 396 19 1 3 419 Derivative financial assets 621 – – – 621 Short-term investments 328 – – – 328 Cash and cash equivalents 2,858 – – – 2,858
5,719 199 87 33 6,038

Rolls-Royce plc Annual report 2011
75
Financial statementsNotes to the consolidated financial statements
Fina
ncia
l sta
tem
ents
16 Financial instruments (continued)
Contractual maturity analysis of financial liabilities Gross values
Withinone year
£m
Betweenone and
two years £m
Betweentwo and
five years £m
Afterfive years
£mDiscounting
£mCarrying values
£m
At December 31, 2011 Borrowings (85) (213) (608) (603) 305 (1,204)Derivative financial liabilities (92) (199) (419) (48) (38) (796)Financial RRSPs (37) (37) (91) (127) 62 (230)Trade payables and similar items (2,353) (1) (1) (1) – (2,356)Other non-derivative financial liabilities (715) (2) – (1) – (718)
(3,282) (452) (1,119) (780) 329 (5,304)At December 31, 2010 Borrowings (746) (68) (575) (887) 490 (1,786)Derivative financial liabilities (43) (110) (525) (8) (75) (761)Financial RRSPs (47) (39) (110) (152) 82 (266)Trade payables and similar items (2,199) (7) (4) (2) - (2,212)Other non-derivative financial liabilities (516) (3) (1) (1) - (521)
(3,551) (227) (1,215) (1,050) 497 (5,546)
Interest rate riskIn respect of income earning financial assets and interest bearing financial liabilities, the following table indicates their effective interest rates and the periods in which they reprice. The value shown is the carrying amount.
2011Period in which interest rate reprices
Effectiveinterest rate
%Total
£m
6 monthsor less
£m6-12 months
£m1-2 years
£m2-5 years
£m
More than5 years
£m
Short-term investments 1 4.3782% 11 9 2 – – – Cash and cash equivalents 2 1,309 1,309 – – – – Unsecured bank loans€2m floating rate loan 0.5000% (2) – – – – (2)€5m floating rate loan EURIBOR +0.75 (3) (3) – – – – Overdrafts 3 (19) (19) – – – – Interest rate swaps 10.8775% – 10 – – (10) – £200m floating rate loan GBP LIBOR + 0.267 (200) (200) – – – – Unsecured bond issues73/8% Notes 2016 £200m 7.3750% (200) – – – (200) – 6.38% Notes 2013 US$230m 6.3800% (160) – – (160) – – Effect of interest rate swaps USD LIBOR + 1.26 – (160) – 160 – – 6.55% Notes 2015 US$83m 6.5500% (62) – – – (62) – Effect of interest rate swaps USD LIBOR + 1.24 – (62) – – 62 – 6.75% Notes 2019 £500m 6.7500% (557) – – – – (557)Effect of interest rate swaps GBP LIBOR + 2.9824 – (557) – – – 557 Other securedObligations under finance leases 5.0000% (1) – – – – (1)
116 327 2 – (210) (3)

Rolls-Royce plc Annual report 2011
76
Financial statementsNotes to the consolidated financial statements
16 Financial instruments (continued)2010
Period in which interest rate repricesEffective
interest rate%
Total£m
6 monthsor less
£m6-12 months
£m1-2 years
£m2-5 years
£m
More than5 years
£m
Short-term investments 1 1.1654% 328 327 1 – – – Cash and cash equivalents 2 2,858 2,858 – – – – Unsecured bank loans€5m floating rate loan EURIBOR + 0.5 (5) (5) – – – – Overdrafts 3 (8) (8) – – – – 75m Indian rupee fixed rate loan 11.2467% (1) (1) – – – – Effect of interest rate swaps 7.2237% (1) 12 – – (13) – £200m floating rate loan GBP LIBOR + 0.267 (200) (200) – – – – Unsecured bond issues73/8% Notes 2016 £200m 7.3750% (200) – – – – (200)6.38% Notes 2013 US$230m 6.3800% (162) – – – (162) – Effect of interest rate swaps USD LIBOR + 1.26 – (162) – – 162 – 6.55% Notes 2015 US$83m 6.5500% (60) – – – (60) – Effect of interest rate swaps USD LIBOR + 1.24 – (60) – – 60 – 41/2% Notes 2011 €750m 4.5000% (642) (642) – – – – Effect of interest rate swaps GBP LIBOR + 0.911 – – – – – – 6.75% Notes 2019 £500m 6.7500% (506) – – – – (506)Effect of interest rate swaps GBP LIBOR + 2.98 – (506) – – – 506 Other securedObligations under finance leases 5.0000% (1) – – – – (1)
1,400 1,613 1 – (13) (201)
1 Interest on the short-term investments are at fixed rates.2 Cash and cash equivalents comprises bank balances and demand deposits and earns interest at rates based on daily deposit rates.3 Overdrafts bear interest at rates linked to applicable LIBOR rates that fluctuate in accordance with local practice.
Some of the Group’s borrowings are subject to the Group meeting certain obligations, including customary financial covenants. If the Group fails to meet its obligations these arrangements give rights to the lenders, upon agreement, to accelerate repayment of the facilities. There are no rating triggers contained in any of the Group’s facilities that could require the Group to accelerate or repay any facility for a given movement in the Group’s credit rating.
In addition, the Group has undrawn committed borrowing facilities available as follows:
2011 £m
2010 £m
Expiring in one to two years – 250 Expiring after two years 1,200 200
1,200 450

Rolls-Royce plc Annual report 2011
77
Financial statementsNotes to the consolidated financial statements
Fina
ncia
l sta
tem
ents
16 Financial instruments (continued)
Sensitivity analysisThe Group is exposed to a number of foreign currencies. The most significant transactional currency exposures are US dollar with sterling and US dollar with euro.
At December 31, 2011 if sterling had weakened ten per cent against the US dollar with all other variables held constant, profit after tax for the year and equity would have been £1,083m lower (2010 £989m). If sterling had strengthened ten per cent against the US dollar with all other variables held constant, profit after tax for the year and equity would have been £886m higher (2010 £809m). There would have been no change to the underlying results that exclude unrealised gains and losses on foreign exchange derivatives.
At December 31, 2011 if the euro had weakened ten per cent against the US dollar with all other variables held constant, profit after tax and equity for the year would have been £93m lower (2010 £82m). If the euro had strengthened ten per cent against the US dollar with all other variables held constant, profit after tax for the year and equity would have been £78m higher (2010 £66m). There would have been no change to the underlying results that exclude unrealised gains and losses on foreign exchange derivatives.
At December 31, 2011 if the price of commodities had been ten per cent lower, with all other variables remaining constant, profit after tax for the year and equity would have been £15m lower (2010 £11m). If the price of commodities had been ten per cent higher, with all other variables remaining constant, profit after tax and equity would have been £15m higher (2010 £11m). There would have been no change to the underlying results that exclude unrealised gains and losses on commodity derivatives.
At December 31, 2011 the Group had no material sensitivity to changes in interest rates on that date. The main interest rate sensitivity for the Group arises as a result of the gross up of net cash and this is mitigated as described under the interest rate risk management policies on page 71.

Rolls-Royce plc Annual report 2011
78
Financial statementsNotes to the consolidated financial statements
17 Provisions for liabilities and charges
At January 1, 2011
£m
Exchange differences
£m
Transferred to assets held for
sale£m
Acquisitions/disposals of
businesses £m
Unused amounts reversed
£m
Charged to income
statement £m
Utilised £m
At December 31,
2011 £m
Warranty and guarantees 298 (5) – – (21) 72 (59) 285 Contract loss 72 – – 1 (1) 11 (31) 52 Restructuring 14 – – – (5) 1 (4) 6 Customer financing 78 – (9) – – 14 (2) 81 Insurance 55 – – – – 7 (11) 51 Other 27 – – – (7) 10 (3) 27
544 (5) (9) 1 (34) 115 (110) 502 Current liabilities 276 276 Non-current liabilities 268 226
Provisions for warranties and guarantees primarily relate to products sold and generally cover a period of up to three years.
Provisions for contract loss and restructuring are generally expected to be utilised within two years.
Customer financing provisions cover guarantees provided for asset value and/or financing. These guarantees are considered to be insurance contracts in nature and provision is made in accordance with IFRS 4 Insurance Contracts and IAS 37 Provisions, Contingent Liabilities and Contingent Assets. These guarantees, the risks arising and the process used to assess the extent of the risk are described under the heading ‘Customer financing’ in the Finance Director’s review on page 14. The related contingent liabilities arising from these guarantees and the sensitivity to movements in the value of the underlying security are discussed in note 22. It is estimated that the provision will be utilised as follows:
2011 £m
2010 £m
Potential claims with specific claim dates: In one year or less 12 8 In more than one year but less than five years 62 47 In more than five years 6 6 Potential claims that may arise at any time up to the date of expiry of the guarantee: Up to one year – 9 Up to five years 1 5 Thereafter – 3
81 78
The Group’s captive insurance company retains a portion of the exposures it insures on behalf of the remainder of the Group. Significant delays occur in the notification and settlement of claims and judgement is involved in assessing outstanding liabilities, the ultimate cost and timing of which cannot be known with certainty at the balance sheet date. The insurance provisions are based on information currently available, however it is inherent in the nature of the business that ultimate liabilities may vary. Provisions for outstanding claims are established to cover the outstanding expected liability as well as claims incurred but not yet reported.
Other provisions comprise a number of liabilities with varying expected utilisation rates.

Rolls-Royce plc Annual report 2011
79
Financial statementsNotes to the consolidated financial statements
Fina
ncia
l sta
tem
ents
18 Post-retirement benefits
The Group operates a number of defined benefit and defined contribution schemes.
For the UK defined benefit schemes, the assets are held in separate trustee administered funds and employees are entitled to retirement benefits based on either their final or career average salaries and length of service.
Overseas defined benefit schemes are a mixture of funded and unfunded plans. Additionally in the US, and to a lesser extent in some other countries, the Group’s employment practices include the provision of healthcare and life insurance benefits for retired employees. These schemes are unfunded.
The valuations of the defined benefit schemes are based on the most recent funding valuations, updated by the scheme actuaries to December 31, 2011. The most recent funding valuations of the main UK schemes were:
Scheme Valuation date
Rolls-Royce Pension Fund March 31, 2009 Rolls-Royce Group Pension Scheme April 5, 2010 Vickers Group Pension Scheme March 31, 2010
Amounts recognised in the income statement2011 2010
UKschemes
£m
Overseasschemes
£m Total
£m
UKschemes
£m
Overseasschemes
£m Total
£m
Defined benefit schemes: Current service cost 119 34 153 118 34 152 Past-service (credit)/cost (126) (68) (194) – 1 1 Curtailment – (2) (2) – (6) (6)
(7) (36) (43) 118 29 147 Defined contribution schemes 16 38 54 11 32 43 Operating cost 9 2 11 129 61 190 Financing in respect of defined benefit schemes: Expected return on assets (381) (29) (410) (374) (26) (400)Interest on liabilities 372 50 422 375 56 431
(9) 21 12 1 30 31 Total income statement charge – 23 23 130 91 221
The operating cost is charged as follows:
Defined benefit Defined contribution Total 2011
£m 2010
£m 2011
£m 2010
£m 2011
£m 2010
£m
Cost of sales – included in underlying profit 114 106 38 31 152 137 Cost of sales – excluded from underlying profit (204) – – – (204) –Commercial and administrative costs 36 31 12 9 48 40 Research and development 11 10 4 3 15 13
(43) 147 54 43 11 190
The Group operates a PaySave scheme in the UK. This is a salary sacrifice scheme under which employees elect to stop making employee contributions and the Group makes additional contributions in return for a reduction in gross contractual pay. As a result, there is a decrease in wages and salaries and a corresponding increase in pension costs of £35m (2010 £35m) in the year.
Amounts recognised in the other comprehensive income 2011
£m 2010
£m
Actuarial gain on scheme assets 1,426 460 Experience losses on scheme liabilities (720) (303)Movement in unrecognised surplus (683) (300)Movement in minimum funding liability 100 49
123 (94)

Rolls-Royce plc Annual report 2011
80
Financial statementsNotes to the consolidated financial statements
18 Post-retirement benefits (continued)
Defined benefit schemes Assumptions The principal actuarial assumptions used at the balance sheet date were as follows:
2011 2010UK
schemes%
Overseas schemes
%
UK schemes
%
Overseas schemes
%
Rate of increase in salaries 4.2 4.0 4.7 3.9Rate of increase of pensions in payment 1.7 1.7 3.0 1.7Discount rate 4.7 4.5 5.5 5.4Expected rate of return on scheme assets 3.4 5.6 5.0 7.2Inflation assumption 1 3.1 2.5 3.6 2.5
1 For the UK schemes, this is the assumption for the Retail Price Index. The Consumer Price Index is assumed to be one per cent lower.
The discount rates are determined by reference to the market yields on AA rated corporate bonds. For the main UK schemes, the rate is determined by using the profile of forecast benefit payments to derive a weighted average discount rate from the yield curve. For overseas schemes, the rate is determined as the market yield at the average duration of the forecast benefit payments. The discount rates above are the weighted average of those for each scheme, based on the value of their respective liabilities.
The overall expected rate of return is calculated by weighting the individual returns expected from each asset class (see below) in accordance with the actual asset balance in the schemes’ investment portfolios.
The mortality assumptions adopted for the UK pension schemes are derived from the SAP actuarial tables, with 80 per cent of long cohort and an underpin of one per cent, published by the Institute of Actuaries, projected forward and, where appropriate, adjusted to take account of the relevant scheme’s actual experience. The resulting range of life expectancies in the principal UK schemes are as follows:
Life expectancy from age 65 Current pensioner 22.2 yearsFuture pensioner currently aged 45 24.3 years
Other demographic assumptions have been set on advice from the relevant actuary, having regard to the latest trends in scheme experience and other relevant data. The assumptions are reviewed and updated as necessary as part of the periodic actuarial valuation of the schemes.
Assumptions in respect of overseas schemes are also set in accordance with advice from local actuaries.
The future costs of healthcare benefits are based on an assumed healthcare costs trend rate of 8.4 per cent grading down to five per cent over 6.3 years.

Rolls-Royce plc Annual report 2011
81
Financial statementsNotes to the consolidated financial statements
Fina
ncia
l sta
tem
ents
18 Post-retirement benefits (continued)
Amounts recognised in the balance sheet 2011 2010
UKschemes
£m
Overseasschemes
£m Total
£m
UKschemes
£m
Overseasschemes
£m Total
£m
Present value of funded obligations (7,713) (557) (8,270) (7,039) (484) (7,523)
Fair value of scheme assets 9,519 497 10,016 7,783 434 8,217 1,806 (60) 1,746 744 (50) 694
Present value of unfunded obligations – (495) (495) – (579) (579)Unrecognised past-service credit 1 – (94) (94) – – –Unrecognised surplus 2 (1,318) – (1,318) (628) (7) (635)Minimum funding liability 3 (236) – (236) (336) – (336)Net asset/(liability) recognised in the balance sheet 252 (649) (397) (220) (636) (856)Post-retirement scheme surpluses 495 8 503 164 – 164 Post-retirement scheme deficits (243) (657) (900) (384) (636) (1,020)
1 The unrecognised past-service credit has arisen as a result of revisions to post-retirement healthcare schemes. It will be amortised over the remaining service lives of the participants (12.3 years).2 Where a surplus has arisen on a scheme, in accordance with IAS 19 and IFRIC 14, the surplus is recognised as an asset only if it represents an unconditional economic benefit available to the Group in the
future. Any surplus in excess of this benefit is not recognised in the balance sheet.3 A minimum funding liability arises where the statutory funding requirements require future contributions in respect of past service that will result in a future unrecognisable surplus.
Changes in present value of defined benefit obligations2011 2010
UKschemes
£m
Overseasschemes
£m Total
£m
UKschemes
£m
Overseasschemes
£m Total
£m
At January 1 (7,039) (1,063) (8,102) (6,714) (823) (7,537)Exchange differences – – – – (27) (27)Current service cost (119) (34) (153) (118) (34) (152)Past-service credit/(cost) 126 162 288 – (1) (1)Finance cost (372) (50) (422) (375) (56) (431)Contributions by employees (4) (3) (7) (3) (2) (5)Benefits paid out 312 37 349 313 35 348 Actuarial losses (617) (103) (720) (142) (161) (303)Curtailment – 2 2 – 6 6 At December 31 (7,713) (1,052) (8,765) (7,039) (1,063) (8,102)Funded schemes (7,713) (557) (8,270) (7,039) (484) (7,523)Unfunded schemes – (495) (495) – (579) (579)
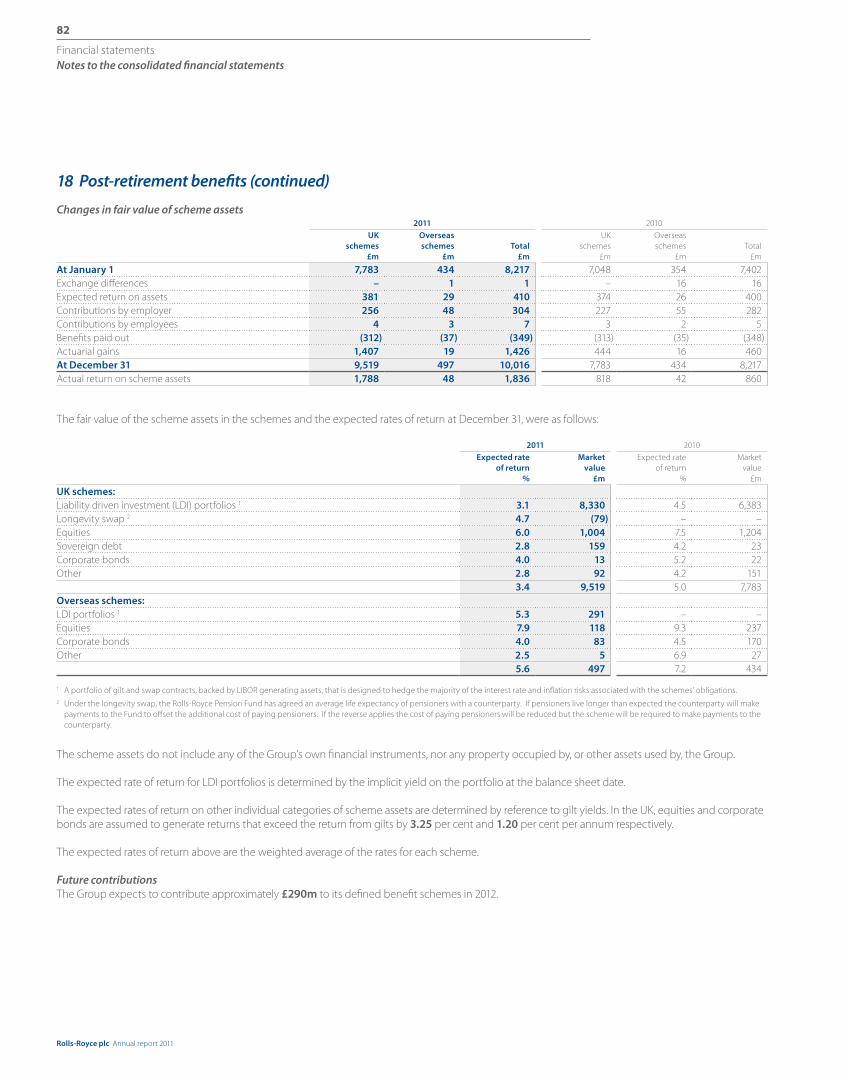
Rolls-Royce plc Annual report 2011
82
Financial statementsNotes to the consolidated financial statements
18 Post-retirement benefits (continued)
Changes in fair value of scheme assets 2011 2010
UKschemes
£m
Overseasschemes
£m Total
£m
UKschemes
£m
Overseasschemes
£m Total
£m
At January 1 7,783 434 8,217 7,048 354 7,402 Exchange differences – 1 1 – 16 16 Expected return on assets 381 29 410 374 26 400 Contributions by employer 256 48 304 227 55 282 Contributions by employees 4 3 7 3 2 5 Benefits paid out (312) (37) (349) (313) (35) (348)Actuarial gains 1,407 19 1,426 444 16 460 At December 31 9,519 497 10,016 7,783 434 8,217 Actual return on scheme assets 1,788 48 1,836 818 42 860
The fair value of the scheme assets in the schemes and the expected rates of return at December 31, were as follows:
2011 2010Expected rate
of return%
Marketvalue
£m
Expected rateof return
%
Marketvalue
£m
UK schemes: Liability driven investment (LDI) portfolios 1 3.1 8,330 4.5 6,383 Longevity swap 2 4.7 (79) – –Equities 6.0 1,004 7.5 1,204 Sovereign debt 2.8 159 4.2 23 Corporate bonds 4.0 13 5.2 22 Other 2.8 92 4.2 151
3.4 9,519 5.0 7,783 Overseas schemes: LDI portfolios 1 5.3 291 – –Equities 7.9 118 9.3 237 Corporate bonds 4.0 83 4.5 170 Other 2.5 5 6.9 27
5.6 497 7.2 434
1 A portfolio of gilt and swap contracts, backed by LIBOR generating assets, that is designed to hedge the majority of the interest rate and inflation risks associated with the schemes’ obligations.2 Under the longevity swap, the Rolls-Royce Pension Fund has agreed an average life expectancy of pensioners with a counterparty. If pensioners live longer than expected the counterparty will make
payments to the Fund to offset the additional cost of paying pensioners. If the reverse applies the cost of paying pensioners will be reduced but the scheme will be required to make payments to the counterparty.
The scheme assets do not include any of the Group’s own financial instruments, nor any property occupied by, or other assets used by, the Group.
The expected rate of return for LDI portfolios is determined by the implicit yield on the portfolio at the balance sheet date.
The expected rates of return on other individual categories of scheme assets are determined by reference to gilt yields. In the UK, equities and corporate bonds are assumed to generate returns that exceed the return from gilts by 3.25 per cent and 1.20 per cent per annum respectively.
The expected rates of return above are the weighted average of the rates for each scheme.
Future contributionsThe Group expects to contribute approximately £290m to its defined benefit schemes in 2012.

Rolls-Royce plc Annual report 2011
83
Financial statementsNotes to the consolidated financial statements
Fina
ncia
l sta
tem
ents
18 Post-retirement benefits (continued)
Sensitivities For the most significant schemes, the revised investment strategies are designed to hedge the risks from interest rates and inflation on an economic basis. A reduction of 0.25 per cent in the discount rate would increase the obligations of the principal UK defined benefit schemes by approximately £298m. An equivalent movement in interest rates would increase the fair value of the assets by approximately £463m. The difference arises largely due to differences in the methods used to value the obligations for accounting and economic purposes. On an economic basis the correlation is approximately 95 per cent. The principal remaining risks relate to the assumptions for mortality and increases in salaries. If the age ratings in respect of the principal UK defined benefit schemes were increased by one year, the scheme liabilities would increase by £163m and there would be a corresponding increase in the value of the longevity swap of £62m. If the rate of increase in salaries were 0.5 per cent higher, scheme liabilities would increase by £127m.
The defined benefit obligation relating to post-retirement medical benefits would increase by £45m if the healthcare trend rate increases by one per cent, and reduce by £56m if it decreases by one per cent. The pension expense relating to post-retirement medical benefits, comprising service cost and interest cost, would increase by £4m if the healthcare trend increases by one per cent, and reduce by £5m if it decreases by one per cent.
History of defined benefit schemes The history of the schemes for the current and prior years is as follows:
2011 £m
2010 £m
2009 £m
2008 £m
2007 £m
Balance sheet Present value of defined benefit obligations (8,765) (8,102) (7,537) (6,546) (6,912)Fair value of scheme assets 10,016 8,217 7,402 7,446 6,903 Unrecognised past-service credit (94) – – – –Unrecognised surpluses (1,318) (635) (335) (1,042) (114)Minimum funding liabilities (236) (336) (385) (425) – Deficit (397) (856) (855) (567) (123)Experience gains/(losses)Actuarial gains/(losses) on scheme assets 1,426 460 (270) 178 161 Experience (losses)/gains on scheme liabilities (720) (303) (878) 766 350 Movement in unrecognised surpluses (683) (300) 707 (928) (112)Recognition of minimum funding liability on January 1, 2008 – – – (491) – Movement in minimum funding liabilities 100 49 40 66 – Total amount recognised in OCI 123 (94) (401) (409) 399 Cumulative amounts recognised in OCI since January 1, 2004 (69) (192) (98) 303 712

Rolls-Royce plc Annual report 2011
84
Financial statementsNotes to the consolidated financial statements
19 Share capitalOrdinary shares
of 20p each Millions
Nominalvalue
£m
Issued and fully paid At January 1, 2010 and December 31, 2011 1,631 326
20 Share-based payments
Effect of share-based payment transactions on the Group’s results and financial position2011
£m2010
£m
Total expense recognised for equity-settled share-based payments transactions 52 47 Total expense recognised for cash-settled share-based payments transactions 7 3 Share-based payments recognised in the consolidated income statement 59 50 Liability for cash-settled share-based payment transactions 9 5
Share-based payment plans in operation during the yearThe Group had the following share-based payment plans, in respect of shares in its parent company, Rolls-Royce Holdings plc, in operation during the year:
PSPThis plan involves the award of shares to participants subject to performance conditions. Vesting of the performance shares is based on the achievement of both non-market based conditions (EPS and cash flow per share) and a market based performance condition (Total Shareholder Return – TSR) over a three-year period.
ShareSaveBased on a three or five-year monthly savings contract, eligible employees are granted share options with an exercise price of up to 20 per cent below the share price when the contract is entered into. Vesting of the options is not subject to the achievement of a performance target. In the UK, the plan is HM Revenue & Customs approved. Overseas, employees in 33 countries participate in cash-settled ShareSave plans through arrangements which provide broadly comparable benefits to the UK plan.
Executive Share Option Plan (ESOP)This plan involved the grant of market value share options to participants. It terminated in 2009 and no further grants may be made. Remaining options under the plan are subject to a non-market based performance condition (growth in EPS) and have a maximum contractual life of ten years.
APRA plan deferred sharesA proportion of the APRA annual incentive scheme is delivered in the form of a deferred share award. The release of deferred share awards is not dependent on the achievement of any further performance conditions other than that participants remain employed by the Group for two years from the date of the award in order to retain the full number of shares. During the two-year deferral period, participants are entitled to receive dividends, or equivalent, on the deferred shares.
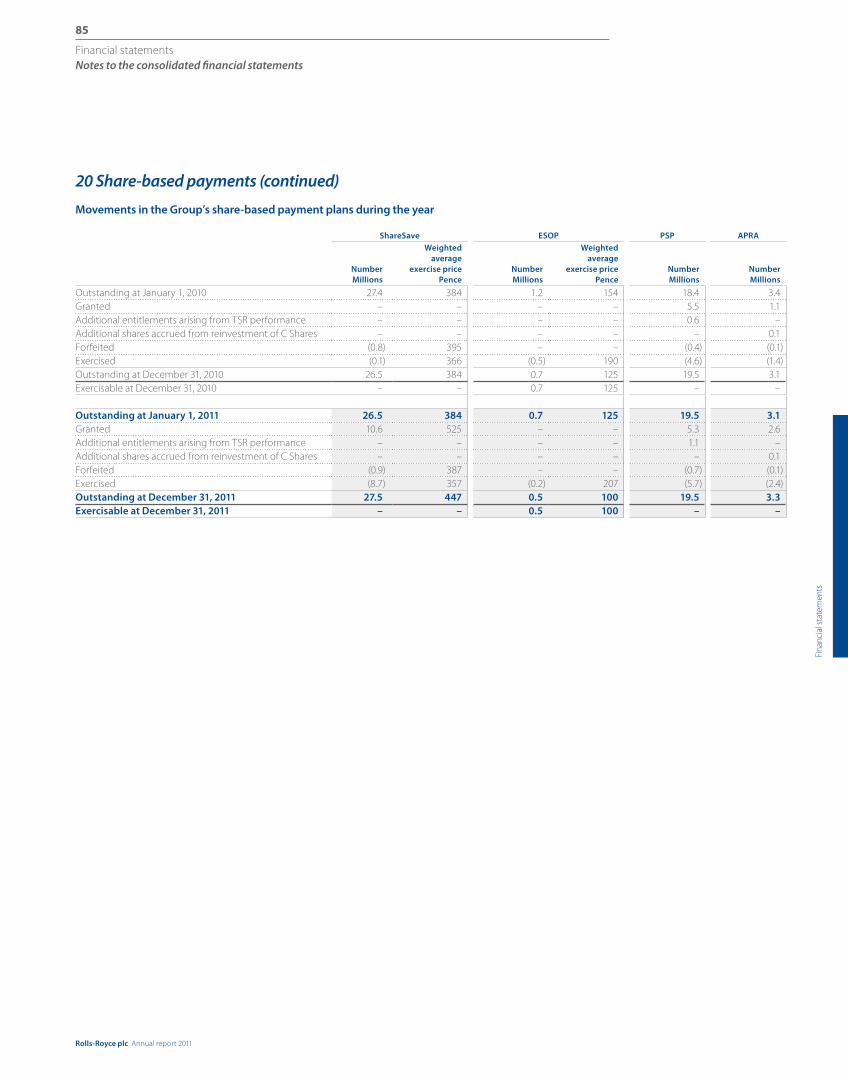
Rolls-Royce plc Annual report 2011
85
Financial statementsNotes to the consolidated financial statements
Fina
ncia
l sta
tem
ents
20 Share-based payments (continued)
Movements in the Group’s share-based payment plans during the year
ShareSave ESOP PSP APRA
NumberMillions
Weighted average
exercise pricePence
NumberMillions
Weighted average
exercise pricePence
NumberMillions
NumberMillions
Outstanding at January 1, 2010 27.4 384 1.2 154 18.4 3.4 Granted – – – – 5.5 1.1 Additional entitlements arising from TSR performance – – – – 0.6 – Additional shares accrued from reinvestment of C Shares – – – – – 0.1 Forfeited (0.8) 395 – – (0.4) (0.1)Exercised (0.1) 366 (0.5) 190 (4.6) (1.4)Outstanding at December 31, 2010 26.5 384 0.7 125 19.5 3.1 Exercisable at December 31, 2010 – – 0.7 125 – –
Outstanding at January 1, 2011 26.5 384 0.7 125 19.5 3.1 Granted 10.6 525 – – 5.3 2.6 Additional entitlements arising from TSR performance – – – – 1.1 – Additional shares accrued from reinvestment of C Shares – – – – – 0.1 Forfeited (0.9) 387 – – (0.7) (0.1)Exercised (8.7) 357 (0.2) 207 (5.7) (2.4)Outstanding at December 31, 2011 27.5 447 0.5 100 19.5 3.3 Exercisable at December 31, 2011 – – 0.5 100 – –

Rolls-Royce plc Annual report 2011
86
Financial statementsNotes to the consolidated financial statements
20 Share-based payments (continued)
As share options are exercised throughout the year, the weighted average share price during the year of 642p (2010 579p) is representative of the weighted average share price at the date of exercise. The closing price at December 31, 2011 was 746.5p (2010 623p).
The average remaining contractual life of exercisable options is one year (2010 1.7 years).
Share options outstandingShareSave ESOP Total
Exercise prices (pence)NumberMillions
Weighted average
remainingcontractual life
YearsNumberMillions
Weighted average
remainingcontractual life
YearsNumberMillions
Weighted average
remainingcontractual life
Years
At December 31, 20110 – 99 – – 0.4 1.2 0.4 1.2 100 – 199 – – 0.1 0.2 0.1 0.2 300 – 399 10.8 2.3 – – 10.8 2.3 400 – 499 6.0 1.1 – – 6.0 1.1 500 – 599 10.7 4.2 – – 10.7 4.2
27.5 2.7 0.5 1.0 28.0 2.7 At December 31, 2010 0 – 99 – – 0.4 2.2 0.4 2.2 100 – 199 – – 0.1 1.2 0.1 1.2 200 – 299 4.5 0.1 0.2 0.3 4.7 0.1 300 – 399 11.6 3.2 – – 11.6 3.2 400 – 499 10.4 1.3 – – 10.4 1.3
26.5 2.0 0.7 1.7 27.2 1.9
The range of exercise prices of options outstanding at December 31, 2011 was: for ShareSave between 387p and 525p (2010 298p and 416p); and for ESOP it was between 77p and 188p (2010 77p and 218p).
Under the terms of the Rolls-Royce 1999 Executive Share Option Plan, options granted to 20 directors and senior executives were outstanding at December 31, 2011.
Fair values of share-based payment plans The weighted average fair value per share of equity-settled share-based payment plans granted during the year, estimated at the date of grant, are as follows:
2011 2010
PSP – 25% TSR uplift 662p 586p PSP – 50% TSR uplift 737p 654p ShareSave – 3 year grant 210p n/a ShareSave – 5 year grant 238p n/a APRA 612p 537p

Rolls-Royce plc Annual report 2011
87
Financial statementsNotes to the consolidated financial statements
Fina
ncia
l sta
tem
ents
20 Share-based payments (continued)
In estimating these fair values, the following assumptions were used:
PSP ShareSave
2011 2010 2011
Weighted average share price 612p 545p 691p Exercise price n/a n/a 525p Expected dividends 15.4p 14.6p 16.0p Expected volatility 32% 33% 30%Correlation 36% 35% n/a Expected life – PSP 3 years 3 years n/a Expected life – 3 year ShareSave n/a n/a 3.3 – 3.8 yearsExpected life – 5 year ShareSave n/a n/a 5.3 – 5.8 yearsRisk free interest rate 1.9% 1.9% 1.9%
Expected volatility is based on the historical volatility of the ultimate parent company’s share price over the seven years prior to the grant or award date. Expected dividends are based on the ultimate parent company’s payments to shareholders in respect of the previous year.
PSP The fair value of shares awarded under the PSP is calculated using a pricing model that takes account of the non-entitlement to dividends (or equivalent) during the vesting period and the market-based performance condition based on expectations about volatility and the correlation of share price returns in the group of FTSE 100 companies and which incorporates into the valuation the interdependency between share price performance and TSR vesting. This adjustment increases the fair value of the award relative to the share price at the date of grant.
ShareSaveThe fair value of the options granted under the ShareSave plan is calculated using a binomial pricing model that assumes that participants will exercise their options at the beginning of the six-month window if the share price is greater than the exercise price. Otherwise it assumes that options are held until the expiration of their contractual term. This results in an expected life that falls somewhere between the start and end of the exercise window.
APRAThe fair value of shares awarded under APRA is calculated as the share price on the date of the award, excluding expected dividends.
21 Operating leases
Leases as lessee2011
£m2010
£m
Rentals paid – hire of plant and machinery 104 82 – hire of other assets 29 20Non-cancellable operating lease rentals are payable as follows:Within one year 36 92 Between one and five years 401 265 After five years 479 215
997 572
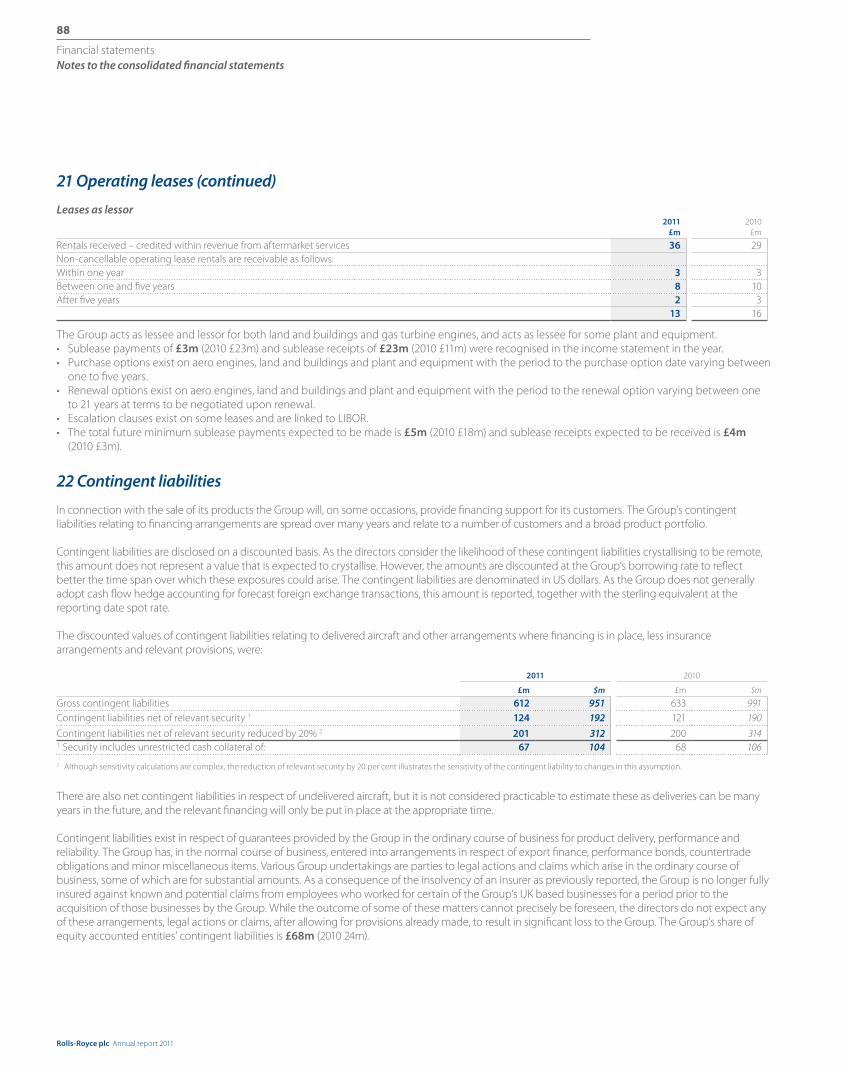
Rolls-Royce plc Annual report 2011
88
Financial statementsNotes to the consolidated financial statements
21 Operating leases (continued)
Leases as lessor2011
£m2010
£m
Rentals received – credited within revenue from aftermarket services 36 29 Non-cancellable operating lease rentals are receivable as follows:Within one year 3 3 Between one and five years 8 10 After five years 2 3
13 16
The Group acts as lessee and lessor for both land and buildings and gas turbine engines, and acts as lessee for some plant and equipment.• Sublease payments of £3m (2010 £23m) and sublease receipts of £23m (2010 £11m) were recognised in the income statement in the year.• Purchase options exist on aero engines, land and buildings and plant and equipment with the period to the purchase option date varying between
one to five years.• Renewal options exist on aero engines, land and buildings and plant and equipment with the period to the renewal option varying between one
to 21 years at terms to be negotiated upon renewal.• Escalation clauses exist on some leases and are linked to LIBOR.• The total future minimum sublease payments expected to be made is £5m (2010 £18m) and sublease receipts expected to be received is £4m
(2010 £3m).
22 Contingent liabilities
In connection with the sale of its products the Group will, on some occasions, provide financing support for its customers. The Group’s contingent liabilities relating to financing arrangements are spread over many years and relate to a number of customers and a broad product portfolio.
Contingent liabilities are disclosed on a discounted basis. As the directors consider the likelihood of these contingent liabilities crystallising to be remote, this amount does not represent a value that is expected to crystallise. However, the amounts are discounted at the Group’s borrowing rate to reflect better the time span over which these exposures could arise. The contingent liabilities are denominated in US dollars. As the Group does not generally adopt cash flow hedge accounting for forecast foreign exchange transactions, this amount is reported, together with the sterling equivalent at the reporting date spot rate.
The discounted values of contingent liabilities relating to delivered aircraft and other arrangements where financing is in place, less insurance arrangements and relevant provisions, were:
2011 2010
£m $m £m $m
Gross contingent liabilities 612 951 633 991Contingent liabilities net of relevant security 1 124 192 121 190
Contingent liabilities net of relevant security reduced by 20% 2 201 312 200 3141 Security includes unrestricted cash collateral of: 67 104 68 106
2 Although sensitivity calculations are complex, the reduction of relevant security by 20 per cent illustrates the sensitivity of the contingent liability to changes in this assumption.
There are also net contingent liabilities in respect of undelivered aircraft, but it is not considered practicable to estimate these as deliveries can be many years in the future, and the relevant financing will only be put in place at the appropriate time.
Contingent liabilities exist in respect of guarantees provided by the Group in the ordinary course of business for product delivery, performance and reliability. The Group has, in the normal course of business, entered into arrangements in respect of export finance, performance bonds, countertrade obligations and minor miscellaneous items. Various Group undertakings are parties to legal actions and claims which arise in the ordinary course of business, some of which are for substantial amounts. As a consequence of the insolvency of an insurer as previously reported, the Group is no longer fully insured against known and potential claims from employees who worked for certain of the Group’s UK based businesses for a period prior to the acquisition of those businesses by the Group. While the outcome of some of these matters cannot precisely be foreseen, the directors do not expect any of these arrangements, legal actions or claims, after allowing for provisions already made, to result in significant loss to the Group. The Group’s share of equity accounted entities’ contingent liabilities is £68m (2010 24m).

Rolls-Royce plc Annual report 2011
89
Financial statementsNotes to the consolidated financial statements
Fina
ncia
l sta
tem
ents
23 Related party transactions2011
£m2010
£m
Sales of goods and services to joint ventures and associates 2,864 2,681 Purchases of goods and services from joint ventures and associates (2,380) (2,163)Operating lease payments to joint ventures and associates (77) (58)Guarantees of joint ventures’ and associates’ borrowings 124 43 Dividends received from joint ventures and associates 75 68 RRSP receipts from joint ventures and associates 13 12 Other income received from joint ventures and associates 56 79
The aggregated balances with Rolls-Royce Holdings plc, Rolls-Royce Group plc and joint ventures are shown in notes 11 and 15. Transactions with Group pension schemes are shown in note 18.
In the course of normal operations, related party transactions entered into by the Group have been contracted on an arms-length basis. Rolls-Royce Holdings plc is a non-trading holding company for Rolls-Royce plc.
Key management personnel are deemed to be the directors and the members of the GLT, as set out in the Annual report of Rolls-Royce Holdings plc. Remuneration for key management personnel is shown below:
2011 £m
2010 £m
Salaries and short-term benefits 18 13 Post-retirement schemes 1 2 Share-based payments 14 8
33 23
24 Acquisitions
On September 1, 2011, the Group acquired 100 per cent of the issued share capital of R. Brooks Associates Inc., a leading specialist civil nuclear reactor services business in the United States. Of the US$30m acquisition cost (net of cash acquired), US$12m has been allocated to identifiable intangible assets and US$5m to other assets and liabilities. The balance of US$13m is recognised as goodwill.

Rolls-Royce plc Annual report 2011
90
Financial statements
Company balance sheet At December 31, 2011
Notes 2011
£m 2010
£m
Fixed assets Intangible assets 3 667 607 Tangible assets 4 1,089 1,038 Investments – subsidiary undertakings 5 1,769 1,753
– joint ventures 5 40 53 3,565 3,451
Current assets Stocks 6 1,261 1,227 Debtors – amounts falling due within one year 7 3,235 1,748
– amounts falling due after one year 7 856 878 Other financial assets – amounts falling due within one year 8 131 259
– amounts falling due after one year 8 333 376 Short-term deposits – 1,432 Cash at bank and in hand 647 644 Assets held for resale – 9
6,463 6,573 Creditors – amounts falling due within one year Borrowings 9 (404) (770)Other financial liabilities 8 (147) (145)Other creditors 10 (5,733) (5,164)
(6,284) (6,079)Net current assets 179 494
Total assets less current liabilities 3,744 3,945
Creditors – amounts falling due after one year Borrowings 9 (1,179) (1,128)Other financial liabilities 8 (950) (986)Other creditors 10 (710) (713)
(2,839) (2,827)Provisions for liabilities and charges 11 (124) (123)Net assets excluding post-retirement schemes 781 995Post retirement schemes – surpluses 13 838 458
– deficits 13 (5) (35)Net assets 1,614 1,418
Capital and reserves Called-up share capital 14 326 326 Share premium account 15 631 631 Revaluation reserve 15 35 41 Other reserves 15 167 167 Profit and loss account 15 455 253 Total shareholders' funds 1,614 1,418
The financial statements on pages 90 to 110 were approved by the Board on February 8, 2012 and signed on its behalf by:
Sir Simon Robertson Chairman Mark Morris Finance Director

Rolls-Royce plc Annual report 2011
91
Financial statements
Fina
ncia
l sta
tem
ents
Statement of total recognised gains and losses For the year ended December 31, 2011
2011 £m
2010 £m
Profit attributable to the shareholders of Rolls-Royce plc (44) 31 Net movement on post-retirement schemes 258 213 Related tax movements (43) (51)Total recognised gains relating to the year 171 193
Reconciliation of movements in shareholders’ fundsFor the year ended December 31, 2011
2011 £m
2010 £m
At January 1 1,418 1,766 Total recognised gains for the year 171 193 Dividends paid – (550)Share-based payments – direct to equity 25 9 At December 31 1,614 1,418

Rolls-Royce plc Annual report 2011
92
Financial statementsNotes to the Company financial statements
1 Accounting policies
Basis of accountingThe financial statements have been prepared in accordance with applicable accounting standards on the historical cost basis, modified to include the revaluation of land and buildings, and on a going concern basis as described on page 40.
As permitted by the Companies Act 2006, a separate profit and loss account for the Company has not been included in these financial statements.
As permitted by FRS 1 Cash Flow Statements, no cash flow statement has been prepared, as a consolidated cash flow statement has been prepared by the ultimate parent company.
Some small adjustments have been made to comparative figures to put them on a consistent basis with the current year.
Revenue recognitionRevenues comprise sales to external customers after discounts, and excluding value added tax.
Sales of products are recognised when the significant risks and rewards of ownership of the goods are transferred to the customer, the sales price agreed and the receipt of payment can be assured.
Sales of services and long-term contracts are recognised when the outcome of the transaction can be reliably estimated. Revenue is recognised by reference to the stage of completion based on services performed to date as a percentage of the total contractual obligation. The assessment of the stage of completion is dependent on the nature of the contract, but will generally be based on: costs incurred to the extent these relate to services performed up to the reporting date; achievement of contractual milestones where appropriate; or flying hours or equivalent for long-term aftermarket arrangements.
Linked sales of product and services are treated as a single long-term contract where these components have been negotiated as a single commercial package and are so closely interrelated that they do not operate independently of each other and are considered to form a single project with an overall profit margin. Revenue is recognised on the same basis as for other sales of products and services as described above.
Full provision is made for any estimated losses to completion of contracts having regard to the overall substance of the arrangements.
Progress payments received on long-term contracts, when greater than recorded turnover, are deducted from the value of work in progress except to the extent that payments on account exceed the value of work in progress on any contract where the excess is included in creditors. The amount by which recorded turnover of long-term contracts is in excess of payments on account is classified as ‘amounts recoverable on contracts’ and is separately disclosed within debtors.
Government investmentWhere a government or similar body has previously invested in a development programme, the Company treats payments to that body as royalty payments, which are matched to related sales.
Risk and revenue sharing partnerships (RRSPs)From time-to-time, the Company enters into arrangements with partners who, in return for a share in future programme revenues or profits, make cash payments that are not refundable (except under certain remote circumstances). Cash sums received, which reimburse the Company for past expenditure, are credited to other operating income. The arrangements also require partners to undertake development work and/or supply components for use in the programme at their own expense. No accounting entries are recorded where partners undertake such development work or where programme components are supplied by partners because no obligation arises unless and until programme sales are made; instead, payments to partners for their share in the programme are charged to cost of sales as programme revenues arise.
The Company has arrangements with partners who do not undertake development work or supply parts. Such arrangements are considered to be financial instruments as defined by FRS 25 Financial Instruments: Presentation and are accounted for using the amortised cost method.
Research and developmentThe charge to the profit and loss account consists of research and development expenditure incurred in the year, excluding known recoverable costs on contracts, contributions to shared engineering programmes and application engineering. Application engineering expenditure, incurred in the adaptation of existing technology to new products, is capitalised and amortised over the programme life, up to a maximum of 15 years, where both the technical and commercial risks are considered to be sufficiently low.
InterestInterest receivable/payable is credited/charged to the profit and loss account using the effective interest method.
Rolls-Royce plc Annual report 2011
93
Financial statementsNotes to the Company financial statements
Fina
ncia
l sta
tem
ents
TaxationProvision for taxation is made at the current rate and for deferred taxation at the projected rate on all timing differences that have originated, but not reversed at the balance sheet date. Deferred tax is calculated using the enacted or substantively enacted rates that are expected to apply when the asset or liability is settled.
Deferred tax assets are recognised only to the extent that it is probable that future taxable profits will be available against which the assets can be utilised.
Foreign currency translationTransactions in overseas currencies are translated into local currency at the exchange rate ruling on the date of the transaction. Monetary assets and liabilities denominated in foreign currencies are translated into sterling at the rate ruling at the year-end. Exchange differences arising on foreign exchange transactions and the retranslation of assets and liabilities into sterling at the rate ruling at the year-end are taken into account in determining profit on ordinary activities before taxation.
Financial instrumentsFRS 26 Financial instruments: Recognition and Measurement requires the classification of financial instruments into separate categories for which the accounting requirement is different. Rolls-Royce has classified its financial instruments as follows:
• Short-term investments are classified as available for sale.• Short-term deposits (principally comprising funds held with banks and other financial institutions), trade receivables and short-term investments
not designated as available for sale are classified as loans and receivables.• Borrowings, trade creditors and financial RRSPs are classified as other liabilities.• Derivatives, comprising foreign exchange contracts, interest rate swaps and commodity swaps are classified as held for trading.
Financial instruments are recognised at the contract date and initially measured at fair value. Their subsequent measurement depends on their classification:
• Loans and receivables and other liabilities are held at amortised cost and not revalued (except for changes in exchange rates, which are included in the profit and loss account) unless they are included in a fair value hedge accounting relationship. Where such a relationship exists, the instruments are revalued in respect of the risk being hedged. If instruments held at amortised cost are hedged, generally by interest rate swaps, and the hedges are effective, the carrying values are adjusted for changes in fair value, which are included in the profit and loss account.
• Available for sale assets are held at fair value. Changes in fair value arising from changes in exchange rates are included in the profit and loss account. All other changes in fair value are taken to reserves. On disposal, the accumulated changes in value recorded in reserves are included in the gain or loss recorded in the profit and loss account.
• Held for trading instruments are held at fair value. Changes in fair value are included in the profit and loss account unless the instrument is included in a cash flow hedge. If the instruments are included in a cash flow hedging relationship, which is effective, changes in value are taken to reserves. When the hedged forecast transaction occurs, amounts previously recorded in reserves are recognised in the profit and loss account.
Financial instruments are derecognised on expiry or when all contractual rights and obligations are transferred.
Hedge accountingThe Company does not apply hedge accounting in respect of forward foreign exchange contracts held to manage the cash flow exposures of forecast future transactions denominated in foreign currencies.
The Company does not apply hedge accounting in respect of commodity swaps held to manage the cash flow exposures of forecast future transactions in those commodities.
The Company applies hedge accounting in respect of transactions entered into to manage the fair value and cash flow exposures of its borrowings. Forward foreign exchange contracts are held to manage the fair value exposures of borrowings denominated in foreign currencies and are designated as fair value hedges. Interest rate swaps are held to manage the interest rate exposures and are designated as fair value or cash flow hedges of fixed and floating rate borrowings respectively.
Changes in the fair values of derivatives designated as fair value hedges and changes in fair value of the related hedged item are recognised directly in the profit and loss account.
Changes in the fair values of derivatives that are designated as cash flow hedges and are effective are recognised directly in reserves. Any ineffectiveness in the hedging relationships is included in the profit and loss account. The amounts deferred in reserves are recognised in the profit and loss account to match the recognition of the hedged item.
Hedge accounting is discontinued when the hedging instrument expires or is sold, terminated, or exercised, or no longer qualifies for hedge accounting. At that time, for cash flow hedges and if the forecast transaction remains probable, any cumulative gain or loss on the hedging instrument recognised in reserves, is retained in reserves until the forecast transaction occurs. If a hedged transaction is no longer expected to occur, the net cumulative gain or loss previously recognised in reserves is transferred to the profit and loss account.
The portion of a gain or loss on an instrument used to hedge a net investment in a foreign operation that is determined to be an effective hedge is recognised directly in reserves. The ineffective portion is recognised immediately in the profit and loss account.

Rolls-Royce plc Annual report 2011
94
Financial statementsNotes to the Company financial statements
Certification costs and participation feesCosts incurred in respect of meeting regulatory certification requirements for new civil engine/aircraft combinations and payments made to airframe manufacturers for this, and participation fees, are carried forward in intangible assets to the extent that they can be recovered out of future sales and are charged to the profit and loss account over the programme life, up to a maximum of 15 years from the entry-into-service of the product.
SoftwareThe cost of acquiring software that is not specific to an item of tangible fixed assets is classified as an intangible asset.
Tangible fixed assets and depreciationTangible fixed assets are stated at cost or valuation less accumulated depreciation and any provision for impairments in value.
Depreciation is provided on a straight-line basis to write-off the cost or valuation, less the estimated residual value, over the estimated useful life. Estimated useful lives are as follows:
i) Land and buildings, as advised by the Group’s professional valuers: a) Freehold buildings – five to 45 years (average 24 years). b) Leasehold land and buildings – lower of valuers’ estimates or period of lease. c) No depreciation is provided in respect of freehold land.ii) Plant and equipment – five to 25 years (average 13 years).iii) Aircraft and engines – five to 20 years (average 16 years).iv) No depreciation is provided on assets in the course of construction.
Impairment of fixed assetsImpairment of fixed assets is considered in accordance with FRS 11 Impairment of Fixed Assets and Goodwill. Where the asset does not generate cash flows that are independent of other assets, impairment is considered for the income-generating unit to which the asset belongs.
Intangible assets not yet available for use are tested for impairment annually. Other fixed assets are assessed for any indications of impairment annually. If any indication of impairment is identified, an impairment test is performed to estimate the recoverable amount.
Recoverable amount is the higher of value in use or fair value less costs to sell – if this is readily available. The value in use is the present value of future cash flows using a pre-tax discount rate that reflects the time value of money and the risk specific to the asset.
If the recoverable amount of an asset (or income-generating unit) is estimated to be below the carrying value, the carrying value is reduced to the recoverable amount and the impairment loss recognised as an expense.
Operating leasesPayments made and rentals received under operating lease arrangements are charged/credited to the income statement on a straight-line basis.
StockStock and work in progress are valued at the lower of cost and net realisable value on a first-in, first-out basis. Cost comprises direct materials and, where applicable, direct labour costs and those overheads, including depreciation of property, plant and equipment, that have been incurred in bringing the inventories to their present location and condition. Net realisable value represents the estimated selling prices less all estimated costs of completion and costs to be incurred in marketing, selling and distribution.
ProvisionsProvisions are recognised when the Company has a present obligation as a result of a past event, and it is probable that the Company will be required to settle that obligation. Provisions are measured at the directors’ best estimate of the expenditure required to settle the obligation at the balance sheet date, and are discounted to present value where the effect is material.
Post-retirement benefitsPensions and similar benefits are accounted for under FRS 17 Post-retirement Benefits. For defined benefit plans, obligations are measured at discounted present value whilst plan assets are recorded at fair value. The service and financing costs of such plans are recognised separately in the profit and loss account; service costs are spread systematically over the lives of employees and financing costs are recognised in the periods in which they arise. Actuarial gains and losses are recognised immediately in the statement of total recognised gains and losses.
Payments to defined contribution schemes are charged as an expense as they fall due.
Share-based paymentsThe Company participates in Rolls-Royce Holdings plc employee share-based payment arrangements. These are equity-settled arrangements and are measured at fair value (excluding the effect of non-market based vesting conditions) at the date of grant. The fair value is expensed on a straight-line basis

Rolls-Royce plc Annual report 2011
95
Financial statementsNotes to the Company financial statements
Fina
ncia
l sta
tem
ents
over the vesting period, based on the Company’s estimate of shares or options that will eventually vest. The costs of these share-based payments are treated as a capital contribution from the parent company. Any payments made by the Company to its parent company, in respect of these arrangements, are treated as a return of this capital contribution.
The fair values of the share-based payment arrangements are measured as follows:
i) ShareSave – using the binomial pricing method;ii) Performance Share Plan – using a pricing model adjusted to reflect non-entitlement to dividends (or equivalent) and the Total Shareholder Return
market based condition;iii) Annual performance Related Award plan and free shares under the Share Incentive plan – share price on the date of the award.
See note 17 for further description of the share-based payment plans.
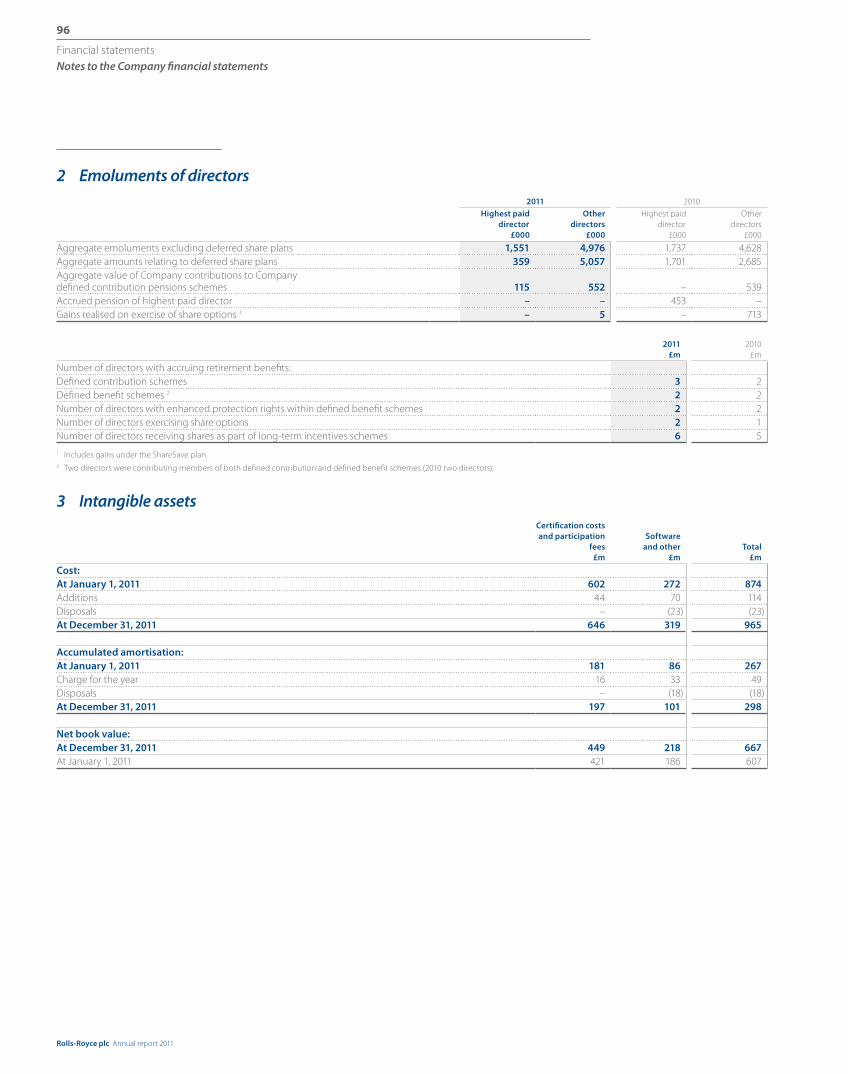
Rolls-Royce plc Annual report 2011
96
Financial statementsNotes to the Company financial statements
2 Emoluments of directors 2011 2010
Highest paid director
£000
Otherdirectors
£000
Highest paid director
£000
Otherdirectors
£000
Aggregate emoluments excluding deferred share plans 1,551 4,976 1,737 4,628 Aggregate amounts relating to deferred share plans 359 5,057 1,701 2,685 Aggregate value of Company contributions to Company defined contribution pensions schemes 115 552 – 539 Accrued pension of highest paid director – – 453 – Gains realised on exercise of share options 1 – 5 – 713
2011 £m
2010 £m
Number of directors with accruing retirement benefits: Defined contribution schemes 3 2Defined benefit schemes 2 2 2Number of directors with enhanced protection rights within defined benefit schemes 2 2Number of directors exercising share options 2 1Number of directors receiving shares as part of long-term incentives schemes 6 5
1 Includes gains under the ShareSave plan.2 Two directors were contributing members of both defined contribution and defined benefit schemes (2010 two directors).
3 Intangible assets Certification costs and participation
fees £m
Software and other
£m Total
£m
Cost:At January 1, 2011 602 272 874 Additions 44 70 114 Disposals – (23) (23)At December 31, 2011 646 319 965
Accumulated amortisation:At January 1, 2011 181 86 267 Charge for the year 16 33 49 Disposals – (18) (18)At December 31, 2011 197 101 298
Net book value:At December 31, 2011 449 218 667 At January 1, 2011 421 186 607

Rolls-Royce plc Annual report 2011
97
Financial statementsNotes to the Company financial statements
Fina
ncia
l sta
tem
ents
4 Tangible assetsLand andbuildings
£m
Plant and equipment
£m
Aircraft and engines
£m
In course of construction
£mTotal
£m
Cost or valuation:At January 1, 2011 414 1,389 36 137 1,976 Additions 9 39 – 130 178 Reclassifications 10 76 11 (87) 10 Transferred from 'Assets held for resale' 15 – – – 15 Disposals/write-offs – (55) (10) (1) (66)At December 31, 2011 448 1,449 37 179 2,113
Accumulated depreciation:At January 1, 2011 132 798 8 – 938 Impairment – – – 1 1 Charge for the year 15 110 3 – 128 Transferred from 'Assets held for resale' 6 – – – 6 Disposals/write-offs – (49) – – (49)At December 31, 2011 153 859 11 1 1,024
Net book value:At December 31, 2011 295 590 26 178 1,089 At January 1, 2011 282 591 28 137 1,038
2011 £m
2010 £m
Tangible fixed assets include:Net book value of finance leased assets 12 12 Non-depreciable land 60 47
Land and buildings at cost or valuation comprise:Cost 286 263 Valuation at December 31, 1996 162 151
448 414 On an historical cost basis the net book value of land and buildings would have been as follows:Cost 413 394 Depreciation (153) (153)
260 241
Capital expenditure commitments 121 76

Rolls-Royce plc Annual report 2011
98
Financial statementsNotes to the Company financial statements
5 InvestmentsSubsidiary
undertakings1
Jointventures2
Sharesat cost3
£m
Sharesat cost
£mLoans
£mTotal
£m
At January 1, 2011 1,753 48 5 53 Additions 16 3 – 3Disposals/write-offs – (16) – (16) At December 31, 2011 1,769 35 5 40
1 The principal subsidiary undertakings are listed on page 111.2 The principal joint ventures are listed on pages 112 and 113.3 The Company has guaranteed the uncalled share capital of Nightingale Insurance Limited, one of its subsidiaries. At December 31, 2011, this guarantee was £25m (2010 £25m).
6 Stocks 2011
£m 2010
£m
Raw materials 76 132 Work in progress 391 415 Long-term contracts work in progress (1) 5 Finished goods 773 651 Payments on account 22 24
1,261 1,227
7 Debtors Falling due within one year Falling due after one year
2011 £m
2010 £m
2011 £m
2010 £m
Trade debtors 307 371 – – Amounts recoverable on contracts 127 9 406 481 Amounts owed by – subsidiary undertakings 1,823 650 – –
– joint ventures 517 470 19 4 – parent undertaking 196 – – –
Deferred tax assets (note 12) – – 403 373 Other debtors 172 148 – – Prepayments and accrued income 93 100 28 20
3,235 1,748 856 878

Rolls-Royce plc Annual report 2011
99
Financial statementsNotes to the Company financial statements
Fina
ncia
l sta
tem
ents
8 Other financial assets and liabilities
Details of the Company’s policies on the use of financial instruments are given in the accounting policies on pages 92 to 95.
The fair values of other financial instruments held by the Company are as follows:
Foreign exchange contracts
£m
Commoditycontracts
£m
Interest ratecontracts
£m
Derivative financial
instruments £m
FinancialRRSPs
£mTotal
£m
At December 31, 2011Assets – amounts falling due within one year 124 7 – 131 – 131
– amounts falling due after one year 243 7 83 333 – 333 Liabilities – amounts falling due within one year (106) (7) – (113) (34) (147)
– amounts falling due after one year (698) (19) (2) (719) (231) (950)(437) (12) 81 (368) (265) (633)
At December 31, 2010Assets – amounts falling due within one year 107 10 142 259 – 259
– amounts falling due after one year 322 18 36 376 – 376 Liabilities – amounts falling due within one year (86) (5) – (91) (54) (145)
– amounts falling due after one year (745) (2) (3) (750) (236) (986)(402) 21 175 (206) (290) (496)
Derivative financial instrumentsThe Company uses various financial instruments to manage its exposure to movements in foreign exchange rates. The Company uses commodity swaps to manage its exposure to movements in the price of commodities (jet fuel and base metals). To hedge the currency risk associated with a borrowing denominated in US dollars, the Company has currency derivatives designated as part of a fair value hedge. The Company uses interest rate swaps, forward rate agreements and interest rate caps to manage its exposure to movements in interest rates. Where the effectiveness of the hedge relationship in a cash flow hedge is demonstrated, changes in the fair value that are deemed effective are included in the hedging reserve and released to match actual payments on the hedged item.
Movements in the fair values of derivative financial instruments were as follows:
Foreign exchange instruments
£m
Commodity instruments
£m
Interest rate instruments
£mTotal
£m
At January 1, 2010 (170) (11) 199 18 Movements in fair value hedges 1 7 – (21) (14)Movements in other derivative contracts (398) 29 (1) (370)Contracts settled 159 3 (2) 160 At January 1, 2011 (402) 21 175 (206)Movements in fair value hedges 1 2 – 83 85 Movements in cash flow hedges (1) – – (1)Movements in other derivative contracts 16 (28) 1 (11)Contracts settled (52) (5) (178) (235)At December 31, 2011 (437) (12) 81 (368)
1 Loss on related hedged items £85m (2010 £14m net gain)
Where applicable, market values have been used to determine fair values. Where market values are not available, fair values have been calculated by discounting expected future cash flows at prevailing interest rates and translating at prevailing exchange rates.
Financial risk and revenue sharing partnerships (RRSPs) The Company has financial liabilities arising from financial RRSPs. These financial liabilities are valued at each reporting date using the amortised cost method. This involves calculating the present value of the forecast cash flows of the arrangements using the internal rate of return at the inception of the arrangements as the discount rate.

Rolls-Royce plc Annual report 2011
100
Financial statementsNotes to the Company financial statements
8 Other financial assets and liabilities (continued)
The amortised cost values of financial RRSPs were as follows:
2011 £m
2010 £m
At January 1 (290) (312)Cash paid to partners 66 59 Financing charge (18) (20)Exchange adjustments (2) (6)Changes in forecast payments (21) (11)At December 31 (265) (290)
9 Borrowings Falling due within one year Falling due after one year
2011 £m
2010 £m
2011 £m
2010 £m
UnsecuredOverdrafts 404 128 – – Bank loans – – 200 200 7 3⁄8% Notes 2016 £200m – – 200 200 6.38% Notes 2013 US$230m 1 – – 160 162 6.55% Notes 2015 US$83m 1 – – 62 60 4 1⁄2% Notes 2011 €750m 2 – 642 – – 6.75% Notes 2019 £500m – – 557 506
404 770 1,179 1,128 Repayable – otherwise than by installmentsBetween one and two years 160 – Between two and five years 462 422 After five years 557 706
1,179 1,128
1 These notes are the subject of interest rate swap agreements under which the Company has undertaken to pay floating rates of interest, and currency swaps which form a fair value hedge. 2 These notes are the subject of swap agreements under which counterparties have undertaken to pay amounts at fixed rates of interest and exchange in consideration for amounts payable at variable
rates of interest and at fixed exchange rates. 3 Obligations under finance leases are secured by related leased assets.
10 Other creditors Falling due within one year Falling due after one year
2011 £m
2010 £m
2011 £m
2010 £m
Payments received on account 1 401 388 487 464 Trade creditors 529 431 – – Amounts owed to – subsidiary undertakings 2,285 2,014 – –
– joint ventures 207 251 1 3 – parent and its subsidiaries 42 249 – –
Corporate taxation 98 99 – – Other taxation and social security 29 17 – – Other creditors 1,229 909 56 91 Accruals and deferred income 913 806 166 155
5,733 5,164 710 713 1 Includes payments received from joint ventures 250 160 147 259
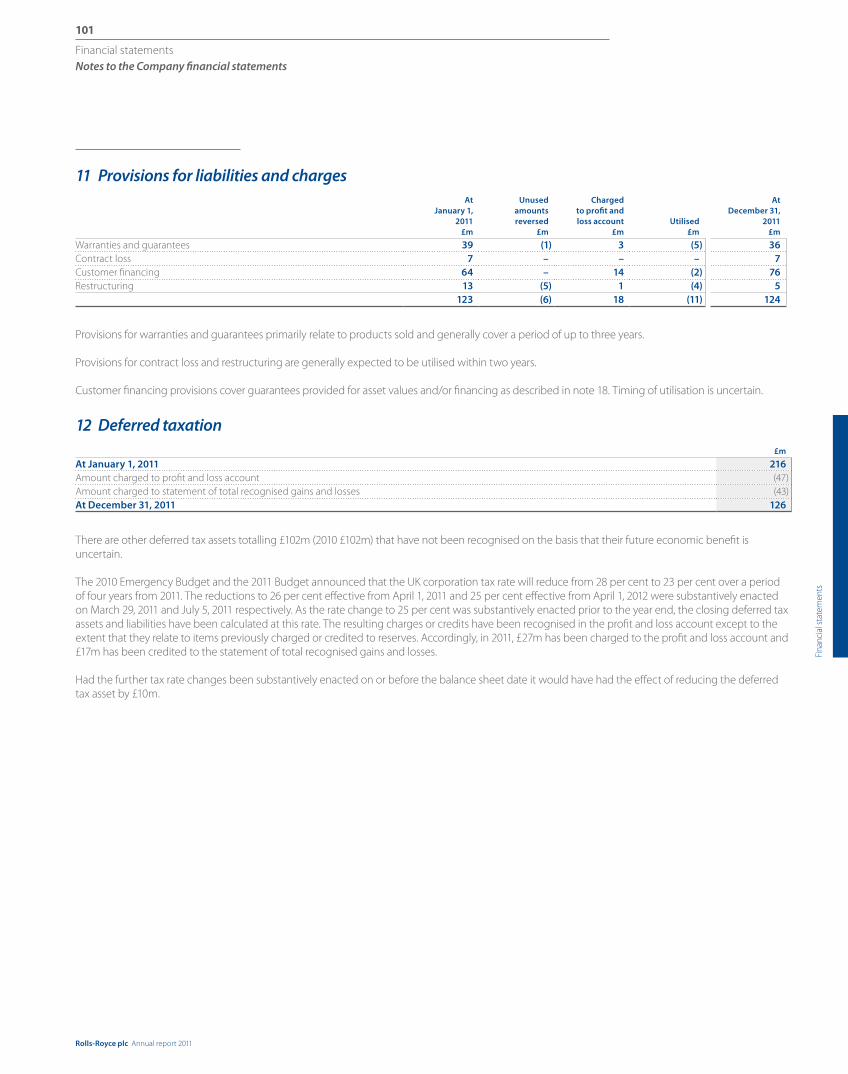
Rolls-Royce plc Annual report 2011
101
Financial statementsNotes to the Company financial statements
Fina
ncia
l sta
tem
ents
11 Provisions for liabilities and chargesAt
January 1,2011
£m
Unusedamountsreversed
£m
Chargedto profit andloss account
£mUtilised
£m
AtDecember 31,
2011 £m
Warranties and guarantees 39 (1) 3 (5) 36 Contract loss 7 – – – 7 Customer financing 64 – 14 (2) 76 Restructuring 13 (5) 1 (4) 5
123 (6) 18 (11) 124
Provisions for warranties and guarantees primarily relate to products sold and generally cover a period of up to three years.
Provisions for contract loss and restructuring are generally expected to be utilised within two years.
Customer financing provisions cover guarantees provided for asset values and/or financing as described in note 18. Timing of utilisation is uncertain.
12 Deferred taxation£m
At January 1, 2011 216 Amount charged to profit and loss account (47)Amount charged to statement of total recognised gains and losses (43)At December 31, 2011 126
There are other deferred tax assets totalling £102m (2010 £102m) that have not been recognised on the basis that their future economic benefit is uncertain.
The 2010 Emergency Budget and the 2011 Budget announced that the UK corporation tax rate will reduce from 28 per cent to 23 per cent over a period of four years from 2011. The reductions to 26 per cent effective from April 1, 2011 and 25 per cent effective from April 1, 2012 were substantively enacted on March 29, 2011 and July 5, 2011 respectively. As the rate change to 25 per cent was substantively enacted prior to the year end, the closing deferred tax assets and liabilities have been calculated at this rate. The resulting charges or credits have been recognised in the profit and loss account except to the extent that they relate to items previously charged or credited to reserves. Accordingly, in 2011, £27m has been charged to the profit and loss account and £17m has been credited to the statement of total recognised gains and losses.
Had the further tax rate changes been substantively enacted on or before the balance sheet date it would have had the effect of reducing the deferred tax asset by £10m.
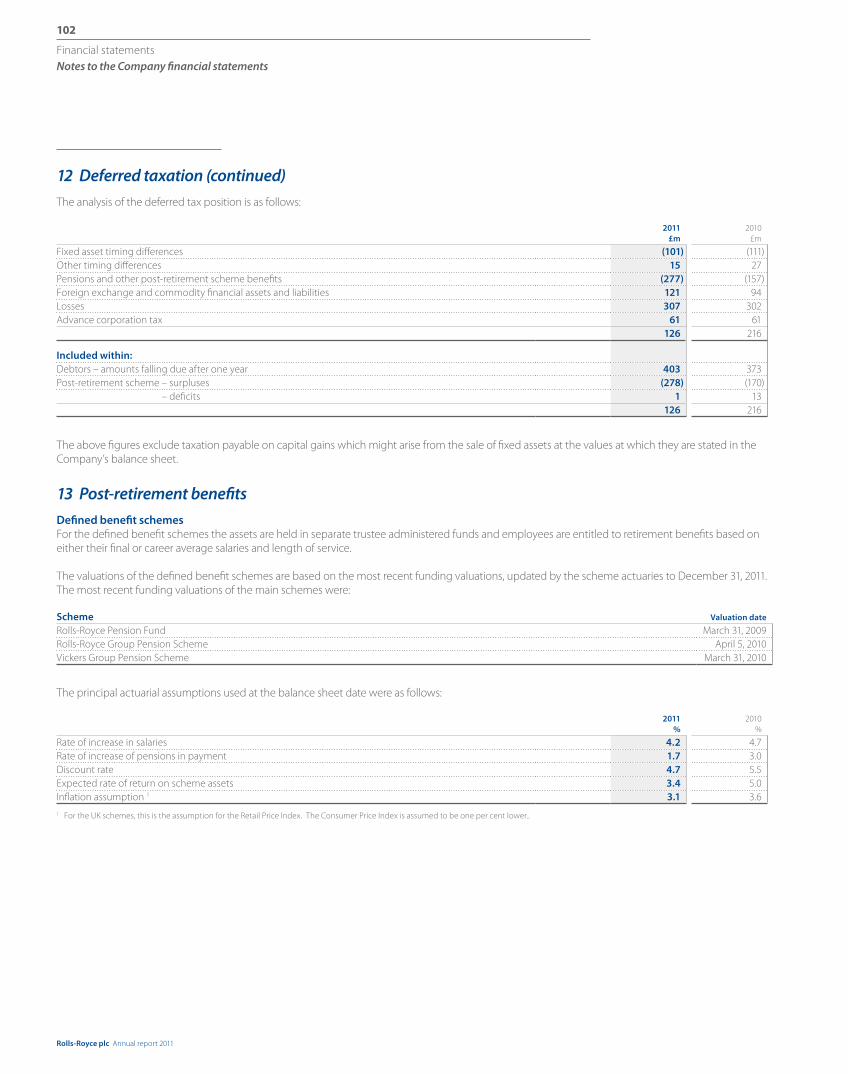
Rolls-Royce plc Annual report 2011
102
Financial statementsNotes to the Company financial statements
12 Deferred taxation (continued)
The analysis of the deferred tax position is as follows:
2011 £m
2010 £m
Fixed asset timing differences (101) (111)Other timing differences 15 27 Pensions and other post-retirement scheme benefits (277) (157)Foreign exchange and commodity financial assets and liabilities 121 94 Losses 307 302 Advance corporation tax 61 61
126 216
Included within:Debtors – amounts falling due after one year 403 373 Post-retirement scheme – surpluses (278) (170)
– deficits 1 13 126 216
The above figures exclude taxation payable on capital gains which might arise from the sale of fixed assets at the values at which they are stated in the Company’s balance sheet.
13 Post-retirement benefits
Defined benefit schemes For the defined benefit schemes the assets are held in separate trustee administered funds and employees are entitled to retirement benefits based on either their final or career average salaries and length of service.
The valuations of the defined benefit schemes are based on the most recent funding valuations, updated by the scheme actuaries to December 31, 2011. The most recent funding valuations of the main schemes were:
Scheme Valuation date
Rolls-Royce Pension Fund March 31, 2009 Rolls-Royce Group Pension Scheme April 5, 2010 Vickers Group Pension Scheme March 31, 2010
The principal actuarial assumptions used at the balance sheet date were as follows:
2011 %
2010 %
Rate of increase in salaries 4.2 4.7Rate of increase of pensions in payment 1.7 3.0Discount rate 4.7 5.5Expected rate of return on scheme assets 3.4 5.0Inflation assumption 1 3.1 3.6
1 For the UK schemes, this is the assumption for the Retail Price Index. The Consumer Price Index is assumed to be one per cent lower..

Rolls-Royce plc Annual report 2011
103
Financial statementsNotes to the Company financial statements
Fina
ncia
l sta
tem
ents
13 Post-retirement benefits (continued)
The discount rates are determined by reference to the market yields on AA rated corporate bonds. For the main schemes, the rate is determined by using the profile of forecast benefit payments to derive a weighted average discount rate from the yield curve. For less significant schemes the rate is determined as the market yield at the average duration of the forecast benefit payments. The discount rates above are the weighted average of those for each scheme, based on the value of their respective liabilities.
The overall expected rate of return is calculated by weighting the individual returns expected from each asset class (see below) in accordance with the actual asset balance in the schemes’ investment portfolios.
The mortality assumptions adopted for the pension schemes are derived from the SAPS actuarial tables, with 80% per cent of long cohort, published by the Institute of Actuaries, projected forward and, where appropriate, adjusted to take account of the relevant scheme’s actual experience. The resulting range of life expectancies in the principal schemes are as follows:
Life expectancy from age 65 Current pensioner 22.2 yearsFuture pensioner currently aged 45 24.3 years
Other demographic assumptions have been set on advice from the relevant actuary, having regard to the latest trends in scheme experience and other relevant data. The assumptions are reviewed and updated as necessary as part of the periodic actuarial valuation of the schemes.
Amounts recognised in the balance sheet 2011
£m 2010
£m
Present value of funded obligations (7,713) (7,039)Fair value of scheme assets 9,519 7,783 Unrecognised surplus 1 (696) (164)Surplus 1,110 580 Related deferred tax liability (277) (157)Net asset recognised in the balance sheet 833 423
Analysed as: Post-retirement scheme surpluses 838 458 Post-retirement scheme deficits (5) (35)
833 423
1 Where a surplus has arisen on a scheme, in accordance with FRS 17 Retirement Benefits, the surplus is recognised as an asset only if it represents a future economic benefit available to the Company. Any surplus in excess of this benefit is not recognised in the balance sheet. Surpluses have arisen largely as a result of differences between the actuarial and FRS 17 valuation assumptions.

Rolls-Royce plc Annual report 2011
104
Financial statementsNotes to the Company financial statements
13 Post-retirement benefits (continued)
Changes in present value of defined benefit obligations 2011
£m 2010
£m
At January 1 (7,039) (6,714)Current service cost (119) (118)Past-service credit 126 – Finance cost (372) (375)Contributions by employees (4) (3)Benefits paid out 312 313 Actuarial losses (617) (142)At December 31 (7,713) (7,039)
Changes in fair value of scheme assets 2011
£m 2010
£m
At January 1 7,783 7,048 Expected return on assets 381 374 Contributions by employer 256 227 Contributions by employees 4 3 Benefits paid out (312) (313)Actuarial gains 1,407 444 At December 31 9,519 7,783 Actual return on plan assets 1,788 818
The fair value of the scheme assets and the expected rates of return at December 31 were as follows:
2011 2010Expected rate
of return%
Marketvalue
£m
Expected rateof return
%
Marketvalue
£m
LDI portfolio 1 3.1 8,330 4.5 6,383 Longevity swap 2 4.7 (79) – – Equities 6.0 1,004 7.5 1,204 Sovereign debt 2.8 159 4.2 23 Corporate bonds 4.0 13 5.2 22 Other 2.8 92 4.2 151
3.4 9,519 5.0 7,783
1 A portfolio of gilt and swap contracts, backed by LIBOR generating assets, that is designed to hedge the majority of the interest rate and inflation risks associated with the schemes’ obligations.2 Under the longevity swap the scheme has agreed an average life expectancy with a counterparty. If pensioners live longer than expected the counterparty will make payments to the scheme to offset
the additional cost of paying pensions. If the reverse applies the cost of paying pensions will be reduced but the scheme will be required to make payments to the counterparty.
The scheme assets do not include any financial instruments of the Rolls-Royce Holdings plc group, nor any property occupied by, or other assets used by, the group.
The expected rate of return for LDI portfolios is determined by the implicit yield on the portfolio at the balance sheet date.
The expected rates of return on individual categories of scheme assets are determined by reference to gilt yields. Equities and corporate bonds are assumed to generate returns that exceed the return from gilts by 3.25 per cent and 1.20 per cent per annum respectively.
The expected rates of return above are the weighted average of the rates for each scheme.

Rolls-Royce plc Annual report 2011
105
Financial statementsNotes to the Company financial statements
Fina
ncia
l sta
tem
ents
13 Post-retirement benefits (continued)
Future contributionsThe Company expects to contribute approximately £240m to its defined benefit schemes in 2012.
SensitivitiesThe investment strategies are designed to hedge the risks from interest rates and inflation on an economic basis. A reduction of 0.25 per cent in the discount rate would increase the obligations of the principal UK defined benefit schemes by approximately £298m. An equivalent movement in interest rates would increase the fair value of the assets by approximately £463m. The difference arises largely due to differences in the methods used to value the obligations for accounting and economic purposes. On an economic basis the correlation is approximately 95 per cent. The principle remaining risks relate to the assumptions for mortality and increases in salaries. If the age ratings in respect of the principal UK defined benefit schemes were increased by one year, the scheme liabilities would increase by £163m and there would be a corresponding increase in the value of the longevity swap of £62m. If the rate of increase in salaries were 0.5 per cent higher, scheme liabilities would increase by £127m.
History of defined benefit schemes The history of the schemes for the current and prior years is as follows:
2011 £m
2010 £m
2009 £m
2008 £m
2007 £m
Balance sheet Present value of defined benefit obligations (7,713) (7,039) (6,714) (5,719) (6,335)Fair value of scheme assets 9,519 7,783 7,048 7,163 6,626
Unrecognised surplus (696) (164) (75) (566) (113)Asset 1,110 580 259 878 178
Experience gains/(losses) Actuarial gains/(losses) on scheme assets 1,407 444 (311) 264 157 Experience (losses)/gains on scheme liabilities (617) (142) (865) 776 309
Movement in unrecognised surplus (532) (89) 491 (453) (113)Total amount recognised in the statement of total recognised gains and losses 258 213 (685) 587 353 Cumulative amount recognised in the statement of total recognised gains and losses1 (22) (280) (493) 192 (395)1 Since January 1, 2002
Defined contribution schemes The Company operates a number of defined contribution schemes. The total expense recognised in the profit and loss account was £13m (2010 £9m).

Rolls-Royce plc Annual report 2011
106
Financial statementsNotes to the Company financial statements
14 Share capitalEquity
ordinary sharesof 20p each
Millions
Nominalvalue
£m
Authorised
At January 1, and December 31, 2011 2,000 400 Issued and fully paid At January 1, and December 31, 2011 1,631 326
15 Movements in capital and reserves Non-distributable reserves
Sharecapital
£m
Sharepremium
£m
Revaluation reserve
£m
Other reserves
£m
Profitand lossaccount
£m
Total equity
£m
At January 1, 2011 326 631 41 167 253 1,418 Total recognised gains relating to the year – – – – 171 171 Transfers between reserves – – (6) – 6 – Share-based payments – direct to equity – – – – 25 25 At December 31, 2011 326 631 35 167 455 1,614
16 Operating lease annual commitments 2011
£m 2010
£m
Leases of land and buildings which expire:Between one and five years 2 4 After five years 1 1
Other leases which expire: Within one year 1 1 Between one and five years 3 4

Rolls-Royce plc Annual report 2011
107
Financial statementsNotes to the Company financial statements
Fina
ncia
l sta
tem
ents
17 Share-based payments
Effect of share-based payment transactions on the Company’s results 2011
£m 2010
£m
Total expense recognised for equity-settled share-based payment transactions 32 28
Share-based payment plans in operation during the yearDuring the year, the Company participated in the following share-based payment plans operated by Rolls-Royce Holdings plc (up until May 23, Rolls-Royce Group plc):
Performance Share Plan (PSP)This plan involves the award of shares to participants subject to performance conditions. Vesting of the performance shares is based on the achievement of both non-market based conditions (EPS and cash flow per share) and a market based performance condition (Total Shareholder Return – TSR) over a three-year period.
ShareSave share option planBased on a three or five year monthly savings contract, eligible employees are granted share options with an exercise price of up to 20 per cent below the share price when the contract is entered into. Vesting of the options is not subject to the achievement of a performance target. The plan is HM Revenue & Customs approved.
Executive Share Option Plan (ESOP)This plan involved the grant of market value share options to participants. It terminated in 2009 and no further grants may be made. Remaining options under the plan are subject to a non-market based performance condition (growth in EPS) and have a maximum contractual life of ten years.
Annual Performance Related Award (APRA) plan deferred sharesA proportion of the APRA annual incentive scheme is delivered in the form of a deferred share award. The release of deferred share awards is not dependent on the achievement of any further performance conditions other than that participants remain employed by the Company for two years from the date of the award in order to retain the full number of shares. During the two year deferral period, participants are entitled to receive dividends, or equivalent, on the deferred shares.
Movements in the Company’s share-based payment plans during the year
ShareSave ESOP PSP APRA
NumberMillions
Weighted average
exercise pricePence
NumberMillions
Weighted average
exercise pricePence
NumberMillions
NumberMillions
Outstanding at January 1, 2010 17.5 381 0.6 165p 10.7 1.7 Granted – – – – 3.2 0.6 Additional entitlements arising from TSR perfromance – – – – 0.4 – Forfeited (0.4) 393 – – – – Exercised (0.8) 426 (0.3) 186p (3.1) (0.7)Outstanding at December 31, 2010 16.3 380 0.3 132p 11.2 1.6 Exercisable at December 31, 2010 – – 0.3 132p – –
Outstanding at January 1, 2011 16.3 380 0.3 132p 11.2 1.6 Granted 6.3 525 – – 3.0 1.5 Additional entitlements arising from TSR perfromance – – – – 0.7 – Forfeited (0.5) 387 – – (0.3) – Exercised (5.2) 346 (0.1) 208p (3.3) (1.3)Outstanding at December 31, 2011 16.9 445 0.2 106p 11.3 1.8 Exercisable at December 31, 2011 – – 0.2 106p – –
As share options are exercised throughout the year, the weighted average share price during the year of 642p (2010 579p) is representative of the weighted average share price at the date of exercise. The closing price at December 31, 2011 was 746.5p, (2010 623p).
The average remaining contractual life of exercisable options is one year (2010 1.6 years).
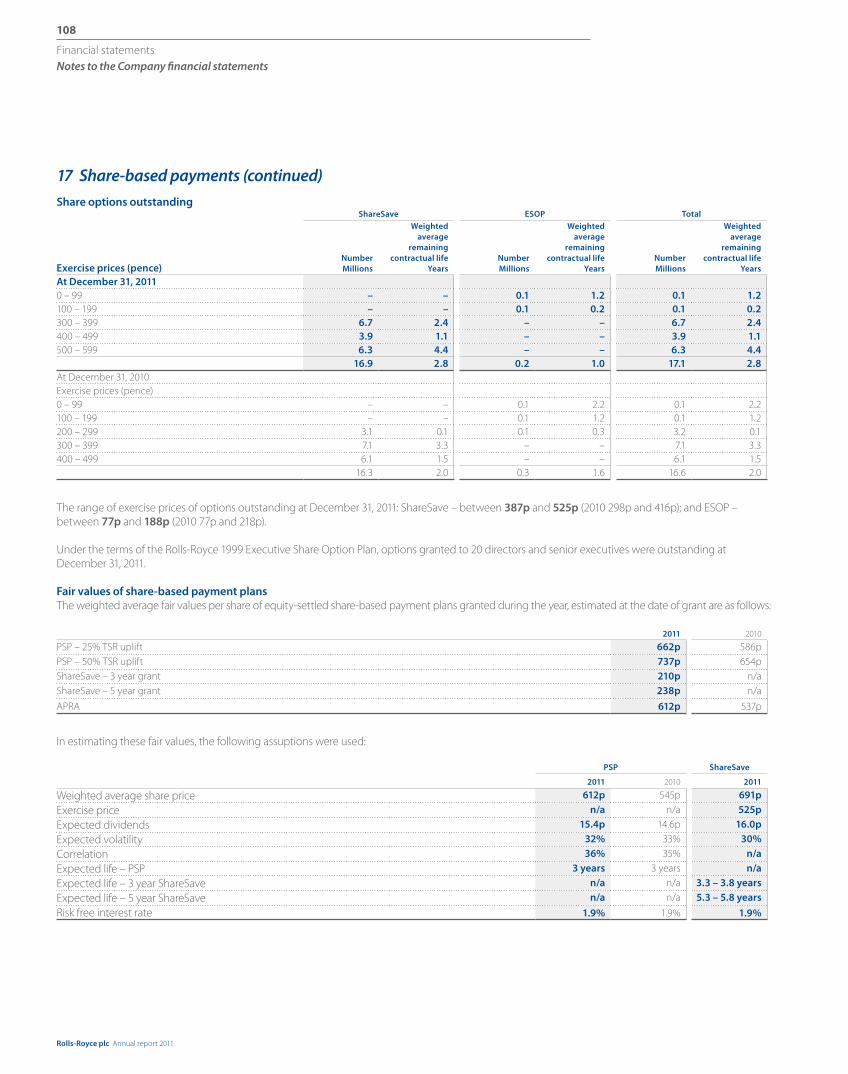
Rolls-Royce plc Annual report 2011
108
Financial statementsNotes to the Company financial statements
17 Share-based payments (continued)
Share options outstandingShareSave ESOP Total
Exercise prices (pence)NumberMillions
Weighted average
remainingcontractual life
YearsNumberMillions
Weighted average
remainingcontractual life
YearsNumberMillions
Weighted average
remainingcontractual life
Years
At December 31, 20110 – 99 – – 0.1 1.2 0.1 1.2100 – 199 – – 0.1 0.2 0.1 0.2300 – 399 6.7 2.4 – – 6.7 2.4400 – 499 3.9 1.1 – – 3.9 1.1500 – 599 6.3 4.4 – – 6.3 4.4
16.9 2.8 0.2 1.0 17.1 2.8At December 31, 2010 Exercise prices (pence)0 – 99 – – 0.1 2.2 0.1 2.2 100 – 199 – – 0.1 1.2 0.1 1.2 200 – 299 3.1 0.1 0.1 0.3 3.2 0.1 300 – 399 7.1 3.3 – – 7.1 3.3 400 – 499 6.1 1.5 – – 6.1 1.5
16.3 2.0 0.3 1.6 16.6 2.0
The range of exercise prices of options outstanding at December 31, 2011: ShareSave – between 387p and 525p (2010 298p and 416p); and ESOP – between 77p and 188p (2010 77p and 218p).
Under the terms of the Rolls-Royce 1999 Executive Share Option Plan, options granted to 20 directors and senior executives were outstanding at December 31, 2011.
Fair values of share-based payment plans The weighted average fair values per share of equity-settled share-based payment plans granted during the year, estimated at the date of grant are as follows:
2011 2010
PSP – 25% TSR uplift 662p 586p PSP – 50% TSR uplift 737p 654p ShareSave – 3 year grant 210p n/a ShareSave – 5 year grant 238p n/a
APRA 612p 537p
In estimating these fair values, the following assuptions were used:
PSP ShareSave
2011 2010 2011
Weighted average share price 612p 545p 691p
Exercise price n/a n/a 525p
Expected dividends 15.4p 14.6p 16.0p
Expected volatility 32% 33% 30%
Correlation 36% 35% n/a
Expected life – PSP 3 years 3 years n/a
Expected life – 3 year ShareSave n/a n/a 3.3 – 3.8 years
Expected life – 5 year ShareSave n/a n/a 5.3 – 5.8 years
Risk free interest rate 1.9% 1.9% 1.9%

Rolls-Royce plc Annual report 2011
109
Financial statementsNotes to the Company financial statements
Fina
ncia
l sta
tem
ents
17 Share-based payments (continued)
Expected volatility is based on the historical volatility of the ultimate parent company’s share price over the seven years prior to the grant or award date. Expected dividends are based on the payments to shareholders in respect of the previous year.
PSP The fair value of shares awarded under the PSP is calculated using a pricing model that takes account of the non-entitlement to dividends (or equivalent) during the vesting period and the market-based performance condition based on expectations about volatility and the correlation of share price returns in the group of FTSE 100 companies and which incorporates into the valuation the interdependency between share price performance and TSR vesting. This adjustment increases the fair value of the award relative to the share price at the date of grant.
ShareSaveThe fair value of the options granted under the ShareSave plan is calculated using a binomial pricing model that assumes that participants will exercise their options at the beginning of the six month window if the share price is greater than the exercise price. Otherwise it assumes that options are held until the expiration of their contractual term. This results in an expected life that falls somewhere between the start and end of the exercise window.
APRAThe fair value of shares awarded under APRA is calculated as the share price on the date of the award, excluding expected dividends.
18 Contingent liabilities
In connection with the sale of its products the Company will, on some occasions, provide financing support for its customers. The Company’s contingent liabilities relating to financing arrangements are spread over many years and relate to a number of customers and a broad product portfolio.
Contingent liabilities are disclosed on a discounted basis. As the directors consider the likelihood of these contingent liabilities crystallising to be remote, this amount does not represent a value that is expected to crystallise. However, the amounts are discounted at the Company’s borrowing rate to reflect better the time span over which these exposures could arise. The contingent liabilities are denominated in US dollars. As the Company does not adopt cash flow hedge accounting for forecast foreign exchange transactions, this amount is reported together with the sterling equivalent at the reporting date spot rate.
The discounted value of the total gross contingent liabilities relating to financing arrangements on all delivered aircraft less insurance arrangements and relevant provisions were:
2011 2010
£m $m £m $m
Gross contingent liabilities 612 951 633 991 Contingent liabilities net of relevant security 1 124 192 121 190 Contingent liabilities net of relevant security reduced by 50% 2 201 312 200 314 1 Unrestricted cash collateral held as security 67 104 68 106 2 Although sensitivty calculations are complex, the reduction of the relevant security by 20% illustrates the sensitivity of the contingent liability to this assumption.
There are also net contingent liabilities in respect of undelivered aircraft, but it is not considered practicable to estimate these as deliveries can be many years in the future, and the relevant financing will only be put in place at the appropriate time.
Contingent liabilities exist in respect of guarantees provided by the Company in the ordinary course of business for product delivery, performance and reliability. The Company has, in the normal course of business, entered into arrangements in respect of export finance, performance bonds, countertrade obligations and minor miscellaneous items. The Company is party to legal actions and claims which arise in the ordinary course of business, some of which are for substantial amounts. As a consequence of the insolvency of an insurer as previously reported, the Company is no longer fully insured against known and potential claims from employees who worked for certain of the Company’s UK based businesses for a period prior to the acquisition of those businesses by the Company. While the outcome of some of these matters cannot precisely be foreseen, the directors do not expect any of these arrangements, legal actions or claims, after allowing for provisions already made, to result in significant loss to the Company.
Where the Company enters into financial guarantee contracts to guarantee the indebtedness of other companies within its group, the Company considers these to be insurance arrangements, and accounts for them as such. In this respect, the Company treats the guarantee contract as a contingent liability until such time as it becomes probable that the Company will be required to make a payment under the guarantee. At December 31, 2011, there were Company guarantees in respect of joint ventures amounting to £124m (2010 £43m).
The Company participates in a Cash Pooling Arrangement. Under the Pooling Arrangement the Company benefits from more favourable interest rates than would be available outside of the Pooling Arrangement as well as more streamlined treasury functions. As part of the Pooling Arrangement, the Company cross-guarantees the borrowings of other pooling participants. At December 31, 2011 these guarantees amounted to £14m (2010 £22m).

Rolls-Royce plc Annual report 2011
110
Financial statementsNotes to the Company financial statements
19 Related party transactions
The Company is a wholly owned subsidiary of Rolls-Royce Holdings plc and therefore has taken advantage of the exemption in FRS 8 Related Party Disclosures not to disclose related party transactions with its parent company and other wholly owned group companies.
There are no significant related party transactions with non wholly owned group companies.
The aggregated balances with joint ventures are shown in notes 7 and 10.
20 Ultimate holding company
The ultimate holding company is Rolls-Royce Holdings plc, incorporated in Great Britain. The financial statements for Rolls-Royce Holdings plc may be obtained from the Company Secretary, Rolls-Royce Holdings plc, 65 Buckingham Gate, London SW1E 6AT.

Rolls-Royce plc Directors’ report and financial statements 2011
111
Oth
er m
atte
rs
Subsidiaries, jointly controlled entities and associates At December 31, 2011
Incorporated within the UK – directly held unless marked *
Optimized Systems and Solutions Limited Equipment health management and advanced data management servicesRolls-Royce Fuel Cell Systems Limited Development of fuel cell systemsRolls-Royce International Limited International support and commercial information servicesRolls-Royce Leasing Limited Engine leasingRolls-Royce Marine Electrical Systems Limited * Marine electrical systemsRolls-Royce Marine Power Operations Limited Nuclear submarine propulsion systemsRolls-Royce Power Development Limited Generation of electricity from independent power projectsRolls-Royce Power Engineering plc Energy and marine systemsRolls-Royce Total Care Services Limited Aero engine aftermarket support servicesTidal Generation Limited Development of tidal generation systems
The above companies operate principally in the UK and the effective Group interest is 100 per cent, other than Rolls-Royce Fuel Cell Systems Limited in which it is 80 per cent.
Incorporated overseas – directly held unless marked *
Brazil Rolls-Royce Brasil Limitada Industrial gas turbines and aero engine repair and overhaul, energy and marine aftermarket support services.Canada Rolls-Royce Canada Limited * Industrial gas turbines and aero engine sales, service and overhaulChina Rolls-Royce Marine (Shanghai) Limited* Manufacture and supply of marine equipmentFinland Rolls-Royce OY AB* ,Manufacture of marine winches and propeller systemsFrance Rolls-Royce Civil Nuclear SAS* Instrumentation and control systems and life-cycle management for nuclear power plantsFrance Rolls-Royce Technical Support SARL* ,Aero engine project supportGermany Rolls-Royce Deutschland Ltd & Co KG* Aero engine design, development and manufactureGuernsey Nightingale Insurance Limited* Insurance servicesIndia Rolls-Royce India Private Limited* Diesel engine project management and customer supportIndia Rolls-Royce Operations (India) Private Limited* Engineering support servicesItaly Europea Microfusioni Aerospaziali S.p.A. ,Manufacture of gas turbine engine castingsNorway Rolls-Royce Marine AS* Design and manufacture of ship equipmentNorway Scandinavian Electric Holding AS* Marine electrical systemsSingapore Rolls-Royce Singapore Pte Limited* Aero engine parts manufacturing and engine assembly, energy and marine aftermarket support servicesSweden Rolls-Royce AB* Manufacture of marine propeller systemsUS Data Systems & Solutions LLC* Instrumentation and control systems and life-cycle management for nuclear power plantsUS Optimized Systems and Solutions Inc* Equipment health management and advanced data management servicesUS R. Brooks Associates Inc. * Specialist civil nuclear reactor servicesUS Rolls-Royce Commercial Marine Inc* Marine aftermarket support servicesUS Rolls-Royce Corporation* Design, development and manufacture of gas turbine enginesUS Rolls-Royce Crosspointe LLC* Manufacturing facility for aero engine partsUS Rolls-Royce Energy Systems Inc* Energy turbine generator packagesUS Rolls-Royce Engine Services – Oakland Inc.* Aero engine repair and overhaulUS Rolls-Royce Defense Services Inc.* Aero engine repair and overhaulUS Rolls-Royce Naval Marine Inc.* Design and manufacture of marine equipmentUS Seaworthy Systems Inc.* Marine support services
The above companies operate principally in the country of their incorporation the effective Group interest is 100 per cent.
Other matters
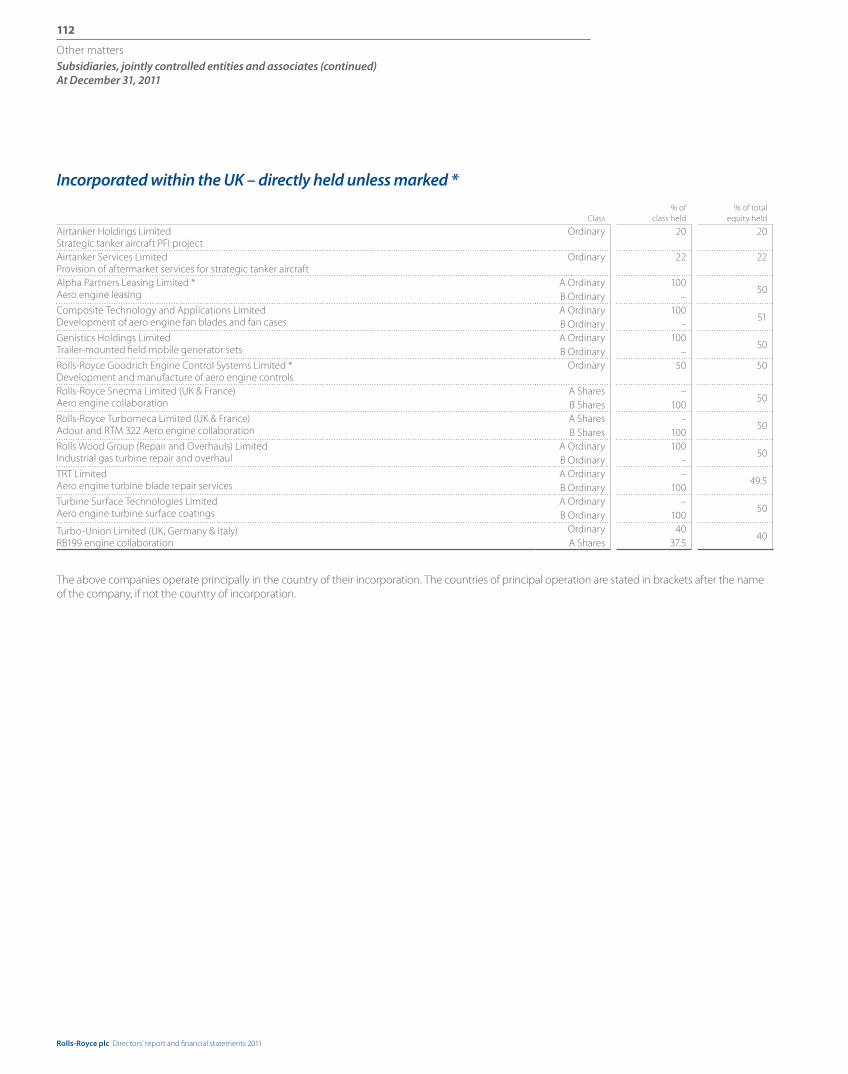
Rolls-Royce plc Directors’ report and financial statements 2011
112
Incorporated within the UK – directly held unless marked *
Class% of
class held% of total
equity held
Airtanker Holdings LimitedStrategic tanker aircraft PFI project
Ordinary 20 20
Airtanker Services LimitedProvision of aftermarket services for strategic tanker aircraft
Ordinary 22 22
Alpha Partners Leasing Limited *Aero engine leasing
A OrdinaryB Ordinary
100–
50
Composite Technology and Applications LimitedDevelopment of aero engine fan blades and fan cases
A OrdinaryB Ordinary
100–
51
Genistics Holdings LimitedTrailer-mounted field mobile generator sets
A OrdinaryB Ordinary
100–
50
Rolls-Royce Goodrich Engine Control Systems Limited * Development and manufacture of aero engine controls
Ordinary 50 50
Rolls-Royce Snecma Limited (UK & France)Aero engine collaboration
A SharesB Shares
–100
50
Rolls-Royce Turbomeca Limited (UK & France)Adour and RTM 322 Aero engine collaboration
A SharesB Shares
–100
50
Rolls Wood Group (Repair and Overhauls) LimitedIndustrial gas turbine repair and overhaul
A OrdinaryB Ordinary
100–
50
TRT LimitedAero engine turbine blade repair services
A OrdinaryB Ordinary
–100
49.5
Turbine Surface Technologies LimitedAero engine turbine surface coatings
A OrdinaryB Ordinary
–100
50
Turbo-Union Limited (UK, Germany & Italy)RB199 engine collaboration
OrdinaryA Shares
4037.5
40
The above companies operate principally in the country of their incorporation. The countries of principal operation are stated in brackets after the name of the company, if not the country of incorporation.
Subsidiaries, jointly controlled entities and associates (continued)At December 31, 2011
Other matters

Rolls-Royce plc Directors’ report and financial statements 2011
113
Oth
er m
atte
rs
Incorporated overseas – directly held unless marked *Class
% of class held
% of total equity held
China Xian XR Aero Components Co LimitedManufacturing facility for aero engine parts
Ordinary 49 49
Germany EPI Europrop International GmbH (effective interest 35.5%)A400M engine collaboration
Ordinary 28 28
Germany EUROJET Turbo GmbH (UK, Germany, Italy & Spain) (effective interest 39%)EJ200 engine collaboration
Ordinary 33 33
Germany MTU, Turbomeca, Rolls-Royce GmbH (UK, France & Germany)MTR390 engine collaboration
Ordinary 33.3 33.3
Germany N3 Engine Overhaul Services GmbH & Co KG *Aero engine repair and overhaul
Ordinary 50 50
Germany Engine Holding GmbH *Supplier of engines and power trains for marine propulsion, distributed power generation and industrial ‘off highway’ sectors. Holding company for Tognum AG.
Ordinary 50 50
Hong Kong Hong Kong Aero Engine Services Limited *Aero engine repair and overhaul
Ordinary 45 45
India International Aerospace Manufacturing Private Limited *Manufacture of compressor shrouds, compressor rings, turbine blades and nozzle guide vanes
Ordinary 50 50
Israel Techjet Aerofoils Limited *Manufacture of compressor aerofoils for gas turbines
A OrdinaryB Ordinary
5050
50
Malaysia Advanced Gas Turbine Solutions Sdn Bhd *Industrial gas turbine aftermarket services
Ordinary 49 49
Singapore International Engine Component Overhaul Pte Limited *Aero engine repair and overhaul
Ordinary 50 50
Singapore Singapore Aero Engine Services Private Limited (effective interest 39%) *Aero engine repair and overhaul
Ordinary 30 30
Spain Industria de Turbo Propulsores SAAero engine component manufacture and maintenance
Ordinary 46.9 46.9
Switzerland IAE International Aero Engines AG (UK, Germany, Japan & US)V2500 engine collaboration
A SharesB SharesC SharesD Shares
100–––
32.5
US Alpha Leasing (US) LLC *, Alpha Leasing (US) (No2) LLC *, Alpha Leasing (US) (No4) LLC *, Alpha Leasing (US) (No.5) LLC *, Alpha Leasing (US) (No.6) LLC *, Alpha Leasing (US) (No.7) LLC *, Alpha Leasing (US) (No.8) LLC *, Rolls-Royce & Partners Finance (US) LLC *, Rolls Royce & Partners Finance (US) (No.2) LLC * Aero engine leasing
Partnerships 50 –
US Exostar LLC *Business to business internet exchange
Partnership 18.5 –
US GE Rolls-Royce Fighter Engine Team LLC *F136 development engine for the Joint Strike Fighter
Partnership 40 –
US Texas Aero Engine Services, LLC *Aero engine repair and overhaul
Partnership 50 –
US Williams-Rolls Inc. (UK & US) *FJ44 engine collaboration
Common 15 15
Unincorporated overseas – held by subsidiary undertaking
US Light Helicopter Turbine Engine Company (LHTEC)Rolls-Royce Corporation has a 50 per cent interest in this unincorporated partnership which was formed to develop and market jointly the T800 engine
The above companies operate principally in the country of their incorporation. The countries of principal operations are stated in brackets after the name of the company, if not the country of their incorporation.
In accordance with Section 410 of the Companies Act 2006, the subsidiaries, jointly controlled entities and associates listed on pages 111 to 113 are those whose results or financial position, in the opinion of the directors, principally affect the financial statements. A list of all related undertakings will be included in the Company’s annual return to Companies House.
Subsidiaries, jointly controlled entities and associates (continued)At December 31, 2011
Other matters
Rolls-Royce plc Directors’ report and financial statements 2011
114
Other matters
Independent Auditor’s reportto the Members of Rolls-Royce plc
We have audited the financial statements of Rolls-Royce plc for the year ended December 31, 2011, set out on pages 42 to 110. The financial reporting framework that has been applied in the preparation of the Group financial statements is applicable law and International Financial Reporting Standards (IFRSs) as adopted by the EU. The financial reporting framework that has been applied in the preparation of the parent company financial statements is applicable law and UK Accounting Standards (UK Generally Accepted Accounting Practice).
This report is made solely to the Company’s members, as a body, in accordance with Chapter 3 of Part 16 of the Companies Act 2006. Our audit work has been undertaken so that we might state to the Company’s members those matters we are required to state to them in an auditor’s report and for no other purpose. To the fullest extent permitted by law, we do not accept or assume responsibility to anyone other than the Company and the Company’s members, as a body, for our audit work, for this report, or for the opinions we have formed.
Respective responsibilities of directors and auditorsAs explained more fully in the Directors’ responsibilities statement set out on page 40, the directors are responsible for the preparation of the financial statements and for being satisfied that they give a true and fair view. Our responsibility is to audit, and express an opinion on, the financial statements in accordance with applicable law and International Standards on Auditing (UK and Ireland). Those standards require us to comply with the Auditing Practices Board’s (APB’s) Ethical Standards for Auditors.
Scope of the audit of the financial statementsA description of the scope of an audit of financial statements is provided on the APB’s website at www.frc.org.uk/apb/scope/private.cfm.
Opinion on financial statementsIn our opinion:
• the financial statements give a true and fair view of the state of the Group’s and of the parent company’s affairs as at December 31, 2011 and of the Group’s profit for the year then ended;
• the Group financial statements have been properly prepared in accordance with IFRSs as adopted by the EU;• the parent company financial statements have been properly prepared in accordance with UK Generally Accepted Accounting Practice; and• the financial statements have been prepared in accordance with the requirements of the Companies Act 2006; and, as regards the Group financial
statements, Article 4 of the IAS Regulation.
Opinion on other matters prescribed by the Companies Act 2006In our opinion the information given in the Directors’ report for the financial year for which the financial statements are prepared is consistent with the financial statements.
Matters on which we are required to report by exceptionWe have nothing to report in respect of the following:
Under the Companies Act 2006 we are required to report to you if, in our opinion:
• adequate accounting records have not been kept by the parent company, or returns adequate for our audit have not been received from branches not visited by us; or
• the parent company financial statements are not in agreement with the accounting records and returns; or• certain disclosures of directors’ remuneration specified by law are not made; or• we have not received all the information and explanations we require for our audit.
A J Sykes (Senior Statutory Auditor) for and on behalf of KPMG Audit Plc, Statutory Auditor Chartered Accountants 15 Canada Square London E14 5GL February 8, 2012


© Rolls-Royce plc 2012
Rolls-Royce plc Registered office: 65 Buckingham Gate London SW1E 6AT
T +44 (0)20 7222 9020 www.rolls-royce.com
Company number 1003142
® ®