Embed Size (px)
Citation preview

13 February, 2015
ROLLS-ROYCE HOLDINGS PLC
2014 FULL-YEAR RESULTS
Group Highlights
Record order book £73.7 billion
Underlying revenue and profit in line with guidance1
Free cash flow £254 million (£447 million excluding the divested Energy business)
Reported profit before tax £67 million2
Concluded the sale of the Energy business and began a £1 billion share buyback with the proceeds
Delivered the first Trent XWB engines for launch customer Qatar Airways
Secured an exclusive position to power the Airbus A330neo
Launched new family of medium-speed reciprocating engines
Payment to shareholders 23.1 pence per share, up 5%
Rolls-Royce Holdings plc
£ millions 2013 2014 Change
Order book 71,612 73,674 3%
Underlying revenue 15,505 14,588 -6%
Underlying profit before tax 1,759 1,617 -8%
Return on sales* 11.8% 11.5% -0.3pp
Underlying earnings per share 65.6p 65.3p -0.3pp
Full year payment to shareholders 22.0p 23.1p 5%
Reported revenue** 14,642 13,736 -6%
Reported profit before tax** 1,700 67 -96%
Reported earnings per share** 73.3p 3.7p -95%
Net cash 1,939 666 -66%
Free cash flow*** 781 254 -67%
Underlying: for definition, see note 2 on page 26
* By reference to underlying profit before finance charges and tax
** Represented to reflect Energy as a discontinued operation
*** Free cash flow defined as operating cash after capital expenditure, pensions and taxes, before payments to shareholders, and acquisitions & disposals. For details see: http://www.rolls-royce.com/investors/financial_results/
John Rishton, Chief Executive, said:
“We have met guidance for 2014 revenue and profit in challenging conditions while continuing to build strong foundations for future growth.
1 See table on page 2 for reconciliation to guidance.
2 Principally reflecting foreign exchange mark-to-market adjustments

2
“2014 has been a mixed year during which underlying revenue fell for the first time in a decade, reflecting reduced spending by our defence customers, macroeconomic uncertainty, and falling commodity prices. In response to these headwinds, we are taking decisive action to improve the Group’s financial performance and accelerating our focus on the 4Cs: Customer, Concentration, Cost and Cash. This includes a major restructuring programme in our Aerospace Division and continued rationalisation of our Land & Sea Division. “The fundamentals of our business remain solid, with long-term growth in demand for the complex power systems we deliver across our Aerospace and Land & Sea Divisions. “In Aerospace, the delivery of the first Airbus A350XWB, powered by the Rolls-Royce Trent XWB engine, marked a significant milestone in our most important programme. In Land & Sea, we introduced a new family of medium-speed reciprocating engines. “Our record order book demonstrates the faith our customers continue to place in our technology and underpins our confidence in future growth.” Group Overview
Reconciliation of 2014 Results to Latest Guidance
£ millions
2013
2014
Change
Latest 2014 Guidance
Underlying Revenue As reported 15,505 14,588 -6%
Foreign exchange translation 459 Estimated at £500m
Guidance basis*** 15,047 -3% Down 3.5% to 4.0%
Energy** 871 762
Guidance basis excl Energy 14,634 *14,285 -2% Down 3.0 to 3.5%
Underlying Profit before tax As reported 1,759 1,617 -8%
Foreign exchange translation 49 Estimated at £60m
Marine one off charge 30
Additional restructuring 56 Estimated at £60m
Guidance basis 1,759 1,752 0% Flat
Energy 64 -3
Guidance basis excl. Energy 1,695 1,755 4% 1% higher
Free cash flow As reported 781 254 Around £350m
Energy 3 -193
Excluding Energy 778 447 * Revenue of £14,285m - £421m in foreign exchange translation excluding Energy = £13,864m as shown on page 5.
** On 1 December, we concluded the sale of our Energy gas turbines and compressor business to Siemens for a £785 million cash consideration and a further £200 million for a 25-year licensing agreement.
*** Our October 2014 guidance was given both including and excluding the Energy business. Because this business has now been sold, the figures given in this Group Overview exclude Energy. The table above provides a reconciliation to both forms of guidance.
The Group order book increased 5% to £73.7 billion. Free cash flow declined 43% to £447 million, primarily reflecting lower volumes, as well as lower deposits in Civil, Marine, and Defence.

3
In August, we completed our acquisition of Power Systems, purchasing Daimler’s 50% share in the company for £1.94 billion. Power Systems has world-leading technology in high-speed reciprocating engines and advanced fuel injection systems, and extends the scale and scope of our Land & Sea Division. Rolls-Royce operates as two Divisions: Aerospace and Land & Sea. We believe both markets offer attractive returns and leverage our core strengths. There is an industrial, commercial, and strategic logic that ties our Aerospace and Land & Sea Divisions together and generates value for the Group. Industrially, our knowledge of advanced engineering applies across both Divisions. World-class technology is required by all of our customers and, as the power systems we produce become more sophisticated, a deep understanding of materials science, electronics, data management, and aftermarket services are increasingly important in every part of the Group. Commercially, the need for scale and portfolio breadth with exposure to differing business and investment cycles is something that both we and our competitors recognize. This scale provides a balance sheet that can withstand shocks, and in turn, provides confidence to our customers who are buying products that will be in service for decades. Our breadth increases market access and generates opportunity. Strategically, our two Divisions address growing markets. Strong growth in the demand for air travel is widely forecast and is reflected in our £63 billion Civil aerospace order book. Future growth in world trade (90% of which is carried by sea), urbanisation, population growth, and tighter environmental regulation leaves our Land & Sea Division well-positioned to meet the increasing requirements for cleaner power. Operations: We continue to focus the Group on the 4Cs of Customer, Concentration, Cost, and Cash. On Customer: We continue to make good progress improving quality, delivery, reliability, and responsiveness – the characteristics our customers tell us they value most. The results can be seen across a wide range of programmes. In Aerospace, the Trent 1000-powered Boeing 787 Dreamliner has achieved an industry-leading 99.9% engine dispatch reliability after more than 500,000 flying hours in service. Since launch, we have doubled the time on wing for both our Trent 700 and Trent 800 fleets. In our Corporate & Regional business, we achieved a 57 percentage point improvement in our response time to business jet customers. In our Land & Sea Division, on-time delivery to Marine customers has improved by 33 percentage points since 2012. Marine also signed its first commercial long-term service agreement. As the power systems we deliver in Land & Sea become more complex, we see further opportunities to expand our aftermarket activities, building on the data and service capabilities we have developed in Aerospace. In Power Systems, we opened an additional logistics centre in Singapore, enabling a 5% improvement in the availability of spare parts and setting a new standard for customer service. Recognising the progress we have made, Airbus has presented us with their Supply Chain and Quality Improvement Award. The US Government’s Defense Logistics Agency recognised Rolls-Royce as a ‘first tier supplier’ from amongst 153 companies, and we were awarded joint first place by Aviation International News for the quality of our business aircraft support. Improving performance in this way deepens the relationship we have with our customers and generates opportunities for us to secure additional business.
In major programmes: In July, we announced the seventh member of the Trent engine family, the Trent 7000, which will power the new Airbus A330neo. This new engine will incorporate technology from our most recent

4
Trents, and will deliver a 10% improvement in fuel consumption while halving noise energy compared to current aircraft. We will be the exclusive engine supplier on the A330neo, which is expected to enter service in 2017. In December, we were delighted to celebrate the first customer delivery of the Trent XWB to launch customer Qatar Airways. The Trent XWB is the most fuel-efficient large aero engine operating in the world today. We continue to be the sole engine provider for the Airbus A350 XWB. In our Land & Sea Division we continue to bring new technology to market. In September, we unveiled our new medium-speed, Bergen B33:45 engines, which offer a 20% increase in power per cylinder while reducing fuel consumption, emissions, and operating costs. In July, we celebrated the naming of the Royal Navy’s newest aircraft carrier, the HMS Queen Elizabeth. This represented a major milestone for our Marine business that has supplied the engines, propellers, rudders, and steering gear for this highly-advanced and complex vessel. On Concentration: The completion of our Power Systems acquisition has added significantly to the breadth and reach of our Land & Sea Division. We are already seeing the benefits of this acquisition, where our MTU diesel-electric propulsion systems were delivered to Marine customers for offshore vessels in China and Brazil. The sale of our Energy business to Siemens demonstrates our continued drive to focus our organisation where we can most add value. The sale proceeds of around £1 billion are being returned to shareholders by way of the share buyback programme we initiated in December.
On Cost: We have taken action to improve cost performance in every part of the business and in every cost category. We have made good progress in some areas and as a result, Group gross margins improved by 1.7 percentage points in 2014. In Defence, we have improved margins despite declining revenue. In Land & Sea, we closed five plants and are rationalising other parts of the business. For example, we are consolidating production of steering gear in Norway and waterjets into Finland. We are driving down cost by improving quality, simplifying logistics, reducing waste, and adopting processes that allow us to make things better and faster.
In November, we announced a restructuring programme in our Aerospace Division and central functions, which is expected to reduce headcount by 2,600. By the end of 2014, 545 people had left the business, with the majority of the reductions expected in 2015. This programme is expected to result in restructuring charges of around £120 million, of which £56 million was recognised in our 2014 results. We anticipate annualised cost benefits of around £80 million from 2016 onwards, with £50 million in benefits expected in 2015. Our total Aerospace 2014 restructuring activities cost £164 million (of which £139 million was underlying).
However, in a complex and highly-regulated business, we recognise that it will take some time for the full benefit of our cost programmes to feed through. There are also a number of headwinds in our Civil aerospace business associated with our future growth. For example, we have invested in the capacity required to deliver our record order book, but delay in a number of our customers’ major programmes has meant some of this new capacity has come on stream before it is needed, leaving us with under-utilised production facilities. We have also constructed a number of new world-class facilities to replace older, less productive plants. For a period of transition we are carrying the cost of both the old and new facilities.
Group restructuring costs in 2014 were £188 million, of which £149 million was underlying. Over the past two years, the Group has reduced indirect headcount by 18%. We expect Group underlying restructuring costs to be between £90 and £100 million in 2015.
Cost performance will continue to be a major focus, and as we rationalise and transform the Group, we have targeted a 20% reduction in our footprint and a doubling of our lower-cost country sourcing by 2020. We are now accelerating progress towards these targets.
On Cash: Our free cash flow was lower in 2014 than in 2013, primarily reflecting lower volume, as well as lower deposits in Civil, Defence and Marine, and the expected increase in the TotalCare

5
receivable. Inventory declined from £3.3 to £2.8 billion during the year, primarily reflecting the Energy sale and foreign exchange. Excluding this, inventories improved by £140 million and inventory turns were flat on lower volume. We continue to focus on improving our free cash flow, particularly in the face of near-term headwinds. Our programmes to reduce product and aftermarket costs, to lower our headcount, and to reduce our footprint all require upfront investment, but will deliver cost and cash benefits in the medium-term. As revenue increases, we expect to reduce our capital expenditure and R&D as a percentage of sales. The customer progress highlighted above is improving our operational performance. Combined with increasing volumes, this will enable us to reduce our inventory buffers.
Group Trading Summary
Rolls-Royce Holdings plc Excluding Energy £ millions 2013 2014 Change
Order book 70,385 73,674 5% Underlying revenue 14,634 13,864 -5% Underlying profit before tax 1,695 1,620 -4% Return on sales 12.1% 12.1% +0.0pp Free cash flow 778
447 -43%
Order Book
The order book grew 5% to £73.7 billion, with increases in Civil aerospace, Defence aerospace and Power Systems. The order intake of £19.0 billion included net orders of £11.7 billion in Civil aerospace, £2.5 billion in Defence aerospace, £1.8 billion in Marine, £0.6 billion in Nuclear, and £2.6 billion in Power Systems. Our order book remains widely spread around the world, with 44% in Asia and the Middle East, 25% in North America, 25% in Europe, while South America and Rest of World account for 4% and 2%, respectively.
Income Statement
Group underlying revenue fell 5% to £13.9 billion. Excluding adverse foreign exchange translation, underlying revenue fell 2%. The main factors were a sharp decline in Defence aerospace OE revenue due to lower volumes as government defence spending in many countries was scaled back, and lower Land & Sea revenue due to weaker end markets. These falls were partially offset by continuing growth in Civil aerospace deliveries as Trent 1000 engine production ramped up, and an improvement in Defence aerospace services.
Group underlying profit before tax in 2014 declined 4% to £1,620 million. We saw a negative impact from lower volumes, especially in Defence and Land & Sea, increased R&D investment (£140m) and higher restructuring charges (£100 million), the one-off Marine charge (£30 million), and adverse foreign exchange (£49 million). These factors were offset by an improved trading margin which included an approximately £150 million benefit from improved retrospective TotalCare contract profitability (approximately £110 million negative in 2013), reflecting lower cost, changing operating patterns and reduced contract risk. Lower bonus and share incentive costs resulted in a saving of £178 million, about half of which was in commercial and administrative costs (C&A). Trading margins in Defence also improved, driven by both cost reduction action and an improved mix. In Land & Sea we had a difficult year at our Bergen subsidiary, reflecting weaker trading performance.
Research & development net spend increased in 2014 to £819 million, reflecting increased spending on the higher thrust Trent XWB-97k, due to enter service in 2017, and on the Trent 1000-TEN, due to enter service in 2016. We continue to invest in research for our Advance and UltraFan programmes, which will create opportunities for the next generation of gas turbine engines.

6
The Group provides both reported and underlying figures. Underlying figures exclude the impact of mark-to-market adjustments in our hedge book, post-retirement financing, and the effects of acquisition accounting. Reported profit before tax declined £1.6 billion, primarily reflecting changes in the foreign currency spot rates, which caused a mark-to-market change in our hedge book. Mark-to-market adjustments have no effect on cash flow, and are principally driven by movements in the £/$ exchange rate, which moved from $/£1.65 to $/£1.56.
Balance Sheet
The Group remains committed to maintaining a strong balance sheet and a strong, investment-grade credit rating. Standard & Poor’s retains a rating of A/stable, and Moody’s a rating of A3/stable. These ratings are important when selling products that will be in service for decades.
The Group holds £666 million in net cash and £3.5 billion in facilities. Debt maturities remain well-spread through 2026.
On 10 December, the Group initiated its £1 billion share buyback, which will return to shareholders the proceeds from the sale of the Energy business. As of 9 February, we had completed £204 million and purchased 23.6 million shares as part of the share repurchase programme.
UK pension liabilities, which represent approximately 86% of the Group’s liabilities, reported a surplus of £1.7 billion. Overseas, our net liability was valued at £1.2 billion. Overall funding across the schemes has improved in recent years as the Group has adopted a lower risk investment strategy that enables the funding to remain relatively stable.
The Group hedges transactional foreign exchange exposures to reduce volatility. The most significant exposure is the net US dollar income of approximately $5 billion per year which is converted into GBP. The hedge book was $26 billion at year end, which represents four and a half years of cover. The average rate was $/£1.61.
TotalCare Net Assets increased £463 million in 2014, consistent with our guidance. This will continue to grow as linked engine deliveries rise, reflecting the timing difference between profit and cash.
The Group’s net cash balance reduced from £1.94 billion to £666 million, reflecting the acquisition of the remaining 50% of Power Systems from Daimler, offset by the proceeds of the disposal of the Energy business.
Free Cash Flow
Free cash flow was £447 million compared to £778 million in 2014. Higher cash flow from operations and lower capital spending were offset by an increase in net working capital, which reflected lower customer advances or deposits, and the expected increase in TotalCare receivables.
Capital expenditure in 2014 was £649 million as we invested in facilities and equipment to deliver the large increases in widebody engines. This included investments in assembly and test facilities, our Advanced Blade Casting Facility in Rotherham and our Washington fan disc facility.
The cash cost of the pension programme in excess of the earnings charge was £54 million higher than in 2013.
2015 Guidance
7
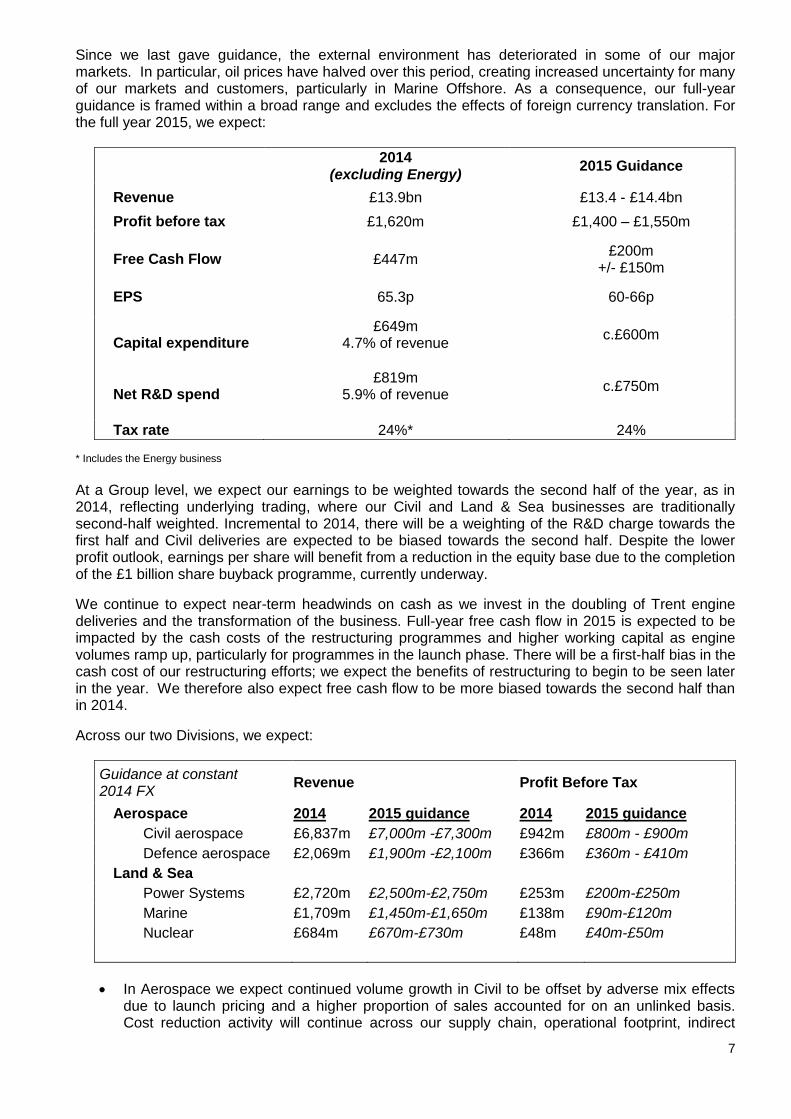
Since we last gave guidance, the external environment has deteriorated in some of our major markets. In particular, oil prices have halved over this period, creating increased uncertainty for many of our markets and customers, particularly in Marine Offshore. As a consequence, our full-year guidance is framed within a broad range and excludes the effects of foreign currency translation. For the full year 2015, we expect:
2014
(excluding Energy) 2015 Guidance
Revenue £13.9bn £13.4 - £14.4bn
Profit before tax £1,620m £1,400 – £1,550m
Free Cash Flow £447m £200m
+/- £150m
EPS 65.3p 60-66p
Capital expenditure £649m
4.7% of revenue
c.£600m
Net R&D spend £819m
5.9% of revenue
c.£750m
Tax rate 24%* 24% * Includes the Energy business
At a Group level, we expect our earnings to be weighted towards the second half of the year, as in 2014, reflecting underlying trading, where our Civil and Land & Sea businesses are traditionally second-half weighted. Incremental to 2014, there will be a weighting of the R&D charge towards the first half and Civil deliveries are expected to be biased towards the second half. Despite the lower profit outlook, earnings per share will benefit from a reduction in the equity base due to the completion of the £1 billion share buyback programme, currently underway.
We continue to expect near-term headwinds on cash as we invest in the doubling of Trent engine deliveries and the transformation of the business. Full-year free cash flow in 2015 is expected to be impacted by the cash costs of the restructuring programmes and higher working capital as engine volumes ramp up, particularly for programmes in the launch phase. There will be a first-half bias in the cash cost of our restructuring efforts; we expect the benefits of restructuring to begin to be seen later in the year. We therefore also expect free cash flow to be more biased towards the second half than in 2014.
Across our two Divisions, we expect:
Guidance at constant 2014 FX
Revenue Profit Before Tax
Aerospace 2014 2015 guidance 2014 2015 guidance
Civil aerospace £6,837m £7,000m -£7,300m £942m £800m - £900m
Defence aerospace £2,069m £1,900m -£2,100m £366m £360m - £410m
Land & Sea
Power Systems £2,720m £2,500m-£2,750m £253m £200m-£250m
Marine £1,709m £1,450m-£1,650m £138m £90m-£120m
Nuclear £684m £670m-£730m £48m £40m-£50m
In Aerospace we expect continued volume growth in Civil to be offset by adverse mix effects due to launch pricing and a higher proportion of sales accounted for on an unlinked basis. Cost reduction activity will continue across our supply chain, operational footprint, indirect

8
headcount, and service provision, which will continue to produce operational benefits. Retrospective TotalCare profit benefits are not expected to repeat at the same levels as in 2014.
In Power Systems we expect growth in the industrial, power generation and commercial marine end markets, offset by lower revenue from naval marine. On profit, we continue to focus on cost reduction, but face headwinds on mix. We are taking actions to improve the operating performance and cost controls at Bergen that are expected to restore profitability during 2015.
In Marine we anticipate that the market will remain challenging in the short-term, reflecting external factors especially oil price uncertainty, particularly in Offshore. We will accelerate our cost reduction focus on our footprint, our supply chain, and our overhead costs in order to drive a more competitive business while also adapting to volume risks.
We expect capital expenditure (additions to property, plant & equipment) to be around £600 million in 2015, down from £649 million in 2014. In 2014 capital expenditure was 4.7% of revenue. Over time we expect capital expenditure to trend towards 4%.
We expect net research & development (R&D) spend to be around £750 million in 2015, down from £819m in 2014. In 2014 R&D was 5.9% of revenue. We expect it to ease as a percentage of revenue as the business grows.
We expect a tax rate of around 24% in 2015, similar to that of 2014. We remain confident in the fundamental strength of the business and its potential to significantly increase profit and free cash flow in the future. Enquiries: Investors: Media: Jilinda Crowley Richard Wray Acting Director – Investor Relations Director of External Communications Rolls-Royce plc Rolls-Royce plc Tel: +44 (0)20 7227 9282 Tel: +44 (0)20 7227 9163 [email protected] [email protected] Photographs and broadcast-standard video are available at www.rolls-royce.com. A PDF copy of this report can be downloaded from www.rolls-royce.com/investors. This Full Year Results Announcement contains forward-looking statements. Any statements that express forecasts, expectations and projections are not guarantees of future performance and will not be updated. By their nature, these statements involve risk and uncertainty, and a number of factors could cause material differences to the actual results or developments. This report is intended to provide information to shareholders, is not designed to be relied upon by any other party, or for any other purpose and the Company and its directors accept no liability to any other person other than under English law.

9
Civil aerospace
£ millions 2013 2014 Change Order book 60,296 63,229 5% Engine deliveries 753 739 -2% Underlying revenue 6,655 6,837 3% Underlying OE revenue 3,035 3,265 8% Underlying services revenue 3,620 3,572 -1% Underlying profit before financing 844 942 12% Return on sales 12.7% 13.8% 1.1pp
Financial
The Civil order book increased 5%. Our net order intake was £11.7 billion. Aftermarket services now constitute 31% of the Civil order book. Significant orders in 2014 included: o £4.5 billion in Trent 7000 engines and TotalCare orders for the Airbus A330neo,
including orders from AirAsia X, Air Lease Corporation, Delta Air Lines, Avolon, CIT, Transaero Airlines, and Hawaiian Airlines
o £1.6 billion in Trent XWB engines and TotalCare orders for the A350XWB, including orders from IAG, Air Mauritius, Delta and Finnair
o £1.1 billion in Trent 1000 engines and TotalCare orders for the 787 Dreamliner, including orders from ANA and Air Europa
o £0.6 billion in Trent 700 engines and TotalCare orders for the Airbus A330, including orders from AirAsia X, Kuwait Airways and Lion Air
Underlying revenue grew 3% (up 4% at constant foreign exchange), on 8% growth in OE that was partially offset by a 1% decline in services. OE growth was primarily driven by a ramp-up in Trent 1000 engine production. This was partially offset by a 9% reduction in business jet engine deliveries. The decline in services reflected an expected 24% decline in the RB-211 programme. Aftermarket revenue from our Trent fleet increased 6%.
Underlying profit improved by 12%, driven by higher volumes and improved aftermarket margins. Profit benefited from approximately £150 million in improved retrospective TotalCare contract profitability, reflecting lower cost, changing operating patterns and reduced contract risk. Profit also benefited from lower C&A and bonus costs. This was partially offset by £63 million in higher restructuring costs and £151 million in higher R&D costs. The investments we are making in R&D and restructuring will support future profitable growth.
In 2015, we expect revenue between £7.0 and £7.3 billion, with continued growth in Trent XWB and Trent 1000 OE sales, and good growth in aftermarket revenue. We expect this to be partially offset by fewer Trent 900 and Trent 700 sales. We expect profit to be between £800 and £900 million, as the retrospective TotalCare accounting adjustments do not repeat at similar levels. This guidance is based on 2014 average exchange rates.
Portfolio
Our Trent XWB entered service with Qatar Airways. The Trent XWB is the world’s most fuel-efficient large turbofan, and the fastest-selling widebody engine ever, with more than 1,500 engines already sold.
We launched the Trent 7000 engine, the seventh generation of the market-leading Trent family of large engines, and the exclusive engine for the Airbus A330neo. Over 240 Trent 7000 engines have been ordered.
We were selected to power Gulfstream’s new ultra long-range business jet, the G650ER.

10
Defence aerospace
£ millions 2013 2014 Change Order book 4,071 4,564 12% Engine deliveries 893 744 -17% Underlying revenue 2,591 2,069 -20% Underlying OE revenue 1,385 816 -41% Underlying services revenue 1,206 1,253 4% Underlying profit before financing 438 366 -16% Return on sales 16.9% 17.7% 0.8pp
Financial
The Defence order book grew 12% in 2014, the first increase since 2010. Total order intake increased 55% to £2.54 billion, from £1.64 billion in 2013. Significant orders in 2014 included: o A major long-term agreement with Lockheed Martin worth up to $1 billion to supply up
to 600 AE 2100 engines for the C-130J aircraft, in addition to over $200 million in support contracts for AE 2100 engines
o Production and support contracts worth $548 million for the F-35B LiftSystem o Engine orders for Trent 700s to power A330 tanker aircraft for the defence forces of
France and the Republic of Singapore, worth nearly $800 million o Contracts worth over US$400 million to support the V-22 Osprey’s AE 1107C engines
with the US Marine Corps and US Air Force o A continued support contract worth over $100 million from the US Navy for Adour
engines, powering T-45 trainers
Underlying revenue fell 20% (down 18% at constant foreign exchange), reflecting a 41% decline in OE partially offset by 4% growth in aftermarket services. OE reductions were due to lower volumes across several programmes, including major deliveries in 2013 of two export contracts that were nearing completion: EJ200 to Saudi Arabia and Adour to India. Services revenue grew modestly, as LiftSystem and TP400 maintenance started to ramp up.
A smaller decline in underlying profit of 16% (down 14% at constant foreign exchange), reflects significant cost reduction actions and a favourable mix shift towards aftermarket, which represented 61% of Defence revenue. Profit also benefited from lower C&A and bonus costs.
In 2015, we expect revenue of between £1.9 and £2.1 billion and profits of between £360 and £410 million, based on average 2014 exchange rates. Cost reduction activity will continue across our supply chain, operational footprint, headcount, and service provision.
Portfolio
The A330 tanker aircraft powered by our Trent 700 engines was selected by the defence forces of France and the Republic of Singapore.
Our T56 Series 3.5 engine enhancement programme for legacy C-130 and P-3 aircraft received US Air Force certification, obtained its first funding through the US Congress, and completed flight tests for our launch customer, the WP-3D ‘Hurricane Hunter’ aircraft of the National Oceanic and Atmospheric Administration.
In November, EPI, in which we are a senior partner, delivered its 100th TP400 production engine to power the A400M transport aircraft. We also announced an £18 million investment in our Bristol facility for maintenance, repair and overhaul capabilities to support this programme.

11
Power Systems
£ millions 2013 2014 Change Order book 1,927 1,971 2% Underlying revenue 2,831 2,720 -4% Underlying OE revenue 2,004 1,893 -6% Underlying services revenue 827 827 -- Underlying profit before financing 294 253 -14% Return on sales 10.4% 9.3% -1.1pp
Financial
The Power Systems order book grew 2%. Order intake was £2.6 billion. Significant orders in 2014 included: o Orders from Polish rail vehicle manufacturer Pesa Bydgoszcz SA for MTU high-speed
diesel engines o Order to power the new German infantry combat vehicle, Puma, where our new Series
890 engine is the world’s most compact military vehicle engine o Bergen medium-speed engines for power generation in Mozambique, including a 15-
year service agreement
Underlying revenue declined 4% mainly due to adverse foreign exchange effects. Growth in defence and power generation was offset by substantially lower sales to European construction, industrial, and agricultural customers. Marine revenue also declined, driven by weaker yacht markets. As in previous years, revenue was biased towards the second half.
Underlying profit declined 14% due to adverse foreign currency effects and losses in the Bergen business. Profit benefited from lower C&A and bonus costs.
In 2015, we expect revenue between £2.5 and £2.75 billion and profit between £200 and £250 million. We expect growth in the industrial, power generation and commercial marine end markets, offset by lower revenue from defence customers, particularly naval marine. We expect profit headwinds from a deteriorating mix. We are taking actions to improve the operating performance and cost controls at Bergen. Our guidance is based on 2014 average exchange rates.
Portfolio
In August, we completed the acquisition of Daimler’s minority interest in Rolls-Royce Power Systems, consisting of the MTU, Bergen, and L’Orange product ranges.
We launched the Bergen B33:45, a new family of medium-speed engines for the marine market, with future variants for land-based power generation.
We introduced our new MTU Series 4000 natural gas engines, which offer improved efficiency to our onsite energy customers.

12
Marine
£ millions 2013 2014 Change Order book 1,622 1,567 -3% Underlying revenue 2,037 1,709 -16% Underlying OE revenue 1,288 1,070 -17% Underlying services revenue 749 639 -15% Underlying profit before financing 233 138 -41% Return on sales 11.4% 8.1% -3.3pp
Financial
The Marine order book declined 3% in 2014, with a 1% reduction in order intake to £1.82 billion. At constant exchange rates, the order book increased 6%. Significant orders in 2014 included: o A contract worth more than £54 million for an extensive package of deck machinery to
six new high-end anchor handling tug supply vessels, Rolls-Royce’s largest single contract for deck machinery
o An order for engines and azimuthing thrusters to power Asia’s first gas-powered tugs o A £35 million contract to design and equip a large offshore support vessel for Island
Offshore o A £24 million contract to supply a complete module handling system to the subsea
construction vessel Aker Wayfarer, the largest single subsea vessel project ever undertaken by Rolls-Royce
Underlying revenue decreased 16% (down 9% at constant foreign exchange), reflecting a 17% decline in OE and a 15% decline in services. OE reduction was driven by a combination of pricing and the expected decline in Offshore, driven by 2013’s weak order intake. Service revenue declined in Offshore and Merchant, as ship owners deferred overhaul and maintenance.
Underlying profit fell 41%. Excluding foreign exchange translation and a one-off charge of £30 million to cover the resolution of a quality issue, profit declined 25% as a result of lower revenue and an adverse mix, reflecting pricing pressure and lower services revenue. The business also incurred restructuring costs as it continued to streamline its global footprint, reduce indirect headcount, and consolidate manufacturing activity. Profit benefited from lower C&A and bonus costs.
In 2015, we expect revenue between £1.45 and £1.65 billion and profit between £90 and £120 million. We anticipate that the market will remain challenging in the short term, reflecting external factors, particularly in Offshore. We will accelerate our cost reduction focus on our footprint, our supply chain, and our overhead costs in order to drive a more competitive business while also adapting to volume risks. Our guidance is based on 2014 average exchange rates.
Portfolio
We celebrated 40 years of leadership in offshore oil and gas vessels with UT design. There are now 800 UT vessels in service or on order.
Our MT30 gas turbine powered the launch of the US Navy’s multi-mission destroyer USS Zumwalt and the Royal Navy’s aircraft carrier HMS Queen Elizabeth.

13
Nuclear & Energy (includes the Energy business sold to Siemens)
£ millions 2013 2014 Change Order book 3,843 2,499 -35% Underlying revenue 1,538 1,408 -8% Underlying OE revenue 565 556 -2% Underlying services revenue 973 852 -12% Underlying profit before financing 74 45 -39% Return on sales 4.8% 3.2% -1.6pp
On 1 December, we concluded the sale of our Energy gas turbine and compressor business to Siemens for a £785 million cash consideration, and a further £200 million for a 25-year licensing agreement. The table above shows the performance of the total business, including the Energy business sold to Siemens. The Energy & Nuclear business experienced a challenging year, with order intake down 54% to £0.9 billion, and a 35% reduction in the order book. Despite improvements in Nuclear, revenue declined 8% and profit declined 39%, as the Energy business’ end markets weakened and customer orders slowed ahead of the sale of the gas turbine business to Siemens. The table and commentary below separately highlight the performance of the retained business.
Nuclear (excludes the Energy business sold to Siemens)
£ millions 2013 2014 Change Order book 2,617 2,499 -4% Underlying revenue 667 684 3% Underlying OE revenue 236 254 8% Underlying services revenue 431 430 0% Underlying profit before financing 10 48 380% Return on sales 1.5% 7.0% +5.5pp
Financial
The order book for the continuing business declined 4%, reflecting lower order intake following the receipt of a multi-year submarines contract in 2013. Significant orders in 2014 included: o Orders totalling £175 million to cover continuing development of the new propulsion plant
for the Royal Navy’s Vanguard class replacement submarine o A €130 million contract with Finnish nuclear operator, Fortum, to provide Instrumentation &
Control (I&C) technology and expertise to upgrade two reactors in Finland
Underlying revenue increased 3%, driven by good growth in the Civil Nuclear services business, which has been the focus of recent acquisitions. Our services capabilities include remote inspection, plant life extension and obsolescence management, and these performed well in 2014.
Underlying profit increased £38 million, including £20 million from better operating performance, lower C&A and bonus costs, and a non-repeat of 2013 one-time charges.
In 2015, we expect revenue between £670 and £730 million, and profit between £40 and £50 million. This is based on 2014 average exchange rates.
Portfolio
Our market-leading digital safety I&C platform for nuclear reactors, known as Spinline™, received certification by the US Nuclear Regulatory Commission. Spinline™ enables power utilities to enhance nuclear safety and operational efficiency over the lifetime of the plant.

14
We signed separate memoranda of understanding with Chinese nuclear companies CGN and SNPTC. These agreements will see us cooperate more closely with the companies in the field of civil nuclear power in China, the UK, and other overseas markets.
We delivered designs for the new propulsion plant for the Vanguard class replacement submarine to the UK MoD.

Financial review
Underlying income statement £million 2014 2013 Change
Revenue 14,588 15,505 -917
Profit before financing 1,678 1,831 -153
Net financing (61) (72) +11
Profit before tax 1,617 1,759 -142
Tax (387) (434) +47
Profit for the year 1,230 1,325 -95
Earnings per share (EPS) 65.31p 65.59p -0.28p
Payments to shareholders 23.1p 22.0p +1.1p Gross R&D investment 1,249 1,118 +131
Net R&D charge 755 624 +131
Segmental analysis Revenue Profit before financing
£million 2014 2013 Change 2014 2013 Change
Civil 6,837 6,655 +182 942 844 +98
Defence 2,069 2,591 -522 366 438 -72
Aerospace Division 8,906 9,246 -340 1,308 1,282 +26
Power Systems 2,720 2,831 -111 253 294 -41
Marine 1,709 2,037 -328 138 233 -95 Nuclear 684 667 +17 48 10 +38
Intra-segment (155) (147) -8 (13) 2 -15
Land & Sea Division (excluding Energy) 4,958 5,388 -430 426 539 -113
Energy 724 871 -147 (3) 64 -67 Land & Sea Division 5,682 6,259 -577 423 603 -180
Central costs (53) (54) +1
Group (excluding Energy) 13,864 14,634 -770 1,681 1,767 -86
Group 14,588 15,505 -917 1,678 1,831 -153
Underlying revenue reduced £0.9 billion to £14.6 billion, a reduction of 6%, of which 3% is due to adverse year-on-year foreign exchange (FX) rate movements. The remaining reduction reflects a 5% decline in original equipment (OE) revenue and a 1% decline in services revenue. Underlying services revenue continues to represent around half (48%) of the Group’s underlying revenue. Group services revenue included increases in Defence aerospace and Power Systems offset by reductions in our Marine and Nuclear & Energy businesses.
Underlying profit before financing and taxation reduced 8% to £1.7 billion, including a 3% impact from FX translation. The reduction is largely due to higher restructuring charges in 2014 to accelerate our progress on cost reductions, a one-off product rectification charge in Marine, higher R&D spend, and the impact of lower revenue.
Underlying financing costs reduced by 15% to £61 million reflecting reduced financial Risk and Revenue
Sharing Arrangements (RRSA) liabilities and other improvements.
Underlying taxation was £387 million, an underlying tax rate of 23.9% compared with 24.7% in 2013.
Underlying EPS was marginally lower at 65.31p, with the impact of the lower underlying profit after tax largely offset by the improvement in the underlying tax rate and a lower non-controlling interest in Power Systems, following Daimler’s exercise of the put option in April 2014.
At the Annual General Meeting on 8 May 2015, the directors will recommend an issue of 141 C Shares with a total nominal value of 14.1 pence for each ordinary share. Together with the interim issue on 2 January 2015 of 90 C Shares for each ordinary share with a total nominal value of 9.0 pence, this is the equivalent of a total annual payment to ordinary shareholders of 23.1 pence for each ordinary share. Further details are on
page 36.
Net underlying R&D charged to the income statement increased by 21% to £755 million, reflecting a combination of increased net investment of £98 million and lower net capitalisation of £21 million (due to the phasing of major new programmes, in particular the certification of the Trent XWB-84) and £12 million lower net deferral of RRSA entry fees (note 3). The net investment represents 5.8% of Group underlying revenue, although it is expected that this will reduce slightly in the future towards the longer-term target of around 5%. Our gross R&D expenditure of £1.2 billion includes funded programmes.

16
Reported results
£million 2014 2013
Underlying profit before tax 1,617 1,759
Mark-to-market adjustments on derivatives (1,254) 217
Movements on other financial instruments (87) (251)
Effects of acquisition accounting (142) (265)
Exceptional restructuring (39)
Acquisitions and disposals 8 335
Post-retirement schemes (29) (90)
Other (including discontinued operations) (7) (5)
Reported profit before tax (2013 restated to exclude discontinued operations) 67 1,700
Consistent with past practice and IFRS, the Group provides both reported and underlying figures. We believe underlying figures are more representative of the trading performance, by excluding the impact of year-end mark-to-market adjustments, principally the GBP:USD hedge book. In addition, post-retirement financing and the effects of acquisition accounting are excluded. The adjustments between the underlying income statement and the reported income statement are set out in more detail in note 2 to the Condensed Financial Statements. This basis of presentation has been applied consistently.
The mark-to-market adjustments are principally driven by movements in the GBP:USD exchange rate which moved from 1.65 to 1.56 during 2014.
Movement on other financial instruments primarily relate to the change in value of the put option on the RRPS non-controlling interest, which has now been exercised.
The effects of acquisition accounting in accordance with IFRS 3 are excluded from underlying profit so that all businesses are measured on an equivalent basis.
Costs associated with the substantial closure or exit of a site, facility or activity are classified as exceptional restructuring and excluded.
Profits and losses arising on acquisitions and disposals during the year are excluded.
Net financing on post-retirement schemes is excluded from underlying profit and, in 2013, the cost of
providing a discretionary increase to pensions was also excluded.
Appropriate tax rates are applied to these adjustments, the net effect of which was an increase of £241 million reduction in the reported tax charge (2013 £54 million reduction). The adjustment also includes a £64 million reduction in the value of recoverable advance corporation tax recognised.

17
Summary balance sheet
£million 2014 Other
movements Energy
disposal 2013
Intangible assets 4,804 (77) (106) 4,987
Property, plant and equipment 3,446 241 (187) 3,392 Joint ventures and associates 539 (6) (56) 601
Net working capital (1,134) 229 (393) (970)
Net funds 666 (1,269) (4) 1,939
Provisions (807) (108) 34 (733) Net post-retirement scheme deficits 555 1,348 - (793)
Net financial assets and liabilities (855) 732 - (1,587)
Other net assets and liabilities (827) (294) - (533)
Net assets 6,387 796 (712) 6,303
Other items
US$ hedge book (US$ billion) 25.6 24.7
TotalCare assets 2,492 1,901
TotalCare liabilities 1 (687) (559)
Net TotalCare assets 1,805 1,342
Customer financing contingent commitments: Gross 388 356
Net 59 59 1 2013 includes £245m of liabilities not previously included in the TotalCare balance.
Intangible assets (note 7) represent long‑term assets of the Group. These assets decreased by £77 million
with additional development, contractual aftermarket rights, certification and software costs being offset by annual amortisation charges.
The carrying values of the intangible assets are assessed for impairment against the present value of forecast cash flows generated by the intangible asset. The principal risks remain: reductions in assumed market share; programme timings; increases in unit cost assumptions; and adverse movements in discount rates. There have been no significant impairments in 2014.
Property, plant and equipment (note 8) increased by £241 million due to the ongoing development and
refreshment of facilities and tooling as the Group prepares for increased production volumes.
Net post-retirement scheme surpluses/(deficits) (note 11) increased by £1,348 million, principally due to relative movements in the yield curves used to value the underlying assets and liabilities in accordance with IAS 19. In addition, the scheme rules on the largest UK scheme were amended during the year, resulting in a surplus being recognised (£544 million impact).
The Group’s principal pension schemes adopt a low risk investment strategy that reduces volatility going forward and enables the funding position to remain stable: interest rate and inflation risks are largely hedged and the exposure to equities is around 8% of scheme assets.
Investments in joint ventures and associates remained stable as the share of retained profit was offset by dividends received.
Provisions largely relate to warranties and guarantees provided to secure the sale of OE and services. The increase is largely a result of the recognition of restructuring costs.
Net financial assets and liabilities (note 9) include the fair value of derivatives, financial RRSAs, the put option on the non-controlling interest of Power Systems and C Shares. The reduction primarily reflects the settlement of the put option (£1,937 million) offset by a reduction in value of the foreign exchange derivatives (£1,137 million) due to the strengthening of the US dollar.
The USD hedge book increased by 4% to US$25.6 billion. This represents around four and a half years of net
exposure and has an average book rate of £1 to US$1.61.
Net TotalCare® assets relate to long-term service agreement (LTSA) contracts in the Civil aerospace business, including the flagship services product TotalCare. These assets represent the timing difference between the recognition of income and costs in the income statement and cash receipts and payments.
The increase largely reflects high levels of linked Trent 700 and increasing Trent 1000 engine sales in the year.
Customer financing facilitates the sale of OE and services by providing financing support to certain customers. Where such support is provided by the Group, it is almost exclusively to customers of the Civil aerospace business and takes the form of various types of credit and asset value guarantees. These exposures produce contingent liabilities that are outlined in note 12. The contingent liabilities represent the maximum aggregate

18
discounted gross and net exposure in respect of delivered aircraft, regardless of the point in time at which such exposures may arise.
During 2014, the Group’s gross exposure on delivered aircraft increased by £32 million, due largely to the strengthening of the US dollar. On a net basis, exposures remained unchanged with a small reduction being offset by the exchange rate movement.
Summary funds flow
£million 2014 2013 Change
Opening net funds 1,939 1,317 Closing net funds 666 1,939
Change in net funds (1,273) 622
Underlying profit before tax 1,617 1,759 (142)
Depreciation and amortisation 600 608 (8)
Movement in net working capital (509) 91 (600) Expenditure on property, plant and equipment and intangible assets (1,114) (1,172) 58
Other 88 (231) 319
Trading cash flow 682 1,055 (373)
Contributions to defined benefit post-retirement schemes in excess of PBT charge (152) (36) (116)
Tax (276) (238) (38)
Free cash flow 254 781 (527) Shareholder payments (482) (417) (65)
Share buyback (69) (69)
Acquisitions and disposals (965) 265 (1,230)
Net funds of businesses acquired (30) 36 (66) Foreign exchange 19 (43) 62
Change in net funds (1,273) 622
Average net funds (38) 350 (388)
Movement in working capital – the increase includes an increase in the net TotalCare asset and a net reduction in the amount of customer deposits. This increase compares to a modest decrease in the previous year which is primarily a result of the phasing of customer deposit utilisation.
Expenditure on property, plant and equipment and intangibles – the decrease reflects a reduction in additions to property, plant and equipment (£32 million), participation fees and certification costs (£26 million) and software and other intangible assets (£41 million), offset by increased expenditure on contractual aftermarket rights (£41 million).
Pensions – contributions to defined benefit pension schemes in 2014 included £33 million to UK schemes to fund the discretionary increases agreed in 2013. The service cost included a past-service credit of £31 million – largely relating to restructuring (2013 past-service cost £71 million – largely relating to the discretionary increases above), which is the main reason for the £116 million increase in the increase in the cash contributions in excess of the PBT charge.
The Group’s funding of its defined benefit schemes is expected to reduce by around 30% in 2015, as a result of deficit funding requirements ending and the non-recurrence of the payment for discretionary increases.
Shareholder payments – the increase reflects the C Share issues in 2014 (£51 million increase) and the
Power Systems dividend to Daimler AG (£14 million increase).
Acquisitions and disposals include the payment of £2,013 million (including the fair value of derivatives held to hedge the cost) for the additional 50% of RRPS offset by £1,027 million of net proceeds from the disposal of the Energy business.

19
Condensed consolidated income statement For the year ended 31 December 2014
*Re-presented
2014 2013 Notes £m £m
Continuing operations Revenue 2 13,736 14,642
Cost of sales (10,533) (11,482)
Gross profit 3,203 3,160
Other operating income 3 10 65
Commercial and administrative costs (1,124) (1,237) Research and development costs 3 (793) (658)
Share of results of joint ventures and associates 94 149
Operating profit 1,390 1,479
Profit on acquisition/reclassification of joint ventures 2 119
Profit on disposal of businesses 6 216
Profit before financing and taxation 2 1,398 1,814
Financing income 121 327 Financing costs (1,452) (440)
Net financing 4 (1,331) (114)
Profit before taxation 1 67 1,700
Taxation (151) (377)
Profit for the year from continuing operations (84) 1,323
Discontinued operations
Profit for the year ordinary activities 2 4 56
Profit on disposal 13 138
Profit for the year from discontinued operations 142 56
Profit for the year 58 1,379
Attributable to:
Ordinary shareholders 69 1,367
Non-controlling interests (11) 12
Profit for the year 58 1,379
* Re-presented to reflect Energy as a discontinued operation
Earnings per ordinary share attributable to shareholders
2 5
From continuing operations Basic (3.90)p 70.26p
Diluted (3.90)p 69.48p
From continuing and discontinued operations
Basic 3.68p 73.26p Diluted 3.68p 72.44p
Payments to ordinary shareholders in respect of the year
Per share 23.1p 22.0p
Total (£m) 435 414 1
Underlying profit before taxation 1,617 1,759 2 Underlying earnings per share are shown in note 4
Condensed consolidated statement of comprehensive income For the year ended 31 December 2014
2014 2013 £m £m
Profit for the year 58 1,379 Other comprehensive income (OCI) Items that will not be reclassified to profit or loss
Movements in post-retirement schemes 1,192 48
Related tax movements (431) 10
761 58
Items that may be reclassified to profit or loss Foreign exchange translation differences on foreign operations (158) (64)
Reclassified to income statement on disposal of business (29)
Share of OCI of joint ventures and associates (13) (6)
Related tax movements (2) 1
(202) (69)
Total comprehensive income for the year 617 1,368
Attributable to:
Ordinary shareholders 650 1,356
Non-controlling interests (33) 12
Total comprehensive income for the year 617 1,368

20
Condensed consolidated balance sheet At 31 December 2014
2014 2013 Notes £m £m
ASSETS Non-current assets
Intangible assets 7 4,804 4,987
Property, plant and equipment 8 3,446 3,392
Investments – joint ventures and associates 539 601 Investments – other 31 27
Other financial assets 9 107 674
Deferred tax assets 369 316
Post-retirement scheme surpluses 11 1,740 248
11,036 10,245
Current assets Inventories 2,768 3,319
Trade and other receivables 5,509 5,092
Taxation recoverable 19 16
Other financial assets 9 22 74 Short-term investments 7 321
Cash and cash equivalents 2,862 3,990
Assets held for sale 1 6
11,188 12,818
Total assets 22,224 23,063
LIABILITIES Current liabilities Borrowings 10 (68) (207)
Other financial liabilities 9 (209) (1,976)
Trade and other payables (6,791) (7,045)
Current tax liabilities (184) (204) Provisions for liabilities and charges (433) (348)
(7,685) (9,780)
Non-current liabilities
Borrowings 10 (2,193) (2,164)
Other financial liabilities 9 (717) (360)
Trade and other payables (2,445) (2,138) Non-current tax liabilities (10) (10)
Deferred tax liabilities (1,228) (882)
Provisions for liabilities and charges (374) (385)
Post-retirement scheme deficits 11 (1,185) (1,041)
(8,152) (6,980)
Total liabilities (15,837) (16,760)
Net assets 6,387 6,303
EQUITY Equity attributable to ordinary shareholders Called-up share capital 376 376
Share premium account 179 80
Capital redemption reserve 159 163
Cash flow hedging reserve (81) (68) Other reserves 78 250
Retained earnings 5,671 4,804
6,382 5,605
Non-controlling interests 5 698
Total equity 6,387 6,303

21
Condensed consolidated cash flow statement For the year ended 31 December 2014
2014 2013 Notes £m £m
Reconciliation of cash flows from operating activities Operating profit from continuing operations 1,390 1,479
Operating profit from discontinued operations 2 (1) 56
Operating profit 1,389 1,535
Profit on disposal of property, plant and equipment (3) 7
Share of results of joint ventures and associates (94) (160) Dividends received from joint ventures and associates 73 99
Return of capital from joint venture 3
Gain on consolidation of previously non-consolidated subsidiary (3)
Amortisation and impairment of intangible assets 367 428 Depreciation and impairment of property, plant and equipment 375 372
Increase/(decrease) in provisions 129 (17)
Decrease in inventories 166 119
(Increase) in trade and other receivables (878) (533) Increase in trade and other payables 214 376
Cash flows in other financial assets and liabilities held for operating purposes (30) 9
Net defined benefit post-retirement cost/(credit) recognised in operating profit 170 279
Cash funding of defined benefit post-retirement schemes (322) (315) Share-based payments 21 79
Net cash inflow from operating activities before taxation 1,577 2,278
Taxation paid (276) (238)
Net cash inflow from operating activities 1,301 2,040
Cash flows from investing activities
Additions of unlisted investments (11) (1) Disposals of unlisted investments - 1
Additions of intangible assets (477) (503)
Disposals of intangible assets Purchases of property, plant and equipment (648) (669)
Government grants received 11 21
Disposals of property, plant and equipment 65 7
Acquisitions of businesses (net of cash acquired) (3) (37) Acquisition of non-controlling interest 9 (1,937)
Reclassification of joint ventures to subsidiaries 245
Acquisition of preference shares in subsidiary (34)
Disposal of discontinued operations 13 1,027 Disposals of businesses 13 24 273
Investments in joint ventures and associates (17) (43)
Net cash outflow from investing activities (1,966) (740)
Cash flows from financing activities
Repayment of loans (233) (133) Proceeds from increase in loans and finance leases 49 1,013
Net cash flow from (decrease)/increase in borrowings and finance leases (184) 880
Interest received 18 15
Interest paid (63) (58)
Decrease/(increase) in short-term investments 313 (313) Issue of ordinary shares 1 32
Purchase of ordinary shares – share buyback (69)
Purchase of ordinary shares – other (2) (3) Dividends paid to NCI (76) (60)
Redemption of C Shares (406) (357)
Net cash outflow from financing activities (468) 136
Net increase in cash and cash equivalents (1,133) 1,436 Cash and cash equivalents at 1 January 3,987 2,585 Exchange gains/( losses) on cash and cash equivalents 8 (34)
Cash and cash equivalents at 31 December 2,862 3,987

22
2014 2013 £m £m
Reconciliation of movements in cash and cash equivalents to movements in net funds
(Decrease)/increase in cash and cash equivalents (1,133) 1,436
Net cash flow from decrease/(increase) in borrowings 184 (880) Cash outflow from (decrease)/increase in short-term investments (313) 313
Change in net funds resulting from cash flows (1,262) 869
Net funds (excluding cash and cash equivalents) of businesses acquired (30) (204)
Exchange gains/(losses) on net funds 19 (43)
Fair value adjustments (59) 105
Movement in net funds (1,332) 727
Net funds at 1 January excluding the fair value of swaps 1,940 1,213
Net funds at 31 December excluding the fair value of swaps 608 1,940 Fair value of swaps hedging fixed rate borrowings 58 (1)
Net funds at 31 December 666 1,939
The movement in net funds (defined by the Group as including the items shown below) is as follows:
At 1 January
2014 Funds
flow
Net funds of business
acquired/ disposed
Exchange differences
Fair value adjustments
Reclass-ifications
At 31 December
2014
£m £m £m £m £m £m £m
Cash at bank and in hand 982 (228) (15) 739
Money market funds 1,157 (470) 5 692
Short-term deposits 1,851 (438) 18 1,431
Overdrafts (3) 3 -
Cash and cash equivalents 3,987 (1,133) 8 2,862
Short-term investments 321 (313) (1) 7
Current borrowings excluding overdrafts (204) 229 (30) (2) (60) (67)
Non-current borrowings (2,163) (3) 14 (57) 60 (2,149)
Finance leases (1) (42) (2) (45)
Net funds excluding fair value of swaps 1,940 (1,262) (30) 19 (59) 608
Fair value of swaps hedging fixed rate borrowings (1) 59 58
Net funds 1,939 (1,262) (30) 19 666

23
Condensed consolidated statement of changes in equity For the year ended 31 December 2014
Attributable to ordinary shareholders
Share
capital Share
premium
Capital redemption
reserve
Cash flow
hedging reserve
Other
reserves1
Retained earnings
2 Total
Non-controlling
interests Total
equity
£m £m £m £m £m £m £m £m £m
At 1 January 2013 374 - 169 (63) 314 5,185 5,979 17 5,996
Profit for the year 1,367 1,367 12 1,379 Foreign exchange translation differences on foreign operations (64) (64) (64)
Movement on post-retirement schemes 48 48 48
Share of OCI of joint ventures and associates (5) (1) (6) (6)
Related tax movements 1 10 11 11
Total comprehensive income for the year (5) (64) 1,425 1,356 12 1,368
Arising on issues of ordinary shares 2 80 (81) 1 1
Issue of C Shares (366) 3 (363) (363)
Redemption of C Shares 360 (360)
Ordinary shares purchased (3) (3) (3)
Share-based payments – direct to equity 3 99 99 99
Reclassification of RRPS AG 4 669 669
Transactions with NCI5 (45) (45)
Initial recognition of put option on NCI 5 (1,477) (1,477) 45 (1,432)
Related tax movements – deferred tax 13 13 13
Other changes in equity in the year 2 80 (6) (1,806) (1,730) 669 (1,061)
At 1 January 2014 376 80 163 (68) 250 4,804 5,605 698 6,303
Profit for the year - 69 69 (11) 58
Foreign exchange translation differences on foreign operations
(141) (141)
(17) (158)
Reclassification to income statement on disposal of businesses
(29) (29)
(29)
Movement on post-retirement schemes 1,199 1,199 (7) 1,192
Share of OCI of joint ventures and associates (13) (13) (13)
Related tax movements - (2) (433) (435) 2 (433)
Total comprehensive income for the year (13) (172) 835 650 (33) 617
Arising on issues of ordinary shares 2 99 (100) 1 1
Issue of C Shares (414) 2 (412) (412)
Redemption of C Shares 408 (408) -
Purchase of ordinary shares – share buyback6 (69) (69) (69)
Ordinary shares cancelled 6 (2) 2
Purchase of ordinary shares – other (2) (2) (2)
Share-based payments – direct to equity 3 29 29 29
Transactions with NCI – purchase of NCI shareholding 584 584 (584)
Dividends paid to NCI (76) (76)
Related tax movements (4) (4) (4)
Other changes in equity in the year 99 (4) 32 127 (660) (533)
At 31 December 2014 376 179 159 (81) 78 5,671 6,382 5 6,387
1 Other reserves include a merger reserve of £3m (2013: £3m; 2012: £3m) and a translation reserve of £75m (2013: £247m; 2012: £311m). 2 At 31 December 2014, 14,561,097 ordinary shares with a net book value of £91m (2013 11,960,535, 2012 20,365,787 ordinary shares with net book values
of £91m and £125m respectively) were held for the purpose of share -based payment plans and included in retained earnings. During the year, 7,770,113 ordinary shares with a net book value of £64m (2013 16,603,840 shares with a net book value of £118m) vested in share-based payment plans. During the year the Company acquired 169,404 of its ordinary shares via reinvestment of dividends received on its own shares. In addition, the Company issued 10,200,000 (2013 7,900,000) new ordinary shares to the Group’s share trust for its employees share-based payment plans with a net book value of £100m (2013 £81m).
3 Share-based payments – direct to equity is the net of the credit to equity in respect of the share-based payment charge to the income statement and the
actual cost of shares vesting, excluding those vesting from own shares. 4 As part of the RRPSH shareholders' agreement, Daimler has the option to sell its shares in RRPSH to Rolls-Royce for a period of six years from 1 January
2013. The initial fair value of the exercise price of this option in respect of Bergen Engines AS (£166m) was recognised in 2012 and the amount in respect of RRPS (£1,432m) was recognised in 2013 and charged to retained earnings. In addition, £45m of the initial recognition of the put option on NCI relating to Bergen Engines AS, recognised in 2012, was reclassified from NCI to retained earnings. Subsequent movements in the value of the liability are included in the income statement but excluded from the underlying results.
5 On 1 January 2013, the Group exercised rights that resulted in Rolls-Royce Power Systems AG (RRPS AG) being classified as a subsidiary and consolidated.
6 Following the completion of the sale of the Energy business to Siemens on 1 December 2014 and further to the announcement on 19 June 2014 of a £1bn share buyback, on 10 December 2014 the Company put in place a £250m programme to enable the purchase of its ordinary shares. The aim of the buyback is to reduce the issued share capital of the Company, helping enhance returns for shareholders. In the period to 31 December 2014, 8,215,000 shares were purchased at an average price of 840p. These shares were cancelled.

24
1 Basis of preparation
These condensed financial statements have been prepared in accordance with International Financial Reporting Standards (IFRS) adopted for use in the EU (Adopted IFRS) in accordance with EU law (IAS Regulation EC 1606/2002).
The financial information set out above does not constitute the Company's statutory accounts for the year ended 31 December 2014, but is derived from those accounts. Statutory accounts for Rolls-Royce Holdings plc for the year ended 31 December 2013 have been delivered to the Registrar of Companies. Statutory accounts for the year ended 31 December 2014 will be delivered to the Registrar of Companies following the Company’s Annual General Meeting. The auditors have reported on those accounts; their reports were (i) unqualified, (ii) did not include references to any matters to which the auditors drew attention by way of emphasis without qualifying their reports and (iii) did not contain statements under section 498(2) or (3) of the Companies Act 2006.
With effect from 1 January 2014, the Group has adopted IFRS 10 Consolidated Financial Statements, IFRS 11 Joint Arrangements and IFRS 12 Disclosure of Interests in Other Entities. The principal potential effect was that certain entities previously classified as joint ventures might be classified as joint operations, requiring the Group’s share of the individual assets and liabilities of these entities to be included in the financial statements rather than the equity accounting method previously applied. The Group has reviewed its material joint ventures and has concluded that none are to be classified as joint operations under the requirements of IFRS 11. Disclosures required by IFRS 12 are included in the statutory accounts.

25
2 Analysis by business segment
The analysis by Divisions (business segment) is presented in accordance with IFRS 8 Operating segments, on the basis of those segments whose operating results are regularly reviewed by the Board (the Chief Operating Decision Maker as defined by IFRS 8).
Aerospace Division Civil development, manufacture, marketing and sales of commercial aero engines and aftermarket
services. Defence development, manufacture, marketing and sales of military aero engines and aftermarket services. Land & Sea Division
Power Systems development, manufacturing, marketing and sales of diesel engines and power systems. Marine development, manufacture, marketing and sales of marine-power propulsion systems and
aftermarket services. Nuclear & Energy development, manufacture, marketing and sales of nuclear systems for civil power generation and
naval propulsion systems and power systems for the offshore oil and gas industry and electrical power generation and aftermarket services. The Energy business was sold on 1 December 2014 and has been treated a discontinued operation – see note 11.
The operating results are prepared on an underlying basis, which the Board considers reflects better the economic substance of the Group’s trading during the year. The principles adopted to determine the underlying results are:
Underlying revenues – Where revenues are denominated in a currency other than the functional currency of the Group undertaking, these reflect the achieved exchange rates arising on settled derivative contracts.
Underlying profit before financing – Where transactions are denominated in a currency other than the functional currency of
the Group undertaking, this reflects the transactions at the achieved exchange rates on settled derivative contracts. In addition, adjustments have been made to exclude one-off past-service credits on post-retirement schemes, exceptional restructuring and the effect of acquisition accounting.
Underlying profit before taxation – In addition to those adjustments in underlying profit before financing:
Include amounts realised from settled derivative contracts and revaluation of relevant assets and liabilities to exchange rates forecast to be achieved from future settlement of derivative contracts.
Exclude unrealised amounts arising from revaluations required by IAS 39 Financial Instruments: Recognition and Measurement, changes in value of financial RRSA contracts arising from changes in forecast payments, changes in the
value of put options on NCI and the net impact of financing costs related to post-retirement scheme benefits.
Taxation – the tax effect of the adjustments above are excluded from the underlying tax charge. In addition changes in the amount of recoverable advance corporation tax recognised that arises from the above adjustments are also excluded.
This analysis also includes a reconciliation of the underlying results to those reported in the consolidated income statement.
Underlying revenues 2014 2013
Original
equipment Aftermarket Total Original
equipment Aftermarket Total £m £m £m £m £m £m
Civil 3,265 3,572 6,837 3,035 3,620 6,655 Defence 816 1,253 2,069 1,385 1,206 2,591
Aerospace Division
4,081 4,825 8,906
4,420 4,826 9,246
Power Systems 1,893 827 2,720 2,004 827 2,831
Marine 1,070 639 1,709 1,288 749 2,037
Nuclear & Energy 556 852 1,408 565 973 1,538
Intra-segment (78) (77) (155) (72) (75) (147)
Land & Sea Division 3,441 2,241 5,682 3,785 2,474 6,259
7,522 7,066 14,588 8,205 7,300 15,505
Underlying profit before financing and taxation 2014 2013
£m £m
Civil 942 844
Defence 366 438
Aerospace Division 1,308 1,282
Power Systems 253 294
Marine 138 233 Nuclear & Energy 45 74
Intra-segment (13) 2
Land & Sea Division 423 603
Reportable segments 1,731 1,885
Central items (53) (54)
Underlying profit before financing and taxation 1,678 1,831
Underlying net financing (61) (72)
Underlying profit before taxation 1,617 1,759 Underlying taxation (387) (434)
Underlying profit for the year 1,230 1,325

26
Net assets/(liabilities) Total assets Total liabilities Net assets
2014 2013 2014 2013 2014 2013 £m £m £m £m £m £m
Civil 10,775 10,082 (7,418) (6,243) 3,357 3,839
Defence 1,473 1,454 (1,743) (1,660) (270) (206)
Aerospace 12,248 11,536 (9,161) (7,903) 3,087 3,633
Power Systems 3,588 3,956 (1,100) (3,034) 2,488 922
Marine 1,641 1,706 (1,075) (985) 566 721 Nuclear & Energy 961 1,671 (880) (1,015) 81 656
Intra-segment (22) (10) (22) (10)
Land & Sea 6,168 7,323 (3,055) (5,034) 3,113 2,289
Inter-segment (1,269) (734) 1,269 733 (1)
Reportable segments 17,147 18,125 (10,947) (12,204) 6,200 5,921
Net funds/(debt) 2,949 4,358 (2,283) (2,419) 666 1,939
Tax assets/(liabilities) 388 332 (1,422) (1,096) (1,034) (764) Net post-retirement scheme surpluses/(deficits) 1,740 248 (1,185) (1,041) 555 (793)
Net assets 22,224 23,063 (15,837) (16,760) 6,387 6,303
Group employees (average during the year) 2014 2013
Civil 23,900 23,400 Defence 7,000 7,900
Aerospace Division 30,900 31,300
Power Systems 10,700 10,700
Marine 6,400 6,900
Nuclear & Energy 6,100 6,300
Land & Sea Division 23,200 23,900
54,100 55,200
Reconciliation to reported results Total
reportable segments
Underlying central
items
Total
underlying Underlying
adjustments
Discontinued operations
Group Year ended 31 December 2014 £m £m £m £m £m £m
Revenue from sale of original equipment 7,522 7,522 61 (283) 7,300
Revenue from aftermarket services 7,066 7,066 (200) (430) 6,436
Total revenue 14,588 14,588 (139) (713) 13,736
Operating profit excluding share of results of joint ventures and associates 1,622 (53)
1 1,569 (274) 1 1,296
Share of results of joint ventures and associates 109 109 (13) (2) 94
Profit on reclassification of joint ventures to subsidiaries 2 2
Profit on disposal of businesses 6 6
Profit before financing and taxation 1,731 (53) 1,678 (279) (1) 1,398
Net financing (61) (61) (1,270) (1,331)
Profit before taxation (114) 1,617 (1,549) (1) 67
Taxation (387) (387) 239 (3) (151)
Profit for the year from continuing operations 1,226 (1,310) (84)
Profit for the year from discontinued operations 4 138 142
Profit for the year 1,230 (1,310) 138 58
Attributable to ordinary shareholders 1,224 (1,293) 138 69
Attributable to non-controlling interests 6 (17) (11)
Year ended 31 December 2013
Revenue from sale of original equipment 8,205 8,205 70 (328) 7,947
Revenue from aftermarket services 7,300 7,300 (62) (543) 6,695
Total revenue 15,505 15,505 8 (871) 14,642
Operating profit excluding share of results of joint ventures and associates
1,726 (54)1
1,672 (297) (45)
1,330
Share of results of joint ventures and associates 159 159 1 (11) 149
Profit on transfer of joint ventures to subsidiaries 119 119
Profit on disposal of businesses 216 216
Profit before financing and taxation 1,885 (54) 1,831 39 (56) 1,814
Net financing (72) (72) (39) (3) (114)
Profit before taxation (126) 1,759 (59) 1,700
Taxation (434) (434) 54 3 (377)
Profit for the year from continuing operations 1,269 54 1,323
Profit for the year from discontinued operations 56 56
Profit for the year 1,325 54 1,379
Attributable to ordinary shareholders 1,224 143 1,367
Attributable to non-controlling interests 101 (89) 12 1 Central corporate costs
27
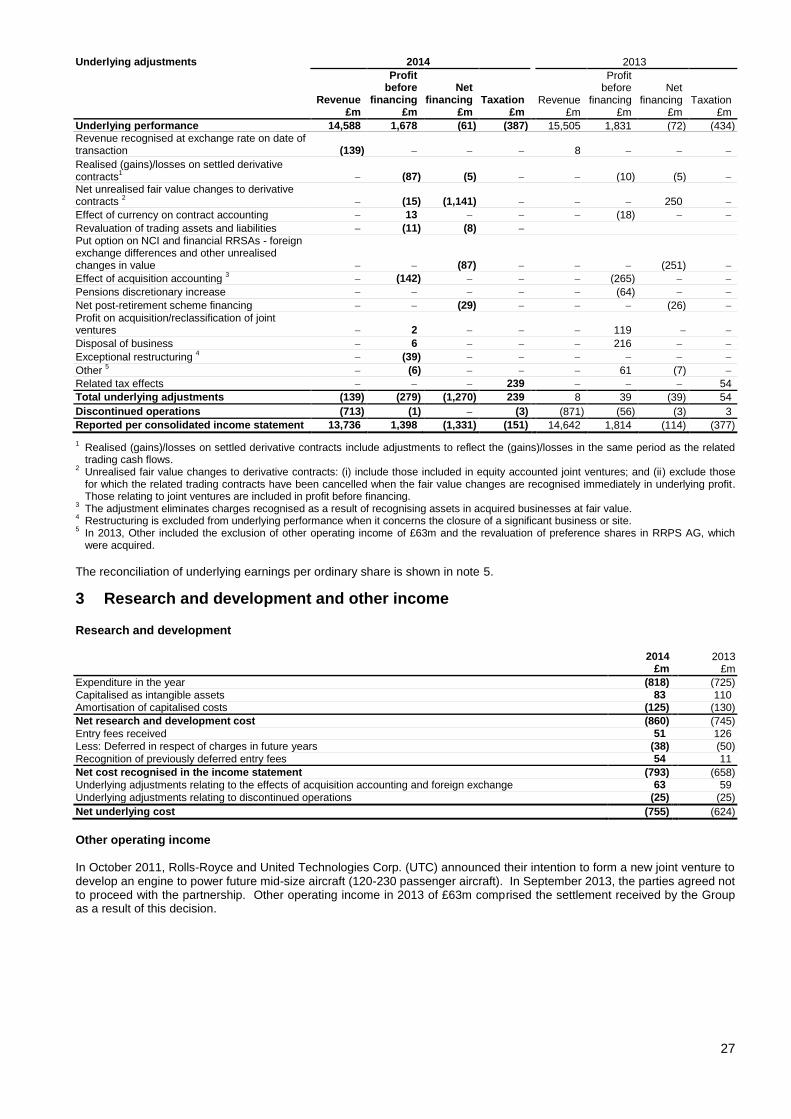
Underlying adjustments 2014 2013
Revenue
Profit before
financing Net
financing Taxation Revenue
Profit before
financing Net
financing Taxation £m £m £m £m £m £m £m £m
Underlying performance 14,588 1,678 (61) (387) 15,505 1,831 (72) (434) Revenue recognised at exchange rate on date of transaction (139) 8
Realised (gains)/losses on settled derivative contracts
1 (87) (5) (10) (5)
Net unrealised fair value changes to derivative contracts
2 (15) (1,141) 250
Effect of currency on contract accounting 13 (18)
Revaluation of trading assets and liabilities (11) (8) Put option on NCI and financial RRSAs - foreign exchange differences and other unrealised changes in value (87) (251)
Effect of acquisition accounting 3 (142) (265)
Pensions discretionary increase (64)
Net post-retirement scheme financing (29) (26)
Profit on acquisition/reclassification of joint ventures 2 119
Disposal of business 6 216
Exceptional restructuring 4 (39)
Other 5 (6) 61 (7)
Related tax effects 239 54
Total underlying adjustments (139) (279) (1,270) 239 8 39 (39) 54
Discontinued operations (713) (1) (3) (871) (56) (3) 3
Reported per consolidated income statement 13,736 1,398 (1,331) (151) 14,642 1,814 (114) (377)
1 Realised (gains)/losses on settled derivative contracts include adjustments to reflect the (gains)/losses in the same period as the related trading cash flows.
2 Unrealised fair value changes to derivative contracts: (i) include those included in equity accounted joint ventures; and (ii) exclude those for which the related trading contracts have been cancelled when the fair value changes are recognised immediately in underlying profit. Those relating to joint ventures are included in profit before financing.
3 The adjustment eliminates charges recognised as a result of recognising assets in acquired businesses at fair value.
4 Restructuring is excluded from underlying performance when it concerns the closure of a significant business or site.
5 In 2013, Other included the exclusion of other operating income of £63m and the revaluation of preference shares in RRPS AG, which were acquired.
The reconciliation of underlying earnings per ordinary share is shown in note 5.
3 Research and development and other income
Research and development
2014 2013 £m £m
Expenditure in the year (818) (725)
Capitalised as intangible assets 83 110 Amortisation of capitalised costs (125) (130)
Net research and development cost (860) (745)
Entry fees received 51 126
Less: Deferred in respect of charges in future years (38) (50)
Recognition of previously deferred entry fees 54 11
Net cost recognised in the income statement (793) (658) Underlying adjustments relating to the effects of acquisition accounting and foreign exchange 63 59
Underlying adjustments relating to discontinued operations (25) (25)
Net underlying cost (755) (624)
Other operating income
In October 2011, Rolls-Royce and United Technologies Corp. (UTC) announced their intention to form a new joint venture to develop an engine to power future mid-size aircraft (120-230 passenger aircraft). In September 2013, the parties agreed not to proceed with the partnership. Other operating income in 2013 of £63m comprised the settlement received by the Group as a result of this decision.

28
4 Net financing
2014 2013
Per consolidated
income statement
Underlying financing
1
Per consolidated
income statement
Underlying financing
1
£m £m £m £m
Financing income
Interest receivable 17 17 15 15
Fair value gains on foreign currency contracts 2 287 Put option on NCI and financial RRSAs - foreign exchange differences and other changes in unrealised values 89 8
Expected return on post-retirement scheme surpluses 13 17
121 17 327 15
Financing costs
Interest payable (63) (63) (58) (58)
Fair value losses on foreign currency contracts (1,127) (3)
Financial charge relating to financial RRSAs (7) (5) (9) (9)
Put option on NCI and financial RRSAs - foreign exchange differences and other changes in unrealised values (174) (259)
Fair value losses on commodity derivatives (15) (34)
Interest on post-retirement scheme liabilities (42) (43)
Net foreign exchange losses (13) (5)
Other financing charges (11) (10) (30) (20)
(1,452) (78) (441) (87)
Net financing (1,331) (61) (114) (72)
Analysed as:
Net interest payable (46) (46) (43) (43)
Net post-retirement scheme financing (29) (26) Net other financing (1,256) (15) (45) (29)
Net financing (1,331) (61) (114) (72) 1 See note 2
5 Earnings per ordinary share (EPS)
Basic earnings per ordinary share (EPS) are calculated by dividing the profit attributable to ordinary shareholders by the weighted average number of ordinary shares in issue during the year, excluding ordinary shares held under trust, which have been treated as if they had been cancelled.
Diluted EPS are calculated by adjusting the weighted average number of ordinary shares in issue during the year for the bonus element of share options.
2014 2013
Basic
Potentially dilutive share
options Diluted 1 Basic
Potentially dilutive share
options Diluted
Profit attributable to ordinary shareholders (£m)
Continuing operations (73) (73) 1,311 1,311
Discontinued operations 142 142 56 56
69 69 1,367 1,367
Weighted average number of ordinary shares (m) 1,874 18 1,892 1,866 21 1,887
EPS (pence)
Continuing operations (3.90)p (3.90)p 70.20p (0.78p) 69.48p
Discontinued operations 7.58p 7.58p 3.00p (0.04p) 2.96p
3.68p 3.68p 73.26p (0.82p) 72.44p 1 As there is a loss on continuing operations, the effect of potentially dilutive ordinary shares is anti-dilutive.
The reconciliation between underlying EPS and basic EPS is as follows:
2014 2013
Pence £m Pence £m
Underlying EPS/Underlying profit attributable to ordinary shareholders 65.31 1,224 65.59 1,224
Total underlying adjustments to profit before tax (note 2) (82.65) (1,549)
Related tax effects 12.75 239 2.89 54
Profit on disposal of discontinued operations 7.36 138
Related NCI effects 0.91 17 4.78 89
EPS/Profit attributable to ordinary shareholders 3.68 69 73.26 1,367

29
6 Payments to shareholders in respect of the year
Payments to shareholders in respect of the year represent the value of C Shares to be issued in respect of the results for the year. Issues of C Shares were declared as follows:
2014 2013
Pence
per share £m Pence
per share £m
Interim (issued in January) 9.0p 170 8.60 162 Final (issued in July) 14.1 265 13.40 252
23.1 435 22.00 414
7 Intangible assets
Goodwill
Certification costs and
participation fees
Development expenditure
Contractual aftermarket
rights Customer
relationships Software Other
Total
£m £m £m £m £m £m £m £m
Cost:
At 1 January 2014 1,861 928 1,646 551 475 453 532 6,446
Reclassifications (8) - 4 11 19 (28) (2)
Exchange differences (112) (8) (43) (17) (1) (28) (209)
Additions 159 100 93 83 42 477
Acquisitions of businesses 1 1
Disposal of businesses (67) (35) (11) (113)
At 31 December 2014 1,675 1,079 1,707 609 469 543 518 6,600
Accumulated amortisation: At 1 January 2014 23 265 444 323 69 198 137 1,459
Reclassifications (8) 4 (11) 5 6 (4)
Exchange differences (9) (4) (6) (19)
Charge for the year 46 125 37 42 63 53 366
Impairment 1 1
Disposal of businesses (7) - (7)
At 31 December 2014 16 311 564 360 96 259 190 1,796
Net book value at 31 December 2014
1,659 768 1,143 249 373 284 328 4,804
Net book value at 31 December 2013 1,838 663 1,202 228 406 255 395 4,987 1
In 2013, following the acquisition of RRPS, the Group revised the classification of intangible assets. During 2014, a number of minor inconsistencies in these classifications have been identified and amended. The net movement of £2m relates to software previously included in property, plant and equipment.
Goodwill has been tested for impairment during 2014 on the following basis:
The carrying value of goodwill has been assessed by reference to value in use. These have been estimated using cash flows from the most recent forecasts prepared by management, which are consistent with past experience and external sources of information on current and future market conditions. Given the long-term and established nature of many of the Group’s Aerospace products (product lives are often measured in decades), these forecast the next ten years, with five years used elsewhere. Growth rates for the period not covered by the forecasts are assumed to be 2.0-2.75%, reflecting the products, industries and countries in which the relevant CGU or group of CGUs operate.
The key assumptions for the impairment tests are the discount rate and, the programme forecasts, the growth rates and the impact of foreign exchange rates on the relationship between selling prices and costs. Impairment tests are performed using prevailing exchange rates.
The pre-tax cash flow projections have been discounted at 13% (2013 13%), based on the Group’s weighted average cost of capital.
Following the recognition of RRPS at fair value on 1 January 2013, reasonably possible changes in the key assumptions would cause the value in use of the goodwill to fall below its carrying value. Such changes include: a reduction in the level of cash generation of 14%; or an increase in the assumed discount rate of 4%.

30
Certification costs and participation fees, customer relationships, technology, patents and licences, order backlog, development expenditure and customer aftermarket rights have been reviewed for impairment in accordance with the requirements of IAS 36 Impairment of Assets. Where an impairment test was considered necessary, it has been performed on the following basis:
The carrying values have been assessed by reference to value in use. These have been estimated using cash flows from the most recent forecasts prepared by management, which are consistent with past experience and external sources of information on market conditions over the lives of the respective programmes.
The key assumptions underlying cash flow projections are assumed market share, programme timings, unit costs, discount rates, and foreign exchange rates.
The pre-tax cash flow projections have been discounted at 11% (2013 11%), based on the Group’s weighted average cost of capital.
No impairment is required on this basis. However, a combination of changes in assumptions and adverse movements in variables that are outside the Company’s control (discount rate, exchange rate and airframe delays), could result in impairment in future periods.
The Group is currently engaged in a number of Trent 900 sales campaigns. The carrying value of intangible assets relating to the Trent 900 programme assumes that a proportion of these campaigns are successful. If no further orders are obtained, the carrying value of these intangible assets (£142 million) may be impaired.
8 Property, plant and equipment
Land and buildings
Plant and equipment
Aircraft and engines
In course of construction
Total
£m £m £m £m £m
Cost:
At 1 January 2014 1,297 3,490 324 700 5,811
Exchange differences (23) (42) (1) 2 (64)
Additions 24 160 57 427 668 Acquisitions of businesses 38 38
Disposal of businesses (88) (94) (77) (28) (287)
Reclassifications ( to intangible assets) 134 137 32 (305) (2) Disposals/write offs (10) (51) (52) (1) (114)
At 31 December 2014 1,334 3,600 321 795 6,050
Accumulated depreciation: At 1 January 2014 386 1,949 84 2,419
Exchange differences (8) (26) (34)
Charge for the year 49 294 31 374
Impairment 1 1
Disposal of businesses (29) (62) (9) (100)
Disposals/write offs (7) (46) (3) (56)
At 31 December 2014 391 2,109 103 1 2,604
Net book value at 31 December 2014 943 1,491 218 794 3,446
Net book value at 31 December 2013 911 1,541 240 700 3,392
9 Other financial assets and liabilities
Derivatives
Foreign exchange contracts
Commodity contracts
Interest rate
contracts Total
Exercise price of
put option on NCI
Financial RRSAs C Shares Total
£m £m £m £m £m £m £m £m
At 31 December 2014
Non-current assets 28 79 107 107
Current assets 22 22 22
Current liabilities (144) (21) - (165) (22) (22) (209)
Non-current liabilities (545) (22) (27) (594) (123) - (717)
(639) (43) 52 (630) (145) (22) (797)
At 31 December 2013
Non-current assets 631 43 674 674
Current assets 72 2 74 74
Current liabilities (63) (16) (1) (80) (1,858) (22) (16) (1,976)
Non-current liabilities (142) (25) (48) (215) (145) (360)
498 (39) (6) 453 (1,858) (167) (16) (1,588)

31
Derivative financial instruments
Movements in the fair value of derivative financial instruments were as follows: 2014 2013
Foreign exchange contracts
Commodity contracts
Interest rate
contracts Total Total £m £m £m £m £m
At January 1 498 (39) (6) 453 347
Acquisition of business 3
Movements in fair value hedges 3 58 61 (88)
Movements in other derivative contracts (1,125) (15) (1,140) 250
Contracts settled (15) 11 (4) (59)
At December 31 (639) (43) 52 (630) 453
Non derivative other financial instruments The Group had agreed a put option with Daimler AG, such that Daimler could sell its interest in Rolls-Royce Power Systems GmbH to the Group. The fair value of the exercise value this option was included as a financial liability.
The Group has financial liabilities arising from financial RRSPs. These financial liabilities are valued at each reporting date using the amortised cost method. This involves calculating the present value of the forecast cash flows of the arrangements using the internal rate of return at the inception of the arrangements as the discount rate.
Put option on NCI Financial RRSAs
2014 2013 2014 2013 £m £m £m
At 1 January (1,858) (167) (167) (193)
Acquisition of business (2) Initial recognition of put option on NCI on consolidation of RRPS (1,432)
Exchange adjustments included in OCI 3 (4)
Financing charge 1 (5) (9)
Excluded from underlying profit:
Financing charge 1 (2)
Change in put option exercise price 1 (166) (212)
Changes in forecast payments 1 2
Exchange adjustments 1 89 (45) (8) 4
Cash paid to partners 32 33
Settlement of put option 1,937
At 31 December (1,858) (145) (167) 1
Included in financing
10 Borrowings
During the year, the Group repaid a £200 million EIB loan.

32
11 Pensions and other post-retirement benefits
Movements in the net post-retirement position recognised in the balance sheet were as follows: UK schemes
Overseas schemes
Total
£m £m £m
At 1 January 2014 196 (989) (793)
Exchange differences 11 11
Current service cost (156) (45) (201)
Past-service (cost)/credit 18 13 31 Financing recognised in income statement 11 (40) (29)
Contributions by employer 257 65 322
Returns on plan assets excluding financing recognised in OCI 2,258 55 2,313
Actuarial losses recognised in OCI (1,419) (262) (1,681)
Movement in unrecognised surplus 1 513 513
Movement on minimum funding liability 2 47 47
Disposal of business 10 16 26
Other (4) (4)
At 31 December 2014 1,735 (1,180) 555
Analysed as:
Post-retirement scheme surpluses - included in non-current assets 1,735 5 1,740
Post-retirement scheme deficits - included in non-current liabilities (1,185) (1,185)
1,735 (1,180) 555
1 Where a surplus has arisen on a scheme, in accordance with IAS 19 and IFRIC 14, the surplus is recognised as an asset only if it represents an unconditional economic benefit available to the Group in the future. Any surplus in excess of this benefit is not recognised in the balance sheet.
2 A minimum funding liability arises where the statutory funding requirements require future contributions in respect of past service that will result in a future unrecognisable surplus.
12 Contingent liabilities
On 6 December 2012, the Company announced that it had disclosed matters of concern to the Serious Fraud Office (SFO) relating to the use of intermediaries in certain overseas markets. On 23 December 2013, we were informed by the SFO that it has now commenced a formal investigation into these matters. The Company is continuing its investigations into its use of intermediaries across its business and is engaged with relevant government agencies in the UK and elsewhere regarding its findings.
The consequence of these disclosures will be decided by the regulatory authorities. It remains too early to predict the outcomes, but these could include the prosecution of individuals and of the company. Accordingly, the potential for fines or other penalties cannot currently be assessed. As the investigation is ongoing, it is not yet possible to identify the timescale in which these issues might be resolved.
In connection with the sale of its products the Group will, on some occasions, provide financing support for its customers - generally in respect of civil aircraft. The Group’s commitments relating to these financing arrangements, which are spread over many years, relate to a number of customers and a broad product portfolio and are generally secured on the asset subject to the financing. Customer financing provisions cover guarantees provided for asset value and/or financing.
Commitments on delivered aircraft in excess of the amounts provided are shown in the table below. These are reported on a discounted basis at the Group’s borrowing rate to reflect better the time span over which these exposures could arise. These amounts do not represent values that are expected to crystallise. The commitments are denominated in US dollars. As the Group does not generally adopt cash flow hedge accounting for future foreign exchange transactions, this amount is reported, together with the sterling equivalent at the reporting date spot rate. The values of aircraft providing security are based on advice from a specialist aircraft appraiser.
2014 2013
£m $m £m $m
Gross commitments 388 605 356 589
Value of security (245) (382) (217) (360)
Indemnities (84) (132) (80) (132)
Net commitments 1 59 91 59 97
Net commitments with security reduced by 20% 2 90 140 78 129
1 Security includes unrestricted cash collateral of: 42 66 50 83
2 Although sensitivity calculations are complex, the reduction of the relevant security by 20% illustrates the sensitivity of the contingent liability to changes in this assumption
There are also net contingent liabilities in respect of undelivered aircraft, but it is not considered practicable to estimate these as deliveries can be many years in the future, and the relevant financing will only be put in place at the appropriate time.

33
Following the sale of the Energy business to Siemens on 1 December 2014 and further to the announcement on 19 June 2014 of a £1 billion share buyback, on 10 December 2014, the Company put in place an initial £250 million programme for the purchase of its ordinary shares. The aim of the buyback is to reduce the share capital of the Company, helping enhance returns to shareholders. In the period to 31 December 2014, 8,215,000 shares were purchased at an average price of 840 pence, leaving a contracted commitment of £182 million.
13 Disposals
On 1 December 2014, the Group sold its Energy business for £785 million which included a contribution to the costs of separating the Energy business from the Group’s continuing activities, most significantly the creation of a stand-alone IT system. In addition, Rolls-Royce has received a further £200 million for a 25-year licensing agreement
1 granting Siemens
access to relevant Rolls-Royce aero-derivative technology for use in the 4 to 85 megawatt power output gas turbine range. The Energy business disposal gave rise to a cash inflow of £1,027 million. In accordance with IFRS 5 Non-Current Assets Held for Sale and Discontinued Operations, the disposal of the Energy business has been accounted for as discontinued
operation.
Energy (discontinued
Operation) Other
Proceeds £m £m
Cash consideration 985 24
Adjustments and future obligations to the purchaser (28)
Total consideration before deferrals 957 24
Receipt of licencing agreement proceeds deferred at 31 December 2014 1 (58)
Total consideration after deferrals 899 24
Assets and liabilities disposed
Intangible assets 106
Property, plant and equipment 187
Investment in joint venture 56 14 Inventory 320
Deposits (payments received on account) (11)
Trade and other receivables 337
Cash and cash equivalents 4 Trade and other payables (253)
Provisions for liabilities and charges (34)
Net assets disposed 712 14
Profit on disposal
Profit on disposal before disposal costs and continuing obligations 187 10
Cumulative currency translation gain/(loss) 32 (3) Disposal costs and continuing obligations
2 (98) (1)
Post-retirement scheme net credit 3 15
Profit on disposal of the business before tax 4 136 6
Tax on disposal 2
Profit on disposal of the business after tax 138 6
Reconciliation to cash flow statement
Total consideration after deferrals 899 24
Adjustments, future obligations and receipt of licensing agreement proceeds deferred at 1 December 2014
4
156
Cash and cash equivalents disposed (4)
Disposal costs paid in the year (26)
Cash inflow per cash flow statement 1,027 24
1 The £200 million licensing agreement contained £142 million to provide intellectual property which has been recognised in the period, whilst £58 million relating to the provision of engineering services and supply of parts has been deferred over a period up to 25 years.
2 Disposal costs £98 million (incurred and accrued), includes costs to separate the Energy business including IT, legal and transactional fees.
3 Profit on the sale of business includes pension and other post-retirement benefit plan curtailment gains of £26 million and an accrual to settle a pension deficit that is expected to transfer to Siemens during 2015.
4 £58 million of costs relating to future obligations to Siemens not yet incurred have been accrued and £58 million relating to the licensing agreement have been deferred. In addition, the Energy disposal is subject to customary post-closing adjustments that are estimated to be £42 million, which may include adjustments for working capital. Such adjustments may result in the final amounts received from the purchaser differing from the disposal proceeds above.

34
Principal risks and uncertainties
The following table describes the principal risks facing the Group notwithstanding that there are other risks that may occur and may impact the achievement of the Group’s objectives.
Risk or uncertainty and potential impact How we manage it
PRODUCT FAILURE
Product not meeting safety expectations, or causing significant impact to customers or the environment through failure in quality control.
Operating a safety first culture
Applying our engineering design and validation process from initial design, through production and into service
The Safety and Ethics Committee reviewing the scope and effectiveness of the Group’s product safety policies to ensure that they operate to the highest industry standards
Operating a safety management system (SMS), governed by the product safety review board, and subject to continual improvement based on experience and industry best practice. Product safety training is an integral part of our SMS
Improving our supply chain quality
Crisis management team chaired by the Director – Engineering and Technology or General Counsel as appropriate
BUSINESS CONTINUITY
Breakdown of external supply chain or internal facilities that could be caused by destruction of key facilities, natural disaster, regional conflict, financial insolvency of a critical supplier or scarcity of materials which would reduce the ability to meet customer commitments, win future business or achieve operational results.
Continuing investment in adequate capacity, and modern equipment and facilities
Identifying and assessing points of weakness in our internal and external supply chain, our IT systems and our people skills
Selecting and developing stronger suppliers
Developing dual sources or dual capability
Developing and testing incident management and business continuity plans
Crisis management team chaired by Director – Engineering and Technology or General Counsel as appropriate
Customer excellence centres providing improved response to supply chain disruption
COMPETITOR ACTION
The presence of large, financially strong competitors in the majority of our markets means that the Group is susceptible to significant price pressure for original equipment or services even where our markets are mature or the competitors are few. Our main competitors have access to significant government funding programmes as well as the ability to invest heavily in technology and industrial capability.
Accessing and developing key technologies and service offerings which differentiate us competitively
Focusing on being responsive to our customers and improving the quality, delivery and reliability of our products and services
Partnering with others effectively
Driving down cost and improving margins
Protecting credit lines
Investing in innovation, manufacturing and production, and continuing governance of technology programmes
Understanding our competitors
POLITICAL RISK
Geopolitical factors that lead to an unfavourable business climate and significant tensions between major trading parties or blocs which could impact the Group’s operations. For example: explicit trade protectionism, differing tax or regulatory regimes, potential for conflict; or broader political issues.
Where possible, locating our domestic facilities and supply chain in countries with a low level of political risk and/or ensuring that we maintain dual capability
Diversifying global operations to avoid excessive concentration of risks in particular areas
The international network of Rolls-Royce and its business units proactively monitoring local situations
Maintaining a balanced business portfolio with high barriers to entry and a diverse customer base
Proactively influencing regulation where it affects us

35
Risk or uncertainty and potential impact How we manage it
MAJOR PROGRAMME DELIVERY
Failure to deliver a major programme on time, within budget to specification or technical performance falling significantly short of customer expectations, or not delivering the planned business benefits, would have potentially significant adverse financial and reputational consequences, including the risk of impairment of the carrying value of the Group’s intangible assets and the impact of potential litigation.
Major programmes are subject to Board approval
Reviewing major programmes at levels and frequencies appropriate to their performance against key financial and non-financial deliverables and potential risks throughout the programme’s lifecycle
Conducting technical audits at pre-defined points performed by a team that is independent from the programme
Requiring programmes to address the actions arising from reviews and audits and monitoring and controlling progress through to closure
Applying knowledge management principles to provide benefit to current and future programmes
COMPLIANCE
Non-compliance by the Group with legislation or other regulatory requirements in the heavily regulated environment in which it operates (for example: export controls; use of controlled chemicals and substances; and anti-bribery and corruption legislation) compromising the ability to conduct business in certain jurisdictions and exposing the Group to potential: reputational damage; financial penalties; debarment from government contracts for a period of time; and/or suspension of export privileges or export credit financing, any of which could have a material adverse effect.
Taking an uncompromising approach to compliance
Operating an extensive compliance programme. This programme and the Global Code of Conduct are disseminated throughout the Group and are updated and reinforced from time-to-time to ensure their continued relevance, and to ensure that they are complied with both in spirit and to the letter. The Global Code of Conduct and the Group’s compliance programme are supported by appropriate training
A legal and compliance team is in place to manage our compliance programme and any ongoing regulatory investigations
Lord Gold has reviewed the Group’s current compliance procedures and the Group has continued to implement an improvement plan
Implementing a comprehensive REACH compliance programme. This includes establishing appropriate data systems and processes, working with our suppliers, customers and trade associations and conducting research on alternative materials
MARKET SHOCK
The Group is exposed to a number of market risks, some of which are of a macro-economic nature. For example, oil price or foreign currency exchange rates, and some which are more specific to the Group, for example, liquidity and credit risks, reduction in air travel or disruption to other customer operations. Significant extraneous market events could also materially damage the Group’s competitiveness and/or credit worthiness. This would affect operational results or the outcomes of financial transactions.
Maintaining a strong balance sheet, through healthy cash balances and a continuing low level of debt
Providing financial flexibility by maintaining high levels of liquidity and an investment grade ‘A’ credit rating
Sustaining a balanced portfolio through earning revenue both from the sale of original equipment and aftermarket services, providing a broad product range and addressing diverse markets that have differing business cycles
Deciding where and what currencies to source in, and where and how much credit risk is extended or taken. The Group has a number of treasury policies that are designed to hedge residual risks using financial derivatives (foreign exchange, interest rate and commodity price risk)
IT VULNERABILITY
Breach of IT security causing controlled or critical data to be lost, made inaccessible, corrupted or accessed by unauthorised users.
Establishing ‘defence in depth’ through deployment of multiple layers of software and processes including web gateways, filtering, firewalls, intrusion, and advanced persistent threat detectors and integrated reporting
Running security and network operations centres
Actively sharing IT security information through industry, government and security forums

36
Annual General Meeting
This year’s AGM will be held at 11.00am on Thursday, 8 May 2015 at the QEII Conference Centre, Broad Sanctuary, Westminster, London, SW1P 3EE.
In accordance with the UK Corporate Governance Code and the Company’s Articles of Association, all directors of the Company are required to retire from office and are subject to annual election or re-election by shareholders. The Notice of the AGM to be held on 8 May 2015 will specify those current directors who intend to put themselves forward for election or re-election at the AGM.
Payments to shareholders
At the AGM on 8 May 2015, the directors will recommend an issue of 141 C Shares with a total nominal value of 14.1 pence for each ordinary share. The final issue of C shares will be made on 1 July 2015 to shareholders on the register on 24 April 2015 and the final day of trading with entitlement to C Shares is 22 April 2015. Together with the interim issue on 2 January 2015 of 90 C Shares for each ordinary share with a total nominal value of 9.0 pence, this is the equivalent of a total annual payment to ordinary shareholders of 23.1 pence for each ordinary share.
The payment to shareholders will, as before, be made in the form of redeemable C Shares which shareholders may either choose to retain or redeem for a cash equivalent. The Registrar, on behalf of the Company, operates a C Share Reinvestment Plan (CRIP) and can, on behalf of shareholders, purchase ordinary shares from the market rather than delivering a cash payment. Shareholders wishing to redeem their C Shares or else redeem and participate in the CRIP must ensure that their instructions are lodged with the Registrar, Computershare Investor Services Plc, no later than 5.00pm on 1 June 2015. Redemption will take place on 3 July 2015.
Annual report and financial statements
The statements below have been prepared in connection with the Company’s full Annual Report for the year ended 31 December 2014. Certain parts thereof are not included with this announcement.
Going concern
The Group meets its funding requirements through a mixture of shareholders’ funds, bank borrowings, bonds and notes. At 31 December 2014, the Group had borrowing facilities of £3.5 billion and total liquidity of £4.1 billion, including: cash and cash equivalents of £2.9 billion; and undrawn facilities of £1.3 billion. £67 million of the facilities mature in 2015.
The Group’s forecasts and projections, taking into account reasonably possible changes in trading performance, show that the Group has sufficient financial resources. The directors have reasonable expectation that the Company and the Group are well placed to manage their business risks and to continue in operational existence for the foreseeable future, despite the current uncertain global economic outlook.
Accordingly, the directors continue to adopt the going concern basis (in accordance with the guidance ‘Going Concern and Liquidity Risk: Guidance for Directors of UK Companies 2009’ issued by the FRC) in preparing the consolidated financial statements.
Responsibility statements under the Disclosure and Transparency Rules
Each of the persons who is a director at the date of approval of this report confirms that to the best of his or her knowledge: i) each of the Group and parent company financial statements, prepared in accordance with IFRS and UK Accounting
Standards respectively, gives a true and fair view of the assets, liabilities, financial position and profit or loss of the issuer and the undertakings included in the consolidation taken as a whole; and
ii) the Directors’ report includes a fair review of the development and performance of the business and the position of the Company and the undertakings included in the consolidation taken as a whole, together with a description of the principal risks and uncertainties that they face.
iii) the Annual Report, taken as a whole, is fair, balanced and understandable and provides the information necessary for shareholders to assess the Company’s performance, business model and strategy.
By order of the Board
John Rishton Chief Executive
12 February 2015
David Smith Chief Financial Officer
12 February 2015