Embed Size (px)
Citation preview
Molecular Ecology (2010) 19, 732–748 doi: 10.1111/j.1365-294X.2010.04521.x
Rolling stones and stable homes: social structure, habitatdiversity and population genetics of the Hawaiianspinner dolphin (Stenella longirostris)
KIMBERLY R. ANDREWS,*† LESZEK KARCZMARSKI ,‡§ WHITLOW W. L. AU,*†
SUSAN H. RICKARDS,¶ CYNTHIA A. VANDERLIP,* * BRIAN W. BOWEN,* E. GORDON GRAU*
and ROBERT J . TOONEN*
*Hawai’i Institute of Marine Biology, University of Hawai’i, PO Box 1346, Kaneohe, Hawai’i 96744, USA, †Marine Mammal
Research Program, PO Box 1106, Kailua, Hawai’i 96734, USA, ‡The Swire Institute of Marine Science, The University of Hong
Kong, Cape d’Aguilar, Shek O, Hong Kong, §Mammal Research Institute, University of Pretoria, C ⁄ o Whale Unit, PO Box 61,
Cape Town 8000, South Africa, ¶Hawai’i Marine Mammal Consortium, PO Box 1493, Kamuela, Hawai’i 96743, USA, **State
of Hawai’i Department of Land and Natural Resources, Division of Forestry and Wildlife, 2135 Makiki Heights Dr., Honolulu,
Hawai’i 96822, USA
Corresponde
E-mail: andre
Abstract
Spinner dolphins (Stenella longirostris) exhibit different social behaviours at two regions
in the Hawaiian Archipelago: off the high volcanic islands in the SE archipelago they
form dynamic groups with ever-changing membership, but in the low carbonate atolls in
the NW archipelago they form long-term stable groups. To determine whether these
environmental and social differences influence population genetic structure, we
surveyed spinner dolphins throughout the Hawaiian Archipelago with mtDNA control
region sequences and 10 microsatellite loci (n = 505). F-statistics, Bayesian cluster
analyses, and assignment tests revealed population genetic separations between most
islands, with less genetic structuring among the NW atolls than among the SE high
islands. The populations with the most stable social structure (Midway and Kure Atolls)
have the highest gene flow between populations (mtDNA FST < 0.001, P = 0.357;
microsatellite FST = )0.001; P = 0.597), and a population with dynamic groups and fluid
social structure (the Kona Coast of the island of Hawai’i) has the lowest gene flow
(mtDNA 0.042 < FST < 0.236, P < 0.05; microsatellite 0.016 < FST < 0.040, P < 0.001). We
suggest that gene flow, dispersal, and social structure are influenced by the availability
of habitat and resources at each island. Genetic comparisons to a South Pacific location
(n = 16) indicate that Hawaiian populations are genetically depauperate and isolated
from other Pacific locations (mtDNA 0.216 < FST < 0.643, P < 0.001; microsatellite
0.058 < FST < 0.090, P < 0.001); this isolation may also influence social and genetic
structure within Hawai’i. Our results illustrate that genetic and social structure are
flexible traits that can vary between even closely-related populations.
Keywords: dispersal, habitat availability, insularity, microsatellites, mtDNA, population structure
Received 7 January 2009; revision accepted 27 November 2009
Introduction
Levels of dispersal and genetic divergence can vary
between populations within species, and this variation
nce: Kimberly R. Andrews, Fax: +1 808 236 7443;
is thought to be driven by habitat differences such as
abundance and predictability of resources, level of pre-
dation pressure, and level of habitat isolation (reviewed
in Bowler & Benton 2005). In cetaceans, intraspecific
variation in dispersal patterns and genetic structure
may also correspond to patterns of social group forma-
tion, or ‘social structure’, such as the size and stability
� 2010 Blackwell Publishing Ltd
GE NETIC STRUCTURE OF HAWAIIAN SPINNER DOLPHIN 73 3
of groups, the sex and relatedness of individuals within
groups, and dispersal ranges of groups. For example,
two sympatric forms of killer whale (Orcinus orca) in
the northeast Pacific have different group sizes, group
stability, prey type, foraging behaviour and dispersal
patterns; these differences are thought to be driven by
the distribution of prey and facilitated by social
transmission (Hoelzel 1998; Baird & Whitehead 2000).
Bottlenose dolphins (Tursiops spp.) also show intraspe-
cific variation in group size, prey type, dispersal
patterns and genetic structure (Wells et al. 1987; Lus-
seau et al. 2003; Sellas et al. 2005; Querouil et al. 2007);
in some regions this variation has been attributed to
habitat differences between sheltered nearshore regions
vs. open coastline or offshore regions (Ballance 1992;
Gowans et al. 2008). The frequent association between
habitat, genetic structure and social structure illustrates
the inter-relatedness of these factors within cetacean
species.
The spinner dolphin (Stenella longirostris) shows intra-
specific variation in dispersal, genetic structure and
social structure across a worldwide distribution in trop-
ical and subtropical waters. In the Eastern Tropical
Pacific (ETP), spinner dolphins are pelagic and form
groups that are thought to range over wide geographic
distances (Reilly 1990). Average group size in the ETP
is around 120 individuals, but group sizes can reach
hundreds or thousands (Gerrodette & Forcada 2005).
These extensive movements and large groups are
thought to promote greater foraging efficiency in the
pelagic environment where prey are unpredictable, and
greater protection where no shelter from predators is
available (Gowans et al. 2008). Population genetic analy-
ses in the ETP reveal little genetic divergence in mito-
chondrial DNA (mtDNA) or microsatellite loci even
between four morphotypes that exist in this region
(Galver 2002).
In contrast to the pelagic spinner dolphins in the
ETP, most other Pacific populations rely heavily on the
shelter and resources available in nearshore habitats.
Island-associated dolphins feed nocturnally on the
mesopelagic boundary community associated with the
underwater slopes of the islands within several kilome-
tres from shore (Norris et al. 1994; Benoit-Bird & Au
2003). During daylight hours, the dolphins use near-
shore habitat for resting and social behaviour, with
preferences for calm, sandy-bottom bays and lagoons
(Norris et al. 1994). The consistent presence of these dol-
phins in nearshore island habitats is likely driven by
the predictability of prey along the slopes of the islands
and the predictability of resting habitat in the shallow
waters surrounding islands (Norris et al. 1994).
The social structure of island-associated spinner dol-
phins has been studied in the Society and Hawaiian
� 2010 Blackwell Publishing Ltd
Archipelagos. In the Society Archipelago, photo-identifi-
cation data indicate that group size and composition
varies from day-to-day (a ‘fission-fusion’ society) within
relatively closed island communities (Poole 1995; Ore-
mus et al. 2007). Although some dolphins were
observed to move between islands, no evidence of per-
manent relocation was observed even between Moorea
and Tahiti, only 17 km apart. Genetic data reinforced
the indication that permanent migration and interbreed-
ing between islands are rare in the Society Archipelago,
with many island populations being genetically distinct
(Oremus et al. 2007).
In the Hawaiian Archipelago, the social structure of
spinner dolphins differs between regions. They regu-
larly occur at all of the Main Hawaiian Islands (MHI),
three atolls in the far-Northwestern Hawaiian Islands
(far-NWHI; low carbonate atolls), and one intermediate
atoll at French Frigate Shoals (with both basaltic and
coralline features; Fig. 1). Along the Kona Coast of
Hawai’i Island (also known as the Big Island) in the
MHI, the dolphins have a fission-fusion social structure
and group sizes (�30–70 dolphins) similar to the Soci-
ety Archipelago (Norris et al. 1994; Ostman 1994). Lim-
ited information exists on social structure at other MHI;
however, there is evidence that spinner dolphins at
O’ahu exhibit long-term site fidelity (Marten & Psarakos
1999) and a fission-fusion grouping pattern with possi-
bly even greater fluidity than at the Kona Coast (Lam-
mers 2004).
In contrast, the social structure at the two most north-
western atolls, Midway and Kure, differs substantially
from that at the Kona Coast and the Society Archipel-
ago. Spinner dolphins form large groups at each atoll
(�120 at Kure, �260 at Midway) and their group stabil-
ity is greater than in any other spinner dolphin popula-
tion studied to date (Karczmarski et al. 2005a,b). Kure
and Midway also differ from the MHI in that there is
usually only one large and coherent group of long-term
associates that uses each atoll lagoon on a daily basis;
in contrast, multiple groups are present at each MHI.
The differences in social structure in the far-NWHI are
thought to be driven by the limited availability of rest-
ing habitat and the geographic insularity of the atolls
(Karczmarski et al. 2005b). In particular, the presence of
a single, small area of resting habitat at each atoll is
thought to preclude the presence of multiple groups.
Karczmarski et al. (2005b) propose that the geographic
distance (97 km of deep oceanic waters) separating
these two atolls may be energetically expensive and
potentially dangerous to traverse, and that these factors
may reinforce social bonds and promote long-term sta-
bility of the communities at each atoll.
Although social structure is known to vary within the
Hawaiian spinner dolphins, little is known about pat-

(a)
(b)
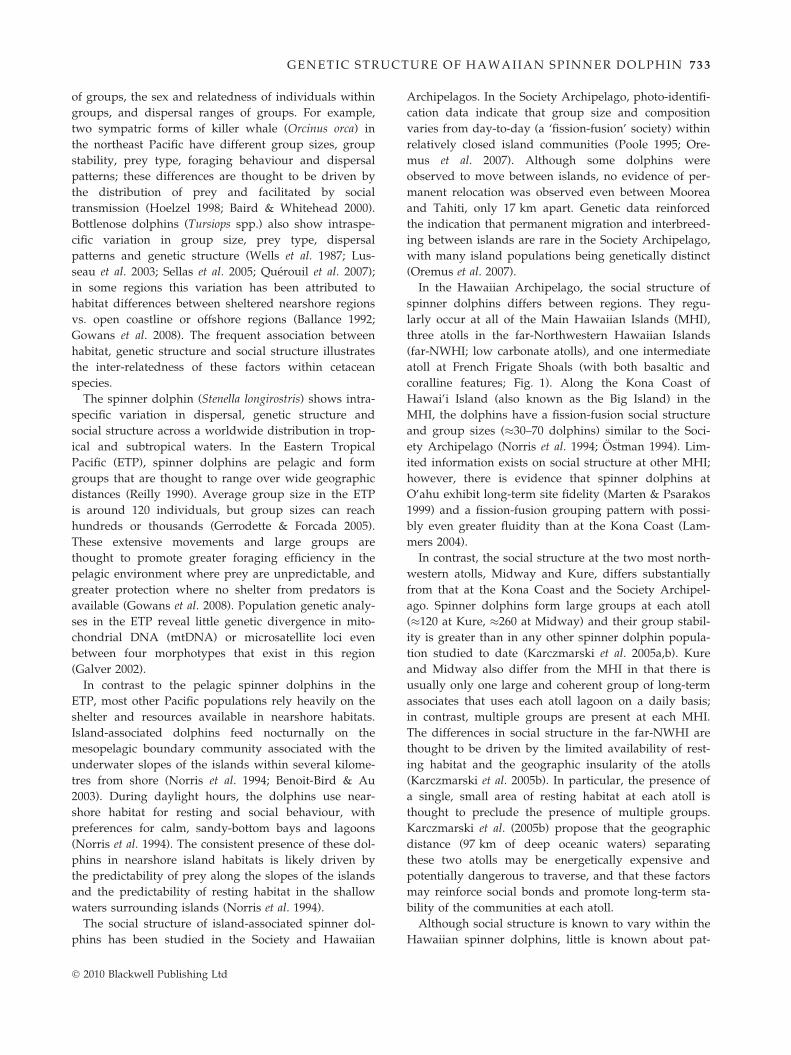
Fig. 1 (a) Map of the Hawaiian Archipelago. Dashed line separates the Northwestern Hawaiian Islands from the Main Hawaiian
Islands. Gray shaded circles highlight the islands and atolls where spinner dolphins are regularly sighted. Numbers following loca-
tion names represent sample sizes. Dashed arrows represent interisland movement observed by genetic recapture; and (b) Detailed
map of the Main Hawaiian Islands. Circles represent spinner dolphin (Stenella longirostris) sampling locations at each island.
734 K. R. ANDREWS ET AL.
terns of genetic diversity or dispersal across the region.
To examine whether variation in habitat and social
structure correspond to variation in genetic diversity in
Hawai’i, we examined population genetic structure
across the archipelago by sampling at each island or
atoll where spinner dolphins regularly occur. A preli-
minary study (Andrews et al. 2006) found genetic struc-
ture across the Hawaiian Archipelago based on mtDNA
control region sequences, with lower genetic diversity
and less genetic structure within the NWHI than within
the MHI. Our current study provides a more detailed
analysis of population genetic structure in Hawai’i by
utilising larger sample sizes, larger numbers of loca-
tions sampled, nuclear as well as mtDNA markers, and
comparisons with a South Pacific population at Ameri-
can S�amoa. The results of these analyses were com-
pared with existing demographic data for spinner
dolphins in Hawai’i and elsewhere, to examine the rela-
tionships between dispersal, social structure and habitat
variation. Hawai’i offers both high and low-island habi-
tats in proximity, allowing direct comparisons without
the confounding factors of ocean-basin separations, eco-
logical discontinuities and evolutionary divergence.
Materials and methods
Study site and sample collection
Skin specimens were collected from spinner dolphins at
each island group or atoll in the Hawaiian Archipelago
where this species regularly occurs (at some islands ⁄atolls in the NWHI spinner dolphins do not occur regu-
larly) (Fig. 1a). Specimens were also collected at the
island of Tutuila in American S�amoa. All samples were
� 2010 Blackwell Publishing Ltd
GE NETIC STRUCTURE OF HAWAIIAN SPINNER DOLPHIN 73 5
collected between 2001 and 2005 using previously
described biopsy methods (Andrews et al. 2006) includ-
ing a Paxarms rifle (Krutzen et al. 2002) and a Hawaiian
sling with a biopsy tip. Additionally, a skin-swabbing
technique (Harlin et al. 1999) was used to collect many
of the specimens at Midway Atoll. Specimens were
stored in 20% dimethyl sulfoxide NaCl-saturated solu-
tion (modified from Amos & Hoelzel 1991). Additional
specimens were provided by the National Marine Fish-
eries Service, Southwest Fisheries Science Center
(SWFSC) Genetics Archive in the form of extracted
genomic DNA, corresponding to accession numbers
7185–7202, 15510, 17432, 30411–30420, 30449, 30512–
30516. SWFSC samples were collected between 1997
and 2002.
mtDNA sequencing and genetic sexing
Genomic DNA was extracted using Qiagen DNeasy
extraction kits. Polymerase chain reactions (PCRs)
amplified a portion of the 5’ mtDNA control region as
described in Andrews et al. (2006). PCR products were
sequenced in both the forward and reverse directions
with an ABI 3730 automated sequencer, and sequences
were aligned and edited manually using SEQUENCHER
4.8 (Genecodes Corporation). Primer sequences and
ambiguous sequences were removed, resulting in a
417 bp fragment. The sex of each dolphin was deter-
mined by dual PCR amplification of a fragment of the
sry gene on the Y chromosome and a fragment of the
ZFX ⁄ ZFY genes on the X chromosomes as described by
Gilson et al. (1998).
Microsatellite genotyping
Ten microsatellite loci obtained from three previous
studies (Amos et al. 1993; Valsecchi & Amos 1996; Gal-
ver 2002; Table 1) were amplified by PCR carried out
Table 1 Diversity in the Hawaiian Archipelago for microsatellite loc
He: expected heterozygosity), and polymerase chain reactions (PCR) a
Locus k Ho He
EV1 21 0.842 0.864
EV37 13 0.755 0.727
EV94 16 0.851 0.841
415 ⁄ 416 12 0.815 0.812
SD8 15 0.672 0.688
SL1-25 16 0.724 0.743
SL4-16 4 0.396 0.385
SL8-49 18 0.787 0.802
SL9-69 9 0.734 0.728
SL10-26 20 0.781 0.782
� 2010 Blackwell Publishing Ltd
in 12 ll volume reactions containing 1 X Reaction Buf-
fer (Promega Corporation), 200 lM of each dNTP, 2.0–
2.75 mM MgCl2, 0.38 units Taq DNA polymerase (Pro-
mega Corporation), and 0.21 lM each primer. Cycle con-
ditions were as follows: 94 �C for 2.5 min, followed by
33 cycles of 94 �C for 30 s, annealing temperature for
30 s (Table 1), and 72 �C for 30 s, followed by a final
72 �C extension for 15 min. For skin swabs, the number
of cycles was increased to 40. PCR products were sepa-
rated on a Beckman CEQ8000 automated sequencer
(Beckman Coulter), and fragment sizes were scored
using the CEQ 8000 Genetic Analysis System software
8.0 (Beckman Coulter).
Microsatellite loci were tested for departures from
Hardy Weinberg equilibrium and linkage equilibrium
using ARLEQUIN 3.11 (Excoffier et al. 2005). Microsatellite
loci were also tested for null alleles, large allele dropout
and scoring errors due to stutter peaks using MICRO-
CHECKER 2.2.0.3 (Van Oosterhout et al. 2004). To estimate
microsatellite scoring error rate, 278 PCR reactions were
repeated using biopsy samples (between 19 and 38 reac-
tions for each locus), and 629 PCR reactions were
repeated using skin swab samples (approximately equal
numbers of reactions for each locus). The error rate was
calculated as the ratio of the number of allelic differ-
ences observed to the total number of allelic compari-
sons (Bonin et al. 2004).
The average nonexclusion probability for the identity
of individuals was estimated using CERVUS 3.0.3 (Kali-
nowski et al. 2007). Matching genotypes were identified
using MSTOOLS 3.1 (Park 2001) and were assumed to be
replicate samples from the same individual. In these
cases only one copy of the genotype was retained for
subsequent analyses.
To test for the presence of closely related individuals
within a priori defined populations, pairwise genetic
relatedness values were calculated for each pair of indi-
viduals at each island using the relatedness coefficient
i (k: total number of alleles found; Ho: observed heterozygosity;
nnealing temperatures used
Annealing
temp (�C) Reference
48 Valsecchi & Amos (1996)
50 Valsecchi & Amos (1996)
50 Valsecchi & Amos (1996)
45 Amos et al. (1993)
49 Galver 2002
52 Galver 2002
50 Galver 2002
50.5 Galver 2002
53.5 Galver 2002
55 Galver 2002

736 K. R. ANDREWS ET AL.
in the program RELATEDNESS 5.0.8 (Queller & Goodnight
1989; Goodnight & Queller 1998). The highest pairwise
relatedness value for each island was compared with
the highest pairwise relatedness value for each of 100
randomisations of the dataset for each island. Similarly,
the average of the five highest pairwise relatedness val-
ues for each island was compared with the values from
100 randomised datasets. Each randomisation was con-
ducted by permuting alleles across individuals for each
locus, retaining the presence and positions of missing
data. Identification of close relatives within populations
is important because their presence can bias measures
of population differentiation.
Genetic diversity
For mtDNA data, nucleotide (p) and haplotypic (h)
diversities were calculated using ARLEQUIN. The nucleo-
tide substitution model used to calculate genetic dis-
tance was the Tamura and Nei model (Tamura & Nei
1993). This was the model available in ARLEQUIN that
most closely matched the best-fit model determined
using AIC in MODELTEST 3.06 (Posada & Crandall 1998),
which was K81uf + I (Kimura 1980). Data from samples
collected in S�amoa were not used in MODELTEST analyses.
To test whether mtDNA haplotype and nucleotide
diversities differed between islands ⁄ atolls, standard
error values were calculated from 10 000 bootstrap
replicates for each island ⁄ atoll, and Welch’s t-tests
were used for pairwise comparisons between locations
due to inequality of variances. Observed heterozygosity,
expected heterozygosity, allelic richness, and total num-
ber of alleles were calculated per microsatellite locus
and per location using FSTAT 2.9.3.2 (Goudet 2001) and
ARLEQUIN. Welch’s t-tests were used to assess differences
in microsatellite allelic richness between islands ⁄ atolls.
Population structure
To investigate population structure within the Hawaiian
Archipelago, genealogical relationships between
mtDNA haplotypes were examined using a statistical
parsimony network in TCS 1.21 (Clement et al. 2000)
with a 95% connection limit. Additionally, pairwise F-
statistics were calculated for mtDNA and microsatellites
using ARLEQUIN and RECODEDATA 0.1 (Meirmans 2006),
with each island or atoll treated as an a priori defined
population. Three different F-statistics were used: a
measure that incorporates mtDNA sequence divergence
(FST), a measure based on microsatellite allele frequen-
cies or mtDNA haplotype frequencies (FST), and a
standardised version of FST that takes into account
within-population genetic variation for both mtDNA
and microsatellites (F’ST) (Hedrick 2005; Meirmans
2006). Significance of pairwise F-statistics was tested
using 10 000 permutations.
Population structure was also investigated in a Bayes-
ian clustering analysis to estimate the most probable
number of populations using the program STRUCTURE
2.3.2 (Pritchard et al. 2000) using sampling location as a
prior (Hubisz et al. 2009) and using the admixture and
correlated allele frequency models. The burn-in length
was set at 105 steps, followed by 106 steps. Five indepen-
dent runs were conducted for each value of K ranging
between one and 10 to test the consistency of estimates
of P(X|K). To investigate the influence of the geographi-
cally distant S�amoa sample, these analyses were con-
ducted with and without the S�amoa dataset. Population
structure was further investigated using Bayesian likeli-
hood methods to assign each individual to a population
based on multilocus microsatellite genotypes as imple-
mented in GENECLASS 2 (Piry et al. 2004). Assignment tests
are thought to provide information about recent gene
flow, since they identify migrants, or recent descendents
of migrants, by identifying disequilbrium within mul-
tilocus genotypes (Wilson & Rannala 2003).
To examine the possible influence of sex-biased dis-
persal, measures of genetic structure were compared
between males and females in the Hawaiian Archipel-
ago with the biased dispersal methods implemented in
FSTAT (Goudet et al. 2002) using microsatellite data.
These methods test for differences between the sexes
for the mean and variance of corrected assignment indi-
ces (mAIc and vAIc), FST, inbreeding coefficients (FIS),
relatedness, and within-group gene diversity (HS).
These tests were performed for the entire sample set
from Hawai’i. After taking into account the results of
genetic structure analyses, these tests were also per-
formed separately for the subset of samples only from
the far-NWHI, and the subset of samples only from the
MHI plus French Frigate Shoals.
Relationships between geographic distance and
genetic isolation within the Hawaiian Archipelago were
investigated using GENEPOP 3.1b (Raymond & Rousset
1995). Correlations between genetic distinction (FST ⁄1-FST) (Rousset 1997) and geographic distance were
assessed with a Mantel test (10 000 permutations) and a
Spearman’s rank correlation test for each of the F-statis-
tics calculated for mtDNA and microsatellites. Geo-
graphic distances were calculated from the approximate
centres of the sampling locations at each island or atoll.
Results
Samples
A total of 589 specimens were collected from spinner
dolphins at nine islands or atolls in the Hawaiian
� 2010 Blackwell Publishing Ltd
GE NETIC STRUCTURE OF HAWAIIAN SPINNER DOLPHIN 73 7
Archipelago (Fig. 1a,b) and at the island of Tutuila in
American S�amoa (Table 2). However, some specimens
were removed from the dataset for final analyses (see
below). Samples collected at the islands of Maui and
L�ana’i were considered as one location (here abbrevi-
ated as ‘Maui’) because of their close proximity
(�14 km) and the shallow waters separating the islands,
as well as photo-identification data indicating that spin-
ner dolphins move between these two locations (R
Baird, unpublished data).
All microsatellite loci were highly polymorphic over-
all (Table 1) and at each location (Table 3). Based on
these ten loci, the average nonexclusion probability for
the identity of individuals was 1.42 · 10)11, indicating a
high probability that samples with matching genotypes
were the same individual. Identification of matching
genotypes revealed that when the biopsy sampling
technique was used, 27 individuals had been re-sam-
Table 2 Sample location, abbreviations and numbers of spinner dolp
American S�amoa
Location Abbrev. Individuals
Kure Atoll Kure 51
Midway Atoll Midway 119
Pearl & Hermes Reef PHR 47
French Frigate Shoals FFS 33
Ni’ihau 45
Kaua’i 32
O’ahu 40
Maui Nui complex Maui 59
Kona Coast Kona 79
Tutuila S�amoa 16
Total 521
Table 3 Mitochondrial (mtDNA) control region and microsatellite di
p, nucleotide diversity; h, haplotype diversity; k, average number of a
mtDNA
No. of
haplotypes p h
Kure Atoll 3 0.00237 0
Midway Atoll 4 0.00179 0
Pearl & Hermes Reef 3 0.00141 0
French Frigate Shoals 5 0.00396 0
Ni’ihau 9 0.00642 0
Kaua’i 5 0.00548 0
O’ahu 6 0.00476 0
Maui Nui 5 0.00431 0
Kona Coast 12 0.00883 0
S�amoa 13 0.01977 0
� 2010 Blackwell Publishing Ltd
pled once. When the skin-swabbing technique had been
used, 31 individuals had been re-sampled once, three
individuals had been re-sampled twice and one individ-
ual had been re-sampled four times. A total of 30 indi-
viduals were re-sampled one or more years apart.
Twenty-seven of these were re-sampled at the same
island ⁄ atoll (including samples collected from all
islands except Ni’ihau, Kaua’i and O’ahu), and three
were re-sampled at a different location: two juveniles
(one male and one female) were sampled at Midway in
2001 and at Kure in 2003 (�97 km apart), and one adult
female was sampled at Ni’ihau in 2003 and at Kaua’i in
2005 (sampling locations 37 km apart). All analyses
were carried out with these three ‘migrants’ included in
the location at which they were first sampled, and also
with these migrants removed from the dataset. Results
did not differ with or without the migrants included in
the dataset, and here we report the results obtained
hin skin specimens collected in the Hawaiian Archipelago and
Groups
Sex
Males Females Unknown
NA 30 21 0
NA 80 29 10
NA 29 18 0
10 22 10 1
8 16 29 0
13 13 19 0
15 23 15 2
10 32 26 1
14 45 34 0
1 10 6 0
71 300 207 14
versity statistics for spinner dolphins sampled at each location:
lleles; Ho, observed heterozygosity; He, expected heterozygosity
Microsatellites
k
Allele
richness Ho He
.395 7.9 6.31 0.710 0.718
.405 8.4 6.27 0.716 0.713
.200 7.6 6.17 0.710 0.707
.491 8.3 7.10 0.750 0.762
.656 8.6 7.02 0.733 0.801
.429 8 6.76 0.734 0.718
.582 8.3 6.88 0.726 0.737
.461 9.4 6.98 0.727 0.732
.721 9.9 6.89 0.742 0.747
.975 9.6 9.60 0.856 0.814
738 K. R. ANDREWS ET AL.
when migrants were removed from the dataset. After
removal of replicate and migrant specimens, the dataset
consisted of 521 dolphins (Table 2), based on 420 biop-
sies and 101 skin swabs. Of the biopsies, two were col-
lected from dolphins that stranded on O’ahu. All of the
skin swabs were collected at Midway.
For each island ⁄ atoll the highest pairwise relatedness
value and the average of the five highest pairwise relat-
edness values were within the 95% confidence intervals
of the null distributions, with the exception of the high-
est pairwise relatedness value for O’ahu. To investigate
the influence of the related pair of individuals in the
O’ahu dataset on tests for population structure, F-statis-
tics analyses (see below) were conducted with and
without one of the individuals in the pair of related
individuals from O’ahu. Pairwise F-statistic values dif-
fered by no more than 0.006 between these analyses,
and the significance of P-values did not change. There-
fore, a bias correction for the presence of closely related
individuals was not implemented in this study, and the
analyses reported here include the pair of related indi-
viduals from O’ahu.
Microsatellite quality control
No microsatellite loci deviated from Hardy Weinberg
equilibrium or linkage equilibrium at any island or atoll
after Bonferroni correction. Loci showed no evidence
for null alleles, large allele dropout, or scoring error
due to stutter peaks at any island or atoll after Bonfer-
roni correction, although deviation from the expected
level of homozygosity was found for locus 415 ⁄ 416 at
Ni’ihau.
The average amount of missing allelic data per locus
was 0.7% for biopsies and 4.4% for skin swabs. Scoring
error rate was estimated at 0.7% for biopsies and 0.9%
for skin swabs. These error rates are similar to others
reported in the literature for studies utilising microsatel-
lite data (Bonin et al. 2004).
Genetic diversity and population structure
Mitochondrial DNA analyses revealed a total of 29
haplotypes and 43 variable sites (GenBank Accession
Numbers GU253256 to GU253284). Both haplotype and
nucleotide diversities for mtDNA (Table 3) were signifi-
cantly higher (P < 0.05) at S�amoa than at any island ⁄ a-
toll in the Hawaiian Archipelago, with the exception of
nucleotide diversity at the Kona Coast (nearly signifi-
cant, P = 0.054). Within the Hawaiian Archipelago, hap-
lotype diversities were significantly different (P < 0.05)
for all pairwise comparisons except Kure vs. Midway;
French Frigate vs. Maui; and Kaua’i vs. Kure, Midway,
French Frigate, and Maui. For nucleotide diversity, most
pairwise comparisons were not significant within the
Hawaiian Archipelago, with the exceptions (P < 0.05) of
the Kona Coast vs. each of the far-NWHI; O’ahu vs.
each of the far-NWHI; and Pearl & Hermes vs. French
Frigate and Ni’ihau (see Table 3). For microsatellite
allelic richness, pairwise comparisons were significant
for S�amoa vs. the far-NWHI (Kure, Midway, and Pearl
& Hermes) (P < 0.05) and were nearly significant for
S�amoa vs. the other Hawaiian Islands (P £ 0.069), with
S�amoa having higher allelic richness in all cases. Allelic
richness was not significantly different for any pairwise
comparisons within the Hawaiian Archipelago.
The mtDNA haplotype network showed strikingly
different patterns for Hawai’i vs. S�amoa (Fig. 2). When
taking into consideration the difference in sample sizes
between these two locations (S�amoa n = 16, Hawai’i
n = 505), proportionately far more haplotypes were
observed in S�amoa (13 haplotypes) than Hawai’i (19
haplotypes), and S�amoan haplotypes were more geneti-
cally distant from each other than were Hawaiian hapl-
otypes (p = 0.0198 vs. p = 0.0014–0.0088). The dataset
from Hawai’i was dominated by two haplotypes,
whereas haplotypes were relatively equifrequent in the
dataset from S�amoa (Fig. 2). Three haplotypes were
shared between Hawai’i and S�amoa, but the most com-
mon haplotypes in Hawai’i were not detected in S�amoa.
However, the network showed no evidence for phylog-
eographic structuring of mtDNA lineages between
Hawai’i and S�amoa; the haplotypes found exclusively
at S�amoa or Hawai’i were scattered throughout the
network.
One mtDNA haplotype was highly distinct from all
other haplotypes in the network (Fig. 2). This haplotype
was at least nine mutational steps from any other hap-
lotype, and therefore did not connect to any other hap-
lotype in the 95% TCS connection limit. This haplotype
was observed at French Frigate Shoals, Kaua’i, and
S�amoa. To confirm that individuals with this haplotype
were not mis-identified congeners, the haplotype was
compared in a neighbour-joining phylogenetic tree with
mtDNA control region haplotypes from all recognized
members of the genus Stenella, as well as seven other
odontocete species. The haplotype consistently fell
within the well-supported and monophyletic spinner
dolphin group (data not shown).
For F-statistics analyses, patterns of significance and
relative values between islands and atolls throughout
Hawai’i and S�amoa were similar for mtDNA and
microsatellites, and for the different types of F-statistics
(Table 4). As expected, the highest F-statistic values
were found between S�amoa and the Hawaiian
islands ⁄ atolls. Significant population differentiation was
also found between most Hawaiian islands ⁄ atolls, with
some exceptions: adjacent Midway and Kure were not
� 2010 Blackwell Publishing Ltd

Fig. 2 Parsimony network of mtDNA
control region haplotypes from different
islands and atolls in the Hawaiian
Archipelago and American S�amoa.
Diameters of circles are proportional to
the frequency of the haplotype. Hash
marks and nodes represent mutational
steps separating haplotypes. Locations
in the far-Northwestern Hawaiian
Islands are shades of blue, and locations
in the Main Hawaiian Islands are
shades of red and purple. The haplo-
type within the dashed-line box was at
least nine mutational steps from the
closest haplotype and did not connect
with ‡ 95% confidence anywhere in the
network.
GE NETIC STRUCTURE OF HAWAIIAN SPINNER DOLPHIN 73 9
distinct for all F-statistics, and French Frigate Shoals,
Ni’ihau, Kaua’i and O’ahu were not distinct from each
other for most F-statistics. The highest pairwise F-statis-
tic values within Hawai’i generally involved compari-
sons with the Kona Coast.
Bayesian clustering analyses indicated similar pat-
terns of population structure as did F-statistics (Fig. 3).
The highest average posterior probability occurred at
K = 4 (Fig. 3a), although variance was relatively high
for all K ‡ 4. Despite this high variance, visual inspec-
tion of the output for all K > 1 indicated similar parti-
tioning into population clusters. For example, for both
K = 4 (Fig. 3a) and K = 8 (Fig. 3b), visual inspection of
the output revealed partitioning into four primary pop-
ulation clusters including S�amoa; the far-NWHI; French
Frigate Shoals combined with all the MHI except the
Kona Coast; and the Kona Coast. Based on these results,
we chose K = 4 as the most probable value. When anal-
yses were conducted without the S�amoa dataset, the
highest average posterior probability occurred at K = 3,
and visual inspection of the output showed similar pat-
terns of population clustering within the Hawaiian
Islands as did the analyses that included the S�amoa
dataset (data not shown).
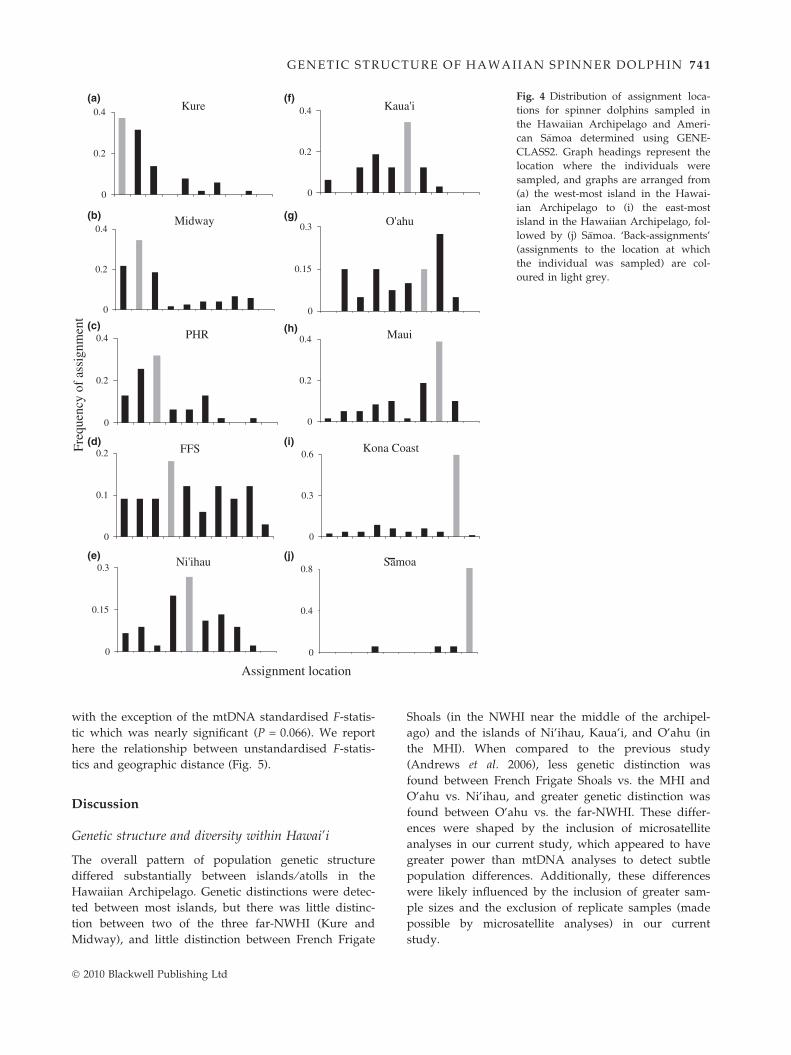
GENECLASS2 assignment tests provided evidence for
relative migration levels consistent with F-statistics and
STRUCTURE results (Fig. 4). For samples collected at each
island ⁄ atoll except O’ahu, more individuals were
assigned to the island at which they were sampled
� 2010 Blackwell Publishing Ltd
(here we refer to these individuals as ‘back-assigned’)
than to any other island, indicating some site fidelity at
each island. Migration appeared to be relatively high
between the far-NWHI (Kure, Midway, and Pearl &
Hermes Reef), but low between the far-NWHI vs. other
islands ⁄ atolls; of all the individuals sampled in the far-
NWHI, 75.6% were assigned back to the far-NWHI.
Islands with the lowest percent back-assignments were
French Frigate Shoals (18.2%) and O’ahu (15.0%), sug-
gesting that these islands have the highest migration
rates in Hawai’i. For samples collected at O’ahu, more
individuals were actually assigned to adjacent Maui
(27.5%) than to O’ahu. The Kona Coast had the highest
percent back-assignments (59.5%) in Hawai’i, and
S�amoa had the highest percent back-assignments overall
(81.3%).
None of the six tests for sex-biased dispersal showed
significant differences between males and females
within the Hawaiian Archipelago (P > 0.05). After tak-
ing into account results of the genetic structure analy-
ses, sex-biased dispersal tests were also conducted
treating the far-NWHI and MHI ⁄ French Frigate Shoals
as two separate regions. These tests also showed no evi-
dence for sex-biased dispersal in either region
(P > 0.05).
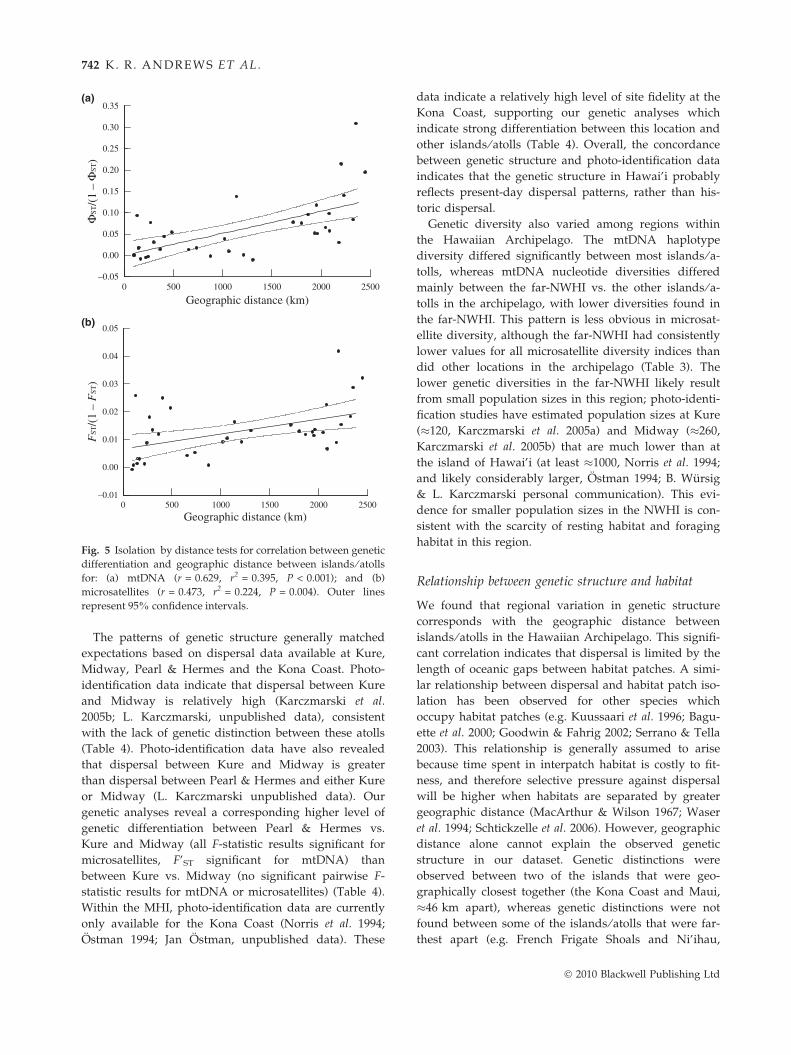
Genetic differentiation was significantly correlated
with geographic distance across the Hawaiian Archipel-
ago (Spearman’s rank correlation, P < 0.05) for both
mtDNA and microsatellites and each type of F-statistic,
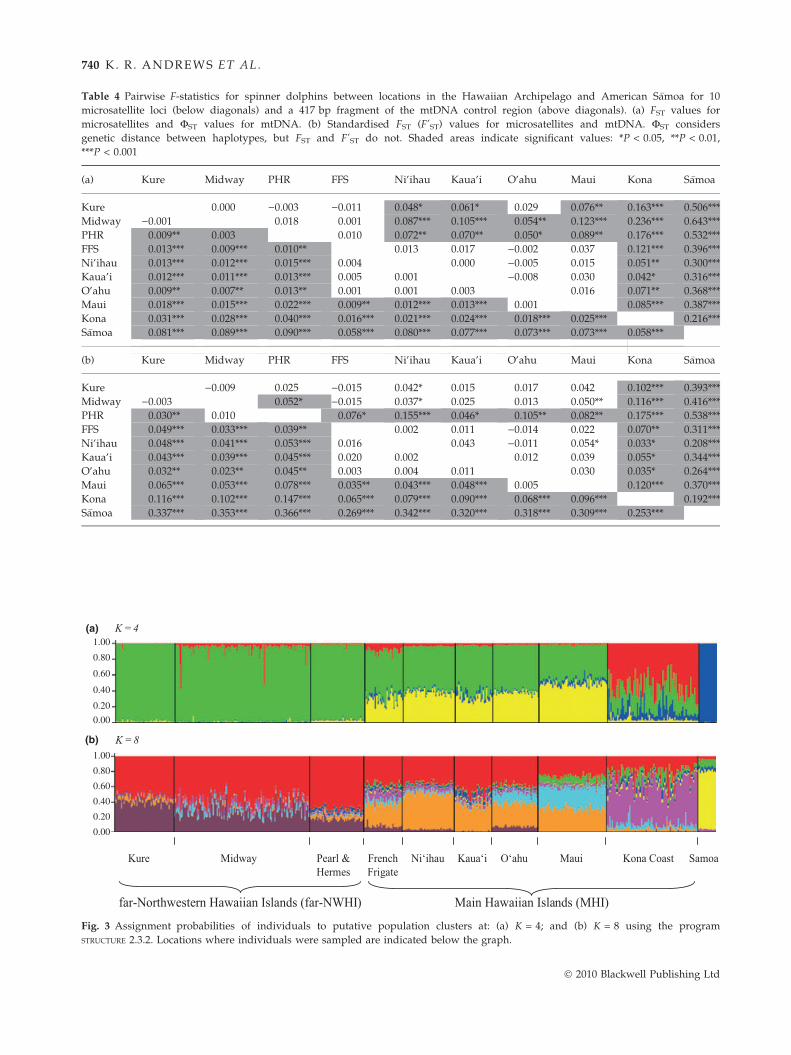
Table 4 Pairwise F-statistics for spinner dolphins between locations in the Hawaiian Archipelago and American S�amoa for 10
microsatellite loci (below diagonals) and a 417 bp fragment of the mtDNA control region (above diagonals). (a) FST values for
microsatellites and FST values for mtDNA. (b) Standardised FST (F’ST) values for microsatellites and mtDNA. FST considers
genetic distance between haplotypes, but FST and F’ST do not. Shaded areas indicate significant values: *P < 0.05, **P < 0.01,
***P < 0.001
(a) Kure Midway PHR FFS Ni’ihau Kaua’i O’ahu Maui Kona S�amoa
Kure 0.000 )0.003 )0.011 0.048* 0.061* 0.029 0.076** 0.163*** 0.506***
Midway )0.001 0.018 0.001 0.087*** 0.105*** 0.054** 0.123*** 0.236*** 0.643***
PHR 0.009** 0.003 0.010 0.072** 0.070** 0.050* 0.089** 0.176*** 0.532***
FFS 0.013*** 0.009*** 0.010** 0.013 0.017 )0.002 0.037 0.121*** 0.396***
Ni’ihau 0.013*** 0.012*** 0.015*** 0.004 0.000 )0.005 0.015 0.051** 0.300***
Kaua’i 0.012*** 0.011*** 0.013*** 0.005 0.001 )0.008 0.030 0.042* 0.316***
O’ahu 0.009** 0.007** 0.013** 0.001 0.001 0.003 0.016 0.071** 0.368***
Maui 0.018*** 0.015*** 0.022*** 0.009** 0.012*** 0.013*** 0.001 0.085*** 0.387***
Kona 0.031*** 0.028*** 0.040*** 0.016*** 0.021*** 0.024*** 0.018*** 0.025*** 0.216***
S�amoa 0.081*** 0.089*** 0.090*** 0.058*** 0.080*** 0.077*** 0.073*** 0.073*** 0.058***
(b) Kure Midway PHR FFS Ni’ihau Kaua’i O’ahu Maui Kona S�amoa
Kure )0.009 0.025 )0.015 0.042* 0.015 0.017 0.042 0.102*** 0.393***
Midway )0.003 0.052* )0.015 0.037* 0.025 0.013 0.050** 0.116*** 0.416***
PHR 0.030** 0.010 0.076* 0.155*** 0.046* 0.105** 0.082** 0.175*** 0.538***
FFS 0.049*** 0.033*** 0.039** 0.002 0.011 )0.014 0.022 0.070** 0.311***
Ni’ihau 0.048*** 0.041*** 0.053*** 0.016 0.043 )0.011 0.054* 0.033* 0.208***
Kaua’i 0.043*** 0.039*** 0.045*** 0.020 0.002 0.012 0.039 0.055* 0.344***
O’ahu 0.032** 0.023** 0.045** 0.003 0.004 0.011 0.030 0.035* 0.264***
Maui 0.065*** 0.053*** 0.078*** 0.035** 0.043*** 0.048*** 0.005 0.120*** 0.370***
Kona 0.116*** 0.102*** 0.147*** 0.065*** 0.079*** 0.090*** 0.068*** 0.096*** 0.192***
S�amoa 0.337*** 0.353*** 0.366*** 0.269*** 0.342*** 0.320*** 0.318*** 0.309*** 0.253***
1.00
0.80
0.60
0.40
0.20
0.00
1.00
0.80
0.60
0.40
0.20
0.00
(a)
(b)
Fig. 3 Assignment probabilities of individuals to putative population clusters at: (a) K = 4; and (b) K = 8 using the program
STRUCTURE 2.3.2. Locations where individuals were sampled are indicated below the graph.
740 K. R. ANDREWS ET AL.
� 2010 Blackwell Publishing Ltd
PHR
FFS
Ni'ihau
O'ahu
Samoa
Kure
Midway
Maui0.4
0.2
0
0.15
0.3
0
0.6
0.3
0
Kona Coast
Kaua'i0.4
0.2
0
0.8
0.4
0
0.3
0.15
0
0
0.1
0.2
0
0.2
0.4
0.2
0.4
0
0.4
0.2
0
Freq
uenc
y of
ass
ignm
ent
Assignment location
(a) (f)
(b) (g)
(d) (i)
(e) (j)
(c) (h)
Fig. 4 Distribution of assignment loca-
tions for spinner dolphins sampled in
the Hawaiian Archipelago and Ameri-
can S�amoa determined using GENE-
CLASS2. Graph headings represent the
location where the individuals were
sampled, and graphs are arranged from
(a) the west-most island in the Hawai-
ian Archipelago to (i) the east-most
island in the Hawaiian Archipelago, fol-
lowed by (j) S�amoa. ‘Back-assignments’
(assignments to the location at which
the individual was sampled) are col-
oured in light grey.
GE NETIC STRUCTURE OF HAWAIIAN SPINNER DOLPHIN 74 1
with the exception of the mtDNA standardised F-statis-
tic which was nearly significant (P = 0.066). We report
here the relationship between unstandardised F-statis-
tics and geographic distance (Fig. 5).
Discussion
Genetic structure and diversity within Hawai’i
The overall pattern of population genetic structure
differed substantially between islands ⁄ atolls in the
Hawaiian Archipelago. Genetic distinctions were detec-
ted between most islands, but there was little distinc-
tion between two of the three far-NWHI (Kure and
Midway), and little distinction between French Frigate
� 2010 Blackwell Publishing Ltd
Shoals (in the NWHI near the middle of the archipel-
ago) and the islands of Ni’ihau, Kaua’i, and O’ahu (in
the MHI). When compared to the previous study
(Andrews et al. 2006), less genetic distinction was
found between French Frigate Shoals vs. the MHI and
O’ahu vs. Ni’ihau, and greater genetic distinction was
found between O’ahu vs. the far-NWHI. These differ-
ences were shaped by the inclusion of microsatellite
analyses in our current study, which appeared to have
greater power than mtDNA analyses to detect subtle
population differences. Additionally, these differences
were likely influenced by the inclusion of greater sam-
ple sizes and the exclusion of replicate samples (made
possible by microsatellite analyses) in our current
study.
FST
/(1
– F
ST)
0 500 1000 1500 2000 2500–0.01
0.00
0.01
0.02
0.03
0.04
0.05
Geographic distance (km)
ΦST
/(1
– Φ
ST)
0 500 1000 1500 2000 2500–0.05
0.00
0.05
0.10
0.15
0.20
0.25
0.30
0.35
Geographic distance (km)
(b)
(a)
Fig. 5 Isolation by distance tests for correlation between genetic
differentiation and geographic distance between islands ⁄ atolls
for: (a) mtDNA (r = 0.629, r2 = 0.395, P < 0.001); and (b)
microsatellites (r = 0.473, r2 = 0.224, P = 0.004). Outer lines
represent 95% confidence intervals.
742 K. R. ANDREWS ET AL.
The patterns of genetic structure generally matched
expectations based on dispersal data available at Kure,
Midway, Pearl & Hermes and the Kona Coast. Photo-
identification data indicate that dispersal between Kure
and Midway is relatively high (Karczmarski et al.
2005b; L. Karczmarski, unpublished data), consistent
with the lack of genetic distinction between these atolls
(Table 4). Photo-identification data have also revealed
that dispersal between Kure and Midway is greater
than dispersal between Pearl & Hermes and either Kure
or Midway (L. Karczmarski unpublished data). Our
genetic analyses reveal a corresponding higher level of
genetic differentiation between Pearl & Hermes vs.
Kure and Midway (all F-statistic results significant for
microsatellites, F’ST significant for mtDNA) than
between Kure vs. Midway (no significant pairwise F-
statistic results for mtDNA or microsatellites) (Table 4).
Within the MHI, photo-identification data are currently
only available for the Kona Coast (Norris et al. 1994;
Ostman 1994; Jan Ostman, unpublished data). These
data indicate a relatively high level of site fidelity at the
Kona Coast, supporting our genetic analyses which
indicate strong differentiation between this location and
other islands ⁄ atolls (Table 4). Overall, the concordance
between genetic structure and photo-identification data
indicates that the genetic structure in Hawai’i probably
reflects present-day dispersal patterns, rather than his-
toric dispersal.
Genetic diversity also varied among regions within
the Hawaiian Archipelago. The mtDNA haplotype
diversity differed significantly between most islands ⁄ a-
tolls, whereas mtDNA nucleotide diversities differed
mainly between the far-NWHI vs. the other islands ⁄ a-
tolls in the archipelago, with lower diversities found in
the far-NWHI. This pattern is less obvious in microsat-
ellite diversity, although the far-NWHI had consistently
lower values for all microsatellite diversity indices than
did other locations in the archipelago (Table 3). The
lower genetic diversities in the far-NWHI likely result
from small population sizes in this region; photo-identi-
fication studies have estimated population sizes at Kure
(�120, Karczmarski et al. 2005a) and Midway (�260,
Karczmarski et al. 2005b) that are much lower than at
the island of Hawai’i (at least �1000, Norris et al. 1994;
and likely considerably larger, Ostman 1994; B. Wursig
& L. Karczmarski personal communication). This evi-
dence for smaller population sizes in the NWHI is con-
sistent with the scarcity of resting habitat and foraging
habitat in this region.
Relationship between genetic structure and habitat
We found that regional variation in genetic structure
corresponds with the geographic distance between
islands ⁄ atolls in the Hawaiian Archipelago. This signifi-
cant correlation indicates that dispersal is limited by the
length of oceanic gaps between habitat patches. A simi-
lar relationship between dispersal and habitat patch iso-
lation has been observed for other species which
occupy habitat patches (e.g. Kuussaari et al. 1996; Bagu-
ette et al. 2000; Goodwin & Fahrig 2002; Serrano & Tella
2003). This relationship is generally assumed to arise
because time spent in interpatch habitat is costly to fit-
ness, and therefore selective pressure against dispersal
will be higher when habitats are separated by greater
geographic distance (MacArthur & Wilson 1967; Waser
et al. 1994; Schtickzelle et al. 2006). However, geographic
distance alone cannot explain the observed genetic
structure in our dataset. Genetic distinctions were
observed between two of the islands that were geo-
graphically closest together (the Kona Coast and Maui,
�46 km apart), whereas genetic distinctions were not
found between some of the islands ⁄ atolls that were far-
thest apart (e.g. French Frigate Shoals and Ni’ihau,
� 2010 Blackwell Publishing Ltd
GE NETIC STRUCTURE OF HAWAIIAN SPINNER DOLPHIN 74 3
�650 km apart). These examples are reflected in the
variance present in the graphical relationship between
genetic differentiation and geographic distance (Fig. 5)
and the nonsignificant correlation for mtDNA standar-
dised F-statistics.
A second environmental factor likely influencing
genetic structure is the availability of resources. Resting
habitat is thought to be a limiting resource for spinner
dolphins in Hawai’i, influencing both population size
and social structure at the different islands ⁄ atolls (Nor-
ris et al. 1994; Karczmarski et al. 2005b). Prey abundance
and density may also vary between islands and may act
as a limiting resource (Benoit-Bird 2004). Although rest-
ing habitat and prey abundance have not been quanti-
fied at all islands, these variables are likely closely
linked with island size. Our results show a trend that
spinner dolphin populations at the smallest islands (far-
NWHI, French Frigate Shoals, Ni’ihau, Kaua’i and
O’ahu) have the highest levels of gene flow. Because
smaller islands likely have fewer resources and smaller
populations than larger islands, the higher levels of
gene flow between smaller islands may result from
increased pressures of resource competition and
inbreeding (Greenwood 1980; Johnson & Gaines 1990;
Pusey & Wolf 1996).
Relationship between genetic structure and socialstructure
Social structure may be a third factor influencing popu-
lation connectivity in Hawai’i. In particular, Midway
and Kure (97 km distant) have stable groups and no
genetic distinctions between atolls, whereas the Kona
Coast has a fission-fusion society and is genetically dis-
tinct from Maui (46 km distant) and all other islands
(Norris et al. 1994; Ostman 1994; Karczmarski et al.
2005a, b). The spinner dolphins at Moorea in French
Polynesia show similarities to the Kona Coast in having
a fission-fusion social structure and genetic distinctions
from nearby island habitats (Oremus et al. 2007). The
apparent relationship between social and genetic struc-
tures may be counterintuitive; the islands with higher
group stability (Kure and Midway) have greater interis-
land gene flow than the islands with the fission-fusion
society (Kona Coast and French Polynesia). A greater
understanding of this relationship between social and
genetic structures can be gained through the photo-
identification data from Midway and Kure. These data
indicate that dispersal does not occur at a constant rate;
rather, dispersal occurs infrequently by groups of 30–60
dolphins with approximately equal numbers of males
and females, juveniles and adults. These dispersers
move between dolphin communities that are otherwise
stable, resident and socio-behaviourally discrete over
� 2010 Blackwell Publishing Ltd
long periods of time (Karczmarski et al. 2005b). Group
dispersal (called parallel dispersal) has been observed in
a few other species, including lions (Panthera leo, Pusey
& Packer 1987) and capuchins (Cebus capucinus, Jack &
Fedigan 2004), and is thought to function in maintain-
ing social relationships that are important for predator
avoidance, resource acquisition, intraspecific competi-
tion, or the raising of young (Handley & Perrin 2007).
Group dispersal at Midway and Kure may similarly
function to maintain social relationships in these highly
stable social communities, while still permitting gene
flow to alleviate pressures of inbreeding and resource
competition.
Sex-biased dispersal
The majority of mammalian species appear to alleviate
the pressures of inbreeding and kin competition
through male-biased dispersal (Greenwood 1980). In
contrast, our genetic analyses indicate that spinner dol-
phins throughout the Hawaiian Archipelago have equal
levels of dispersal for both sexes. Photographic identifi-
cation data from Midway and Kure support these
results, with approximately equal numbers of males
and females found to disperse between these atolls (L.
Karczmarski & S.H. Rickards unpublished data). How-
ever, genetic tests for sex-biased dispersal are known to
have low power (Goudet et al. 2002), and therefore
these results should be confirmed by mark-recapture
studies at other islands in the archipelago. A lack of
male-biased dispersal is relatively rare among odontoce-
te species; male-biased dispersal has been found for
spinner dolphins in French Polynesia (Oremus et al.
2007); bottlenose dolphins (Tursiops spp.) in western
and southeastern Australia (Krutzen et al. 2004; Moller
& Beheregaray 2004); Dall’s porpoises (Phocoenoides dalli,
Escorza-Trevino & Dizon 2000); sperm whales (Physeter
macrocephalus, Lyrholm et al. 1999); and belugas (Del-
phinapterus leucas, O’Corry-Crowe et al. 1997). However,
lack of sex-biased dispersal has been reported for bot-
tlenose dolphin in the Bahamas (Parsons et al. 2006), the
North Atlantic (Natoli et al. 2005; Querouil et al. 2007),
and the Mediterranean and Black Seas (Natoli et al.
2005).
Genetic isolation of Hawai’i
Geographic and genetic isolation of Hawaiian spinner
dolphins from other populations in the Pacific may also
influence social and genetic structure within Hawai’i.
For example, strong demographic isolation in the far-
NWHI is thought to influence the stable social structure
in this region (Karczmarski et al. 2005b). Previous stud-
ies have reported genetic distinctions between the Kona
744 K. R. ANDREWS ET AL.
Coast vs. other Pacific regions, providing evidence that
Hawai’i may be a demographically isolated archipelago
(Galver 2002; Johnston et al. 2008). Our results showing
genetic distinctions between S�amoa vs. all islands ⁄ atolls
in Hawai’i were consistent with this prediction. Further
evidence for the genetic isolation of Hawai’i comes
from the low mtDNA control region diversity in
Hawai’i, and especially in the far-NWHI. This diversity
is the lowest observed to date among spinner dolphins
worldwide (Galver 2002; Oremus et al. 2007), indicating
the presence of relatively small and isolated popula-
tions in Hawai’i. This isolation is likely due to the large
geographic distances separating Hawai’i from other
spinner dolphin populations; the closest island known
to host spinner dolphins is Palmyra Atoll, 1600 km
south of Hawai’i.
The origin of the divergent haplotype found at French
Frigate Shoals, Kaua’i, and S�amoa is unknown. It may
be a remnant haplotype from an ancestral population
which colonised both Hawai’i and S�amoa, or it may
have originated from a divergent population of spinner
dolphins at a location outside of Hawai’i or S�amoa.
Either way, the presence of this haplotype in both
Hawai’i and S�amoa demonstrates a genetic connection
between northern and southern hemispheres in the cen-
tral Pacific, although it is not clear whether this repre-
sents historic gene flow or low levels of ongoing gene
flow. Oremus et al. (2007) suggest that low levels of
gene flow occur between island-associated spinner dol-
phin populations across the Pacific, creating a metapop-
ulation dynamic. This idea of a Pacific metapopulation
was advanced to explain the high mtDNA diversity,
despite small population sizes, at islands in French
Polynesia (Oremus et al. 2007). However, if ongoing
gene flow is occurring between Hawai’i and other loca-
tions, this gene flow is not sufficient to retain high
mtDNA diversity in Hawai’i.
Comparison with other species in Hawai’i: populationstructure
The island fidelity and genetic structure observed for
spinner dolphins are not unusual for odontocete species
in the Hawaiian Archipelago, despite the capabilities of
odontocetes for long-distance movement. Photo-identifi-
cation and genetic data have revealed that bottlenose
dolphins have unusually high fidelity to each MHI,
when compared to other oceanic islands (Martien et al.
2005; Baird et al. 2009). Rough-toothed dolphins (Steno
bredanensis) and two species of beaked whales (Ziphius
cavirostris and Mesoplodon densirostris) also exhibit site
fidelity at one or more Hawaiian Islands, despite being
deep-water species (McSweeney et al. 2007; Baird et al.
2008b). Another species found commonly in deep
waters, false killer whales (Pseudorca crassidens), did not
exhibit fidelity to individual islands in Hawai’i (Baird
et al. 2008a), but had lower genetic diversity in near-
shore waters of Hawai’i, as well as genetic distinctions
between nearshore and offshore populations. These
data indicate that Hawai’i hosts a small, demographi-
cally isolated population of false killer whales (Chivers
et al. 2007). Short-finned pilot whales in Hawai’i are
also genetically distinct from other populations in the
Pacific (Chivers et al. 2003). The fidelity of odontocetes
to the Hawaiian Archipelago is probably driven by the
predictability of food resources in the waters surround-
ing the islands, as well as the large geographic dis-
tances separating this archipelago from any other
coastal habitat.
The genetic distinctions for spinner dolphins
between Hawaiian Islands contrasts strongly with the
limited genetic subdivision observed in similarly dis-
tributed marine fishes. Molecular surveys of the
Hawaiian grouper (Epinephelus quernus, Rivera et al.
2004), three surgeonfishes (Eble et al. 2009), and the
bigscale soldierfish (Myripristis berndti, Craig et al.
2007) all revealed little to no genetic differentiation
across the archipelago. The evolutionary causes for
the more pronounced genetic structure in spinner dol-
phins likely include stronger genetic drift due to
small population sizes, as well as lower levels of
population connectivity resulting from strong social
structure and the lack of pelagic larval dispersal for
odontocete species. However, the genetic structure of
spinner dolphins also contrasts with that of a dis-
tantly related marine mammal species, the Hawaiian
monk seal, which is also distributed across the
Hawaiian Archipelago (J. Schultz, unpublished data).
The differences in genetic structure between spinner
dolphins and monk seals may be related to differ-
ences in their social structure; in contrast to spinner
dolphins, monk seals are solitary.
Management implications
Anthropogenic impacts on the spinner dolphin popula-
tions in Hawai’i are a growing concern. The primary
focus of this concern is the rapidly growing dolphin
ecotourism industry (Carretta et al. 2009). Our range-
wide genetic survey of Hawaiian spinner dolphins has
applications under the US Marine Mammal Protection
Act, to aid in defining and assessing management units.
The results of genetic assignment tests indicate rela-
tively high site fidelity at most islands, indicating that
the dolphins at each island should be managed sepa-
rately. Our data also highlight the potential vulnerabil-
ity of these dolphins to anthropogenic disturbance by
providing evidence that the populations in Hawai’i are
� 2010 Blackwell Publishing Ltd

GE NETIC STRUCTURE OF HAWAIIAN SPINNER DOLPHIN 74 5
small and genetically isolated from locations outside of
Hawai’i. The populations that are likely most vulnera-
ble to disturbance include the population at the Kona
Coast due to its higher level of philopatry, and the
population in the far-NWHI due to their very small and
socio-behaviourally discrete communities. Our results
also provide evidence that availability of resources may
be a critical factor influencing spinner dolphin distri-
bution, dispersal patterns, genetic structure and social
structure at the different Hawaiian Islands. Therefore,
efforts to conserve spinner dolphins would benefit
from characterisation of critical habitat at each of the
Hawaiian Islands and atolls.
Conclusions
Our analyses indicate that genetic structure between
islands is highly variable for spinner dolphins across
the Hawaiian Archipelago, with less genetic structuring
among the NHWI than among the MHI, and a trend for
smaller islands ⁄ atolls to have lower levels of genetic
diversity and differentiation. This variation in genetic
structure corresponds with variation in both habitat
and social structure, providing evidence that the popu-
lation-level response of spinner dolphins to different
island ⁄ atoll habitats within Hawai’i has involved shifts
in social behaviour, dispersal and consequent genetic
structure. Our results illustrate that social and genetic
structures are flexible within spinner dolphins and can
change in response to habitat differences across rela-
tively small geographic scales.
Acknowledgements
This research was conducted under NMFS Scientific Research
Permits No.’s 1007–1629 and 1000–1617 and University of
Hawai’i Animal Care Committee Protocol No. 01–014. We
thank Tetsuya Hirano, Malia Rivera, Steve Karl, April Harlin,
Malia Chow, Sarah Daley, Melinda Swanson, Kim Selkoe and
members of the ToBo Lab and the Grau Lab for assistance with
genetics laboratory work and analysis. We thank Bill Amos,
Sarah Mesnick and two anonymous reviewers for helpful com-
ments on a previous version of this paper. We thank the fol-
lowing people and organisations for assistance and ⁄ or support
in sample collection: Bud Antonelis, Robin Baird, Jason Baker,
Jay Barlow, Todd Buczyna, Suzanne Canja, Bruce Casler, Marie
Chapla, Susan Chivers, Lisa Davis, Mark Deakos, Vinnie DePa-
olo, Sonok and Gerry Deutscher, Ania Driscoll-Lind, Jeff Eble,
Chris Eggleston, Cari Eggleston, Beth Flint, Annie Gorgone,
Nancy Hoffman, Stuart Ibsen, Dave Johnston, Patti and Bruce
Jones, Randall Kosaki, Marc Lammers, Keith Larson, Amarisa
Marie, Carl Meyer, Darlene Moegerle, Charles Moore, Rodrigo
Moraga, Don Moses, Jan Ostman-Lind, Yannis Papastamatiou,
Robert Pitman, Marıa Jose Perez, Dick and Bonnie Robbins,
Jim and Robin Roser, Tony Sarabia, Rob Shallenberger, Dave
Smith, Robert Smith, Russel Sparks, Naomi Sugimura, Barbara
� 2010 Blackwell Publishing Ltd
Taylor, Kristen Taylor, Jen Tietjen, Jeff Walters, Daniel Web-
ster, Birgit Winning, Bernd Wursig, Chad Yoshinaga, Hawai’i
Department of Land and Natural Resources, Division of For-
estry & Wildlife and Division of Aquatic Resources, USA Fish
& Wildlife Service, Papah�anaumoku�akea Marine National
Monument, Hawaiian Islands Humpback Whale National Mar-
ine Sanctuary, NMFS Southwest Fisheries Science Center,
NMFS Pacific Islands Fisheries Science Center, Oceanic Society,
Ko Olina Marina, the crew of the NOAA R ⁄ V Hiialakai and
Texas Institute of Oceanography. Partial funding was provided
by: National Science Foundation Graduate Research Fellowship
Program; National Geographic Society; Pacific Marine Life
Foundation; National Fish and Wildlife Foundation; Anony-
mous Foundation; Maybelle Roth ARCS Scholarship; Jessie
Kay Fellowship; University of Hawai’i Sea Grant College Pro-
gram; University of Hawai’i Ecology, Evolution and Conserva-
tion Biology Program; Algalita Foundation; Sea Vision
Foundation; American Museum of Natural History; Watson T.
Yoshimoto Foundation; Animal Behavior Society Cetacean
Behavior and Conservation Award; and Project AWARE Foun-
dation. Research at Midway Atoll was partially sponsored by
Oceanic Society. Most genetic analyses were conducted in the
ToBo lab at Hawaii Institute of Marine Biology, which is sup-
ported by grants from the HIMB-NWHI Coral Reef Research
Partnership (NMSP MOA 2005-008 ⁄ 6882), University of Hawaii
Sea Grant College Program, National Science Foundation
(OCE-0454873 to B.W.B.; EPS-0554657 to University of Hawaii;
OCE-0623678 to R.J.T.). The views expressed herein are those
of the authors and do not necessarily reflect the views of NSF,
NOAA, the State of Hawaii, or any of their subagencies. This
is contribution #1378 from the Hawaii Institute of Marine Biol-
ogy and SOEST #7862.
References
Amos B, Hoelzel AR (1991) Long-term preservation of whale
skin for DNA analysis. Report of the International Whaling
Commission, Special Issue, 13, 99–103.
Amos B, Schlotterer C, Tautz D (1993) Social structure of pilot
whales revealed by analytical DNA profiling. Science, 30,
670–672.
Andrews KR, Karczmarski L, Au WWL et al. (2006) Patterns of
genetic diversity of the Hawaiian spinner dolphin (Stenella
longirostris). Atoll Research Bulletin, 543, 65–73.
Baguette M, Petit S, Queva F (2000) Population spatial
structure and migration of three butterfly species within the
same habitat network: consequences for conservation. Journal
of Applied Ecology, 37, 100–108.
Baird RW, Gorgone AM, McSweeney DJ et al. (2009)
Population structure of island-associated dolphins: evidence
from photo-identification of common bottlenose dolphins
(Tursiops truncatus) in the main Hawaiian Islands. Marine
Mammal Science, 25, 251–274.
Baird RW, Gorgone AM, McSweeney DJ et al. (2008a) False
killer whales (Pseudorca crassidens) around the main
Hawaiian Islands: Long-term site fidelity, interisland
movements, and association patterns. Marine Mammal
Science, 24, 591–612.
Baird RW, Webster DL, Mahaffy SD et al. (2008b) Site fidelity
and association patterns in a deep-water dolphin: rough-

746 K. R. ANDREWS ET AL.
toothed dolphins (Steno bredanensis) in the Hawaiian
Archipelago. Marine Mammal Science, 24, 535–553.
Baird RW, Whitehead H (2000) Social organization of
mammal-eating killer whales: group stability and dispersal
patterns. Canadian Journal of Zoology, 78, 2096–2105.
Ballance LT (1992) Habitat use patterns and ranges of the
bottlenosed dolphin in the Gulf of California, Mexico. Marine
Mammal Science, 8, 262–274.
Benoit-Bird KJ (2004) Prey caloric value and predator energy
needs: foraging predictions for wild spinner dolphins.
Marine Biology, 145, 435–444.
Benoit-Bird KJ, Au WWL (2003) Prey dynamics affect foraging
by a pelagic predator (Stenella longirostris) over a range of
spatial and temporal scales. Behavioral Ecology and
Sociobiology, 53, 364–373.
Bonin A, Bellemain E, Eidesen PB et al. (2004) How to track
and assess genotyping errors in population genetics studies.
Molecular Ecology, 13, 3261–3273.
Bowler DE, Benton TG (2005) Causes and consequences of
animal dispersal strategies: relating individual behaviour to
spatial dynamics. Biological Reviews, 80, 205–225.
Carretta JV, Forney KA, Lowry MS et al. (2009) USA Pacific
Marine Mammal Stock Assessments: 2008. USA Department
of Commerce, NOAA Technical Memorandum NMFS-
SWFSC-434, 334 pp.
Chivers SJ, Baird RW, McSweeney DJ et al. (2007) Genetic
variation and evidence for population structure in eastern
North Pacific false killer whales (Pseudorca crassidens).
Canadian Journal of Zoology, 85, 783–794.
Chivers SJ, LeDuc RG, Baird RW (2003) Hawaiian island
populations of false killer whales and short-finned pilot
whales revealed by genetic analysis. In: Abstracts of 15th
Biennial Conference on the Biology of Marine Mammals,
Greensboro, NC, USA, 14–19 December 2003.
Clement M, Posada D, Crandall KA (2000) TCS: a computer
program to estimate gene genealogies. Molecular Ecology, 9,
1657–1659.
Craig MT, Eble JA, Bowen BW, Robertson DR (2007) High
genetic connectivity across the Indian and Pacific Oceans in
the reef fish Myripristis berndti (Holocentridae). Marine
Ecology Progress Series, 334, 245–254.
Eble JA, Toonen RJ, Bowen BW (2009) Endemism and
dispersal: comparative phylogeography of three
surgeonfishes across the Hawaiian Archipelago. Marine
Biology, 156, 689–698.
Escorza-Trevino S, Dizon AE (2000) Phylogeography,
intraspecific structure and sex-biased dispersal of Dall’s
porpoise, Phocoenoides dalli, revealed by mitochondrial and
microsatellite DNA analyses. Molecular Ecology, 9, 1049–1060.
Excoffier L, Laval LG, Schneider S (2005) ARLEQUIN ver. 3.0: an
integrated software package for population genetics data
analysis. Evolutionary Bioinformatics Online, 1, 47–50.
Galver LM (2002) The molecular ecology of spinner dolphins,
Stenella longirostris: genetic diversity and population structure.
PhD Thesis, University of California, California.
Gerrodette T, Forcada J (2005) Nonrecovery of two spotted and
spinner dolphin populations in the eastern tropical Pacific
Ocean. Marine Ecology Progress Series, 291, 1–21.
Gilson A, Syvanen M, Levine K, Banks J (1998) Deer gender
determination by polymerase chain reaction: Validation
study and application to tissues, bloodstains, and hair
forensic samples from California. California Fish and Game,
84, 159–169.
Goodnight K, Queller D (1998) RELATEDNESS 5.4. Goodnight
software. Available at http://www.gsoftnet.us/GSoft.html.
Goodwin BJ, Fahrig L (2002) How does landscape structure
influence landscape connectivity? Oikos, 99, 552–570.
Goudet J (2001) FSTAT, a program to estimate and test gene
diversities and fixation indices. Available at http://
www.unil.ch/izea/softwares/fstat.html.
Goudet J, Perrin N, Waser P (2002) Tests for sex-biased
dispersal using bi-parentally inherited genetic markers.
Molecular Ecology, 11, 1103–1114.
Gowans S, Wursig B, Karczmarski L (2008) The social structure
and strategies of delphinids: Predictions based on an
ecological framework. In:Advances in Marine Biolog (ed Sims
DW). pp. 195–294, Elsevier Ltd, Amsterdam, The
Netherlands.
Greenwood PJ (1980) Mating systems, philopatry and dispersal
in birds and mammals. Animal Behaviour, 28, 1140–1162.
Handley LJL, Perrin N (2007) Advances in our understanding
of mammalian sex-biased dispersal. Molecular Ecology, 16,
1559–1578.
Harlin AD, Wursig B, Baker CS, Markowitz TM (1999) Skin
swabbing for genetic analysis: application to dusky dolphins
(Lagenorhynchus obscurus). Marine Mammal Science, 15, 409–
425.
Hedrick PW (2005) A standardized genetic differentiation
measure. Evolution, 59, 1633–1638.
Hoelzel AR (1998) Genetic structure of cetacean populations
in sympatry, parapatry, and mixed assemblages:
Implications for conservation policy. Journal of Heredity, 89,
451–458.
Hubisz MJ, Falush D, Stephens M, Pritchard JK (2009)
Inferring weak population structure with the assistance of
sample group information. Molecular Ecology Resources, 9,
1322–1332.
Jack KM, Fedigan L (2004) Male dispersal patterns in white-
faced capuchins, Cebus capucinus Part 1: patterns and causes
of natal emigration. Animal Behaviour, 67, 761–769.
Johnson ML, Gaines MS (1990) Evolution of dispersal:
theoretical models and empirical tests using birds and
mammals. Annual Review of Ecology and Systematics, 21, 449–
480.
Johnston DW, Robbins J, Chapla ME, Mattila DK, Andrews KR
(2008) Diversity, habitat associations and stock structure of
odontocete cetaceans in the waters of American Samoa,
2003–06. Journal of Cetacean Research and Management, 10, 59–
66.
Kalinowski S, Taper M, Marshall T (2007) Revising how the
computer program CERVUS accommodates genotyping error
increases success in paternity assignment. Molecular Ecology,
16, 1099–1006.
Karczmarski L, Rickards SH, Gowans S et al. (2005a) ‘One for
all and all for one’: intra-group dynamics of an insular
spinner dolphin population. In: Abstracts of the 16th Biennial
Conference on the Biology of Marine Mammals, San Diego, CA,
USA, 12–17 December 2005.
Karczmarski L, Wursig B, Gailey G, Larson KW, Vanderlip C
(2005b) Spinner dolphins in a remote Hawaiian atoll: social
grouping and population structure. Behavioral Ecology, 16,
675–685.
� 2010 Blackwell Publishing Ltd
GE NETIC STRUCTURE OF HAWAIIAN SPINNER DOLPHIN 74 7
Kimura M (1980) A simple method for estimating evolutionary
rates of base substitutions through comparative studies of
nucleotide sequences. Journal of Molecular Evolution, 16, 111–
120.
Krutzen M, Barre LM, Moller LM et al. (2002) A biopsy system
for small cetaceans: darting success and wound healing in
Tursiops spp. Marine Mammal Science, 18, 863–878.
Krutzen M, Sherwin WB, Berggren P, Gales N (2004)
Population structure in an inshore cetacean revealed by
microsatellite and mtDNA analysis: Bottlenose dolphins
(Tursiops sp.) in Shark Bay, Western Australia. Marine
Mammal Science, 20, 28–47.
Kuussaari M, Nieminen M, Hanski I (1996) An experimental
study of migration in the Glanville fritillary butterfly
Melitaea cinxia. Journal of Animal Ecology, 65, 791–801.
Lammers MO (2004) Occurence and behavior of Hawaiian
spinner dolphins (Stenella longirostris) along Oahu’s leeward
and south shores. Aquatic Mammals, 30, 237–250.
Lusseau D, Schneider K, Boisseau OJ et al. (2003) The
bottlenose dolphin community of Doubtful Sound features a
large proportion of long-lasting associations – can
geographic isolation explain this unique trait? Behavioral
Ecology and Sociobiology, 54, 396–405.
Lyrholm T, Leimar O, Johanneson B, Gyllensten U (1999) Sex-
biased dispersal in sperm whales: contrasting mitochondrial
and nuclear genetic structure of global populations.
Proceedings of the Royal Society of London Series B-Biological
Sciences, 266, 347–354.
MacArthur RH, Wilson EO (1967) The Theory of Island
Biogeography. Princeton University Press, Princeton, NJ.
Marten K, Psarakos S (1999) Long-term site fidelity and
possible long-term associations of wild spinner dolphins
(Stenella longirostris) seen off Oahu, Hawaii. Marine Mammal
Science, 15, 1329–1336.
Martien KK, Baird RW, Robertson KM (2005) Population
structure of bottlenose dolphins (Tursiops sp.) around the
main Hawaiian Islands. In: Abstracts of the 16th Biennial
Conference on the Biology of Marine Mammals, San Diego, CA,
USA, 12–17 December 2005.
McSweeney DJ, Baird RW, Mahaffy SD (2007) Site fidelity,
associations, and movements of Cuvier’s (Ziphius
cavirostris) and Blainville’s (Mesoplodon densirostris) beaked
whales off the island of Hawai’i. Marine Mammal Science,
23, 666–687.
Meirmans PG (2006) Using the AMOVA framework to
estimate a standardized genetic differentiation measure.
Evolution, 60, 2399–2402.
Moller LM, Beheregaray LB (2004) Genetic evidence for sex-
biased dispersal in resident bottlenose dolphins (Tursiops
aduncus). Molecular Ecology, 13, 1607–1612.
Natoli A, Birkun A, Aguilar A, Lopez A, Hoelzel AR (2005)
Habitat structure and the dispersal of male and female
bottlenose dolphins (Tursiops truncatus). Proceedings of the
Royal Society B-Biological Sciences, 272, 1217–1226.
Norris KS, Wursig B, Wells RS et al. (1994) The Hawaiian
Spinner Dolphin. University of California Press, Berkeley, CA.
O’Corry-Crowe GM, Suydam RS, Rosenberg A, Frost KJ, Dizon
AE (1997) Phylogeography, population structure and
dispersal patterns of the beluga whale Delphinapterus leucas
in the western Nearctic revealed by mitochondrial DNA.
Molecular Ecology, 6, 955–970.
� 2010 Blackwell Publishing Ltd
Oremus M, Poole MM, Steel D, Baker CS (2007) Isolation
and interchange among insular spinner dolphin
communities in the South Pacific revealed by individual
identification and genetic diversity. Marine Ecology-Progress
Series, 336, 275–289.
Ostman JSO (1994) Social organization and social behavior of
Hawai’ian spinner dolphins (Stenella longirostris). PhD
Dissertation, University of California, Santa Cruz.
Park SDE (2001) Trypanotolerance in West African Cattle and the
Population Genetic Effects of Selection. PhD Thesis, University
of Dublin, Dublin.
Parsons KM, Durban JW, Claridge DE et al. (2006) Population
genetic structure of coastal bottlenose dolphins (Tursiops
truncatus) in the Northern Bahamas. Marine Mammal Science,
22, 276–298.
Piry S, Alapetite A, Cornuet JM et al. (2004) GENECLASS2: a
software for genetic assignment and first-generation migrant
detection. Journal of Heredity, 95, 536–539.
Poole MM (1995) Aspects of behavioral ecology of spinner dolphins
(Stenella longirostris) in the nearshore waters of Mo’orea, French
Polynesia. PhD Thesis, University of California, Santa Cruz.
Posada D, Crandall KA (1998) MODELTEST: testing the model
of DNA substitution. Bioinformatics, 14, 817–818.
Pritchard JK, Stephens M, Donnelly P (2000) Inference of
population structure using multilocus genotype data.
Genetics, 155, 945–959.
Pusey A, Packer C (1987) Dispersal and philopatry. In:Primate
Societies (eds Smuts BB, Cheney DL, Seyfarth RM,
Wrangham RW). pp. 250–266, University of Chicago Press,
Chicago.
Pusey A, Wolf M (1996) Inbreeding avoidance in animals.
Trends in Ecology & Evolution, 11, 201–206.
Queller DC, Goodnight KF (1989) Estimating relatedness using
genetic markers. Evolution, 43, 258–275.
Querouil S, Silva MA, Freitas L et al. (2007) High gene flow in
oceanic bottlenose dolphins (Tursiops truncatus) of the North
Atlantic. Conservation Genetics, 8, 1405–1419.
Raymond M, Rousset F (1995) GENEPOP (version 1.2): population
genetics software for exact tests and ecumenicism. Journal of
Heredity, 86, 248–249.
Reilly SB (1990) Seasonal changes in distribution and habitat
differences among dolphins in the Eastern Tropical Pacific.
Marine Ecology Progress Series, 66, 1–11.
Rivera MAJ, Kelley CD, Roderick GK (2004) Subtle population
genetic structure in the Hawaiin grouper, Epinephelus quernus
(Serranidae) as revealed by mitochondrial DNA analyses.
Biological Journal of the Linnean Society, 81, 449–468.
Rousset F (1997) Genetic differentiation and estimation of gene
flow from F-statistics under isolation by distance. Genetics,
145, 1219–1228.
Schtickzelle N, Mennechez G, Baguette M (2006) Dispersal
depression with habitat fragmentation in the bog fritillary
butterfly. Ecology, 87, 1057–1065.
Sellas AB, Wells RS, Rosel PE (2005) Mitochondrial and
nuclear DNA analyses reveal fine scale geographic structure
in bottlenose dolphins (Tursiops truncatus) in the Gulf of
Mexico. Conservation Genetics, 6, 715–728.
Serrano D, Tella JL (2003) Dispersal within a spatially
structured population of lesser kestrels: the role of spatial
isolation and conspecific attraction. Journal of Animal Ecology,
72, 400–410.

748 K. R. ANDREWS ET AL.
Tamura K, Nei M (1993) Estimation of the number of
nucleotide substitutions in the control region of
mitochondrial DNA in humans and chimpanzees. Molecular
Biology and Evolution, 10, 512–526.
Valsecchi E, Amos W (1996) Microsatellite markers for the
study of cetacean populations. Molecular Ecology, 5, 151–156.
Van Oosterhout C, Hutchinson WF, Wills DPM, Shipley P
(2004) MICRO-CHECKER: software for identifying and correcting
genotyping errors in microsatellite data. Molecular Ecology
Notes, 4, 535–538.
Waser PM, Creel SR, Lucas JR (1994) Death and disappearance:
estimating mortality risks associated with philopatry and
dispersal. Behavioral Ecology, 5, 135–141.
Wells RS, Scott MD, Irvine AB (1987) The social structure of
free-ranging bottlenose dolphins. In:Current Mammalog (ed
Genoways HH). pp. 247–305, Plenum Press, NY.
Wilson GA, Rannala B (2003) Bayesian inference of recent
migration rates using multilocus genotypes. Genetics, 163,
1177–1191.
K.A. studies the influence of habitat and behavior on genetic
structure and diversity, with application to conservation issues.
L.K. studies cetacean behavioural ecology, especially sociobe-
havioural complexity and comparative population ecology of
delphinids and other group-living mammals. S.R.’s research
interests include cetacean population biology, behavioural ecol-
ogy, and social organization, with an emphasis on conservation
in the Hawaiian archipelago. C.V. collaborates on the collection
of long term photographic-identification and behavioural data
of spinner dolphins at Kure and Midway Atolls and Pearl &
Hermes Reef. B.B. studies the evolution and conservation
genetics of marine vertebrates, with an emphasis on how biodi-
versity is generated and maintained. E.G.G.’s research focuses
on the role of the neuroendocrine system in orchestrating the
environmental physiology of fish and other vertebrates. R.T.
studies coral reef connectivity.
� 2010 Blackwell Publishing Ltd


![[ALBUM - SONGBOOK - PIANO] Rolling Stones _-_ the Best of Rolling Stones 1963-1973.pdf](https://img.pdfslide.us/doc/110x75/55cf9713550346d0338fa23e/album-songbook-piano-rolling-stones-the-best-of-rolling-stones-1963-1973pdf.jpg)


![[ALBUM - SONGBOOK - PIANO] Rolling Stones _-_ the Best of Rolling Stones 1963-1973](https://img.pdfslide.us/doc/110x75/54fd531c4a795937538b5349/album-songbook-piano-rolling-stones-the-best-of-rolling-stones-1963-1973.jpg)