Embed Size (px)
Citation preview
- 1 - Tuesday 27th July 2021
This document is for private circulation, and must be read in conjunction with the disclaimer on the last page.
SUBSCRIBE
Issue Details Rolex Rings Ltd (RRL), established in 2003, is in the business of
manufacturing of bearings and auto components. It has over 60 customers
in 17 countries across automobiles(2W/PV/CV/EV), bearings, wind turbines
and railways, among other segments. It has the fifth largest forging capacity
of 1,44,750 MTPA and exports 56% of its total turnover.
RRL is one of the largest manufacturers of bearing rings in India (inner and
outer) with a wide range of offerings (from 25 to 900 mm in diameters and
0.01 kgs to 163+ kgs in weight). It manufactures ~150 different auto
components and this segment comprises 40-42% of its total turnover.
With three manufacturing units in Rajkot, the company has 22 forging lines,
machining facilities consisting of 528 spindles (combined installed capacity
of 69 million parts p.a.), and other machinery including heat treatment
furnaces, cold rolling machines and other infrastructure. Its equipment is
sourced from the best global manufacturers- DMG, FUJI, ACE, TSUGAMI,
HYUNDAI, MAZAK and MURATEE. The location of its manufacturing
facilities at Rajkot helps it in accessing various automotive clusters in North
India, West India and South India, as well as cater to the export markets
through the ports of Kandla, Mundra and Pipavav.
Apart from raw materials, power is one of the key constituents of the cost
element. In order to optimize power costs, RRL is increasing the
contribution from renewable energy sources and is planning to add another
16 MW of solar energy to its existing renewable portfolio of 8.75MW wind at
Bhogat and 1.58 MW solar at Lamba. This should help improve operating
margins significantly.
Impacted by the pandemic, RRL’s operating performance declined sharply.
Over the period FY19-21, the capacity utilization dropped to 34% from 50%
leading to a 17.4% / 26.4% CAGR decline in the Revenue / EBITDA to INR
616.3 / 108.9 crs. The Auto Components business de-grew at a CAGR of -
10.2% to INR 237.3 cr, while the bearing business de-grew at a CAGR of -
21.3% to INR 331 cr.
Listing BSE & NSE
Open Date 28th July 2021
Close Date 30th July 2021
Price Band INR 880-900
Market Lot 16 shares
Minimum Lot 1 Lot
Issue Structure
Offer for sale 92%
Fresh Issue 8%
Issue Size INR 731 cr
Total no of shares 8,122,222
QIB share (%) ≥ 50%
Non Inst share (%) ≤ 15%
Retail share (%) ≤ 35%
Shareholding Pattern
Pre
(%) Post (%)
Promoters 59.0 57.6
Institutional 41.0 27.5
Public 0.0 14.9
Rolex Rings Ltd.
IPO
NO
TE
Sales EBITDA Net
Profit EBITDA
(%)
Net Profit
(%)
EPS ₹
BV ₹
RoE (%)
RoIC (%)
P/E (x)
P/BV (x)
EV/EBITDA (x)
FY20 666.0 121.4 52.9 18.2 7.9 19.4 98.4 19.7 16.0 46.3 9.1 22.0
FY21 616.3 108.9 87.0 17.7 14.1 31.9 131.0 24.4 12.3 28.2 6.9 24.4
FY22E 1,030.9 218.9 138.0 21.2 13.4 50.7 202.2 25.1 20.1 17.8 4.5 12.2
FY23E 1,288.7 310.4 218.5 24.1 17.0 80.2 282.4 28.4 26.4 11.2 3.2 8.2
FY24E 1,472.8 320.9 213.7 21.8 14.5 78.5 360.9 21.7 22.9 11.5 2.5 7.5
Key Financials (in ₹ crores)
- 2 - Tuesday 27th July 2021
This document is for private circulation, and must be read in conjunction with the disclaimer on the last page.
EBITDA margins slumped by 1090 bps to 17.7% due to higher freight charges and lower revenue. However, over the same period PAT grew at a CAGR of 21.4% (to INR 87 cr) on utilization of MAT credit entitlement. PAT margins surged by 758bps to 14.1%. The net debt to equity declined from 1.8X in FY19 to 0.7X in FY21, while the gross debt was lowered to INR 249 cr in FY21 from INR 385 cr in FY19. The decline in revenue and lower operating margins impacted the return ratios too. RoE and RoIC, declined to 24.4% (-304bps) and 12.3% (-1328bps) respectively. The management is looking to raise INR 731 cr through a maiden public offering (INR 675 cr through OFS and INR 56 cr through a fresh issue). The net proceeds from the fresh issue will be utilized for long term working capital requirements and the balance will go towards other corporate expenses. We are optimistic about the global efforts to deal with the pandemic and the surging liquidity coupled with the acceleration of the EV trend and China+1 policies will help RRL return to the growth trajectory. Accordingly, we forecast that utilizations will improve to 80% by FY24. Consequently, Revenue / EBITDA / PAT are expected to grow at a CAGR 33.7% / 43.4% / 35.9% to INR 1,473 / 321 / 214 crs by FY24 respectively. EBITDA and net margins are expected to improve by 413bps (to 21.8%) and 40bps (to 14.5%) due to the operating leverage from the higher capacity utilizations and savings from commencement of renewable’s energy contribution. This will lead to a sharp improvement in RoIC to 22.9% (+1063bps). However, RoE is expected to marginally decline to 21.7% (-263bps). Valuation We initiate coverage with a SUBSCRIBE for long term investing. Our target price of INR 1,177 (15X FY24 earnings) represents a potential upside of 31% from the offer price of INR 900 over a period of 18-24 months. Better than expected recovery in the global economy, a rebound of the domestic automotive industry and the management’s guidance on higher capacity utilization in the coming years bolster our confidence in improving revenue growth and profitability.
- 3 - Tuesday 27th July 2021
This document is for private circulation, and must be read in conjunction with the disclaimer on the last page.
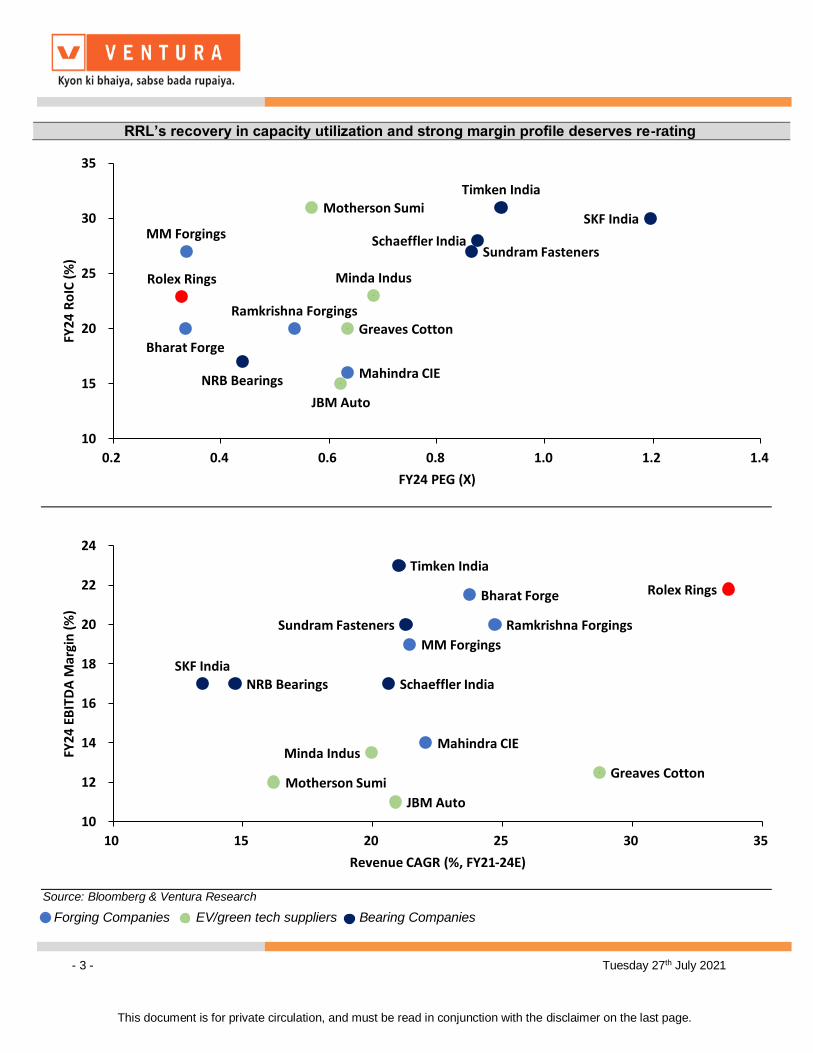
RRL’s recovery in capacity utilization and strong margin profile deserves re-rating
Source: Bloomberg & Ventura Research
Forging Companies EV/green tech suppliers Bearing Companies
Rolex Rings
Bharat Forge
Ramkrishna Forgings
MM ForgingsSKF India
Schaeffler India
NRB Bearings
Timken IndiaMotherson Sumi
Minda Indus
Sundram Fasteners
Mahindra CIE
JBM Auto
Greaves Cotton
10
15
20
25
30
35
0.2 0.4 0.6 0.8 1.0 1.2 1.4
FY24
Ro
IC (
%)
FY24 PEG (X)
Rolex RingsBharat Forge
Ramkrishna Forgings
MM Forgings
SKF IndiaSchaeffler IndiaNRB Bearings
Timken India
Motherson Sumi
Minda Indus
Sundram Fasteners
Mahindra CIE
JBM Auto
Greaves Cotton
10
12
14
16
18
20
22
24
10 15 20 25 30 35
FY24
EB
ITD
A M
argi
n (
%)
Revenue CAGR (%, FY21-24E)
- 4 - Tuesday 27th July 2021
This document is for private circulation, and must be read in conjunction with the disclaimer on the last page.
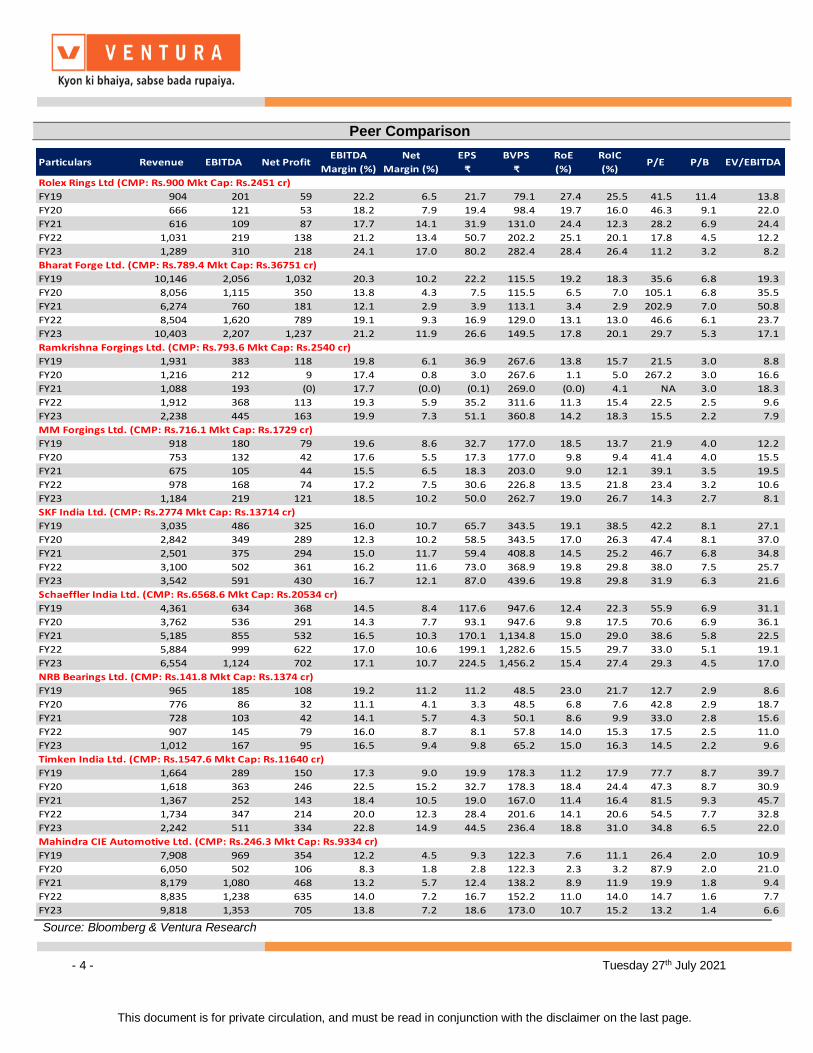
Peer Comparison
Source: Bloomberg & Ventura Research
Particulars Revenue EBITDA Net ProfitEBITDA
Margin (%)
Net
Margin (%)
EPS
₹
BVPS
₹
RoE
(%)
RoIC
(%)P/E P/B EV/EBITDA
Rolex Rings Ltd (CMP: Rs.900 Mkt Cap: Rs.2451 cr)
FY19 904 201 59 22.2 6.5 21.7 79.1 27.4 25.5 41.5 11.4 13.8
FY20 666 121 53 18.2 7.9 19.4 98.4 19.7 16.0 46.3 9.1 22.0
FY21 616 109 87 17.7 14.1 31.9 131.0 24.4 12.3 28.2 6.9 24.4
FY22 1,031 219 138 21.2 13.4 50.7 202.2 25.1 20.1 17.8 4.5 12.2
FY23 1,289 310 218 24.1 17.0 80.2 282.4 28.4 26.4 11.2 3.2 8.2
Bharat Forge Ltd. (CMP: Rs.789.4 Mkt Cap: Rs.36751 cr)
FY19 10,146 2,056 1,032 20.3 10.2 22.2 115.5 19.2 18.3 35.6 6.8 19.3
FY20 8,056 1,115 350 13.8 4.3 7.5 115.5 6.5 7.0 105.1 6.8 35.5
FY21 6,274 760 181 12.1 2.9 3.9 113.1 3.4 2.9 202.9 7.0 50.8
FY22 8,504 1,620 789 19.1 9.3 16.9 129.0 13.1 13.0 46.6 6.1 23.7
FY23 10,403 2,207 1,237 21.2 11.9 26.6 149.5 17.8 20.1 29.7 5.3 17.1
Ramkrishna Forgings Ltd. (CMP: Rs.793.6 Mkt Cap: Rs.2540 cr)
FY19 1,931 383 118 19.8 6.1 36.9 267.6 13.8 15.7 21.5 3.0 8.8
FY20 1,216 212 9 17.4 0.8 3.0 267.6 1.1 5.0 267.2 3.0 16.6
FY21 1,088 193 (0) 17.7 (0.0) (0.1) 269.0 (0.0) 4.1 NA 3.0 18.3
FY22 1,912 368 113 19.3 5.9 35.2 311.6 11.3 15.4 22.5 2.5 9.6
FY23 2,238 445 163 19.9 7.3 51.1 360.8 14.2 18.3 15.5 2.2 7.9
MM Forgings Ltd. (CMP: Rs.716.1 Mkt Cap: Rs.1729 cr)
FY19 918 180 79 19.6 8.6 32.7 177.0 18.5 13.7 21.9 4.0 12.2
FY20 753 132 42 17.6 5.5 17.3 177.0 9.8 9.4 41.4 4.0 15.5
FY21 675 105 44 15.5 6.5 18.3 203.0 9.0 12.1 39.1 3.5 19.5
FY22 978 168 74 17.2 7.5 30.6 226.8 13.5 21.8 23.4 3.2 10.6
FY23 1,184 219 121 18.5 10.2 50.0 262.7 19.0 26.7 14.3 2.7 8.1
SKF India Ltd. (CMP: Rs.2774 Mkt Cap: Rs.13714 cr)
FY19 3,035 486 325 16.0 10.7 65.7 343.5 19.1 38.5 42.2 8.1 27.1
FY20 2,842 349 289 12.3 10.2 58.5 343.5 17.0 26.3 47.4 8.1 37.0
FY21 2,501 375 294 15.0 11.7 59.4 408.8 14.5 25.2 46.7 6.8 34.8
FY22 3,100 502 361 16.2 11.6 73.0 368.9 19.8 29.8 38.0 7.5 25.7
FY23 3,542 591 430 16.7 12.1 87.0 439.6 19.8 29.8 31.9 6.3 21.6
Schaeffler India Ltd. (CMP: Rs.6568.6 Mkt Cap: Rs.20534 cr)
FY19 4,361 634 368 14.5 8.4 117.6 947.6 12.4 22.3 55.9 6.9 31.1
FY20 3,762 536 291 14.3 7.7 93.1 947.6 9.8 17.5 70.6 6.9 36.1
FY21 5,185 855 532 16.5 10.3 170.1 1,134.8 15.0 29.0 38.6 5.8 22.5
FY22 5,884 999 622 17.0 10.6 199.1 1,282.6 15.5 29.7 33.0 5.1 19.1
FY23 6,554 1,124 702 17.1 10.7 224.5 1,456.2 15.4 27.4 29.3 4.5 17.0
NRB Bearings Ltd. (CMP: Rs.141.8 Mkt Cap: Rs.1374 cr)
FY19 965 185 108 19.2 11.2 11.2 48.5 23.0 21.7 12.7 2.9 8.6
FY20 776 86 32 11.1 4.1 3.3 48.5 6.8 7.6 42.8 2.9 18.7
FY21 728 103 42 14.1 5.7 4.3 50.1 8.6 9.9 33.0 2.8 15.6
FY22 907 145 79 16.0 8.7 8.1 57.8 14.0 15.3 17.5 2.5 11.0
FY23 1,012 167 95 16.5 9.4 9.8 65.2 15.0 16.3 14.5 2.2 9.6
Timken India Ltd. (CMP: Rs.1547.6 Mkt Cap: Rs.11640 cr)
FY19 1,664 289 150 17.3 9.0 19.9 178.3 11.2 17.9 77.7 8.7 39.7
FY20 1,618 363 246 22.5 15.2 32.7 178.3 18.4 24.4 47.3 8.7 30.9
FY21 1,367 252 143 18.4 10.5 19.0 167.0 11.4 16.4 81.5 9.3 45.7
FY22 1,734 347 214 20.0 12.3 28.4 201.6 14.1 20.6 54.5 7.7 32.8
FY23 2,242 511 334 22.8 14.9 44.5 236.4 18.8 31.0 34.8 6.5 22.0
Mahindra CIE Automotive Ltd. (CMP: Rs.246.3 Mkt Cap: Rs.9334 cr)
FY19 7,908 969 354 12.2 4.5 9.3 122.3 7.6 11.1 26.4 2.0 10.9
FY20 6,050 502 106 8.3 1.8 2.8 122.3 2.3 3.2 87.9 2.0 21.0
FY21 8,179 1,080 468 13.2 5.7 12.4 138.2 8.9 11.9 19.9 1.8 9.4
FY22 8,835 1,238 635 14.0 7.2 16.7 152.2 11.0 14.0 14.7 1.6 7.7
FY23 9,818 1,353 705 13.8 7.2 18.6 173.0 10.7 15.2 13.2 1.4 6.6
- 5 - Tuesday 27th July 2021
This document is for private circulation, and must be read in conjunction with the disclaimer on the last page.
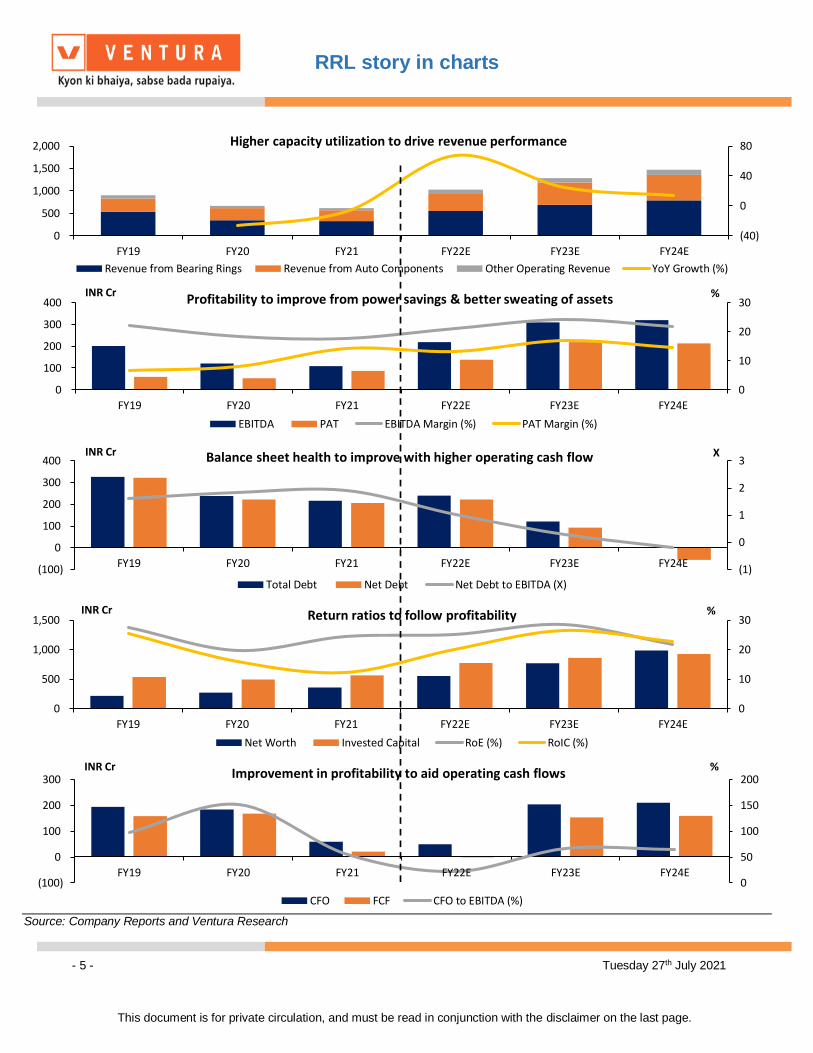
Source: Company Reports and Ventura Research
(40)
0
40
80
0
500
1,000
1,500
2,000
FY19 FY20 FY21 FY22E FY23E FY24E
Higher capacity utilization to drive revenue performance
Revenue from Bearing Rings Revenue from Auto Components Other Operating Revenue YoY Growth (%)
0
10
20
30
0
100
200
300
400
FY19 FY20 FY21 FY22E FY23E FY24E
Profitability to improve from power savings & better sweating of assets
EBITDA PAT EBITDA Margin (%) PAT Margin (%)
INR Cr %
(1)
0
1
2
3
(100)
0
100
200
300
400
FY19 FY20 FY21 FY22E FY23E FY24E
Balance sheet health to improve with higher operating cash flow
Total Debt Net Debt Net Debt to EBITDA (X)
INR Cr X
0
10
20
30
0
500
1,000
1,500
FY19 FY20 FY21 FY22E FY23E FY24E
Return ratios to follow profitability
Net Worth Invested Capital RoE (%) RoIC (%)
INR Cr %
0
50
100
150
200
(100)
0
100
200
300
FY19 FY20 FY21 FY22E FY23E FY24E
Improvement in profitability to aid operating cash flows
CFO FCF CFO to EBITDA (%)
INR Cr %
RRL story in charts
- 6 - Tuesday 27th July 2021
This document is for private circulation, and must be read in conjunction with the disclaimer on the last page.
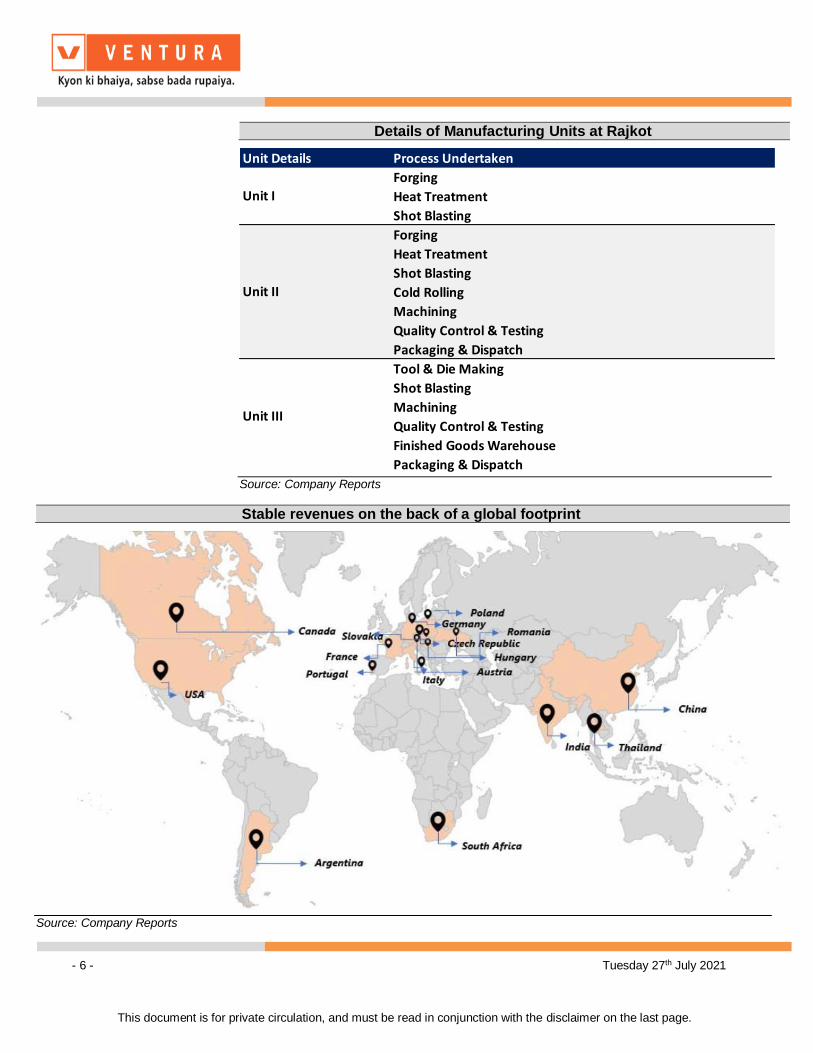
Details of Manufacturing Units at Rajkot
Source: Company Reports
Stable revenues on the back of a global footprint
Source: Company Reports
Unit Details Process Undertaken
Forging
Heat Treatment
Shot Blasting
Forging
Heat Treatment
Shot Blasting
Cold Rolling
Machining
Quality Control & Testing
Packaging & Dispatch
Tool & Die Making
Shot Blasting
Machining
Quality Control & Testing
Finished Goods Warehouse
Packaging & Dispatch
Unit I
Unit II
Unit III
- 7 - Tuesday 27th July 2021
This document is for private circulation, and must be read in conjunction with the disclaimer on the last page.
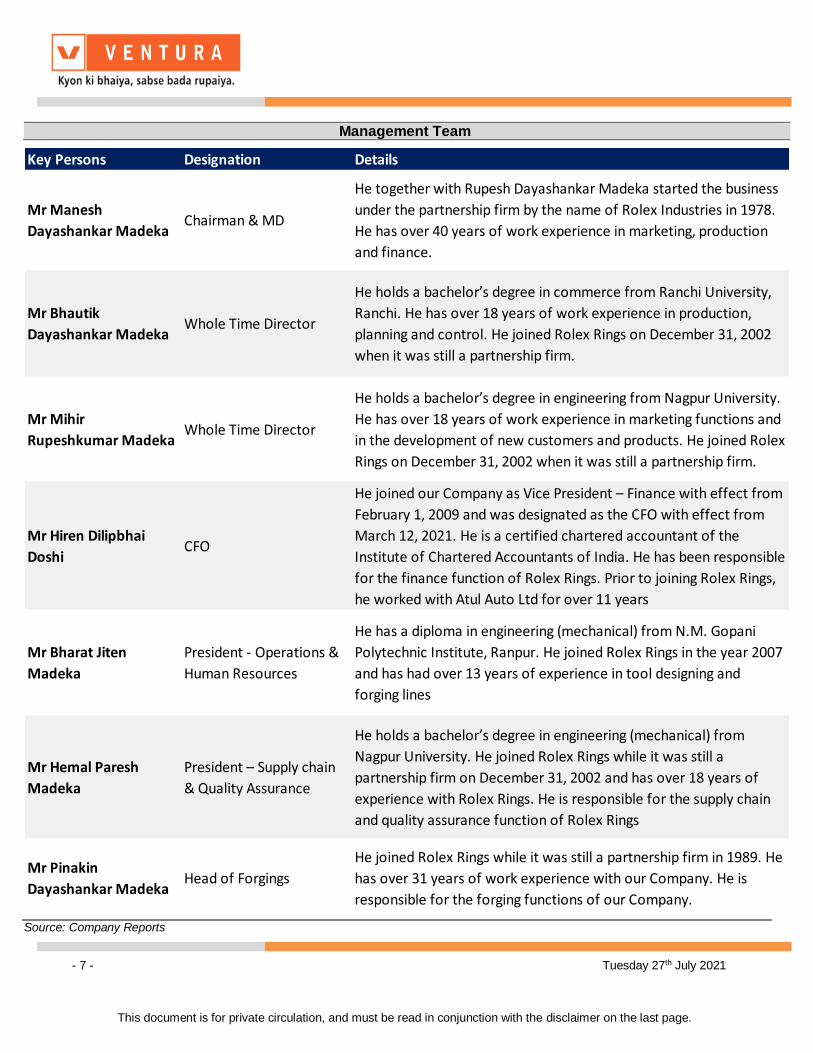
Management Team
Source: Company Reports
Key Persons Designation Details
Mr Manesh
Dayashankar MadekaChairman & MD
He together with Rupesh Dayashankar Madeka started the business
under the partnership firm by the name of Rolex Industries in 1978.
He has over 40 years of work experience in marketing, production
and finance.
Mr Bhautik
Dayashankar MadekaWhole Time Director
He holds a bachelor’s degree in commerce from Ranchi University,
Ranchi. He has over 18 years of work experience in production,
planning and control. He joined Rolex Rings on December 31, 2002
when it was still a partnership firm.
Mr Mihir
Rupeshkumar MadekaWhole Time Director
He holds a bachelor’s degree in engineering from Nagpur University.
He has over 18 years of work experience in marketing functions and
in the development of new customers and products. He joined Rolex
Rings on December 31, 2002 when it was still a partnership firm.
Mr Hiren Dilipbhai
DoshiCFO
He joined our Company as Vice President – Finance with effect from
February 1, 2009 and was designated as the CFO with effect from
March 12, 2021. He is a certified chartered accountant of the
Institute of Chartered Accountants of India. He has been responsible
for the finance function of Rolex Rings. Prior to joining Rolex Rings,
he worked with Atul Auto Ltd for over 11 years
Mr Bharat Jiten
Madeka
President - Operations &
Human Resources
He has a diploma in engineering (mechanical) from N.M. Gopani
Polytechnic Institute, Ranpur. He joined Rolex Rings in the year 2007
and has had over 13 years of experience in tool designing and
forging lines
Mr Hemal Paresh
Madeka
President – Supply chain
& Quality Assurance
He holds a bachelor’s degree in engineering (mechanical) from
Nagpur University. He joined Rolex Rings while it was still a
partnership firm on December 31, 2002 and has over 18 years of
experience with Rolex Rings. He is responsible for the supply chain
and quality assurance function of Rolex Rings
Mr Pinakin
Dayashankar MadekaHead of Forgings
He joined Rolex Rings while it was still a partnership firm in 1989. He
has over 31 years of work experience with our Company. He is
responsible for the forging functions of our Company.
- 8 - Tuesday 27th July 2021
This document is for private circulation, and must be read in conjunction with the disclaimer on the last page.
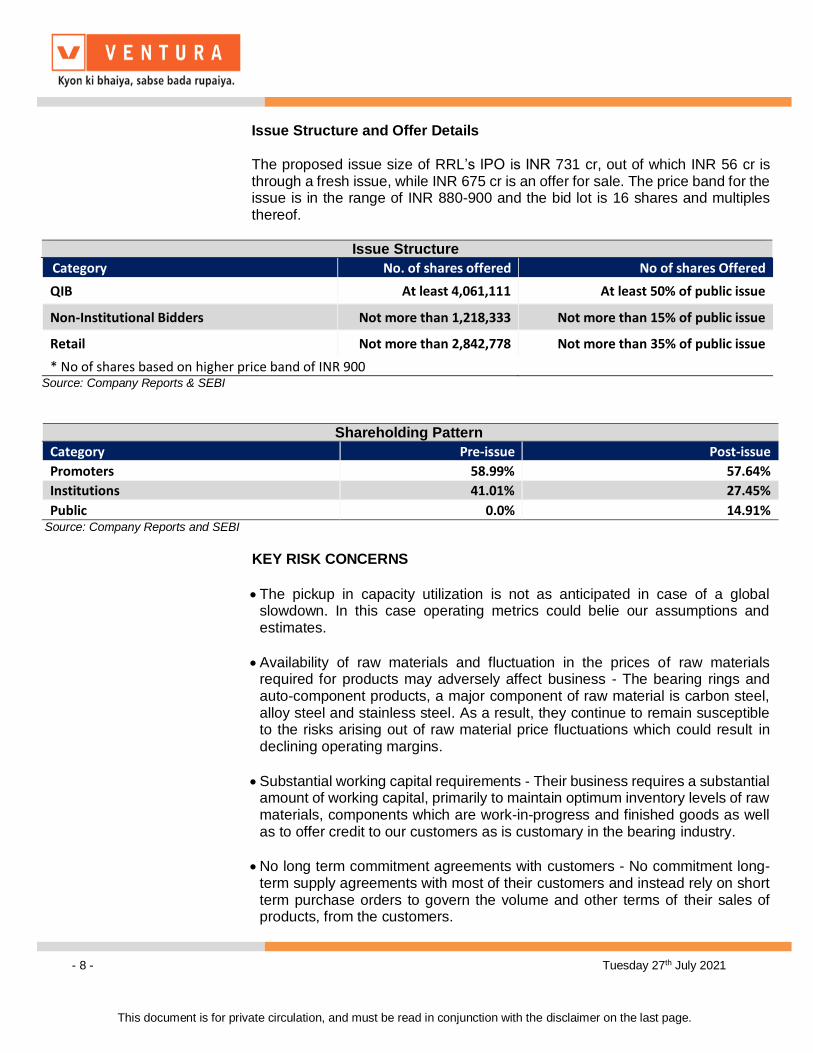
Issue Structure and Offer Details
The proposed issue size of RRL’s IPO is INR 731 cr, out of which INR 56 cr is through a fresh issue, while INR 675 cr is an offer for sale. The price band for the issue is in the range of INR 880-900 and the bid lot is 16 shares and multiples thereof.
Issue Structure
Category No. of shares offered No of shares Offered
QIB At least 4,061,111 At least 50% of public issue
Non-Institutional Bidders Not more than 1,218,333 Not more than 15% of public issue
Retail Not more than 2,842,778 Not more than 35% of public issue
* No of shares based on higher price band of INR 900 Source: Company Reports & SEBI
Shareholding Pattern
Category Pre-issue Post-issue
Promoters 58.99% 57.64%
Institutions 41.01% 27.45%
Public 0.0% 14.91% Source: Company Reports and SEBI
KEY RISK CONCERNS
The pickup in capacity utilization is not as anticipated in case of a global slowdown. In this case operating metrics could belie our assumptions and estimates.
Availability of raw materials and fluctuation in the prices of raw materials required for products may adversely affect business - The bearing rings and auto-component products, a major component of raw material is carbon steel, alloy steel and stainless steel. As a result, they continue to remain susceptible to the risks arising out of raw material price fluctuations which could result in declining operating margins.
Substantial working capital requirements - Their business requires a substantial amount of working capital, primarily to maintain optimum inventory levels of raw materials, components which are work-in-progress and finished goods as well as to offer credit to our customers as is customary in the bearing industry.
No long term commitment agreements with customers - No commitment long-term supply agreements with most of their customers and instead rely on short term purchase orders to govern the volume and other terms of their sales of products, from the customers.

- 9 - Tuesday 27th July 2021
This document is for private circulation, and must be read in conjunction with the disclaimer on the last page.
Financial & Projections
Source: Company Reports & Ventura Research
Figures in INR Crores FY20 FY21 FY22E FY23E FY24E Figures in INR Crores FY20 FY21 FY22E FY23E FY24E
Income Statement Per Share Data (Rs) & Yield (%)
Revenue 666.0 616.3 1,030.9 1,288.7 1,472.8 Adjusted EPS 19.4 31.9 50.7 80.2 78.5
YoY Growth (%) (26.4) (7.5) 67.3 25.0 14.3 Adjusted Cash EPS 29.2 41.3 62.1 92.8 92.1
Raw Material Cost 329.3 287.4 476.3 592.8 674.5 Adjusted BVPS 98.4 131.0 202.2 282.4 360.9
YoY Growth (%) (24.1) (12.7) 65.7 24.5 13.8 CFO per share 67.5 21.7 18.0 74.6 76.9
Employee Cost 52.7 51.9 65.6 85.8 111.2 CFO Yield 7.5 2.4 2.0 8.3 8.5
YoY Growth (%) (13.4) (1.5) 26.5 30.8 29.6 FCF per share 61.7 7.6 (0.3) 56.2 58.5
Power & Fuel Cost 54.2 52.1 82.5 67.0 100.8 FCF Yield 6.9 0.8 (0.0) 6.2 6.5
YoY Growth (%) (24.2) (3.9) 58.4 (18.8) 50.5
Other Expenses 108.4 116.1 187.6 232.7 265.3 Solvency Ratio (X)
YoY Growth (%) (20.9) 7.1 61.6 24.0 14.0 Total Debt to Equity 0.9 0.6 0.4 0.2 0.0
EBITDA 121.4 108.9 218.9 310.4 320.9 Net Debt to Equity 0.8 0.6 0.4 0.1 (0.1)
YoY Growth (%) (39.6) (10.4) 101.1 41.8 3.4 Net Debt to EBITDA 1.8 1.9 1.0 0.3 (0.2)
Margin (%) 18.2 17.7 21.2 24.1 21.8
Depreciation 26.5 25.4 31.1 34.1 37.1 Return Ratios (%)
Depreciation to Gross Block (%) 6.0 5.4 6.0 6.0 6.0 Return on Equity 19.7 24.4 25.1 28.4 21.7
EBIT 94.9 83.5 187.8 276.3 283.8 Return on Capital Employed 15.4 12.0 19.6 25.6 21.6
YoY Growth (%) (46.0) (12.1) 125.0 47.1 2.7 Return on Invested Capital 16.0 12.3 20.1 26.4 22.9
Margin (%) 14.3 13.5 18.2 21.4 19.3
Other Income 9.3 3.4 4.7 6.6 8.0 Working Capital Ratios
Finance Cost 32.2 11.7 25.3 18.0 6.0 Inventory Days 72 101 90 80 75
PBT 72.1 75.2 167.2 264.8 285.7 Receivable Days 70 101 80 70 70
YoY Growth (%) (48.7) 4.3 122.4 58.4 7.9 Payable Days 40 70 50 40 40
Margin (%) 10.8 12.2 16.2 20.6 19.4 Net Working Capital Days 101 133 120 110 105
Reported Tax 19.1 (11.8) 29.3 46.3 72.0 Net Working Capital to Sales (%)
Tax Rate 26.6 (15.7) 17.5 17.5 25.2
PAT 52.9 87.0 138.0 218.5 213.7 Valuation (X)
YoY Growth (%) (10.3) 64.2 58.7 58.4 (2.2) P/E Ratio 46.3 28.2 17.8 11.2 11.5
Margin (%) 7.9 14.1 13.4 17.0 14.5 P/BV Ratio 9.1 6.9 4.5 3.2 2.5
EV/EBITDA 22.0 24.4 12.2 8.2 7.5
Balance Sheet EV/Sales 4.0 4.3 2.6 2.0 1.6
Share Capital 24.0 24.0 27.2 27.2 27.2
Total Reserves 244.1 332.8 523.5 741.9 955.7 Cash Flow Statement
Shareholders' Fund 268.1 356.7 550.7 769.2 982.9 Profit Before Tax 72.1 75.2 167.2 264.8 285.7
LT Borrowings 44.2 32.3 0.0 0.0 0.0 Adjustments 64.8 12.1 25.8 34.0 31.0
LT Lease Liabilities 0.1 0.1 0.0 0.0 0.0 Change in Working Capital 66.0 (39.8) (114.7) (49.4) (35.3)
LT Income Tax Liabilities 17.9 17.9 17.9 17.9 17.9 Less: Tax Paid (19.1) 11.8 (29.3) (46.3) (72.0)
Deferred Tax Liabilities 56.9 32.4 32.4 32.4 32.4 Cash Flow from Operations 183.8 59.2 49.1 203.1 209.4
LT Provisions 3.1 3.1 3.9 5.1 6.7 Net Capital Expenditure (15.7) (38.5) (50.0) (50.0) (50.0)
Total Liabilities 390.4 442.6 605.0 824.7 1,039.9 Change in Investments 1.5 2.2 (13.0) (8.7) (6.2)
Gross Block 445.7 469.0 519.0 569.0 619.0 Cash Flow from Investing (14.2) (36.3) (63.0) (58.7) (56.2)
Less: Accumulated Depreciation 72.6 97.7 128.8 162.9 200.1 Change in Borrowings (134.7) (11.3) (9.3) (117.5) (118.2)
Net Block 373.0 371.4 390.3 406.1 419.0 Less: Finance Cost (32.2) (11.7) (25.3) (18.0) (6.0)
Capital WIP 0.0 1.2 0.0 0.0 0.0 Proceeds from Equity 0.0 0.0 56.0 0.0 0.0
Right of use assets 0.1 0.1 0.0 0.0 0.0 Divided Paid (incl Tax) 0.0 0.0 0.0 0.0 0.0
Intangible Assets 1.2 0.9 0.9 0.9 0.9 Proceeds from issue of Pref Shares 0.0 2.6 0.0 0.0 0.0
LT Loans & Advances 2.5 0.0 0.0 0.0 0.0 Payment of lease liabilities (0.0) (0.0) 0.0 0.0 0.0
Other LT Financial Assets 3.4 14.0 23.4 29.2 33.4 Cash Flow from Financing (168.5) (19.5) 21.4 (135.5) (124.2)
LT Income Tax Assets 2.0 2.0 2.0 2.0 2.0 Net Cash Flow 1.1 3.4 7.5 8.9 29.0
Other Non Current Assets 11.1 28.8 48.2 60.3 68.9 FOREX Effect 0.0 0.0 0.0 0.0 0.0
Net Current Assets (2.8) 24.3 140.2 326.2 515.8 Opening Balance of Cash 0.1 1.2 4.6 12.1 21.0
Total Assets 390.4 442.6 605.0 824.7 1,039.9 Closing Balance of Cash 1.2 4.6 12.1 21.0 50.1
- 10 - Tuesday 27th July 2021
This document is for private circulation, and must be read in conjunction with the disclaimer on the last page.
Disclosures and Disclaimer
Ventura Securities Limited (VSL) is a SEBI registered intermediary offering broking, depository and portfolio management services to clients. VSL is member
of BSE, NSE and MCX-SX. VSL is a depository participant of NSDL. VSL states that no disciplinary action whatsoever has been taken by SEBI against it in last five years except administrative warning issued in connection with technical and venial lapses observed while inspection of books of accounts and records. Ventura Commodities Limited, Ventura Guaranty Limited, Ventura Insurance Brokers Limited and Ventura Allied Services Private Limited are associates of
VSL. Research Analyst (RA) involved in the preparation of this research report and VSL disclose that neither RA nor VSL nor i ts associates (i) have any financial interest in the company which is the subject matter of this research report (ii) holds ownership of one percent or more in the securities of subject company (iii) have any material conflict of interest at the time of publication of this research report (iv) have received any compensation from the subject
company in the past twelve months (v) have managed or co-managed public offering of securities for the subject company in past twelve months (vi) have received any compensation for investment banking merchant banking or brokerage services from the subject company in the past twelve months (vii) have received any compensation for product or services from the subject company in the past twelve months (viii) have received any compensation or other benefits
from the subject company or third party in connection with the research report. RA involved in the preparation of this research report discloses that he / she has not served as an officer, director or employee of the subject company. RA involved in the preparation of this research report and VSL discloses that they have not been engaged in the market making activity for the subject company. Our sales people, dealers, traders and other professionals may provide oral or
written market commentary or trading strategies to our clients that reflect opinions that are contrary to the opinions expressed herein. We may have earlier issued or may issue in future reports on the companies covered herein with recommendations/ information inconsistent or different those made in this report. In reviewing this document, you should be aware that any or all of the foregoing, among other things, may give rise to or potential conflicts of interest. We may
rely on information barriers, such as "Chinese Walls" to control the flow of information contained in one or more areas within us, or other areas, units, groups or affiliates of VSL. This report is for information purposes only and this document/material should not be construed as an offer to sell or the solicitation of an offer to buy, purchase or subscribe to any securities, and neither this document nor anything contained herein shall form the basis of or be relied upon in
connection with any contract or commitment whatsoever. This document does not solicit any action based on the material contained herein. It is for the general information of the clients / prospective clients of VSL. VSL will not treat recipients as clients by virtue of their receiving this report. It does not constitute a personal recommendation or take into account the particular investment objectives, financial situations, or needs of clients / prospective clients. Similarly, this
document does not have regard to the specific investment objectives, financial situation/circumstances and the particular needs of any specific person who may receive this document. The securities discussed in this report may not be suitable for all investors. The appropriateness of a particular investment or strategy will depend on an investor's individual circumstances and objectives. Persons who may receive this document should consider and independently
evaluate whether it is suitable for his/ her/their particular circumstances and, if necessary, seek professional/financial advice. And such person shall be responsible for conducting his/her/their own investigation and analysis of the information contained or referred to in this document and of evaluating the merits and risks involved in the securities forming the subject matter of this document. The projections and forecasts described in this report were based upon a
number of estimates and assumptions and are inherently subject to significant uncertainties and contingencies. Projections and forecasts are necessarily speculative in nature, and it can be expected that one or more of the estimates on which the projections and forecasts were based will not materialize or will vary significantly from actual results, and such variances will likely increase over time. All projections and forecasts described in this report have been prepared
solely by the authors of this report independently of the Company. These projections and forecasts were not prepared with a view toward compliance with published guidelines or generally accepted accounting principles. No independent accountants have expressed an opinion or any other form of assurance on these projections or forecasts. You should not regard the inclusion of the projections and forecasts described herein as a representation or warranty by VSL,
its associates, the authors of this report or any other person that these projections or forecasts or their underlying assumptions will be achieved. For these reasons, you should only consider the projections and forecasts described in this report after carefully evaluating all of the information in this report, including the assumptions underlying such projections and forecasts. The price and value of the investments referred to in this document/material and the income from
them may go down as well as up, and investors may realize losses on any investments. Past performance is not a guide for future performance. Future returns are not guaranteed and a loss of original capital may occur. Actual results may differ materially from those set forth in projections. Forward-looking statements are not predictions and may be subject to change without notice. We do not provide tax advice to our clients, and all investors are s trongly advised to consult
regarding any potential investment. VSL, the RA involved in the preparation of this research report and its associates accept no liabilities for any loss or damage of any kind arising out of the use of this report. This report/document has been prepared by VSL, based upon information available to the public and sources, believed to be reliable. No representation or warranty, express or implied is made that it is accurate or complete. VSL has reviewed the report and,
in so far as it includes current or historical information, it is believed to be reliable, although its accuracy and completeness cannot be guaranteed. The opinions expressed in this document/material are subject to change without notice and have no obligation to tell you when opinions or information in this report change. This report or recommendations or information contained herein do/does not constitute or purport to constitute investment advice in publicly accessible media
and should not be reproduced, transmitted or published by the recipient. The report is for the use and consumption of the rec ipient only. This publication may not be distributed to the public used by the public media without the express written consent of VSL. This report or any portion hereof may not be printed, sold or distributed without the written consent of VSL. This document does not constitute an offer or invitation to subscribe for or purchase or deal in any securities
and neither this document nor anything contained herein shall form the basis of any contract or commitment whatsoever. This document is strictly confidential and is being furnished to you solely for your information, may not be distributed to the press or other media and may not be reproduced or redistributed to any other person. The opinions and projections expressed herein are entirely those of the author and are given as part of the normal research activity of VSL and are given as of this date and are subject to change without notice. Any opinion estimate or projection herein constitutes a view as of the date of this report and
there can be no assurance that future results or events will be consistent with any such opinions, estimate or projection. This document has not been prepared by or in conjunction with or on behalf of or at the instigation of, or by arrangement with the company or any of its directors or any other person. Information in this document must not be relied upon as having been authorized or approved by the company or its directors or any other person. Any opinions and projections
contained herein are entirely those of the authors. None of the company or its directors or any other person accepts any liability whatsoever for any loss arising from any use of this document or its contents or otherwise arising in connection therewith. The information contained herein is not intended for publication or distribution or circulation in any manner whatsoever and any unauthorized reading, dissemination, distribution or copying of this communication is prohibited
unless otherwise expressly authorized. Please ensure that you have read “Risk Disclosure Document for Capital Market and Derivatives Segments” as prescribed by Securities and Exchange Board of India before investing in Securities Market.
Ventura Securities Limited - SEBI Registration No.: INH000001634
Corporate Office: I-Think Techno Campus, 8th Floor, ‘B’ Wing, Off Pokhran Road No 2, Eastern Express Highway, Thane (W) – 400608