Embed Size (px)
Citation preview

Role of the Chinese Steel Industry in the Economic Development of China and
Australia’s Contribution to the Industry as a Supplier of Raw Materials
By
James G. Trench MSc, Grad Dip, BSc Hons
This Thesis is presented for the degree of
Doctor of Philosophy of Murdoch University
- 2004 -

ii
Declaration
I declare that this thesis is my own account of my research and contains as its main
content work that has not previously been submitted for a degree at any tertiary
education institution.
James G. Trench

iii
Abstract
The objective of this thesis is to examine the extent to which the iron and steel industry
in China has been a major contributor to the recent economic development and growth
of the Chinese economy and whether this will continue. Key elements of China’s
economic development model – THE CHINESE MODEL - based on the steel industry
are presented and demonstrate the impact of China taking “great leaps forward” in its
steel production capacity to become the world’s leading steel producer and one of the
fastest growing economies. This bold step was undertaken at times when the global
steel industry was burdened with overcapacity and economic pressures. At the same
time, this thesis examines the role played by the Australian iron ore industry in
supporting the Chinese steel industry through its iron ore trade with China and how this
role will evolve.
The development of the iron and steel industry in China reflects not just the role played
in the overall expansion of the Chinese economy through technical input-output
relationships, but it also reflects control and historical characteristics taken from China's
social and political context. Starting from the views of Sun Yat Sen, and flowing
through Mao Zedong, and then into later leaders, the steel industry was always intended
to be the basis for the modernisation of the Chinese economy. The Great Leap Forward
of the 1950s was an ill-founded reflection of that fundamental view, but the failure in
that case did not cause a shift away from that basic perspective. Instead a more
comprehensive perspective was provided and this came to the fore at the start of the
reform process in the early 1980s.

iv
The role of the steel industry in the recent modernisation of China is traced using the
policy foundations and directions that were adopted combined with empirical data on
the investment and growth in the industry, as well as the role of the output of the steel
industry in the expansion of other industries in China. To the extent that conditions in
China may be replicated in other countries, the Chinese experience using the iron and
steel industry as the key element in the industrialisation of that economy will have
important lessons.
At the same time, this thesis demonstrates weaknesses in a development model that has
the iron and steel industry as the leading sector. One major weakness is the reliance on
imported raw materials and at this point the Chinese experience with Australia as a
source of raw materials becomes relevant. Australia’s role as a reliable supplier and
partner for the steel industry enabled the steel industry to expand in a low risk
environment with respect to the price and availability of raw materials.

v
Contents
1 INTRODUCTION...................................................................................................1
1.1 THE OBJECTIVE OF THIS THESIS .........................................................................3 1.2 ACADEMIC REVIEW............................................................................................4 1.3 RESEARCH METHODOLOGY ...............................................................................8 1.4 OVERVIEW OF CHAPTERS.................................................................................10
2 OVERVIEW OF THE GLOBAL IRON AND STEEL INDUSTRY ...............13
2.1 STEEL INDUSTRY - DRIVER OF THE ECONOMY .................................................14 2.2 INDUSTRY STRUCTURE AND BEHAVIOUR - BARRIERS TO ENTRY .....................21 2.3 ECONOMICS OF THE STEEL INDUSTRY - FACTORS OF PRODUCTION..................22
2.3.1 Iron Ore - Principal Input Material to the Steel Industry ......................28 2.4 LEADING STEEL PRODUCING COUNTRIES ........................................................29 2.5 STEEL PRODUCTION PROCESSES FOR THE TOP SIX PRODUCING COUNTRIES....31
2.5.1 Continuous Cast Steel Making Process ..................................................31 2.5.2 Steel Production in Electric Arc Furnaces .............................................33 2.5.3 Production of Steel in Oxygen Blown Converters ..................................35 2.5.4 Steel Production in Open Hearth Furnaces............................................36 2.5.5 Summary of Global Supply .....................................................................37
2.6 STEEL DEMAND ...............................................................................................37 2.6.1 World Apparent Crude Steel Consumption.............................................38 2.6.2 Per Capita Steel Demand - Six Leading Producer Countries ................40 2.6.3 Summary of Global Demand...................................................................41
2.7 EMPLOYMENT IN THE STEEL INDUSTRY ...........................................................42 2.8 DISCUSSION .....................................................................................................43 2.9 CONCLUSION....................................................................................................45
3 CHINESE IRON AND STEEL INDUSTRY–MARSHALL OF INDUSTRY 46
3.1 HISTORY OF CHINA’S IRON AND STEEL INDUSTRY...........................................47 3.2 PROFILE OF CHINA’S TOP 10 STEEL PRODUCERS...............................................65 3.3 CRUDE STEEL PRODUCTION BY STEEL MAKING PROCESS ...............................68 3.4 CONTINUOUSLY CAST STEEL DEVELOPMENT ..................................................70 3.5 STEEL PRODUCTION AND ECONOMIC GROWTH................................................71
3.5.1 Gross Domestic Product .........................................................................75 3.5.2 Agriculture & Industrial Production ......................................................78 3.5.3 Money Supply ..........................................................................................82
3.6 PRODUCTIVITY AND ECONOMIC EFFICIENCY ...................................................85 3.6.1 Iron Ore Production – Principal Input Factor .......................................89 3.6.2 Energy Consumption - Input Factor 3 ....................................................91
3.7 TRADE DEVELOPMENT - STEEL AND IRON ORE ................................................97 3.8 CHINA’S IRON ORE DEMAND .........................................................................100
3.8.1 Elasticity of Demand for Steel and Iron Ore ........................................105 3.8.2 Intensity of Demand ..............................................................................107 3.8.3 Automobile Production and Steel Demand...........................................111 3.8.4 Shipbuilding and Steel Demand............................................................113
3.9 IRON ORE SUPPLY CHARACTERISTICS............................................................115 3.9.1 Iron Ore Supply Elasticity.....................................................................117
4 AUSTRALIA’S ROLE SUPPLYING CHINA’S STEEL INDUSTRY..........120

vi
4.1 AUSTRALIA’S ROLE IN SUPPORTING CHINA’S ECONOMIC DEVELOPMENT .....120 4.1.1 Trade between China and Australia .....................................................120
4.2 COMPARATIVE ADVANTAGE..........................................................................127 4.3 IRON ORE PRODUCTION .................................................................................129 4.4 IRON ORE EXPORTS ........................................................................................130
4.4.1 Outlook for Australia’s Iron Ore Production .......................................133 4.4.2 Pricing of Iron Ore - Setters or Takers.................................................134 4.4.3 Economics of Iron Ore Sea Borne Trade..............................................137 4.4.4 Outlook for Australian Iron Ore Trade.................................................140
5 CHINA’S TRADE DEVELOPMENT...............................................................142
5.1 CHINA’S INTERNATIONAL TRADE ..................................................................143 5.1.1 China’s approach to trade ....................................................................148
5.2 TRADE WITH JAPAN AND THE USA ................................................................150 5.3 CHINA’S FUTURE TRADE OUTLOOK - FACTORS INPUTS AND EFFICIENCY......152
5.3.1 How China develops trading strategy – Buying and Selling ................153 5.3.2 Olympics 2008 and Shanghai World Fair 2010 ...................................154 5.3.3 Infrastructure development ...................................................................155
5.4 FREE TRADE AND TARIFFS .............................................................................157 5.5 WORLD TRADE ORGANISATION (WTO) ENTRY.............................................165 5.6 FOREIGN TRADE POLICY................................................................................170
5.6.1 Foreign Investment in China.................................................................171 5.7 FUTURE OF CHINA’S STEEL INDUSTRY...........................................................180
5.7.1 Outlook for steel production .................................................................181 5.7.2 Research, Development and Sustainability...........................................184 5.7.3 Environmental Issues ............................................................................187 5.7.4 China’s Economic Development ...........................................................188
5.8 STRUCTURAL WEAKNESSES IN ECONOMY .....................................................191 5.8.1 China’s Currency..................................................................................191 5.8.2 Finance - debt levels .............................................................................196 5.8.3 Reform Generated Unemployment – Threat to Economic Stability......205
6 FINDINGS ...........................................................................................................209
6.1.1 Key Research Findings .........................................................................210
7 RECOMMENDATION AND CONCLUSION ................................................238
7.1 SUMMARY OF FINDINGS .................................................................................239 7.2 RECOMMENDATIONS......................................................................................242
7.2.1 China.....................................................................................................242 7.2.2 Australia................................................................................................243 7.2.3 Other Countries.....................................................................................244
7.3 FURTHER RESEARCH......................................................................................244 7.4 CONCLUSION..................................................................................................245
8 REFERENCES....................................................................................................248
9 APPENDICES .....................................................................................................275
9.1 GLOBAL IRON & STEEL INDUSTRY DATA ......................................................275 9.1.1 China Steel Balance ..............................................................................275 9.1.2 Japan Steel Balance ..............................................................................276

vii
9.1.3 Global Steel Production, 1900-2002 ....................................................277 9.1.4 Summary-Crude Steel Production ........................................................278 9.1.5 China Steel Growth Predictions ...........................................................279 9.1.6 Summary-Continuously Cast Steel Production.....................................280 9.1.7 Summary-Production of Steel in Oxygen Blown Converters ................281 9.1.8 Summary-Production of Steel in Electric Arc Furnaces.......................282 9.1.9 Summary-Production of Steel in Open Hearth Furnaces .....................283 9.1.10 Summary-Apparent Crude Steel Consumption .....................................284 9.1.11 Summary-Apparent Crude Steel Consumption per Capita ...................285 9.1.12 Productivity of Top 6 Crude Steel Producers .......................................286 9.1.13 Ranking of Steel Producing Countries, 1993-2002 ..............................287 9.1.14 Top 50 Steel Producing Companies, 1999-2002 ..................................289
9.2 CHINA AND GLOBAL IRON ORE DATA ...........................................................291 9.2.1 World and China’s Historical Iron Ore Production.............................291 9.2.2 Australian Historical Iron Ore Production, 1950-2002 .......................292 9.2.3 Australian Exports of Iron Ore, 2000-2002..........................................293 9.2.4 China Iron Ore Imports and GDP, 1981-2002.....................................294 9.2.5 Iron Ore Fines Pricing into Asia, 1973-2002 .......................................295 9.2.6 Composition of Iron Ore Imports to China, 1975-2002 .......................296 9.2.7 Composition of Australian Iron Ore Exports, 1975-2002 ....................297
9.3 KEY PHASES OF CHINA’S REFORM..................................................................298 9.4 CHINA STEEL INDUSTRY ................................................................................299
9.4.1 Steel products supply in 2002 with forecast for 2003...........................299 9.4.2 China's output of major steel products, 2002 .......................................299 9.4.3 Import and export of major steel products, 2002..................................300 9.4.4 Output of Non Ferrous metals, 2002 ....................................................301 9.4.5 Import and Export of Major Metals, 2002............................................302 9.4.6 Import Value of Major Commodities, 2002 ..........................................303 9.4.7 China’s Import Volume of Major Commodities, 2002..........................303 9.4.8 Automobile Makes, Output and Sales in China, 2002 ..........................304 9.4.9 Automobile Output by Region, 2002 .....................................................305
9.5 SELECTED CHINA ECONOMIC INDICATORS.....................................................306 9.5.1 Economic Data Base.............................................................................306 9.5.2 China’s GDP, Trade and Output, 1981-2002.......................................307 9.5.3 China’s Money Supply, 1981-2002.......................................................308 9.5.4 Debt Level Comparisons, 1981-2002....................................................309 9.5.5 Intensity of Steel Demand, 1952-2002 ..................................................310 9.5.6 China’s Trade with Australia, 1982-2002 ............................................311 9.5.7 Industrial Added Value by China’s Regions, 2002 ...............................312
9.6 CHINA MAP - STEEL AND IRON ORE REGIONS................................................313 9.7 AUSTRALIA – CHINA SHIPPING MAP ..............................................................314 9.8 DEVELOPMENTS IN CHINA’S IRON & STEEL INDUSTRY..................................315 9.9 EXTRACT FROM ZHU RONGJI’S GOVERNMENT WORK REPORT ......................316 9.10 COMPOSITION OF CHINA'S EXPORTS TO USA, 2002.......................................317 9.11 COMPOSITION OF CHINA'S IMPORT FROM USA, 2002 ....................................318 9.12 STEEL FOR THE BEIJING OLYMPICS ................................................................319 9.13 FIXED ASSET INVESTMENT IN CHINA 2002 ....................................................320 9.14 AUSTRALIA CHINA TRADE.............................................................................321
9.14.1 Summary of Australian Trade with Top 5 Countries, 2000-2002.........321 9.14.2 Australian Merchandise Trade by Country, 2000-2002 .......................322

viii
9.14.3 Australia’s Top Trades with China, 1996-2002....................................323 9.14.4 Australia – China Trade breakdown, 2002...........................................324
9.15 CHINA’S TOP ELEVEN IMPORT COMMODITIES, 2000 AND 2001 .....................325 9.16 MAP SHOWING AUSTRALIA’S IRON ORE MINES ............................................326 9.17 STEEL TARIFF CHANGES FOLLOWING WTO MEMBERSHIP ............................327 9.18 CHINA STEEL COMPANIES DATA BASE ...........................................................341 9.19 STATE COUNCIL .............................................................................................346

ix
Acknowledgements
I extend my gratitude to Murdoch University which provided financial and professional
support for this research programme and also supported me in presenting papers at
international conferences.
I also extend my thanks to my employer BHP Billiton Marketing Asia Pte Ltd, Minister
Song Ruixiang, Head of China’s Seismological Bureau, Professor Herb Thompson who
had the task of helping me develop my initial research programme and Dr Frank
Harman who subsequently edited my initial drafts.
A special thanks is given to Dr Dora Marinova who had the task of supervising me
during the latter and most demanding part of my research. Her experience and wisdom
were very helpful in enabling me to put my research thesis into its final form.
I specially acknowledge the excellent publications issued by the China Economic
Information Service (a Xinhua news agency publication), the Asian Development Bank,
the International Iron and Steel Institute, the World Trade Organisation, CRU
International (which publishes a wide range of journals on the metals industry). Each
one of these organisations produces many useful publications and information, which
was helpful to me during my research.
Last and not least is to thank my dear wife, Dr Gaomai Trench, who endlessly provided
moral support during many intense study periods both overseas and in
Australia. She is my inspiration.

1
1 Introduction
From the age of 12 and as a young martial arts enthusiast, I had an intense interest in
Asian culture. Then as a young professional engineer, I witnessed the emergence of
Asian industry at the expense of western industry. Japan emerged as the world’s
leading steel making country. It seemed that no country could possibly compete with
such a culture and strengthening economy. It was not until I became involved in the
iron and steel industry in the early 80s, that my interest started to focus on China. By
the early 90s, I could see an eclipse of Japan’s unbeatable rising sun was occurring.
China through its market and social reform programmes was emerging on the horizon
and was soon to become the leading steel making country.
China had indeed begun its journey in becoming a significant trading nation. Industrial
output was increasing, infrastructure was being improved, steel demand was increasing
and most importantly the iron and steel industry was modernising and growing. In
1996, crude steel production from China overtook Japan’s iron and steel industry (101.2
cf 98.8 million tonnes) and has continued to do so. It seems that China’s miraculous
development is now unbeatable. At the same time, and resulting from China’s reliance
on imports of raw materials, Australia was playing an ever-increasing role in China’s
economic development and China had become one of its leading trading partners. How
such a transformation could occur intrigued many. Working in the Australian iron ore
industry highlighted that China’s iron and steel industry had an important role to play in
China’s economic development, but this was not enough to enable an understanding of
what was really behind such development, its drivers and where it would lead to. It was
not until after studying Chinese language, culture and history followed by a Masters

2
programme in Mineral Economics that I started to take great interest in not only the
significant role that the iron and steel industry had played in China’s economic
development, but also in the role that history and culture played in this development.
With a view to understanding and subsequently documenting the model behind China’s
success, this research programme was undertaken.
In Chinese culture, historical events are to be understood as determinants for the future.
The view of the importance of nationally developing the iron and steel industry can be
traced back to Dr Sun Yat Sen and subsequently maintained by Mao Zedong even
though his Great Leap Forward campaign was a complete failure. In the last quarter of
the 20th century, China started to achieve enormous success in its efforts to modernise
its industrial capability. Towards the end of the century, the centralised planning
system was replaced by a transitional and now market economy. By exploring the
development of China’s economy and by examining historical and cultural
characteristics behind that development, this thesis will attempt to give answers to the
main research question which is: What role did the Chinese iron and steel industry play
in the economic development of China? In order to answer it, the following sub-
questions are addressed:
• Did the industry support the building of a more prosperous society or did people
have to pay for wrong decisions?
• Can the industry sustain China’s economic development?
• Being a major supplier of raw materials (iron ore in particular), what role has
Australia played and will continue to play in supporting China’s development?
• What are the lessons for the future or for any other countries?

3
1.1 The Objective of this Thesis
The specific aims of the study are to:
• Analyse trends in the development of the Chinese iron and steel industry
including Australia’s contribution
• Examine previous literature analysing this development
• Draw an understanding of the development model
• Identify weaknesses in the model
• Make recommendations.
To do this, the research explores, examines and documents the characteristics behind a
long-standing view held in China that steel industry development and subsequent
industrialisation of the country would be a successful model for the economic
modernisation of China and that it would also lead to achieving the status of being a
modern world power. At the same time, the thesis outlines China’s iron and steel
industry development relative to the global iron and steel industry and the role that
Australia plays in supplying the principal raw material input, iron ore, to China.
The research also exposes weaknesses in China’s modernisation model based on the
expansion of the steel industry and industrial reform. Examples of these are social
pressures arising from higher unemployment and increasing financial instability seen
from the high level of non-performing loans that exist particularly in state owned
enterprises that have undergone significant reform. Whether growth in steelmaking
capacity can be sustained after domestic consumption demand cools off is examined.
The importance of China’s currency for the steel industry and continued economic
development is also considered.
4
1.2 Academic Review
Extensive studies have been published about China’s economy, but not so much work
undertaken in relation to the Chinese Steel Industry and its role as a model in
developing the Chinese economy. Jefferson (1990) examined sources of enterprise
efficiency and productivity growth in China’s steel industry. His work showed that
during the years following the Great Leap Forward, productivity performance was poor
but improved significantly as a result of the reforms that took place in the 1980s.
Following Feng’s (1994a) study on restructuring of the international steel industry and
changing comparative advantage and Labson et al’s (1995) publication on China’s
emerging steel industry and its impact on world iron ore and steel market, much of the
academic China steel industry research has been undertaken by Yanrui Wu. His work
includes a 2000 paper outlining recent developments and prospects for the Chinese steel
industry (Wu 2000) and a 1998 study on the economics of the East Asia steel industries
in which a chapter was dedicated to China’s iron and steel industry (Wu 1998). In other
work on the productive efficiency and performance in Chinese enterprises, he illustrates
that China’s iron and steel industry is only achieving around 60% of its potential output
and that this is typical of a developing economy (Wu 1995 and 1996).
Tcha and Wright (1999) present results of analysis of their model for determining
China’s demand for importing Australian iron ore. Crompton and Wu (2000) further
examine features of Chinese steel consumption demand. Greig’s (1997) discussion
paper on emerging trends, issues and policies in metals markets and East Asia is a
convenient collection of several University of Western Australia’s discussion papers in
which Wu also provides input. In relation to China’s iron and steel industry, the paper
covers supply and demand characteristics. It also briefly looks at Western Australia as

5
a supply source of iron ore. Extending to Wu’s work is Xiao-Guang Zhang & Siqi
Zhang (2001) who further discuss technical efficiency in China’s iron and steel
industry.
With regards to reform and economic growth, Wu and Ye (1998) as editors present a
selection of papers that were given at the International Conference on the Economies of
Greater China, held at the University of Western Australia in 1997. The papers include
macroeconomic policy and reforms; trade reform and economic growth and regional
development. Bell et al (1993) in their book on China’s market reforms outline
developments since China’s 1949 revolution - embarking on a strategy of socialist
economic development based on self reliance, central planning and directed allocation
of resources. They illustrate by the 1970s the economy through trade and investment
was opened up, but still contained a large proportion of public ownership. The authors
show how China’s reform was unlike other centrally planned economies of Eastern
Europe in that the process was gradual and not “big bang”. A summary of the reform
phases is outlined in Appendix 9.3.
The World Bank has produced many papers on China. Two such papers on China’s
comparative advantage (Yeats 1991) and foreign trade reform (World Bank 1994) were
found particularly useful. In the comparative advantage paper, tables on comparative
advantage indices are compared with Japan and other Asian countries between 1970 and
1987. It concludes that China’s main advantage is with its huge pool of low cost labour
resources and that the country has large potential in expanding its international trade as
it builds on this advantage. In the China foreign trade reform paper, a detailed overview
of China’s reform process is outlined. It is interesting to note that with regards to
6
inefficiency in the country’s steel industry due to fragmentation of production facilities,
in 1989 it was estimated that as much as 95% of enterprises were operating below
optimum.
Feng (1994b) in his article on China’s steel industry suggests that a clear trend in
developing economies attracting steel industry at the expense of industrialised countries
exists. He outlines this is attributed to increased national demand in developing
economies which in turn facilitates supply side capital stocks and economic reforms.
This then promotes technical efficiency and resource allocation improvements.
For understanding the history that shaped the Chinese psychology and attitude that
enabled economic reforms to be effective, cultural literature works were found very
useful. Wagner’s (1997) study of the traditional Chinese iron industry and how it
changed was useful from a historical perspective of the country’s steel industry
development.
Most of the iron and steel statistical data came from Chinese Government Departments
(their publications, internet websites and people) and the International Iron & Steel
Institute (their publications and internet website)1. Economic data were collected from
the Asian Development Bank (their internet website and publications). Much of the
current financial and economic news was obtained from the Asian media during regular
searches. The China Economic Information Service (CEIS) was monitored over several
years and was found to be one of the best sources of information on China’s steel
industry, mineral resources activity and general economic news.
1 Also documents searched for and found hidden away in old library files-discarded as being too old.

7
In relation to the actual role played by China’s steel industry on the country’s economic
development, apart from in depth academic analysis of aspects, which generally related
to efficiency, it was found that much of the published work available tended to be rather
old and did not articulate or examine the history behind the role played by the industry
in China’s economic development and its industrialisation programme. This research
was needed to bring together the history behind the development of an industry that was
intended to be the country’s major driver towards industrialisation and how it compared
with the global industry. This being particularly significant since during a large
proportion of China’s period of rapid economic development, the global iron and steel
industry suffered from overcapacity and inefficiency.
Very little academic work has been done that takes a forward looking perspective in
examining how such an industry being a key driver of Chinese economic development
will develop. As conditions change in China, weaknesses in a model based on
industrialisation are sure to emerge. In order that both China and those engaging in
trade with the country better understand risks, it is useful to openly discuss these
weaknesses. It is considered necessary in a study researching the role played by a major
industry sector, to examine whether the viability of the industry can be sustained as the
country develops and its exposure to strategic issues increases.

8
1.3 Research Methodology
The research was conducted over several years in Australia, China and Singapore. It
consisted of reviewing Asian media, literature and databases held by international
organisations like the International Iron & Steel Institute, the Asian Development Bank,
the World Bank, the International Monetary Fund and Chinese Government
Departments. Several research visits were made to China where discussions were held
with Chinese Government Departments and Universities in both Beijing and Tianjin. A
trip was also made to the United Kingdom (a country that formerly had a strong iron
and steel industry). Support for the research was initially given by Rio Tinto Pty
Limited and subsequently by BHP Billiton Pty Ltd, two of the world’s largest mineral
resources companies and leading iron ore producers and suppliers to the Chinese steel
industry.
Several presentations and papers on this research were given. The most significant
were at the 2001 Global Iron Ore Conference in London, the 2002 Global Iron Ore &
Steel Forecast Conference in Australia and at a 2002 Hi-Tech trade presentation in
Tianjin, China. Participation in these events helped develop important contacts in
China which were helpful in providing further insight into the key features of steel
industry development that helped transform China’s economy and restore national
pride.
Economic and steel industry data were collected and stored in databases much of which
has been shown in the Appendices. The research focuses on China’s economic
development and examines the following hypothesis in relation to that development:

9
From a long-standing national development perspective, a firmly based indigenous
steel industry not relying on imported steel provides a secure base for modernisation
and economic development through industrialisation and international trade.
This research tests this hypothesis by examining in detail the following:
• In view of the importance of culture and history behind the drive towards
modernisation and industrialisation, Chinese literature going back to Sun Yat
Sen (1866-1925) - who led the first Chinese Republic in 1911
• An analysis of the failure of the Great Leap Forward campaign which started in
the early part of 1958, officially ended in December 1958, but many of the
programmes still continued through to 1963 (the end of the second five year
planning period in which the campaign was to modernise China’s economy)
• The details of the modernisation programme during and post Mao Zedong – this
covers his first Five-Year Plan (1953-1957) and subsequent plans. Post Mao
reforms started with Deng Xiaoping just prior to Mao Zedong’s death in 1976
• An outline of the growth of the Chinese steel industry (relative to the global
industry) from the middle of the 20th century
• How the iron and steel industry contributed to enhancing other industries
through increasing the production of exports and also reducing reliance on
imports
• The most important input raw material required for the production of iron and
steel is iron ore. This is a resource that China lacks; so having access to a
reliable source of this principal input is essential for sustaining the industry.
Australia is a key source for this raw material, and therefore Australia’s

10
contribution to China’s iron and steel industry as a supplier of raw materials is
examined
• Structural weaknesses, that may just be a part of the economic cycle, that
threaten the ability of the iron and steel industry to continue developing and
which in turn could lead to the industry being a drain on the economy.
1.4 Overview of Chapters
Before one can quantify the role China’s iron and steel industry has had on the
development of the country’s economy, it is necessary to understand the relative
position within the global iron and steel industry. This thesis starts with an in depth
look at the global iron and steel industry in Chapter 2. This is to provide an
understanding of the industry and enable one to better quantify and put into context the
importance of the steel industry as a key economic driver. In order to subsequently be
able to quantify the relative magnitude of China’s iron and steel industry development
and its corresponding rankings, global historical industry production data up to the end
of 2002 are presented along with selected detailed industry data and trends for the
world’s leading steel producing countries.
Chapter 3 follows with a historical review and detailed examination of the Chinese iron
and steel industry. This outlines the significant milestones in China’s history that had a
bearing on the philosophy behind developing an iron and steel industry to be a key
factor in rebuilding the country and driving the economy. Reforms in both political
ideology and economic management that put in place the appropriate framework for
iron and steel production are discussed in detail. The significant developments since the
birth of the People’s Republic in 1949 are highlighted along with changes in the

11
industry’s characteristics which are shown and discussed along with economic data and
trends. The country’s comparative advantage in a range of steel production processes
along with improvements in economic efficiency in relation to factors of production and
resource allocation are considered. These demonstrate and quantify the nature and
importance of the role played by the industry on the country’s economic development
and modernisation at the same time providing a detailed assessment of China’s iron and
steel industry in relation to the global iron and steel industry.
Chapter 4 presents an outline of Australia’s role in supporting China’s iron and steel
industry and the country’s economic development. Australia’s endowment of iron ore
reserves gives it a comparative advantage and this makes it the source of choice for
China and has elevated Australia to being China’s principle supplier of iron ore. Iron
ore production and supply economics are examined and discussed. The potential for
future trade developments between Australia and China is also assessed.
Chapter 5 outlines China’s economic development and its approach to international
trade. As the relationship between the nation’s steel industry and economy develops,
the appeal of international trade and foreign investment, which were found to be
increasing, is looked at with a view to impact on iron and steel demand and the nature
of its trade. The effects of China being a member of the World Trade Organisation, the
Beijing Olympics 2008, Shanghai World Expo and further trade reform together with
changing approaches to trade are discussed. The research discovered mid to longer-
term inherent risks and exposures for both China and international suppliers or
investors. With this in mind, steel industry, trade development and structural
weaknesses associated with exchange rate policy, integrity of the financial system in

12
relation to debt and reform generated unemployment giving rise to social tensions are
highlighted.
Chapter 6 outlines and discusses the findings of this research project and assesses
whether the decision to build an iron and steel industry, which supported
industrialisation as a basis for modernisation and economic development, was a good
choice. The work looks at the results of increased exposure to international markets and
resulting trade, whether they have improved the living standards of the Chinese,
whether the steel industry will continue to play as significant role in the future as the
economy develops and how the nature of demand, factors of production and
comparative advantage may change.
Chapter 7 summarises the findings and key issues that are relevant to China,
Australia and other countries. Conclusions, recommendations and further research
directions are also presented.

13
2 Overview of the Global Iron and Steel Industry
To help understand China’s relative ranking and position in the global iron and steel
industry both now and in the past, this Chapter presents an overview of the industry. It
gives an outline of the key elements and measurements that enable assessment of the
steel industry’s economic contribution.
Throughout this and following chapters, a great deal of reference is made to crude steel
making, manufacturing processes and product types. To help understand the
terminology and measures that are referred to in this thesis, the diagram on Figure 2.1
has been developed. It presents the key elements of total crude steel production. A
breakdown of the key elements of the crude steel making processes is shown in brown
and the key elements of steel product processes are shown in blue.
Figure 2.1: Crude Steel Production Breakdown
Abvn: HR: Hot rolled Coil (steel strip); CR: Cold Rolled Coil; HDG: Hot Dipped Galvanised
Stock
Rebar Merchant Bar Sections
WireRod
Billets & Blooms Slabs
Longs Sheet/Flat
Plate
HR Coil
HDG
CR Coil
Total Crude Steel Production
Oxy Blown Converter Electric Arc Furnace Other
Steel Products
Crude Steel Ingots Continuously Cast Steel Liquid Steel for casting
Open Hearth Furnace
Scrap
Tubes & Fittings Other Products
Rail Track Scrap

14
2.1 Steel Industry - Driver of the Economy
A key principle in growth theory is the important roles played by industry and
manufacturing in that they are considered as being “Engines of Growth” (Kaldor 1996
cited in Bramall 2000). The global steel industry developed from the heavily
industrialised Europe and USA. These regions had industries in place prior to the
Second World War between 1939 and 1945. It was not until after the war that
production capacity started to rapidly increase (refer to Chart 2.1). However, during the
latter half of the 20th century, developments in other manufacturing sectors introduced
substitutes (for example, plastics and aluminium) and these have contributed to lower
demand and lessened the steel industry’s dominance in the global economy. The
industry has been faced with oversupply problems for most of the second half of the
20th century. Threats to oil supplies and environmental concerns also contributed to
many western countries reducing investment in the industry.
However, steel is a material that is difficult to do without and less developed countries
demand more as they embark on development programmes as occurred in the last
quarter of the 20th century when Asian countries increased their appetite for steel. So as
western countries downgraded supply side economics, Asian economies (first Japan,
then Korea and China) with their lower input factor costs, moved in and captured steel
production market share. This was done during periods of significant economic
development for these countries that in effect used the steel industry as a model to
utilise resources, reduce reliance on imports and at the same time increase their

15
industrial base and capability. Correspondingly, this growth has been positively
reflected in GDP statistics.2
The iron and steel industry is very resource hungry and factors of production
incorporate a large proportion of a country’s energy, minerals and labour. In relation to
economic significance, the World Trade Organisation (2002) reports that global trade in
the iron and steel industry in 2001 was US$130 billion. Allowing for related industries
Marsh (2003a, p.i) considers the iron and steel industry to be worth over US$300 billion
annually to the global economy.
Chart 2.1 shows world steel production which following World War 2 was driven by
large demand growth in the industrialised countries and regions of Europe and North
America. The most rapid growth phase was from the late 1940s through late 1970s
when production increased from 111.6 million tonnes in 1946 to 746.4 million tonnes in
1979. From this time, as traditional industrial nations like USA and the European
countries reduced demand growth, Asian economies started their development, which
maintained increased demand.
2 Both Japan and Korea subsequently had economic issues that arose from weaknesses in their economic structures.

16
Chart 2.1: World Steel Production, 1900-2002
Data sources: From 1990 to 2001(inclusive) - Steel Statistical Yearbooks
For 2002 - CRU Monitor Bulk Ferroalloys (March 2003)
The major challenges affecting the industry are slowing down of world economic
growth, excess steelmaking capacity, input factor logistics/economics, oil price and US
dollar value. The slow down in world economic growth at a time when many countries
added to their steel production capacity has contributed to global excess steelmaking
capacity. This excess capacity is causing older, less efficient plants (like many in the
USA) to close, this in turn is causing domestic political pressures in the USA to impose
punitive tariffs and impact world trade and prices. The oil price has a significant impact
on regional economies in that as it increases, demand and economic growth suffer. In
addition, as factor input prices increase, steel production costs increase, which lower
profit margins for the industry. These lower margins cannot be recovered in the market
place due to the excess supply of steel causing product prices to remain low. Oil
markets have been very volatile in recent years as a result of regional insecurity and
threats of terrorism. Most countries trade in US dollars, so as the dollar weakens, to
maintain local costs, sellers tend to increase prices. During 2002 and 2003, the US
0
100
200
300
400
500
600
700
800
900
1000
1900
1905
1910
1915
1920
1925
1930
1935
1940
1945
1950
1955
1960
1965
1970
1975
1980
1985
1990
1995
2000
Wor
ld S
teel
Pro
duct
ion
(Mill
ion
tonn
es
2002

17
dollar has depreciated by over 20% against several currencies. It appears unlikely in the
short term that the US dollar will recover to its pre 2002 high values. The producers
who can best manage the above challenges will be the ones that will better survive in a
tough global marketplace.
To show the world steel production, Chart 2.2 shows the regional comparisons since
1989. Regional groupings are: Europe (all of Europe); former USSR3; North America
(Canada, USA, Mexico, Trinidad & Tobago, Cuba, Dominican Republic, Guatemala
and El Salvador); South America (Argentina, Brazil, Chile, Colombia, Ecuador,
Paraguay, Peru, Uruguay and Venezuela); Africa and Middle East; China; Japan; South
Korea and other Asian countries plus Oceania (Australia and New Zealand).
Chart 2.2: Regional World Steel Production, 1989 – 2002
Data source: International Iron and Steel Institute
From Chart 2.2, the reducing trend in steel production in the former USSR can be seen.
Notwithstanding industry restructuring which involved closing many inefficient plants,
0
50
100
150
200
250
1989 1990 1991 1992 1993 1994 1995 1996 1997 1998 1999 2000 2001 2002year
Reg
iona
l Ste
el P
rodu
ctio
n (th
ousa
nd to
nnes
)
All Europe Former USSR North America
South America Africa and Middle East China
Japan Korea Asia and Oceania
18
North America still maintained a modest increase in production output. This results
from continued investment in modern steel making processes such as the lower capital-
intensive electric arc process. China’s production output grew steadily from 1989
through to 2000 from 61.59 to 127.24 million tonnes, an average annual increase of 6
million tonnes. From 2000 to the end of 2002, production output increased from 127.24
to 181.56 million tonnes, an increase of 42.7%. Since 1989, China has had the highest
growth in steel production in the world. Japan (formerly the world’s largest
steelmaking country up until1996), produced 107.91 million tonnes of steel in 1989 and
in 2002 produced 107.75 million tonnes. Its output has remained reasonably constant.
This is mainly due to the higher technical quality steels being produced there. These
groupings are shown in Chart 2.3 for 2000, 2001 and 2002.
From Chart 2.3, it can be seen that global crude steel production did not change much
from 2000 to 2001 then increased moderately in 2002. In comparison, China’s crude
steel production increased from 127.2 million tonnes in 2000 to 152.3 million tonnes in
2001 and then to 181.6 million tonnes in 2002. This represents 15%, 17.9% and 20.5%
of the world’s total production respectively. Europe has remained steady at around 206
million tonnes. China (the world’s largest steel making country) is catching up with
181.6 million tonnes and has the potential to exceed the steel production of all of
Europe within the next few years. Particularly, with oversupply resulting from excess
capacity in both Europe and North America, these regions are under pressure to
rationalise their industries by closing down older plants and ones with lower efficiency4
(in the mid to longer term, this will lead to considerably less supply in these regions).
3 Former USSR consists of: Russia, Ukraine, Kazakhstan, Byelorussia, Moldova, Latvia, Uzbekistan, Azerbaijan, Georgia, Estonia, Latvia and Lithuania.

19
China has undoubtedly become one of the top steel producers in the world. Details of
world production (supply) and world steel consumption (demand) of crude steel are
shown in Appendices 9.1.3 and 9.1.10 respectively.
4 China has been selectively purchasing redundant plant mainly from Germany and has then with the help of German expertise used this plant in expansions and upgrades to some of the older Chinese plants.

20
Chart 2.3: Regional World Steel Production 2000, 2001 & 2002
Data source: International Iron and Steel Institute (all units in million tonnes)
World steel (2000)Total 847 million tonnes
62.943.1
106.4
127.2
24.639.1 135.2
98.6
209.8
15%15%
World steel (2001)Total 849 million tonnes
204.6
100.1
119.737.4
26.8152.3
102.9
43.962.1
Europe
Former USSR
North America
South America
Africa & Middle East
China
Japan
South Korea
Other Asia & Oceania
17.9%17.9%
World steel (2002)Total 887 million tonnes
55.245.4
107.7
181.6
26.6 40.8123.9
99.9
205.6
20.5%20.5%

21
2.2 Industry Structure and Behaviour - Barriers to Entry
The iron and steel industry is very capital intensive, requires long factory construction
and upgrade times and access to low cost factor inputs (iron ore, energy and labour).
These features make it difficult for new companies to enter the industry and in effect are
natural barriers of entry. In addition, returns on investment have traditionally been low,
which also does not encourage new entrants. Many of the Chinese producers initially
had their factories close to iron ore and coal mines (to lower the major factor input
costs), but many also found that the quality of their iron ore was too low (30-35% iron
content compared with Australia at 60-63%) and environmental problems arose from
coal burning.
Due to the high costs and low returns, many of the traditional steel making factories in
the USA closed (Marsh 2003a). The United Kingdom was one of the first industrialised
nations to see its steel industry being cut back. In the 1970s, crude steel production in
the United Kingdom was 28 million tonnes (IISI 1974, p.5) compared to 2002 when
production was only 11.6 million tonnes (IISI 2002a). Closing down and rehabilitation
costs also tend to encourage older less efficient plants5 to continue production beyond
their economic lives, this adds to the oversupply situation of steel products, which
continues to maintain downward pressure on steel prices.
In 2002, the top 5 world’s leading steel countries (China, Japan, USA, Russia and South
Korea) produced 54.8% of the world’s steel output, and then when one examines the top
5 of the world’s steel makers (Arcelor, LNM Group, Nippon Steel, Posco and Baosteel),
one sees that they only produce 17.6% of total world output. This is less industry

22
concentration compared to other industries like cement, aluminium and copper where it
is more than 40% (Marsh 2003a, p2). The steel production figures show that the
potential for further consolidation in the industry is likely and necessary. Further
examination of the iron ore industry (being the principal raw material input) showed
that predominantly 3 large companies control the majority of global production
(Australia’s Rio Tinto and BHP Billiton and Brazil’s CVRD).
To restore some measure of profitability to the industry and ensure that it can be
sustained in the longer term, pressure for more consolidation through mergers and
acquisitions is mounting (Alden & Marsh 2002, p3). This is an attempt by the major
players to increase industry concentration, which will in turn tilt playing fields and
enable higher market prices. As suggested above, this trend in industry concentration is
likely to increase barriers to entry, but will also increase a move towards monopolistic
behaviour, which together with high barriers to entry will increase the returns on capital
being achieved. In addition to high capital investment costs, other factor of production
characteristics impact entrants’ willingness to enter the industry. Examples of these
follow.
2.3 Economics of the Steel Industry - Factors of Production
To understand how China has emerged from being an insignificant player in the global
steel industry to being the world’s largest producer, it is useful to consider economic
aspects of the steel industry. These relate to the principal factors of production: energy,
raw materials (iron ore being the principal input), technology, vintage of plant, location
of labour and comparative advantage.
5 Environmental impact, energy efficiency and costs per tonne are key measures impacting plant efficiency.

23
A major factor of production is operating costs. These costs consist of feedstock raw
materials (iron ore, coking coal, magnesium, nickel and other minor additives), energy,
labour, services, and interest charges. With China starting steel industry development
in its communist era of the 1950s, these production costs had been artificially low and
centrally planned economies have shown that factors of production were not efficiently
allocated. This will be discussed in more detail in Chapter 3.
Steel industry start up costs are high due to the capital required for the high costs of the
steel making plant. However, with rationalisation in both the European and North
American steel industries underway, China has been able to purchase redundant steel
plant at low costs. For example in 1998, Thyssen Krupp Stahl (TKS) sold its 1.5
million tonne per year blast furnace from its Dortmund-Horde plant to China’s Handan
Iron and Steel Works (CRU 1998, Industry developments, p.3). Then in 2001, TKS
sold the Jiangsu Shagang Group most of the 4 million tonnes per year Dortmund steel
plant. When operational, this will increase Shagang’s total steel production capacity
from 4.5 to 8.5 million tonnes per year (CRU 2002a, Industry developments, p.10). In
2002, China’s Xiyang Group purchased two flat product mills, one from ISG’s
Cleveland West operations and the other from ISG’s Sparrow Point Mill. With the
collapse of Enron, the Chongqing Iron and Steel Company purchased a cold rolling mill
previously owned by them (CRU 2003a, Industry news in brief, p.10).
Due to the lower start up costs, many modern plants are being constructed as mini steel
mills. This type of plant uses the electric arc steel production process to produce long
products (refer to Figure 2.1 which shows the other two processes, oxygen blown

24
converter and open hearth furnace and also charts later in this chapter which show
increasing use of the lower capital cost electric arc production process). A typical
breakdown of costs associated with mini steel mills is shown in Table 2.1.
Table 2.1: Comparison of Average Mini Steel Plant (long products) Costs as at 2000
Country
(averages)
Feedstock Energy Refractories Fluxes &
Alloys
Direct
labour Electrodes Other
China 63% 18% 4% 5% 1% 3% 6%
Japan,
Korea,
Taiwan
56% 23% 5% 4% 3% 3% 6%
North
America 56% 17% 6% 5% 7% 4% 5%
Data source: AME Mineral Economics Steel, 2001, pp.26-33
The above table confirms that notwithstanding China’s comparative advantage of low
labour and energy costs, feedstock costs are higher. In this regard, it is worth taking a
detailed look at one of China’s steelworks, see Table 2.2. It shows costs in US$/tonne
against the world average costs for Shanghai No.5, long products mill in 2002.

25
Table 2.2: Comparison of Selected World Average Costs with Shanghai No.5 Long
Products Mill as at 2000
Costs (US$/tonne)
Average Feedstoc
k Energy
Direct
labour
Refractories, Fluxes,
Alloys,
Electrodes & Other
Shanghai No. 5
Long Products Mill
Year 2000
120.2 36.9 2.0 35.9
World average
(from samples) 97.3 31.5 6.8 35.9
Data source: AME Mineral Economics Steel, 2001, p.A-3
China’s main feedstock raw material is iron ore. As the country’s reserves of these are
of low quality, it is cost effective to use only part of the domestic production and import
the rest. Shanghai No 5’s feedstock cost of US$120.2 per tonne is 23.5% higher than
the world average of US$97.3 per tonne and energy costs of US$36.9 per tonne are
17.1% higher than the world average value of US$31.5 per tonne. This research
identified that China’s feedstock costs are increasing (mainly as a result of the country’s
own demand) and as the country relies on energy imports, it is likely that energy costs
will continue to be higher than world average. This shows that China’s low labour cost
is giving the country a competitive advantage. As the country’s economic development
continues, labour costs are likely to increase; this suggests that in the long run, China
could lose its international competitiveness. This situation will occur sooner if its
currency appreciates in value which will make imports cheaper and exports more
expensive.

26
As stated above, the principal feedstock raw material in the steel making process is iron
ore. Details of domestic reserves, production and imports are presented in Chapter 3.
This is an area where Australia with its abundant iron ore resources and a direct reduced
iron production facility will play a major role in China’s continued development of both
its iron and steel industry and its economy. Australia’s contribution is outlined in detail
in Chapter 4. Feedstock inputs (energy and iron ore) are major risk exposures that
China faces in maintaining the steel industry’s momentum in driving the economy.
With direct labour cost of US$2 per tonne, comparative advantage in low labour cost
inputs is evident from Table 2.2. This is confirmed by the World Bank’s research on
China’s comparative advantage, which concluded that China had developed
comparative advantage in a relatively broad base of labour intensive industries (Yeats
1991). China has a large supply of labour that is willing to work for low wages in
generally poor working environments. Factories take advantage of this and to some
extent exploit workers in that safety and health in the workplace is not high on their
agendas.
Location is an important factor contributing to production costs. China’s industrial
development has been helped by the development of large production facilities located
at coastal cities. Improved infrastructure has enabled improved transport efficiency of
the commodities for export and for those required for industrial inputs. Unfortunately,
in a country as large as China, this has given rise to large disparities in regional
development and efficiencies. So in the short term, this increases the efficiency of
production, but in the longer term, will introduce social problems as state workers are

27
laid off and locals cannot get work. This leads to an important finding and is discussed
in more detail in Chapter 5.
Important features of the productive efficiency of steel producing plants are age,
technical and commercial ability. Newer and higher technical level steel making
facilities require lower maintenance and operate using lower energy consumption.
Environmental pollution is also lower. How well the factories manage the supply -
demand balance, negotiate raw material supply contracts and markets their products
impacts input/output efficiency. In relation to sustainability, China has recently started
to pay more attention to improving environmental externalities. The China Economic
Information Service reported (CEIS 0401 2003, art.043) that Shougang steelworks will
reduce production capacity by 2 million tonnes by closing down one of their converters
to reduce pollution. A new production facility is being built in Hebei, closer to
Shougang’s mining operations. The plant is expected to be operational by mid 2004.
According to Zhu Jimin, Board Chairman of Shougang (CEIS 0128 2003, art.040) “no
out-of-date production techniques and equipment formerly used by Shougang would be
transferred to the new base. Instead new and environmentally friendly technology and
equipment would be installed to build a modern steel plant”. In the past few years,
Shougang is reported to have spent 241 million yuan (US$29 million) in financing 33
projects relating to environmental protection (CEIS 0117 2003). It is expected that
many other steel facilities will close down as the Central Government continues in its
endeavours to reduce pollution.

28
2.3.1 Iron Ore - Principal Input Material to the Steel Industry
Chart 2.4: World Production of Iron Ore, 1948 - 2002
Data sources: American Iron Ore Association (1996), International Iron and Steel Institute
AME Mineral Economics, January 2003 (for 2002 data only)
Iron ore is the principal raw material input required in the steel making process. In
many countries, the industry is considered a labour intensive factor input. In relation to
China, it is a resource that was traditionally sourced domestically, but now increasingly
relying on imports due to cost effectiveness of using higher quality material than what is
available domestically. The growth in world iron ore production since 1948 is shown in
Chart 2.4 and is directly related to steel production, which in turn is determined by
global demand for steel products. Within 50 years, we have seen production increase
from under 200 to just over 1,000 million tonnes (annual average 16 million tonnes).
Most of the growth occurred between 1950 and early 1970s – from just over 200 to
approx 900 million tonnes (annual average 35 million tonnes). Growth slowed after
mid 1970s, not starting its modest recovery (in relative terms) until early 1980s when
China’s demand increased. The Asian economic crisis in the early 1990s stalled the
growth rate for a few years.
0
200
400
600
800
1000
120019
48
1950
1952
1954
1956
1958
1960
1962
1964
1966
1968
1970
1972
1974
1976
1978
1980
1982
1984
1986
1988
1990
1992
1994
1996
1998
2000
2002
Iron
Ore
Pro
duct
ion
(milli
on to
nnes
)

29
China has taken advantage of the key factors of production to develop its steel industry.
Iron ore and coal (coking and energy) have been relatively low cost; prices for these key
inputs are increasing as a result of the country’s high demand. The country is
maintaining its comparative advantage through its low cost labour. This is under threat
as labour costs increase with increasing economic development. Increasing demand and
in turn increased costs of steel will impact the country’s continued economic
development. This finding will be discussed in more detail in Chapter 6.
2.4 Leading Steel Producing Countries
Table 2.3 shows the top ten steel producing countries (ranked on 2002 output) and the
corresponding production output from 1998 to 2002.
Table 2.3 Steel Output of the Top Ten Producing Countries (million tonnes), 1998 - 2002
Countries 1998 1999 2000 2001 2002
China 114.1 123.3 126.3 150.9 181.6
Japan 93.5 94.2 106.4 102.9 107.7
USA 97.3 96.1 100.7 90.1 92.4
Russia 41.8 49.8 57.6 57.5 58.6
Korea 39.9 41.0 43.1 43.9 45.4
Germany 44.0 42.1 46.4 44.8 45.0
Ukraine 23.5 26.8 31.3 33.1 34.1
Brazil 25.8 25.0 27.8 26.8 29.6
India 23.5 24.3 26.9 27.3 28.8
Italy 25.8 25.0 26.5 26.5 26
Data sources: International Iron and Steel Institute, Iron & Steel Monthly report December
1999 for 1999 & 1998; Iron & Steel Monthly report December 2001 for 2000; Iron
& Steel Monthly report December 2002 for 2001 and 2002

30
Since 1998, not much change has occurred with the main exception being China
increasing production by the highest margin and Korea edging ahead of Germany in
2002. Rankings since 1991 are in Appendix 9.1.13.
Chart 2.5 shows the 6 leading steel producing countries since 1972. These are China,
Japan, Germany, USA, Russia and South Korea. The chart shows that only China and
Korea are experiencing growth, which is occurring at the expense of the others.
Between 1972 and 2002, China increased from 23.4 to 181.5 million tonnes, Korea
from 2 to 45.4 million tonnes and the USA, actually decreased from 120.9 to 92.4
million tonnes. This shows the shift in steel production from the west to Asia.
Although Japan is losing market share to China, it still is a significant producing
country.
Chart 2.5: Six Leading Producer Countries' Steel Production, 1972 - 2002
Data sources: International Iron and Steel Institute up to 2000 and Russia 2001
CRU Monitor Bulk Ferroalloys, March 2003, p.2 for 2001 and 2002
0
20,000
40,000
60,000
80,000
100,000
120,000
140,000
160,000
180,000
200,000
1972
1974
1976
1978
1980
1982
1984
1986
1988
1990
1992
1994
1996
1998
2000
2002
year
Maj
or P
rodu
cers
' Ste
el P
rodu
ctio
n S
ince
197
2(th
ousa
nd to
nnes
)
PR China USA
Japan Russia
Germany Korea

31
2.5 Steel Production Processes for the Top Six Producing Countries
A useful way to quantify a country’s efficiency and technical development is to
examine the change in steel production from the traditional steel making processes.
Figure 2.1 outlined the steel production processes and resulting products. The main
steel making processes are oxygen blown converter, electric arc furnace and the open-
hearth furnace. The final casting methods used can be very energy and labour intensive,
the most technically advanced approach is to use the continuous casting process. The
continuous casting process uses less energy (it processes the material directly before it
cools thus eliminating the need for additional heat energy). Many producers have been
upgrading plants to use this method.
Chart 2.6 shows the development in continuously cast steel for the 6 leading producer
countries. A higher level of usage of continuous casting is a key industry performance
measure. Charts 2.7, 2.8 and 2.9 illustrate the changes in the major crude steel
production processes (this is the stage before shaping the steel into billets, blooms or
slabs either by continuous casting or in separate stages) for the 6 leading producing
countries since 1972.
2.5.1 Continuous Cast Steel Making Process Chart 2.6 shows that between 1982 and 2002, China’s continuous cast steel production
has increased from just under 3 to 168 million tonnes; Korea from just over 6 to just
under 45 million tonnes. Between 1982 and 2002, the USA increased continuous cast

32
steel production from 19.6 to 89.5 million tonnes dropping to 87.3 million tonnes in
2001 as the industry faced overcapacity in steel production.
33
Chart 2.6: Six Leading Producer Countries' Continuously Cast Steel Production 1972 – 2002 Data source: International Iron and Steel Institute
The continuous casting process is increasingly being used along with electric arc
furnaces in steel minimills. These mills reduce the number of stages in the steelmaking
process and as a result are more efficient. They are increasingly being used in the USA
as shown by the increase in continuous casting processes in Chart 2.6.
2.5.2 Steel Production in Electric Arc Furnaces
Chart 2.7: Six Leading Producer Countries' Production of Crude Steel in Electric Arc
Furnaces, 1972-2002.
Source: International Iron and Steel Institute
0
20000
40000
60000
80000
100000
120000
140000
160000
180000
1972
1974
1976
1978
1980
1982
1984
1986
1988
1990
1992
1994
1996
1998
2000
2002
Maj
or P
rodu
cer's
Con
tinuo
us S
teel
Pro
duct
ion
(tho
usan
d to
nnes
)
PR China USA Japan Russia Germany Korea
0
10,000
20,000
30,000
40,000
50,000
60,000
1972
1974
1976
1978
1980
1982
1984
1986
1988
1990
1992
1994
1996
1998
2000
2002
Maj
or P
rodu
ders
EA
F S
teel
Pro
duct
ion
(thou
sand
tonn
es)
PR China USA
Japan Russia
Germany Korea

34
Data source: International Iron and Steel Institute
Since it was very effective at reducing the ingress of impurities into the steelmaking
process, the electric arc furnace was originally designed for making high grade alloy
steels. It was also found to be very effective at removing sulphur from the steelmaking
process when scrap was being used and for this reason, electric arc furnace steelmaking
plant became more attractive from an investment perspective in that lower capital is
required and the process is simpler. Chart 2.7 shows the growth in the electric arc
furnace process. Between 1972 and 2002, Japan’s growth has been from 18 to 28.2
million tonnes, the USA from 21.5 to 46.7 million tonnes and China from 5.2 to 29
million tonnes. Korea has quietly been increasing from 0 in 1974 to 20.5 million tonnes
in 2002. The electric arc furnace can use direct reduced iron (DRI) products and scrap
metal directly. This type of plant is very suitable for minimills where they are more
suited to rolled rather than flat products. It is however heavily reliant on the cost of
electrical power.

35
2.5.3 Production of Steel in Oxygen Blown Converters
Chart 2.8: Six Leading Producer Countries' Production of Crude Steel in Oxygen Blown
Converters, 1972 - 2002
Data source: International Iron and Steel Institute
Chart 2.8 shows the production of steel in oxygen blown converters. Oxygen blown
converters include blast furnace steel making processes which have a jet of pure oxygen
injected onto the surface of the molten iron. These furnaces prefer lump product or
agglomerated (sinter) products being fed into the furnace. Unfortunately, they have
high initial capital outlays. The chart shows that only China and Korea invested in
growth of the use of oxygen blown converters. The USA closed down plants of this
type in the early 1980s in an effort to reduce the country’s oversupply capacity while
endeavouring to increase its more cost effective electric arc furnace steel producing
plant together with continuous casting processes in minimills.
0
20,000
40,000
60,000
80,000
100,000
120,000
140,000
1972
1974
1976
1978
1980
1982
1984
1986
1988
1990
1992
1994
1996
1998
2000
2002
Maj
or P
rodu
cers
BO
F S
teel
Pro
duct
ion
. (t
hous
and
tonn
es)
PR China USA
Japan Russia
Germany Korea

36
2.5.4 Steel Production in Open Hearth Furnaces Chart 2.9 shows the traditional inefficient open-hearth furnace. The open-hearth
furnace is the oldest method and was primarily used in the early days of steel making.
As can be seen, its use is diminishing as older plants are closed down.
Chart 2.9: Six Leading Producer Countries' Production of Crude Steel in Open Hearth
Furnaces, 1972 – 2002.
Data source: International Iron and Steel Institute
Following the forming of the People’s Republic, the open-hearth furnace was China’s
principal steel making process. It continued growing until the mid 1990s when as part
of the country’s steel industry reform, the central government closed many steel
producing plants that used this type of equipment. The chart shows that long before
China’s reform, other leading countries such as Japan, Germany and USA had been
moving away from the open-hearth steel making process replacing it with more efficient
alternatives.
0
5,000
10,000
15,000
20,000
25,000
30,000
35,000
40,000
1972
1974
1976
1978
1980
1982
1984
1986
1988
1990
1992
1994
1996
1998
2000
2002
Ste
el P
rodu
ctio
n in
Ope
n H
earth
Fur
nace
s (th
ousa
nd to
nnes
)
PR China USA
Japan Russia
Germany Korea

37
2.5.5 Summary of Global Supply
Regionally, notwithstanding a potential increase in Russian crude steel production, the
trend for the European steel production is moderately downwards, this being somewhat
dependent on German industry consolidation. Asia’s competitive advantage through
factor of production inputs of lower labour costs and plant locations (principally
supplying domestic markets) should result in Asia’s upward trend continuing. This
upward trend will be underpinned and sustained by China, Korea and India’s supply
growth. North America’s long-term trend is upwards. This has the potential to
significantly level off and may even trend downwards as older plants (which are
continuing beyond their economic lives) close down and the industry continues to both
restructure and consolidate. However, it is not all negative, as the North American steel
industry consolidates and increases its use of higher level of technical processes, its
operating efficiencies will increase. The increasing use of lower capital intensive and
mini steel mills using electric arc furnaces and continuous casting steel making
processes will improve the competitive position of the its steel industry.
2.6 Steel Demand
The previous sections outlined supply characteristics, this section outlines demand
characteristics. The International Institute of Steel’s standard methodology (IISI 2002b,
p107) is to use the term apparent crude steel consumption to measure and report crude
steel consumption. This term is made up of a country’s production plus imports less
exports. Exports and imports are converted to crude steel equivalent using a factor of
1.3/(1+0.175c)6, where c is the proportion of domestic steel that is continuously cast.
This term is used throughout this thesis.
6 The reciprocal of this factor is applied to gross up import and export terms.

38
2.6.1 World Apparent Crude Steel Consumption Chart 2.10 shows modest growth in world apparent crude steel demand since the early
1970s. Demand in most developed regions has not been increasing at the same rate as
that of some of the developing countries. In fact, some of the developed countries are
now showing a modest decrease in demand.
Chart 2.10: World Apparent Crude Steel Consumption, 1972 - 2001
Data sources: International Iron and Steel Institute (Statistical Yearbooks from 1982 to 2002)
It is to be expected that when the cycle of increased demand in the developing countries
peaks, we should see in the mid to longer term, both world iron ore and steel production
peaking. The impact of this will be significant for Asian, European and North
American trade. To illustrate the relative differences in regional demand for steel,
Chart 2.11 compares steel demand by regions since 1990. It shows Asia consistently
with the highest demand for crude steel.
0
100
200
300
400
500
600
700
800
900
1000
1972
1973
1974
1975
1976
1977
1978
1979
1980
1981
1982
1983
1984
1985
1986
1987
1988
1989
1990
1991
1992
1993
1994
1995
1996
1997
1998
1999
2000
2001
Wor
ld S
teel
Con
sum
ptio
n (M
illion
tonn
es)

39
Chart 2.11: World Apparent Crude Steel Consumption by Region, 1990 - 2001
Data source: International Iron and Steel Institute
Chart 2.12 shows in more detail the apparent crude steel consumption for the leading
producer countries from 1972 to 2001. The USA and Germany’s consumption of steel
have been gradually decreasing, while at the same time Japan experienced modest
growth up until the early 1990’s from which time demand started to decrease. Both
China and Korea have consistently had considerable growth. China’s growth has been
the most dramatic, increasing from 25.7 to 169.9 million tonnes between 1972 and
2001. It now has the highest total demand consumption of the leading producer
countries.
0
50,000
100,000
150,000
200,000
250,000
300,000
350,000
400,000
1990 1991 1992 1993 1994 1995 1996 1997 1998 1999 2000 2001
Reg
iona
l App
aren
t Ste
el C
onsu
mpt
ion
(thou
sand
tonn
es)
European Union 15 Other Europe + USSR Nth America + Sth America Africa + Mexico = Asia Oceania

40
Chart 2.12: Six Leading Producer Countries' Apparent Crude Steel Consumption, 1972-
2001
Data source: International Iron and Steel Institute
2.6.2 Per Capita Steel Demand - Six Leading Producer Countries
Another indication of a country’s potential demand for steel is per capita apparent crude
steel consumption. Chart 2.13 shows this indicator for the leading steel producing
countries from 1989 to 2001. By the end of 2001, developed countries such as Japan,
USA and Germany had per capita apparent crude steel consumption values of 600, 400
and 500 kilograms respectively. South Korea and Taiwan have values close to 1,000 kg
per person. Despite China being the world’s largest steel consumer, with a population
exceeding 1.2 billion, the country ranks among the lowest in the world in terms of steel
consumption per capita. According to the China Economic Information Service (CEIS
0324 2003 art.043), in 2002 the per capita steel consumption in China was only 141 kg.
0
50,000
100,000
150,000
200,000
250,000
1972
1974
1976
1978
1980
1982
1984
1986
1988
1990
1992
1994
1996
1998
2000
2002
App
aren
t Cru
de S
teel
Con
sum
ptio
n(th
ousa
nd to
nnes
)
PR China USA Japan Russia Germany Korea

41
Chart 2.13: Six Leading Producer Countries' Apparent Crude Steel Consumption per capita,
1989-2001
Data source: International Iron and Steel Institute
2.6.3 Summary of Global Demand
Western economies’ steel demand per capita is not expected to significantly increase.
This may be related to the level of development in those regions’ relatively stable
population sizes and also the introduction of substitute materials (aluminium, plastics
and fibre glass). The relationship between demand for steel and level of economic
development is discussed in Chapter 3. With other developing regions and countries,
one should continue to see demand growth. In particular, China with such a low steel
consumption per capita value of around 140 kg suggests that the country still has great
potential for increased demand to occur before it starts to level then reduce. The
outlook for China’s demand for steel is examined in Chapter 3.
0
100
200
300
400
500
600
700
800
900
1000
1989 1990 1991 1992 1993 1994 1995 1996 1997 1998 1999 2000 2001 2002
Maj
ors
Pro
duce
r cou
ntrie
s' A
ppar
ent S
teel
(Kilo
gram
s) PR China USA Japan Russia Germany Korea

42
2.7 Employment in the Steel Industry
To complete this review of the global iron and steel industry, Chart 2.14 shows the
employment levels in the steel industry of the leading producer countries.
Notwithstanding the decrease from 2.3 million workers in 1996 to 1.8 million in 2002,
compared to the other leading producers (Japan 176,000, USA 124,000, Germany
74,000 and Korea 57,000), China’s steel industry employment figures are still very
large. However, it is not accurate to directly compare these figures, as the structure of
employment in China is different. Many of the employees being reported in statistics
are actually retired workers and also ones on special employment conditions that enable
them to receive benefits from the company. In 1974 when Europe was a major
industrial producer, the total number of people employed in the steel industry was
790,000 (IISI 1981, p.18). So as China’s industrial activity has also grown, it is not
such a surprise given the nature of the welfare in China that high numbers of employees
are registered in the industry. Nevertheless, it does demonstrate a need for the Central
Government to continue with reform of China’s steel industry.
Chart 2.14: Leading Producer Countries' Employment in the Steel Industry, 1975 - 2002
Data source: International Iron and Steel Institute
0
500
1,000
1,500
2,000
2,500
1975 1995 1996 1997 1998 1999 2000 2001 2002
Em
ploy
men
t in
the
Ste
el in
dust
ry (t
hous
and
peop
le)
PR China USA Japan Germany Korea

43
Clearly, China still has a long way to go to reduce employment in the industry to bring
it to the levels of the other leading producer countries. This demonstrates the industry
has much capacity for reform to increase efficiency and lower unit costs, which
supports its potential to maintain competitive position in the global trade of steel
products. This will be important as labour costs increase along with the country’s
economic development. The challenge for China is managing this transition from a
social perspective. Considering China’s history in relation to the impact of social
inequalities, this social challenge could have the potential to derail China’s economic
development and subsequently its trading comparative advantages as workers adjust to
a changing income and welfare conditions. This is discussed in more detail in Chapters
5 and 6, particularly as it was found to be a major concern.
2.8 Discussion
As the iron and steel industry has traditionally been a significant contributor to a
country’s economic development, then it is not surprising that we have seen capacity
growth in developing nations much of which has been at the expense of developed
nations. This has resulted in an excess of global steel capacity. This is more critical on
a regional basis, where western regions have lower demand versus other regions. In the
mid to longer term particularly either after or when China reduces demand (resulting
from its infrastructure construction programme), the excess capacity will produce
excess stocks resulting in downward pressure on steel prices. An OECD report (cited in
Asia Financial Times 2002) states that there is around 200 million tonnes of spare
capacity in the global market. It appears that even with major efforts to balance supply
and demand through international agreements to close production plant capacity by
between 93.5 and 97.5 million tonnes (Marsh & Mann 2001), it is likely to take up to 20

44
years to achieve the correct balance. Traditional dominating regions like Europe and
North America will continue to see their steel industry slowly disappearing as they
battle the lower cost and efficient Asian producers. This will continue to cause tension
in the industry. Unions in the USA will likely continue with demands for tariff and
industry trade protection. It is likely that the WTO will have a major role to play in
future trade negotiations to ensure that “creative in concept” trade barriers are not put in
place to protect regional steel industries. These are examined in more detail in Section
5.4. Nevertheless, it is projected that a modest recovery in global steel production to
900 million tonnes by 2005 will occur (MEPS 2001, p.6). This is based on improved
industrial performance from the countries of the former USSR, continued expansion in
China along with India and South East Asian countries and improvements in Japanese
industry. The ABARE (2002a) forecasts that steel and iron ore production in 2007 will
be 908 and 1,119 million tonnes respectively. If recent increasing trends in steel
production (and corresponding increased demand of iron ore) continue, by 2007 the
values will be considerably higher than the forecast by ABARE.
A possible development in the iron and steel industry is futures trading in steel through
exchange markets like the London Metals Exchange (LME). For futures contracts and
trading (either in physical or paper) to be effective, it generally requires commodities
which can be classified by set standards such that they are almost identical no matter
where they originated from. If trades were physical, it would mean setting up steel
stores around the world where stocks could be called upon as needed. This
development could open up new opportunities to improve trading performance. Having
the ability to be “short” or “long” in steel products would improve price transparency
and would enable buyers and sellers of crude steel, products and even iron ore to hedge

45
exposures to future price and/or supply shocks. Unfortunately, this concept is not new
and according to Morrison (2003, p.24), it was first tried in 1872 when an informal
metals exchange in London launched a steel futures contract only to stop several
months later. Morrison also reports that Enron offered online swap trading in steel.
This occurred during the latter part of the 1990s. Nevertheless, the idea of steel future
contracts and trading is no different to what is being done for other commodities and
this initiative is considered to have great potential.
2.9 Conclusion
The global iron and steel industry plays an important role in both satisfying a country’s
domestic demand for steel and for export trade both of which have a significant impact
on a country’s economy. With the exception of China, regional steel production has
remained relatively constant as countries endeavour to maintain their industry and steel
making capability. Changes in the steelmaking plant have seen the end of the
traditional open hearth process plants with more focus on cost efficient electric arc
plants combined with continuous casting processes. This has been most evident in
North America through increasing use of minimills. Supply side economics show that
as a result of high capital costs, long plant construction times and the importance of low
cost factor inputs (iron ore, energy and labour); barriers of entry are difficult to
overcome. This means that to enter the industry, long time horizons are involved.
Before China could industrialise and develop the economy, it was important to have an
industry that could satisfy its demand for steel. The Chinese iron and steel industry has
developed in a time of global excess capacity and continuing uncertainty. China’s path
to developing such an industry started at the early part of the nineteenth century.

46
3 Chinese Iron and Steel Industry–Marshall of Industry
The previous chapter presented an overview of the global iron and steel industry. This
chapter looks at the Chinese iron and steel industry in detail and how it compares
globally. It also examines the importance of Chinese history and culture in enabling the
country’s iron and steel industry to play such an important part in its economic reform
and industrialisation.
The Qing government attempted early modernisation reforms. This programme of
modernisation was known as the Yangwu (foreign matters) movement between 1865
and 1894. It included the establishment of modern arsenals and direct military
industries, building up a modern navy, founding of modern enterprises and the
establishment of a western style iron and steel works (Su 1986). The iron and steel
works were built at Guangzhou and were later moved to Hanyang. They consisted
mainly of British machinery. This early attempt at having a national iron and steel
industry saw output from the plant’s blast furnace being only 22,000 tonnes. In 1890,
Governor Chang Chih-Tung established an iron and steel works in Hunan (Metal
Bulletin 1978, p.5). The war with Japan in 1894-1895 interrupted China’s attempt to
industrialise.
This raises the question why China’s early attempts at reforming the economy and
becoming a modern industrialised economy like Japan failed. Japan had developed a
strong military capability, which was a result of the Samurai class who ran Japan’s early
governments. They had already constructed a light industry and quickly moved to
import machinery and build a heavy industry along the lines of the west. Japan’s ruling
class were military in discipline and strategic unlike in China where Confucian
47
philosophy focused more on a well-educated public service. As a result of
industrialisation and at the same time developing a strong military, Japan was able to
enjoy economic development long before China. Interestingly, since the People’s
Republic was founded in 1949, China’s military sector has in fact developed ahead of
the economy. It seems that although the steel industry is a key driver in economic
development so also is military might7. China’s solid economic performance seems to
have followed growth in its military capability, in addition to being driven by the iron
and steel industry’s role in industrialisation.
History is an important part of Chinese culture. To better understand how the country’s
iron and steel industry developed, the following sections outline the key periods that
shaped the industry and then go on to examine the industry in detail. The connection to
the country’s economy is highlighted and discussed in detail so that industry’s role in
the economic development can be shown.
3.1 History of China’s Iron and Steel Industry
China is one of the largest countries in the world both in land area and in population, a
country, which is endowed with most natural mineral resources. As early as AD 100
the Chinese had discovered how to make steel (AME Mineral Economics 1999, p.C24).
It is one of the oldest civilisations in the world, but as a result of a turbulent history, it
took a long time before it was able to take advantage of its resources and skills. This
section looks at a brief period in China’s history as it relates to the development of its
iron and steel industry.
7 A similar view is suggested by Mailer (2003) in his conclusion that the only way America can get off its present economic downslope is for the government to “become a regime with greater military presence and drive to ward empire”. He suggests that America may use Iraq as an excuse for moving in an imperial direction.

48
Sun Yat-Sen was an important figure in Chinese history. Born in 1867, he became a
key figure in the Guomindang, the nationalist party in China that eventually became the
enemy of the communist party. Sun Yat-Sen was a strong believer in China becoming a
republic and developing industry and agriculture. He never had the opportunity to
realise these beliefs as Chinese politics and society were to continue in disarray.
Eventually, Mao’s communist forces defeated his nationalist party and a new chapter in
Chinese history started. In relation to the model of industrialisation by way of the iron
and steel industry, since the People’s Republic of China was proclaimed on 1 October
1949 four periods of major significance have occurred. These periods include the
centrally planned five-year plans and are:
Period 1 (1949-1957): Founding of the PRC, Rehabilitation, Planning Model and
Stability
In 1949, China’s economy and industry were in very poor shape following the Chinese
civil war (1946-1949). Following the establishment of the People’s Republic of China,
Mao Zedong had to recover the economy. At this time, China’s annual steel production
was very low at 158,000 tonnes, insignificant in relation to global steel production.
China needed to choose a model for economic development. The choice was between a
Japanese model (based on a market economic system) and the soviet or Stalinist
centrally planned model. The Communist Party had a good relationship with the USSR,
so felt it was better to move in that direction and receive support at the same time.
China signed the Treaty of Friendship Alliance and Mutual Assistance, which provided
the country with financial aid to modernise its industry. Mao Zedong copied the
USSR’s five-year planning model, first used by Stalin in 1928. An important aspect of

49
Stalin’s first five-year plan was developing the iron and steel industry, so that the
country could rapidly industrialise. The main reason for this was to ensure the country
was able to defend itself from capitalist countries (Five Year Plan, on line, 2003). Two
guiding principles were adopted from the soviets – Marxist principles of common
ownership and the Stalinist central planning, particularly in relation to resource
allocation, suppression of light industry in favour of heavy industry. Mao Zedong
added a third guiding principle – the principle of regional economic self-sufficiency
(Demurger et al 2002).
The first planning period implemented was known as the Period of Rehabilitation (1949
– 1952). This was a period that was to allow gradual rehabilitation and rebuilding of
the nation. It was a time for industry to recover from the Chinese civil war and to
develop production and administrative systems. Between 1949 and 1952, 329.3 million
yuan8 was spent in the metallurgical sector (Metal Bulletin 1978, p.8) and steel
production during this period is shown in Table 3.1.
Table 3.1: Steel production during the Period of Rehabilitation (1949-1952)
Year 1949 1950 1951 1952 Steel Production
(tonnes) 158,000 606,000 896,000 1,349,000
Data source: International Iron and Steel Institute
8 This represented 11.6% of total investment in capital construction.

50
During the Period of Rehabilitation, China’s steel production increased from 158,000 to
1,349,000 tonnes. This represented a 754% increase over 4 years. In order to recover
from the damaging civil conflicts, the government was relatively liberal in their policies
and actually gave incentives to workers and owners. The growth in steel production
during this period suggested that the more liberal policies were effective.
Following the Rehabilitation Period was the First Five-Year Plan (1953-1957). This
plan was copied from Stalin’s model, and was China’s first attempt to map out a
programme to achieve industrialisation. With the emphasis on the soviet model, Russia
played an important role in the implementation of the plan. By copying the soviet
model, this could be considered an early period of transition to socialism for China.
The plan targeted heavy industry for major reform, with an emphasis on steel, coal and
iron production. Table 3.2 compares the plan values (estimated and actual) to the pre-
plan year (1952) values for coal, pig iron and steel.
Table 3.2: Planned and Actual Steel Output Compared to Pre Plan Steel Output
Steel Output (million tonnes) 1952 1957 planned 1957 Actual
Coal 63 113 124 Pig Iron 1.9 4.7 5.8
Steel 1.3 4.1 5.35
Data sources: http//www.historylearningsite.co.uk/china_china_five_year_plan.htm (viewed 3 March
2003) and China Steel Statistics 2000, p.1 (The State Administration of Metallurgical Industry)
Table 3.2 shows that the planned output values for coal, iron and steel were not only
achieved, but were also exceeded. This encouraged the government to continue with its
planning reforms to develop steel production. At the start of the First Five-Year Plan,
apparent consumption was only 2.4 million tonnes and has averaged an annual growth
51
of 9.1% to reach 167 million tonnes in 2002 (CEIS 1203 2002). The objective of the
First Five-Year Plan was to establish a foundation for socialist industrialisation. This
was to emphasise steel production and with the help and expertise of USSR, existing
steelworks were expanded and new integrated mills were built. The plan called for
2,930 million yuan9 to be allocated to the iron and steel sector (Metal Bulletin 1978,
p.8). The State Statistical Bureau (cited in Dorian 1994, p.56) reports that more than 86
billion yuan were invested in capital construction during 1952 to1958 of which 22.4%
was for heavy industry. According to Sugimotto (1993, p.268), investment in the steel
industry during the First Five-Year Pan period was 15.16% of all industrial investment
in China. This equates to the 2,930 million yuan reported by the Metal Bulletin. In
1953, steel production was 1,700,000 tonnes and at the end of the First Five-Year Plan
period in 1957, production had increased to 5,350,000 tonnes - an increase of 214.7%.
Table 3.3 shows the steel production for each year during the First Five-Year Plan.
Table 3.3: Steel Production during the First Five-Year Plan, 1953-1957
Year 1953 1954 1955 1956 1957 Steel
Production (tonne)
1,700,000 2,230,000 2,853,000 4,465,000 5,350,000
Data source: International Iron and Steel Institute
During this period the Anshan Iron and Steel works in Liaoning Province were
established. Anshan went on to become China’s second and the world’s eighteenth
largest steel producer in 2002. The First Five-Year Plan results were good for industrial
development but with only 6.7% of the total nation’s funds spent on agriculture the
country did not develop as well (Su 1986, pp.213-214). This was recognised by Mao
9 This represented 12.8% of central investment funds.

52
Zedong and was part of his speech on the “Ten Major Relationships” in April 1956. In
this speech, he outlined the importance of agriculture to ensure food and basic needs
provision for workers.
Period 2 (1958-1976): Instability Caused by the Great Leap Forward Campaign,
Recovery and Readjustment
The next milestone was the Second Five-Year Plan (1958-1963). During this planning
period, agriculture and industry were to develop. The five major objectives of the plan
translated from the Premier Zhou Enlai’s proposals delivered in September 1956 at the
Eighth Chinese Communist Party National Congress (Liu Suinian & Wu Qungan 1986,
cited in Dorian 1994, p.58) were:
1. Carry out industrial construction centring around heavy industry, speed up
the technical transformation of the national economy and lay a solid
foundation for China’s socialist industrialisation
2. Accomplish the task of socialist transformation, consolidate and expand
ownership by the collective and ownership by the whole people
3. Further develop industrial, agricultural and handicraft production and
appropriately develop transportation and commerce
4. Make great efforts to train qualified personnel for national construction
and upgrade scientific research work
5. Strengthen national defence and improve the people’s material and cultural
well-being.
The Great Leap Forward campaign (1958 –1959) started in 1958 but embraced if not
displaced the second five-year planning period and the results of the campaign were to

53
extend through to 1962. This campaign was a milestone where China departed from
strict adherence to the soviet model. Planning was decentralised and People’s
Communes were set up. It was during this period Mao Zedong called steel “the
Marshall of industry” and ordered steel production to be doubled within one year from
5.35 to 10.7 million tonnes (Chang 1991, p.293). Mao Zedong wanted to see China’s
economy overtake that of Great Britain and the USA within 15 years. Priority was
given to steel production over other industries and backyard furnaces were built all over
the country. Iron, steel fences and items were collected and melted in these primitive
furnaces. Steel was to be produced locally and consumed locally. A drive to produce
steel throughout the country had communes setting up backyard furnaces. Steel output
was to reach 10.5-12 million tonnes by 1962 (Dorian 1994, p.59). It is estimated that
600,000 furnaces were set up and 11 million tonnes of steel were produced (Great Leap
Forward 2003). Unfortunately, the quality of the iron produced in these furnaces was
poor with high sulphur content. This caused many problems with plant and machinery
made from it.
With the Great Leap Forward campaign, China’s overzealous plans did not enable
factors of production to be efficiently allocated. Raw material use was inefficient, with
no incentives, labour was not effectively utilised and capital was not properly managed.
This was to give rise to economic shocks, the waves of which extended beyond
industrial to agricultural production. During this turbulent period, steel production was
as shown in Table 3.2.

54
Table 3.2: Steel Production during the Great Leap Forward Period
Year 1958 1959 1960 1961 1962 Steel
Production ( tonnes)
8,000,000 13,865,000 18,671,000 8,703,000 6,672,000
Data source: China Steel Statistics 2000, p.1 (The State Administration of Metallurgical
Industry)
By the end of 1960, steel had increased to 18,671,000 tonnes. The 1950s was a period
when Russian engineers and technology developed China’s base industry of around 10
key steel plants (Metal Bulletin 1978, p.21). Ideological differences between Russia
and China had started to emerge and Russian engineers left the country in 1960. It was
becoming clear that the Great Leap Forward campaign was unsuccessful, technical
efficiency of steel production was low - the output was of low quality and the priority
given to steel production, had damaged the economy. From 1959 to 1961 inclusive was
known as “the three difficult years”. The people’s commune focus on iron production
had taken priority over agriculture and this combined with natural disasters, poor
agricultural planning, the departure of soviet support and economic dislocation caused
by the Great Leap Forward campaign gave rise to a serious famine which caused around
30 million people to die from starvation and related disease. Although higher figures
have been reported, this is the accepted estimate of the death toll (Chang 1991, p.309).
Mass production of steel had now ceased and output plummeted not recovering until
1969. Aware of the failure of the Great Leap Forward campaign, the Chinese
Government instigated a period of Recovery and Readjustment (1961-1965). During
this period, the guidelines that were formulated were economic recovery, adjustment,
consolidation, reinforcement or enrichment of weak links (Dorian 1994, p.62). It was

55
during this period that the 5.4 million tonnes per year Maanshan steel plant was
constructed and according to Metal Bulletin (1978, p.15) this was probably the most
significant construction project in China’s iron and steel industry during the Recovery
and Readjustment period.
In 1964, as a result of security concerns, China developed a “Third Front” defence
strategy – this was to put in place a third line of defence in the Western parts of China.
During this period, major industries were relocated from the coast to the interior and
major expenditure and resources were allocated to military equipment facilities to
ensure that important industries were protected. After many of the important coastal
factories were relocated, they lost their production capability. This “Third Front”
strategy and its subsequent attempts to industrialise China’s interiors were ineffective
and wasteful. In fact, it was a good example of violating the principles of comparative
advantage.
At least, the Recovery and Readjustment period could be credited with laying the
foundation for structural improvements in the national economy. By 1969, steel
production had started to recover (production output of 13.3 million tonnes compared
with the 1968 output of 9 million tonnes).
This period included the Third Five-Year Plan (1966-1970) and the Fourth Five-Year
Plan (1971-1975). The government continued to correct its mistakes by making
adjustments to the economy. Mao Zedong did not accept responsibility for this disaster
and left Deng Xiaoping and Liu Shaoqi to resolve the food shortage and rectify the
economy. He seemed to be more concerned with his own political survival when he

56
unleashed his Cultural Revolution programme on the nation. In relation to steel
industry development, this can be classed as the start of reform - a time to reflect on
past errors and rebuild. In 1965, the first Basic Oxygen furnace10 was built at the
Shoudu steelworks in Beijing. With no aid coming from Russia, China looked to the
west for technological improvements and in 1966 two-off 55 tonne basic oxygen
furnaces were purchased from Austria and installed at the Taiyuan plant (Metal Bulletin
1978, p.16, p.49).
Mao Zedong’s Cultural Revolution was indeed the next milestone period. This was
unleashed on the nation in 1966 and lasted for 10 years. In effect, it took precedence
over the Third and Fourth Five-Year plans as officials struggled to survive during the
many denunciations that were to take place. During this period, Mao Zedong’s
ideology and power were to take hold again. “Bu Po, Bu Li” (destroy then rebuild). He
set about destroying the “Four Olds” - outdated culture, ideas, customs and habits. As
Mao Zedong’s Red Guards emerged and bullied the population, this was a time of class
enemies, denunciation, terror and atrocity. This period effectively came to an end on 9
September, 1976 when Mao Zedong died. During the first half of the Cultural
Revolution, steel production did not increase significantly (between 1965 and 1970
production increased from 15,320,000 to 17,786,000 tonnes and then subsequently
increasing up to 23,903,000 tonnes in 1975).
By 1971, relations with the west were improving and in 1972, Richard Nixon, President
of the USA, visited China and the “seed was sown” for trade relations with the western
world to improve. Now China could start to access Western technology and took
10 Of capacity 150,000 tonnes per year.

57
advantage of this to upgrade steel mills. In 1974, over US$350 million of steel plant
was purchased from West Germany and Japan for the Wuhan plant. Additional
purchases were subsequently made (Metal Bulletin 1978, p.20). These were mainly
from German plants. During the Fourth Five-Year Plan, the Four Modernisations
(agriculture, industry, science and technology) and open-door concepts were developed.
Period 3 (1976-1985): Foundations of Reform
The Fifth Five-Year Plan (1976-1980) was part of a ten year plan extending to 1985 - in
effect covering what was to be the Sixth Five-Year Plan (1981-1985). This plan had the
steel industry as a key driver of the country’s economic development. The state
planned to build ten iron and steel complexes (Peking Review, 10 March 1978, cited in
Dorian 1994, p.70), but problems with capital funding caused this plan to fail. Between
1978 and 1981, Deng Xiaoping made adjustments to the plan and the foundation of
social and economic reforms were being laid. In 1978, Zhao Ziyang and Deng
Xiaoping formally introduced the Four Modernisations policy and Deng Xiaoping made
his famous statement: “To Get Rich is Glorious” and in 1979 opened the door to a
partial market economy that was eager to trade with the world. Trade and market
reform became a priority for the government. The mechanics of free market conditions
would encourage improvements in the factors of production. So up until this time, the
steel industry was mainly owned and controlled by the government. The Sixth Five-
Year Plan (1981-1985) saw a dramatic change towards trade with the west. The open
door policy was put in place. Foreign investment and joint ventures were encouraged.
With reforms taking place, private ownership of steel plants was encouraged and a
transformation from public to private ownership of steel production plants commenced.
Deng Xiaoping’s adjustments to the Fifth Five-Year Plan had seen steel output

58
increasing from 20.5 million tonnes in 1976 to 37.1 million tonnes in 1980. By the end
of the Sixth Five-Year Plan (1985) steel output had grown to 46.8 million tonnes. The
reforms of this period were to shape China’s steel industry into being a world leader
over the next 15 to 20 years, getting the industry into good shape for the next market
reform period when China would make application to join GATT in 1986.
Period 4 (1986-2003): Continued Social and Economic Reforms, WTO
Membership and Rapid Economic Development
During the Seventh Five-Year Plan (1986-1990) reforms continued and improved
control over the economy took place. In 1988, a three-year austerity programme
commenced to cool the economy and enable it to sustain its development. As can be
seen from Chart 3.1, economic development started to grow rapidly from 1,020 billion
yuan in 1986 to 1,854 billion yuan in 1990. During the same period, steel production
increased from 52.2 to 66.35 million tonnes.
Chart 3.1: China’s GDP (in current prices), 1952-2002
Data sources: China Statistics yearbook, 2001 and Asian Development Bank
0
1000
2000
3000
4000
5000
6000
7000
8000
9000
10000
1952
1954
1956
1958
1960
1962
1964
1966
1968
1970
1972
1974
1976
1978
1980
1982
1984
1986
1988
1990
1992
1994
1996
1998
2000
2002
Bill
ion
Yuan

59
In relation to the steel industry, the Seventh Five-Year Plan promoted substantial
renovation of existing plant to boost production capacity, efficiency (reduce energy
consumption) and improve quality control (Dorian 1994, p.78). The plan aimed to raise
crude steel production to 58 million tonnes for 1990 and 80 million tonnes for 2000.
This objective for the steel industry was not only achieved but also exceeded with 66.35
million tonnes of steel being produced in 1990 and 127.24 million tonnes in 2000.
During the Eighth Five-Year Plan (1991-1995) reforms continued (social and
economic). At the time of approving this plan, a ten-year programme (1991-2001) was
adopted, the aim of which was to map out the development for the final decade of the
century. During this planning period, China was to continue its transition to a full
socialist market economy. In relation to the steel industry, it targeted:
• Restructuring the industry with an emphasis on quality and reduction of energy
consumption to be achieved through importation advanced technology and
equipment (Business China 1992, p.45-46)
• Produce 59.5 million tonnes of rolled steel by 1995 (Dorian 1994, p.82)
• Raising crude steel production to 80 million tonnes by 2000 (this follows the
Seventh Five-Year Plan) and increase the flat rolled and tubular steel product
ratio from 37% to 45%. The flat rolled and tubular steel product ratio is a
measure of a country’s steel making structure - it is the ratio of flat rolled and
tubular steel product produced to total steel produced. Higher ratios indicate
higher level of technical equipment Increased investment in mining. Eight
major raw material mines would be developed (Business China 1992, p.46).
The Central Government stated that they would reduce the distribution of iron
ore to companies that own iron ore mines and do not develop them. Companies

60
having no mine ownership were ordered to seek venture partners. Focus is for
producers to develop raw material bases and strengthen the procurement of iron
ore in their own area (cited in Sugimoto 1993, p.284).
By 1995, China had produced a total of 81 million tonnes of rolled products and by
2000 had achieved 43% flat rolled and tubular steel product ratio, just falling short of its
45% target. This is an important achievement and improvement needs to continue.
This is important in view of the focus on construction and infrastructure development
(where sections and rail have been required in greater proportions than flats and tubes
which are used more in manufacture). As China reaches a level of development when
its infrastructure construction moderates then the industry will need to increase steel
products required for the manufacturing sector. The industry is lacking in such product
making capability. This important finding is discussed in more detail in Chapter 6.
Mine investment and partnering (domestically and internationally) significantly
increased during the plan period and have subsequently continued to do so. Recently, it
has become quite evident that more of this development is needed if China is to sustain
growth in steel production and demand for mined raw materials.
The Ninth Five-Year Plan (1996-2000) was part of the 10 year programme that also
included the Eighth Five-Year Plan. It incorporated 105 targets and continued reform
and liberalisation with a doubling of the GDP between 2000 and 2010. According to
the plan, inefficient state-owned enterprises (SOE) would be reformed and China’s
pillar industries would be enhanced (Young 1996). This occurred and continued after
the planning period.
The Tenth Five-Year Plan (2001-2005) lays out development priorities and makes
61
specific mention of 4 major projects that will consume large quantities of steel. These
are:
1. Construction of a Qinghai -Tibet railway that will consist of over 1,140 km of
rail line
2. A west-to-east power transmission project consisting of 6,680 km of power
transmission lines
3. A west-to-east natural gas transmission pipeline from Tarim in Xinjiang to
Shanghai - a total length of 4,200 km of heavy-duty pipeline
4. A south-to-north water diversion project to link the Yangtze and the Yellow
Rivers by two channels in east and middle China (China Metals 2003, p.17).
The plan gives an idea of the need for construction and manufacturing steels and as a
result is useful for estimating iron and steel demand. In relation to roads and railway:
• The total length of China's highways open to traffic will be 1.6 million km
• Upgrading of existing railway lines to bring the total length of China's railways
to 75,000 km (China Business Daily Update 2001).
Investment in railroad will amount to US$12.3 billion which includes 6,000 km of new
main line, 1,000 km of new local line construction, 3,000 km of track doubling of
existing lines, plus other project work like electrification. US$10 billion will be spent
on upgrading locomotives. China invests more in railroads than any other country in
the world, followed by Germany. Investment in associated railroad infrastructure is
reported to equal US$33 billion (Knutton 2002).

62
In relation to the machine tool industry:
• The industry is to maintain an average growth of around 10 %
• Current supply shortfall in relation to demand to be changed
• The industry is to provide most of the nation’s industrial needs
• Break restrictions on industries, regions and encourage mergers
• Establish a market environment that is beneficial to fair competition
• Draft unified technical standards, laws and regulations (Asia Pulse 2001).
The Tenth Five-Year Plan indicates continued demand for steel. According to the
president of China Iron and Steel Association Wu Xichun (2000, p.408), China needs to
improve transportation, loading and distribution of iron ore within the country. In the
Tenth Five-Year Plan, there are proposals to shift more steel production to the coast so
that iron ore imports are handled more efficiently. The country's four largest steel
makers - Shanghai-based Baoshan Iron and Steel, Wuhan Iron and Steel in Hubei
Province, Beijing-based Capital Iron and Steel and Anshan Iron and Steel in Liaoning
Province - have set their export targets during this planning period. Baoshan plans to
export 3 million tonnes a year by 2005 and the other three producers aim to each export
1.5 million tonnes a year by 2005.
Baotou Iron and Steel Group has outlined its goals for the Tenth and Eleventh Five-
Year Plans. With an expected outcome of 6 million tonnes by 2005, the company is
aiming to become one of the top 50 steel producers in China. The planned performance
targets are shown in Table 3.3.
63
Table 3.3: Baotou’s Planned Performance under the Tenth and Eleventh Five-Year Plans
Year 2003 2004 2005 2010
Output (million tonnes)
5.3 5.5 6 -
Sales revenue (billion yuan)
13 15 17 26
Data source: CEIS 0421 2003 art.031
The Tenth Five-Year Plan covers 13 industries including machinery, motor vehicles,
and metallurgy. It aims to restructure and upgrade the industrial sector, social and
economic development, increase equipment manufacture and develop the supply of the
nation’s raw materials (Xinhua 2001). It is unlike previous plans in that it focuses less
on targets and more on growth, the environment and sustainable development.
According to the Asian Development Bank, the plan “reflects the greater role of
markets in the economy” (cited in Young 2001). As the State invests in infrastructure
construction, domestic demand for steel products will continue to increase - especially
in the large, undeveloped western regions. An Iron and Steel Industry Association
(ISIA) report (CEIS 0714 2003, art.034) expects that China’s steel production will grow
to over 200 million tonnes in 2003. In addition to being a major producer, China is also
a major user of steel with consumption being at about 24% of the world’s total steel
output. The ISIA report also expects steel consumption to increase by over 12% during
2003.
Period 4 (1986-2003) was a very significant period where China made an application to
join GATT in 1986 and together with further market and trade reforms led to China
being accepted into the WTO on 11 December 2001, and then subsequently achieving
normalised trade relations with the USA on 1 January 2002. This was a period of rapid
64
growth in steel production along with economic development. China was to overtake
Japan in 1996 to become the world’s leading steel producer. Table 3.4 shows China’s
production through the four periods from 1949 to 2002. Production peaked at the time
of the Great Leap Forward campaign in 1960, followed by a large decrease in output,
which did not recover until 1969. China become the world’s largest steel producing
country in 1996 and has maintained this leadership position since that year.
Table 3.4: China’s Crude Steel Production Compared to World Production 1949-2002
Year
China
Production
(million tonnes)
World
Production
(million tonnes)
China’s
Ranking
China’s Share of
World Production
(%)
1949 0.158 160 - 0.10
1955 2.853 270 - 1.06
1960 18.671 346.4 - 5.39
1965 12.230 454 8 2.69
1978 31.780 717.2 5 4.43
1980 37.121 716 5 5.18
1985 46.794 718.8 4 6.51
1990 66.349 770.5 4 8.61
1994 92.613 725.1 3 12.77
1995 95.360 752.3 2 12.68
1996 101.237 750.0 1 13.50
1997 108.911 798.9 1 13.63
1998 114.458 777.2 1 14.73
1999 123.954 788.3 1 15.72
2000 127.236 847.6 1 15.01
2001 152.260 849.6 1 17.92
2002 181.552 897.0 1 20.24
Data sources: China Steel Statistics 2000, p.32 up to 1999 for rankings, from 2000 onwards,
International Iron & Steel Institute Publications

65
3.2 Profile of China’s top 10 steel producers
Table 3.5 presents a profile of China’s top ten steel producers (ranked on 2002 output).
This shows the location, product range and steel output for 1999, 2000, 2001 and 2002.
It is followed by Figure 3.1, which shows the location of each of the top 10 producers.
With the exception of the Baosteel Corporation, China’s top ten steel producing
companies are not considered large. In 2002, the top ten producers’ total of 76.8
million tonnes, represents 42.3 % of China’s total steel output (181.552 million tonnes).
The next 40 or so steel companies produce the remainder. In relation to the top 50 steel
companies, only 9 produce over 4 million tonnes, the majority of them being small with
output below 2 million tonnes per annum. According to the State Development and
Reform Commission (SDRC), more than 200 of the 280 steel companies in China were
small, each with an annual output of less than 100,000 tonnes (CEIS 0813 2003,
art.032). Many are high in pollution and low in energy efficiency. This shows that
industry concentration is low and gives an indication of the potential for continued
reform to improve technical efficiency and performance and suggests further scope for
mergers and closures of smaller plants as the larger producers take advantage of
economies of scale. The SDRC also reports that a large additional amount of steel-
making capacity is to come into production between 2003 and 2006. This continuing
increase in productive capacity is discussed in detail in relation to productive capacity
as an important finding.
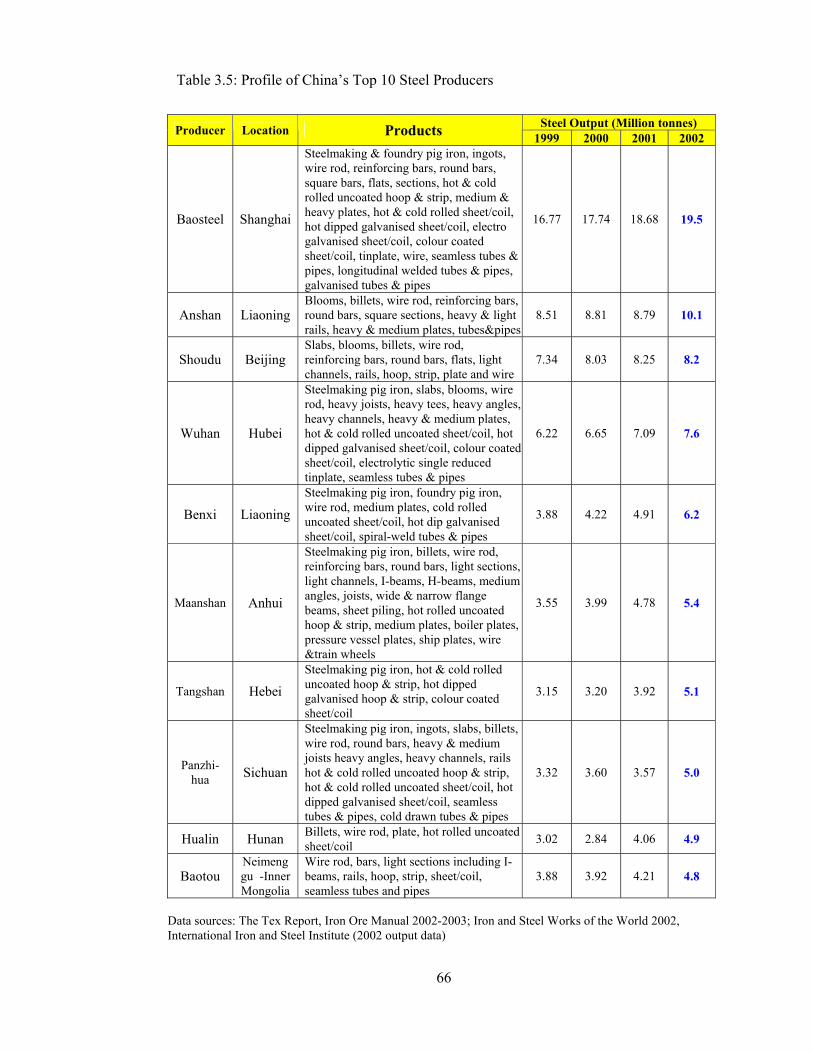
66
Table 3.5: Profile of China’s Top 10 Steel Producers
Steel Output (Million tonnes) Producer Location Products 1999 2000 2001 2002
Baosteel Shanghai
Steelmaking & foundry pig iron, ingots, wire rod, reinforcing bars, round bars, square bars, flats, sections, hot & cold rolled uncoated hoop & strip, medium & heavy plates, hot & cold rolled sheet/coil, hot dipped galvanised sheet/coil, electro galvanised sheet/coil, colour coated sheet/coil, tinplate, wire, seamless tubes & pipes, longitudinal welded tubes & pipes, galvanised tubes & pipes
16.77 17.74 18.68 19.5
Anshan Liaoning Blooms, billets, wire rod, reinforcing bars, round bars, square sections, heavy & light rails, heavy & medium plates, tubes&pipes
8.51 8.81 8.79 10.1
Shoudu Beijing Slabs, blooms, billets, wire rod, reinforcing bars, round bars, flats, light channels, rails, hoop, strip, plate and wire
7.34 8.03 8.25 8.2
Wuhan Hubei
Steelmaking pig iron, slabs, blooms, wire rod, heavy joists, heavy tees, heavy angles, heavy channels, heavy & medium plates, hot & cold rolled uncoated sheet/coil, hot dipped galvanised sheet/coil, colour coated sheet/coil, electrolytic single reduced tinplate, seamless tubes & pipes
6.22 6.65 7.09 7.6
Benxi Liaoning Steelmaking pig iron, foundry pig iron, wire rod, medium plates, cold rolled uncoated sheet/coil, hot dip galvanised sheet/coil, spiral-weld tubes & pipes
3.88 4.22 4.91 6.2
Maanshan Anhui
Steelmaking pig iron, billets, wire rod, reinforcing bars, round bars, light sections, light channels, I-beams, H-beams, medium angles, joists, wide & narrow flange beams, sheet piling, hot rolled uncoated hoop & strip, medium plates, boiler plates, pressure vessel plates, ship plates, wire &train wheels
3.55 3.99 4.78 5.4
Tangshan Hebei Steelmaking pig iron, hot & cold rolled uncoated hoop & strip, hot dipped galvanised hoop & strip, colour coated sheet/coil
3.15 3.20 3.92 5.1
Panzhi-hua Sichuan
Steelmaking pig iron, ingots, slabs, billets, wire rod, round bars, heavy & medium joists heavy angles, heavy channels, rails hot & cold rolled uncoated hoop & strip, hot & cold rolled uncoated sheet/coil, hot dipped galvanised sheet/coil, seamless tubes & pipes, cold drawn tubes & pipes
3.32 3.60 3.57 5.0
Hualin Hunan Billets, wire rod, plate, hot rolled uncoated sheet/coil 3.02 2.84 4.06 4.9
Baotou Neimenggu -Inner Mongolia
Wire rod, bars, light sections including I-beams, rails, hoop, strip, sheet/coil, seamless tubes and pipes
3.88 3.92 4.21 4.8
Data sources: The Tex Report, Iron Ore Manual 2002-2003; Iron and Steel Works of the World 2002, International Iron and Steel Institute (2002 output data)

67
Appendix 9.1.14 gives the relative rankings of global producers. Amongst them,
Baosteel ranks 5th and Anshan 18th, all others are well down the listing confirming again
the low concentration of medium to large steel producers. Shanghai’s Baosteel
Corporation can be seen to be China’s largest and most significant steel producer. In
2002, it produced 19.5 million tonnes of steel, followed by Anshan with 10.1 million
tonnes. Baosteel has the highest profit of all china’s steel producers. In 2002, it earned
more than 7 billion yuan in profit. Baosteel also has China’s most modern plant which
helps give the highest steel productivity figures for the nation. Baosteel is expected to
have an annual sales income of 120 billion yuan (US$14.5 billion) by 2005 (CEIS 0618
2003, art.028).
According to the China Iron and Steel Association (cited in CEIS 0414 2003, art.034),
major Chinese steelworks made a total profit of 24 billion yuan in 2002. This
represented an increase of 42.84 percent year-on-year, out of a sales revenue of 444
billion yuan, which was up 16.16 percent. Wuhan and Anshan earned more than one
billion yuan. Eleven other steel companies, Shangang, Xinxing Pipe, Tangshan, Hualin,
Shougang, Benxi, Shaoguan, Handan, Panzhihua, Jinan, Jinxi, had profit over 500
million yuan.
With the exception of Panzhihua, the concentration of the top ten producers is in the
eastern and northern provinces of China (see Figure 3.1).

68
Figure 3.1 Location of each of China’s top 10 steel producers.
As the regional consumption of steel increases, large gaps in supply capacity are
emerging. This encourages further developments in the steel industry. For example
based on 2002/2003, Guangdong Province consumed approximately 25 million tonnes
of steel, but its annual production capacity is only six million tonnes. As a result,
Guangdong Steel is examining the feasibility of developing one of the largest steel
plants in China. This project is known as the Linhai steel project (CEIS 0825 2003,
art.030).
3.3 Crude Steel Production by Steel Making Process
The blast furnace steel making process is the most commonly used process to produce
“raw” or pig iron and is considered the lowest operating cost method but involves high
Baosteel
Anshan
Shoudu
Wuhan
Benxi
Tangshan
Maanshan
Hualin
Baotou
Panzhihua
Baosteel
Anshan
Shoudu
Wuhan
Benxi
Tangshan
Maanshan
Hualin
Baotou
Panzhihua
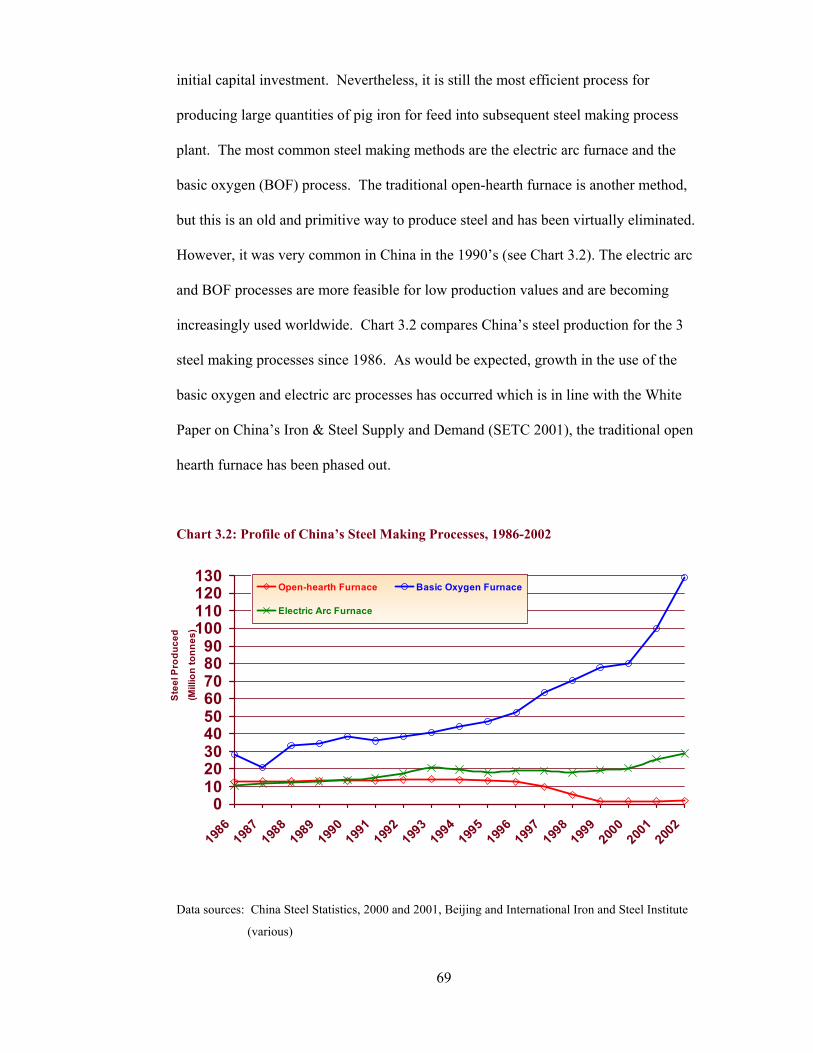
69
initial capital investment. Nevertheless, it is still the most efficient process for
producing large quantities of pig iron for feed into subsequent steel making process
plant. The most common steel making methods are the electric arc furnace and the
basic oxygen (BOF) process. The traditional open-hearth furnace is another method,
but this is an old and primitive way to produce steel and has been virtually eliminated.
However, it was very common in China in the 1990’s (see Chart 3.2). The electric arc
and BOF processes are more feasible for low production values and are becoming
increasingly used worldwide. Chart 3.2 compares China’s steel production for the 3
steel making processes since 1986. As would be expected, growth in the use of the
basic oxygen and electric arc processes has occurred which is in line with the White
Paper on China’s Iron & Steel Supply and Demand (SETC 2001), the traditional open
hearth furnace has been phased out.
Chart 3.2: Profile of China’s Steel Making Processes, 1986-2002
Data sources: China Steel Statistics, 2000 and 2001, Beijing and International Iron and Steel Institute
(various)
0102030405060708090
100110120130
1986
1987
1988
1989
1990
1991
1992
1993
1994
1995
1996
1997
1998
1999
2000
2001
2002
Ste
el P
rodu
ced
(Mill
ion
tonn
es)
Open-hearth Furnace Basic Oxygen Furnace
Electric Arc Furnace

70
3.4 Continuously Cast Steel Development
China’s improved process efficiency can be seen through its increased utilisation of
continuously cast steel processes. These have increased from 5% to 92.5% of total steel
production between 1980 and 2002 (see Chart 3.3).
Chart 3.3: China’s Continuously Cast Steel Development 1972-2002
Data sources: IISI (publications & www.worldsteel.org/wsif/wsif2002, August 2002) & State
Administration of Metallurgical Industry, Beijing, 2000
According to the State Continuous Casting Centre (cited in CEIS 0507 & 0814 2003,
arts.031 and 022 respectively) during 2002, 54 new continuous casters were
commissioned, increasing continuous casting capacity by 27.5 million tonnes and in
2003, 85 more continuous casters are scheduled to be commissioned bringing
continuous casting capacity to 238.38 million tonnes. Actual continuous cast billet
output is expected to exceed 200 million tonnes with the continuous casting ratio
0
20
40
60
80
100
120
140
160
180
200
1972
1973
197419
75197
619
7719
78197
919
8019
8119
8219
8319
8419
8519
86198
719
8819
8919
9019
91199
219
9319
94199
519
96199
719
9819
9920
0020
01200
2
Crud
e St
eel P
rodu
ced
(mill
ion
tonn
es)
Continuously Cast Steel Produced in China
Total Crude Steel Produced in China
92.5%
5%

71
exceeding 95 percent. This output consists of 170 tonnes from the 75 key steel
enterprises included in national statistics’ reporting together with the output of 30
million tonnes by nearly a 100 steel enterprises not covered by national statistics’
reporting (CEIS 0507 & CEIS 0814 2003).
3.5 Steel Production and Economic Growth
By the end of 2002, China had 1,588 large industrial enterprises with a total asset value
of 5,349.746 billion yuan and generated a total of 3,622.711 billion yuan in sales
revenue (CEIS 0826 2003, art.24). Table 3.6 shows the percentage sales revenue and
asset values for the major industrial sectors in 2002.
Table 3.6: Major Industry Sector Percentage Sales Revenue and Asset Values - 2002.
Industry Sector % Sales Revenue % Asset Value Petrochemical 24.9% 13.7 %
The iron and steel enterprises 16.4 % 20 %
Electronic 14.9 - Power and transport
equipment 11.5 12.6 %
Data source: National Bureau of Statistics of China cited in CEIS 0826 2003, art.24
The steel industry is a major industrial sector in revenue and asset value. The Chinese
steel industry has come a long way since 1949 (see Chart 3.4). Up to the late 1970s and
early 1980s, steel production occasionally fell below the preceding year. As a result of
political reform, production of steel started to rapidly grow in the early 80s and still
continues with each year’s production being higher than the preceding year. In 1996,
steel production in China exceeded that of Japan for the first time, making China the
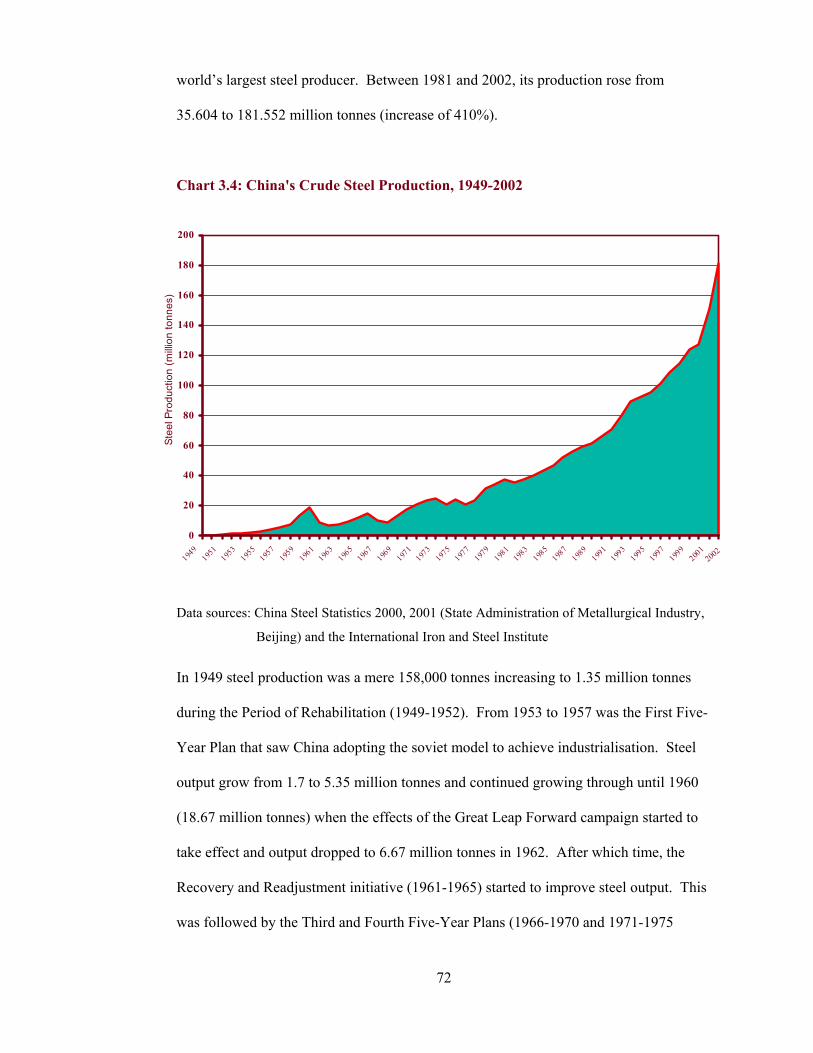
72
world’s largest steel producer. Between 1981 and 2002, its production rose from
35.604 to 181.552 million tonnes (increase of 410%).
Chart 3.4: China's Crude Steel Production, 1949-2002
Data sources: China Steel Statistics 2000, 2001 (State Administration of Metallurgical Industry,
Beijing) and the International Iron and Steel Institute
In 1949 steel production was a mere 158,000 tonnes increasing to 1.35 million tonnes
during the Period of Rehabilitation (1949-1952). From 1953 to 1957 was the First Five-
Year Plan that saw China adopting the soviet model to achieve industrialisation. Steel
output grow from 1.7 to 5.35 million tonnes and continued growing through until 1960
(18.67 million tonnes) when the effects of the Great Leap Forward campaign started to
take effect and output dropped to 6.67 million tonnes in 1962. After which time, the
Recovery and Readjustment initiative (1961-1965) started to improve steel output. This
was followed by the Third and Fourth Five-Year Plans (1966-1970 and 1971-1975
0
20
40
60
80
100
120
140
160
180
200
1949
1951
1953
1955
1957
1959
1961
1963
1965
1967
1969
1971
1973
1975
1977
1979
1981
1983
1985
1987
1989
1991
1993
1995
1997
1999
2001
Stee
l Pro
duct
ion
(milli
on to
nnes
)
2002

73
respectively) by which time steel production output had grown to 23.9 million tonnes.
The economic reforms that occurred during the Fifth and Sixth Five-Year planning
periods (1976-1980 and 1981-1985 respectively), accelerated steel output and this
continued to 182 million tonnes by the end of 2002.
Chart 3.5, shows the rate of growth each year from 1949 to 2002 and projects that an
average 6 million tonnes annual growth could be expected over the next decade or so
(notwithstanding the 20% annual growth between 2000 and 2002). This is supported
when one considers the state of China’s manufacturing and construction industry, which
has been growing rapidly and was specifically outlined in the Tenth Five-Year Plan.
Growth should continue in view of the planned investment in the nation’s infrastructure
(“4 big projects”). The potential here is articulated further in Chapter 5.5 discussing
China’s entry to the World Trade Organisation. One can get an idea of the country’s
demand potential when considering that by the end of 2001, developed countries like
Japan, USA and Germany had per capita consumption values of 600, 400 and 500
kilograms respectively. South Korea and Taiwan had values closer to 1,000 kg per
person. By 2002, China's steel sector cut staff numbers by 20 per cent, bringing the
number of employees directly engaged in steel-making down from over 1 million to
around 800,000. The industry's objective is to raise steel output per employee to 150
tonnes a year from around 140 kg (compared with a world average of 183 tonnes). The
top 69 steel makers produce 123 tonnes per employee, compared with less than 40
tonnes before 1996 (China Economic Review 2000). The factors behind steel demand
growth and demand are looked at in detail in Chapter 3.8.2 under Intensity of Demand.

74
Chart 3.5: China's Steel Production Growth Rate, 1949-2002
Data sources: China Steel Statistics 2000, 2001 (State Administration of Metallurgical Industry, Beijing)
and International Iron and Steel Institute
We have already examined the key stages in China’s history and how soviet planning
models were used to industrialise the country. The iron and steel industry was shown to
be an important aspect of most of the Five-Year Plans in the country’s economic
development. This research attempts to assess the extent to which the iron and steel
industry in China has contributed to the country’s economic development and growth.
So changes that have taken place in key economic indicators are examined while at the
same time considering connections and relationships to the iron and steel sector. This
also illustrates whether the industry will (and can) sustain its growth. To do this, the
following key economic indicators are examined in detail in the sections and chapters
that follow.
• Gross Domestic Product
• Agriculture and Industrial Production
-60
-40
-20
0
20
40
60
80
1952
1954
1956
1958
1960
1962
1964
1966
1968
1970
1972
1974
1976
1978
1980
1982
1984
1986
1988
1990
1992
1994
1996
1998
2000
2002
Rat
e of
Cha
nge
%

75
• Money Supply
• Energy consumption
• International trade
• Foreign Investment
• Exchange rate
• Debt levels
3.5.1 Gross Domestic Product
During the period from 1992 to 2002, China’s GDP increased from 2,664 to 10,240
billion yuan an increase of 7,576 billion yuan (2.84 times the 1992 value). The
remarkable change in China’s economic development is clearly seen in Charts 3.6 and
3.7. Chart 3.6 shows China’s GDP growth, in current prices, for 1952-2002.
Chart 3.6: China's GDP (Current prices, in yuan due to exchange rate variations) 1952-
2002
Data sources: China Statistics yearbook 2001 and Asian Development Bank
Note: The above Chart is Chart 3.1, reproduced for convenience.
0
1000
2000
3000
4000
5000
6000
7000
8000
9000
10000
1952
1954
1956
1958
1960
1962
1964
1966
1968
1970
1972
1974
1976
1978
1980
1982
1984
1986
1988
1990
1992
1994
1996
1998
2000
2002
Bill
ion
Yuan

76
Up to the early 1970s, no significant development occurred (see Chart 3.6). This
changed from the mid 1980s. Rapid growth started in the early 1980s, stalling only
moderately during the Asian economic crisis of the mid 1990s. This strong
performance still exists if the values are inflation adjusted, as shown on Chart 3.7 where
the GDP change from 1985 to 2002 is adjusted to 1985 pricing.
Chart 3.7: China's GDP (at 1985 pricing), 1985-2002
Data source: Asian Development Bank
Taking inflation and the changing time value of money into consideration, Chart 3.7
shows the periods where growth was actually negative. These were 1985-1986, 1988 to
1990 and 1993-1994. Positive growth occurred during the remaining periods.
According to China’s State Statistics Bureau deputy director-general, Qiu Xiaohua
(Tschang 2001), the country should maintain 7 per cent economic growth or better
during the next 10 to 15 years. With the ongoing social and economic reforms
0
50
100
150
200
250
300
350
400
1985
1986
1987
1988
1989
1990
1991
1992
1993
1994
1995
1996
1997
1998
1999
2000
2001
2002
GD
P (B
illio
n U
S$)

77
following Deng Xiaoping’s open door philosophy of the 1970s continuing along with
the country’s industrialisation and infrastructure development, national industrial and
agricultural production output are expected to increase. However, as demonstrated in
the next section, agricultural production is not growing and does not show signs of
growth potential. The large resource of low cost labour is giving Chinese companies a
competitive advantage, leading to global trade increases and improvements in people’s
income along with standard of living. This creates more consumption demand for
goods, houses and services. The increased output utilises Chinese resources and growth
is maintained. China’s Premier, Zhu Rongji (quoted in China Business Daily Update
2001) confirmed this trend when he forecast the economy would grow by seven percent
a year between 2001 and 2005 and would double in size from US$1.08 trillion in 2000.
During the 2002 National China’s Communist Party Congress, the goal of doubling
GDP by 2020, making China the third largest economic power in the world was set
(CEIS 0425 2003, art.036).
A major threat to continued growth in national output is the trend particularly with the
younger generation to develop a large appetite for western goods. If this trend
continues, it will see imports of such goods increasing at the expense of local labour and
economic growth will slow down. Later discussion on China’s domestic and
international debt obligations, indicate that China’s banks’ domestic non-performing
loans - bad debts - may be a significant factor that leads to a slowing down of China’s
GDP growth and economic performance. According to Hu (cited in Taipei Times 2002,
online), “continued delays in disposing of bad debts could cost China enough to retard
its growth rate by as much as 2 percentage points in the coming years”. These concerns
78
will be discussed further along with currency appreciation, which has the potential to
lower export competitiveness in Chapter 5.
3.5.2 Agriculture & Industrial Production
For many centuries, China’s main concern as a nation was feeding its population. So
agriculture became the foundation of its economy. Chart 3.8, illustrates that from the
early 1980s, China’s industrial production ability started to emerge with initial
development being slow as a result of structural changes that were taking place. In
1981, agricultural production was US$88.36 billion and industrial production was
US$117 billion. By the early 1990s, it was becoming evident that China’s economy
was developing strongly. In terms of value, industrial production continued increasing,
a little slower during the Asian economic slowdown, but still faster than agricultural
production. Agricultural production increased modestly to US$112 billion in 1994 then
had a 53% increase to US$171.6 billion in 1996 and has not changed much since
(US$179.8 billion in 2002). With improved economic development, increasing
population and international trade, the value of agricultural production should have
been much higher. In comparison, between 1999 and 2000, industrial production grew
from US$422.429 to US$478.049 billion (13.2%). Between 2000 and 2001, it grew
from US$478.049 to US$514.776 billion (7.68%) and between 2001 and 2002 it grew
from US$514.776 to US$554.951 billion (7.8%). According to the CRU Monitor Steel
(CRU 2002b, Chasing the dragon, p.3), the highest growth in 2001 and 2002 industrial
production came from the steel industry where production increased by 25%.11
11 International Iron and Steel Institute data shows that steel production (tonnes) increased by 20% between 2001 and 2002.

79
Chart 3.8: Agricultural & Industrial Production values, 1981-2002
Note: Industrial production values include mining, manufacturing and utilities
Data source: Asian Development Bank
Chart 3.9: Rate of Change of Chinese Agricultural and Industrial Production, 1982-2002
Note: Industrial production values include mining, manufacturing and utilities
Data source: Asian Development Bank
-5.00%
0.00%
5.00%
10.00%
15.00%
20.00%
25.00%
30.00%
35.00%
40.00%
1982
1983
1984
1985
1986
1987
1988
1989
1990
1991
1992
1993
1994
1995
1996
1997
1998
1999
2000
2001
2002
Perc
enta
ge
Agriculture
Industry
0
100
200
300
400
500
600
19811982
1983
1984
198519
861987
1988198
91990
199119
921993
1994199
51996
1997
19981999
2000200
12002
Bill
ion
US
$
Agricultural Production
Industrial Production

80
Chart 3.9, shows the annual rate of change for both agricultural and industrial
production. Since mid 1990s, agriculture production has trended lower. As a result of
the Asian economic crisis, the rate of change of industrial production reduced in the
1990s, with increases commencing in 1998 as the Asian economic crisis ended. The
poor performance of the agricultural sector compared to the industrial sector is further
demonstrated in Chart 3.10 which shows a breakdown of China’s GDP by the three
major sectors: industry, agriculture and public administration. The value of total
industrial value includes industrial production, construction, trade and transport. Since
1981, the value of agricultural production has increased by US$91 billion (103%), the
value of finance, public administration by US$217 billion (639%) and the value of the
country’s industrial activity has increased by US$650 billion (418%). Chart 3.11 shows
the same three major sectors in percentage terms.
Chart 3.10: Breakdown of China's GDP into the 3 Major Sectors, 1981-2002
Data Source: Asian Development Bank
$0
$200
$400
$600
$800
$1,000
$1,200
$1,400
billi
on U
S$
1981
1982
1983
1984
1985
1986
1987
1988
1989
1990
1991
1992
1993
1994
1995
1996
1997
1998
1999
2000
2001
2002
Value of finance , Public Administration & Others
Value of Total Industrial Activity
Value of Agriculture

81
Chart 3.11: Percentage Breakdown of China's GDP into the 3 Major Sectors, 1981-2002
Data source: Asian Development Bank
Industrial activity value and contribution to GDP are measured and reported in national
accounts. The iron and steel industry is a major part of these industry sectors and in
2002, their combined output value was US$806.3 billion. This represented 65.12% of
2002 GDP. In 1992 and 1982 industrial activity, as percentage of GDP, was 60.50 and
53.24% respectively, indicating significant increases in this industry sector. Comparing
to China’s traditional sector, agriculture, where the contribution for 2002, 1992 and
1982 was 14.53, 21.77 and 33.28% respectively, we see significant decreases. Chart
3.11 further demonstrates evidence of this lagging agricultural sector. It is important
that the downward trend since 1981 is halted. At a time of a booming industrial sector,
this lagging development in the agriculture sector should be a warning sign to the
central authorities. If not adequately addressed, it will give rise to major disparities in
incomes and living standards between rural and urban households which will further
adversely impact this important sector of the Chinese economy. This finding is
discussed further in Chapters 5 and 6.
0.00%
10.00%
20.00%
30.00%
40.00%
50.00%
60.00%
70.00%
1981 1983 1985 1987 1989 1991 1993 1995 1997 1999 2001
% G
DP
Agriculture as % of GDP
Industrial activity as % of GDP
Finance, Pub admin others as % ofGDP
2002

82
Another important indicator in the domestic economy that has an impact on consumer
demand is money supply. This is examined in section 3.5.3. Other important economic
factors (exchange rate, debt levels, foreign investment, international trade and energy
consumption) are examined in later sections and chapters.
3.5.3 Money Supply
The amount of money available to consumers (and how it is used) has an important
impact on the national economy and the type of goods consumed which in turn impact
the demand for resources. As long as money supply increases in a stable manner,
people generally enjoy improved standards of living. This is evident in increased
purchases of houses, automobiles, washing machines and other goods. In relation to
this research topic, this means money supply relates to steel consumption demand. The
impact on national output will depend on the extent this increased money supply is used
for day-to-day purchases; investment or consuming luxury-imported goods. In the
medium to longer term, it will have a significant effect on economic development.
The supply of money comes in many forms: workers’ wages, sale of goods and loans
from banks. Money can also be stored in various types of bank accounts or as cash in
people’s possession (personally or in safes at offices and homes). Money supply values
are important measurements in National Account statistics and are generally classified
as M0, M1 and M2. M0 refers to cash in circulation; M1 refers to narrow money
supply and includes M0 and demand deposits (current accounts). M2 refers to broad
money supply and includes business deposits, quasi-money (fixed and savings deposits),
personal savings, and cash in circulation. The accumulation of foreign exchange

83
reserves and bank lending, are the main factors that encourage money supply growth.
Chart 3.12, shows broad and narrow money supply since 1981.
Chart 3.12: China's Money Supply, 1981-2002
Data source: Asian Development Bank (various year reports)
In relation to material demand, positive rates of growth of money supply increase
consumption and put upward pressure on material demand. When growth rates exceed
15%, this can introduce inflationary pressures, which adversely impact the national
economy. Lower rates of money supply reduce consumption and can lead to
deflationary pressures. It is important for economic policy to get the balance correct.
Chart 3.13 shows the rates of money supply growth, 1982-2002. In 2002, rates of
growth of 20% were experienced. These large growth rates are continuing in 2003,
according to Kyne (2003, p.A3), M2 money supply growth increased 22% in August
2003 to US$2,540 billion. This was the eighth consecutive month in 2003 that M2
money supply has risen above the central bank’s target of 18% growth value.
0
500
1,000
1,500
2,000
2,500
1981
1982
1983
1984
1985
1986
1987
1988
1989
1990
1991
1992
1993
1994
1995
1996
1997
1998
1999
2000
2001
2002
Billion
US$
Narrow, M1
Broad, M2

84
Chart 3.13: Rate of Growth of China's Money Supply, 1981-2002
Data source: Asian Development Bank These high levels of money supply are supporting the construction and consumer booms
in China, but will cause upward pressure on domestic prices and encourage inflation. It
is not possible for an economy to sustain such a growth. Either limits on lending funds
or increasing interest rates will be necessary. Both of these measures will reduce
money supply growth and in turn put downward pressure on construction and
consumption activity. Kyne reports (cites Jun Ma, senior economist at Deutsche Bank)
that money supply increasing 21 – 22% monthly could generate 4 to 5% inflation in 12
to 18 months. This would put further pressure on an already heated economy and also
increase the risk of social instability due to aggravating the current disparities in rural
and household incomes. These are important findings.
From September 2003, the Central Bank raised the reserve requirements from 6 to 7%
for financial institutions to reduce the rapid lending of funds. The opposite approach
-20
-10
0
10
20
30
40
50
1982 1983 1984 1985 1986 1987 1988 1989 1990 1991 1992 1993 1994 1995 1996 1997 1998 1999 2000 2001 2002
Rate
of
Grow
th (%)
Rate of Narrow, M1growth (%)
Rate of Broad, M2growth (%)

85
was taken during the Asian Economic Crisis when reserve ratio requirements were
lowered from 13% to 5% to stimulate consumption (McGregor 2003, p1). Increasing
the reserve ratio is expected to remove about US$18 billion of cash out of circulation
(Wong 2003). This should ease inflationary pressures and inhibit domestic
consumption. Reducing domestic consumption will decrease the demand for steel
products which would help correct the supply demand imbalance that is estimated to be
costing China US$5 billion more for its iron ore raw materials alone (see Chapter 6). It
will also enable the country to focus on essential infrastructure construction which will
take pressure off steel companies to expand production capacity which if not managed
properly will lead to excess capacity after the current construction demand boom ends.
3.6 Productivity and Economic Efficiency
In the earlier years of the development of China’s steel industry, efficiency was very
low. However steel produced using the continuous casting process has increased - this
process has been shown to be the most efficient steel making process. China’s ratio of
continuous casting to total crude steel production has increased from 5% in the mid
1970s to just 92.5% in 2002; compared to the former world’s leading steel producing
country, Japan, where the improvement in continuous casting ratio was from 30% in the
70s to 97% in 2002 (refer to tables of steel production in Appendices 9.1.1 and 9.1.2).
Japan is still leading and this indicates that only modest improvements can be expected
in China’s continuous casting tonnages in the years ahead. However, if we examine the
breakdown of China’s steel production over time, we get a better understanding of how
this relates to economic growth (see Appendix 9.1.1, where the table shows the
breakdown in the types of steel products being produced).

86
As flat rolled and tubular steel sections require a different and higher level of
technology than other steel products, a good measure of technology improvement is to
look at the ratio of flat rolled and tubular steel produced to total steel production. The
steel making plant for production of long products is significantly less capital intensive
than that required for flat products. Traditionally, this ratio was used as an indicator of a
country’s steel industry structure (Sugimoto 1993). China’s ratio of flat rolled and
tubular steel produced to total steel production increased from a low 20% in 1974 to
40% in 2000 (see Appendix 9.1.1). Such low values (particularly in the earlier years)
were due to limitations with the country’s steel making plant. Improvements occur as
plant equipment and technology improve. Compared for example to Japan, which has a
constant value of around 49%, in terms of technical efficiency China has significant
potential for improvement. Chart 3.14 shows that China has consistently produced just
over double the long products (rail and sections – columns, channels) to flat products
(plates and strip). This resulted from the domestic focus being on infrastructure
construction (railroad, structures and buildings). As China’s steel industry increases its
capacity, it is essential this gap between the two processes is closed. This will better
position the industry to satisfy the value adding manufacturing industry rather than the
less value adding domestic construction industry. Otherwise the need to increase
imports of such flat products will continue. China is still a net importer of steel
products as is shown in Table 3.7. This issue is discussed further in Chapter 6.

87
Chart 3.14: Comparison of China’s Rolled and Flat Product Production, 1972-2002
Data sources: IISI and China Steel Statistics
Table 3.7: China’s Import and Export of Semi and Finished Steel Products (million
tonnes)
1992 1993 1994 1995 1996 1997 1998 1999 2000 2001 2002
Impor
t
8.089 36.87 25.81 14.81 16.54 13.62 13.11 17.0 20.71 25.64 29.22
Export 4.04 1.41 2.56 10.75 7.13 8.91 5.86 5.98 11.16 7.49 6.84
Data sources: International Iron and Steel Institute, Steel Statistical Yearbook 2002, p79, p.82
and China Metals, January 2003, p.19
Table 3.7 suggests that China has significant export potential when investment in flat
products increases. This will occur as China’s shipbuilding and motor vehicle
industries continue their development. After China reaches the stage of economic
development when steel demand for long products required for infrastructure
construction starts to slow down or stop, demand for flat products will be the driver that
will be needed to maintain China’s steel industry and enable it to continue being a key
driver of economic development. This does have to be carefully managed – particularly
0
20,000
40,000
60,000
80,000
100,000
120,000
1972
1974
1976
1978
1980
1982
1984
1986
1988
1990
1992
1994
1996
1998
2000
2002
Thou
sand
tonn
es
Rolled Long Products
Rolled Flat Products

88
while other poorer economies are developing their iron and steel industries. The issue
is also considered later in relation to intensity of demand and stages of a country’s
economic development, when it will be even more important with China being a
member of the WTO.
China’s steel production has increased, but its productivity is still considered low in
relation to other developed steel producing countries. Chart 3.15, compares the five
leading countries’ steel output per employee. China’s average of 100 tonnes per
employee12 does not reflect the nature of employment in China where many people are
generally employed and most would receive very little salary. Nevertheless, with the
upgrading of steel plants with more efficient equipment that are much less labour
intensive, the need for large labour resources diminishes. So reduction of these
numbers is a priority for both the government and the steel industry sector. Faced with
the situation of increasing unemployment, this process is a little slower than one would
expect from developed countries.
Chart 3.15: Comparison of the World's Top Five Steel Countries Productivity (total
tonne/employees within that country's industry), 1990-2002
12 This value is an industry sector average. China’s leading steel producer, Baosteel’s productivity is closer to 600 tonne per employee.
0
100
200
300
400
500
600
700
800
900
1990 1995 1996 1997 1998 1999 2000 2001 2002
Prod
uctio
n(T
onne
s / E
mpl
oyee
)
PR China USA Japan Germany Korea

89
Data sources: IISI, China Steel Statistics 2000, 2001 (State Administration of Metallurgical Industry,
Beijing), 2000, p32 & 2001
3.6.1 Iron Ore Production – Principal Input Factor After going through the transition of becoming a world leader in the production of steel,
China’s demand for quality iron ore expected to continue to increase. According to the
Classification Standards of Solid Mineral Resource Reserves (Metal Bulletin 2002),
China’s iron ore reserves at the end of 1998 were 12.5 billion tonnes ranking fourth in
the world and the probable reserves were 22.3 billion tonnes. The CEIS (CEIS 0904
2003, art.033) reported in 2003 that the country has approximately 46 billion tonnes of
proven iron ore deposits and recoverable reserves of around 25 billion tonnes.
Unfortunately, these reserves have high levels of contamination and low iron content
(less than 35%). This means that China will continue to have an acute shortage of
quality iron ore and its economic development will become more and more exposed to
dependence on the international trade of iron ore. As China’s global trade position
diversifies and increases, its economic wealth will become inextricably linked to its
ability to obtain a low cost, secure supply of iron ore through international trade. Not
only does China need to understand the “new global economy” but also those wishing
do trade with China need to understand how China fits within a more liberalised world
economy. Zhou (cited in James 2002, p.55) articulates that the biggest barrier to
understanding China is realising that the country’s transformation is not about
conventional trade; it is about China’s active engagement in globalisation.
China’s iron ore production output increased from 75 million tonnes in the early 1980s,
before starting to increase in 1985 to 80 million tonnes. Output continued to increase to

90
a maximum of 268.6 million tonnes in 1997 after which time it reduced as it became
clear that due to the low iron content of China’s ore, it was more cost effective to import
it. Chart 3.16 shows China’s iron ore output from 1948 through to 2002 and Table 3.8,
shows China’s relative position in the world for iron ore production.
Chart 3.16: China's Iron Ore Production, 1948-2002
Data sources: American Iron Ore Association, International Iron and Steel Institute (various
publications, & www.worldsteel.org/wsif/wsif2002, August 2002), 2001 on - China Customs
Table 3.8, China’s Relative Position in the World for Iron Ore Production, 1990-2002
1990 1997 2000 2001 2002
Total World Production
(million tonnes) 983 1,063 1,051 1,052 1,097
China production
(million tonnes) 168.29 268.62 223.95 217.05 231.43
Percentage 17.1% 25.3% 21.3% 20.6% 21.1%
Data sources: China Steel Statistics 2000, 2001 (State Administration of Metallurgical
Industry), China Customs Bureaux, 2002 World data – AME Mineral Economics January 2003
0
50
100
150
200
250
300
1948
1950
1952
1954
1956
1958
1960
1962
1964
1966
1968
1970
1972
1974
1976
1978
1980
1982
1984
1986
1988
1990
1992
1994
1996
1998
2000
2002
Iron
Ore
Pro
duct
ion
(Mill
ion
tonn
es

91
China’s maximum production of iron ore was in 1997 at 268.62 million tonnes and
decreased since then, with the exception of a slight increase in 2002. This is due to the
global iron ore industry being capacity constrained. This means it is not able to
immediately produce more iron ore as market demand dictates. It can take several years
before large capital-intensive iron ore producers can increase output. These producers
react to market demand by looking at the longer-term demand characteristic and invest
in capital to enable supply output to match demand. With improvements in the
industry, iron ore price per tonne produced should become lower. Together with
international competition, steel producing countries have been seeing lower cost iron
ore being available, but this is changing due to China’s demand. China’s preference is
clearly to import while it is more cost effective to do so. In 2002 and the first half of
2003, demand from China has been difficult to satisfy. This is the reason that it has had
to increase its own domestic output. China’s demand has in fact been excessive due to
its industrialisation programme. This excessive demand results from poor planning and
is driving iron ore and sea freight prices higher.
3.6.2 Energy Consumption - Input Factor 3
China’s population increased from 982.1 million to 1,284.5 million between 1980 and
2002 and as can be expected, energy consumption has also increased. The following
charts will show that increases in energy consumption are more than just directly related
to population growth. The development of China’s economy in relation to energy
required for industry can be seen from the changing patterns of energy consumption.
The steel industry sector is a large consumer of energy, but so are many of the industry
sectors that also consume steel in their products. Table 3.9, shows the steel industry’s
energy consumption in relation to the rest of the country from 1998 through 2000.

92
Table 3.9: Energy Consumption and Steel Manufacture, 1998-2000
1998 Oil
(million tonnes)Gas
(billion M3) Coal
(million tonnes) Electricity
(billion KWh)Whole *1 country 173 20 1,295 1,160 Steelmaking*2 3.167 0.426 36.680 82.800 Percentage 1.83% 2.13% 2.83% 7.14%
Data sources: *1 - Asia Development Bank- Key Indicators – PRC 2001, P.124 *2 - China Steel Statistics 2000, State Administration of Metallurgical Industry pp.66-68 1999 Oil
(million tonnes) Gas
(billion M3) Coal
(million tonnes) Electricity
(billion KWh) Whole *1 country 207*2 25 1,264 1,231 Steelmaking*3 2.643 0.439 39.574 85.570 Percentage 1.28% 1.76% 3.13% 6.95%
Data source: *1 - Asia Development Bank- Key Indicators – PRC 2002, P.126-127 *2 – BP’s Statistical Review, June 2003 *3 - China Steel Statistics 2000, State Administration of Metallurgical Industry pp.66-68 2000 Oil
(million tonne) Gas
(billion M3) Coal
(million tonne) Electricity
(billion KWh) Whole *1 country 230.1*2 27 1,000 1,356 Steelmaking*3 1.790 na 36.130 69.510 Percentage 0.78% na 3.61% 5.13%
Data sources: *1 - Asia Development Bank- Key Indicators – PRC 2002, p.126-127 *2 - BP’s Statistical Review, June 2003 *3 - China Steel Statistics 2001, State Administration of Metallurgical Industry pp.84-87 Table 3.9 shows that the steel industry by 2000 had not made the change away from
coal as a major fuel source. This is a change that will take place as the Central
Government aims to improve environmental conditions – particularly with the Beijing
Olympics event in 2008.

93
The industry’s base energy supply is coal of which China has adequate reserves.
Together with low labour costs, the country has the potential to remain the world leader
in crude steel production for many years. Japan used the coal industry to rebuild its
economy, then made the shift to imported oil and has shown that even with no energy
resources, with careful management of this important input, a country can still make
outstanding economic progress. Unlike Japan, China has had abundant energy
resources (in the form of coal) to support its economic growth. However as a country
develops, it pays more attention to the wellbeing of both its people and the environment.
As China’s energy appetite grew to fuel its GDP growth, pollution became a serious
problem which could not be permitted to continue becoming worse every year. This
caused shifts in consumption of coal to more use of oil in the first instance then gas as it
became more available on international markets.
Chart 3.17 illustrates China’s daily coal consumption since 1980. It shows coal
consumption increasing from 649 to 1,447 million tonnes per day (or 123%) from 1982
to 1996 - during a period when other Western countries were trying to reduce
consumption at the same time as their energy requirements were increasing. Chart 3.17
shows China’s direct coal consumption in million tonnes and also its international oil
equivalent in tonnes. This allows comparisons with other countries. One tonne of oil
equivalent equals approximately 1.5 tonne of coal (BP 2003). It can be seen that China
has a long way to go before it reaches the low coal consumption values of Japan, which
built its industry on coal then shifted to oil and then gas. Environmental issues will
push China to replace coal with cleaner fuels. This will reduce the competitive
advantage the country enjoys from its use of coal as an energy source.

94
Chart 3.17: Annual Coal Consumption for Selected Countries, 1980-2002
Data sources: Oil Equivalents - BP Australia Energy Review & China direct Coal - Asian Development Bank
Since 1996, China’s government has made great efforts to reduce pollution and lower
use of coal. Its major power stations still use coal, but improvements in plant are being
made to reduce pollutants. China is gradually replacing coal with oil and gas.
Consumption of these is shown in Charts 3.18 and 3.19. The charts show that China’s
oil consumption has been increasing significantly since the early 1990s to overtake
Japan’s consumption of 242.6 million tonnes in 2002 by 3.1 million tonnes. Since
making the shift from coal to oil, Japan has been reducing oil consumption and moving
to the use of gas. Chart 3.19 shows the increasing use of gas by Japan since 1980.
China is lagging this pattern, but is slowly moving in the same direction. Use of less
coal and more oil and gas has made China become heavily reliant on energy imports –
similar to Japan. This is causing the Chinese government concern, as it now needs to
ensure long term secure supply of these resources.
0
200
400
600
800
1000
1200
1400
1600
1980 1981 1982 1983 1984 1985 1986 1987 1988 1989 1990 1991 1992 1993 1994 1995 1996 1997 1998 1999 2000 2001 2002
Coa
l C
onsu
mpt
ion
(mill
ion
tonn
es)
China's direct coal Consumption China Coal (Oil equiv)
Japan Coal (Oil equiv) Australian (Oil Equiv)

95
Chart 3.18: Annual Crude Oil Consumption for Selected Countries, 1980-2002
Data sources: BP Australia Energy Review, 2001, 2002 and 2003
Chart 3.19: Natural Gas Consumption for Selected Countries, 1980-2002
Data sources: BP Australia Energy Review, 2001, 2002 and 2003
These energy resources are subject to international volatility. The price volatility will
not make it easy for China’s export industries that need to consume such commodities
in the future. How China manages this transition from coal to oil to gas will have an
0
50
100
150
200
250
300
1980 1981 1982 1983 1984 1985 1986 1987 1988 1989 1990 1991 1992 1993 1994 1995 1996 1997 1998 1999 2000 2001 2002
Oil
Con
sum
ptio
n (m
illion
tonn
es).
China Japan
Singapore South Korea
Taiwan Australia
0
10
20
30
40
50
60
70
80
90
1980 1981 1982 1983 1984 1985 1986 1987 1988 1989 1990 1991 1992 1993 1994 1995 1996 1997 1998 1999 2000 2001 2002
China Japan Singapore
South Korea Australia
Natural Gas Consumption
(billion cubic metres per day)

96
important bearing on the continued development on both the country’s comparative
advantage in manufacturing and its economy.
China’s population increased from 982.1 million to 1,284.5 million between 1980 and
2002 (30.8% increase) and during the same period its electricity consumption increased
from 382 billion KWh to 1,654 billion KWh (333% increase), and the country overtook
the consumption of the former leading steel nation, Japan, in 1995. This change in
electricity consumption is shown in Chart 3.20.
Chart 3.20: Electricity Consumption, China 1982-2002 and Japan 1990-2002
Data sources: BP Australia Energy Review 2001, 2002 and Asian Development Bank
The increases in energy consumption are more than just population growth and
demonstrate increases in productive capacity and industrialisation. It seems China has
become the “new Japan” in that its economic growth appears to be following that of
Japan. Such increases in China’s energy demand which are being driven by industrial
0
200
400
600
800
1000
1200
1400
1600
1800
1982
1983
1984
1985
1986
1987
1988
1989
1990
1991
1992
1993
1994
1995
1996
1997
1998
1999
2000
2001
2002
Ele
ctric
ity C
onsu
mpt
ion
(billi
on K
Wh)
China Japan

97
growth are becoming a factor that looks like it could inhibit further economic growth as
energy demand outstrips supply in high consumption regions (Kynge & Harney 2003).
As a result, increased investment in liquefied natural gas plants are occurring and it is
possible that undesirable nuclear power plants may become an alternative energy source
for a developed China. According to Harney (2003) tenders for a 6,000 MW nuclear
plant have already been called. The US$8 billion plant will operate next to
Guangdong’s liquefied natural gas terminals. This energy demand supply imbalance
results from excessive industrial demand that is discussed in Chapter 6. This issue
relates to the need for better demand planning to ensure supply and demand balance for
iron ore and sea freight is achieved. Otherwise high costs associated with such
excessive demand will incur excessive costs which will impact the longer term viability
of not only the country’s iron and steel industry, but industry in general.
3.7 Trade development - Steel and Iron Ore
In relation to trade development, Table 3.10 shows for the period between 1950 and
2000 that in proportion to national imports steel imports have decreased from 8.75% to
5.55% and exports have increased from 1.27% to 1.49 %. These minor percentage
changes in import and export values show that notwithstanding the general view that
China’s steel demand has caused increased imports, when examined in perspective to
overall imports, it has actually decreased. With exports showing a slight increase to
1.49%, both results support the growing self-sufficiency of China in satisfying the
country’s demand for steel as industrialisation and infrastructure development
continues. The large growth in steel production over the same period suggests that
domestic consumption driven by infrastructure development is responsible for using up

98
the country’s steel output. It is important to understand that much of this demand
consumption is value adding in that it is used for the nation’s infrastructure and has
been satisfied with domestic production and at same time decreasing steel imports in
proportion to national imports.
One can expect when the country’s domestic demand for steel decreases, China has the
potential to become a significant exporter of the steel products that it has the capacity to
produce. However, this needs careful planning and management. This is an important
finding.
Table 3.10: China Steel Industry – Trade Development, 1950 – 2000
1950 2000
National Total *1
(106 US$)
Iron and Steel
Products *1
(106US$)
% National Total *2
(106 US$)
Iron and Steel
Products *2
(106 US$)
%
Import 583 51 8.75% 225,096 12,490 5.55%
Export 552 7 1.27% 249,212 3,711 1.49% Data sources: *1 - China Steel Statistics 2000, Planning & Developing Department, The State
Administration of Metallurgical Industry pp.119-120.
*2 – China Steel Statistics 2001, China Iron and Steel Association, China Metallurgical
Information and Standardisation Institute p.126.
As China’s development continues, consumer demand for higher quality stainless steel
is expected to increase. This growth pattern is evident when we look at apparent
consumption values since 2000, see table 3.11.

99
Table 3.11: China’s Stainless Steel Apparent Consumption Values, since 2000
Year Apparent
Consumption (million tonnes)
% increase
2000 1.7 - 2001 2.39 30% 2002 3.2 40%
Data Source: CEIS 0826 2003, art.023
By 2007, China’s apparent consumption of stainless steel is expected to exceed five
million tonnes. This is comparable to the total consumption of Europe (CEIS 0826
2003, art.023). Such high demand consumption is being met mainly by imports. Keen
to increase market share, stainless steel producers are increasing production capacity. In
2002, state-owned stainless steel companies produced 583,400 tonnes of stainless steel.
This represents an increase of 12.5% on 2001 production. China’s largest stainless steel
producer, Taiyuan Steel whose production capacity is 1 million tonne, produced
374,300 tonnes an increase of 16.5% on 2001 and plans to increase its stainless steel
capacity to two million tonnes within the next 3-4 years. It is estimated that private
companies now have a combined stainless steel capacity of around 700,000 tonnes
(CEIS 0407 2003, art.049 & CEIS 0404 2003 art.040). Details of other stainless steel
production capacity expansions are:
1. Shanghai No. 1 Steel Plant’s 750,000 tonnes stainless steel capacity at a cost of 11
billion yuan
2. Ningbo Baoxin Stainless Steel Company upgraded to 600,000 tonnes –completion
of its third-phase renovation at the end of 2003
3. Shanghai Tissen Krupp Stainless Steel Company’s No. 2 and No. 3 Cold Rolled
stainless steel production lines will go into operation at the end of 2004, the No. 4

100
production line will go into operation the end of 2005, resulting in stainless steel
capacity of 390,000 tonnes
4. Pohang and Qingdao Iron and Steel construction of a 150,000 tonnes cold rolled
stainless steel production line
5. Jiangsu Yicheng Special Steel Company is constructing a stainless steel medium
plate plant. Completion scheduled at end of 2003 (CEIS 0708 2003, art.041).
With the mismatch in supply and demand, China’s stainless steel manufacturers are now
attempting to increase capacity to capture the loss of market share to overseas
companies. This will take a long time and is a good example of poor demand planning.
It is however, positive that capacity to make higher quality steels is improving. This is
an area that will continue to increase long after the construction boom is over. It
nonetheless must be carefully timed and managed.
3.8 China’s Iron Ore Demand
To understand China’s demand for iron ore, one needs to consider the nature of the
demand for steel. Up to and after the People’s Republic of China was founded in 1949,
iron ore imports were negligible. It was not until after the Cultural Revolution when the
government’s central planning policies towards economic development were
introduced, that its appetite for steel and in turn iron ore increased. China has abundant
reserves of iron ore, but the iron content is low between 30 and 35% and many of the
iron ore mines are located inland, far away from the large efficient steel ports usually
located close to seaports. In addition, the Chinese government’s liberalisation reform
and restructuring of inefficient industries has led to the closure of the distant, smaller
and less efficient iron ore mines. Hence, in the absence of capital intensive,

101
downstream processing capability (HBI or pelleting type process plants), China’s
appetite for steel will lead to the need for increasing imports. Chart 3.21 illustrates the
increase of China’s demand for imported iron ore since 1975.
Chart 3.21: China’s Iron Ore Imports, 1975-2002
Data sources: Tex Reports – 1987 through 2000 and China Customs Bureau – 2001 and 2002
China deregulated iron ore pricing on 1 May 1993. From that time, domestic iron ore
prices have increased to similar levels as the higher quality imported ore. This made it
more cost effective for purchasing imported ore. China’s decreased domestic
production was discussed earlier, but its relationship to increased imports is shown in
Chart 3.22. The percentage of imports increased from 14.9% in 1994 to 48.2% in 2002.
This trend suggests increasing imports of iron ore and decreasing national production.
In view of the emergence of direct reduced iron process plants which enable lower
quality iron ore to be processed (beneficiated), the nature of this demand may change
over the next decade as China is likely to apply this type of process to utilise its own
lower iron content reserves of iron ore. It will also depend on whether the country can
secure low cost iron ore supplies in the future. This is an important finding. According
0
20
40
60
80
100
120
1975
1976
1977
1978
1979
1980
1981
1982
1983
1984
1985
1986
1987
1988
1989
1990
1991
1992
1993
1994
1995
1996
1997
1998
1999
2000
2001
2002
Tota
l Im
ports
(Mill
ion
Tonn
e)

102
to CEIS (0915 2003, art.027), China’s iron ore imports are likely to reach 170-180
million tonnes by 2005. This will represent over 30 percent of the world’s total
shipping volume of iron ore.
Chart 3.22: China's Total Iron Ore Demand, 1994-2002
Data sources: Up to 2000 - China Steel Statistics 2000, 2001 (State Administration of Metallurgical
Industry, Beijing). From 2001 – China Customs Bureau
The relationship between iron ore demand (import, domestic) and total steel production
is presented in Chart 3.23. This chart shows total steel production, the total iron ore
demand and the imported iron ore demand. It is interesting to note the improvement in
iron ore to steel ratio between 1995 and 2002 was from 3.18 to 1.87 tonnes of iron ore
to one tonne of steel produced. This shows the value associated with higher iron
content imported ores versus lower iron content domestic grades. Of course during this
period, plant efficiency improved, but plant efficiencies lower unit cost, produce better
0
50
100
150
200
250
300
350
mill
ion
tonn
es
1994 1995 1996 1997 1998 1999 2000 2001 2002
National production Imported Ore

103
quality of steel and do not reduce the iron ore per tonne of steel ratio by a significant
amount.13
Chart 3.23: China's Iron Ore Demand and Steel Production, 1995-2002
Data sources: China Steel Statistics 2000, 2001 (State Administration of Metallurgical Industry, Beijing)
and China Customs Department
The dwindling reserves of iron ore are of concern for China's national security,
notwithstanding Lu’s estimate (cited in Wu 1998) of China having around 760 sites
containing a total of 472 billion tonnes of iron ore deposits, most of which are not
economically recoverable (estimated that 46 billion tonnes are proven). Pu Haiqing,
Director of the State Administration of Metallurgical Industry (cited in China Metal
Markets Iron & Steel Monthly, 14 November 2000, p.14) has called on Chinese steel
makers to launch iron ore bases abroad to fill the gap in domestic demand. The country
now has less than 18 billion tonnes of exploitable iron ore reserves. Pu Haiqing
estimated the reserves could satisfy domestic demand for only 40 years. Liu Jinghai,
13 This is in relation to developments since 1995.
0
50
100
150
200
250
300
350
400
1995 1996 1997 1998 1999 2000 2001 2002
Mill
ion
Tonn
es
Total Iron Ore Demand Total Steel Production Imported Iron Ore

104
Deputy Director of the China Metallurgical Economic Development and Research
Centre, (cited in China Metal Market Iron & Steel Monthly, 14 November 2000, p.14)
advises that in addition to the direct launch of foreign bases, Chinese steel makers may
buy foreign iron ores through long-term trade agreements with resource-rich nations.
Average transport cost for imported iron ores of the Wuhan Iron and Steel Corp in
Central China's Hubei Province is 100 yuan (US$12) per tonne higher than that of
Baoshan steel (cited in China Metal Markets Iron & Steel Monthly, 14 November 2000,
p.14). This is a significant amount being around 30% of the cost per tonne of iron ore
and considering it excludes sea freight, which would be common to both Baoshan and
Wuhan, will become a major problem for those producers not closer to seaports. Not
having to rely on imports would considerably improve their supply (price) risk
exposure. According to the World Mineral Resource Strategy Research Centre, which
comes under the Chinese Academy of Geological Sciences (cited in CEIS 2003 0127,
art.038), it is important for China to find its own new mineral deposits as increasing
reliance on imported minerals will become a threat to national security. The research
centre reports that traditionally drilling depths of most Chinese mines are only about
500 metres, whereas in developed countries it is between 700 and 1,000 metres. The
centre claims that “lack of funds for in-depth geological surveys is also a major factor
behind China’s lack of mineral resources”, and that, “of China’s more than 200,000
locations with mining potential, only 20 percent have undergone evaluation”. In order
to reduce reliability on international markets for sourcing of strategic minerals and
improve the country’s probability of sustaining its strong economic development,
elevating the status of the domestic mineral resource sector with more domestic

105
exploration and improved beneficiation are important for China’s future development
and industrialisation. This is an important finding.
According to the China Iron and Steel Association (CEIS 0411 2003, art.037), China’s
iron ore production increased in 2002, with an output of 232 million tonnes. This is six
percent higher than 2001. The government’s lowering of the resource compensation tax
on steelworks’ iron ore mines from 15 yuan/tonne to 5 yuan/tonne, on 1 April 2002,
took their resource compensation tax to the same level as for independent iron ore
mining companies whose resource compensation tax had already been lowered to 5
yuan/tonne in 1995. According to Zhou Jian, Chairman of China Metallurgical Mines
Association: “Management in mining companies has improved, which led to continuous
reduction of mining costs, down by an average three percent in 2002. In addition,
technical advances continued and this has lifted the grade of iron ore fine concentrates
by one percentage point and increased comprehensive usage of resources” (CEIS 0411
2003, art.037).
3.8.1 Elasticity of Demand for Steel and Iron Ore Elasticity of demand with respect to price is a measure of responsiveness of the quantity
demanded of a good to a change in its price (McTaggart, Findlay & Parkin 1995). The
higher the value the more elastic it is said to be and this means it is more responsive to
changes in what it is being quoted in relation with (with respect to term). Goods with
high elasticity of demand with respect to price means that more of the good will be
demanded as price decreases and less demanded if the price increases. A good with an
elasticity of demand less than 1 is said to be inelastic and changes in price will not have
a significant effect on demand. Modelling by Labson, Gooday & Manson (1995, pp.23-

106
34) predicts consumption patterns and lists elasticities of steel demand with respect to
price and industrial production for several countries, see Table 3.12.
Table 3.12: Elasticities of Demand for Steel for Various Countries
Country Elasticity Elasticity
(Price) (Industrial production)
Australia -0.05 2.33
Brazil -0.33 3.65
China -0.28 0.38
Japan -0.04 2.12
Data source: Labson, Gooday & Manson (1995, p.40)
Table 3.12 shows positive and negative values for elasticity. By convention, we
consider only the absolute value. The negative value indicates the drop in quantity
demanded when price increases. From Table 3.12, the steel demand with respect to
price is inelastic in all the countries. So, price changes of just steel will not have a
significant impact on the quantity of steel demanded. On the other hand, the elasticity
of steel demand with respect to industrial production is significantly more substantial in
Australia, Brazil and Japan, but still very low in China. This anomaly may be due to the
demand for steel being more aligned to infrastructure construction rather than industrial
production. However, as China moves along the development cycle and has less focus
in infrastructure and more on manufacturing, this inelastic demand is expected to
change in line with normal market economics, such that as industrial production
increases, higher demand for steel will result.

107
3.8.2 Intensity of Demand To assess demand for iron ore and steel it is useful to examine the trends in
consumption in terms of GDP per capita. Chart 3.24 shows China’s GDP per capita and
iron ore imports since 1981. GDP per capita in yuan has been used in preference to
USD due to exchange rate variation occurring when the yuan was pegged to the dollar
in 199414. Both indicators show similar increasing trends and there is no doubt that we
are seeing large increases in iron ore demand as GDP per capita increases.
Chart 3.24: China’s Iron Ore Imports and GDP per Capita (Current Prices),
1981-2002
Data sources: China Steel Statistics 2000, 2001 (State Administration of Metallurgical Industry), China
Customs Bureau & Asia Development Bank
However, China’s iron ore demand (both import and domestic) depends on steel
consumption. The best way to examine the changing demand nature for steel is to
consider the intensity of steel use.
14 At this time the rate devalued from 5.76 yuan in 1993 to 8.62 yuan to the USD in 1994.
0
20
40
60
80
100
120
1981 1982 1983 1984 1985 1986 1987 1988 1989 1990 1991 1992 1993 1994 1995 1996 1997 1998 1999 2000 2001 2002
Iron
Ore
Impo
rt (M
T)
0
1000
2000
3000
4000
5000
6000
7000
8000
9000
GD
P p
er C
apita
(Yua
n)
China Iron Ore ImportChina's GDP per Capita

108
Traditional economic thinking suggests that steel demand increases with increased
income. Malenbaum (1975 and 1978, cited in Tilton 1992, p.51) proposed the
“intensity of material use” theory. The intensity of use of a material is the ratio of its
consumption to GDP per capita (thousand tonnes per yuan). Malenbaum suggests that
as a country emerges from early economic development, demand for steel increases
(increasing intensity of use), then as it reaches development, there is less demand for
steel (less infrastructure construction and less demand for goods since most people have
already acquired such goods) – we then see an inverted u curve, where a peak is reached
then demand drops off, see Figure 3.2.
Figure 3.2: Intensity of Steel Use in Relation to Economic Development
Applying this principle to China’s steel consumption, the result is shown in Chart 3.25.
This shows the intensity of consumption based on China’s steel production only with
the intensity of steel consumption increasing during China’s early economic
development then after early 1980s starting to decrease – supporting Malenbaum’s
concept outlined above.
Intensity of material use
Level of economic development per capita

109
Chart 3.25: China’s Intensity of Use of Steel, 1952-2002
Data sources: China Statistical Yearbook, Asian Development Bank & International Iron and Steel
Institute
In relation to increasing GDP the increase in China’s steel consumption is not as large
as one would have expected. This doesn’t suggest that Chinese with higher incomes are
not buying cars and items containing steel, but more likely technology has decreased the
amount of steel in the traditional goods being consumed and that steel used in
construction is being better designed so as to use less tonnage. In contrast, according to
Campbell (1999), of several metals he reviewed between 1985 and 1997, only China’s
aluminium intensity of use showed any significant increase. Investment in the steel
sector has been underpinned not only by demand consumption, but also as a result of
the government’s efforts to develop infrastructure. According to the China Economic
Information Service (CEIS 0725 2003, art.38), the government has issued bonds worth
660 billion yuan to boost long-term construction. This has both increased steel
consumption and also investment in the industry.
0
20
40
60
80
100
120
1952
1954
1956
1958
1960
1962
1964
1966
1968
1970
1972
1974
1976
1978
1980
1982
1984
1986
1988
1990
1992
1994
1996
1998
2000
2002
stee
l dem
and
(thou
sand
tonn
es/Y
uan)

110
In 2002, China’s demand for steel was 211 million tonnes and was greater than
domestic production capacity. With global steel production during 2002 being 897
million tonnes, China’s demand represents 23.5% of the world’s steel consumption.
So China has become the world’s second largest steel importer (after the USA). The
former State Economic and Trade Commission forecasts that in 2003 domestic demand
could reach 215 million tonnes (CEIS 0725 2003, art.38). China generally had been a
net importer of small quantities of steel, but in 2002, this increased to 29 million tonnes
with most of these imports coming from Japan, the Republic of Korea, Russia,
Kazakhstan, and Taiwan. During the first 10 months of 2003, China’s steel imports
reached 31.05 million tonnes and by the end of 2003 should reach 36 million tonnes
(CEIS 1118 2003, art.34). This will make China the world’s leading steel importer.
A major driver for demand for steel and iron ore is growth in per capita income.
Income growth leads to increased consumption of steel goods such as: automobiles,
infrastructure (railroads, bridges and ports), building homes, shipbuilding, domestic
goods etc. Therefore, all else equal, growth in iron ore and steel demand should occur
in line with GDP growth as is shown in Chart 3.24. The increase in per capita income is
fuelling an increase in home construction and automobile purchases. The China
Association of Special Steel Enterprises (CEIS 1113 2003, art.034) reports that
construction of residential buildings is growing at an annual rate of over 20% and in
2002 there were 5 billion square metres of residential houses in urban area in China,
averaging 15 square metres per person. With per capita living area in developed
countries being around 35 square metres, this indicates there is still significant potential
for demand growth.

111
Increased consumer demand for automobiles will increase steel demand. There is
around 800 kg in the average passenger vehicle and automobile demand in China is
expected to rise to 3.75 million vehicles per year by 2010 (Hogan 1999). This research
found this estimate to be low (refer to the next section). In addition, increased
shipbuilding capability is expected to raise demand for steel plate to over 1.5 million
tonnes (Hogan 1999). This together, with the government’s plans for increased
infrastructure development should underpin increases in steel demand and productive
capacity through to the end of 2009.
In relation to the growth in national output, China’s intensity of steel use during the past
24 years is similar to a developed economy in that it is on the decline. This would
suggest that in proportion to other drivers of its economic development, the steel
industry appears to be taking on less significance in China’s overall economic
development.
3.8.3 Automobile Production and Steel Demand
China is very attractive for multinational companies because of its cheap labour, for
example, total automobile production has increased by around 50% between 1999 and
2002 (Matthews 2002) to 1.2 million vehicles and will continue to increase with foreign
carmakers relocating offshore to take advantage of China’s lower labour costs and
reforms. According to Du Fangci, Deputy Secretary General of the China Association
of Auto Manufacturers, China's output of motor vehicles is forecast to top 3.90-4.00
million in 2003 as the automotive industry is entering a period of growth, with private
purchases dominating the market. The industry is expected to continue a long and

112
steady period of growth (CEIS 0509 2003, art.006). Wei Jianguo, Vice-Minister of
Foreign Trade and Economic Cooperation, reinforced this when he said that China’s
demand for motor vehicles is expected to top 4.6 million units by 2005. Wei outlined
that China has become the 5th largest producer of motor vehicles in the world and
described China's present auto market as the potentially the biggest in the world (CEIS
0414 2003, art.003). Since China's entry into the WTO in 2001, considerable growth
has occurred in the automotive industry. Between 1990 and 2002, China’s output has
increased as shown in Table 3.13 (Refer to Appendix 9.4.8 and 9.4.9 for a list of car
sales and makes and regional outputs for 2002).
Table 3.13: China’s Output of Motor Vehicles, 1990-2002
Year Output (Unit: Million)
1990 0.51
1992 1.06
1994 1.35
1996 1.46
1998 1.63
2000 2.07
2002 (Jan-Oct), 2.63 Data source: China Association of Automobile Manufacturers cited in CEIS 1129 2002, art.002.
If we further examine what this increased demand for vehicles means for steel, Li
Jianshe, manager of the market department of the Maanshan Iron and Steel Co. Ltd,
forecasts for 2005 that 5.65 million tonnes of steel will be needed. This includes 3.45
million tonnes of medium plates. Extending this to 2010, the steel consumption could
reach 7.27 million tonnes, including 4.52 million tonnes of medium plates (CEIS 0319
2003, art.006). This demand increase is further supported by Chen Hong, Vice-
President of Shanghai Automotive Industry Corporation Group and General Manager of
113
the Shanghai General Motors Corporation Limited, who reports that 150 million
families in China, involving a population of 500 million, are expected to buy
automobiles in the next 10 to 15 years, with this having the potential to make China the
leading car market in the world. The Shanghai Automotive Industry Corporation Group
hopes to achieve its objective of “selling up to one million cars with no less than 50,000
national brand names by 2007, ranking itself in the list of the Fortune 500” (CEIS 0313
2003, art.004).
3.8.4 Shipbuilding and Steel Demand
China’s demand for heavy and medium flat steel plate for shipbuilding is increasing
along with that industry’s growth. The China Economic Information Service (CEIS
0514 2003, art.009) clearly outlines the increasing role being played by China in the
international shipbuilding market:
China is aiming to become the world's No.1 shipbuilder and for the eighth
consecutive year in 2003, China ranked 3rd in terms of dead weight tonnage (dwt)
of the global international shipbuilding market, behind Japan and the Republic of
Korea. China entered the international market around 1979 and when the open
door trade reform started in the early 1980s held 17th position. At this stage,
China’s share of the international shipping market was between 400,000 tonnes
and 500,000 tonnes annually with only 1% of the international market. In 2002,
China manufactured ships with a combined tonnage of 4.61 million tonnes15
making up 9.7 percent of the world's ship production. Over 70% of the ships that
15 This refers to the deadweight, ie the weight of the ship plus its total load.

114
are built in China are exported worldwide. The value of ship exports for 2003 is
expected to be around US$2 billion.
To capture the larger vessel market, the industry is also improving its shipbuilding
technology. According to Gu Baolong (CEIS 0609 2003, art.017), Board Chairman of
the Hudong-Zhonghua Shipbuilding (Group) Co. Ltd16, the company has made
technological progress so that they could build large-capacity container ships with
8,100 twenty-foot equivalent units (TEUs). This is an increase from its largest ship put
into service in May 2003, of capacity 5,688 TEUs, built for the China Shipping Group
Corporation.
The China Shipbuilding Industry Corporation (CSIC) is one of China's top two
shipbuilding giants and is China’s biggest shipbuilding company for military and
civilian vessels. Li Changyin (CEIS 0117 2003 art.015), President of The China
Shipbuilding Industry Corporation (CSIC) says that his company built 69 vessels in
2002 of total value 11.8 billion yuan (1.42 billion US dollars). China’s other largest
shipbuilder, the China State Shipbuilding Corporation (CSSC), is boosting its
competitive position by consolidating its domestic branches into five major shipbuilding
bases, as reported by Chen Xiaojin, president of the CSSC. The five major bases are the
Jiangnan Shipyard Group, Hudong Shipbuilding Group, Waigaoqiao Shipyard in
Shanghai, Guangzhou Shipbuilding Company and a combination of shipyards in
Shanghai and Jiangyin. The company plans to import more technology skills and
administrative concepts to maintain China's shipbuilding industry at the leading edge of
the international shipbuilding market (CEIS 1127 2002, art.012).

115
The President of CSIC, Li Changyin (CEIS 0120 2003, art.046) reports that by 2010,
about 45 million tonnes of vessels will be needed annually in the global shipbuilding
market, and the annual vessel order from domestic shipping companies from 2001 to
2005 will top two million tonnes. This implies an annual growth rate between 8 and
10%. The Corporation plans to increase its annual vessel output to eight million tonnes
by 2020 in order to meet the surge of market demand.
According to the director of planning at China's State Administration for the
Metallurgical Industry, Li Shijun (September 2000), China’s rapid growth in apparent
consumption of steel during the 1980s and 1990s should slow down as demand shifts to
the use of higher quality products. He forecast apparent consumption is going to be
around 140 million tonnes in 2005.
With the government underpinning investment in construction, increase in per capita
incomes leading to higher consumption domestic goods including automobiles and
increase in shipbuilding there is no doubt demand for steel and in turn iron ore will
continue to increase.
3.9 Iron Ore Supply Characteristics
The supply of iron ore to China is characterised by fierce international competition,
market and capacity constraints. Capacity constraints make it difficult for iron ore
producers to respond to sudden demand and associated price increases. It will take iron
ore producers several years to upgrade plant and port facilities with a view to increasing
supply. The resource input is not regulated and in fact, the Chinese government
16 One of China’s major shipbuilders.
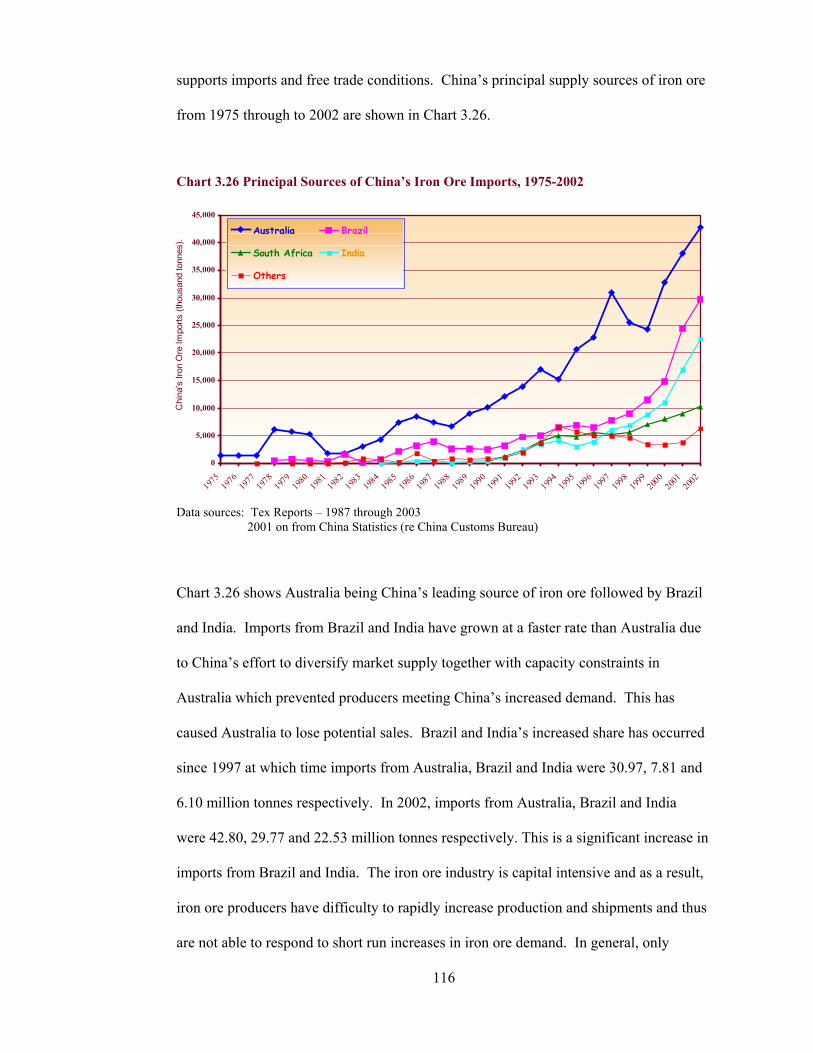
116
supports imports and free trade conditions. China’s principal supply sources of iron ore
from 1975 through to 2002 are shown in Chart 3.26.
Chart 3.26 Principal Sources of China’s Iron Ore Imports, 1975-2002
Data sources: Tex Reports – 1987 through 2003
2001 on from China Statistics (re China Customs Bureau)
Chart 3.26 shows Australia being China’s leading source of iron ore followed by Brazil
and India. Imports from Brazil and India have grown at a faster rate than Australia due
to China’s effort to diversify market supply together with capacity constraints in
Australia which prevented producers meeting China’s increased demand. This has
caused Australia to lose potential sales. Brazil and India’s increased share has occurred
since 1997 at which time imports from Australia, Brazil and India were 30.97, 7.81 and
6.10 million tonnes respectively. In 2002, imports from Australia, Brazil and India
were 42.80, 29.77 and 22.53 million tonnes respectively. This is a significant increase in
imports from Brazil and India. The iron ore industry is capital intensive and as a result,
iron ore producers have difficulty to rapidly increase production and shipments and thus
are not able to respond to short run increases in iron ore demand. In general, only
0
5,000
10,000
15,000
20,000
25,000
30,000
35,000
40,000
45,000
1975
1976
1977
1978
1979
1980
1981
1982
1983
1984
1985
1986
1987
1988
1989
1990
1991
1992
1993
1994
1995
1996
1997
1998
1999
2000
2001
2002
Chi
na's
Iron
Ore
Impo
rts (t
hous
and
tonn
es).
Australia Brazil
South Africa India
Others
117
limited stockpiling is carried out (mainly to the extent of insuring against short term
ship loading interruptions). In the international arena, Brazil and India are the main
competitors to Australia and this is shown in relation to tonnages to China. The
company CVRD is Brazil’s major supplier and the world’s largest supplier. Brazil also
has the highest quality of iron ore up to 2 percent higher than Australia. Its largest
producer, CVRD, is keen to position itself to be a dominant player in all global markets.
Brazil dominates the European markets and Australia dominates the Asian markets. To
capture more Chinese market share for iron ore, Brazil is developing several joint
ventures with China. Australia’s proximity to Asian and in particular, Chinese markets,
give it a shipping advantage: around 6,000 km from Australia versus around 20,000 km
from Brazil. Shipping/transport costs represent the most significant cost in supplying
iron ore. The main threat to Australia’s shipping advantage lies in China’s development
of larger and deeper ports, which are capable of handling larger ships. This will lower
unit-shipping costs and together with their better quality ores provide Brazil and India
with valuable opportunities to threaten Australia’s large share of China’s iron ore
market. This is discussed in more detail later.
3.9.1 Iron Ore Supply Elasticity Elasticity is a measure of the responsiveness of quantity supplied to a change in price.
The short run elasticity relates to quantity supplied when only some adjustments to
input factors have been made; whereas, long run elasticity relates to how quantity
supplied responds when all possible input (technological) factors have been adjusted.
Table 3.14 shows estimates of iron ore supply elasticities for several countries up to
2000 (Labson, Gooday & Manson 1995, p.45). When the supply elasticity is small
price changes do not have a significant impact on quantity supplied. In the longer term,
after all technology changes have been done, quality improvements (higher unit iron

118
contents) lead to moderately higher elasticity values, but still inelastic. This is not
surprising given that there are few substitutes for iron ore; at least while steel is the
preferred construction material.
Table 3.14: Iron Ore Supply Elasticities – short and long run
Country Short run long run
Australia 0.30 0.43
Brazil 0.26 0.66
China 0.13 0.85
India 0.10 0.72
Table 3.14 shows that in the longer run, supply to China will be slightly more elastic
which should still provide encouragement to iron ore suppliers that prices will improve.
During 2003, this has occurred with China being more concerned with actual supply
than on the price of that supply. This has caused a shift to supplying the Chinese
market rather than other markets. The effect of this is increased global pricing, iron ore
suppliers being keen to increase production, although capacity constraint has been the
major barrier. The biggest threat to Australia’s iron ore trade with China is that as
technological improvements combined with a more sustainable demand level make
China’s supply less inelastic, then sales to that country will be affected, putting pressure
on supply price levels. This is what the Chinese authorities should be planning and
working towards. It does not seem that this planning is occurring. This is an important
finding.
To understand supply curve characteristics, one should consider the type of market iron
ore producers operate in. Tilton (1992, p.53) distinguishes between two metal markets:

119
“producer markets and competitive markets”. Producer markets are where producers
have more opportunity to dictate price levels. Competitive markets are where the
market sets the price and the producers follow that price. Iron ore traditionally operated
in a producer market, however, with the introduction of Indian producers and
improvements to Brazilian producers, competitive markets have emerged. Even
although they are able to affect supply to some extent, Australian producers have
become price takers. High entry costs create effective barriers for the iron ore industry.
This creates opportunities for current large players to dominate the market place and
“tilt the playing field” so that producer markets re-emerge. Mergers and buyouts in the
iron ore industry suggest this process is in place. Bigger players are becoming larger;
the smaller producers are becoming fewer. This trend will have serious consequences
for China’s future sourcing ability. China needs to be aware of this and should be
making appropriate contingencies such as long-term overseas deals and equity in
producer operations. These dynamics will shape future iron ore sourcing negotiations.
This is an important finding.
The long term outlook for China’s iron and steel industry which continues to increase
capacity and output is securing reliable sources of low cost iron ore raw materials. It
has been shown that Australia has played an important role in supplying China’s iron
ore needs. With Australia being close to China geographically, iron ore imports from
that country should continue to be the most cost effective for China. How Australia’s
role in supplying China evolves will be very important for both China and Australia.

120
4 Australia’s Role Supplying China’s Steel Industry
4.1 Australia’s Role in Supporting China’s Economic Development
Australia with its abundant resources of high grade iron ore and being closer to China
than its competitors has been well positioned to play an important role in the
development of China’s iron and steel industry. Imports of iron ore to China from
Australia have increased from 1.4 million tonnes in 1975 to 42.8 million tonnes in 2002
and at all times during this period, Australia has been China’s leading supply source.
This has resulted in a symbiotic relationship such that both countries’ economies are
inextricably linked. Therefore, how this trade has and will develop is important for both
countries. This Chapter examines the role that Australia has played in its trade with
China and how this will develop. It looks at trade development between each country
and shows that China has become Australia’s 3rd leading trading country after Japan and
the USA. With this background, trade in iron ore is examined in detail concluding with
the outlook for the future of trade in this commodity with China.
4.1.1 Trade between China and Australia
Notwithstanding Australia’s large and growing exports of iron ore to China, Australia
has been running a trade deficit with China since 1989 when it was US$19 million.
Since that time, the deficit has steadily increased to US$2.46 billion in 2002. Whether
this deficit will shrink at some stage in the future will depend significantly on the value
of mineral resources that Australia can export to China and on its import value of
manufactured goods decreasing. This will depend on the extent of increased trade with
China at the cost of other Australian trading partners.

121
Chart 4.1: China's Trade with Australia, 1981-2002 (At exchange rate A$1 =USD 0.55)
Data sources: Department of Foreign Affairs and Trade (DFAT) 2001, 2002 and 2003
Chart 4.1 shows China’s trade with Australia between 1981 and 2002. Up to 1988,
Australia had a trade surplus with China. This changed to a deficit of US$19 million
during 1989 and thereafter the deficit has both continued and increased. In relation to
this research, it is necessary to examine the significance of iron ore trade. Chart 4.2
shows Australia’s top six export commodities to China since 1996.
Chart 4.2: Australia’s top 6 Export Commodities to China, 1996-2002 (At exchange rate A$1 = USD 0.55) Data sources: DFAT 2001, 2002 and 2003
0
1,000
2,000
3,000
4,000
5,000
6,000
7,000
8,000
1982
1983
1984
1985
1986
1987
1988
1989
1990
1991
1992
1993
1994
1995
1996
1997
1998
1999
2000
2001
2002
Mill
ion
US
$
Import from Australia
Export to Australia
0
100
200
300
400
500
600
700
800
900
1996 1997 1998 1999 2000 2001 2002
Mill
ion
US$
Wool Iron OreCrude Petroleum CoalCopper Ores Aluminium

122
Traded iron ore to China has been a significant commodity for Australia. After
alternating leadership between 1996 and 2000, trade in iron ore overtook wool as the
leading commodity in 2001. Crude oil exports, the 3rd largest export commodity
moderately decreased during 2000 then improved in 2001. It is expected that as
China’s demand for energy increases while the country tries to reduce consumption of
domestic coal, its petroleum and gas demand will continue to increase. This should
provide Australia with an opportunity to increase its export of energy products to China.
Chart 4.2 shows that Australian exports are made up of resource commodities that
enable China as an industrial nation to add value to them. This is evident through the
use of the end product for construction materials, to improve infrastructure and
industrial productivity or with wool, which is used in the clothing industry and is a
major export business for the country. In comparison if we examine what Australia
buys in return for its commodities we see from Chart 4.3 that the imported goods are
mainly for personal consumption, with the exception of computers, goods which do not
add much value.
Chart 4.3 Australia’s top 5 Import Commodities from China, 1996-2002 (At exchange rate A$1 = USD 0.55)
0
100
200
300
400
500
600
1996 1997 1998 1999 2000 2001 2002
Mill
ion
US$
Clothing of textile fabrics Toys, games & sporting goodsFootwear ComputersWomen's/Girls' clothing

123
Data sources: DFAT 2000, 2001 and 2002
China’s exports to Australia are made up of value added manufactured goods. How
long China will maintain its competitive export position will depend on how long it
takes other developing economies to catch up. China’s current low cost of factor inputs
together with a perceived undervalued exchange rate should give it an advantage for
many years to come.
Salomon Smith Barney (cited in Balfour 2002) estimates that between 2002 and 2005,
the sales of goods from Asia to China could increase by between 55 and 85% - this
representing US$70 billion additional trade. Australia should be aiming for a
proportion of this trade. A breakdown of Australia – China’s trade for 2002 is shown
in Appendix 9.14.4.
In 2002, China was Australia's third largest trading partner after Japan and USA with
total bilateral trade being US$11.67 billion17 (see Table 4.1). According to the deputy
chairman of the China-Australia Chamber of Commerce (cited in CEIS 0818 2003,
art.16), “Economic cooperation between China and Australia is exciting,". The China
Economic Information Service (CEIS) reports that bilateral trade for the first half of
2003 was US$6.05 billion. This represented an increase of 31.9 percent year-on-year.
For the same period, China's exports to Australia increased by 37.7 % to US$2.62
billion and imports increased by 27.8 % to US$3.42 billion.
17 In the same year, Australia’s trade with Japan and USA was US$20.85 and US$19.07 billion respectively.

124
Table 4.1: Australia’s Merchandise Trade With its Top 5 Trading Countries 2002
Data source: DFAT 2003
China is an important trading partner for Australia. Chart 4.4 shows Australia’s leading
export trading countries. Trade with China continued to increase in 2002, while at the
same time, it started to decrease with Japan and USA. As China continues with its drive
to industrialise and increase trade with other countries, demand for Australian
commodities should increase thus increasing Australia’s trade potential, which will be
at the expense of USA and Japan. According to Mark Rider, UBS Warburg Australia’s
Chief Economist, “China is on track to become Australia’s largest export destination by
2012, this growth coming mainly from metal ores” (cited in Trounson 2003, p.M2).
Chart 4.4: Australia’s Top 5 Merchandise Export Markets, 1996-2002
(At exchange rate A$1 = USD 0.55)
Australia Merchandise Trade by Country, 2002 -Rank Country Exports Imports Net Exports Total
USD,000 % Share USD,000 % Share USD,000 USD,000 % Share1 Japan 12,190,200 18.56 12,731,400 19.38 (541,200) 24,921,600 37.942 United States 6,342,600 9.66 8,657,550 13.18 (2,314,950) 15,000,150 22.833 China 4,602,400 7.01 7,066,400 10.76 (2,464,000) 11,668,800 17.764 Rep of Korea 5,484,600 8.35 3,215,300 4.89 2,269,300 8,699,900 13.245 New Zealand 4,356,000 6.63 4,035,350 6.14 320,650 8,391,350 12.77
World Total 65,689,800 50.20 70,203,100 54.36 (4,513,300) 135,892,900 104.55
0
2,000
4,000
6,000
8,000
10,000
12,000
14,000
1996 1997 1998 1999 2000 2001 2002
Mill
ion
US
$
Japan United StatesRep of Korea New ZealandChina

125
Data sources: DFAT 2001, 2002 and 2003
Chart 4.5 shows Australia’s top 5 import markets. Imports from all with the exception
of United Kingdom increased; the largest increase was with China. Since 1996, China
exports to Australia increased from US$2.267 to US$7.066 billion (an increase of
212%). Over the same time, China’s trade surplus with Australia grew from US$0.13
billion to US$2.46 billion (Department of Foreign Affairs and Trade, 2000, 2001, 2002
and 2003). During the same period, import trade with the other top import markets saw
a reduced rate of growth. This should provide trade negotiators with a good opportunity
to increase exports and also to negotiate better deals on the imported goods.
Chart 4.5: Australia’s Top 5 Merchandise Import Markets, 1996-2002 (At exchange rate A$1 = USD 0.55)
Data sources: DFAT 2001, 2002 and 2003
0
2,000
4,000
6,000
8,000
10,000
12,000
14,000
1996 1997 1998 1999 2000 2001 2002
Mill
ion
US
$
United States JapanChina United KingdomGermany

126
Table 4.2 shows that since 2000, China has been Australia’s 3rd largest trading partner
closely followed by Korea. Japan and the United States took first and second place
respectively. As both Japan and the United States lose their competitive position in
producing a wide range of goods to China and at the same time, China’s economy
continues to grow along with industrial production and consumer demand, it is likely
that trade will shift from the USA and Japan towards China. The US currency has been
high for several years and will need to considerably drop to enable the country to
become more cost competitive. Japan lost much of its competitive position when its
exchange rate substantially increased. Only after an economic recession18 and
significant devaluation of its exchange rate, will Japan be able to improve its
competitive position in the international market place. It is likely that the reduced trade
with Japan and the United States will not only be lost to China, but also a developing
Korea. For trade other than iron ore, this will be important for both China and Australia
bilateral trade developments in the coming years. As China increases trade in goods,
this will help maintain and even increase demand for steel. This in turn will increase
demand for iron ore.
18 The recession will end when Japan’s economy is restructured. This process is occurring.

127
Table 4.2, Australia’s Merchandise Trade with the top 5 Trading Countries 2000-2002
Data sources: DFAT 2001, 2002 and 2003
4.2 Comparative Advantage
As outlined earlier, iron ore is the principle raw material input to the steel making
process and Australia is one of the world’s leading suppliers. The first deposits of iron
ore were found in 1880 on Koolan and Cockatoo Islands in Western Australia. In 1907,
mining commenced at Koolan Island on a relatively small-scale basis. In 1935, a
London-based firm called H.A.Brassert and Company Limited acquired leases over the
iron ore deposits at Koolan Island for the purpose of export to Japan (Blockley, Reid &
Australia Merchandise Trade by Country, 2001 -Rank Country Net Exports
USD,000 % Share USD,000 % Share USD,000 USD,000 % Share1 Japan 13,045,717 19.36 8,392,673 12.45 4,653,044 21,438,390 31.812 United States 6,558,781 9.73 11,775,906 17.47 (5,217,125) 18,334,688 27.203 China 4,171,160 6.19 5,671,717 8.41 (1,500,556) 9,842,877 14.604 Rep of Korea 5,240,787 7.78 2,549,223 3.78 2,691,564 7,790,010 11.565 New Zealand 3,947,094 5.86 2,607,647 3.87 1,339,447 6,554,741 9.73
World Total 67,400,508 48.91 64,757,840 45.99 2,642,668 132,158,349 94.90
Exports Imports Total
Australia Merchandise Trade by Country, 2000 -Rank Country Net Exports
USD,000 % Share USD,000 % Share USD,000 USD,000 % Share1 Japan 12,014,333 19.79 8,423,674 13.10 3,590,659 20,438,006 16.342 United States 6,038,748 9.94 12,717,759 19.77 (6,679,011) 18,756,508 15.003 China 3,305,461 5.44 4,990,132 7.76 (1,684,671) 8,295,593 6.634 Rep of Korea 4,976,250 8.20 2,641,543 4.11 2,334,708 7,617,793 6.095 New Zealand 3,610,410 5.95 2,467,607 3.84 1,142,803 6,078,017 4.86
World Total 60,722,734 49.31 64,320,601 48.57 (3,597,868) 125,043,335 48.93
Exports Imports Total
Australia Merchandise Trade by Country, 2002 -Rank Country Exports Imports Net Exports Total
USD,000 % Share USD,000 % Share USD,000 USD,000 % Share1 Japan 12,190,200 18.56 12,731,400 19.38 (541,200) 24,921,600 37.942 United States 6,342,600 9.66 8,657,550 13.18 (2,314,950) 15,000,150 22.833 China 4,602,400 7.01 7,066,400 10.76 (2,464,000) 11,668,800 17.764 Rep of Korea 5,484,600 8.35 3,215,300 4.89 2,269,300 8,699,900 13.245 New Zealand 4,356,000 6.63 4,035,350 6.14 320,650 8,391,350 12.77
World Total 65,689,800 50.20 70,203,100 54.36 (4,513,300) 135,892,900 104.55

128
Trendal 1990), and in 1936, the Yampi Sound Mining Company also tried to export the
commodity to Japan. At this time, it was reported that the Australian Government was
concerned about Japan’s military ambitions19 (Iron Ore 2003). In May 1938, the
Commonwealth Government announced its intention to impose, by amendment of the
Customs Regulations, an indefinite embargo on the export of iron ore to take effect
from 1 July 1938 (Blockley, Reid & Trendal 1990). The embargo was subsequently
lifted in December 1960, by which time more exploration discoveries had taken place
and the industry was now freely able to develop into being a major supplier to the
global iron and steel industry and was to develop into being one of the country’s leading
export industries. Since that time production has increased from below 10 million
tonnes to over 180 million tonnes (Western Australia, Department of Industry and
Resources 2003).
Over 91% of Australia’s iron ore resources are located in the Northwest region of
Western Australia in an area called the Pilbara. Flint (2003) reports that as at 31
December, 2002 the measured and indicated resources of high grade iron ore total 9,149
million tonnes and the inferred resources total 9,900 million tonnes. Without any
further discoveries, at the current rate of mining this will last approximately 100 years.
The most suitable ore from Western Australia for making steel is Brockman low
phosphorous iron ore. Notwithstanding that Australian iron ore producers are
prolonging its life by blending with other ore body types, this type of ore is being
depleted and its dominance in the industry will progressively decrease over the next 20
years (Townsend & Flint 1997, p.64). A map showing the locations of operating mines,
reserves, road and rail is in Appendix 9.16.
19 By this time Japan had invaded China.

129
Although iron ore production plants are very capital intensive, since Australian ore
bodies are easily accessible when the producing plant and associated infrastructure are
in place, then additional production and transporting costs make Australian iron ore
very cost effective for China to purchase. Ease of access to reserves and short shipping
distances give Australia a competitive advantage over other countries with fewer
reserves and which may be more difficult to mine and subsequently transport.
4.3 Iron Ore Production
Chart 4.6 illustrates Australia’s annual production of iron ore between 1950 and 2002.
As mentioned earlier, the commonwealth government imposed an embargo on
exporting iron ore in 1938, this being lifted in 1960. At the time of lifting the embargo,
production output was 4.45 million tonnes. Subsequently, during the 1960s, Australia’s
production and trade in iron ore started to rapidly increase. By 1965, it had increased
by 55% to 6.89 million tonnes. Then between 1965 and 1975 it increased from 6.89 to
97.65 million tonnes. From 1975 to 1990 production was relatively constant, then
along with increased demand in Japan followed by increase demand in China,
production rapidly increased during the 1990s, 2000, 2001 up to 183 million tonnes in
2002.
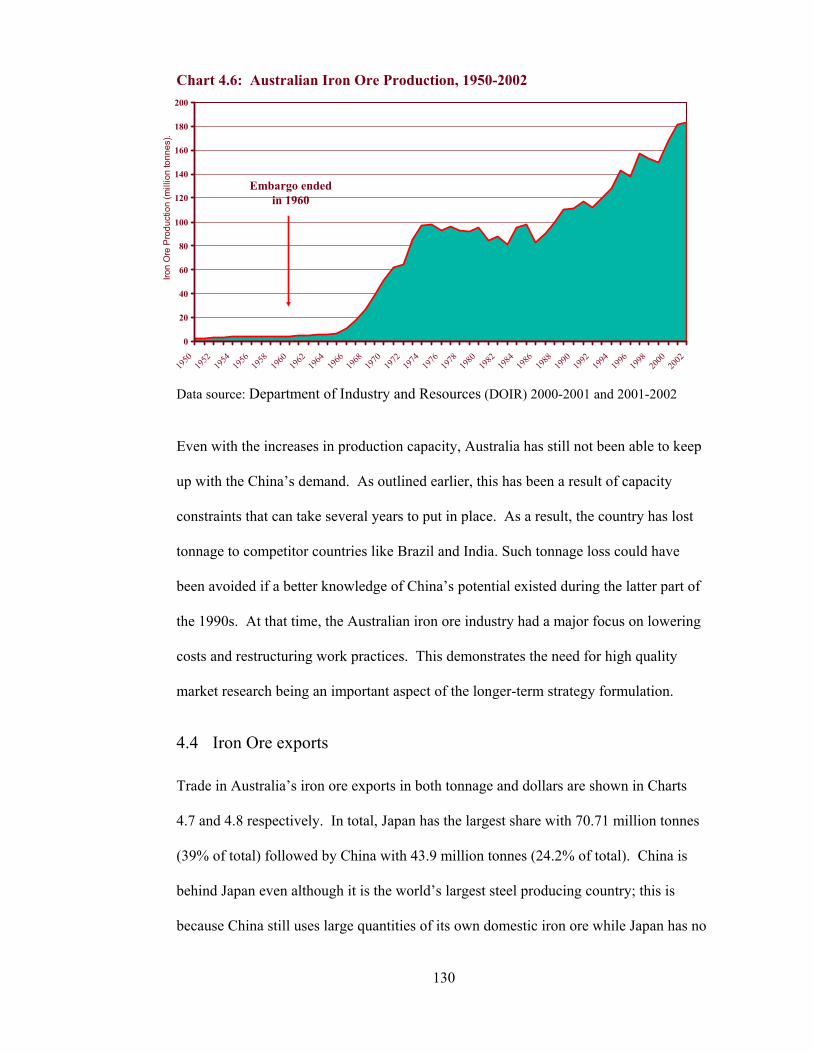
130
Chart 4.6: Australian Iron Ore Production, 1950-2002
Data source: Department of Industry and Resources (DOIR) 2000-2001 and 2001-2002
Even with the increases in production capacity, Australia has still not been able to keep
up with the China’s demand. As outlined earlier, this has been a result of capacity
constraints that can take several years to put in place. As a result, the country has lost
tonnage to competitor countries like Brazil and India. Such tonnage loss could have
been avoided if a better knowledge of China’s potential existed during the latter part of
the 1990s. At that time, the Australian iron ore industry had a major focus on lowering
costs and restructuring work practices. This demonstrates the need for high quality
market research being an important aspect of the longer-term strategy formulation.
4.4 Iron Ore exports
Trade in Australia’s iron ore exports in both tonnage and dollars are shown in Charts
4.7 and 4.8 respectively. In total, Japan has the largest share with 70.71 million tonnes
(39% of total) followed by China with 43.9 million tonnes (24.2% of total). China is
behind Japan even although it is the world’s largest steel producing country; this is
because China still uses large quantities of its own domestic iron ore while Japan has no
0
20
40
60
80
100
120
140
160
180
200
1950
1952
1954
1956
1958
1960
1962
1964
1966
1968
1970
1972
1974
1976
1978
1980
1982
1984
1986
1988
1990
1992
1994
1996
1998
2000
2002
Iron
Ore
Pro
duct
ion
(mill
ion
tonn
es).
Embargo ended in 1960

131
domestic resources of iron ore. Australia’s iron ore exports to Korea and Taiwan have
been increasing over the past several years, while exports of iron ore to Europe have
been falling since 1997 (with the exception of 2000, where an increase occurred). As
Korea develops, export trade to that country has significant potential to increase.
Chart 4.7: Australia’s Iron Ore Exports in 2002
Data source: Iron Ore Manual 2002-2003, The Tex Report, p.36
Chart 4.8: Value of Australia’s Iron Ore Exports, 2002
Total 181 million tonnes
16.915
14.306
9.41225.309
43.906
70.71
Japan
China
South Korea
Taiwan
Europe
Others (diff from total)Note: All values in million tonnes Values used are for Western Australia which account for most of Australia’s exports of Iron Ore
Total US$2.68 billion
19.8
179.1
190.5
399
742
1,149.40
Japan
China
South Korea
Taiwan
Europe
Others (diff fromtotal)

132
Data source: DOIR 2002 - Statistics Digest, Department of Industry and Resources, Western
Australia. Values are principally Western Australian values (other Australia represents only 3%
of Australia exports).
Traded destinations and quantities of Australian iron ore are presented in more detail in
Chart 4.9. This shows that Japan is still Australia’s prime market for its iron ore. In
1976, Australia was supplying Japan with 63 million tonnes of ore and this remained
constant through to 1999 when it grew to 69 million tonnes, thereafter it continued
steadily growing to 70.7 million tonnes in 2002 (an increase of 12.2% in tonnage). In
1976, Australia was only supplying China with 1.37 million tonnes, this increased to
26.5 million tonnes in 1999 further increasing to 44 million tonnes in 2002. During this
same period, Japan’s steel production remained constant from 107.4 million tonnes in
1976 to 107.7 million tonnes in 2002. Australia was successful in winning more market
share from its competitors20. During the same period, China’s steel production
increased from a very low 20.5 million tonnes in 1976 to 181.5 million tonnes in 2002.
The chart shows that the gap between China and Japan is closing. This gap will
continue to close as long as China can sustain its iron and steel growth and Japan’s steel
production drops as the potential for it to lose market share to the Chinese steel industry
is high. The timing will depend on when China’s steel industry focuses on export
markets rather than domestic construction. This is not expected to occur until after the
Beijing Olympics in 2008. To take advantage of lower overheads and China’s
comparative advantage of lower labour and resource costs, it is very likely that Japan
will participate in more joint ventures with China’s major steel producers. This means
that the China market has significant potential to become larger. Australian producers
need to plan accordingly.
20 Australia’s comparative supply advantage helped gain market share in Japan.

133
It can be seen from Chart 4.9 that from the mid 1990s, Australia’s iron ore exports to
Europe and other countries is decreasing while increasing to Asia. With the closeness
to Asia, costs to supply there are lower. This in turn increases profit margins for the
Australian producers.
Chart 4.9: Destinations and Quantities of Australia’s Iron Ore Exports, 1975-2002
Data sources: Tex Reports, Iron Ore Manuals – 1987 through 2003.
4.4.1 Outlook for Australia’s Iron Ore Production Chart 4.6 showed Australia’s production of iron ore between 1950 and 2002. What is
the outlook for the next several years? Considering output 1999-2002 (149.97 to 182.7
million tonnes respectively) this represented an increase of 8.18 million tonnes per
annum. The ABARE (2002b), estimates that Australia’s iron ore output will increase
from a 2002 level of around 183 million tonnes to 209.5 million tonnes in 2007. Details
are shown in Table 4.3.
0
10
20
30
40
50
60
70
80
19751976
19771978
19791980
19811982
19831984
19851986
19871988
19891990
19911992
19931994
19951996
19971998
19992000
20012002
Aus
tralia
's Ir
on O
re E
xpor
ts (M
illio
n to
nn
Japan China
South Korea Taiwan
Europe Others (diff from total)

134
Table 4.3: Australia’s Estimated Iron Ore Output, 2003 - 2007
Australia Production Units 2003 2004 2005 2006 2007
Iron Ore (Million tonnes) 189.0 194.5 199.5 204.5 209.5
Data source: ABARE, Australian Commodities, Forecasts and Issues, 2002 p.112
For the period 1999-2002, Chart 4.9 showed increases in supply to both Japan and
China. All else equal, the upward supply trend to Japan should not change much. With
preparations for the Beijing 2008 Olympics, strong demand for steel in China is
expected to continue. This suggests that ABARE’s estimate is conservative and the
outlook for Australian iron ore exports to China is even more favourable.
4.4.2 Pricing of Iron Ore - Setters or Takers Iron ore is supplied in two basic forms. One is in the form of lumps, which range in
size from 6.3mm to 31.5mm and the other form is called fines, which range in size from
0.150mm to just under 6.3mm. Depending on which process is being used in the steel
making plant, either lump or fines are used. Lump product can be injected directly into
some furnaces whereas fines products require to be pre-treated (agglomerated into sinter
or pellets). As a result, lump iron ore is generally preferred, as it requires lower energy
input to the steel making process. This benefit of lump attracts a premium in price from
steel makers. Iron ore in the form of lumps is becoming a scarcer commodity; iron ore
producers are more able to supply fine products. In 2002, Australia exported 48.5
million tonnes of lump product and 116.7 million tonnes of fine products (The Tex
Report 2002-2003). As a result of the larger market being for fine products, traded
prices for iron ore are based on this. A benchmark or representative marker is the cost
of fines into Japan as this represents the largest proportion of the trade in ore. A
135
differential is normally added for iron ore lump prices on top of this representative of
fines price. A common unit for basing pricing on is US cents per dry long ton21 iron
unit. It is converted to metric tonnes by multiplying by the iron content of the traded
ore, then by a conversion factor of 1.016. Dry tonnes are used since iron ore can
contain moisture, some deposits more than others. Customers do not want to pay, for
example, for shipping and supplying water. Generally, contracts are for iron ore to be
“FOB” (free on board). Subsequent costs of sea freight have significant bearings on the
directions of traded iron ore. Sea freight of international bulk commodities is subjected
to global market supply and demand conditions. This introduces a degree of volatility
and uncertainty generally from year to year for the longer-term contracts with spot sales
of iron ore being subjected to the volatility of sea freight rates.
Chart 4.10, shows the price of fines into Japan since 1973. The results show that up to
1982, prices increased, and then the price has trended down, recovering to an upward
trend in 1999. The figures in the chart are in current dollars, so if we consider inflation,
prices have certainly dropped. If not for strong Chinese demand, reductions in price
would have been larger. The market is still competitive due to Brazil and India. As
European demand decreases which generally occurs as Asian steel producers increase
their market share, Brazil and India enter the Asian market to ensure they can clear their
products. This leads to demanding trading conditions that put downward pressure on
prices. More and more Australian producers are being challenged to maintain profit
margins. This is being balanced by continuing strong Chinese demand.
21 Ton is the American short ton and requires conversion.

136
Chart 4.10: Price of Iron Ore (Representative Fines) into Japan, 1973-2003
Data sources: The Tex Report, Iron Ore Manuals – 1975-2003
By continually producing iron ore at lower costs and at the same time compensating for
lower quality ore bodies by processing and blending22, Australian producers can
maintain their market leadership. Australia’s iron ore productivity has increased
continually from 15,500 tonnes per employee in 1992 to 22,500 tonnes per employee in
1998 (SBC Warburg 1998, p.42). During 2003, productivity levels would be closer
45,000 tonnes per employee.23
The outlook for the industry should see increasing demand for downstream products -
pellets made from fines and hot briquette iron. Australia with its large resources of gas
for energy together with its advanced and well established iron ore production plants
should be well placed to increase trade in these newer iron ore products. Will Australia
be able to take advantage of economic uncertainty and competitive global iron ore
trade? It is important for producers to continue endeavouring to lower costs and
improve productivity. At the same time, good quality market research will be required
22 BHP Billiton’s hot briquette production facility in Western Australia is one such initiative.
0
5
10
15
20
25
30
35
40
1973
1975
1977
1979
1981
1983
1985
1987
1989
1991
1993
1995
1997
1999
2001
2003
Rep
rese
ntat
ive
Iron
Ore
Fin
es (U
S ce
nts
per D
LU)

137
to ensure that production capacity does not become excess capacity. In the short to
medium term, technical limitations will not help achieve this. To improve their
competitive position in the international market, at some stage, Australian producers
may need to consider sharing infrastructure and cooperating with logistic supply issues.
The other approach is to lock in several long term supply contracts and perhaps equity
arrangements with Chinese steel producers. One major factor, which is increasingly
playing an important role in iron ore trade economics, is sea freight costs. The next
section examines this in detail.
4.4.3 Economics of Iron Ore Sea Borne Trade
According to Holroyd (1992, p.117), to effectively compete in a global market place is a
function of transport costs. The most significant cost component in China’s iron ore
sourcing economics is sea freight costs. These vary with the market rates, but what is
important is the differential cost between the two major sources of iron ore, Australia
and Brazil. Sea freight costs are like a commodity, set by market prices. Apart from
premiums being paid as a result of some international crisis24, the components that
make up sea freight costs in general are: freight/labour cost ratios; port costs
(demurrage, handling fees, time to load and unload), shipping technology, port
restrictions, utilisation (back loading), fuel costs, and ship condition. Economies of
scale also play a major role (very large carriers have lower unit transport costs).
In relation to China’s iron ore shipments from its two major sources, Brazil and
Australia, the three following economic aspects are continually taking on a greater role
in China’s iron ore sourcing strategy and policy:
23 Based on Australia’s current annual output of 181 million tonnes with around 4,000 direct labour.

138
1. At the macro level, geographical distance – Chinese iron ore unloading ports are
6,130 km from Australian iron ore loading ports and 20,120 km from Brazilian
ports. Sourcing iron ore from Australia gives China lower sea freight costs and this
gives Australia a comparative, geographical shipping advantage. The European iron
ore loading ports are further from China, but closer to Brazil. As a result China has
been sourcing more iron ore from Australia rather than from Brazil. Brazil has a sea
freight competitive advantage in supplying to the European market.
2. At the micro level - port depth restrictions (SSY 1999, pp.9-36). The two major iron
ore loading ports in Australia are at Dampier and Port Hedland. Both of these ports
have two major berths. Dampier’s two berths are 21.5 and 17 metres deep. Port
Hedland’s two berths are 19 and 17 metres deep. The largest carriers through the
Australian iron ore loading ports are just under 200,000 dwt25, more usually 170,000
dwt. Brazil’s main iron ore loading ports are at Tubarao and Ponta Da Madeira and
these are 21 and 18 metres deep respectively. As a result, Brazilian iron ore
producers using Tubarao or Ponta Da Madeira, have sea freight advantage in that
they can take over 300,000 dwt. However, unlike Japan and European countries,
the majority of China’s ports that are used for unloading iron ore have capacity
limitations requiring smaller vessels around 170,000 dwt. As a result, Brazilian iron
ore producers’ advantage in its ability to sea freight higher tonnage is more
advantageous to other markets rather than China.
However, China is investing in improved seaport infrastructure and larger sized
vessels will be used more in future. Smaller carriers have higher per tonne sea
freight costs, this makes it more economical for Chinese vessels to freight iron ore
from Australia.
24 The Iraq conflict was a typical example, this causes a war premium and market rates increase.

139
3. In the marketplace, supply and demand. When more ships become less utilised and
available, this lowers sea freight rates (this occurred during the Asian economic
crisis and rates substantially decreased). Volatile market conditions caused by
hostilities breaking out in particular regions, put market prices higher by incurring
war premiums. An urgent need to build double hulled oil tankers due to a European
ban on single hull vessels means that it is more profitable to build these vessels
rather than bulk ore carriers for carrying iron ore. According to a Credit Suisse
report (November, 2003, p.5), the likely lead time for new dry cargo carriers is three
years. This is a major supply capacity constraint.
Brazil has clearly been positioning to be a dominant player in the China market. This
country is taking every opportunity to capture market share from Australia and was
successful for a short period during 1999. During this period, Australia experienced the
unexpected – a significant reduction in differential sea freight costs down to
approximately US$2.00 per tonne (approximately 7% of iron ore price). This was as a
result of the slowing down of steel production caused by the Asian economic crisis.
This reduction caused China to switch ore imports from Australia to Brazil and enabled
Brazil to capture an increased share of the China market. At that time, the sea freight
cost from Brazil to China was only US$5 per tonne compared to Australia’s US$3 per
tonne. This US$2.00 differential is now considered by iron ore companies to represent
the critical value. At this point, it is worth China paying to obtain the slightly higher
iron content ore (1-2% higher). Australian producers could improve iron ore content by
further beneficiation. This further processing is costly. In general, producers do
25 dwt is dead weight tonnage.

140
beneficiate many of their fine products26 to improve iron content and also to reduce
impurity levels. By 2003, sea freight rates increased to US$28 per tonne from Brazil to
China and US$18 from Australia to China. It is interesting to note that sea freight costs
are showing upward price trends while at the same time longer-term price trend for iron
ore is down27. This is an important finding.
In general, mineral economists expect iron ore prices to continue trending lower.
Lower costs per tonne result from improved production methods and customers driving
lower input costs. To maintain trading margins in an increasingly difficult global
market place, Australian iron ore suppliers need to reduce costs per tonne supplied.
4.4.4 Outlook for Australian Iron Ore Trade
To increase iron ore production capacity, the Chinese government is encouraging
foreign companies to participate in joint ventures. Liu Qi (1996, p.8), Executive Vice-
Chairman of the Board China Iron and Steel Industry and Trade Group Corporation
suggests joint-trading agreements with countries (eg Brazil) taking coal from China for
iron ore is a very possible development. In relation to the major Australian iron ore
producers, China has only entered into a joint venture arrangement with Rio Tinto.
They have the A$100 million Channar iron ore joint venture28, which commenced in
1990, a 20 year joint venture with Baosteel Corporation worth A$120 million which
was signed on the 20th December 2001 (Australian Stock Exchange 2001), Shougang
Corporation participating in their downstream processing plant in Kwinana, Western
26 The need for this usually depends on the nature of the ore body from which the ore is mined. 27 As is the case for most mineral resources. 28 China have 40% share of the A$250 million capital cost, Hamersley Iron 60% (Smith 1987).

141
Australia29 and Wuhan Iron and Steel’s signing of a framework agreement in August
2003 to have a strategic partnership which will involve the purchase of 75 million
tonnes of iron ore over 25 years (Interfax 2003). These are positive developments that
have great potential to improve iron ore trade between Australia and China. It also
suggests that there is potential for other Chinese steel producers to develop joint
ventures with Australia’s other major producer, BHP Billiton. That group has an
agreement with Korean steelmaker, POSCO, to develop a West Australian iron ore
deposit at its Mining Area C in the central Pilbara (Oldfield 2001). POSCO took 20%
equity in the Mining Area C development (Bell 2001) to develop the A$300 million
Mining Area C development in the Pilbara, Western Australia. China has contracted
with one of the minor iron ore producers in Australia, Hancock Mining, to take half of
the iron ore output from that company’s Hope Down’s development during the first 5
years (CRU 2002c, Industry developments, p.10).
Pu Haiqing (2000, p.408) stresses the need for China to secure iron-ore interests
overseas in order to safeguard China’s long-term requirements. According to Liu Qi
(1996), China’s iron ore market is characterised by increasing imports, diversified
resources and poor infrastructure. China’s relationship with Australia is good and
Australia has “most favoured nation” status and as a result Australia is China’s first
choice for iron ore (Liu 1996, p.6). This should help both countries to increase trade
with one another.
29 Known as Hismelt.

142
5 China’s Trade Development
It was not until February 1972, when the then President of USA Nixon visited China
that the process of China opening its markets for trade started. By 1979, China had
embarked on a more open market trading journey, subsequently making application to
join the WTO’s predecessor, GATT, in 1986. After 15 years of effort, China became a
member of the WTO on 11 December 2001. The entry of China, one of the world’s
largest markets, into the WTO was considered to represent a watershed in global trade
and in China’s economic history. This membership should enable the Chinese Central
Government to drive economic reforms and could become the focus for many changes
that previously were not considered ideologically correct. This chapter discusses
China’s trade outlook in relation to its iron and steel industry, including: international
trade, trade with Japan and USA, future trade outlook, free trade and tariffs, entry to the
World Trade Organisation, foreign trade policy, structural weaknesses and the future of
the Chinese steel industry.
In just over 20 years, China’s exports have increased from US$13,657 million in 1979
to US$266,200 million in 2001 moving from a world ranking of 30th to 6th. During the
same period the country’s imports have increased from US$15,675 million in 1979 to
US$243,600 million in 2001 moving from a world ranking of 21st to 6th (DFAT 2001
and WTO 2001).
Trade between WTO member countries requires reduction in trade barriers and
development of free trade arrangements. China, for example, will cut tariffs from
around 24% to 9% by 2005. Tariffs on cars will drop to 25% from over 80% by 2006

143
and China is already considering looking at setting up regional trade agreements with
ASEAN countries. This will increase its exports and has the potential to assist with
improved economic performance in the ASEAN region. This could be a bonus for
resource-based exporters well positioned to satisfy an increasing resource demand in the
Asian market. Later sections examine the impact of lower tariffs and increased foreign
investment in automobile manufacturing in China which increase steel demand.
5.1 China’s International Trade
A country’s balance of payments (imports less exports) is a common measure of
economic health. Consistent surplus would suggest the government has a sound control
of the economy. Chart 5.1, shows import and export performance of China since 1981.
Up to 1995, its performance was good with an export value of US$148.5 billion after
which export performance increased steadily to US$195 billion in 1999, subsequently
rapidly growing to US$371 billion in 2002. This recent performance with 150%
increase from 1995 to 2002 has been excellent. From 1995 to 2002, imports increased
from US$132 to US$274.3 billion (108% increase). This performance is particularly
significant when one considers that during these years, much of China’s imports have
been used to “add value” to the country’s productive capacity – for example aircraft,
steel making and factory machine tools. Refer to Appendix 9.15 – Top Eleven Import
Commodities, 2000 and 2001. Steel is ranked at 3rd at US$8.96 billion and Iron ore is
ranked at 11th at US$2.5 billion. All of the top eleven imports have significant value
adding potential.

144
Chart 5.1: China's International Trade, 1981-2002
Data source: Asian Development Bank
China has come a long way since 1980 when it held 28th ranking in merchandise exports
with value US$18.139 billion. In 1990, it was ranked 14th with US$62.760 billion in
merchandise exports. In the 10 years between 1980 and 1990 the country increased
merchandised exports by US$44.621 billion averaging US$ 4.46 billion per annum.
Between 1990 and 2000 it increased merchandised exports by US$213.482 billion,
which is an average increase of US$ 21.35 billion per year. Finally, between 2000 and
2002 exports increased by a large US$122.228 billion, of which US$105.283 billion
was between 2001 and 2002. Can this sound performance continue? According to Pu
Yonghao (cited in Kynge 2001a), foreign trade is expected to double to more than
US$1,000 billion by 2006, exports growing by 15 percent from 2002 to 2006 with
foreign direct investment growing by 16 per cent annually from 2002 to 2006 reaching
around US$100 billion in 2006. This research supports this, but points out that after the
2008 Beijing Olympics, pressure resulting from currency appreciation and social issues
0
50,000
100,000
150,000
200,000
250,000
300,000
350,000
400,000
1981
1982
1983
1984
1985
1986
1987
1988
1989
1990
1991
1992
1993
1994
1995
1996
1997
1998
1999
2000
2001
2002
Mill
ion
US$
Exports Imports

145
may have an adverse affect on trade growth. According to the People’s Daily (2001a),
the global economic recession which started in the latter part of the 1990’s will lower
China's exports and forecasts that China's growth rate for imports will outstrip that for
exports during the first several years following accession to the World Trade
Organisation. This is a major reason why it is unlikely China would support its currency
appreciating in value.
Trade performance in relation to GDP is shown in Chart 5.2. In 2002, exports
accounted for 26.3% of GDP and imports accounted for 23.9%. Since the 1980s trade
performance has been good, only experiencing a slowdown in 1993 as a result of the
Asian financial crisis. A large component of the country’s GDP growth has been
government expenditure. Chart 5.2 indicates a slowing of the rate of increase for both
imports and exports. With improved infrastructure and enhanced value added
production capacity, it is likely that as the world emerges from the current economic
slowdown, China will be well prepared to increase exports, but its population’s
increasing appetite for western goods may need addressing. The Chinese government is
intent on developing and sustaining healthy export trading. According to the People’s
Daily (2001b), measures are already in place to boost foreign trade. These include:
faster and higher duty refund rates, simplified customs and tariff procedures. China will
also need to manage the level of its exchange rate. A higher valued yuan will not help
exports, but will help lower the cost of importing value adding machinery. This will be
a timing control matter for the Central Government to get correct. Prospective traders
with China need to be aware of this (see the section on China’s currency, section 5.8.1).

146
Chart 5.2: China's International Trade as % GDP, 1981-2002
Data source: Asian Development Bank
In relation to global trade, as mentioned earlier, China’s total exports have moved from
30th place in 1979 in the world export table to 6th place in 2002. During the same period,
imports moved from 21st place to 6th place. Tables 5.1 and 5.2 show the leading
exporters and importers in world merchandise trade in 2000 and 2001 respectively.
Between 2000 and 2001, China slipped from 5th to 6th place in the world’s export
ranking and moved up from 8th to 6th place in the world’s import rankings. If we had
included the values for Hong Kong, in 2001 we would have seen China moving to 3rd
place in both export and import rankings.
0.00%
5.00%
10.00%
15.00%
20.00%
25.00%
30.00%
1981
1982
1983
1984
1985
1986
1987
1988
1989
1990
1991
1992
1993
1994
1995
1996
1997
1998
1999
2000
2001
2002
Perc
enta
geExports/GDP Imports/GDP

147
Table 5.1: Leading Importers & Exporters in World Merchandise Trade, 2000
Rank Exporters Value (Billion US dollars)
% Share Importers Value
(Billion US dollars) %
Share 1 United States 771.991 12.13 United States 1,238.200 18.56 2 Germany 548.785 8.62 Germany 500.278 7.50 3 Japan 477.929 7.51 Japan 377.012 5.65
4 France 323. 885 5.09 United Kingdom 375.389 5.63
5 China 276.242 4.34 France 332.189 4.98
6 United Kingdom 275.555 4.33 Canada 262.721 3.94
7 Canada 275.183 4.32 Italy 235.280 3.53 8 Italy 236.569 3.72 China 224.688 3.37 9 Netherlands 229.741 3.61 Netherlands 215.716 3.23 10 Hong Kong 196.890 3.09 Hong Kong 215.485 3.23
World Total Export = US$6,364bn World Total Import = US$6,670.4bn
Data source: Data-Department of Foreign Affairs and Trade, 2002
Table 5.2: Leading Importers & Exporters in World Merchandise Trade, 2001
Rank Exporters Value (Billion US dollars)
% Share Importers Value
(Billion US dollars) %
Share 1 United States 730.8 11.9 United States 1180.2 18.3 2 Germany 570.8 9.3 Germany 492.8 7.7 3 Japan 403.5 6.6 Japan 349.1 5.4
4 France 321.8 5.2 United Kingdom 331.8 5.2
5 United Kingdom 273.1 4.4 France 325.8 5.1
6 China 266.2 4.3 China 243.6 3.8 7 Canada 259.9 4.2 Italy 232.9 3.6 8 Italy 241.1 3.9 Canada 227.2 3.5 9 Netherlands 229.5 3.7 Netherlands 207.3 3.2 10 Hong Kong, 191.1 3.1 Hong Kong, 202.0 3.1
World Total Export = US$ 6,155 billion World Total Import = US$ 6,441.3 billion
Data source: WTO International Trade Statistics, 2002, p.25.
According to the World Bank (cited in Roberts & Clifford 2002), China’s share of
world’s exports should reach 13.7% (this includes Taiwan and Hong Kong - called
Greater China) by 2007 and the combined GDP will be US$12 trillion, overtaking the
European Union. Goldman Sachs & Co Asia estimate that total exports and imports,

148
excluding trade between the 3 economies will exceed US$2 trillion (cited in Roberts &
Clifford 2002). China’s performance is apparent when compared to global trade:
China’s trade increased by US$8.87 billion (1.77%) between 2000 and 2001; at the
same time, world trade decreased by US$438 billion (3.36%). The trade data in these
tables do not support the pressure being put on China by the USA to appreciate its
currency. This pressure is related directly to manufacturing export competitiveness,
resulting from China’s low cost labour and this will be examined separately.
5.1.1 China’s approach to trade Throughout early history, Chinese were regarded as a trading nation. A visit to Chinese
markets anywhere in the world, demonstrates these people’s ability to negotiate and
trade in all goods and services. The following quotation clearly illustrates a modern
view of China’s approach to trade:
“China is ready to develop trade with all countries on a basis
of equality and mutual benefit, to import advanced
technology and key equipment from abroad, to draw on
foreign management experience, and to make use of foreign
funds - all for the purpose of speeding up China’s
modernisation” (Zhao 1984, pp.24-25).
Now with China in the WTO, it is widely believed that in relation to how it conducts
trade China will clash with many of its trading partners (Leggett 2001). Although this
is not official government policy, the media reports are strongly reporting such
viewpoints. This research has not found evidence of such need for China’s trading

149
partners to be “clashing” or having major trade conflicts even considering that China
ranks first in the world for anti - dumping suits, with more than 450 suits lodged against
its products (O’Neill 21 November 2001a). This issue appears to be more to do with
China’s lower labour costs which are giving it a comparative advantage rather than
some strategy that China has in place to cause difficulty with its trading partners. In
fact, this research has found evidence of unnecessary “China bashing” in that many
countries are claiming China is harming their trade, with this being due to its artificially
low exchange rate. The same countries were not complaining when China’s currency
was held firm during the Asian economic crisis and was considered overvalued. China
maintained its peg to the US currency at that time like it is continuing to do now.
According to Kynge (2001b, p.7), the European Union’s trade commissioner, Pascal
Lamy, recommended discreet discussions in preference to litigation and confrontation.
On the issue of steel trading, he expresses concerns that the United States are very
likely to take a tough stance on imported steel which is hurting domestic manufacturers.
This has the potential to be a big issue not only for China, but many other international
steel suppliers. In 2001, the USA was the world’s largest importer of steel with imports
totalling 27.8 million tonnes; China was second with 25.6 million tonnes (IISI 2003b,
p.11)30. Imposing tariffs in steel imports will impact steel producers exporting to the
USA while at the same time will help the domestic industry in as much as it will enable
domestic producers to sell more products within the USA. The problem with such
tariffs is that they distort the market. This will lead to higher steel prices for goods
manufactured in the USA and increase costs to consumers of manufactured goods both
30 By the end of 2003, China’s steel imports are forecast to exceed 31million tonnes, making it the world’s leading steel importer (CEIS 1118 2003, art.34).

150
domestically and internationally. This will inevitably lead to lowering USA producers’
competitive position in those goods. This issue is discussed under tariffs.
5.2 Trade with Japan and the USA
Charts 5.3 and 5.4 show China’s historical export and import values for USA and Japan
compared to total values. This analysis is useful in helping determining trade potential
and gives an idea of the magnitude of trade opportunities that exist. China’s export
trade to both Japan and the USA is growing faster than its import trade with them. The
resulting growing trade imbalance with the USA is causing concern with the US
government. King and Wonacott (2002) report that the trade imbalance reached an all
time monthly high of $10.8 billion in August 2002, for the whole year it totalled
US$44.5 billion (China exports to USA were US$69.95 billion, imports from USA were
US$25.506 billion). A detailed breakdown of trade with USA, as reported by the China
Economic Information Service, is shown in Appendices 9.10 and 9.11.

151
Chart 5.3: China's Export Values to Japan and USA, 1981-2002
Data source: Asian Development Bank, China Customs
In 2002, China’s exports to Japan of US$53 billion outstripped exports from the USA to
Japan for the first time. This is a good indication of the extent to which China’s foreign
trade has grown and why the USA is showing so much concern.
Chart 5.4: China's Import Values from Japan and USA, 1981-2002
Data source: Asian Development Bank
0
50,000
100,000
150,000
200,000
250,000
300,000
350,000
400,000
1981
1982
1983
1984
1985
1986
1987
1988
1989
1990
1991
1992
1993
1994
1995
1996
1997
1998
1999
2000
2001
2002
Mill
ion
US$
China TotalTo USATo Japan
0
50,000
100,000
150,000
200,000
250,000
300,000
1981
1982
1983
1984
1985
1986
1987
1988
1989
1990
1991
1992
1993
1994
1995
1996
1997
1998
1999
2000
2001
2002
Mill
ion
US$
China TotalFrom USAFrom Japan

152
According to Roston and Fonda (2002), China’s share of world exports could reach
6.8% by 200531. The Asian Development Bank (2001a), reports that as a result of WTO
entry and the associated easing of trade restrictions, imports will continue to grow faster
than exports in the next few years. According to AME Mineral Economics (July 2001),
the Chinese say that WTO entry will boost their GDP by 2–3% annually. The US
International Trade Commission estimates that the Chinese economy could expand by
4% as a result of WTO membership. This flows from efficiency gains as a result of
freeing up foreign investment.
5.3 China’s Future Trade Outlook - Factors Inputs and Efficiency
The Minister of the State Economic and Trade Commission (SETC), Li Rongrong,
outlined the major tasks necessary to achieve 9% industrial growth in 2002: “san gai, yi
jiaqiang” refers to reform, reorganisation, transformation, and strengthening
management. In general, the objectives for economics and trade in 2002 (People’s
Daily, 2001c) were for growth rates of:
• 9 percent in industrial added value
• 10 percent investment in technical renovation and
• Around 10 percent in total volume of social consumer goods’ retail sales.
With particular interest in industrial value as this relates to steel and subsequently trade,
a recent review of China’s 2002 performance shows that growth in industrial added
value was well in excess of Li Rongrong’s 9 % forecast. In fact, according to National
Bureau of Statistics (cited in CEIS 0217 2003), the growth has been the highest since
31 In 2001, China’s share of world’s exports was 4.3%.

153
1997. Table 5.3 shows in current prices, comparisons of the industrial value added with
value added from other sectors of the economy.
Table 5.3: Industrial Value Added Comparisons for China, 2001 and 2002
Value Added by: Dec 2002 (billion yuan)
%Change over
Dec 2001
Jan - Dec 2002
(billion yuan)
% Change over
Jan-Dec01
Industrial added value
321.60 14.9 3,148.2 12.6
Light industry 125.10 12.8 1,229.40 12.1
Heavy industry 196.50 16.8 1,918.80 13.1
State-owned and state holding enterprises 163.00 14.1 1,663.80 11.7
Collective enterprises 25.90 8.1 276.90 8.6
Cooperative enterprises 8.70 8.5 84.70 10.5
Joint-stock enterprises 122.90 18.1 1,157.00 14.4
Enterprises foreign funded 83.50 18.0 809.10 13.3
Data source: National Bureau of Statistics, cited in CEIS 0217 2003, art.039.
A full breakdown of industrial value added by region is shown in Appendix 9.5.7.
5.3.1 How China develops trading strategy – Buying and Selling
Unlike Japan and Korea, China tends to trade at the factory level rather than have large
trading groups. In Japan, these large trading groups are known as sogo sosha. These
are very experienced trading companies which use their large trading tonnages to obtain
maximum leverage in negotiations. The approach has been very successful in both
Japan and Korea. It seems Chinese culture prefers this to be performed within the
154
producer units. This can be considered a loss of strategic advantage to Chinese industry
when faced with trading with only a few global iron ore suppliers. This is an area of
opportunity for China and is an important finding that is discussed in more detail in
Chapter 6.
5.3.2 Olympics 2008 and Shanghai World Fair 2010 It has been reported that Beijing city would spend US$21.69 billion (180 billion yuan)
upgrading infrastructure, municipal facilities and improving the environment in advance
of the Olympics (AsiaPulse 2001). Wang Ying (2001) estimates the Olympics is worth
US$500 million in trade and investment and several billion dollars more in follow-up.
Steel and iron ore will be one of the most important commodities they will need for the
new infrastructure and sports facilities. This will increase the demand for iron and steel
over the next 5 to 7 years. According to the China Economic Information Service
(CEIS 0818 2003, art.034), it is estimated that more than three million tonnes of steel
will be needed for the 280 billion yuan of Olympic construction projects and the 100
billion yuan worth of infrastructure projects. China’s steel companies are keen to win
the majority of this business. The Deputy President of the China Iron and Steel
Association (CISA), Luo Bingsheng believes that China’s domestic steel companies are
capable of providing at least 90 percent of the building steel materials needed for the
event. However, foreign companies are also keen to secure an increased share of the
business. Refer to Appendix 9.12 for further details of Olympics projects.
China has also been successful in securing the 2010 World Expo. It will be held in
Shanghai from May through to October 2010. The project will require the construction

155
of a new Exhibition Centre and other supporting infrastructure in the region. According
to the China Economic Information Service (CEIS 0212 2003, art.033), “the planned
area for the World Expo is 400 hectares and the direct investment involved will top
three billion dollars”. The CEIS also reports “that by 2010, the city aims to have two
international airports, two railway stations, nearly 20 international container sea routes
reaching more than 400 ports in more than 160 countries and regions, seven tunnels
across the Huangpu River, six bridges, three ring roads, nearly 400 km of railway tracks
and a number of passenger transport hubs around the exhibition area”.
The multiplier effects of the Olympics and World Expo will lead to more infrastructure
construction, create more jobs and generally continue to stimulate the economy. This
will be positive for the iron and steel industry in that it should be capable of supplying
the majority of the steel products required for these events.
5.3.3 Infrastructure development The construction of infrastructure is a large consumer of steel. The development of
China’s infrastructure is expected to continue for the short to mid term and will be a
major factor in consumption of domestic steel production and will help maintain
production levels which will enable productive efficiency and in turn competitive steel
prices. Details of the major steel consuming infrastructure developments underway in
China are:
The Three Gorges dam project on the Yangtze River started in 1994 and the expected
completion date is 2010. According to China Energy (Interfax 2003), construction of

156
the dam is expected to consume 800,000 tonnes of steel and reports 600,000 tonnes
have been used to date.
Construction of the Ningbo Hangzhou Bay sea-crossing bridge (CEIS 0609 2003
art.018) started in the middle of 2003 and should be complete by 2009. The bridge will
be 36 kilometres long and will be one of the world’s longest with 6 lanes in both
directions. The cost of the project is estimated to be 11.8 billion yuan (US$1.42 billion).
The construction of this bridge is expected to considerably boost economic
development in the Yangtze River delta region. Following construction of the Ningbo
Hangzhou Bay Bridge, a number of other bridges (Bohai Bay, Huangdao in Shandong
Province and East China Sea) are being considered for construction. The costs of such
projects are estimated to be more than 100 billion yuan (US$12.09 billion).
Construction of the 1,956 kilometre long Qinghai to Tibet railway line (CEIS 0513
2003, art.013) was launched in June 2001 and is scheduled to be completed by 2007.
The project will cost around 36 billion yuan (US$4.34 billion). It involves the
construction of a 920 metres long bridge which will stretch over the Lhasa River. The
bridge is expected to be completed by 2005 and will cost approximately 100 million
yuan (US$12 million).
The above are just some examples of the infrastructure projects either planned or in
place. Construction of infrastructure also has a flow on effect to other sectors, for
example it increases domestic demand for engineering materials and equipment.
According to CEIS (0423 2003, art.032), it is estimated that the engineering machinery
industry will consume around 2.6 million tonnes of steel products over the next few

157
years. With the outlook for increased steel demand, such activity is good for the steel
industry, particularly as China’s steel industry is more suited to producing steel
products for construction of railroads, bridges and for reinforcing concrete.
5.4 Free Trade and Tariffs
The nature of trade is such that free trade and associated tariff reductions will never
fully eliminate trade tensions. This is because traders will be likely to devise other
ways to either tilt playing fields in their favour or level what they consider are tilted
playing fields working against them. This very often emerges as anti-dumping
arguments, common in the international trade of iron and steel, which has had its share
of disputes and tensions. This is evidenced by high numbers of dumping32 claims being
made which in turn has led to steel producing countries introducing trade protection
measures which are not conducive to a free trade culture.
In March 2002, the US surprised many by introducing protective measures in an attempt
to protect its iron and steel industry by imposing tariffs up to 30% on imported steel
from Europe, Asia and South America. Subsequently, in an interim WTO ruling in
March 2002 and then in July 2003, these were found to violate WTO trade rules. The
United States appealed against this ruling (Meller 2003) and in a final verdict the
Appellate Body upheld the earlier decision of a panel of trade judges that the tariffs
were “inconsistent” with trading regulations (Bloomberg News 2003).
32 This is selling low priced and usually subsidised goods into another market, where the sale has the potential to damage the local industry or market.
158
China, the European Union, Japan, the Republic of Korea, Switzerland, Norway, New
Zealand and Brazil vehemently opposed the tariff increases. China subsequently took
counter measures, which ironically resulted in higher domestic market prices for its
steel. This in turn put cost pressures on other industrial sectors of the economy. As
outlined earlier, the USA is the world’s largest importer of steel33 products so this
action seriously impacted all countries which export steel. However, just prior to the
deadline set by the WTO, the USA withdrew its tariffs without any damage being
caused. Its strategy gave the country’s steelmakers almost 2 years protection during a
period when the dollar also depreciated and went a long way in assisting the industry
restructure and consolidate.
As part of its WTO commitments, China undertook to lower its average tariff level to
10% by 2005 (CEIS 0212 2003, art.041). During 2002, China lowered its tariff levels
from 15.3% to 12% then on 1 January 2003, this was followed by a further reduction to
11%. More than 3,000 taxable items have had their tariff rates reduced. As at early
2003, the world’s nominal tariff rate is around 3.8%, China’s tariff rates for industrial
products and agricultural products have dropped by 7.2% and 9.6% respectively.
According to Pu Haiqing, director of the State Administration of the Metallurgical
Industry (SAMI) (cited in China Metal Markets Iron & Steel Monthly, 16 October
2000, p.2) China will cut its tariffs on steel imports within the first five years after it
joins the WTO. Tariffs in general will need to be cut from around 24% to 9% by 2005.
Table 5.4 shows examples of large reductions that China has been making in complying
with its WTO obligations. The rate shown for MFN34 is the rate that will apply to
member countries of the WTO; the general duty rate applies to all other countries with
33 China will likely be the world’s leading steel importer by the end of 2003 with imports exceeding 31million tonnes (CEIS 1118 2003, art.34).

159
the exception of those included in the Bangkok Agreement. For a comprehensive list of
tariffs reductions that relate to iron and steel products, refer to Appendix 9.17.
Table 5.4: Examples of Tariff Reductions35 Following China’s Joining the WTO
Import Duty Rate Tariff Number Description of Goods M.F.N % Gen. %
8702.1093 With 10 seats or more, but not exceeding19 seats 40 230
8703.2339 a cylinder of capacity exceeding 3000 cc:
38.2 270
8703.2430 Saloon cars 43 270
Data source: The Customs General Administration of the P.R.C (cited in CEIS 0403 2003, art.022)
8519.1000 Coin-or disc-operated record player 30 130
8519.2100 Other record players without loudspeaker
30 130
8519.3100 Turntables (record decks with automatic record
30 130
8520.3210 Digital audio Cassette-type 30 130 Data source: The Customs General Administration of the P.R.C (cited in CEIS 0331 2003, item
10, art.032)
Excess global capacity in the steel industry has led to steel producing countries seeking
protection. In the long run, reduction in global capacity is required if it is to move
towards economic efficiency. Unfortunately, market forces will cause less efficient
steel producers to either merge or go out of business. Even while faced with global
excess capacity, China forges ahead and increases capacity.
34 MFN refers to Most Favoured Nation. 35 These tariff reductions took effect on 1st January, 2003.

160
This in turn puts more pressure on other countries. Although China is consuming the
majority of the steel that is produced domestically, the country actually will still become
the world’s largest steel importer in 2003. The country’s increasing capacity reduces
the need for dependence on other countries and enables resources to be employed
locally to produce the nation’s steel demands. In China’s situation, without a strong
steel industry, the country could not have afforded to import all the iron and steel
required to enable its industrialisation and modernisation programme. China’s steel
production ability when it focuses on the international market for its sales will put even
greater pressure on those other countries whose industries are not as competitive as
China’s.
According to Jonquieres (2002), governments of steel producing nations belonging to
member countries of the Organisation for Economic Co-operation and Development
and seven other countries including China agreed to accelerate closure of surplus steel
capacity by 140 million tonnes by 2005 and at the same time would work together to cut
subsidies that are distorting international steel trade. Government subsidies such as tax
breaks and low interest loans have added to an excess capacity of about 200 million
tonnes (Bloomberg, cited in Today, Business News 2003, p.12).
Interest in regional free trade agreements (FTAs) is increasing, especially in the Asia-
Pacific region. In the absence of a new round of negotiations in the World Trade
Organisation, this trend is likely to continue. Free trade agreements can be an effective
means for dealing with some of the challenges of globalisation, as they offer a vehicle
for promoting closer regional ties and greater trade liberalisation. In November 2002,
the Association of South East Asia Nations signed an agreement for member countries

161
to work towards a free trade agreement by 2010. According to Wright (2002), as a
result of the increased competition, backlash towards an agreement with China is
growing within the ASEAN member countries. The Trade Ministry in Indonesia is
considering talks of tariff increases on China’s competitive garment trade. This appears
to be more evidence of a trend towards “China bashing” where it seems China trade is
criticised for being competitive. The USA tried the same in relation to steel. This is
occurring at a time when China is complying with its commitment to the WTO to
reduce its own tariffs, promoting free trade and actually setting up free trade agreements
in the region. Mihui (2002) reports that Korea’s Ministry of Agriculture and Forestry
and Ministry of Commerce, Industry & Energy are examining the feasibility of a free
trade agreement between China and Korea.
Tadao Chino, the Asian Development Bank’s president (cited in Luce 2002) supports
Jiang Zemin’s proposal to create a free trade area between the Association of Southeast
Asian Nations (ASEAN) and China. This would help reduce China’s dependence on
the USA market for its trade. This initiative was subsequently progressed and the 10
ASEAN members have agreed with Beijing on a long list of agricultural products on
which tariffs will be reduced from 1st January 2004, with the newer members
(Cambodia, Laos, Myanmar and Vietnam) having an extra three to four years to reform
tariff rates (Wain 2002).
The most significant trade agreement milestones for China have been with the European
Union and the USA. Features of China’s agreement with the European Union are:

162
• China ceasing to apply a number of measures that distort trade and have
macroeconomic effects, including export performance, local content
requirements, and industrial export subsidies
• China's government procurement system will become more transparent, and will
not discriminate between foreign bidders
• The approval thresholds of provincial authorities in some manufacturing sectors
will be raised from US$30million to US$150million
• Reduced import tariffs on over 150 leading European exports (South China
Morning Post, 23 May 2000).
Features of the negotiations with USA are:
• China reducing tariffs on automobiles from between 80 and 100 per cent to 25
per cent by 2006. Automobile spare parts tariffs cut to an average of 10 % by
mid-2006
• WTO rules bar quotas and other restrictions. China has agreed to eliminate these
restrictions over a five-year period
• Auto quotas will be phased out by 2005. In the interim, the base-level quota will
be US$6 billion (the level prior to China's automobile industrial policy)
• Trading rights and distribution services to be progressively phased in over three
years. China will also open up sectors related to distribution services (Laprès
2000).
Multilateral negotiations offer the best way to achieve market access gains and secure
more favourable trading conditions for exporters, which in turn can lead to economic
benefits for participating countries. A range of factors motivates FTAs, including:

163
• A desire by countries to gain maximum short-term trading advantages in
advance of a WTO round
• An attempt to capture strategic advantages from establishing closer links
between particular countries and
• An interest to trial liberalisation in a smaller, less threatening environment than
the multilateral one.
According to the WTO (2003, p.10), removal of trade barriers could result in welfare
gains of between US$250 to US$620 billion.
As a result of Japanese and Korean steel producers allegedly dumping36 steel products
onto the Chinese market, the Ministry of Foreign Trade and Economic Co-operation
(MOFTEC) announced its final verdict on its anti-dumping case against Japanese and
South Korean cold-rolled stainless steel sheet. The anti-dumping tariffs will be
effective for five years from April 13, 2000, when the ministry made its initial judgment
on the case, according to a press release from MOFTEC. These details are shown in
Table 5.5.
36 This is selling products into a market at subsidised prices.

164
Table 5.5: Anti-dumping Tariffs applying to Japanese and Korean Companies
Company Anti-dumping tariff
Japanese companies
Nippon Steel Co., Ltd 24%
Nippon Metal Industry Co., Ltd 26%
Nisshin Steel Co., Ltd 17%
Sumitomo Metal Industries, Ltd 26%
Yakin Kogyo Co 27%
Nippon Kinzokuco Ltd 58%
Takasago Tekkok. K 58%
NAS Stainless Steel Strip MFG
Co., Ltd
58%
Other Japanese Companies 58%
South Korean companies 57%
Data source: China Metal Market Iron & Steel Monthly, 15 January 2001, p.10
This is a strategic measure by the Chinese government aimed at ensuring China’s steel
producers do not suffer as a result of Japanese and Korean subsidised steel being sold in
the country. As China is not a major exporter of steel, it will not suffer retaliatory
tariffs being imposed on its steel products. It is a move that ensures domestic demand
for steel in China is satisfied by domestic production.
In response to the USA introducing tariffs on steel imports, China’s Foreign Trade &
Economic Cooperation Ministry imposed “Safeguard Measure” tariffs on five types of
steel imports for the next 3 years (MOFTEC 2002). These commenced on 20

165
November 2002 and will continue in place until 23 May 2005. According to Delaney
(2003), China’s response measures helped Baoshan Steel by contributing to an
increased profit of 1.7 billion yuan and at the same time keeping out competitive
imports giving Baoshan time to upgrade its production facilities. However, China’s
increased tariffs were not welcomed by all of Chinese industry, which complained that
the protective measures were causing many of their manufactured goods to increase in
price. Consequently, in China like other countries governments introducing measures
to help their steel industry leads to increases in raw material costs for other
manufacturers. These measures help one sector, but hurt others and in the longer term
fail. The Chinese government subsequently introduced substantial exemptions to these
safeguard measures (Kynge 2003a, p7).
5.5 World Trade Organisation (WTO) Entry
Following World War Two, the concept of global trading emerged when the General
Agreement on Tariffs and Trade (GATT) was established. After the Uruguay Round
negotiations, GATT was replaced by the World Trade Organisation (WTO) on 1
January 1995. At this time, membership was 128 countries (the 128 countries that had
signed GATT by 1994 2003) and as of 4 April 2003, this has subsequently grown in
strength to 146 countries (Understanding the WTO: The Organisation – Members and
Observers 2003). Now one of the world’s largest and most diversified markets, China,
became a member of WTO after a Ministerial meeting in Qatar in November 2001.
To gain entry to the WTO, China had to clear many obstacles. The country had to
negotiate bilateral agreements with a total of 37 WTO members and still needs to
complete negotiations with: Costa Rica, Ecuador, Guatemala, Mexico, and Switzerland.

166
It also still has to finalise the Protocol of Accession (POA) package with the WTO
working party. This package includes the final, legally binding terms and conditions of
China's membership. Members of the WTO need to grant fellow members a “most-
favoured-nation” (MFN) status. This means they must provide all members with the
same favourable trade privileges. In the USA, this is referred to as Permanent Normal
Trade Relations (PNTR). Trade between member countries requires China to reduce
trade barriers. For example, tariffs will need to be cut from around 24% to 9% by 2005.
This research found that China was in the process of complying with its WTO
obligations.
Effect on metal demand
Chinese officials expect more foreign investment in China together with more joint
ventures. There are two reasons for this, because of the size of the market for goods and
services and to tap into the low cost of labour and other factor inputs of manufacturing.
Chandler (2001) suggested the rates of increase of foreign investments seen in 2001
have the potential to add a full percentage point to China's annual economic growth.
This increased foreign investment drives economic activity, creates more jobs and this
gives people more money to either spend or invest. In a country that has had limited
access to luxury goods, increased economic activity and money supply increases
demand for houses and goods, both of which require large amounts of steel. As long as
a nation has steel productive capacity in place, it does not have to damage its balance of
payments by having to import expensive steel for manufacture or construction. Having
steel productive capacity also means that China can add value to the basic inputs and
also export these goods to other countries and generate national income.

167
It is generally believed that as foreign investment increases in China, both technical and
managerial expertise will go to there. This occurs as companies send their professional
staff to the country to manage their investments. It leads to transfer of knowledge and
skills to local staff, which in turn leads to more efficient use of China’s economic
resources. Through increased exports of value adding goods, a more efficient China
also stimulates internal demand.
The ABARE (2002c) reports that membership of WTO will give China greater access to
foreign capital and technology, which as outlined above will modernise its industrial
capacity and enhance its competitive position even further. This together with removal
of trade barriers as prescribed by the WTO will help China, particularly since it is so
competitive with its lower labour costs. This is very positive for the nation’s iron and
steel industry which the government put solidly in place to industrialise and modernise
the nation and should help ensure its economic growth and integrity can be sustained.
Effect on the Economy
According to the Zhu Qiwen (cited in China Business Weekly 2001), “the proven
willingness of the Chinese authorities to incur substantial short-term economic costs in
the pursuit of long-term economic gains is a measure of the depth of their commitment
to reform and opening up.” China’s Premier, Zhu Rongji (quoted in China Business
Daily Update, 4 July 2001) forecasts that the economy would grow by seven percent a
year between 2001 and 2005 and would double in size from US$1.08 trillion in 2000.
He made it clear his Government recognises the challenge facing China due to the
competitive threat from entry to the WTO. His views support earlier comments by the

168
Chinese President Jiang Zemin that globalisation was a "two-edged sword", and "to a
developing country, it holds opportunity as well as risk" (Reuters 2001a).
Zhao Jinping (China Daily 20 July 2001) states that sustainable economic development
will demand more foreign capital and to maintain the planned 7-8 per cent growth rate
during the 10th Five-Year Plan (2001-2005), China will need to absorb around US$250
billion of foreign investment. According to Hu Zuliu (2000), China’s entry to the WTO
would raise annual foreign direct investment (FDI) inflows to US$100 billion by 2005
and add half a percentage point to the annual gross domestic product growth rate.
The Asian Development Bank (2001b), reports that as a result of WTO entry and the
associated easing of trade restrictions, imports will continue to grow faster than exports
in the next few years. According to AME Mineral Economics (July 2001), the Chinese
say that WTO entry will boost GDP by 2–3% annually, translating into five million jobs
for each percentage point. The US International Trade Commission estimates that the
Chinese economy would expand by 4% as a result of WTO membership. This would
flow from efficiency gains from freeing up foreign investment. China’s entry to the
WTO is causing concern to other Asian economies. In relation to heavy industries such
as the petrochemicals, shipbuilding, and automobile industries, China has the potential
to equal the Republic of Korea within the next decade. In terms of efficiency
improvements, we are already seeing:
• A reorganised domestic shipbuilding industry
• Formation of strategic alliances between the Baoshan, Shoudou and Wuhan
Steel Corporations (Yoo 2001).

169
While the Chinese Government continues to drive these efficiency improvements, the
rest of Asia will be watching carefully.
Lardy (2002) points out that China made service level commitments that other countries
will use to limit Chinese imports. An example of these commitments is the transitional
product safeguard clause, which will be in place until 2013. This enables member
countries to limit imports, a safeguard to allow member countries to impose quotas on
imported Chinese clothing until end of 2008 and discriminatory WTO terms in relation
to anti-dumping cases. According to Wu Jianzhong (cited in Hsieh 2002, p.A3), local
governments in China are liberalising much faster than required under the WTO
Agreement – not taking advantage of a 3 year grace period after which time, foreign
companies should have a more “level playing field”. There is also concern that China
with its large and growing production capacity entering the WTO together with world
trade barriers being removed and the world’s excess production capacity will add
further pressure to the deflationary conditions, which are emerging globally (Pfanner
2002). This deflationary pressure may in turn impact on world commodity prices, as
outlined in the section on money supply, which examined the effects of China’s money
supply increasing. This showed how deflationary pressure is lowered as increasing
money supply causes inflationary pressures. Although, the lower costs of Chinese
manufactured goods when exported are still causing deflation fears in other countries.
The WTO is to eliminate tariffs and level the playing field for international trade, but it
will not get involved in many of the issues that are troubling China such as currency and
non-performing loans, so its impact will be limited to tariff related issues which in many
ways will tend to help China more than it may harm it.

170
5.6 Foreign Trade Policy
According to the China Metal Market Iron and Steel Monthly (16 October, 2000, p.1),
the Chinese government plans to make changes to the trading policies for steel after
entry into the WTO. Currently, foreign trade policies support export and at the same
time encourage minimising imports. The policies affected are: setting limits to the
imports of steel products and appointing a certain enterprises to trade steel. These
methods should enable China to better manage and control steel trade in the future.
In what appears to be an attempt at addressing Japan’s iron and steel industry’s
competitive position, which has been losing ground to China, Japanese trading
companies, Itochu Corporation and Marubeni Corporation are in the final stages of
negotiations to integrate their steel divisions to boost competitiveness. In addition, the
Metal Bulletin (29 January 2001) reports Japanese steel traders Mitsubishi Corporation
and Nissho Iwai announced that, after nearly a year of discussions, they have decided to
formally begin investigating the feasibility of an across-the-board consolidation of their
domestic and overseas steel trading divisions. When finalised, this would create the
largest steel trading firm in Japan and among the largest in the world. It would create a
company controlling 30% of Japan's domestic steel trading business and 19% of all
exports (Agence France-Presse, cited in Dow Jones, 19 October 2000). According to
Dow Jones Newswires (2001), Sumitomo is reported to be considering tie-ups with
Nippon Steel which had already announced a similar alliance with Kobe Steel and
Kawasaki Steel Corporation is planning an alliance with NKK Corporation.
Matthews (2002) reports due to the increased demand for steel, China’s steelmakers
have had to form foreign partnerships. For example, Thyssen Krupp AG of Germany

171
and Anshan Steel & Iron Company are forming a galvanised sheet steel joint venture for
automobiles. Honda of Japan is one of the first foreign companies to be granted
permission to control an automotive joint venture with several China automotive
companies. According to Dow Jones, the venture is worth US$193 million and is
scheduled to start production in 2004 (cited in the Asian Wall Street Journal, 2002,
p.M2). The booming steel market in China is attracting major European steel
companies. Thyssen Krupp (Germany) is planning to invest US$141 million over two
years on processing plants to produce steel for the automobile industry and Arcelor
(Luxembourg) will be spending US$118 million in a joint venture in Shanghai with
Baosteel and Nippon Steel (Marsh 2003b, p.16). These trends are important findings in
that they are suggesting a relocation of potential steel production from Europe to China.
This is positive for Australian iron ore producers who are considering major capital
expansions and for China in that it improves China’s ability to produce flat sheet
products for the value adding manufacturing sector.
Rather than incur high shipping transport costs for the iron ore then to transport steel to
international markets, we are likely to see China investing more overseas. Baosteel has
already begun this by doing a feasibility study for a 3.5 million tonne per year slab mill
with Brazil’s large iron ore supplier CVRD. The iron ore would come from CVRD’s
Carajas mine and Baosteel would export the steel slabs (CRU 2003b, p.10).
5.6.1 Foreign Investment in China
The Chinese government is aware of the importance of the need for increased foreign
investment in order to sustain economic development while at the same time, inefficient
state owned enterprises (SOEs) are being restructured and many Chinese workers are
being made redundant. Chart 5.5, gives foreign investment in China from 1988 through

172
to 2002. This shows rapid increase in the early 1990s with lower rate of increase
through the rest of the 1990s, the Asian economic crisis in the latter part of 1990s
causing lower investment, with increases returning in 2000 and continuing.
Chart 5.5: Foreign Investment in China, 1988-2002
Data source: Asian Development Bank – Regional tables
According to the Governor of China’s Central Bank, Dai Xianglong (cited in Business
Week 2001) US$45 billion per year of foreign investment is expected for the next five
years. With the interest foreign companies have to increase their presence in China,
foreign investment should exceed the Governor’s expectations. This is good news for
steel demand and China’s continuing sound economic performance.
Analysts estimate foreign investment in China could accelerate sharply to between
US$60 billion and US$65 billion in 2005 from around the 2001 value of just over
US$50 billion. Some of this is likely to come at the expense of potential investment in
the rest of the Asian region (China Securities Bulletin 2001). The importance of foreign
$0
$10,000
$20,000
$30,000
$40,000
$50,000
$60,000
1988 1989 1990 1991 1992 1993 1994 1995 1996 1997 1998 1999 2000 2001 2002
Mill
ion
US
$
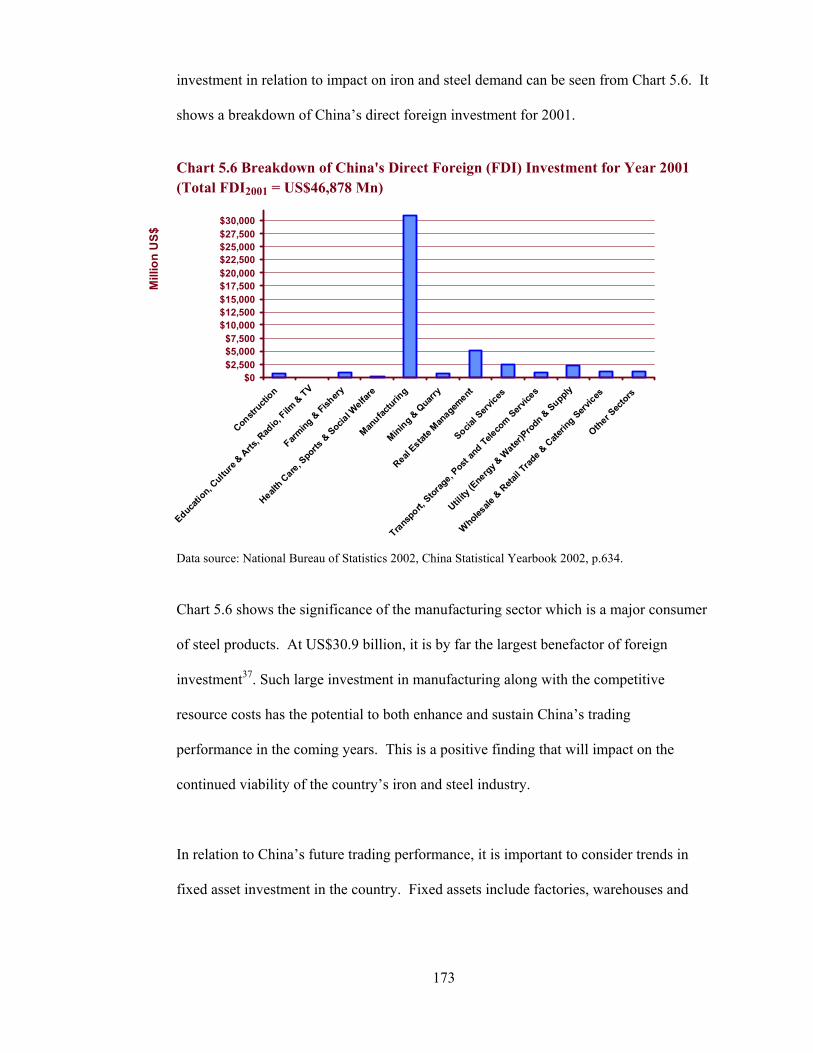
173
investment in relation to impact on iron and steel demand can be seen from Chart 5.6. It
shows a breakdown of China’s direct foreign investment for 2001.
Chart 5.6 Breakdown of China's Direct Foreign (FDI) Investment for Year 2001
(Total FDI2001 = US$46,878 Mn) Data source: National Bureau of Statistics 2002, China Statistical Yearbook 2002, p.634.
Chart 5.6 shows the significance of the manufacturing sector which is a major consumer
of steel products. At US$30.9 billion, it is by far the largest benefactor of foreign
investment37. Such large investment in manufacturing along with the competitive
resource costs has the potential to both enhance and sustain China’s trading
performance in the coming years. This is a positive finding that will impact on the
continued viability of the country’s iron and steel industry.
In relation to China’s future trading performance, it is important to consider trends in
fixed asset investment in the country. Fixed assets include factories, warehouses and
$0$2,500$5,000$7,500
$10,000$12,500$15,000$17,500$20,000$22,500$25,000$27,500$30,000
Constr
uction
Educa
tion,
Culture
& Arts
, Rad
io, Film
& TV
Farm
ing &
Fishery
Healt
h Care
, Spo
rts &
Social W
elfare
Man
ufacturin
g
Mini
ng & Q
uarry
Real
Estate M
anag
ement
Socia
l Serv
ices
Trans
port, Stor
age, P
ost a
nd Tele
com S
ervice
s
Utili
ty (E
nerg
y & W
ater)P
rodn &
Supply
Whole
sale &
Reta
il Trad
e & C
aterin
g Services
Other S
ector
s
Mill
ion
US$

174
shipbuilding yards. This type of investment will give an idea of the value adding
potential that results from asset investment and expenditures - as long as the fixed assets
are indeed value adding. Chart 5.7, shows fixed asset investment for 1981-2001.
Between 1981 and 1991, fixed asset investments grow from US$55 billion to US$103
billion averaging a modest US$4.8 billion per year growth. As China’s economy
started to rapidly develop, fixed asset investment grew from US$103 billion in 1991 to
US$449.6 billion in 2001, this averages US$34.7 billion per year growth.
The China Economic Information Service (CEIS 0306 2003 art.032) reports that the
value of foreign funds used in fixed asset investment was 140.6 billion yuan in the first
11 months of 2002, rising 23 percent year-on-year, of which 96.0 billion yuan was
foreign direct foreign investment, up 35.2 percent. China's total investment in fixed
assets is estimated to exceed 4,000 billion yuan, an increase of more than 16 percent
year-on-year, which is a record high since 1996. Further details of the CEIS report is
in Appendix 9.13.
37 In 1999, it was US$22.6 billion and in 2000 it was US$ 25.8 billion (National Bureau of Statistics, 2001, 2002, p.634).

175
Chart 5.7: Total Fixed Asset investment in China, 1981-2001
Data sources: Data up to 2000 – National Bureau of Statistics 2001, China Statistical Yearbook
2001 and 2001 data - China Statistical Yearbook 2002, p.176.
What was the level of foreign investment during this large annual average increase of
US$33 billion per year growth in fixed asset investment? Chart 5.8 shows the value of
foreign funds used in China’s total fixed asset investment since 1981. After 1996,
foreign investment in fixed assets actually started to drop. This would have been as a
result of the slower world economic activity following the Asian economic crisis. At
that time, China would have been self-funding its increased expenditure on fixed assets.
A modest increase occurred between 2000 and 2001.
0
50
100
150
200
250
300
350
400
450
500
1981 1982 1983 1984 1985 1986 1987 1988 1989 1990 1991 1992 1993 1994 1995 1996 1997 1998 1999 2000 2001
Bill
ion
US$

176
Chart 5.8: Foreign Funds used for Fixed Asset Investment in China, 1981-2001
Data sources: Data up to 2000, China Statistical Yearbook 2001,
2001 data - China Statistical Yearbook 2002, p177
According to UNCTAD’s 38 World Investment Report 2002 (Sept, 2002), between 2000
and 2001, global foreign direct investment (FDI) inflows declined 51% from
US$1,491,934 million to US$735,146 and FDI outflows declined 55% from
US$1,379,493 million to US$620,713. At the same time, China’s FDI inflows
increased 15% from US$40,722 million to US$46,846 million and its outflows
increased 94% from US$916 million to US$1,775million. Further declines in World
FDI are being forecast for 2002. Table 5.6, compares the changes in global versus
China’s FDI from 1980 through 2001.
38 United Nations Conference on Trade and Development. Established in 1964, UNCTAD aims at the development and friendly integration of developing countries into the world economy.
0
5,000
10,000
15,000
20,000
25,000
30,000
35,000
1981
1982
1983
1984
1985
1986
1987
1988
1989
1990
1991
1992
1993
1994
1995
1996
1997
1998
1999
2000
2001
Mill
ion
US$

177
Table 5.6: Comparison of the World and China Foreign Direct Investment Inflows, 1980-2001
US$ million 1980 1985 1990 1995 2000 2001
World 54,945 57,596 202,782 330,516 1,491,934 735,146
China 57 1,659 3,487 35,849 40,772 46,846
% World 0.104% 2.88% 1.72% 10.85% 2.73% 6.37%
Data source: UNCTAD, 2002
The increasing FDI funds into China, at a time of slower global economic activity, are
being driven by China’s economic reform which has been further enhanced by China’s
entry to the WTO. China’s gain is at the expense (and of much concern) of its Asian
neighbours. Between 2000 and 2001, FDI inflows for Hong Kong, Malaysia and
Republic of Korea reduced from US$61,938 million to US$22,834, US$3,788 to
US$554, and US$9,283 to US$3,198 respectively (UNCTAD 2002). The increasing
foreign investment together with China’s increased trade performance is enabling its
merchandised exports to become more diverse. We have discussed earlier even with its
steel industry growing and contributing to its GDP, the significance of steel production
on GDP has in fact decreased. This supports the maturing of China’s industrial sector –
further evidence of the country’s trade diversity is apparent in the section on Australian
trade, where large trade exports of clothes and toys occurred. According to The Bank
of China, FDI is boosting productivity by 4% annually (cited in Clifford 2002, p.25).
Chart 5.9 shows how industrial activity, which includes mining, manufacturing and
public utilities, has increased compared to the other major sectors agriculture and the
public service. Foreign direct investment into China is having very little impact on
agriculture as it is mostly going directly to industrial productivity. Actual steel

178
production has lowered relative to GDP, but industrial activity has increased from 53%
in the early 1980’s to over 65% in 2002 (see Chart 3.11). Industrial activity is a major
consumer of steel, mainly in the form of sheets, tubes and plates. The Chinese steel
industry is still not meeting this demand in full as it does not have the capacity to
produce the range of sheet products required in manufacture, hence the reason for China
still being a large importer of these products. The industry sector is rapidly building
and commissioning steel processing plant capable of supplying the needs of the entire
industrial sector. This will be essential for the industry as it moves away from
government driven infrastructure steel demand to demand driven by foreign investment
in the manufacturing sectors. The section on increased automobile production and steel
demand is a good example where foreign investment is driving manufacturing in China.
Chart 5.9: Significance of Industrial Activity, 1981-2002
Data sources: Asian Development Bank, 2000, 2001, 2002 and 2003
It can be seen that large foreign investment funds are flowing into China, but are funds
flowing out? China has not traditionally invested overseas; those of Chinese origin
$0
$100
$200
$300
$400
$500
$600
$700
$800
$900
1981
1982
1983
1984
1985
1986
1987
1988
1989
1990
1991
1992
1993
1994
1995
1996
1997
1998
1999
2000
2001
2002
billi
on U
S$
Value of AgricultureTotal Industrial activ ityValue of finance, Pub admin & others

179
living in Hong Kong, Taiwan and many parts of the world have mainly done this. Table
5.7 compares foreign direct investment outflows from China to the rest of the world
between 1980 and 2001.
Table 5.7: Comparison of the World and China Foreign Direct Investment Outflows, 1980-2001
US$ million 1980 1985 1990 1995 2000 2001
World 53,674 62,163 233,315 356,404 1,379,493 620,713
China - 629 830 2,000 916 1,775
% World - 1.01% 0.356% 0.561% 0.066% 0.286%
Data source: UNCTAD, 2002
As China’s economy improves, the country is investing more in overseas projects.
Table 5.7 shows periods of higher investment outflows occurring in 1985 and 1995. An
increase for 2001 occurred and with the country keen to secure access to overseas raw
materials for example, iron ore, it is highly likely that increased investment outflows
will occur for the next few years. This will be necessary to sustain the iron and steel
industry’s viability. If China does not invest in securing future supplies, this means that
they will have less control over material price and commercial conditions. Then as
other countries in the region develop their steel industry, this will put upward pressure
on raw material prices which will make it difficult for China to achieve an adequate
share of steel exports. A large share of global export market is necessary if China’s
steel industry is to be sustained after the end of this decade when infrastructure
development will slow down. This is an important finding. Balfour (2002) estimates
that Chinese companies will spend around US$2.4 billion in overseas investments in
2002 and according to the Ministry of Foreign Trade and Economic Cooperation

180
(MOFTEC) (cited in CEIS 0218 2003), by the end of 2002, 6,960 Chinese-funded firms
had been officially established outside China and that over 160 countries and regions
received investment from China, involving contracted funds of US$9.34 billion. Some
examples of recent Chinese overseas resource related investments are shown in Table
5.8.
Table 5.8: Examples of Chinese Foreign Investment Overseas
Chinese Company Foreign company Details Value
(US$) China National Offshore Oil Corporation British Petroleum 12.5% Share of gas field in
Indonesia 275 million
China National Offshore Oil Corporation WA Government 5% stake in NW Australia 320 million
Sinopec 75% stake in African oil field 394 million
Baosteel Rio Tinto 46% stake in Iron Ore Joint Venture 66 million39
Principal source: Balfour (2002). It can be seen from Table 5.8 that China is becoming serious about energy and raw
material security. Secure access to these resources will be essential for the longer-term
state of the county’s economy.
5.7 Future of China’s Steel Industry
The importance of infrastructure development together with economic reform in driving
developments in the iron and steel industry has been shown. These aspects will
continue to have the biggest impact on iron and steel demand characteristics. This
section examines the outlook for the industry, paying particular attention to reforms and
social changes that are taking place in China. How the industry can sustain its viability
as the country changes is also discussed. This will be useful in helping potential
investors with their trading and investment aspirations.
39 At 1A$ = US$0.55 exchange rate (rate at time deal was signed).

181
5.7.1 Outlook for steel production In 200240, China accounted for 20% of the world steel production. The China
Economic Information Service (CEIS 0825 2003, art.029) reports that by 2005, China’s
production capacity of crude steel is expected to reach 270 million tonnes and exceed
330 million tonnes by 2010. The production capacity of pig iron, crude steel and steel
products of the top 40 large steel enterprises is expected to reach 177 million, 184
million and 184 million tonnes respectively by 2005. Comparing to 2002, this
represents an increase of 42%, 29% and 34% respectively. In relation to the top 40
steel producers, the top 10 would increase capacity by an average of about 24% in the
next three years, while those between 11 to 20th ranking would increase capacity by
68% on average, those between 21 to 30th ranking would increase their capacity by
about 43%. The remaining 10 producers in the top 40 list expect a 75% increase.
According to the survey, several of the major steel firms located in inland areas plan to
relocate their plants to the coastal areas. Foreign investors from overseas, mainly Japan,
Republic of Korea and Germany are involved in many of these expansion projects
(CEIS 0709 2003, art.35).
AME Mineral Economics Steel Outlook (2003) estimates that China’s steel production
will grow to 270 million tonnes by 2005 and then to 330 million tonnes by 2010. Based
on a world production of 1,000 million tonnes, this equates to China having 33% of
world production in 2010.
40 China’s steel output in 2002 was 181.6 million tonnes; world output was 897 million tonnes.

182
As outlined earlier, increased demand for steel from continued infrastructure
development together with foreign investment in industrial activity should continue to
increase demand to around 300 million tonnes, by this time world steel production
should also increase to over 1,000 million tonnes. This suggests that China’s share of
the world market should increase by around 10% to 30%. The International Iron and
Steel Institute, which estimates world steel output growth being 1.7% per year with
China’s growing at 6.7%, supports this. If we extrapolate this through to 2010 we
obtain the values shown in Table 5.9. This is an important finding.
Table 5.9: Forecast World and China Steel Output, 2003-2010.
2002
Actual 2003 2004 2005 2006 2007 2008 2009 2010
World
(million
tonnes)
897 912 928 944 960 976 992 1,009 1,027
China
(million
tonnes)
181.6 194 207 221 235 251 268 286 305
China
as %
world
20% 21% 22% 23% 25% 26% 27% 28% 30%
Data source: China Economic Information Service, (CEIS 0423 2003, art.032)
The IISI forecast in Table 5.9 is supported by the China Iron & Steel Association
(CISA) which forecasts that China will need 313 million tonnes of steel by 2010 and
further outlines how studies show that a country's steel demand is closely related to the
nation's industrialisation level, especially the development of the steel industry (CEIS
0911 2003, art.034). As China sets the goal of achieving industrialisation by 2020, its
steel industry will account for 54.9 percent of the gross domestic product in 2010. The

183
CISA also draws attention to the investment risks faced by China's iron and steel
industry, among which is a lack of iron ore resources. However, CRU International
(CRU 2002a, September, p.2) forecasts lower production tonnages such that by 2012,
world steel production will be 1,059.2 million tonnes and China’s production will only
be 231.4 million tonnes. This represents only 21.8% of the world’s output. The CRU
forecast was made before the large output increases in 2001 and 2002. A probable over
optimistic forecast is an output of 510 million tonnes per annum (China Metals 2003,
p.2) which is based on growth of 21.8% in 2004 and 2005 followed by around 7%
growth between 2006 and 2010. As discussed in Chapter 7, around this time, it is likely
that demand for construction type steel (long products) is likely to reduce. An output of
510 million tonnes would expose the industry to an over capacity situation.
In the long run (beyond 2010), China’s economic efficiency (in relation to steel
production and iron ore consumption) will be improved by continued improved
infrastructure development41. Baoshan steel and Wuhan still need to transport their
imported ore by barge 150 km and 1200 km respectively to their mills after being
offloaded at ports (SBC Warburg 1998, p21). Continued closure of many of the smaller
less efficient steel producers will also enhance efficiency. Demurger et al (2002, p.8) in
their comparison of the topography of the USA and China, outline that although both
countries are similar in size and climate, the USA has coastline on both east and west
whereas, China only has coast on its east. China is also more mountainous and hilly.
These topographical features require China to have a greater need for infrastructure
development to make internal transportation more economical. This is one reason why
in the past economic development has been relatively slow in China.
41 In order to balance raw material input supply and demand, this needs to be well managed.

184
5.7.2 Research, Development and Sustainability A China Iron and Steel Industry Association report says that large and medium-sized
steel enterprises are spending more in environmental protection, technological
renovation and research and development (CEIS 0714 2003, art.34). Zeng Peiyan,
Minister in Charge of the State Development Planning Commission, in his report on
China's national economic and social development plan delivered at the First Session of
the 10th National People's Congress on March 6, 2003 (CEIS 0321 2003, art.052)
outlined “the government would continue to implement the strategy of rejuvenating
China through science, technology and education and strategy of sustainable
development”. A report from the National Statistics Bureau, the Ministry of Science
and Technology and the Ministry of Finance (CEIS 1114 2002) outlines that that annual
expenditure in 2001 on R&D was 104.3 billion yuan. The report states that 68.4 percent
of the research and development money went to the coastal provinces and
municipalities in China, such as Shanghai, Guangdong and Shandong.
Research and development will produce longer-term benefits to industry in that
technological improvements lead to increased factor efficiencies, which in turn helps
reduce marginal costs and maintains a competitive edge in the market place. As a result
of overcapacity in the global iron and steel industry, expenditure on research and
development has generally suffered. China on the other hand has had a large focus on
development. Nevertheless, research has not been high on China steel industry’s
agenda as the country absorbs the knowledge benefits achieved by European steel
companies. In order to sustain leadership in the industry, China could be well rewarded
in its research efforts. How this research is conducted, will determine the value
obtained for the dollars expended. China has traditionally not been a big spender on

185
technical research, relying mainly on its large pool of academics to carry out low cost
academic research in conjunction with foreign institutions of higher learning. Joint
ventures and working closer with Australian and Brazilian iron ore companies will
provide reliable, economic and quality supplies of iron ore. Like Japan did, China
needs to maintain a long term competitive supply market for satisfying the country’s
demand for iron ore.
China’s iron ore is low quality, so the country will need to improve beneficiation
processes or introduce further downstream processing of its own iron ore. This may
involve joint ventures with western companies. In the longer term (or when cost of
importing ore becomes too expensive) it is likely, that China’s iron and steel industry
will move into more beneficiation and downstream processing. This will ensure more
efficient use of its low-grade ore deposits. When international trading conditions lead
to higher iron ore prices, one can expect to see the emergence of several joint ventures
and increased development of facilities for pellet, direct reduced iron (DRI) and hot
briquette iron production (HBI). In 2002, world production of DRI/HBI was 45.08
million tonnes (Midrex 2002) and in 2002, China’s consumption of DRI was 1,298
thousand tonnes (China Specific 2002, p.11), this represented 2.88% of world DRI/HBI
production. Depending on the development of mini steelmills, availability and the price
of scrap (major variables in the use of DRI /HBI products); the next decade should see
China’s consumption of these products increase.
Tindale (1997) suggests the optimum efficiencies will occur in the Chinese steel
industry when excessive investments in overcapacity are addressed and more focus on
quality management and worker expertise is achieved. This will require closing steel

186
producing plants, which are not geographically positioned for ease of access to ports or
at least economic rail transport. Steel plants with lower efficiency usually associated
with older equipment should also be closed. Focus on training of management,
technicians and workers will become more important as China changes its focus from
satisfying domestic demand to exporting. As outlined earlier, entry to the World Trade
Organisation should also drive growth through the reductions in tariffs and trade
barriers.
With continued economic development, how does and how will China compare with the
international competition? Brizendine and Oliver (2001) believe China’s steel industry
is not in good shape with many of the steel producers being inefficient in that they do
not use resources efficiently and that most of them require government protection. This
may be the case for many of the smaller mills, but this is changing. The larger players,
like the Shanghai based Baosteel, where one tonne of steel takes around 5 hours to
produce, have productivity levels comparable to developed nations-generally exceeding
400 tonnes. In order to be among the top 500 multi-national companies in the world by
2005, the Baosteel Corporation is reforming its management system and aims to
develop strong competitive ability in the international market. By 2010, the group
should be operating under a unified system, entering the international capital market
and be in the top three of the world’s steel producers from a competitive outlook (CEIS
0618 2003 art.028).
An example of the restructuring occurring is apparent at the Angang steelworks where
in 1988, over 220,000 people were employed and 8 million tonnes of steel was
produced (Hogan 1999) compared with in 1999 when only 166,735 people were

187
employed (24.2% reduction) and 8.5 million tonnes of steel was produced (6.25%
increase).
5.7.3 Environmental Issues With China’s economy developing and the standard of living for the urban population
improving, people will develop a stronger desire to improving lifestyle. The
environmental burden the current industrialisation boom imposes on the country is
another problem that investors appear not to have fully appreciated. China currently is
the world’s second largest producer of greenhouse gases (United States is the leading
producer) and the International Energy Agency (cited in Bradsher 2003, p.1) predicts
that the “increase in greenhouse gas emissions from 2000 to 2030 in China alone will
nearly equal the increase from the entire industrialised world”. As a developing country
China is exempt from the Kyoto Protocol, but with the government’s increasing desire
to be a modern society open to increased and international events is likely to encourage
the government through the State Environmental Protection Agency to increase its
focus on improving the environment.
China has currently being trialling emissions trading in five provinces and cities and it
looks likely this will be extended in 2005 (Lim 2003). Emission licences are tradeable
instruments that in effect allow factories to buy and sell pollution rights. Trading of
emission licences will impose additional costs on factories, higher costs being
associated with higher levels of pollution. No doubt this will encourage factories to
improve their technology, with resulting environmental improvements and lower
negative externalities. This will certainly improve living standards and reduce
respiratory related illnesses, but this will lower the comparative advantage that helped
188
China’s steel industry become a world leader – this will tilt the playing fields in the
favour of those developing nations, like India that wish to emulate China’s economic
development using the steel industry model. Nonetheless, it will be necessary for China
to do this in order to reduce its contribution to global warming and improve living
standards and quality of life.
5.7.4 China’s Economic Development As the global economy slowed down from the latter half of 1990s, China has been one
of the few countries to continue achieving a healthy annual GDP growth of around 7%
per year. Its economy together with trading ability has came a long way from the
economic woes following the birth of the republic in 1949 and very poor economic
performance during Mao’s early ruling years up to the early 1970s.
There has been much discussion about the accuracy of GDP and growth figures coming
out of China. Richardson (2001, p.M1) confirms that the Chinese authorities even
admit to there being some flaws in their numbers. Her article quotes analysts reporting
numbers around 2% lower than published. Hong Kong analyst, Pu Yonghao (cited in
The Economist, 16 March, 2002, p.35) believes that they are actually accurate. It seems
many of the provinces understate the numbers rather than overstate to ensure that higher
taxes are not imposed on them and so that they can continue to receive Central
Government support for local projects. Hence, this would suggest that there is no
reason to expect that the Central Government quoted figures are too high. A team at
Goldman, Sachs & Co (cited in Clifford 2003) examined the statistics and found that
some were actually higher than reported and that some were marginally lower. In any
event, as is done for other countries, one needs to focus more on trends rather than

189
specifics. This approach will yield adequate indicators, which should help support
sound judgements in relation to economic assessments to be made. Leow (2002),
reports that the Chinese government is adopting improved methods of gathering and
reporting economic statistics. This will bring their reporting in line with international
practice and should improve accuracy.
At one stage, many of the large developed countries have experienced high growth
along with their iron and steel industries. The global and China’s iron and steel
industries were looked at in earlier chapters and the extent of the output and impact on
the economy was shown. Clearly, China’s economy and its iron and steel industry
performance will continue to have a symbiotic relationship. This relationship should be
maintained long after China’s demand for steel drops off and the country looks to
international trade to support its major industries.
We have seen constant increase in China’s GDP and improvements in international
trade notwithstanding minor stalls between 1994 and 1998 and this is shown in Chart
5.2 (China's International Trade as % GDP, 1981 – 2002). Chart 5.10 shows the rate of
change of China’s GDP from 1953 through to 2002 and it can be seen that the rate of
growth of GDP has not been constant and in fact, years having high growth have been
followed by periods of low growth. The highest rate of growth was found to be in 1994,
from which time the trend has been lower. The occurrence of this trend during a period
of huge infrastructure development activity and with the build up to the 2008 Beijing
Olympics suggests that post 2008 could see a contraction of China’s economy – this
would have the effect of reducing demand for steel.

190
Chart 5.10: Rate of Change of China’s GDP, 1953-2002
Data sources: Chinese Statistics Yearbook 2001 and Asian Development Bank (calculated from
data extracted from these sources)
Countries and organisations wishing to successfully trade with China need to be aware
of this. It is also important they understand both the culture and the economic
development (both historically and future prediction). This will help them develop
appropriate models and strategies to improve the likelihood of success – where many
have failed and never understood why.
-20
-10
0
10
20
30
40
1953
1955
1957
1959
1961
1963
1965
1967
1969
1971
1973
1975
1977
1979
1981
1983
1985
1987
1989
1991
1993
1995
1997
1999
2001
Rat
e of
Cha
nge
of G
DP
(%)
2002

191
5.8 Structural Weaknesses in Economy
As China’s iron and steel industry continues to increase output, drive industrial
production and contributes to the country’s economic development, it is important to
examine structural weaknesses that exist in the country’s economy. These weaknesses
have the potential to derail the current performance of the iron and steel industry and
the economy it is playing a major role in driving. By examining and drawing attention
to these weaknesses, it increases the chance of mitigating the downside risks that they
expose the country to. The structural weaknesses that have been identified are China’s
currency, level of debt and unemployment.
5.8.1 China’s Currency
During the Asian economic crisis, western economists were advising China to devalue
its currency. At that time, it was not considered appropriate by China to vary its
exchange rate policy and that it would remain pegged to the US dollar. The Chinese
government believed at the time, it would be better for Asia if it was not devalued, but
instead shown to be stable and predictable. On reflection, China made the correct
decision. Then as China’s trade performance improved relative to other countries,
many western economists demanded an appreciation of its currency. This was
considered desirable in order to reduce China’s level of competitiveness and increase
the cost of the country’s exports, at the same time decrease import costs. Subsequently,
since the current global economic downturn and in particular the Japanese yen’s fall in
value during the latter part of 1990s, 2001 and 2002 the debate turned back to
devaluation. Then from early in 2003, the US dollar significantly depreciated against
most currencies and the pressure was on again for China to appreciate its currency.

192
This time the USA took a more serious view and has been putting pressure on the
Central Government to float the currency. So, what is the outlook for China’s currency
and what impact could it have on the iron and steel industry and the economy in general?
China’s consistent good economic performance is shown by its gross domestic product
growth of around 7% during 2000, 2001 and 2002. China’s neighbours and trading
partners are in agreement that China’s currency should be floated and its resulting value
is expected to significantly increase. China’s trading performance could be
significantly affected by changes to its currency. A higher valued yuan would make
imports cheaper and exports more expensive. The Chinese government does not want
this to happen. With minimal international debt, growing markets and increasing
unemployment, China will continue to strongly resist changing its exchange rate policy.
Tett and Kynge (2001, p.9) report that Japanese politicians believe the undervalued
Chinese currency is hurting Japan’s economic future and urgently needs addressing.
Japan and other Asian countries would like China to revalue, so as to reduce the
competitiveness of its exports. The yuan has remained around 8.3 to the US dollar for
eight years. "In that time, the currency has had a de facto appreciation of about 40 per
cent against the dollar and 26 per cent against other currencies. Following entry to the
World Trade Organisation, the trade surplus is expected to fall, putting downward
pressure on the yuan" (O’Neill 21 Nov 2001b). This reduction of the trade surplus only
occurred during occasional months due to spikes in oil prices during the Iraq war. Guo
Shuqing, the deputy governor of the People's Bank of China and director of the State
Administration of Foreign Exchange, acknowledged that the yuan was likely to
appreciate over the longer term (Reuters 2001b). O’Neill (2001c) reports that an

193
appreciated yuan, at about 7.25-7.5 to the dollar, would reduce the yuan value of
China's foreign debt of US$150 billion and reduce United States’ concerns resulting
from many years of high trade surpluses. Guo Shuqing denied that China has been
under any pressure from the United States to revalue its currency42. Around October
2001, the black market value of the Yuan rose to 8.25 to the dollar, against an official
rate of 8.29. Chart 5.11 illustrates exchange rate trends for US, Singapore and
Australian dollars against the yuan.
Chart 5.11: China's Exchange Rate, 1981-1982
Data sources: USD to yuan - Asian Development Bank
Sing$ and Aus$ to yuan – OANDA (website http://www.oanda.com/convert/fxhistory, viewed 8 August 2003).
It was expected that China would buy more Euro currency. The Head of China’s State
Administration of Foreign Exchange said (Guo Shuqing, November 2001) that China
has been buying Euros and will buy more in the future. According to Kynge (2002a,
p.2) China welcomed the introduction of the Euro as it would dilute the dominance of
42 During mid 2003 John Snow, the USA treasurer was publicly pressuring China to float its currency.
0
1
2
3
4
5
6
7
8
9
10
1981
1982
1983
1984
1985
1986
1987
1988
1989
1990
1991
1992
1993
1994
1995
1996
1997
1998
1999
2000
2001
2002
yuan
per
cur
renc
y un
it
Avg yearly Exch rate USD-Yuan
Avg yearly Exch rate Sing Dollar-Yuan
Avg yearly Exch rate Aus Dollar-Yuan

194
the US dollar and he reports that the Chinese Xinhua News stated: “the costs of
transnational trade will be lowered” with the subsequent devaluation of the USD. China
spreading its foreign exchange reserve exposure from mainly US dollar to Euros during
the latter part of 2002 has subsequently proven to be a very timely move.43
The Chinese authorities’ desire to maintain monetary stability of the currency should
ensure controls will continue until 2006 (Chiu, 2002). Currency controls are considered
to be effective in preventing large outflows of capital. With free-floating currencies,
foreign exchange traders can cause large outflows of currency. This occurred during
the Asian financial crisis and has been blamed for making the crisis worse than it should
have been. It appears a major concern of the Chinese authorities is that if the yuan
appreciated by a large margin, the Chinese economy would suffer much as Japan's did,
and fall into recession.
Since 1994 (refer to Chart 5.1), China has been running up a healthy trade surplus. A
significant amount of the country’s imports are value adding rather than per capita
consumption – this leads to the country collecting significant foreign reserves, which
Samuelson (2002) suggests should be used to stimulate global trade. By revaluing its
currency, the surplus would diminish and other countries would benefit. However, this
is not China’s principle concern at the moment - while it tackles unemployment and
structural reform. In fact, according to Clifford (2002), some analysts believe that due
to the bad loan44 problems China’s banks have; the currency will be devalued rather
than appreciate. The weakness with China’s non-performing loans is examined in
section 5.8.2.
43 USD against the Euro depreciated around 10% since China’s purchases.

195
China is increasingly coming under pressure for exporting deflation resulting from its
lower price goods being exported. Haruhiko Kuroda, Japan’s Vice-Finance Minister for
International Affairs complained that falling prices together with fixed exchange rates
were to blame (McGregor 2002). Deflationary pressures cause prices of goods to fall
while costs of wages, services and investment loan servicing remain the same. This
leads to falling corporate profits, closure of factories and deterioration of the economy.
This problem affects industrialised countries that have heavily invested in
manufacturing facilities. The USA, Japan, Germany and other European countries are
significantly impacted, but so also are the developing nations – like Mexico.
In relation to the iron and steel industry from a global perspective, deflation causes less
demand for steel products in those countries losing market share due to being less
competitive, and more demand in countries which are gaining market share due to being
more competitive45. In effect, we have been seeing this with the rise of iron and steel
demand in China at the expense of USA and European steelmakers. This is good for
Australia in that the China market is closer and shipping costs are lower than to Europe
and USA where Australia’s competitors service these markets more.46 The important
finding here is that China’s international competitive position is being maintained by its
low valued currency. This benefits the iron and steel industry in that international
demand for the country’s goods is increasing.
44 Bad loans refer to non performing loans (NPLs). 45 Deflation drives unemployment higher this results in less spending ability. 46 Australia’s competitors have significant sea freight advantage in these other markets.
196
This will become more important after the current period of industrialisation and
reconstruction ends. At this time, China will have a large manufacturing capacity – in
particular more iron and steel capacity than its nation will need and can support. So it is
very important that China is able to maintain its competitive position at this time. This
will be difficult if its currency is allowed to appreciate. It seems the short to medium
term benefits of lower value adding import costs are outweighed by the longer term
capacity and social benefits that will be obtained by a better international trading
competitive position. The problem for China and its iron and steel industry is the
pressure that will be put on them by the USA to float their currency. A low valued
currency has been a key foundation in the development of China’s economy; how long
this can continue for is an issue that needs to be carefully monitored. In the longer
term,47 the value of China’s currency will be a major factor in the health of the nation’s
iron and steel industry.
5.8.2 Finance - debt levels
The state of a nation’s financial system has an important bearing on investment risk,
particularly with high value longer-term capital-intensive investments. An important
aspect of this in relation to China’s industrialisation programme and continued
economic development that will both have major impact on the future of the country’s
iron and steel industry, is the level of non performing loans (NPLs) or bad loans in the
banking sector. These NPLs resulted from the large capital loans given to many of the
government owned companies referred to as state owned enterprises (SOEs). Many of
them ran up very large losses and were subsequently closed or reformed. Their large
debts were not recovered.
47 The length of the term will depend on when and by how much the currency appreciates.

197
According to the OECD (2000), China’s total debt was 9.9 trillion yuan (US$1.2
trillion) in 1998. Up to 30% of these are considered bad debt (US$360 billion). Dai
Xianglong, Governor of the People’s Bank of China, quotes the bad debt value as being
26.62% of total debt for the state’s four banks, this equates to 1.8 trillion yuan, about
US$220 billion (The People’s Daily 2002)48. Japan’s economy is just over 3 times
larger than China’s and during 2002 its bad debt problem was seriously impacting the
economy. In comparison, the Bank of Japan’s debt is reported to be US$600 billion
(Bremner 2002). This is an indication that China has a serious problem that if not
resolved would have negative impact on its current economic growth path. It is also an
issue international investors need to be aware of before embarking in large-scale
projects in the country.
Bank loans account for 50-60 percent of the financing of investment in new steel plants
(CEIS 0813 2003, art.032), so continued increases in capacity will lead to a higher risk
of increasing banks’ exposure to worsening bad debts during a period where they are
already at a critical stage. We have already seen that China’s steel productive capacity
has grown and continues to do so as a result of increasing demand.
48 This is during the early part of 2002. This value is considered a low estimate.

198
This continuing increase in capital expansion has the potential at some future time, to
lead to an overcapacity situation, particularly if investment in infrastructure slows
down, consumer demand reduces and productive capacity increases in other countries.
Careless and untimely capacity expansion will increase market risk exposure to
oversupply for both existing and planned steel plants. This situation could cause
inventories to rise, drive steel prices lower, reduce profitability and increase
bankruptcies. Careful attention needs to be paid to the continued capacity expansion of
China’s steel industry. The industry is sensitive to market dynamics and any inefficient
resource allocations which could result in unbalanced industrial structures. This
sensitivity suggests that any one of a number of negative factors has the potential to
seriously impact steel company’s financial risk is one such factor.
China’s authorities have learned from Japan and have introduced strategies to reduce
this NPL burden - direct debt-write offs, listing on domestic stock markets and debt
equity swaps. In addition, they have embarked on reforming the enterprises to improve
performance, behaviour and supporting systems as follows:
• Improving the performance of enterprises - economic restructuring to reduce
excess capacity, improve profitability and reorganise the SOE structure
• Improving the behaviour of the enterprises – introducing collective corporate
governance mechanisms and reforming the financial system
• Developing the supporting institutions – legal reforms and social structures to
allow them to achieve their commercial objectives (OECD 2000, p.14).
The aspirations to fix China’s acute banking bad debt ratio, have led to setting up asset
management companies to handle the bad debts. These companies are empowered to

199
sell off the debts to agencies and foreign companies in return for ownership or access
rights. According to Interfax (Interfax China Business News 2002), debts are being
transferred from the big four state banks, Bank of China (BOC), the Industrial and
Commercial Bank of China (ICBC), the China Construction Bank (CCB) and the
Agricultural Bank of China (ICBC) to asset management companies. Lardy (2001,
paragraph 3) reports that the Bank of China disclosed its level of non-performing loans
using an updated methodology “which correspond more closely to international
standards”. The results indicated that the level of non-performing loans in 1999 equated
to 39%. He further outlines that this figure appears to be higher. This is supported by
Moody’s Investors Services (Cited in The New Paper, October 2002, 14th paragraph),
which report the bad debt ratio was “probably between 40 and 45 percent”. It is no
surprise that the Central Bank has ordered the country’s banks to reduce their debt to
15% by 2005 (Clifford 2002). If this is not achieved, it will become a major problem
for both the iron and steel industry, and the country.
As part of the WTO membership agreement, China needs to open its banking sector to
foreign competition in 2007. This will impact on the performance of China’s Banks –
we could see capital leaking out of China as foreign banks repatriate profits to their
home base, this will increase risk to local banks. Hence, the Chinese government is
keen to get its own banks into good shape before that time. It is possible that we may
see some strain on China’s economy prior to this date. Fortunately, the Chinese are
very good savers, so local banks’ liquidity is good. Nevertheless, large foreign banks
may lure the local investors away from the local banks. Another possible development
could be a financial crisis that causes depositors to remove funds quickly from the

200
banks. A combination of both would be the start of major financial insecurity and even
crisis in China.
The debt rating agency, Standard & Poor (cited in Clifford 2002) estimates that it will
take US$518 billion, or 45% of China’s 2001 GDP to clean up the debt problem.
Estimates of time required to clean up this problem range from 8 to 21 years. To get an
idea of the magnitude of China’s debt problem it is worth comparing China’s bank debt
situation with the financial crisis in Japan during the late 1990s and 2000s. This is done
using Lardy’s 39% of China’s total bank debt as being non-performing and this gives a
total debt as US$ 475.8 billion. In 2001, China’s nominal GDP was US$1,159.06
billion. This results in a domestic bad debt to GDP ratio in 2001 for China as being
41%. In 2001, Japan’s bank debt was US$600 billion and its nominal GDP as 497,427
billion yen (Bank of Japan, 2002). Converting this at value at an exchange rate of 124
yen to US$1 (being a typical 2001 value), we obtain a GDP of US$4,011.508 billion.
This results in a domestic bad debt to GDP ratio in 2001 for Japan as being 15%.
Significantly better than China’s!
The above numbers are supported by comments in The New Paper (2002a, paragraph
3), which quotes bad debt rates as being “three times higher than the crippling problem
in Japan”. Further it reports that “as many as half of the loans held by China’s four
biggest banks are bad debts”, the total amounting to US$500 billion.
Such large levels have serious potential to cause China economic problems over the
next several years. This then could adversely affect continued sound economic
performance, which is important in that it will have a major effect on the nation’s iron

201
and steel industry, particularly with the capacity increases that have occurred and
continue to do so. To better assess the debt levels both public and international, the
following comparison with other Asian economies is useful. This will also enable
potential investors to better assess the country’s financial health before deciding to
make a major investment in the country. Chart 5.12 shows a comparison of
International External Debt with other Asian countries.
Chart 5.12: International External Debt (China compared to Indonesia, Korea,
Malaysia, Singapore and Vietnam), 1981-2001
Data source: Asian Development Bank
It can be seen from Chart 5.12 that China’s international external debt has been
increasing rapidly since the early 1990s. This is the result from the increasing foreign
investments that have been occurring during that time. It appears from the steepness of
the rise between 2000 and 2001 that this debt will continue to increase. Such high
0
20,000
40,000
60,000
80,000
100,000
120,000
140,000
160,000
180,000
1981
1982
1983
1984
1985
1986
1987
1988
1989
1990
1991
1992
1993
1994
1995
1996
1997
1998
1999
2000
2001
Mill
ion
$US
China Korea Singapore
Indonesia Malaysia Vietnam

202
external debt levels along with high rate of increase are generally of concern and have
been a topic of discussion in the Chinese media. In order to better understand whether
such high debt levels will adversely impact China’s iron and steel industry, the research
analyses this exposure further and also clarifies whether such levels should give rise to
high-risk exposure for investors and traders dealing with the country’s iron and steel
producers. To do this, we examine the level of this international external debt in
relation to national output - see Chart 5.13 and in relation to international external debt
as a percentage of total reserves - see Chart 5.14. The ratio of international external
debt as percentage of GDP is known as the liability ratio. This is a good comparison to
assess whether a country is overexposed. The ability of a country to repay its
international debt can be seen from the corresponding level of its foreign reserves.
Chart 5.13: International External Debt as Percent of GDP (liability ratio) (China
compared to Indonesia, Korea, Malaysia, Singapore and Vietnam), 1981-2001
Data sources: Asian Development Bank
Chart 5.13 shows that in relation to GDP, China’s international external debt is one of
the lowest in the region, and notwithstanding the serious NPL problem, with such low
0
20
40
60
80
100
120
1981 1982 1983 1984 1985 1986 1987 1988 1989 1990 1991 1992 1993 1994 1995 1996 1997 1998 1999 2000 2001
Perc
ent
China Korea Singapore
Indonesia Malaysia Vietnam

203
liability ratios, it seems that foreign external debt should not be a problem. This will be
the case as the economy continues to be sound. The risk of instability may increase if
the currency is floated and funds are removed from the country over a short period.
This is an important finding that supports continued sound development of China’s
industrialisation and economic development programme.
Chart 5.14: Total Reserves as Percent of International External Debt (China Compared
to Indonesia, Korea and Malaysia , 1981-2001
Data source: Asian Development Bank
Chart 5.14 shows China’s total reserve to international external debt ratio has been
growing steadily since 1993 well ahead of Korea, Malaysia and Indonesia. Vietnam
was not shown since its total reserves to total debt ratio was consistently very low,
ranging from 0.17% in 1984 to 12.7% in 1999. On the other hand, Singapore was also
not included because of its high total reserves to total debt ratio. Singapore’s average
value for the period 1981 to 2000 was 536%. Interestingly enough, both Taiwan and
Hong Kong have also high total reserves to total debt ratios. The increasing total
reserves to international debt ratio for China are encouraging, but this measurement is
0
20
40
60
80
100
120
140
160
1981
1982
1983
1984
1985
1986
1987
1988
1989
1990
1991
1992
1993
1994
1995
1996
1997
1998
1999
2000
2001
Perc
ent
China Korea Indonesia Malaysia

204
easily impacted in the event of a drop in the country’s reserves brought on by a
downturn in economic conditions. Nevertheless, this is still encouraging.
It would seem that China’s financial debt concerns are in relation to the government’s
guaranteed public debt, where the country’s very high NPLs have been backed. It is
this area that requires addressing. Such high public debt can be supported while foreign
investment and trade surpluses continue but support can come to an end quickly
especially in the event of an appreciation of China’s currency. Chart 5.15 shows the
increasing guaranteed public debt increasing since 1981, dropping in 1998, and then
continuing to increase. At US$91.7 billion in 2001 it is much higher than Indonesia,
Korea and Malaysia. However, in relation to the size of the economy, the level is not
considered seriously high. The government should still ensure that by the time any
change to the country’s economic development occurs, public debt is appropriately
managed.
Chart 5.15: Guaranteed Public Debt (China Compared to Indonesia, Korea & Malaysia),
1981-2001
Data source: Asian Development Bank
0
20,000
40,000
60,000
80,000
100,000
120,000
1981
1982
1983
1984
1985
1986
1987
1988
1989
1990
1991
1992
1993
1994
1995
1996
1997
1998
1999
2000
2001
Mill
ion
US$
China Korea
Indonesia Malaysia

205
5.8.3 Reform Generated Unemployment – Threat to Economic Stability The communist party refers to China’s economic system as being a “socialist market
economy with Chinese characteristics”. It seems this variety involves an element of
private enterprise combined with government intervention and is considered more likely
to be successful than European or American systems (Wolf 2002, pp.48-49). However,
this reform will have major social consequences in relation to the unemployment it is
generating. This has the potential to seriously impact social order in the country.
According to O’Donnell (August 2000, p.29) China’s steel industry appears to be
“biting the bullet of reform” as central planners realise that the tough decisions can no
longer be avoided if the industry is to become a lean and mean competitor. This is
leading to the central government shedding hundreds of thousands of excess workers
and closing dozens of inefficient plants.
By the end of 2002, the Ministry of Labour and Social Security (cited CEIS 0213 2003)
reported that China has 7.5 million registered unemployed people in cities, which
represents a jobless rate of about 4 percent. According to the China Economic
Information Service, this does not count the 120-150 million surplus rural labourers or
the other 10 million laid-off workers who remain on labour contracts with their
employers under government-brokered arrangements and around 700,000 idle college
graduates. The report states that a one-percentage point increase in the unemployment
rate represents the loss of work for an estimated one million residents. China’s current
unemployment rate is expected to jump to 7% (Li 2001). Chiu (2002) sees increased
competition from foreign companies aggravating this acute employment situation.

206
The results of such reform is becoming evident, the Information Centre for Human
Rights and Democracy Beijing (cited in the Agence France-Presse 2000, 28 September)
reported that five hundred steel workers blocked a key railroad line in southern China
for six hours in protest over fears of losing their jobs. Protests are becoming
increasingly common in China as people see it as the only way to get the government's
attention. The report outlined that in 1999, 100,000 protests occurred, compared to
60,000 protests in 1998. The unemployment issue has the potential to increase social
tensions and is a major threat to the stability of China’s economy and the subsequent
viability of the country’s iron and steel industry.
At the same time that rising unemployment is occurring with former industrial workers,
widening disparities in standard of living and in incomes between rural and urban
workers is taking place. Chart 5.16 shows rural net per capita annual income and urban
disposable per capita annual income levels from 1978 to 2001. In 1978, the difference
between them was 209.8 yuan. At this time net rural income was 38.9% of urban
disposable income. In 1983, even although the difference between rural and urban
incomes increased to 254 yuan, rural net income as a percentage of urban income had
increased to 54.9%. This still reflected an economy in which agriculture played a
significant part. However, it was now the Sixth Five-Year Plan period, a time of
increasing trade with the western world. From this time, as industrial production49 grew
along with GDP, the gap widened to 5,227 yuan in 2002. This represents 32.1% of
urban income.
49 See Charts 3.6 and 3.8 showing GDP, industrial and agricultural production.

207
Chart 5.16: Comparison of China’s Rural and Urban per Capita Annual Income, 1978-
2002
Data sources: China Statistical Yearbooks, 2001, 2002
This increasing disparity in income levels will worsen the plight of rural households,
increase social tensions and accelerate changing skills. This situation together with
industrial sector unemployment has been recognised by the World Bank (Dahlman
2001), whose report outlines that to sustain poverty-reducing growth over the course of
the decade ahead, China will need to:
• Look after the interests of over 300 million farmers and create between 100-200
million new jobs for people moving out of agriculture and state-owned
enterprises
• Maintain growth and competitiveness by tackling inefficient state-owned
enterprises and non-performing loans, and diversifying Chinese goods and
services
• Sustain the environment
100
1100
2100
3100
4100
5100
6100
7100
8100
1978 1980 1982 1984 1986 1988 1990 1992 1994 1996 1998 2000 2002
Per C
apita
Inco
me
(Yua
n)Rural Urban

208
• Reduce regional inequalities and invest in education of its people. According to
the Economist magazine (The Economist 2003), China only spends 2% of its
GDP on education while the United Nations recommends 6%. The USA spends
around 5% (Wessel 2003).
So far only around 6 million jobs with 8% growth have been created, so if China was to
face lower growth levels as the world economy slows, this would provide real
challenges for the Chinese government (Batson 2001).

209
6 Findings
After quantifying the global iron and steel industry it could be seen that the industry has
been and still is a major contributor to a country’s economic wellbeing. It therefore, is
no surprise that Chinese leaders were found to be very keen to possess such an industry.
The research on historical and cultural characteristics relating to the development of a
strong iron and steel industry showed that Mao Zedong had a sound vision. He and
other leaders understood that a robust domestic iron and steel industry would facilitate
the nation’s development. This research confirms that strong leadership together with
centralised planning pulled the nation together. It has shown that a relationship exists
between China’s steel industry and the country’s economic performance. Many
mistakes were made in satisfying the vision of an economically strong China.
Centralised control on its own was not enough, social and market reforms moved the
country to being market based and attracted foreign investment which facilitated
increased fixed asset investments with resulting increases in productive capacity and
infrastructure. The country’s increased productive capacity provided people with
higher incomes. This created and drove domestic consumption; the resulting demand
being satisfied by the nation’s domestic output.
The research results provide an outline of a model – the Chinese Model - that may help
legislators and scholars in both developing and developed economies better understand
and apply its features and characteristics to help them work towards some of the
successes achieved by China. It shows how an economy can be changed from being
centrally directed and agriculturally based to being one driven by industrialisation and
global trade resulting in a transformation to one of the world’s leading industrial and

210
trading nations. The development of a national industry like the iron and steel
industry50 that satisfies the demand needs of the nation such that it does not rely on
expensive imports should lead to creating better conditions for improving the nation’s
economic development and wellbeing.
Successive Chinese leadership’s decisions to put planning emphasis on the steel
industry, while reforms freed up controls over the rest of the economy is supported.
Such an emphasis along with reforms enabled competitive markets to take an increased
role in investment and production decisions. The research project’s findings are
summarised and discussed as follows:
6.1.1 Key Research Findings Clearly, China’s iron and steel industry has played a major role in developing the
country. Using its comparative advantage of low labour costs, it has delivered the
nation a productive capacity that it can continue to build on. The research found that
the country’s iron and steel industry continues to grow. Whether the success to date
will be sustained, depends on how planners manage to match productive output to a
changing global market place. This will be particularly important following the end of
China’s current infrastructure boom, which is likely to occur after the 2008 Olympics.
The research’s key findings were in identifying shortfalls and weaknesses in the model
that have the potential to derail the viability of the industry after 2008. The key
findings are in the following areas:
• Demand-planning
• Security of supply of iron ore
50 Other major industries could have the same potential. This will depend on comparative advantage.

211
• Reform in the financial sector
• Structure of the industry and
• Managing the backwash from an industrialisation boom.
Demand-planning
The research identified that China’s continued infrastructure programme could increase
the country’s share of global steel production from 20% in 2002 to 30% in 2010. This
rapid growth in such a short period suggests lack of a national planning strategy with
too much emphasis on infrastructure development in a short time period. This caused
large demand shifts in iron ore and bulk carriers that could not be satisfied with global
supply both in the short to medium terms. The result of this supply and demand
mismatch has seen increased iron ore costs, loss of buyer discounts and large increases
in sea freight costs51. If this mismatch continues, China’s steel production costs will
become uneconomic – the result in an ideal market would be large demand reductions
or shifts to purchasing steel from other markets that may find its way to the mismatched
market. In China, domestic production would continue at least through to 2008,
building up capacity for construction steel products. The end result will have serious
consequences for the industry. It is important that infrastructure construction is planned
in relation to a sustainable productive capacity in the country’s steel industry. Such an
initiative is necessary and needs to include appropriate plans to ensure it puts downward
pressure on iron ore and sea freight pricing.
51 These costs are becoming highly inelastic - increased price is not changing quantity demanded.
212
This can be done by driving technological improvements combined with a more
sustainable demand level making supply less inelastic. Sea freight logistics will be a
major factor in China’s future sourcing plans. With 3 years lead time for new dry cargo
carriers resulting from urgent demand for double hulled oil tankers, better demand
planning (delaying non-essential infrastructure construction) would also better match
the shipbuilders capacity to build more dry cargo vessels. This would very likely result
in significant reductions in sea freight costs.
According to Lundgren (1996), research suggests that sea freight costs will not increase,
but in real terms should decrease as economies of scale and new technology are
introduced. In addition, China’s infrastructure development programme - constructing
larger and deeper ports, which are capable of handling larger iron ore vessels should
help lower unit sea freight costs and will improve its ability to improve sourcing
alternatives. In the longer run, this will put downward pressure on supply pricing and
provide Brazil with valuable opportunities to be more active in the China market and
threaten Australia’s increasing share of trade with China. How can Australia prepare
and counter this threat of lower shipping cost differentials and in turn help lower
China’s raw material input costs? A number of possibilities arise:
• Change the nature of the product being shipped - start adding value to it by utilising
downstream processing (direct reduced iron, pellets made from fines and/or hot
briquettes). By changing the nature and quality of the product it also helps to reduce
degradation of product quality during loading, at sea and unloading. This increased
use of beneficiated iron ore will also help compensate for both declining grades of
iron ore and declining real prices. The approach could be supported by China’s
increasing use of electric arc furnaces for steel making.

213
• Australian producers should work closer together, sharing developments and even
infrastructure. Australian iron ore producers’ operations are in the same region of
Western Australia and in some cases they are adjacent to each other. At the same
time each producer has to build almost identical complex high capital infrastructure,
which is also costly to operate and maintain. So by not sharing the use of
infrastructure, Australian producers will incur higher production costs and are not
achieving optimum allocation of economic resources. Working together with
research, planning and use of capital would help Australian producers maintain
better profit margins while lowering product costs to its important customers. This
would benefit China’s steel industry by reducing input costs, which in turn would be
positive for improved bilateral trade with Australia.
• Backloading of ships with some other commodity could also be part of a counter
trade deal. The ABARE (2002) reports that Brazil is in fact gaining market share
through purchasing coal from China, then returning backloaded with iron ore. This
was also mentioned by Liu Qi (1966), Executive Vice-Chairman of the Board China
Iron and Steel Industry and Trade Group Corporation
All else equal, high fuel prices and sea freight war premiums should increase China’s
purchases of iron ore from Australia. However, this research found that contrary to the
expected lowering of sea freight rates, as a result of excessive increased demand for
iron ore bulk carriers and the shortage in supply of these carriers, rates are increasing
and it appears they will continue to rise.
China has been moving away from centralised government control over purchasing iron
ore to one where the steel mills are free to import their own. This has led to a market

214
structure having many purchases of relatively small quantities. This research identified
an important lesson for China which is to copy Japan, where consolidators and large
trading groups purchase iron ore on behalf of the steel producers. These purchasers are
few and buy very large quantities of iron ore. They are skilful at purchasing and do an
excellent job of maintaining downward pressure on iron ore prices. Unless appropriate
strategies are put in place, China will have difficulty in making this progression to
optimum world class sourcing practice. If China can successfully adopt this approach,
it would make it more difficult for iron ore producers to secure favourable commercial
conditions and higher prices. It seems Chinese culture prefers this sourcing task to be
performed within the steel producer units. This can be considered a loss of strategic
advantage to Chinese industry when faced with trading with only a few global iron ore
suppliers.
Myers and Barnett (1985) conclude in their study that economic growth is aided if
mineral prices are falling relative to other goods and will be hindered if mineral prices
are increasing relative to other goods. This is precisely what is occurring in China’s
major industry - the steel industry. If China does not address its demand planning, iron
ore and sea freight costs will continue to increase. This increase has been shown to be
due to China’s continued high steel demand for construction. As a result of Chinese
demand for iron ore, spot sea freight rates increased from around US$9 per tonne to
around US$27 dollars per tonne. Losses on discounts and higher iron ore costs are
estimated to have or will have added around US$10 per tonne. As outlined earlier,
China’s iron ore imports are likely to reach 170-180 million tonne by 2005 (CEIS 0915
2003, art.027). This means that China could be paying around US$28 per tonne more,
i.e. US$5 billion dollars per year more for its imports of iron ore than it would have

215
paid if better demand planning was in place. With price rises of between 9 and 13%
predicted for 2004 (AME Mineral Economics 2003, p.1), the additional import bill
could be increased another US$0.5 billion. These cost increases also extend to steel
prices which are reported to have increased between 7.1 to 20% during the first 10
months of 2003 (Asian Wall Street Journal 2003, p.A4).
Security of supply of iron ore
An important finding was the increasing need for China to put in place appropriate
strategies to ensure security of supply of iron ore. The need for this was outlined
clearly in the World Mineral Resource Strategy Research Centre’s report on the need
for China to find its own new mineral deposits as increasing reliance on imported
minerals will become a threat to national security. This has been recognised by China's
Ministry of Land and Resources with their approval of a 31 provincial-level mineral
exploration programme (cited in CEIS 0116 2003, art.033). According to Pan Wencan,
director of Planning Development under the Ministry of Land and Resources, it is the
first time that China has set up and approved provincial mineral exploration
programmes since 1949. Pan Wencan outlined:
The establishment of the programmes would improve the efficiency of the
exploration and the efficiency of the use of the country's mineral resources. It
will also guarantee the sustainable development of the country's mining industry.
China's mining industry has a long history of problems, such as surpluses,
shortages, the inefficient use of mineral resources, excessive exporting of the
country's rich mineral resources, including tungsten, rare earth, fluorite and
barite, and a negative environmental impact. The above problems have impeded
the sustainable development of the country's mining industry. The newly
approved provincial-level mineral resources exploration programmes are

216
expected to help guarantee the sustainable development of the mining industry
through the following six initiatives (CEIS 0116 2003, art.033):
• Intensifying the search for new mineral resources near large and medium
sized mines
• Strengthening the macro-control of the exploration and use of mineral
resources
• Utilising mineral resources in a more rational and scientific way
• Extracting some rare minerals in an environmentally friendly manner
• Building a stable mineral resource supply system
• Building a "green mining industry" in China by adopting more ecological
environmental protection measures while mining mineral resources.
Chinese authorities need to be aware of this and will be making contingencies such as
long-term overseas deals and equity in producer operations. The mining industry in
China is a significant contributor to the economy. In 2001, it contributed 400 billion
yuan to the country’s gross domestic product (GDP) last year, or roughly four percent
of GDP (CEIS 1203 2002). China’s mining industry has not been well managed.
Exploration, output and safety performance have not been optimal. Improving the
efficiency of both exploration and mining will significantly support and help sustain
China’s industrialisation programme by reducing the reliance on mineral imports.
China is endowed with most of the natural resources that it requires. It has resource
reserves spread over the entire country. Many of the country’s resources are focused in
the Western Region, an area that could do with increased economic activity. This
initiative will assist in making China’s infrastructure development programme more
cost effective in that it can be better utilised in transporting minerals to plants that will
process them.

217
Poor demand planning for steel has led to China paying around US$28 per tonne more
for its iron ore imports (including freight), this is costing China approximately US$5
billion per year. A similar situation is likely to be occurring with other mineral
resources. More exploration increases the chances of finding iron ore reserves and
focus on the mining industry will improve the country’s capability to beneficiate the
lower grade ore reserves.
In addition to lowering demand for mineral imports, increasing unemployment has been
shown to be a major weakness in China’s economic growth; a vibrant mineral resource
industry in China will help support employment improvement programmes in rural
areas and will also have an economic multiplier effect in these communities. This
should help reduce social tensions in regions not enjoying the benefits of the booming
industry sector and should also provide an opportunity to improve incomes of rural
communities. Improved management and increased investment in the mining sector
should be done together with initiatives to stimulate agricultural production based on
increased efficiencies through utilising higher levels of technical equipment.
Chinese steel mills should continue their efforts to join up with iron ore producers (for
example, Chinese mills seeking joint ventures with iron ore companies and the purchase
of the Minero Peru iron ore mine). Australian iron ore producers’ sharing infrastructure
would go a long way to improving Australia’s competitive position and help it continue
as China’s principal source of iron ore. Notwithstanding the comments made on the
need for Australian iron ore producers to share infrastructure, it is interesting to note
that Hancock Mining’s development of the Hope Downs project in Western Australia
failed in its bid to obtain access to BHP Billiton’s rail facilities. Even after an appeal to

218
the State Supreme Court, Hancock Mining still could not obtain access. So, it appears a
free for all approach is being adopted. This may return healthy margins in the short
term, but will not be in the longer term interests of Australia and its Chinese customers.
Subsequently in November 2003, the West Australian Supreme Court ruled that the
project had a right to access the BHP Billiton’s railway network, with agreement still
needing to be reached on the actual access terms with BHP Billiton (Trounson & King
2003).
Exploration and investment in mining in Australia is shrinking. Flint and Searson
(2001-2002, p.8) report that the 2001-2002 exploration expenditure in Australia was
45% lower than that of the peak year of 1996-1997 (149 million Australian dollars
compared to 636 million Australian dollars). This provides an excellent opportunity for
China to participate in exploration activity within Australia.
With the emergence of direct reduced iron process plants, which enable lower quality
iron ore to be processed (beneficiated), the nature of iron ore demand may change over
the next decade. China is likely to use this type of process to utilise its own lower iron
content reserves of iron ore. When this will occur will depend on whether the country
can secure low cost iron ore supplies in the future. These dynamics will shape future
iron ore sourcing negotiations. In order to reduce reliability on international markets
for sourcing of strategic minerals and improve the country’s probability of sustaining its
strong economic development, elevating the status of the domestic mineral resource
sector with more domestic exploration and improved beneficiation is important for
China’s future development and industrialisation. Increasing costs of iron ore and sea
freight will drive China back to using its own reserves again. This will be negative for

219
the iron ore suppliers, but may be necessary to return to balanced supply and demand
characteristics.
If China does not invest in securing its future iron ore supplies, steel producers will
have less control over material price and commercial conditions. As other countries in
the region develop their steel industry, upward pressure on raw material prices will
occur. This will make it difficult for China to achieve an adequate share of steel
exports. A large share of global export market will be essential if a viable steel industry
is to be sustained after the end of this decade when China’s infrastructure development
is expected to slow down.
Reform in the financial sector
Improvement in the management and governance of China’s financial sector is
necessary. As outlined earlier, China’s high level of bad loans could threaten its
economic development as it did in Japan. China needs to reform its financial sector into
being more market driven (Kynge 2003b). This research discovered that the country’s
bad debt problems are worse than Japan’s and this is becoming a major concern to both
domestic and international investors. As shown in chart 5.14, China’s total reserves to
total debt ratios are high and have been improving since 1993. However, as was
outlined earlier, domestic bank debt within China is emerging as a major problem. A
bank debt to GDP ratio for China of 41% compared to Japan’s 15% would suggest
potential overseas investors would be wise to examine the risk of investing funds in the
country. With such a large burden of bad loans, the concern is that if depositors were to
rush and withdraw funds, the banks may not have the ability (in relation to liquidity) to

220
pay out such funds. Such a scenario could occur if some negative event was to cause
depositors to quickly withdraw their funds.
At least Moody’s are preparing to upgrade China’s debt rating from stable to positive
this being due to the country’s ability to attract foreign reserves together with reducing
concerns that it can actually meet its foreign debt obligations (Areddy 2002). It is
recommended that both the Central Government and the banks continue to work
towards rapidly resolving current bad loans and hopefully, reforms will put in place
systems and processes to enable the banks to better assess the risks associated with high
capital projects.
The research found that many countries had a view that China’s international
competitive position is being maintained by its low valued currency52. This benefits the
iron and steel industry in that international demand for the country’s goods increases as
the country grows its export trade of manufactured goods. This issue will become
critical for China and its steel industry when the current period of rapid industrialisation
and reconstruction ends. At this time, China will have a large manufacturing capacity –
in particular more iron and steel capacity than the country will need and can support.
So it is very important that China manages this transition carefully to ensure that it can
maintain its competitive position. This will be difficult if its currency appreciates. It
seems the short to medium term benefits of lower value adding import costs are
outweighed by the longer-term capacity and social benefits that will be obtained by a
better international trading competitive position. The problem for China and its iron
and steel industry is the pressure that will be put on them by the USA to float their
52 Seems the view held by majority of China’s competitors who lobby their governments.

221
currency. An undervalued currency has been a key foundation in the development of
China’s economy; how long this can continue for is an issue to be watched. In the
longer term, the value of China’s currency will be a major factor in the health of the
nation’s iron and steel industry.
Notwithstanding concerns about the integrity of the financial sector, foreign companies
are still investing in China. Hijino (2001, p.24) reports many Japanese companies are
relocating their production operations to China. He cites Sony, Toshiba, Pioneer and
Mazda and reports a newspaper survey, which quotes that 69 listed Japanese companies
plan to shut or relocate 120 plants. This issue is not just unique to Japan but many other
Asian countries. This will be one of the factors, which will lower product prices;
support deflationary pressures and in particular will continue to drive China’s steel
demand up. Competition from its Korean and Vietnamese neighbours is increasing. As
Vietnam moves away from its dependence on agriculture, the country has been reported
to have the fastest economic growth in Asia in 2002 (Bloomberg News, cited in
International Herald Tribune, 3 Jan, 2003). In the past decade, while Vietnam’s
economy has doubled, China’s has quadrupled. As Vietnam develops its trade in oil
and gas production, industry and manufacturing, it has the potential to more than double
its economy in the next decade. South Korea has also been experiencing sound
economic growth. According to Chang (2003), Korea’s core traded items of clothes,
semiconductors, footwear, audio-visual equipment and shipbuilding rose 41% in 2002
compared to 38.9% in 2001. She reports that the Korean Government is hoping to
double trading volume to US$600 billion by 2010. This increased activity and fierce
competition from around Asia coupled with China’s exposure to exchange rate changes

222
and capital structural problems will make investors increasingly nervous to invest in
China. For those who do invest, time will tell whether their desired returns will
materialise. McGregor and Leahy (2003) report that some investors are actually
struggling to find listed companies in China that are making adequate returns. Concern
about the financial sector even exists within China’s communist party members. The
New Paper (2002b), reports on a recent survey of 104 senior Communist Party officials
by the Central Party School which found: “That almost two-thirds said a financial crisis
is the greatest danger to China in the next 10 years”.
Structure of the industry
Foreign direct investment was found continuing to increase with no reason to suspect it
will stop unless the financial sector further deteriorates or social instability within
society arises. Such large foreign investments in manufacturing along with the
competitive resource costs have the potential to both enhance and sustain China’s
trading performance after the current industrialisation period ends. This is a positive
finding that will impact on the continued viability of the country’s iron and steel
industry.
Improved planning in relation to matching supply and demand of iron ore and bulk
carriers – major cost component inputs in producing steel was discussed above. These
are inputs that China does not have a comparative advantage in. In conjunction with
improved planning, the structure of the industry needs to also change to both match and
satisfy the global market. When China’s infrastructure construction boom ends, having
the ability to supply the steel products required in manufacturing rather than
construction will be essential.

223
We have seen earlier in the discussion on technical efficiency that two key measures,
the ratio of flat rolled & tubular steel produced to total steel production and the
continuous casting to total crude steel produced ratio are important indicators of the
level of technical efficiency reached by a country’s steel industry. The research found
that China has scope for significant improvement in the production of flat rolled and
tubular steel sections. Improvements in this area will enable not only less reliance on
imported products, but will enable capture of an increasing share of the world trade in
these sections. China with such a low steel consumption per capita value of 140 kg
suggests that the country still has great potential for increased demand to occur. This
demand will be for steel products that are not the speciality of China’s steel industry.
China’s steel industry is “long” in Long products, this means they benefit from price
increases in such products. These products are currently in demand as a result of
construction consumption. The country is “short” (they do not benefit when price
increases) in rolled and thin sheet products for the manufacturing industry.
Development of the appropriate productive capacity to balance long and short product
positions at the correct time is essential to sustain a viable iron and steel industry in
China.
When domestic demand for steel stabilises and moderates, China will focus more on
increasing exports and technical efficiency. This is supported by Sugimoto (1993,
p.284), he claims “whatever the background, it has been historically proven that export
orientation in a country’s steel industry creates an opportunity to improve technology
and quality levels”. Wu (1997) emphasised the importance of efficiency, productivity
and improved technology, particularly between regions, in supporting China’s
economic growth. He concludes that to sustain growth, reforms supporting innovation

224
will be needed. This will be particularly critical for steel producers, which are not
strategically located close to shipping ports.
Economic growth is a major driver for demand. Income growth, in particular, leads to
increased consumption of steel goods: automobiles, infrastructure, shipbuilding,
domestic goods etc. With China’s healthy economic development, its acceptance into
WTO and with the Beijing Olympics the potential for a continued positive impact is
high. In the short term, the negative parameters are the gloomy economic conditions
and regional instability (which in turn negatively impact world economic growth). A
minor threat to the iron and steel industry is the emergence of substitutes, like
aluminium, which has the potential to lessen demand for iron and steel. In the
manufacturing industry and to a lesser extent the construction industry, non ferrous
metals, particularly aluminium, can be substitutes for steel and therefore a threat to the
steel industry. Aluminium is significantly cheaper, is a lighter material and does not
corrode. According to Kang Yi, president of the China Nonferrous Metals Association
(cited in Delaney 2002), China’s output of aluminium may rise from the 2002 output of
2.74 million tonnes to 7.00 million tonnes a year by 2005. In 2002, China's production
of 10 major non-ferrous metals reached 10.12 million tonnes in 2002; this exceeded the
USA and now ranks China a world leader. Kang Yi further stressed, “That the non-
ferrous metal industry is strongly correlated to national economic growth, and of
China's 124 industrial sectors, 113 use non-ferrous metals in production. In 1949,
production of non-ferrous metals was only 13,300 tonnes” (CEIS 0328 2003, art.035).
This research discovered that as a result of low labour rates, China was becoming the
workshop of the world, impacting regional trade; neighbouring countries need to adjust

225
their economic models to improve their competitive positions. In effect, China has been
given a head start, but neighbouring countries faced with higher unemployment and
depreciating currencies will develop and discover newfound strategies that will provide
them with comparative advantage so that they can increase their share of global trade.
It is not suggested the Chinese model using the steel industry as the Marshall of
industry is appropriate for all, but the model’s principles can be applied to lesser extents
to other drivers of economic growth. The impact on China’s iron and steel industry as
other countries develop will depend on when China’s domestic demand reduces to a
level that appropriately matches supply. This will happen when the economy reaches a
critical point in its life cycle - as was discussed in the section on intensity of demand.
By this stage, China must improve its technology and skills to improve quality of steel
and product range. Only by doing this, will the steel industry maintain product demand;
otherwise, it will suffer from unit production costs which will negatively impact
economic sustainability and in the longer term will lead to surplus capacity which will
require plant closures. China cannot rely on continuing to be the workshop of the world
for low cost labour intensive goods. China’s increasing appetite for high value capital-
intensive goods need to be satisfied internally or the country’s iron and steel industry
will suffer overcapacity and low profits as occurred in other developed countries.
It is important for sustaining the country’s trade performance, to continue reforming and
reducing trade barriers (if not eliminate them). An example of this would be the
removal of trade barriers with Taiwan. Trade barriers on direct air and shipping links
between the countries add around 60% in freight costs in trade between the two
countries and removing these barriers could add 3% to both countries’ economic growth
by 2011 (Mason, cited in Roberts & Clifford 2002, p.24). China trading as part of the

226
WTO will be helpful in dealing with tough global steel industry producers. For
example, China has already used the WTO to make its opposition very clear to the USA
announcements regarding limiting steel imports and tariffs of up to 40%. China, with
the help of other WTO member countries are likely to be effective in convincing the
USA that this trade approach is not acceptable.
Sustaining China’s economic development without clean energy resources will be major
challenge for the government. The section on energy illustrated how the country’s good
fortune was achieved through using its abundant natural resource; coal, as the prime
energy source. The country is now moving towards cleaner (and imported) alternatives.
It is worth noting that the famous Taiheiyo coal mine in Kushiro, North Japan closed in
January 2002. This brought to end an industry that helped rebuild Japan’s shattered
economy (Ibison 2001). Are China’s fortunes just lagging those of Japan? Balfour
(2002, p.24) makes reference to China’s expansion following the pattern of Japan in the
1970s through 1980s and Korea in the 1990s. The results of this research suggest that
China’s economy may indeed be following a similar pattern to Japan’s. The steel
industry in Japan, industrialisation and trade performance drove its economic growth,
the positive cycle ending when its currency significantly appreciated along with poor
financial sector performance with its increasing non-performing loans.
It is therefore very important for China’s iron and steel industry structure to become
export focused and develop its capability to produce flat products and higher quality
technical steel grades more suited to manufacturing rather than construction. Increased
export focus (both on steel and manufactured products) will develop a global market
culture which in turn is more likely to ensure the longer term viability of the industry.

227
Higher quality technical steels (stronger sections – strength to weight ratios) will help
defend against loss of market share in construction markets where a loss of market share
could occur due to the use of substitutes replacing steel. Increased export focus and
higher quality steels can be considered as a two direction approach to changing China’s
iron and steel industry structure.
Managing the backwash from an industrialisation boom
In the early 2000s, GDP growth has averaged 7%. Leow (2003) suggests that China
will be an economic power by 2050 having growth targets through to 2030 of 5.5% and
from 2030 to 2050 lowering to 4.5%. At the same time, GDP is expected to double by
2010 and quadruple by 2020. This research supports China’s potential for such
development, but points out the threats of social disorder resulting from reforms leading
to rapid increases in unemployment, poor performance in the financial sector due to
high level of bad debts (non-performing loans) and the value of China’s exchange rate
which will have a significant impact on the competitiveness of industrial output. Each
of these 3 major issues has considerable potential to negatively impact the stability of
China’s rapidly developing iron and steel industry. Each one of these issues in
combination with some other global event or factor53 could see China having excess
steel capacity – this becoming more critical after the industrialisation build up to the
Beijing Olympics in 2008.
The value of industrial activity and its contribution to GDP were seen to be increasing
and at the same time the agricultural contribution was decreasing.
53 For example another energy crisis.

228
In 2002, the output value of the industrial sector was US$806.3 billion. This
represented 65.12 % of the 2002 gross domestic product. Looking back to 1992 and
1982 industrial activity, as percentages of GDP, were 60.50% and 53.24 % respectively
showing significant increases in this industry sector. The contribution to GDP of
China’s traditional industry, agriculture, was 14.53%, 21.77% and 33.28% for 2002,
1992 and 1982 respectively - significant decreases. This is further evidence of one
major sector booming (industrial sector) and another sector lagging (agriculture). It is
made worse when exchange rates increase in value, putting further pressure on the
lagging sector, further evidence of the phenomenon is seen if workers migrate from the
lagging sector to the booming sectors. These trends in industrial and agricultural
production could have significant impact in the country’s ability to provide adequate
and low cost sources of food in the future and will increase the need to import these
products. The Chinese government is actually encouraging a migration of between 300
to 500 million people from the rural to the urban sector by 2020 (Kynge & Dickie
2003). The migration from rural to urbanisation will put further downward pressure on
agricultural production. Streats (2003, p.31) reports that grain output has fallen from
512 million tonnes in 1998 to 457 million tonnes in 2002 with the 2003 harvest
estimated to fall further to 440 million tonnes. This is causing increases in grain prices
by as much as 50 per cent and has led to the government launching a campaign to assure
the public that the country has enough reserves. The widening disparity in income
between rural and urban households further encourages shifts in skills towards
industrialisation. The importance of proper development of the rural sector of China’s
economy needs careful management to prevent the major cities of China becoming
large slums with high levels of poverty (Patrose 2003, p.12).

229
This raises the issue of a nation transforming farming and handcraft skills to industrial
productive skills as an industrialisation boom is in progress only to find that at the end
of the boom, such skills are in less demand and the traditional skills have been lost.
This becomes evident in higher unemployment and then increased social disorder both
of which were evidenced during this research and were discussed in the earlier section
on structural weaknesses in the economy.
In view of concern regarding the warming climate changes that are evident in China, the
Chinese Academy of Agricultural Sciences recommended that effective measures are
required to ensure that agriculture output is not adversely affected by climate changes.
This being particularly important to protect China’s population which should reach 1.6
billion by 2020 (cited in CEIS 2003 1126, art.001). Such a negative scenario resulting
from climate change in combination with a society that loses its farming and handcraft
skills due to an industrial sector boom has the potential to seriously impact the nation.
Other problems can occur in a society as large and diverse as China’s. According to a
Reuter’s article (cited in Straits Times, 2002), China’s growing AIDS/HIV crisis could
impact its economic development. The problem is mainly in the countryside where
80% of all China’s AIDS cases are to be found. The impact of AIDS is considered to be
a threat to many of the social gains made by China during the past several years. In
addition, China’s population is an ageing one and the one child policy has reduced the
numbers of young people. Also many of the younger Chinese are moving overseas to
study and live. So after the 2008 Olympics, at a time when infrastructure development
will most probably slow down, the trend for younger Chinese to move overseas would
230
suggest that demographics may become an increasingly important determinant of iron
and steel demand.
By reviewing the historical and cultural characteristics behind China’s development, an
idea of the tough conditions experienced by the Chinese and why they have such
enthusiasm and drive to become prosperous was obtained. The “Let a Hundred Flowers
Bloom Campaign” in 1956 encouraged intellectuals to criticise the government. The
campaign was used as tool to search out and punish those people who opposed the
thought of the government. This approach has not been uncommon in Chinese history
and it is no wonder we see many Chinese people and businessmen, in particular, very
reserved and slow to speak up either about or against the system. The historical review
has shown the importance Chinese leaders have put on the iron and steel industry in
relation to it being the “Marshall of Industry”.
China’s pre reform period was plagued by structural inefficiency and dislocation of
resource input factors. Wu (1996) suggested that centrally planned economies were
closely related to developing economies in that they have a strong reliance on the
growth of factor inputs. His view on directive planning playing a positive role during
initial industrialisation periods is supported by the results that followed the planning
efforts of the earlier five-year plans. This has been a planning culture that has
continued to be successful long after the initial market reforms. The results of China’s
experience in developing the nation’s steel industry, suggests that centrally controlled
decision-making is somewhat limited in its effectiveness to improve resource allocation,
factor inputs and productive efficiency.

231
The Chinese have a saying: “Bu po bu li” (building after destruction)54. We have seen
many instances following major wars, where reconstruction of a country can lead to
improved economic performance. The centrally planned reforms (for example: great
leap forward 1958-1959 and the Cultural Revolution 1966-1976) instigated by Mao
Zedong after the communists took control in 1949 provided such a foundation for
rebuilding and improvement. Deng Xiaoping’s “open door” reforms in the 1980s saw
the emergence of Special Economic Zones. These Zones had favourable trading
features that were attractive for foreign investors. Subsequent development in key
coastal provinces and cities started the country’s rapid economic development. This
research outlined the significance of continued reforms which support innovation and
have been shown to be important factors in setting up the social structure to enable
China’s economic development to continue. The nature of these reforms, like they did
in the past when they laid the foundation of China’s industrialisation and created the
environment for the iron and steel industry to flourish, are needed for sustaining both
the economy and the viability of the country’s iron and steel industry. In 2002, Jiang
Zemin told congress that market for rural land should be created, as this would help
speed up the urbanisation of rural land that in turn would lead to increasing economic
efficiency. Turning rural land into a tradeable commodity is seen as one of the boldest
steps in land reform since the communist party nationalised all land in 1949 (Kynge
2002b).
Jiang Zemin has also been calling for “expanding the middle-income” group to
quadruple the gross domestic product by 2020 (Kynge 2002c). This demonstrates that
the Central government still has the will to pursue reforms that continue to move
54 Bu po bu li was a quote from Mao Zedong to promote the need for destruction to precede construction.

232
towards industrialisation. The Communist Party congress in November 2002 set the
goal of “creating a prosperous society during the first half of this century”, the aim of
this being to make China a modern industrialised economy (Brown 2003). This will
encourage demand for products and is positive for the outlook of iron and steel
products. The economic indicators outlined in this research that were behind political
reform and management achieving good economic results were also supported by
Tarchalski (1995).
The research results demonstrate the validity of the hypothesis that from a long-standing
national development perspective, a firmly based indigenous steel industry not relying
on imported steel provides a secure base for modernisation and economic development
through industrialisation and trade. When combined with Chinese culture, this
hypothesis leads to the CHINESE MODEL for modernisation and economic
development.
The development of China’s iron and steel industry relative to that of developed
countries and regions like USA, Europe and Asia was examined and it was shown that
China’s iron and steel industry emerged to become a dominant global player and an
important contributor to modernisation and development of China’s economy. The role
of culture and central reform policies together with competitive factors in production
show why China was able to achieve growth through steel industry development at a
time when many developed economies’ steel industries were deteriorating and in effect
were becoming a burden on those economies. They also help understand the
components of the model driving China’s economic development and the relationship
between industrialisation based reforms, culture and economic development.

233
Trade Outlook
The trade development section outlined the magnitude of the trade prize. The global
market place is very competitive. Dealing with China will not be easy. Trench’s (2001,
p.13) concluding comment in the paper presented at the 2001 Global Iron and Steel
Conference: “It is more likely to be wiser men from the east rather than wise men from
the west that will get prizes”, is supported by Kencihi Ohmae’s (cited in Hijino 2001,
p.24) view on market competitiveness:
Competition is not a fight between China and
the US or Japan, but a race in each market in
which the victor will be the company that
internalises China’s competitiveness.
Words of Warning:
According to the Economist Intelligence Unit (2001, para.1) in its April 2001 study of
the quality or attractiveness of the business environment in the 60 major economies
during 2001-2005, China’s market was ranked at 43 and being of: “Far greater promise
than delivery, and would remain so for some years”. This research can relate to Rudd’s
(cited in James, 2002, p.54) 3 rules for doing business in China: “Beware, Beware,
Beware”
With WTO and the 2008 Olympics, the race is on. It may well be more likely Asian
business rather than Western businesses that will get the larger benefit of China’s
increasing trade opportunities. This may be due not only to a lack of experience in
trading with the middle kingdom, but also a lack of understanding of its people, culture
and history. In addition to supporting using China as a manufacturing base, in his

234
review on a China trade book, John Derbyshire’s (2002) gives the following advice:
“keep a suitcase packed and ready under your bed at all times”.
In addition to outlining the development of China’s economy, this research has brought
together an appraisal of the Chinese Steel industry and its role in supporting objectives
in industrialisation. This should be helpful in understanding its history and its future.
The work provides an insight into the Chinese model and the results should be
particularly useful for Australian mineral resource companies wishing to sustain growth
in market share of their raw materials which will be increasingly required by China as
its steel industry continues to develop along with its economy.
The Chinese government has demonstrated an ability to manage China’s economy well,
even when faced with many pessimistic external factors. The economy has the potential
to continue to develop beyond analysts’ expectations. This development could be at the
expense of neighbouring Asian economies.
Australia’s contribution to China’s economic development through its role as a major
supplier of iron ore has been shown to be substantial. The trade relationship has been
symbiotic in that both countries have benefited. This mutual benefit should continue as
long as China retains its dominant position as the world’s largest steel producer. The
symbiotic trade relationship can increase and have a greater chance of being sustained if
both countries increase trade. With Australia having a comparative sea freight
advantage, this bilateral trade between China and Australia has the potential to increase,
eg, liquid natural gas and other mineral resources. The extent of this increase will
depend on China sustaining its current economic growth. China’s imports of mineral
resources will continue to be highly dependent on the condition of its economy.

235
China chose to increase both the wealth and its security of its nation through
industrialisation. This involved large expenditure in infrastructure to support logistics
associated with trade in manufactured goods. To industrialise and develop, large
amounts of steel were required. Importing this would have been prohibitively
expensive. If a country has the resources: low cost energy supply (China used coal),
coking coal (carbon from which is used in steel making process), iron ore and labour,
then it is viable to supply your own needs and at the same time usefully employ your
people. China did exactly this. Government support is also essential and it seems that
in the Chinese model, trade protection has been helpful in getting industries started.
As it continues to partially satisfy its own demand for steel, it has not yet become a
major exporter of steel. This phase still needs to come - earlier better before its
currency increases in value. Industrialisation through a strong steel industry has
enabled the country to develop its manufacturing sector and while this has been
occurring, well managed reforms were put in place by successive central governments.
The steel industry is the foundation of a nation’s industrial sector which in the case of
China was shown in Chart 5.9 to have grown from US$155.6 billion in 1981 to
US$806.3 billion in 2002 (56% to 65.2% of GDP respectively) being the largest
contributing sector to the country’s economy.
Replicating the Chinese model in other countries is possible as long as the basic factor
inputs are available. China and Japan built their industries using coal as the primary
energy source. From an environmental view, this has become more difficult and

236
availability of a cleaner fuel like gas would be a better alternative. This will also be
more expensive. Developments in downstream processing may give developing
countries an opportunity to source high quality feedstock into which considerable
energy has already been input. As sea-freight costs increase, it becomes more
economical to carry feedstock of 98% iron rather than only around 63% (the remainder
being waste). In replicating the Chinese model, it is important not to focus entirely on
the steel industry, but on the principles behind the model: comparative advantage being
a key driver of economic development, government control in planning that facilitates
the reforms needed to build industry to prepare for global trade and a culture that
embraces development and change. China’s strong leadership with policies not always
liked has been a good example of what is needed in times of crisis.
During a large period of China’s economic development, key industries like the steel
industry were protected from international competition. China took full advantage of
this during a time when the western world was rather pre-occupied with issues like the
“cold war” with the USSR. Now, governments which try to protect their industries
tend to be heavily criticised by other countries. Trade groups like the WTO have
become powerful in applying pressure on such countries. It is interesting to note that
the virtues of free trade are expounded by western countries, yet at the same time, major
trading economies like the USA have been imposing tariffs and measures to protect
their steel industry. Their argument being that the industry needed protection before it
was destroyed! This appears to support the view that a measure of protection for an
industry is important tool to manage the development of that industry. The US
government is fully aware of the important role that its steel industry plays in its
economy and like China did in the past, has needed to protect it. In the longer term,

237
when China’s currency has likely increased in value and its industry suffers from
overcapacity, such an approach may also be needed by China.
In addition to China, the research findings extend to Australia and other countries that
could benefit from a better understanding of the factors behind the Chinese model. A
summary of these findings together with recommendations, suggestions for further
research and conclusion are presented in the following chapter.

238
7 Recommendation and Conclusion
In examining the role played by China’s iron and steel industry in the economic
development of the country, wide subject areas were researched. This included Chinese
history and culture which gave an understanding of the importance of it being a key
component of successive five year plans to industrialise and modernise the country. To
enable one to better quantify the development and structure of the industry,
comparisons were made to the global iron and steel industry. Since the start of the
People’s Republic in 1949, many reforms have been put in place. The country has
become a leading economy in the world. Unlike during its developing years, when it
maintained a degree of invisibility and did not draw much attention from the media,
China’s policies are now monitored daily by all sectors of the international media. With
removal of protective trade barriers and the country under pressure from developed
countries to attend to its trade surpluses, maintaining previous economic performance
will be a big challenge. Whether the industry can maintain its role and sustain the
growth in the country’s economy was considered in detail and this lead to examining
the contribution that Australia, as a supplier of the key input material iron ore has and
will play.
From such a wide and complex subject area, in order to simplify the key findings, they
have been collected and summarised in the 4 sections of this chapter. The first section
summarises the key findings. The second section lists recommendations for China,
Australia and those countries that may find aspects of the Chinese Model useful as a
framework for managing or improving their economy. The third section provides some

239
suggestions for further research directions and conclusions are presented in the final
section.
7.1 Summary of findings
The key research findings have been summarised and grouped into 5 areas, namely:
demand-planning, security of supply of iron ore, reform in the financial sector, structure
of the industry and managing the backwash from a booming industrial sector. Each
item below refers to China.
1. Demand-planning
The architects of the country’s five year plans need to devise and articulate a
planning strategy that has less emphasis on general infrastructure development
and more on balancing raw material supply and demand to match necessary, cost
effective construction. Excluding flow on cost effects, an estimate of costs
incurred as a result of supply balance mismatches exceed US$5 billion per year
There is a need to better organise and consolidate iron ore sourcing process. In a
concentrated supply market structure, better to make fewer purchases of large
quantities in order to achieve the most favourable commercial arrangements
The country’s increasing appetite for high value, capital goods needs to be
satisfied internally or the country’s iron and steel industry will suffer
overcapacity and low profits.
2. Security of supply of iron ore
There is a critical need to put in place appropriate strategies to ensure long term
security of supply of high quality iron ore

240
It is necessary to improve management and increase investment in the mineral
resource sector. This could include iron ore exploration and investment in
Western Australia
Increased contingency planning such as long term supply contracts, joint
ventures and equity in producer operations is required
In the longer term, steel producers should make better use of beneficiation to
improve opportunities to further utilise the country’s lower iron content iron ore
reserves. Planning for this should commence at once.
3. Structure of the industry
Steel producers cannot continue to rely on maintaining a comparative advantage
through low cost labour. This reliance needs to transfer to low unit cost
manufacturing resulting from high tech plant and factory facilities
Steel producers should work with and encourage their principal iron ore
suppliers to share infrastructure and drive material costs down. This could be
part of supply alliance strategies
Should be less focus on fuelling the booming industrial sector and more focus on
initiatives to stimulate agricultural production. This is best done by increasing
efficiencies through utilising higher levels of technical equipment and learning
from the industrial sector
Working towards capturing a large share of the global export market is essential
if a viable steel industry is to be sustained beyond 2008. The value of China’s
currency will be an important aspect impacting the level of success achieved
Industry structure needs to change to both match and satisfy the global market.
China’s steel industry is biased towards long products which are currently in
demand as a result of high construction levels. When the infrastructure

241
construction boom ends, being able to supply high quality flat, rolled and thin
sheet steel products required for manufacturing rather than construction will be
essential.
4. Reform in the financial sector
China’s bank debt to GDP ratio being 41% compared to Japan’s 15%, indicates
further improvement in the management and governance of China’s financial
sector is necessary
An undervalued currency was found to be a key element in the development of
China’s economy - This will only benefit the iron and steel industry if it does
not appreciate in value enabling it to sustain international demand for the
country’s manufactured goods.
5. Managing the backwash from an industrialisation boom
Sustaining China’s economic development without clean energy resources will
be major challenge for the central government. The results of this research
suggest that China’s economy may indeed be following a similar pattern to
Japan’s
The potential for increasing social disorder resulting from reforms which cause
higher unemployment exists
The value of industrial activity and its contribution to GDP were found to be
increasing at the same time the agricultural contribution was decreasing. This is
evidence of a booming industrial sector and a lagging agricultural sector. These
trends in industrial and agricultural production have the potential to seriously
impact the country’s ability to provide low cost sources of food in the future,
leading to an increasing need to import such items

242
Excessive migration from the rural to the urban sector will result in further
downward pressure on agricultural output
The widening disparity in income between rural and urban households will lead
to transforming farming and handcraft skills to industrial productive skills only
to find that at the end of an industrial boom, such skills are in less demand and
the traditional skills have been lost.
7.2 Recommendations
This research project’s main focus was on China and the role played by its steel
industry in developing its economy. At the same time, Australia’s contribution as a
principal supplier of iron ore is examined. As a result, this section lists
recommendations for China, Australia and also those countries that could benefit by
taking advantage of the Chinese model.
7.2.1 China
The iron and steel industry played an important role in facilitating China’s
transformation from an agricultural to an industrial society. However after 2008, it is
likely that manufacturing sector will become the major driver of China’s economy.
Therefore in order to sustain economic development and further improve standards of
living, careful attention to the five key findings listed above is required.
As China industrialises and increases its manufacturing capability, it is important not to
lose sight of the need to maintain a sound agricultural sector. This sector has not been
developing in proportion to the needs of the nation and the development of the
industrial sector. It is recommended that the agricultural sector is developed in a

243
manner that increases productive efficiency by becoming more high tech and that it is
fully supported by an advanced domestic manufacturing sector.
7.2.2 Australia
Australia’s contribution to China’s economic development through its role as a major
supplier of iron ore has been shown to be substantial. The trade relationship was found
to be symbiotic in that both countries have mutually benefited. Bilateral trade between
China and Australia has the potential to increase, eg, liquid natural gas and other
mineral resources. The extent of this increase will depend on China sustaining its
current economic growth. China’s imports of mineral resources will continue to be
highly dependent on the condition of its economy and the economy will be impacted by
the price of these resources.
This research identified that due to capacity constraints, Australian iron ore producers
cannot keep up with China’s increasing demand and as a result are investing heavily in
capacity upgrading. This upgrading is expensive and after completion, producers will
be exposed to the possibility of China unexpectedly cutting back demand. This would
create excess supply which in turn would drive prices lower. Contingencies need to be
put in place for this scenario. An example of such a contingency is negotiating tonnage
commitments within longer term contracts with the Chinese steel mills. Australian
producers need to make a positive effort to demonstrate to China that they should be the
suppliers of choice for them in the long term.
As a result of higher returns being achieved elsewhere and land rights issues, a trend
away from exploration and investment in the Australian mining industry was identified.
This puts the longer term viability of the iron ore industry at risk. This is of concern to

244
China’s longer term security of supply and arrangements should be negotiated with the
Western Australian government with a view to securing attractive terms in relation to
mineral title rights in the state. This needs to be seen as an opportunity for China to
invest in iron ore exploration and subsequently production.
7.2.3 Other Countries
In order to industrialise and develop, it is important countries understand their
competitive advantage and as was achieved through the Chinese model, use this as a
key component of a planning strategy to improve their economic wellbeing. In
replicating the Chinese system, occasionally referred to as being a social market
economy with Chinese characteristics (Wolf 2002, p.48), it is important not to just focus
on the steel industry, but on the principles behind the model: comparative advantage
being a key driver of economic development and government control in planning that
supported the necessary reforms to create the correct climate for change.
7.3 Further Research
The following further research directions are suggested:
• A better knowledge of Chinese history would have helped western companies to be
better prepared for taking full advantage of China’s industrialisation progress. In
particular, this research found that very little historical documentation in relation to
the significance of each of the five-year plans had been carried out. More insight
into this planning approach would be useful for not only managing a nation, but
managing an enterprise

245
• Further analysis should be carried out to determine the cost/benefits associated with
China’s excessive demand of iron ore resulting from an ambitious infrastructure
construction programme compared to a more modest programme that puts
downward pressure on iron ore and sea freight price
• Extensive steel industry and economic data have been collected and is available in
a data base. This should be updated and maintained
• Further research is needed to enable Chinese planners to predict optimum
production capacities for long and flat products which are necessary to sustain the
country’s iron and steel industry
• An econometric model relating agriculture sector output with industrial sector
output using economic and demographic variables should be developed. This
would be useful in assisting with better rural and urban planning.
The above list of further research topics is not exhaustive.
7.4 Conclusion
The development of China’s iron and steel industry relative to that of developed
countries and regions like USA, Europe and Asia was examined and it was shown that
China’s iron and steel industry had emerged to become a dominant global industry
leader. China’s industrial sector was shown to be the largest contributing sector to the
country’s economy growing from US$155.6 billion in 1981 to US$806.3 billion in 2002
(56% to 65.2% of GDP respectively) and the steel industry has been a key component
of the industrial sector. The research results demonstrate the validity of the hypothesis
that from a long-standing national development perspective, a firmly based indigenous
steel industry not relying on imported steel provided a sound base for modernisation
and economic development through industrialisation and trade. When combined with

246
Chinese culture and history, this hypothesis leads to the Chinese model for
modernisation and economic development.
The historical review has shown the importance Chinese leaders have put on the iron
and steel industry in relation to it being the “Marshall of Industry”. China’s experience
in developing the nation’s steel industry, suggested that centrally controlled decision-
making was limited in its effectiveness to improve resource allocation, factor inputs and
productive efficiency. Mao Zedong’s “Bu po bu li” (building after destruction) was
shown through the centrally planned reforms of the Great Leap Forward (1958-1959)
and the Cultural Revolution (1966-1976) to have provided a foundation for economic
reconstruction. This was to be further consolidated by Deng Xiaoping’s “open door”
trade reforms during the 1980s.
China got to where it is today mainly through the efforts of its own people. Future
generations need to manage the improved conditions that have been created for them by
their ancestors. This will be their responsibility as Chinese. Older Chinese believe that
wealth can only last 3 generations, so many challenges lie ahead.
Over many years studying China, I have increasingly observed Chinese thought shifting
to western ways. In the early 1970s, while studying martial arts under Sensei Harada an
ex professor of Japan’s Waseda University, I recall asking him how Japan would
develop in the years ahead. I never forget his reply which was along the lines the rapid
development seen in the 1970’s would only last for a generation, this being due to
Japanese youth changing their culture and habits to western ways.

247
Notwithstanding the never ending list of advice being offered to China by western
consultants, I conclude this thesis with my own contribution to the people of China:
Maintain your culture, the rest will follow.

248
8 References
Agence France-Presse 2000, “Five hundred Chinese steel workers protest over fear of
job loss”, cited in Dow Jones newswire report, 29 September.
Agence France-Presse 2000, “Japanese trading houses to integrate steel divisions” cited
in Dow Jones newswire report, 19 October.
Alden, T & Marsh, P 2002, “World’s big steel producers ready for hard talking”, Asia
Financial Times, 7 February, p.3.
AME Mineral Economics 1999, Iron ore 1999 shakeout, AME Mineral Economics
Report, AME Mineral Economics Pty Ltd ,March 1999, Appendix C, iron and steel
production technology, p.C24.
AME Mineral Economics Steel 2001, Crude Steel Products Mini-Mills, AME Mineral
Economics Report, AME Mineral Economics Pty Ltd, February 2001, pp.26-33 and
p.A3.
AME Mineral Economics Steel Outlook 2001, AME Mineral Economics Pty Ltd, July
AME Mineral Economics 2001, Iron Ore Outlook, AME Mineral Economics Pty Ltd,
July.
AME Mineral Economics 2003, Iron Ore Outlook, AME Mineral Economics Pty Ltd,
January.
AME Mineral Economics 2003, “The market”, Iron Ore Outlook, AME Mineral
Economics Pty Ltd, November, p.1.
Areddy, JT 2002, “Moody’s may upgrade China’s debt rating”, The Asian Wall Street
Journal, 25 November, p. M11.
Asia Financial Times 2002, February 7, p3.

249
AsiaPort 2001, “Beijing to spend big before 2008”, AsiaPort Daily News, online, 18
July 2001, Dow Jones Interactive, Fairfax edn, viewed 22 December 2002
Asia Pulse PTE Ltd 2001, “China outlines 2001-2005 machine industry development
plan”, 17 July.
Asian Development Bank 2001a, PRC'S Growth To Top 7 Percent In 2001-2002,
Driven By Domestic Demand, Asian Development Outlook, News Release, no.
032/01, 19April 2001, [On line], Accessed 15 Dec, 2002, Available:
<http://www.adb.org/Documents/News/2001/nr2001032.asp> .
Asian Development Bank 2001b, PRC'S Growth To Top 7 Percent In 2001-2002,
Driven By Domestic Demand, Asian Development Outlook, News Release, no.
032/01, 19April 2001, [On line], Accessed 15 Dec, 2002, Available:
<http://www.adb.org/Documents/News/2001/nr2001032.asp> .
Australian Bureau of Agriculture and Resource Economics (ABARE) 2002a, Australian
Commodities, Forecasts and Issues, vol.9, no.1, March Quarter, p.112.
Australian Bureau of Agriculture and Resource Economics (ABARE) 2002b, Australian
Commodities, Forecasts and Issues, vol.9, no.1, March Quarter, p.112.
Australian Bureau of Agriculture and Resource Economics (ABARE) 2002c, Australian
Commodities, Forecasts and Issues, vol.9, no.1, March Quarter, p.115.
Australian Bureau of Agriculture and Resource Economics (ABARE) 2002d, Australian
Commodities, Forecasts and Issues, vol.9, no.1, March Quarter, p.119.
Australian Stock Exchange 2001, “Rio Tinto Limited (RIO.AX) Hamersley Iron forges
JV with China’s Baosteel”, Australian Stock Exchange Company Announcement,
online, 21 December, Dow Jones Interactive, Fairfax edn, viewed 3 December 2002.
Balfour, F 2002, “A big lift from China”, Business Week, 21 October, pp.24-25.
250
Balfour, F 2002, “A global shopping spree for the Chinese”, Business Week, 18
November, p.24.
Batson, A 2001, “China urged to lift productivity”, The Asian Wall Street Journal,
December 14-16, p.4.
Bell, MW, Hoe, EK & Kochlar, K 1993, China at the Threshold of a Market Economy,
International Monetary Fund, September.
Bell, S 2001, “Marra mamba boom has Pilbara jumping”, Australia’s Mining Monthly,
March, pp.34-42.
Blockley, JG, Reid, IW & Trendal, AF 1990, “Geological aspects of Australian iron ore
discovery and development”, Geological Aspects of the Discovery of Some Important
Mineral Deposits in Australia, Monograph Series no.17, Australian Institute of
Mining and Metallurgy, Victoria, Australia.
Bloomberg 2003, “Steel-making nations closer to accord” cited in Today, Business
News, July 21, p.12.
Bloomberg News 2003, “Vietnam growth hits 7%, fastest in Southeast Asia”,
International Herald Tribune, Friday, January 3, p.B2.
Bloomberg News 2003, “WTO rules against US steel tariffs”, The Straits Times,
Tuesday, 11 November, p.A13.
BP 2003, BP Statistical Review of World Energy, 52nd edition, June 2003, p.41
(Appendices).
Bradsher, K 2003 “Air pollution rises with China’s growth”, International Herald
Tribune, 23 October, p.1.
Bramall, C 2000, Sources of Chinese Economic Growth 1978-1996, Oxford University
Press, Oxford, p.43.

251
Bremner, B. 2002, “Playing Don Quixote at the Bank of Japan” Business Week, 7
October, p.24.
Brizendine, T & Oliver, C. 2001, “An industry in disarray”, China Business Review,
January-February.
Brown, O 2003, “China develops plan to increase farm incomes”, The Asian Wall Street
Journal, January10-12, p.M8.
Business China 1992, “China outlines bold reform measures for the steel industry”,
Business China, 23 March, pp.45-46.
Business Week 2001, “China coping with its new power”, Business Week, April 16,
pp.38-45.
Campbell, GA 1999, “Recent trends in world metal consumption”, Minerals and
Energy, vol.14, no.1, pp.15-26.
Chandler, C 2001, “China reports 7.9% growth”, Washington Post, 18 July.
Chang, J 1991, Wild Swans, Harper Collins, London, England, p.293 & p.309.
Chang, S 2003, “South Korean exports rose 27% in December”, The Asian Wall Street
Journal, Friday/Saturday/Sunday, January 3, p.A3.
China Business Daily Update 2001, “China to spur economic growth with spending”,
Asia Intelligence Wire, China Business Information Network, 4 July.
China Business Weekly 2001, “China takes giant steps onto world stage”, China
Business Weekly, 24 July.
China Economic Information Service (CEIS) 1114 2002, “China invests over 100
billion yuan in R&D”, Xinhua News Agency, Beijing, 14 November, art.034.
China Economic Information Service (CEIS) 1127 2002 “China's shipbuilding giant
consolidates bases”, Xinhua News Agency, Beijing, 27 November 2002, art.012.

252
China Economic Information Service (CEIS) 1203 2002, “Mining firms dig into world”,
Xinhua News Agency, Beijing, 3 December, art.037.
China Economic Information Service (CEIS) 0115 2003, “China's leading iron, steel
giant aiming high”, Xinhua News Agency, Shanghai, 15 January, art.035.
China Economic Information Service (CEIS) 0116 2003, “China approves 31
provincial-level mineral exploration programs”, Xinhua News Agency, Beijing , 16
January, art.033.
China Economic Information Service (CEIS) 0117 2003, “Chinese shipbuilding giant
develops fast in 2002”, Xinhua News Agency, Beijing, 17 January, art.015.
China Economic Information Service (CEIS) 0117 2003 “Major Chinese steel maker
reports profits, sales up”, Xinhua News Agency, Beijing, 17 January, art.039.
China Economic Information Service (CEIS) 0117 2003, “China's industrial growth hits
12.6% in 2002”, Xinhua News Agency, 17 January, Beijing, art.044.
China Economic Information Service CEIS 0120 2003, “China remains world's third
largest shipbuilder”, China Economic Information Service, Xinhua News Agency,
Beijing, 20 January, art.46.
China Economic Information Service (CEIS) 0127 2003, “Mineral reserves stressed”,
Xinhua News Agency, Beijing, 27 January, art.038.
China Economic Information Service (CEIS) 0128 2003, “Shougang to build new
production base in Hebei”, Xinhua News Agency, Beijing, 28 January, art.040.
China Economic Information Service (CEIS) 0212 2003, “World Expo Economy in the
offing”, China Economic Information Service, Xinhua News Agency, Beijing, 12
February, art.033.
China Economic Information Service (CEIS) 0212 2003 “China honors commitments to
lower tariffs”, Xinhua News Agency, 12 February, Beijing, art.041.

253
China Economic Information Service (CEIS) 0213 2003, “China to keep jobless rate
under 4.5 percent in 2003”, Xinhua News Agency, 13 February, Beijing, art.042.
China Economic Information Service (CEIS) 0217 2003, “China's Industrial Added
Value In December”, Xinhua News Agency, 17 February, Beijing, art.039.
China Economic Information Service (CEIS) 0218 2003, “About 7,000 Chinese-funded
firms established overseas”, Xinhua News Agency, Beijing, 18 February, art.019.
China Economic Information Service (CEIS) 0306 2003, “Features of investment in
fixed assets in 2002”, Xinhua News Agency, Beijing, 6 March, art.032.
China Economic Information Service (CEIS) 0311 2003, “Organisational setup of
Chinese government”, Xinhua News Agency, Beijing, 11 March, art.049
China Economic Information Service (CEIS) 0313 2003, “150 million Chinese families
expected to buy cars in next 15 years”, Xinhua News Agency, Beijing, 13 March,
art.004.
China Economic Information Service (CEIS) 0313 2003, “Baosteel beefs up steel
processing”, Xinhua News Agency, Shanghai, 13 March, art.052.
China Economic Information Service (CEIS) 0314 2003, “Steel trade in 2002”, Xinhua
News Agency, Beijing, 14 March, art.039.
China Economic Information Service (CEIS) 0314 2003, “Metal production in 2002”,
Xinhua News Agency, Beijing, 14 March art.040.
China Economic Information Service (CEIS) 0314 2003, “Metal trade in 2002”, Xinhua
News Agency, Beijing, 14 March art.041.
China Economic Information Service (CEIS) 0319 2003, “Steel consumption in auto
production to reach 5.65 million tonne by 2005”, Xinhua News Agency, Beijing, 19
March, art.006.

254
China Economic Information Service (CEIS) 0319 2003, “Import duty rates for iron and
steel”, Xinhua News Agency, Beijing, 19 March 2003, arts 029, 030, 031, 032, 033,
034, 035 & 036.
China Economic Information Service (CEIS) 0320, 2003, “Full text of Premier Zhu's
government work report”, Xinhua News Agency, Beijing, 20 March 2003, arts 058,
061, 065 & 068.
China Economic Information Service (CEIS) 0321 2003, “Full text of report on
development plan (18)”, Xinhua News Agency, Beijing, 21 March 2003, art.052,
item10.
China Economic Information Service (CEIS) 0321 2003, “Import duty rates for articles
of iron and steel”, Xinhua News Agency, Beijing, 21 March 2003, arts 021, 022,
023, 024, 024, 025, 026, 027 & 028.
China Economic Information Service (CEIS) 0324 2003, “Composition of China's
export to USA in Dec & Jan-Dec.”, Xinhua News Agency, Beijing, 24 March,
art.021.
China Economic Information Service (CEIS) 0324 2003, “Composition of China's
import from USA in Dec & Jan-Dec.”, Xinhua News Agency, Beijing, 24 March,
art.022.
China Economic Information Service (CEIS) 0324 2003, “Composition of China's
export toAustralia in Dec.and Jan.-Dec.”, Xinhua News Agency, Beijing, 24 March,
art.023.
China Economic Information Service (CEIS) 0324 2003, “Composition of China's
import from Australia in Dec.and Jan.-Dec.”, Xinhua News Agency, Beijing, 24
March, art.024.

255
China Economic Information Service (CEIS) 0324 2003, “Per capita steel consumption
in China”, Xinhua News Agency, Beijing, 24 March, art.043.
China Economic Information Service (CEIS) 0328 2003, “Auto output by region in
2002”, Xinhua News Agency, Beijing, 28 March, art.003.
China Economic Information Service (CEIS) 0328 2003, “China's non-ferrous metal
production exceeds 10 million tonne”, Xinhua News Agency, Beijing, 28 March,
art.035.
China Economic Information Service (CEIS) 0331 2003, “Import duty rates for
electrical machinery and equipment and parts thereof, sound recorders and
reproducers, television image and sound recorders and reproducers and parts and
accessories of such articles”, item 10, Xinhua News Agency, Beijing, 31 March
art.032.
China Economic Information Service (CEIS) 0401 2003, “Output and sales of
carmakers in 2002”, Xinhua News Agency, Beijing, 1 April, art.002.
China Economic Information Service (CEIS) 0401 2003, “Shougang closes down
converter for reducing pollution”, Xinhua News Agency, Beijing, 1 April, art.043.
China Economic Information Service (CEIS) 0403 2003, “China’s average steel import
tariffs have declined 50 percent since WTO”, Xinhua News Agency, Beijing, 3 April,
art.022.
China Economic Information Service (CEIS) 0404 2003, “Taiyuan Steel aims at 2
million tonne stainless steel capacity”, Xinhua News Agency, Taihuan, 4 April,
art.040.
China Economic Information Service (CEIS) 0407 2003, “Stainless steel production up
12.5% in 2002”, Xinhua News Agency, Beijing, 7 April, art.049.

256
China Economic Information Service (CEIS) 0409 2003, “Steel products supply in
2002, 2003”, Xinhua News Agency, Beijing, 9 April, art.030.
China Economic Information Service (CEIS) 0414 2003, “Steel profits up 43 percent in
2002”, Xinhua News Agency, Beijing, 4 April, art.034.
China Economic Information Service (CEIS) 0411 2003, “Iron ore production
rebounds”, Xinhua News Agency, Beijing, 11 April, art.037.
China Economic Information Service (CEIS) 0414 2003, “China's demand for motor
vehicles expected to reach 4.6 million by 2005”, Xinhua News Agency, Beijing, 14
April, art.003.
China Economic Information Service (CEIS) 0414 2003, “Steel profits up 43 percent in
2002”, Xinhua News Agency, Beijing, 14 April, art.034.
China Economic Information Service (CEIS) 0421 2003, “Baotou Steel's production
plan in 2003”, Xinhua News Agency, Beijing, 21 April, art.031.
China Economic Information Service (CEIS) 0423 2003, “Chinese, foreign giants
compete for Beijing Olympic steel structure market”, Xinhua News Agency, Beijing,
23 April, art.031.
China Economic Information Service (CEIS) 0423 2003, “More steel products on
demand in 2003”, Xinhua News Agency, Beijing, 23 April, art.032.
China Economic Information Service (CEIS) 0425 2003, “China capable of doubling
GDP in 2020: leading economists”, Xinhua News Agency, Beijing, 25 April, art.036.
China Economic Information Service (CEIS) 0507 2003, “Continuous casting in China”,
Xinhua News Agency, Beijing, 7 May, art.031.
China Economic Information Service (CEIS) 0509, 2003, “Auto output forecast to reach
3.90 million units in 2003”, Xinhua News Agency, Beijing, 9 May, art.006.

257
China Economic Information Service (CEIS) 0513 2003, “Rail bridge breaking ground
in Tibetan capital”, Xinhua News Agency, Lhasa, 13 May, art.013.
China Economic Information Service (CEIS) 0514 2003, “China shipbuilding plan sets
sail”, Xinhua News Agency, Beijing, 14 May, art.009.
China Economic Information Service (CEIS) 0609 2003, “China capable of building
large-capacity container ships”, Xinhua News Agency, Shanghai, 9 June, art.17.
China Economic Information Service (CEIS) 0609 2003, “China begins building
world's longest trans-bay bridge”, Xinhua News Agency, Hangzhou, 9 June, art.018.
China Economic Information Service (CEIS) 0618 2003, “Baosteel to reform its
management system”, Xinhua News Agency, Shanghai, 18 June, art.028.
China Economic Information Service (CEIS) 0708 2003, “Expansion of stainless steel
capacity in China”, Xinhua News Agency, Beijing, 8 July, art.041.
China Economic Information Service (CEIS) 0709 2003, “China's steel sector
expanding capacity”, Xinhua News Agency, Shanghai, 9 July, art.035.
China Economic Information Service (CEIS) 0709 2003, “Baosteel constructs 4
specialised production bases”, Xinhua News Agency, Beijing, 9 July, art.037.
China Economic Information Service (CEIS) 0710 2003, “Pingxiang Steel plans to
double capacity”, Xinhua News Agency, Beijing, 10 July, art.032.
China Economic Information Service (CEIS) 0714 2003, “China remains world's top
steel producer for 7 years”, Xinhua News Agency, Beijing, 14 July, art.034.
China Economic Information Service (CEIS) 0725 2003, “Hot steel sector needs to be
doused”, Xinhua News Agency, Beijing, 25 July 2003, art.38.
China Economic Information Service (CEIS) 0813 2003, “Chinese government warns
of overheating in steel industry”, Xinhua News Agency, Beijing, 13 August, art.032.

258
China Economic Information Service (CEIS) 0814 2003, “Continuous cast billet in
2003”, Xinhua News Agency, Beijing, 14 August, art.022.
China Economic Information Service (CEIS) 0818 2003, “China is Australia's third
largest trading partner”, Xinhua News Agency, Beijing, 18 August, art.016.
China Economic Information Service (CEIS) 0818 2003, “Steel makers compete for
Olympics”, Xinhua News Agency, Beijing, 18 August, art.034.
China Economic Information Service (CEIS) 0825, 2003, “China’s steel capacity to
exceed 300 million tons by 2010”, Xinhua News Agency, Beijing, 25 August,
art.029.
China Economic Information Service (CEIS) 0825 2003, “Steel supply gap in
Guangdong”, Xinhua News Agency, Beijing, 25 August, art.030.
China Economic Information Service (CEIS) 0826 2003, “Apparent consumption of
stainless steel”, Xinhua News Agency, Beijing, 26August, art.023.
China Economic Information Service (CEIS) 0904, 2003, “Supply source of iron ore
imports changes”, Xinhua News Agency, Beijing, 4 September, art.033.
China Economic Information Service (CEIS) 0911 2003, “China's steel demand not to
peak before 2010”, Xinhua News Agency, Beijing, 11 September, art.034.
China Economic Information Service (CEIS) 0915, 2003, “Iron ore import likely to top
150 million tonne”, Xinhua News Agency, Beijing, 15 September, art.027.
China Economic Information Service (CEIS) 1113, 2003, “Application of stainless steel
spreads to 4 areas”, Xinhua News Agency, Beijing, 13 November, art.034.
China Economic Information Service (CEIS) 1118, 2003, “Chinese steel exports no
threat to rivals”, Xinhua News Agency, Beijing, 18 November, art.034.
259
China Economic Information Service (CEIS) 1126 2003, “Experts call for measures to
protect Chinese agriculture from climate changes”, China Economic Information
Service, Xinhua News Agency, Beijing, 26 November, art.001.
China Economic Review 2000, 16 August.
China Metal Market Iron & Steel Monthly 2000, no.10, 16 October, pp.1-2.
China Metal Market Iron & Steel Monthly 2000, no.11, 14 November, p.14.
China Metals 2003” Chinese steel capacity survey”, China Metals, Info China, Xinhua
News Agency, vol.9, no.191, 25 September, p.2.
China Securities Bulletin 2001, “China’s WTO to split Asian currencies further”, China
Securities Bulletin, online 14 November, Dow Jones Interactive, Fairfax edn, viewed
5 January 2002.
China Specific 2002, BHP Billiton, Internal Marketing Publication, December, 2003,
Shanghai, p.11.
Chiu, A 2002, “Currency controls until 2006”, South China Morning Post, 15 January.
Clifford, M 2002, “How low can prices go? – China’s cheap exports worry the West”,
Business Week, 2 December, pp.24-25.
Clifford, M 2003, “How fast is China really growing?” Business Week, 10 March, p.20.
Credit Suisse 2003, “CVRD, Caemi and the freight rates – does it matter? not in the
short term”, Americas/Brazil Diversified Metals and Mining, Credit Suisse First
Boston, Sector Review, 11 November, 2003, p.5.
Crompton, P & Wu Yanrui 2000, Chinese Steel Consumption in the 21st Century,
Discussion Paper, University of Western Australia.
CRU 1998, “Industry developments”, CRU Monitor Steel Making Raw Materials,
October, CRU International, London, p.3.

260
CRU 2002a, “Industry developments”, CRU Monitor Steel Making Raw Materials,
October, CRU International, London, p.10.
CRU 2002b, “Chasing the Dragon”, CRU Monitor Steel, CRU International, London,
October, p.3.
CRU 2002c, The ten year outlook for metallics, A sustainable recovery? September
2002, CRU International, London, p.2.
CRU 2003a, “Industry news in brief”, CRU Monitor Steel Metallics Scrap, DRI and Pig
Iron, July, CRU International, London p.10.
CRU 2003b, “Industry news in brief”, CRU Monitor Steel Metallics Scrap, DRI and Pig
Iron, July, CRU International, London p.10.
CRU 2003, “Industry news in brief”, CRU Steel, July, CRU International, London p.13.
Dahlman, CJ 2001, China and the Knowledge Economy: Seizing the 21st Century,
World Bank Report, World Bank Institute.
Delaney, R 2002, “Alcoa set to increase output at China plant”, International Herald
Tribune, Monday, 9 December, p.B3.
Delaney, R 2003 “Tariffs help Baoshan to sharp increase in profit” International Herald
Tribune, Tuesday, 11 February, p.B1.
Demurger, S, Sachs, JD, Wing, TW, Bao, S, Chang, G & Mellinger, A 2002
Geography, Economic Policy and Regional Development in China, Discussion
paper, Harvard Institute of Economic Research, Harvard University, Cambridge,
Massachusetts, pp.8-12.
Department of Foreign Affairs & Trade (DFAT) 2001, Composition of Trade with
Australia 2000, April.
Derbyshire, J 2002, “Book Review”, The Washington Times, online,14 April, viewed 10
November 2002, <http://olimu.com/journalism/texts/reviews/chinadream.htm> .

261
Dorian, JP 1994, Minerals, Energy and Economic Development in China, Clarendon
Press, Oxford.
Dow Jones Newswires 2001, “Sumitomo considers tie-ups with Nippon”, The Asian
Wall Street Journal, 12 December, p.M8.
Economist Intelligence Unit 2001, “China economy - A promising market has yet to
deliver”, Country Briefing, online 3 July, Dow Jones Interactive, Fairfax edn, viewed
12 December 2002.
Feng, L 1994a, Changing comparative advantage and the restructuring of the
international steel industry, PhD thesis, Australian National University.
Feng, L 1994b, “China steel industry its rapid expansion and influence on the
international steel industry”, Resources Policy, vol.20, no. 4, December.
Five Year Plan 2003, online, viewed 4 March 2003, <www.sparticus.schoolnet.co.uk
/Rusfive.htm> .
Flint, DJ 2003, “Overview of the mineral exploration in Western Australia for 2002-
03”, Western Australia Geological Survey, Annual Review 2002-03, in press.
Flint, D & Searston, SM 2001-2002, “Overview of the mineral sector in Western
Australia in 2001-2002”, Geological Survey of Western Australia Annual Review
2001-2002, pp. 7-25, Department of Resources and Industry Resources, online,
viewed 26 November 2003, <http://www.doir.wa.gov.au/documents/gswa/
AR01_02_overview.pdf>.
Great Leap Forward, 2003, online, viewed 3 March 2003, <http//www.
historylearningsite.co.uk/great_leap_forward.htm> .
Greig, RA 1997, “Metals Markets and East Asia: Emerging Trends, Issues and
Policies”, Discussion Paper 97.27, Economic Research Centre, University of
Western Australia, Perth, Australia.

262
Guo Shuqing 2001, “China will increase Euros in reserves”, The Asian Wall Street
Journal, 21 November, p. M1.
Harney, A 2003,”China to seek tenders on nuclear plant”, Financial Times,
Thursday, 4 December, p.6.
Hijino, K 2001 “Economic war takes its toll”, Financial Times, Thursday, 6 December,
p.24.
Hogan, WT 1999, The Steel Industry of China, Lexington Books, Maryland, USA.
Holroyd, WG 1992, “Raw material trade: mine to market”, in SME Mining Engineering
Handbook, Hartman, HL (ed), Chapter.2.7, pp.17-121.
Hsieh, D 2002 “Foreign players give Chinese retailers run for their money”, The Straits
Times, 2 December, p.A3.
Hu Zuliu, F 2000, “Investment to flood in after WTO accession”, South China Morning
Post, 18 April.
Ibison, D 2001, “Japan’s last operating coal mine bows to the inevitable”, Financial
Times, 17 December, p.16.
Interfax 2003, China Energy Weekly, 22-28 February, vol.11, Issue 7, p.21
Interfax 2003, “Wisco signs 25 year, 75 mln ton supply deal with Australia’s Hamersley
Iron Ore”, Interfax China Business News, online, 3 September, Dow Jones
Interactive, Fairfax edn, viewed 1 December 2003.
International Iron & Steel Institute Statistics (IISI) 1974, Brussels, Table 4, p.5.
International Iron & Steel Institute (IISI) 1981, World Steel in Figures 1980, Brussels,
p.18.
International Iron & Steel Institute (IISI) 2002a, Steel Statistical Yearbook, Brussels,
December 2002, online, viewed 10 November 2003, < http://www.worldsteel.org/
media/ssy/iisi_ssy_2002.pdf>.

263
International Iron & Steel Institute (IISI) 2002b, Steel Statistical Yearbook, Brussels,
December 2002, online, viewed 10 November 2003, < http://www.worldsteel.org/
media/ssy/iisi_ssy_2002.pdf>.
International Iron & Steel Institute (IISI) 2003, World Steel in Figures 1980, Brussels,
p.11.
Iron and Steel Works of the World 15th Edition 2002, Metal Bulletin Directories Ltd,
Surrey, England, pp.41-50.
Iron Ore 2003, online, <www.liswa.wa.gov.au/wepon/mining/html/ironore .html>,
viewed 31 October 2003.
James, D 2002 “The China syndrome”, Business Review Weekly, 10-16 October, pp.54-
56.
Jefferson, GH 1990, “China’s iron and steel industry”, Journal of Development
Economics, vol.33, October, pp.329-355.
Jonquieres, GD 2002, “Steel-producing nations agree on negotiations to cut subsidies”,
Financial Times, Friday, 20 December, p.3.
King, N & Wonacott, P 2002, “Bush’s China-trade dilemma”, The Asian Wall Street
Journal, 15-17 November, p.A5.
Knutton, M 2002, “China spends its way out of capacity problems”, International
Railway Journal, May, vol.42, issue 5, p.17, online, Expanded Academic Index,
viewed 4 March 2003.
Kyne, P 2003, “Chinese consumer prices climb”, The Asian Wall Street Journal,
Tuesday, 16 September, p.A3.
Kynge, J 2001a, “China enters WTO dawn with mixed expectations”, Financial Times,
online, 10 December, Dow Jones Interactive, Fairfax edn, viewed 25 December
2002.

264
Kynge, J 2001b, “EU to take pragmatic line on Chinese trade”, Financial Times, 5
December, p.7.
Kynge, J 2002a, “China Sees a counterweight to the Dollar”, Financial Times, 2
January, p.3.
Kynge, J 2002b, “China experiments in trade in rural land”, Financial Times, 10
December, p.6.
Kynge, J 2002c, “Middle kingdom’s class revolution”, Financial Times, 11 December,
cited in FT.com, online, viewed 8 January 2003, <http://financialtimes.printthis.
clickability.com/ptcpt?action=cpt&expire=urlld=4844> .
Kynge, J 2003a, “Complaints force China to give way over steel tariffs” Financial
Times, 16 January, p.7.
Kynge, J 2003b, “Blueprint seeks to steer China past high-risk economic problems”,
Financial Times, 24 January, p.8.
Kynge, J & Dickie, M 2003, “China encourages urban migration in drive for higher
economic growth”, Financial Times, 28 November, p.2.
Kynge, J & Harney, A 2003, “China’s engine of growth faces brake on progress”,
Financial Times, 4 December, p.16.
Labson, S, Gooday, P & Manson, A 1995, China Steel: China’s Emerging Steel
Industry and its Impact on the World Iron Ore and Steel Market, ABARE Research
Report no.95.4, ABARE Economics, Canberra, A.C.T. pp.21-45.
Laprès, DA 2000, China Business Review, July-August.
Lardy, NR 2001, “China’s worsening debts”, The Financial Times, online, 22 June,
<http://www.brook.edu/views/op-ed/lardy/20010621.htm>, viewed 5 December
2002.

265
Lardy, NR 2002, “Problems on the Road to Liberalisation”, Financial Times, online, 15
March, viewed 8 December 2002, < http://www.brook.edu/views/op-ed/lardy/
20020315.htm>.
Leggett K. 2001, “China could clash with trade group”, The Asian Wall Street Journal,
online, 4 December, Dow Jones Interactive, Fairfax edn, viewed 3 February 2002.
Leow, J. 2002, “China likely to change the way it calculates GDP”, The Straits Times,
online, March 6, Dow Jones Interactive, Fairfax edn, viewed 4 April, 2002.
Leow, J 2003, “China set to be an economic power by 2050”, The Straits Times, 18
January, p.A3.
Li, R 2001, “Unemployment outlook gloomy”, South China Morning Post, 14
November.
Li, S 2000, “Chinese reforms forecast to reduce steel consumption growth”, Metal
Bulletin, Beijing, 27 September.
Lim, L 2003, “China to grant emission permits”, International Herald Tribune, March
19, p.B3.
Liu Q 1996, “The Chinese Iron and Steel Industry-Strategic Research Into Long Term
Iron Ore Imports”, Draft version of paper presented by the Executive Vice Chairman
of the Board China Iron and Steel and Trade Group Corporation at the 1st Iron Ore
and its Markets Conference, Perth, Australia, 26 -28 May, p.6 & p.8.
Luce, E. 2002, “Asean and China urged to step up free trade efforts”, Asia Financial
Times, 6 February, p.6.
Lundgren, N-G 1996, “Bulk trade and maritime transport costs,” Resources Policy,
vol.22, nos1 / 2, pp.5-32.
Mailer, N 2003, “Gaining an empire, losing democracy”, International Herald Tribune,
25 February, p.8.
266
Marsh, P & Mann, M 2001, “Steelmakers on collision course over cuts”, Financial
Times, 19 December, p.11.
Marsh, P 2003a, “World steel industry-special report”, Financial Times, 9 April, pp.i-vi.
Marsh, P 2003b, “China attracts Europe’s steel giants”, Financial Times, 17 November,
p.16.
Matthews, G 2002, “China may spur steel output”, The Asian Wall Street Journal, 25
November, p.A5.
McGregor, R 2002, “China hits Back at Japan over claims on cheap exports”, Financial
Times, 21 November, p.8.
McGregor, R & Leahy, J 2003, “Investors wary of manufacturing giant”, Financial
Times, 29 January, p.16.
McGregor, R 2003, “China’s central bank moves to curb lending”, Financial Times, 25
August, p.1.
McTaggart, D, Findlay, C & Parkin, M 1995, Economics, 2nd Edition, Addison Wesley,
Sydney, pp.98-119.
Meller, P 2003 “US tariffs on steel are illegal, WTO rules”, International Herald
Tribune, 14 July, p.9.
MEPS (Europe) LTD 2001, Global Iron and Steel Production to the Year 2005,
Techno-Marketing Research and Consultancy Services, England, UK, February
2001.
Metal Bulletin 1978, The Iron and Steel Industry of China, Metal Bulletin Limited,
London, England, pp.5-49.
Metal Bulletin 2001, “Japanese trading firms plan mega-merger”, 29 January 2001.
Metal Bulletin 2002, “China no longer self-sufficient”, online, 11 June, Dow Jones
Interactive, Fairfax edn, viewed 1 December 2002.

267
Midrex 2002, World Direct Reduction Statistics, online, viewed 3 November, 2003,
<http://www.midrex.com/info/world.asp> .
Mihui, K 2002, “Preparations underway for free trade agreement between Korea and
China”, The Korea Herald, 22 November.
Ministry of Foreign Trade and Economic Cooperation (MOFTEC) 2002, “Affiche on
the formal safeguard measure on part of import steel products from MOFTEC”
Affiche No.48, MOFTEC,PRC, 19 November
Morrison, K 2003, “Steel futures contract moves closer to reality”, Financial Times, 3
April, p.24.
Myers, JG & Barnett, H.J 1985, “Minerals and Economic Growth” in Vogely,W (ed),
Economics of the Mineral Industries, AIMMPE, pp.3-17.
O'Donnell, L 2000, “Big steel unsheathes the razor for 200,000 workers - dateline
Beijing”, The Australian, 23 August, p29.
OECD 2000, China in the Global Economy, Reforming China’s Enterprises, OECD
Report, p14.
Oldfield, S 2001, “BHP joins forces with Posco”, Australian Financial Review, 1
February, p12.
O’Neill, M. 2001a, “Trade fever takes hold of Beijing”, South China Morning Post,
online 21 November, Dow Jones Interactive, Fairfax edn, viewed 22 December 2002.
O’Neill, M 2001b, “Bank denies yuan pressure”, South China Morning Post, online 24
November, Dow Jones Interactive, Fairfax edn, viewed 22 December 2002.
O’Neill, M 2001c, “Economists rule out yuan change”, South China Morning Post, 30
October, Dow Jones Interactive, Fairfax edn, viewed 23 December 2002.
Patrose, P 2003 “Errors in shaping their cities could take Chinese urban planners
generations to undo”, Financial Times, 2 December 2003, p.12.

268
People’s Daily 2001a, “Global economic recession affects china's exports”, online, 7
December, viewed 20 January 2002, <http://english.peopledaily.com.cn>.
People’s Daily 2001c, “Global economic recession affects china's exports”, online, 7
December, viewed 20 January 2002, <http://english.peopledaily.com.cn>.
People’s Daily 2001b, “Effect of sluggish world economy to China's trade growth not to
be underestimated”, online, 30 October, viewed 6 January 2002, < http://
english.peopledaily.com.cn>.
People’s Daily 2002, “State owned banks asked to cut bad debts”, online, viewed 5
December 2002, <http://english.peopledaily.com.cn>.
Pfanner, E 2002, “Threat of deflation is economists’ no 1 worry”, International Herald
Tribune, 20 November, p.11.
Pu, H 2000, cited in “Chinese iron ore worries”, Mining Journal, London, 24 November,
p.408.
Reuters 2001a, “China's Jiang says globalisation "two-edged sword", Reuters News
Service, Beijing 3 July.
Reuters 2001b, “Yuan devaluation ruled out as US dollar slips amid recession”, South
China Morning Post, 9 November.
Reuters 2002, “AIDS crisis could hit economy china warned”, The Straits Times, 2
December, p.A3.
Richardson, K 2001. “China admits flaws in data; stuns few”, The Asian Wall Street
Journal, 22 November, p.M1.
Roberts, D & Clifford ML 2002, “Greater China”, Business Week, 9 December, pp.21-
32.
Roston, E & Fonda, D 2002, “China’s new party”, Time Magazine, 28 January, pp39-43.
Salomon Brothers 1997, Asia Pacific Equity Research, June, p.30.
269
Samuelson, RJ 2002 “Striving for surpluses, the trouble with China’s exports”,
International Herald Tribune, 5 December, p.2.
SBC Warburg Dillon Read 1998, Global Iron Ore Review – A commodity for the long
haul, Swiss Bank Corporation, Swiss Bank House, London, May 1998.
Smith M, 1987, “Channar set to lift Hamersley”, Financial Review, online, 2 July, Dow
Jones Interactive, Fairfax edn, viewed 4 December 2002.
South China Morning Post 2000, “Highlights of the agreement with European Union”,
23 May.
SSY Consultancy and Research Ltd 1999, Major Coal and Ore Ports, 5th edition, SSY
Consultancy and Research Ltd, London, England, pp.9-36 and pp.192-193.
State Economic & Trade Commission (SETC) 2001, Bureau of Economic Operations,
White Paper on Iron Ore & Steel (Supply & Demand), online, Guojingmaoyunxing,
no.46, <http://www.setc.gov.cn/english/index_e.htm>, viewed 15 January 2002,
Streats 2003, “China frets over food”, Streats, 3 December, p.31.
Su, K 1986, 1840-1983 Modern China A Topical History, New World Press, Beijing,
pp.51-56, pp.213-214.
Sugimoto, T.1993, “The Chinese steel industry”, Resources Policy, December 1993,
pp.264-286.
Taipei Times 2002, “China faces growing pile of bad loans”, Taipei Times, online, 27
October, < http://taipeitimes.com/news/archives/2002/10/27/000177305> viewed 30
October 2002.
Tarchalski, K 1995, “Economic reforms in China: implications for Chinese growth”,
Australian Bureau of Agricultural and Resource Economics, Canberra, vol.42, N12,
pp.985-1001.

270
Tcha, M & Wright, D 1999, “Determinants of China’s import demand for Australia’s
iron ore” Resources Policy, no.25, pp.143-149.
Tett, G & Kynge, J 2001, “Renminbi value sparks Tokyo concern”, Financial Times, 6
December, p.9.
The 128 Countries that had signed GATT by 1994 2003, online, viewed November
2003, <http://www.wto.org/english/thewto_e/gattmem_e.htm>.
The Asian Wall Street Journal 2002, “Honda controls China venture”, The Asian Wall
Street Journal, 25 November, p.M2.
The Asian Wall Street Journal 2003, “China’s producer prices rose 1.2% in October”,
The Asian Wall Street Journal, 27 November, p.A4.
The Economist 2002, “China-how cooked are the books?” The Economist, 16 March,
pp.35-36.
The Economist 2003, “Rich man, poor man”, The Economist, 27 September, pp.25-26.
The New Paper 2002a, “Will Chinese banks sink under bad debts?”, online, 22
September, viewed 10 December 2002, <http://newpaper.asia1.com.sg>.
The New Paper 2002b, “Will Chinese banks sink under bad debts?”, online, 22
September, viewed 10 December 2002, <http://newpaper.asia1.com.sg>.
The New Paper 2002, “$1,000 bn to fix China bank bad debts”, online, 31 October,
viewed 10 December 2002, <http://newpaper.asia1.com.sg>.
The Tex Report 2002-2003, Iron Ore Manual 2002-2003, p.53.
Tilton, J 1992 “Economics of the mineral industries" in Hartman, H (ed), SME Mining
Engineering Handbook 2nd edition, vol.1, pp. 47-62.
Tindale, NR 1997, “The structure of the Chinese steel industry and scenarios for its
future development”, Metal Bulletin’s 5th Asian Steel Conference, Hong Kong,
October.

271
Townsend, DB & Flint, D 1997, “Iron ore resources of the Hamersley Basin-where to
now?”, Ironmaking Resources and Reserves Estimation”, Perth, Western Australia
25-27 September 1997, published by the Australasian Institute of Mining and
Metallurgy, Parkville, Victoria, p.64.
Trench, J 2001, “China’s role in the iron and steel industry”, Proceedings of the 2001
Global Iron Ore Conference, London, 6 and 7 November, 2001, p.13.
Trounson, A 2003 “Australian resources industry looks to play its China hand”, The
Asian Wall Street Journal, 12 March, pp.M1-M2.
Trounson, A & King, D 2003, “Hope to down big two iron grip”, The Australian,
online, 11 November, Dow Jones Interactive, Fairfax edn, viewed 11 December
2003.
Tschang, Chi-Chu 2001, “China's economy to grow by at least 7pc”, South China
Morning Post, 4 December.
Understanding the WTO: The Organisation – Members and Observers 2003, online,
<http://www.wto.org/english/thewto_e/whatis_e/tif_e/org6_e.htm>, viewed 3
November 2003.
United Nations Conference on Trade and Development (UNCTAD) 2002, World
Investment Report 2002, Transnational Corporations and Export Competitiveness,
online,17 September, <http://r0.unctad.org/en/subsites/dite/fdistats_files/fdistats.
htm>, <http://r0.unctad.org/wir/contents/wir02_dl.htm>, viewed 6 December 2002.
Wagner, DB 1997, The Traditional Chinese Iron Industry and its Modern Fate, Curzon
Press, Surrey, England.
Wain, B 2002, “Asean, China near trade deal”, The Asian Wall Street Journal, 1-3
November, p.A4.

272
Wessel, D 2003, “China’s future rests on schools”, The Asian Wall Street Journal, 28
October, p.A4.
Western Australia, Department of Industry and Resources 2003, 2000-2001 Statistics
Digest, Western Australia.
Wang, Y 2001, “'Gold rush' in Australia”, Business Weekly, online 17 July, Factiva,
Dow Jones Interactive, Fairfax edn, viewed 1 December 2002.
Wolf, C 2002 “Capitalism Chinese style”, The International Economy, vol.16, i1,
Winter 2002, pp.48-49.
Wong, K 2003, “China raises reserve ratio for most banks”, International Herald
Tribune, 25 August, p.B1.
World Bank 1994, China Foreign Trade Reform, World Bank Country Study,
Washington DC, online, Econlit, AN 0329327, viewed 20 February 2003.
World Trade Organisation 2001, WTO International Trade Statistics 2001, France,
2002 online, <http://www.wto.org/english/res_e/statis_e/its2001_e/its01_toc_e.htm>,
viewed 9 May 2002
World Trade Organisation 2002, WTO International Trade Statistics 2002, p.127,
France, 2002, online, <http://www.wto.org/english/res_e/statis_e/its2002_e/
its02_toc_e.htm>, viewed 4 July 2003.
World Trade Organisation (WTO) 2003, Annual Report, France, 2002, p.10, Geneva,
online, <https://secure.vtx.ch/shop/boutiques/wto_index_boutique.asp?language
=E&rayon=annual_reportseng&bookmk=r_ar03_e>, viewed 21 October 2003.
Wright, T 2002, “Asean trade accord backfires”, The Asian Wall Street Journal, 2
December, p.A4.
Wu, X 2000, cited in “Chinese iron ore worries”, Mining Journal, London, 24
November, p.408.

273
Wu, Y 1995, “Productivity growth, technological progress, and technical efficiency
change in China: A three-sector anlaysis”, Journal of Comparative Economics,
21(2), October, pp.207-209.
Wu, Y 1996, Productive Performance in Chinese Enterprises: An Empirical Study,
Macmillan Press, London.
Wu, Y 1997, Is China’s Economic Growth Sustainable? A Productivity Analysis,
University of Western Australia, August
Wu, Y (ed) 1998, The Economics of the East Asia Steel Industries, Ashgate, England,
United Kingdom.
Wu, Y 2000, “The Chinese steel industry: recent developments and prospects”,
Resources Policy, no.26, pp.171-178.
Wu, Y & Ye, Q (eds) 1998, China’s Reform and Economic Growth, Asia Pacific Press,
Canberra, ACT, Australia.
Xinhua 2001, “China announces plan for industrial development in five years”, Xinhua
News Agency, June 25, online, Expanded Academic Index, viewed 2 June 2003.
Yeats, AJ 1991 China’s Foreign Trade and Comparative Advantage - Prospects,
Problems and Policy Implications, World Bank Discussion Paper no.141,
Washington, DC USA, November 1991.
Yoo, J 2001, “The Chinese are coming” Korean Herald, 2 July.
Young, I 1996, “Ninth five-year plan: a watershed for China”, Chemical Week, 28
August /4 September, 2001, pp.16-17, online, Expanded Academic Index, viewed 3
February 2003.
Young, I 2001, “China’s olympic hopes”, Chemical Week, 29 August /5 September,
2001, pp.6-9, online, Expanded Academic Index, viewed 3 February 2003.
274
Zhang, X & Zhang, S 2001, “Technical efficiency in China’s iron and steel industry:
evidence from the new census data”, International Review of Applied Economics,
vol.15, no.2.
Zhao, J 2001, “Market-led economic strategy needed” China Daily, 20 July.
Zhao, Z 1984, “The opening of China”, The Atlantic Monthly Magazine, online,
December 1984, v.254, p.24-25, Expanded Academic Index, viewed 8 February
2003.

275
9 Appendices
9.1 Global Iron & Steel Industry Data
9.1.1 China Steel Balance

276
9.1.2 Japan Steel Balance

277
9.1.3 Global Steel Production, 1900-2002
YearProduction
million tonnes
YearProduction
million tonnes
YearProduction
million tonnes
1900 28.3 1935 99.5 1970 595.41901 31.0 1936 124.3 1971 582.61902 34.5 1937 135.7 1972 630.71903 36.1 1938 110.0 1973 697.51904 36.3 1939 137.1 1974 703.81905 44.9 1940 140.6 1975 643.01906 51.2 1941 153.8 1976 675.51907 53.0 1942 151.4 1977 675.61908 41.4 1943 159.6 1978 717.21909 54.2 1944 151.2 1979 746.41910 60.3 1945 113.1 1980 716.01911 60.5 1946 111.6 1981 706.91912 72.8 1947 136.0 1982 644.81913 76.4 1948 155.3 1983 663.41914 60.4 1949 160.0 1984 710.61915 66.6 1950 191.6 1985 718.81916 78.2 1951 211.1 1986 713.41917 82.0 1952 211.6 1987 735.91918 77.2 1953 234.8 1988 779.61919 58.5 1954 223.8 1989 786.01920 72.5 1955 270.0 1990 770.51921 45.2 1956 283.5 1991 733.61922 68.8 1957 292.5 1992 719.71923 78.3 1958 274.3 1993 727.51924 78.5 1959 305.7 1994 725.11925 90.4 1960 346.4 1995 752.31926 93.4 1961 351.3 1996 750.01927 101.8 1962 360.1 1997 798.91928 110.0 1963 387.1 1998 777.21929 120.8 1964 433.4 1999 788.31930 95.1 1965 454.0 2000 847.61931 69.6 1966 472.7 2001 849.61932 50.7 1967 497.2 2002 897.01933 68.0 1968 529.81934 82.4 1969 574.6
Source: 1900 - 2001 Data:International Iron & Steel Institute Yearbooks, various years
International Iron and Steel Institute, Steel Statistical Yearbook 1982International Iron and Steel Institute, Steel Statistical Yearbook 1989International Iron and Steel Institute, Steel Statistical Yearbook 1991International Iron and Steel Institute, Steel Statistical Yearbook 1999International Iron and Steel Institute, Steel Statistical Yearbook 2001International Iron and Steel Institute, Steel Statistical Yearbook 2002
2002 Data: CRU Monitor Bulk Ferroalloys, March 2003

278
9.1.4 Summary-Crude Steel Production

279
9.1.5 China Steel Growth Predictions International Iron and Steel Predictions:
World annual growth 1.70%China annual growth 6.70%
Year
World Production
(million tonnes)
China Production
(million tonnes)
China as % of World
Production
2002 897 181.6 20%2003 912.2 193.7 21%2004 927.8 206.7 22%2005 943.5 220.5 23%2006 959.6 235.3 25%2007 975.9 251.1 26%2008 992.5 267.9 27%2009 1009.3 285.9 28%2010 1026.5 305.0 30%
Source: International Iron & Steel Predictions cited in:China Economic Information Service, CEIS 0423, 2002, “More steel products on demand in 2003”, Xinhua News Agency, 23 April, 2003, Beijing art.032

280
9.1.6 Summary-Continuously Cast Steel Production

281
9.1.7 Summary-Production of Steel in Oxygen Blown Converters

282
9.1.8 Summary-Production of Steel in Electric Arc Furnaces

283
9.1.9 Summary-Production of Steel in Open Hearth Furnaces

284
9.1.10 Summary-Apparent Crude Steel Consumption

285
9.1.11 Summary-Apparent Crude Steel Consumption per Capita
Apparent Consumption of Crude Steel per Capita
Kilograms crude steel1989 1990 1991 1992 1993 1994 1995 1996 1997 1998 1999 2000 2001
European Union 15 385.0 383.4 357.1 347.3 300.1 350.3 392.0 338.8 382.7 417.7 406.6 429.2 409.4 Other Europe 331.9 251.9 172.5 153.5 165.9 150.4 190.9 178.7 190.5 206.3 181.1 200.8 178.4 Former USSR 563.1 528.8 454.8 364.0 244.5 125.0 122.3 115.4 108.2 96.6 102.1 133.9 134.5 North America 307.5 304.2 266.9 285.3 298.1 337.8 312.0 326.0 345.7 379.5 363.1 379.0 321.7 South America 80.2 65.2 69.7 73.3 78.7 81.4 89.5 92.4 103.6 95.3 82.4 94.1 95.2 Africa 29.1 28.4 27.4 25.3 24.4 25.6 24.6 20.4 23.3 32.6 31.7 29.9 35.3 Middle East 89.5 88.4 89.8 103.3 108.5 100.2 88.5 101.1 109.6 130.8 127.6 136.3 148.4 Asia 86.5 89.7 91.3 89.8 107.4 103.2 102.0 104.7 106.2 95.7 106.2 114.6 100.7 Oceania 373.2 303.1 280.9 273.3 305.7 334.4 330.1 321.2 332.5 323.6 320.1 322.2 344.2 World 156.8 151.1 140.0 133.1 135.0 132.3 133.2 131.3 137.5 141.2 143.4 153.8 139.7
PR China 62.4 59.1 60.0 72.6 111.2 100.0 82.2 91.2 92.2 105.0 119.5 128.0 152.8 USA 412.3 412.4 354.7 381.2 404.3 450.6 427.8 448.1 461.3 498.1 467.4 482.8 401.3 Japan 757.9 802.0 800.1 676.0 646.4 634.9 673.7 664.8 684.5 563.1 557.7 635.0 589.0 Russia 398.2 268.3 142.2 148.2 134.8 136.8 123.3 142.9 196.3 215.2 Germany 560.7 562.2 488.5 480.0 386.8 467.9 498.1 417.2 464.5 486.4 468.2 505.1 478.6 Korea 430.3 501.0 602.1 531.2 604.4 721.0 827.3 864.8 867.6 560.4 756.8 846.0 Australia 406.3 323 306.3 292.8 326.1 354.7 346.6 333.8 357.9 349.5 340.7 336.5 360.8
Sources: International Iron and Steel Institute, Steel Statistical Yearbook 1999, Brussels, January 2000, pp196-198from 1998 on: IISI, Steel Statistical yearbook, 2002, p86-89

286
9.1.12 Productivity of Top 6 Crude Steel Producers
Productivity of top Crude Steel Producers
1975 1990 1991 1992 1993 1994 1995 1996 1997 1998 1999 2000 2001 2002Total Steel Production (thousand tonnes)
PR China 66,349 71,000 80,395 89,539 92,613 95,360 101,237 108,911 114,588 123,954 127,236 148,900 181,552 USA 89,726 79,738 84,322 88,793 91,244 95,191 95,535 98,486 97,653 97,427 101,824 90,100 92,378 Japan 110,339 109,649 98,132 99,623 98,295 101,640 98,801 104,545 93,548 94,192 106,444 102,900 107,748 Russia 67,029 58,346 48,812 51,589 49,253 48,502 43,822 51,510 59,098 59,000 58,567 Germany 38,434 42,169 39,711 37,625 40,837 42,051 39,793 45,007 44,046 42,062 46,376 44,800 45,004 Korea 23,125 26,001 28,055 33,026 33,745 36,772 38,903 42,554 39,896 41,042 43,107 43,900 45,390
PR China 2,059 1,993 2,298 1,831 1,748 1,640 1,849 1,795USA 457 204 171 167 163 160 153 151 140 124Japan 447 305 252 240 230 221 208 197 186 176RussiaGermany 213 125 93 86 82 80 78 77 76 74Korea n/a 67 66 68 67 67 67 66 63 58 58 57 57 57
PR China 46 51 47 63 71 78 81 101USA 0 440 557 572 604 610 637 674 644 745Japan 0 362 403 412 455 423 453 540 553 612RussiaGermany 0 307 452 463 549 551 539 602 589 608Korea N/A 346 391 415 497 502 548 585 670 683 708 756 770 796
Number of Employees (thousand)
Productivity (tonnes per employee)

287
9.1.13 Ranking of Steel Producing Countries, 1993-2002 The major steel-producing countries, 1993 to 2002 units in Million tonnes
Table shows countries producing more than two million tonnes of crude steel/ year
Rank Country 2002 2001 2000 1999 1998 1997 1996 1995 1994 1993
1 Mainland China 181.6 150.9 127.2 124 114.6 108.9 101.2 95.4 92.6 89.5
2 Japan 107.7 102.9 106.4 97.4 93.5 104.5 98.8 101.6 98.3 99.6
3 United States 92.2 90.1 101.5 94.2 97.7 98.5 95.5 95.2 91.2 88.8
4 Russia 59.8 59.0 59.1 51.5 43.8 48.5 49.3 51.6 48.8 58.3
5 F.R. Germany 45.0 44.8 46.4 42.1 44 45 39.8 42.1 40.8 37.6
6 R.o.Korea 45.4 43.9 43.1 41 39.9 42.6 38.9 36.8 33.7 33
7 Ukraine 33.4 33.1 31.4 27.5 24.4 25.6 22.3 22.3 24.1 32.6
8 Brazil 29.6 26.7 27.9 25 25.8 26.2 25.2 25.1 25.7 25.2
9 India 28.8 27.3 26.9 24.3 23.5 24.4 23.8 22 19.3 18.2
10 Italy 26.1 26.5 26.7 24.7 25.7 25.8 23.9 27.8 26.2 25.7
11 France 20.3 19.3 21 20.2 20.1 19.8 17.6 18.1 18 17.1
12 Taiwan 18.2 17.3 16.7 15.4 16.9 16 12.4 11.6 11.6 12
13 Turkey 16.5 15.0 14.3 14.3 14.1 14.5 13.6 13.2 12.6 11.5
14 Spain 16.4 16.5 15.8 14.9 14.8 13.7 12.2 13.8 13.4 13
15 Canada 16.0 15.3 16.6 16.2 15.9 15.6 14.7 14.4 13.9 14.4
16 Mexico 14.1 13.3 15.7 15.3 14.2 14.2 13.2 12.1 10.3 9.2
17 United Kingdom 11.7 13.5 15.2 16.3 17.3 18.5 18 17.6 17.3 16.6
18 Belgium 11.3 10.8 11.6 10.9 11.4 10.7 10.8 11.6 11.3 10.2
19 South Africa 9.1 8.8 8.4 7.9 7.5 8.3 8 8.7 8.5 8.7
20 Poland 8.4 8.8 10.5 8.8 9.9 11.6 10.4 11.9 11.1 9.9
21 Australia 7.5 7.0 8.5 8.2 8.9 8.8 8.4 8.5 8.4 7.9
22 Iran 7.3 6.9 6.6 6.1 5.6 6.3 5.4 4.7 4.5 3.7
23 Czech Republic 6.5 6.3 6.2 5.6 6.5 6.8 6.5 7.2 7.1 6.8
24 Austria 6.2 5.9 5.7 5.2 5.3 5.2 4.4 5 4.4 4.1
25 Netherlands 6.1 6.0 5.7 6.1 6.4 6.6 6.3 6.4 6.2 6
26 Sweden 5.8 5.5 5.2 5.1 5.2 5.1 4.9 5 5 4.6
27 Romania 5.5 4.9 4.8 4.4 6.4 6.7 6.1 6.6 5.8 5.4
Rank Country 2002 2001 2000 1999 1998 1997 1996 1995 1994 1993
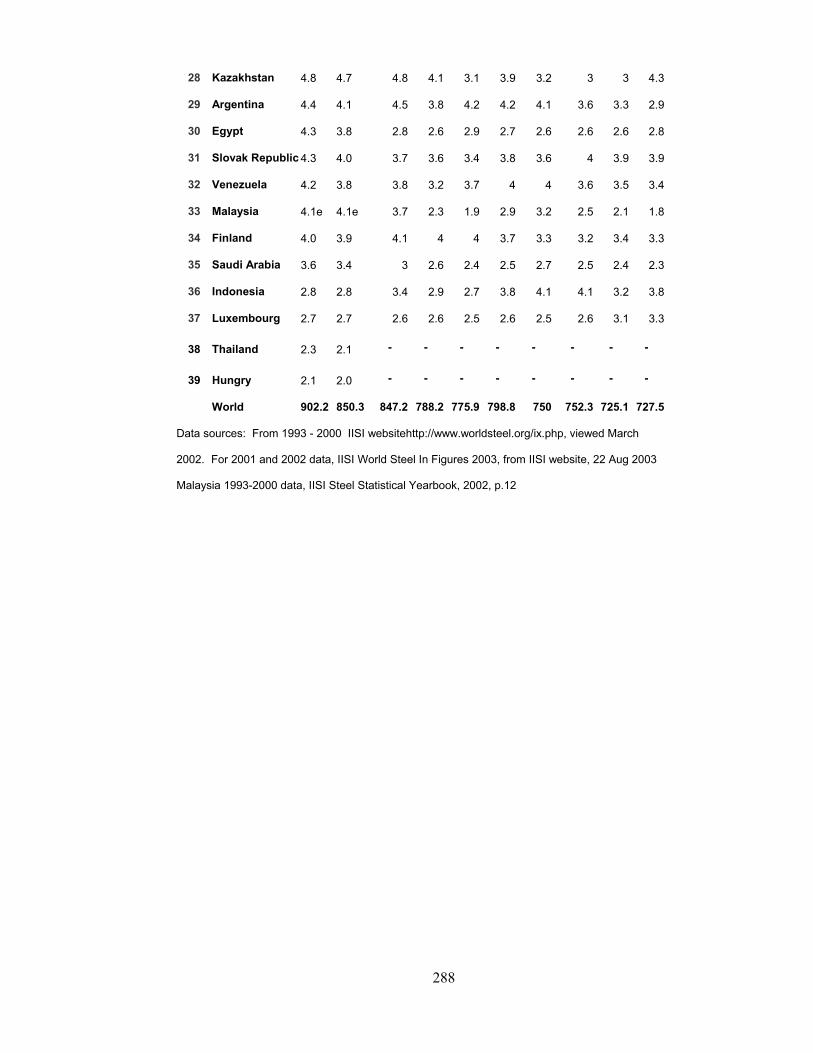
288
28 Kazakhstan 4.8 4.7 4.8 4.1 3.1 3.9 3.2 3 3 4.3
29 Argentina 4.4 4.1 4.5 3.8 4.2 4.2 4.1 3.6 3.3 2.9
30 Egypt 4.3 3.8 2.8 2.6 2.9 2.7 2.6 2.6 2.6 2.8
31 Slovak Republic 4.3 4.0 3.7 3.6 3.4 3.8 3.6 4 3.9 3.9
32 Venezuela 4.2 3.8 3.8 3.2 3.7 4 4 3.6 3.5 3.4
33 Malaysia 4.1e 4.1e 3.7 2.3 1.9 2.9 3.2 2.5 2.1 1.8
34 Finland 4.0 3.9 4.1 4 4 3.7 3.3 3.2 3.4 3.3
35 Saudi Arabia 3.6 3.4 3 2.6 2.4 2.5 2.7 2.5 2.4 2.3
36 Indonesia 2.8 2.8 3.4 2.9 2.7 3.8 4.1 4.1 3.2 3.8
37 Luxembourg 2.7 2.7 2.6 2.6 2.5 2.6 2.5 2.6 3.1 3.3
38 Thailand 2.3 2.1 - - - - - - - -
39 Hungry 2.1 2.0 - - - - - - - -
World 902.2 850.3 847.2 788.2 775.9 798.8 750 752.3 725.1 727.5
Data sources: From 1993 - 2000 IISI websitehttp://www.worldsteel.org/ix.php, viewed March
2002. For 2001 and 2002 data, IISI World Steel In Figures 2003, from IISI website, 22 Aug 2003
Malaysia 1993-2000 data, IISI Steel Statistical Yearbook, 2002, p.12

289
9.1.14 Top 50 Steel Producing Companies, 1999-2002 Data source: International Iron and Steel Institute
2002 2001 2000 1999
Steel Producer RankingMillion
TonnesRanking
Million
TonnesRanking
Million
Tonnes Ranking
Million
Tonnes
1 Arcelor 1 44 1 43.2 - - - -
2 LNM Group 2 34.8 4 19.2 - - - -
3 Nippon Steel 3 29.8 3 26.2 1 28.4 2 25.2
4 POSCO 4 28.1 2 27.8 2 27.7 1 26.5
5 Shanghai Baosteel 5 19.5 5 19.1 8 17.7 7 16.7
6 Corus 6 16.8 6 18.1 6 20 5 21.3
7 Thyssen Krupp 7 16.4 7 16.2 7 17.7 8 16.1
8 NKK 8 15.2 9 14.8 9 16 10 12.8
9 Riva 9 15 8 15 10 15.6 9 14.1
10 US Steel 10 14.4 11 12.8 14 10.7 11 11.3
11 Kawasaki 11 13.7 10 13.3 11 13 12 11.1
12 Nucor 12 12.4 13 11.2 16 10 14 9.4
13 Sumitomo 13 11.8 12 11.7 12 11.6 15 9.4
14 Gerdau 14 11.5 22 7.2 25 7.1 25 6.6
15 SAIL 15 11.4 14 10.8 13 10.9 13 10.2
16 Magnitogorsk 16 11.0 15 10.3 15 10 18 8.9
17 China Steel 17 10.5 16 10.3 17 10 16 9.3
18 Anshan 18 10.1 17 8.8 20 8.8 21 8.5
19 Severstal 19 9.6 19 8.1 18 9.6 17 9
20 Novolipetsk 20 8.6 21 7.9 21 8.2 23 7.5
21 Shougang 21 8.2 18 8.2 22 8 24 7.3
22 Bethlehem Steel 22 8.1 20 8 19 9.1 20 8.5
23 Wuhan 23 7.6 23 7.1 26 6.7 26 6.2
24 NISCO 24 7.3 24 6.9 27 6.6 27 6.1
25 INI Steel 25 7.3 27 6.6

290
2002 2001 2000 1999
Steel Producer RankingMillion
TonnesRanking
Million
TonnesRanking
Million
Tonnes Ranking
Million
Tonnes
26 Krivorozstal 26 6.9 25 6.9 29 6.1 32 5.3
27 Kobe Steel 27 6.6 26 6.7 28 6.4 28 5.7
28 BHP Steel 28 6.4 28 6.0 23 7.5 19 8.5
29 Benxi 29 6.2 38 4.9 49 4.2 58 3.3
30 Mariupol (Ilyich) 30 6.1 31 5.8 33 5.5 35 4.8
31 Polskie Huty Stali 31 5.9 30 5.8
32 Voest-Alpine 32 5.8 34 5.3 36 5.2 37 4.7
33 Zapsib 33 5.7 32 5.6 35 5.3 38 4.7
34 Maanshan 34 5.4 40 4.8 53 3.7
35 Nizhny Tagil 35 5.3 35 5.2 39 4.9 43 4
36 AK Steel 36 5.3 36 5.2 31 5.8 30 5.6
37 National Steel 37 5.2 33 5.4 32 5.6 29 5.7
38 Salzgitter 38 5.1 37 5.1 37 5.1 33 5
39 CSN 39 5.1 50 4.0 41 4.8 34 4.9
40 Tangshan 40 5.1 52 3.9 63 3.2
41 Panzhihua 41 5.0 58 3.6 57 3.6
42 Hualing 42 4.9 49 4.1 70 2.9
43 CST 43 4.9 39 4.8 42 4.8 40 4.4
44 Baotou 44 4.8 46 4.2 51 3.9
45 Azovstal 45 4.7 41 4.7 47 4.3 49 3.6
46 Stelco 46 4.7 45 4.5 38 5.1 36 4.7
47 USIMINAS 47 4.6 42 4.6 44 4.4 66 3
48 Erdemir Group 48 4.6 43 4.5 84 2.4
49 Handan 49 4.5 61 3.4 65 3.2
50 Techint 50 4.5 44 4.5 43 4.6 45 3.8

291
9.2 China and Global Iron Ore Data
9.2.1 World and China’s Historical Iron Ore Production
Historical Production of Iron ore for China and the World, 1948-2002
YearChina (1,000
tonnes)
World (1,000
tonnes)Year
China (1,000
tonnes)
World (1,000
tonnes)Year
China (1,000
tonnes)
World (1,000
tonnes)1948 245.9 181,660.8 1968 37,998.4 685,231.0 1988 154,371.0 967,162.91949 499.9 205,130.4 1969 40,030.4 723,804.5 1989 171,840.1 1,013,324.91950 2,000.5 250,444.0 1970 43,688.0 769,125.2 1990 168,290.2 982,944.41951 3,000.2 294,030.4 1971 54,864.0 787,071.8 1991 176,059.6 955,563.21952 4,368.8 297,281.6 1972 59,944.0 778,408.4 1992 197,588.6 924,834.31953 5,689.6 338,088.2 1973 55,880.0 845,660.5 1993 234,646.2 953,043.61954 7,315.2 305,747.9 1974 59,996.8 897,005.1 1994 240,186.5 969,379.81955 7,010.4 369,231.7 1975 64,996.6 901,967.2 1995 249,335.5 1,034,787.91956 9,042.4 394,493.5 1976 60,045.6 899,259.6 1996 252,283.0 1,033,501.01957 15,036.8 429,439.8 1977 49,987.2 841,061.1 1997 268,622.8 1,063,904.01958 29,972.0 405,076.2 1978 70,002.4 847,236.3 1998 222,236.0 1,004,884.01959 45,008.8 438,261.8 1979 74,980.8 904,227.8 1999 237,230.0 1,016,080.01960 54,965.6 520,526.3 1980 74,980.8 895,827.5 2000 223,950.0 1,074,023.01961 34,950.4 502,517.7 1981 66,040.0 858,119.7 2001 217,015.0 889,969.01962 29,972.0 507,705.4 1982 69,088.0 780,863.1 2002 231,430.0 1,097,000.01963 34,950.4 523,377.2 1983 71,120.0 739,899.01964 36,982.4 582,624.2 1984 74,996.0 829,301.91965 39,014.4 620,966.0 1985 79,995.8 860,507.31966 40,030.4 635,811.8 1986 99,994.7 865,927.71967 27,940.0 622,625.1 1987 112,993.4 902,685.5
Sources:American Iron Ore Association reports - 1996, 1990, 1982, 1979, 1970, 1962, 1957 "World production of Iron Ore, Iron Ore Concentrates and Iron Ore Agglomerates by Countries"The above reports were used for data from 1948 to 1995. Original data was in US tons. Conversion was made to metric tonnes.From 1996 data from International Iron and Steel Institute 2002 Data for the world from AME Iron Ore Outlook, January 20032002 Data for China from China Customs Bureau

292
9.2.2 Australian Historical Iron Ore Production, 1950-2002
YearWestern Australia
(million tonnes
Rest of Australia (million tonnes)
Total (million tonnes) Year Western Australia
(million tonnes
Rest of Australia
(million tonnes)
Total (million tonnes)
1950 0.02 2.40 2.42 1977 83.52 12.41 95.921951 0.04 2.46 2.49 1978 82.50 10.64 93.131952 0.23 2.75 2.97 1979 85.17 6.55 91.721953 0.72 2.64 3.36 1980 84.97 10.56 95.531954 0.66 2.93 3.59 1981 75.30 9.36 84.661955 0.54 3.11 3.64 1982 78.18 9.51 87.691956 0.34 3.66 4.00 1983 74.98 6.05 81.041957 0.42 3.46 3.88 1984 90.91 4.14 95.051958 0.58 3.42 4.00 1985 88.77 8.71 97.481959 0.74 3.49 4.23 1986 81.29 1.27 82.561960 0.94 3.51 4.45 1987 89.12 1.26 90.381961 1.38 4.08 5.46 1988 98.32 1.61 99.931962 1.45 3.59 5.05 1989 106.00 4.50 110.501963 1.35 4.33 5.69 1990 105.00 6.35 111.351964 1.38 4.46 5.84 1991 113.69 3.45 117.131965 2.28 4.53 6.80 1992 108.00 3.94 111.941966 4.23 6.83 11.07 1993 116.00 4.15 120.151967 10.14 7.02 17.16 1994 124.17 4.23 128.401968 23.25 3.37 26.62 1995 135.97 6.97 142.941969 25.08 13.50 38.58 1996 133.65 4.23 137.881970 43.19 8.00 51.19 1997 151.72 6.05 157.771971 52.03 10.04 62.06 1998 143.75 9.49 153.241972 56.12 8.28 64.40 1999 143.01 6.96 149.971973 75.90 8.93 84.83 2000 158.87 9.07 167.941974 87.00 9.95 96.95 2001 166.01 15.54 181.551975 85.19 12.46 97.65 2002 171.76 10.94 182.701976 85.57 7.68 93.26
Sources: 2000 -2001, 2001-2002 Statistics Digest - Department of Mineral and Petroluem Resources
Western Australia Government Publication

293
9.2.3 Australian Exports of Iron Ore, 2000-2002
Value (A$)
Percent. of Total
Value (A$)
Percent. of Total
Value (A$)
Percent. of Total
China 1,150,982,812 24.4% 1,348,967,319 26.8% 1,349,033,572 27.7%Japan 1,934,796,821 41.1% 2,139,161,337 42.5% 2,089,908,402 42.9%South Korea 625,596,362 13.3% 770,929,965 15.3% 725,532,842 14.9%Taiwan 345,654,149 7.3% 371,287,593 7.4% 346,370,325 7.1%Europe 395,561,843 8.4% 346,480,365 6.9% 325,687,692 6.7%Other 256,740,245 5.5% 59,543,242 1.2% 35,927,610 0.7%TOTAL 4,709,332,232 100.0% 5,036,369,821 100.0% 4,872,460,442 100.0%
Iron Ore 2000 Iron Ore 2001 Iron Ore 2002
Source: Department of Industry and Resources (Western Australia)

294
9.2.4 China Iron Ore Imports and GDP, 1981-2002
Year Iron Ore Import (million Tonnes)
GDP (billion Yuan)
1981 3.34 486.201982 3.45 529.501983 4.38 593.501984 5.97 717.101985 10.11 896.401986 12.00 1,020.201987 12.10 1,196.301988 10.76 1,492.801989 12.41 1,690.901990 14.19 1,854.801991 19.03 2,161.801992 25.17 2,663.801993 33.02 3,463.401994 37.34 4,675.901995 41.15 5,847.801996 43.87 6,788.501997 55.00 7,446.301998 51.00 7,834.501999 55.00 8,205.402000 70.00 8,940.402001 92.30 9,593.302002 111.50 10,239.80
Source: China Customs Bureau
Asian Development Bank

295
9.2.5 Iron Ore Fines Pricing into Asia, 1973-2002
Year Price (UScpDLTU) Year Price
(UScpDLTU)
1973 13.41 1989 26.761974 17 1990 31.031975 17 1991 33.491976 17.7 1992 31.851977 20.6 1993 28.351978 21.2 1994 25.661979 23.1 1995 27.151980 27.6 1996 28.761981 29.7 1997 29.11982 34.8 1998 29.921983 30.45 1999 26.631984 26.67 2000 27.791985 27.05 2001 28.981986 25.97 2002 28.281987 24.67 2003 30.341988 23.68
Source: The Tex Report, Iron Ore Manuals -
1975 (p175); 1980 (p21); (p.10)
1986-1987(p.30); 1995-96(p3); 2001-2002(p11);
2001-2002(p9); 2002-2003
2003 - BHP Billiton

296
9.2.6 Composition of Iron Ore Imports to China, 1975-2002

297
9.2.7 Composition of Australian Iron Ore Exports, 1975-2002

298
9.3 Key phases of China’s reform
First phase 1978-1984
o Rehabilitating the economy after the great leap forward o Placing greater emphasis on the market o Setting up special economic zones o Encouraging material incentives.
Second phase 1984-1988
o Reforming the urban industrial sectors o Introducing enterprise taxation o Reforming the wage system (linking pay to productivity) o Reforming the investment system – encouraging borrowing o Attracting capital and expertise. 14 major coastal cities were opened up (this
was subsequently expanded). Third phase 1988-1991
o Period of retrenchment o Reforms increased demand and production and led to inflation o Tackling an overheated economy – aim to slow down industrial sector. This led
to increased debt levels. Fourth phase 1992-
o Authorities announcing intention to accelerate the reform process o Communist party embraced Deng Xiaoping’s view that the market system was
not incompatible with the ideals of socialism o In March 1992, China’s constitution was amended to delete references to “ a
planned economy” and to enshrine the new goal of establishing A MARKET SYSTEM
o Extension of open door policy to all of China o More special economic zones were opened. o Became member of WTO in November 2001.
Sources: Bell et al (1993, pp.2-5) and Demurger et al (2002)

299
9.4 China Steel Industry
9.4.1 Steel products supply in 2002 with forecast for 2003
Product Supply In 2002 (1,000 tonnes)
Forecast Supply in 2003 (1,000 tonnes) % chg
Crude Steel output 180,000 207,000 15.00 Steel products output 192,000 225,000 17.20 Steel products import 24,000 27,000 12.50 Steel products export 5,100 5,200 1.96 Apparent consumption of steel products 210,900 246,800 17.00
Data source: The State Information Centre (cited in CEIS 0409 2003, art.30)
9.4.2 China's output of major steel products, 2002
Product Output in 2002 (1,000 tonnes)
% Change Over 2001
Crude steel 181,552 20.3 Pig iron 170,745 16.1 Rolled steel 192,183 18.9 Coke 112,370 10.3 Ferroalloy 4,836 5.4 Railway steel 1,852 8.7 Heavy section 2,678 19.2 Medium section 7,316 10.8 Light section 53,038 20.9 Quality section 11,263 22.8 Wire rod 35,623 18.1 Medium plate 24,603 22.4 Sheet 22,445 11.8 Steel strip 15,051 27.6 Silicon steel 1,845 10.0 Seamless tube 6,083 18.6 Welded pipe 7,012 9.5
Data source: National Bureau of Statistics, cited in CEIS 0314 2003, art.038

300
9.4.3 Import and export of major steel products, 2002
Product Import in 2002
(1,000 tonnes)
% Change from 2001
Export in 2002
(1,000 tonnes)
% Change from 2001
Iron ore 111,496 20.7 1.0 19.1 Steel scrap 7,853 -19.7 6 -35.2 Pig iron 696 35.1 422 -39.8 Ferroalloy 93 158.4 1,330 9.2 Billet, slab 4,687 -43.9 1,352 -50.4 Finished steel 24,535 42.0 5,488 15.4 Bars, rods 1,025 39.2 1,453 54.2 Angle, shape, section 209 0.5 358 -1.8
Flat products 21,174 42.2 1,796 2.2 Wire 428 20.8 311 38.5 Pipe, tube, fittings
1,392 67.4 1,449 4.8
Stainless steel 2,594 39.5 109 64.7 HR plate>600mm 1,170 43.7 4 54.5
CR sheet>600mm 921 53.3 13 33.8
Data source: China Economic Information Service (CEIS 0314 2003, art.039)

301
9.4.4 Output of Non Ferrous metals, 2002
Metal Output in 2002 (tonnes)
% Change Over 2001
Copper 1,579,996 11.05 Copper Concentrate-based 1,306,565 12.00
Aluminium 4,358,286 26.81 Alumina - based 4,271,031 26.31 Lead 1,288,210 4.89 Lead Concentrate-based 1,157,192 9.39
Zinc 2,105,810 1.54 Zinc Concentrate-based 2,071,528 0.63
Nickel 53,528 6.10 Tin 75,068 -18.87 Antimony 123,993 -7.91 Mercury 495 157.81 Magnesium 231,739 14.68 Sponge titanium concentrate 3,648 47.99
Copper 556,067 -1.66 Lead 568,354 -4.76 Zinc 1,499,173 -6.26 Nickel 54,646 6.09 Tin 62,171 -16.36 Antimony 57,271 -39.32 Intermediary Concentrate-based Copper
1,187,113 7.73
Anode Alumina 5,444,366 14.78 Semis Copper 2,512,041 27.94 Semis Aluminium 2,744,359 14.94
Data source: China Nonferrous Metal Industry Association cited in China Economic
Information Service (CEIS 0314 2003, art.040).

302
9.4.5 Import and Export of Major Metals, 2002
Product Import in 2002
(1,000 tonnes)
% Change from 2001
Export in 2002
(1,000 tonnes)
% Change from 2001
Copper Refined 1,181 41.4 77 50.2 Alloy 44 56.2 0 48.9 Semis 918 23.9 172 38.7
Concentrate Scrap 3,080 -7.6 8 -21.7
Aluminium Refined 271 19.6 621 110.5 Alloy 311 2.6 167 46.4 Semis 476 17.7 189 39.1 Scrap 447 21.1 10 4.5 Alumina 4,571 36.6 24 -6.4
Lead Refined 31 154.7 394 -10.0 Alloy 27 62.3 25 -22.1
Concentrate Zinc
Refined 68 269.7 473 -12.7 Alloy 143 16.8 23 15.4
Concentrate Tin
Refined 3.6 29.0 32.2 -29.7 Alloy 4.4 19.1 10.4 -9.1
Nickel Refined 31.5 -11.6 4.4 -16.9 Alloy 6.9 294.2 0 -45.1
Data source: China Economic Information Service (CEIS 0314 2003, art.041).

303
9.4.6 Import Value of Major Commodities, 2002
Item Value in 2002 (US$ 1,000)
% Change Over 2001
Pig iron 895,644 -15.6 Steel billets and rough forgings
858,902 -43.2
Rolled steel 12,365,854 38.0 steel rod 529,650 31.5 angle & shaped steel 102,942 -9.9
Plate 10,179,231 38.6 Pipe 1,079,717 52.7
Standard steel fixer 539,279 34.4 Iron ore 2,769,096 10.6
Data source: General Administration of Customs (2003) cited in China Economic
Information Service, CEIS 0307 2003 arts.015 & 017.
9.4.7 China’s Import Volume of Major Commodities, 2002
Item Quantity in 2002 (1,000 tonnes)
% Change Over 2001
Pig iron 7,850 -19.8 Steel billets and rough forgings 4,600 -43.7
Rolled steel 24,490 42.2 steel rod 1,030 39.3 angle & shaped steel 230 11.7
Plate 21,170 42.2 Pipe 1,370 68.0
Iron ore 111,500 20.8 Manganese ore 2,080 21.6 Copper ore 2,070 -8.4 Chromium ore 1,140 4.8 Alumina 4,570 36.6 Coal 10,801 333.6
Data source: General Administration of Customs (2003) cited in China Economic
Information Service, CEIS 0306 2003 arts.012 & 014.

304
9.4.8 Automobile Makes, Output and Sales in China, 2002
ENTERPRISE OUTPUT SALES
FAW Car 30,165 26,629
FAW Volkswagen 191,695 207,858
Shanghai Volkswagen 278,890 301,095
Shanghai GM 93,822 93,107
Guangzhou Honda 45,075 45,209
Tianjin Automotive 89,720 95,433
Tianjin Toyota 2,147 2,040
Dongfeng Citroen 79,451 81,579
Chang’an Suzuki 67,846 65,018
South Asia 23,393 23,002
Qinchuan 16,500 17,018
Fenshen 38,897 41,060
Beijing Hyundai 1,356 1,002
SAIC Chery 20,080 20,368
Dongfeng Yueda 49,397 50,155
Jiangbei 481 481
Jiangnan 189 269
Guizhou 1,831 1,775
Harbin Aircraft 14,577 11,270
Changhe 20,564 21,018
FAW Hainan 4,576 4,023
Geely Auto 47,443 45,972
Shenyan Brilliance 8,890 8,816
Total 1,126,985 1,164,197
Data source: China Economic Information Service (CEIS 0401 2003, art.002)

305
9.4.9 Automobile Output by Region, 2002
Region Output (1,000 units)
Beijing -
Tianjin 94
Hebei 19
Shanxi 1
Inner Mongolia 1
Liaoning 90
Jilin 520
Heilongjiang 185
Shanghai 392
Jiangsu 168
Zhejiang 45
Anhui 136
Fujian 48
Jiangxi 208
Shandong 20
Henan 16
Hubei 394
Hunan 28
Guangdong 65
Guangxi 172
Hainan 333
Chongqing 331
Xichuan 33
Guizhou 3
Yunnan 39
Tibet
Shaanxi 32
Gansu 4
Xinjiang 4
National total 3,251
Source: National Bureau of Statistics (cited in CEIS 0328, 2003, art.003)

306
9.5 Selected China Economic Indicators
9.5.1 Economic Data Base

307
9.5.2 China’s GDP, Trade and Output, 1981-2002

308
9.5.3 China’s Money Supply, 1981-2002
YearNarrow
Money, M1 {US$ billion}
Rate of M1 growth
(%)
Broad Money, M2
{USD billion}
Rate of M2 growth (%)
M1 to M2 Ratio
1981 76.89 113.04 0.681982 77.40 0.67 117.82 4.23 0.661983 88.29 14.07 136.96 16.24 0.641984 87.60 -0.79 128.70 -6.03 0.681985 94.24 7.58 152.27 18.32 0.621986 103.68 10.02 170.58 12.02 0.611987 122.89 18.53 213.78 25.33 0.571988 147.42 19.96 257.97 20.67 0.571989 123.55 -16.19 241.27 -6.47 0.511990 134.24 8.65 281.15 16.53 0.481991 165.40 23.21 342.26 21.73 0.481992 203.66 23.13 422.95 23.58 0.481993 288.98 41.90 598.97 41.62 0.481994 255.03 -11.75 555.52 -7.25 0.461995 288.40 13.08 730.41 31.48 0.391996 343.63 19.15 917.01 25.55 0.371997 420.61 22.40 1,099.00 19.85 0.381998 470.53 11.87 1,262.26 14.86 0.371999 553.62 17.66 1,448.13 14.72 0.382000 642.07 15.98 1,626.24 12.30 0.392001 723.37 12.66 1,847.20 13.59 0.392002 856.34 18.38 2,213.85 19.85 0.39
Source: Asian Development Bank, Key Indicators
1981-1983 key indicators 1999;
1984-2001 key indicators 2000, 2001, 2002
2002 key indicators 2003. In many cases, data in earlier years was updated from 2003
key indicator values

309
9.5.4 Debt Level Comparisons, 1981-2002

310
9.5.5 Intensity of Steel Demand, 1952-2002
YearGDP per capita {yuan}
Steel consumption
{thousand tonnes}
Intensity of Steel
Consumption {1,000 t/yuan}
YearGDP per capita {yuan}
Steel consumption
{thousand tonnes}
Intensity of Steel
Consumption {1,000 t/yuan}
1952 119 1,349 11.34 1978 379 42,578 112.341953 142 1,700 11.97 1979 417 44,863 107.591954 144 2,230 15.49 1980 460 43,005 93.491955 150 2,853 19.02 1981 489 39,201 80.141956 165 4,465 27.06 1982 525 40,935 77.971957 168 5,350 31.85 1983 580 52,349 90.261958 200 8,000 40.00 1984 692 60,834 87.961959 216 13,865 64.19 1985 853 72,540 85.051960 218 18,671 85.65 1986 956 77,549 81.091961 185 8,703 47.04 1987 1,104 72,105 65.341962 173 6,672 38.57 1988 1,355 70,689 52.161963 181 7,619 42.09 1989 1,511 71,030 46.991964 208 9,643 46.36 1990 1,634 68,279 41.791965 240 12,230 50.96 1991 1,879 70,180 37.361966 254 15,325 60.33 1992 2,287 87,010 38.051967 235 10,287 43.77 1993 2,939 126,110 42.911968 222 9,045 40.74 1994 3,923 121,810 31.051969 243 13,330 54.86 1995 4,853 101,100 20.831970 275 17,786 64.68 1996 5,575 112,460 20.171971 288 21,317 74.02 1997 6,053 119,660 19.771972 292 25,679 87.94 1998 6,307 131,700 20.881973 309 29,803 96.45 1999 6,534 151,150 23.131974 310 25,400 81.94 2000 7,082 163,240 23.051975 327 28,579 87.40 2001 7,542 196,350 26.031976 316 26,429 83.64 2002 7,972 211,230 26.501977 339 30,284 89.33
Sources: Asian Development Bank Country Key Economic Indicators 1999, 2000, 2001, 2002, 2003
International Iron & Steel Institute various yearbooks

311
9.5.6 China’s Trade with Australia, 1982-2002
Year (A$1,000) US$ million (A$1,000) US$ million
1982 766,236.00 421.43 292,891.00 161.091983 467,333.00 257.03 253,365.00 139.351984 871,197.00 479.16 354,669.00 195.071985 1,271,042.00 699.07 415,094.00 228.301986 1,587,279.00 873.00 499,627.00 274.791987 1,526,046.00 839.33 739,271.00 406.601988 1,079,102.00 593.51 886,650.00 487.661989 1,193,285.00 656.31 1,227,004.00 674.851990 1,292,788.00 711.03 1,331,050.00 732.081991 1,523,601.00 837.98 1,726,600.00 949.631992 1,875,105.00 1,031.31 2,317,470.00 1,274.611993 2,297,097.00 1,263.40 2,924,457.00 1,608.451994 2,815,148.00 1,548.33 3,373,017.00 1,855.161995 3,131,726.00 1,722.45 3,861,472.00 2,123.811996 3,877,541.00 2,132.65 4,121,992.00 2,267.101997 3,976,587.00 2,187.12 4,739,335.00 2,606.631998 3,792,032.00 2,085.62 5,822,546.00 3,202.401999 4,090,138.00 2,249.58 6,613,066.00 3,637.192000 6,008,786.00 3,304.83 9,073,206.00 4,990.262001 7,581,662.00 4,169.91 10,311,902.00 5,671.552002 8,373,151.00 4,605.23 12,847,201.00 7,065.96
Sources: DFAT, Exports of Major Commodities, Time Series Australia,
1982-1999, June 2000 pp.34-35 and subsequent correspondence
Dept of Foreign Affairs and Trade, Exports of Major Commodities, Time Series
Australia, 1984-2001, May 2002 pp.30-31
Sources (for Imports) Dept of Foreign Affairs and Trade - Composition of Australian
Trade 2001, page 163
Composition of Trade Australia 2001, DFAT, May 2002, page 43-47
Composition of Trade Australia 2002, DFAT, May 2003, pages 50 and 55
Merchandised TradeImports from Australia Exports to Australia

312
9.5.7 Industrial Added Value by China’s Regions, 2002
Region Value in 2002 (billion yuan)
% Change Over 2001
Beijing 82.33 8.0 Tianjin 82.28 17.8 Hebei 140.67 14.0 Shanxi 60.87 16.8 Inner Mongolia 36.81 19.1 Liaoning 137.62 13.1 Jilin 64.44 18.6 Heilongjiang 128.06 12.0 Shanghai 219.62 13.9 Jiangsu 353.63 15.7 Zhejiang 235.65 19.0 Anhui 65.61 15.3 Fujian 104.71 20.1 Jiangxi 36.03 16.1 Shandong 350.25 17.3 Henan 143.08 14.2 Hubei 119.90 12.3 Hunan 70.92 16.1 Guangdong 422.46 15.0 Guangxi 36.70 12.3 Hainan 6.85 19.1 Chongqing 39.74 15.2 Sichuan 91.53 17.2 Guizhou 27.04 12.1 Yunnan 63.21 8.1 Tibet 1.03 5.0 Shaanxi 53.06 14.5 Gansu 34.06 10.6 Qinghai 8.01 14.6 Ningxia 9.22 13.6 Xinjiang 36.99 8.4
Data source: National Bureau of Statistics 2003 (cited in CEIS 0217 2003, art.40)

313
9.6 China Map - Steel and Iron Ore Regions
314
9.7 Australia – China Shipping Map
Source: SSY Consultancy and Research Ltd 1999, (between pages 192 and 193)

315
9.8 Developments in China’s Iron & Steel Industry
As an example of the development that is occurring throughout China’s iron and steel
industry, two examples are outlined below. These are typical of many such capacity
investments occurring.
Baosteel
• Baosteel plans to construct four specialised production bases - Carbon steel plate
and tube production, stainless steel production, special steel production and steel
stretching base (CEIS 0709 2003, art 037)
• Construction of two steel mills costing 12 billion yuan (US$1.45 billion). One
mill consists of a wide and heavy plate rolling production line and supporting
continuous casting facilities. It is scheduled for operation by April 2005. The
second mill will be for producing cold rolled flat plate project and this will be
operational in March 2005. The mills are to satisfy a growing demand for steel
in the automotive, shipbuilding and construction industries (CEIS 0115, 2003
art.035).
Pingxiang Steel (Jiangxi Province)
Pingxiang Steel is building a 2 million-tonne Greenfield integrated steelworks in
Baiyuan County, near Pingxiang at a cost of 5 billion yuan. It will be built in two
stages and be completed by October 2005. The new steelworks will have three 450-
cubic-meter furnaces, three 20-tonne converters, three 3-strand billet casters, two high-
speed wire rod and bar mills, and accompanying sinter and coking mills (CEIS 0710
2003, art.032).
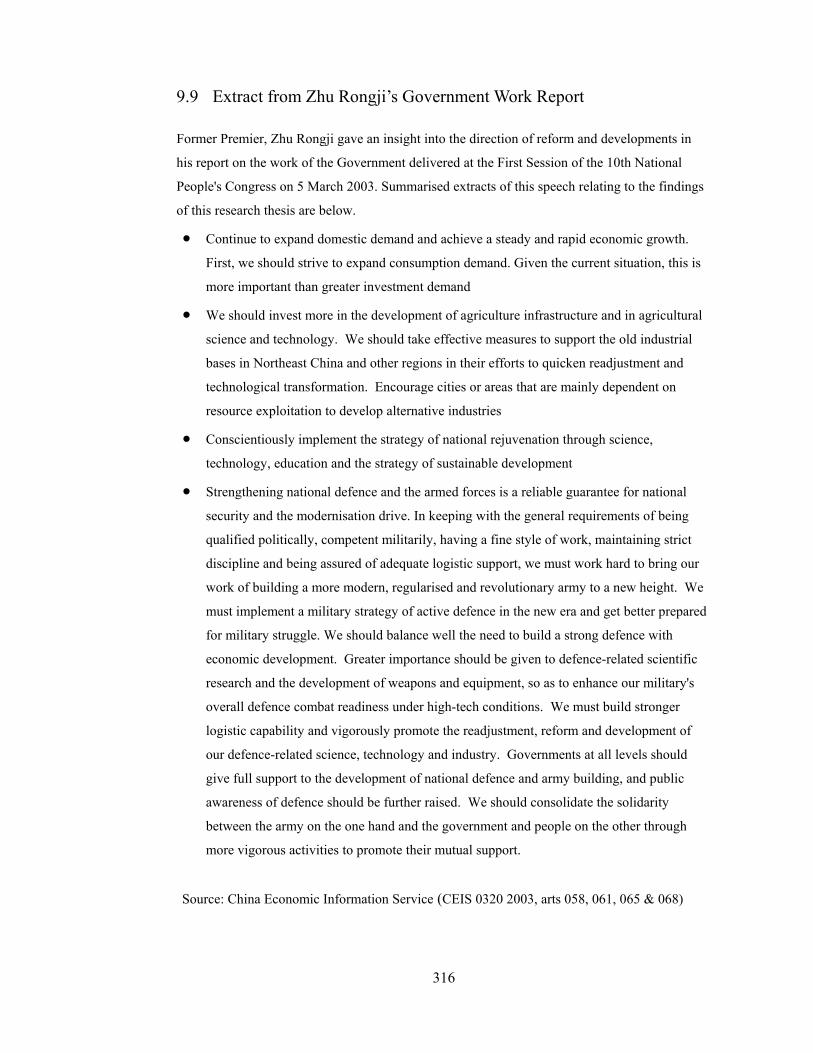
316
9.9 Extract from Zhu Rongji’s Government Work Report
Former Premier, Zhu Rongji gave an insight into the direction of reform and developments in
his report on the work of the Government delivered at the First Session of the 10th National
People's Congress on 5 March 2003. Summarised extracts of this speech relating to the findings
of this research thesis are below.
• Continue to expand domestic demand and achieve a steady and rapid economic growth.
First, we should strive to expand consumption demand. Given the current situation, this is
more important than greater investment demand
• We should invest more in the development of agriculture infrastructure and in agricultural
science and technology. We should take effective measures to support the old industrial
bases in Northeast China and other regions in their efforts to quicken readjustment and
technological transformation. Encourage cities or areas that are mainly dependent on
resource exploitation to develop alternative industries
• Conscientiously implement the strategy of national rejuvenation through science,
technology, education and the strategy of sustainable development
• Strengthening national defence and the armed forces is a reliable guarantee for national
security and the modernisation drive. In keeping with the general requirements of being
qualified politically, competent militarily, having a fine style of work, maintaining strict
discipline and being assured of adequate logistic support, we must work hard to bring our
work of building a more modern, regularised and revolutionary army to a new height. We
must implement a military strategy of active defence in the new era and get better prepared
for military struggle. We should balance well the need to build a strong defence with
economic development. Greater importance should be given to defence-related scientific
research and the development of weapons and equipment, so as to enhance our military's
overall defence combat readiness under high-tech conditions. We must build stronger
logistic capability and vigorously promote the readjustment, reform and development of
our defence-related science, technology and industry. Governments at all levels should
give full support to the development of national defence and army building, and public
awareness of defence should be further raised. We should consolidate the solidarity
between the army on the one hand and the government and people on the other through
more vigorous activities to promote their mutual support.
Source: China Economic Information Service (CEIS 0320 2003, arts 058, 061, 065 & 068)

317
9.10 Composition of China's Exports to USA, 2002
Category Value in
2002 (US$ 1,000)
Total value 69,950,533
Live animals and animal products 662,644
Plant products 226,872
Animal and vegetable oil and fats 6,257
Food, beverages, wine, vinegar, tobacco and products 712,497
Minerals 607,262
Chemicals and related products 2,249,304
Plastics, rubber and their products 3,179,507
Leather, fur and their products; bags and cases 2,464,072
Wood and wood products 876,078
Fibre pulp; paper and paper products 481,205
Textiles and their raw materials 5,427,593
Shoes, caps, umbrellas; down products; artificial flowers;
hair products 5,904,608
Stone products; ceramics; glass and products 1,139,172
Jewellery, ornaments, coins 549,190
Cheap metals and products 4,406,550
Machinery, equipment, audio and video products and
parts 26,234,741
Vehicles, aviation products and ships 2,256,235
Optical and medical apparatus; timepieces; music organs 2,080,831
Weapon, ammunition and parts 5,592
Miscellaneous goods 10,465,311
Arts, crafts and antiques 8,108
Special and unclassified products 6,904
Data source: China Economic Information Service (CEIS 0324 2003, art.021)

318
9.11 Composition of China's Import from USA, 2002
Category Value in
2002 (US$ 1,000)
Total value 27,230,057
Live animals and animal products 762,204
Plant products 1,097,360
Animal and vegetable oil and fats 37,872 Food, beverages, wine, vinegar, tobacco and products 276,918
Minerals 237,183
Chemicals and related products 3,280,812 Plastics, rubber and their products 1,404,139
Leather, fur and their products; bags and cases 504,759
Wood and wood products 262,414
Fibre pulp; paper and paper products 1,242,121
Textiles and their raw materials 437,056
Shoes, caps, umbrellas; down products; artificial flowers;
hair products 46,529
Stone products; ceramics; glass and products 110,102
Jewellery ornaments, coins 288,551
Cheap metals and products 1,259,748
Machinery, equipment, audio and video products and
parts 11,169,523
Vehicles, aviation products and ships 2,606,413
Optical and medical apparatus; timepieces; music organs 2,129,013
Weapon, ammunition and parts 8 Miscellaneous goods 74,865
Arts, crafts and antiques 401
Special and unclassified products 2,066
Data source: China Economic Information Service (CEIS 0324 2003, art.022)

319
9.12 Steel for the Beijing Olympics
Construction for the Beijing Olympics in 2008 is a large consumer of steel products –
mainly long structural type steel. The following is examples of some of the
construction work to be carried out:
• 22 new stadiums, total floor space of 1.69 million square metres having steel
designed structures, using 300,000 tonne of steel products
• Renovate 15 existing stadiums
• An athlete village with total floor space of 355,000 square metres
• A service building with floor space of 218,400 square metres
• Urban infrastructure facilities
• A new 502-metre-high World Trade Building, having floor space of 601,500 square
metres
• A public transit system consisting an expressway.
The above projects are estimated to consume approximately three million tonnes of
steel products. In preparation for the Olympics, China will invest in environmental
protection, which will stimulate demand for steel products. Before 2007, Beijing will
complete 20 key environmental projects with total investment to reach 60-70 billion
yuan (approx US$8 billion), of which 10% will be used to purchase steel products.
Source: China Economic Information Service (CEIS 0423 2003, art.031).

320
9.13 Fixed Asset Investment in China 2002
Below is an outline of key fixed asset investment projects in 2002. It shows the nature of
investment that is driving construction and in turn steel demand.
• Investment in the western part of China reached 451.9 billion yuan between January-
November 2002, up 25% year on year. Investment in the eastern part of China was 1,481.2
billion yuan, and that in the central part of the country was 588.1 billion yuan
• With the construction of water conservancy projects and implementation of the state plan
of recovering farmland into forestland and grass planting, investment in the primary
industry reached 86.9 billion yuan in the first 11 months of 2002, rising 35.2% year on
year. Investment in the secondary industry reached 838.3 billion yuan, up 27.4%. Of this,
investment in some major industrial sectors such as raw materials increased 39.6 percent,
machinery and electronics, up 43.8%, and textile and light industries, up 41.2%.
Investment in the tertiary industry topped 1,686.6 billion yuan, an increase of 21%, or
accounting for about 65% of the total
• The Three-Gorges water project on the Yangtze River. This will continue through until
2010 and it is expected this project will consume around 800,000 tonnes of steel
• Transmitting gas from the west to the east, a strategic construction, with total investment
exceeding 140 billion yuan
• Construction of the 1,956 kilometre Qinghai-Tibet railway, which is estimated to cost 36
billion yuan (US$4.34 billion) started in 2001 and is scheduled to be completed by 2007.
• Transmitting electric power from the west to the east at a cost of 550 billion yuan
• Diverting water from the south to the north of the country started in December 2002. This
project is estimated to cost 500 billion yuan. It will consist of three water division lines:
the east, the central and the west lines. These will form a national water supply network
linking the Yangtze River with the Yellow River, the Huaihe River and the Haihe River.
Upon completion, the project should divert about 38-48 billion cubic metres of water per
year
• By the end of 2002, China would have constructed around 3,576 kilometres of dykes and
dams on the Yangtze River and constructed 5,500 kilometres of new railway lines, 76,000
kilometres of highways and 35 airports.
Source: China Economic Information Service (CEIS 0306 2003 art.032)

321
9.14 Australia China Trade
9.14.1 Summary of Australian Trade with Top 5 Countries, 2000-2002
Australia's Major Merchandise Export Markets in Australian Dollars
Rank Country 1996 1997 1998 1999 2000 2001 20021 Japan 15,565,269 16,813,521 17,384,657 16,707,495 21,803,117 23,723,790 22,164,108 2 United States 4,978,171 6,338,630 8,475,802 8,410,713 10,980,389 11,913,724 11,531,903 3 Rep of Korea 7,304,900 6,762,549 6,105,069 6,280,021 9,045,634 9,530,726 9,972,206 4 China 3,877,541 3,976,587 3,792,032 4,091,083 6,008,786 7,581,662 8,367,956 5 New Zealand 5,659,620 6,179,617 5,691,286 6,674,023 6,568,789 7,182,770 7,920,252
Australia's Major Merchandise Import Markets in Australian Dollars for year 2000
Rank Country 1996 1997 1998 1999 2000 2001 20021 United States 18,017,166 18,174,430 21,548,781 21,139,791 23,122,358 21,399,072 23,148,431 2 Japan 10,212,983 11,409,193 13,318,942 13,636,432 15,316,497 15,259,614 15,741,289 3 China 4,121,992 4,739,335 5,822,546 6,613,066 9,073,206 10,311,902 12,848,432 4 Germany 4,701,304 4,668,318 5,822,598 5,827,601 5,882,034 6,662,739 7,336,868 5 United Kingdom 5,031,069 5,321,590 5,781,228 5,406,940 6,956,909 6,282,213 5,846,145
A$ to US$ = 0.55 (rate during 2002)
Australia's Major Merchandise Export Markets Converted to US Dollars
Rank Country 1996 1997 1998 1999 2000 2001 20021 Japan 8,560.90 9,247.44 9,561.56 9,189.12 11,991.71 13,048.08 12,190.26 2 United States 2,737.99 3,486.25 4,661.69 4,625.89 6,039.21 6,552.55 6,342.55 3 Rep of Korea 4,017.70 3,719.40 3,357.79 3,454.01 4,975.10 5,241.90 5,484.71 4 China 2,132.65 2,187.12 2,085.62 2,250.10 3,304.83 4,170 4,602.38 5 New Zealand 3,112.79 3,398.79 3,130.21 3,670.71 3,612.83 3,950.52 4,356.14
Australia's Major Merchandise Import Markets in USDollars
Rank Country 1996 1997 1998 1999 2000 2001 20021 United States 9,909 9,996 11,852 11,627 12,717 11,769.49 12,731.64 2 Japan 5,617 6,275 7,325 7,500 8,424 8,392.79 8,657.71 3 China 2,267 2,607 3,202 3,637 4,990 5,672 7,066.64 4 Germany 2,586 2,568 3,202 3,205 3,235 3,664.51 4,035.28 5 United Kingdom 2,767 2,927 3,180 2,974 3,826 3,455.22 3,215.38
Source: 1996 and 1997 - Composition of Trade Australia, 2000, DFAT, April 2001, pages 163 to 309
1998- Composition of Trade Australia 2000, DFAT, April 2001, pages 49 and 54
1999 - Composition of Trade Australia 2001, DFAT, May 2002, pages 48 and 53
2000 to 2002 - Composition of Trade Australia 2002, DFAT, May 2002, pages 50 and 55
Values in A$,000
Values in A$,000
Values in USD million
Values in USD million

322
9.14.2 Australian Merchandise Trade by Country, 2000-2002
Aud Australia Merchandise Trade by Country, 2000 -Rank Country Net Exports
A$,000 % Share A$,000 % Share A$,000 A$,000 % Share1 Japan 21,844,241 19.79 15,315,770 13.10 6,528,471 37,160,011 16.342 United States 10,979,542 9.94 23,123,199 19.77 (12,143,657) 34,102,741 15.003 China 6,009,929 5.44 9,072,968 7.76 (3,063,039) 15,082,897 6.634 Rep of Korea 9,047,728 8.20 4,802,805 4.11 4,244,923 13,850,533 6.095 New Zealand 6,564,382 5.95 4,486,558 3.84 2,077,824 11,050,940 4.86
World Total 110,404,970 49.31 116,946,548 100 (6,541,578) 227,351,518 100
Source: Composition of Trade Australia 2000, DFAT, April 2001, page 44-45A$ to US$ = 0.55 (rate during 2002)
USDRank Country Net Exports
USD,000 % Share USD,000 % Share USD,000 USD,000 % Share1 Japan 12,014,333 19.79 8,423,674 13.10 3,590,659 20,438,006 16.342 United States 6,038,748 9.94 12,717,759 19.77 (6,679,011) 18,756,508 15.003 China 3,305,461 5.44 4,990,132 7.76 (1,684,671) 8,295,593 6.634 Rep of Korea 4,976,250 8.20 2,641,543 4.11 2,334,708 7,617,793 6.095 New Zealand 3,610,410 5.95 2,467,607 3.84 1,142,803 6,078,017 4.86
World Total 60,722,734 49.31 64,320,601 48.57 (3,597,868) 125,043,335 48.93
Aud Australia Merchandise Trade by Country, 2001 -Rank Country Net Exports
A$,000 % Share A$,000 % Share A$,000 A$,000 % Share1 Japan 23,719,485 19.36 15,259,405 12.45 8,460,080 38,978,890 31.812 United States 11,925,057 9.73 21,410,739 17.47 (9,485,682) 33,335,796 27.203 China 7,583,928 6.19 10,312,212 8.41 (2,728,284) 17,896,140 14.604 Rep of Korea 9,528,704 7.78 4,634,951 3.78 4,893,753 14,163,655 11.565 New Zealand 7,176,534 5.86 4,741,176 3.87 2,435,358 11,917,710 9.73
World Total 122,546,379 48.91 117,741,528 45.99 4,804,851 240,287,907 94.90
Source: Composition of Trade Australia 2001, DFAT, May 2002, page 43-47USDRank Country Net Exports
USD,000 % Share USD,000 % Share USD,000 USD,000 % Share1 Japan 13,045,717 19.36 8,392,673 12.45 4,653,044 21,438,390 31.812 United States 6,558,781 9.73 11,775,906 17.47 (5,217,125) 18,334,688 27.203 China 4,171,160 6.19 5,671,717 8.41 (1,500,556) 9,842,877 14.604 Rep of Korea 5,240,787 7.78 2,549,223 3.78 2,691,564 7,790,010 11.565 New Zealand 3,947,094 5.86 2,607,647 3.87 1,339,447 6,554,741 9.73
World Total 67,400,508 48.91 64,757,840 45.99 2,642,668 132,158,349 94.90
Aud Australia Merchandise Trade by Country, 2002 -Rank Country Exports Imports Net Exports Total
A$,000 % Share A$,000 % Share A$,000 A$,000 % Share1 Japan 22,164,108 18.56 15,741,289 13.18 6,422,819 37,905,397 31.742 United States 11,531,903 9.66 23,148,431 19.38 (11,616,528) 34,680,334 29.043 China 8,367,956 7.01 12,848,432 10.76 (4,480,476) 21,216,388 17.764 Rep of Korea 9,972,206 8.35 4,763,978 3.99 5,208,228 14,736,184 12.345 New Zealand 7,920,252 6.63 4,874,438 4.08 3,045,814 12,794,690 10.71
World Total 119,436,000 50.20 127,642,000 51.39 (8,206,000) 247,078,000 101.59
Source: Composition of Trade Australia 2002, DFAT, May 2003, pages 50 and 55USDRank Country Exports Imports Net Exports Total
USD,000 % Share USD,000 % Share USD,000 USD,000 % Share1 Japan 12,190,259 18.56 8,657,709 13.18 3,532,550 20,847,968 31.742 United States 6,342,547 9.66 12,731,637 19.38 (6,389,090) 19,074,184 29.043 China 4,602,376 7.01 7,066,638 10.76 (2,464,262) 11,669,013 17.764 Rep of Korea 5,484,713 8.35 2,620,188 3.99 2,864,525 8,104,901 12.345 New Zealand 4,356,139 6.63 2,680,941 4.08 1,675,198 7,037,080 10.71
World Total 65,689,800 50.20 70,203,100 51.39 (4,513,300) 135,892,900 101.59
Exports Imports Total
Exports Imports Total
Exports Imports Total
Exports Imports Total

323
9.14.3 Australia’s Top Trades with China, 1996-2002 Australia's top Exports ( those above A$200,000 ranked at 2002) to China, 1996-2002Values in A$,000Commodity 1996 1997 1998 1999 2000 2001 2002Wool 758,763 846,186 591,911 644,465 1,101,628 1,279,570 1,419,708Iron Ore 570,207 829,668 854,317 731,692 1,044,940 1,368,962 1,481,370Crude Petroleum 37,927 82,440 24,300 245,888 416,876 300,402 369,092Coal x x 127,361 124,933 116,892 68,622 223,946Copper Ores 128,921 101,930 189,811 111,721 195,016 306,361 204,078Aluminium x x 108,703 142,159 156,294 170,849 222,779
Australia's top Imports (those above A$500,000 ranked at 2002) from China,1996-2002Values in A$,000Commodity 1996 1997 1998 1999 2000 2001 2002Clothing of textile Fabrics 332,099 396,846 486,380 508,026 661,044 748,378 743,364Toys Games & Sporting goods 338,710 400,749 461,165 457,849 621,584 688,134 802,543Footwear 279,982 302,237 372,547 410,583 494,915 530,379 614,447Computers 62,334 109,681 132,739 235,922 449,042 590,117 870,779Women's/Girls' clothing x x 233,035 298,379 404,343 509,861 584,122
A$ to US$ = 0.55 (rate during 2002)
Values in US$ million (Calculated from above)Australia's top Exports ( those above A$200,000 ranked at 2002) to China, 1996-2002Commodity 1996 1997 1998 1999 2000 2001 2002Wool 417.32 465.40 325.55 354.46 605.90 703.76 780.84Iron Ore 313.61 456.32 469.87 402.43 574.72 752.93 814.75Crude Petroleum 20.86 45.34 13.37 135.24 229.28 165.22 203.00Coal x x 70.05 68.71 64.29 37.74 123.17Copper Ores 70.91 56.06 104.40 61.45 107.26 168.50 112.24Aluminium x x 59.79 78.19 85.96 93.97 122.53
Australia's top Imports (those above A$500,000 ranked at 2002) from China,1996-2002Values in US$ million (Calculated from above)Commodity 1996 1997 1998 1999 2000 2001 2002Clothing of textile Fabrics 182.65 218.27 267.51 279.41 363.57 411.61 408.85Toys Games & Sporting goods 186.29 220.41 253.64 251.82 341.87 378.47 441.40Footwear 153.99 166.23 204.90 225.82 272.20 291.71 337.95Computers 34.28 60.32 73.01 129.76 246.97 324.56 478.93Women's/Girls' clothing x x 128.17 164.11 222.39 280.42 321.27
Note: Items marked with x were not in the top ranking in that year
Source: Composition of Trade Australia 2000, DFAT, April 2001, page 163 -165
Composition of Trade Australia 2001, DFAT, April 2001, page 163-165
Composition of Trade Australia 2002, DFAT, May 2003, pages 169 -170

324
9.14.4 Australia – China Trade breakdown, 2002
Category Export Value to Australia (US$ 1,000)
Import Value from Australia
(US$ 1,000) Total value 4,585,594 5,850,242
Live animals and animal products 18,481 111,223
Plant products 23,729 345,747
Animal and vegetable oil and fats 1,519 54,445
Food, beverages, wine, vinegar, tobacco and products 90,031 88,861
Minerals 125,446 1,765,321
Chemicals and related products 287,797 770,103
Plastics, rubber and their products 193,867 59,537
Leather, fur and their products; bags and cases 105,126 187,855
Wood and wood products 25,902 62,645
Fibre pulp; paper and paper products 63,216 100,999
Textiles and their raw materials 1,242,796 828,605
Shoes, caps, umbrellas; down products; artificial
flowers; hair products 166,309 181
Stone products; ceramics; glass and products 119,330 2,968 Jewellery, ornaments, coins 33,236 478,605
Cheap metals and products 368,914 704,288
Machinery, equipment, audio, video products & parts 1,185,190 233,031
Vehicles, aviation products and ships 117,128 6,387
Optical and medical apparatus; timepieces; music
organs 72,594 41,358
Weapon, ammunition and parts 4 61
Miscellaneous goods 344,731 7,967
Arts, crafts and antiques 222 54
Special and unclassified products 30 -
Data source: China Economic Information Service (CEIS 0324 2003, arts.023 & 024)
Note: The total quoted export value to Australia is lower than that quoted by Australia’s
Department of foreign Affairs and Trade. The above values have been reproduced as reported
by China’s General Administration of Customs as cited in the China Economic Information
Service, CEIS 0324 2003. They do not appear complete.
325
9.15 China’s Top Eleven Import Commodities, 2000 and 2001
US$ billion
Rank* Commodity 2000 2001
1 Mechanical and electrical products 102.868 120.524
2 Crude Oil 14.861 11.666
3 Rolled Steel 8.536 8.964
4 Data processing machines 4.516 4.981
5 Refined petroleum products 3.657 3.769
6 Aircraft 1.630 3.656
7 Paper and paperboard 3.296 3.057
8 Soybean 2.270 2.81
9 Polyethylene in Primary form 2.134 2.656
10 Motor vehicle parts 2.113 2.528
11 Iron Ore 1.858 2.503
Data source: National Bureau of Statistics of China 2002, China Statistical Yearbook 2002,
no.21, pp.624-625.
* Ranking is on 2001 values.

326
9.16 Map Showing Australia’s Iron Ore Mines
Source: The Tex Report, Iron Ore Manual 2002-2003, p.237

327
9.17 Steel Tariff Changes Following WTO Membership
China's Import Duty Rates for Articles For Iron And Steel Goods From 1 January 2003:
Sources: The Customs General Administration of the P.R.C, cited in CEIS 0319 2003, articles 029, 030, 031, 032, 033, 034, 035, 036. Tariff No. Description of Goods Import Duty Rates M.F.N % General % I. -PRIMARY MATERIALS; PRODUCTS IN GRANULAR OR POWDER FORM Pig iron and spiegeleise in pigs, blocks or other primary forms: -Non-alloy pig iron 1 8 containing by weight 0.5 % or less of phosphorus 7301.2000 -Non-alloy pig iron 1 8 containing by weight more than 0.5% of phosphorus 7201.5000 -Alloy pig iron; spiegeleisen 1 8 72.02 Ferro-alloys:Ferro-manganese: 7202.1100 --Containing by weight more 2 11 than 2% of carbon 7202.1900 --Other 2 11 -Ferro-silicon: 7202.2100 --Containing by weight more 2 11 than 55% of silicon 7202.2900 --Other 2 11 7202.3000 -Ferro-silico-manganese 2 11 -Ferro-chromium: 7202.4100 --Containing by weight more 2 8 than 4% of carbon 7202.4900 --Other 2 8 7202.5000 -Ferro-silico-chromium 2 11 7202.6000 -Ferro-nickel 2 11 7202.7000 -Ferro-molybdenum 2 11 -Ferro-tungsten and ferro-silico-tungaten: 7202.8010 ---Ferro-tungsten 2 11 7202.8020 ---Ferro-silico-tungsten 2 11 -Other: 7202.9100 --Ferro-titanium and ferro- 2 11 silico-titanium 7202.9200 --Ferro-vanadium 9 30 7202.9300 --Ferro-niobium 2 11 7202.9900 --Other 2 11 72.03 Ferrous products obtained by direct reduction of iron ore and other spongy ferrous products, in lumps, pellets or similar forms; iron having a minimum purity by weight of 99.94%, in lumps, pellets or similar forms: 7203.1000 -Ferrous products obtained by direct 2 8 reduction of iron ore 7203.9000 -Other 2 8 72.04 Ferrous waste and scrap; remelting scrap ingots of iron steel: 7204.1000 -Waste and scrap of cast iron 2 8 -Waste and scrap of alloy steel: 7204.2100 --Of stainless steel 0 8

328
Tariff No. Description of Goods Import Duty Rates M.F.N % General % 7204.2900 --Other 0 8 7204.3000 -Waste and scrap of tinned 2 8 iron or steel-Other waste and scrap: 7204.4100 --Turnings, shavings, 2 8 chips, milling waste, sawdust, filings, trimmings and stampings whether or not in bundles 7204.4900 --Other 0 8 7204.5000 -Remelting scrap ingots 0 8 72.05 Granules and powders, of pig iron, spiegeleisen iron or steel: 7205.1000 -Granules 2 30 -Powders: 7205.2100 --Of alloy steel 2 17 7205.2900 --Other 2 17 II. -IRON AND NON-ALLOY STEEL 72.06 Iron and non-alloy steel in ingots or other primary forms (excluding iron of heading No.72.03): 7206.1000 -Ingots 2 11 7206.9000 -Other 2 11 72.07 Semi-finished products of iron or non-alloy steel: -Containing by weight less than 0.25% of carbon: 7207.1100 --Of rectangular (including 2 11 square) cross-section, the width measuring less than twice thickness 7207.1200 -Other, of rectangular 2 11 (other than square cross- section 7207.1900 --Other 2 11 7207.2000 -Containing by weight 0.25% or more of 2 11 carbon 72.08 Flat-rolled products of iron or non-alloy steel of a width, of 600 mm or more hot-rolled, not clad, plated or coated: 7208.1000 -In coils, not further worked 5 14 than hot-rolled, with patterns in relief -Other, in coils, not further worked than hot-rolled, pickled: 7208.2500 --Of a thickness of 4.75 mm or more 5 14 7208.2600 --Of a thickness of 3 mm or more 5 14 but less than 4. 75mm 7208.2700 --Of a thickness of less than 3mm 5 14 -Other, in coils, not further worked than hot-rolled: 7208.3600 --Of a thickness exceeding 6 14 10 mm 7208.3700 --Of a thickness of 4.75 mm or more 5 14 but not exceeding 10 mm --Of a thickness of 3 mm or more but less than 4.75 mm 7208.3810 --Yield strength > 355 5 14 Newton/mm2 7208.3890 ---Other 5 14 --Of a thickness of less than 3 mm: 7208.3910 ---Thickness < 1.5 mm 5 14 7208.3990 ---Other 5 14

329
Tariff No. Description of Goods Import Duty Rates M.F.N % General % 7208.4000 -Not in coils, not further 6 17 worked than hot-rolled, with patterns in relief -Other, not in coils, not further worked than hot- rolled: --Of a thickness exceeding 10 mm: 7208.5110 ---Thickness > 50 mm 6 17 7208.5120 ---20mm < thickness <= 50 mm 6 17 7208.5190 ---Other 6 17 7208.5200 --Of a thickness of 4.75 mm or more 6 17 but not exceeding 10 mm --Of a thickness of 3 mm or more but less than 4.75 mm: 7208.5310 ---Yield strength > 355 6 17 Newton/mm2 7208.5390 ---Other 6 17 --Of a thickness of less than 3 mm: 7208.5410 ---Thickness < 1.5 mm 6 17 7208.5490 ---Other 6 17 7208.9000 -Other 6 17 72.09 Flat-rolled products of iron or non-alloy steel, of a width of 600 mm or more, cold-rolled (cold-reduced), not clad, plated or coated: -In coils, not further worked than cold-rolled (cold-reduced --Of a thickness of 3mm or more 7209.1510 ---Yield strength > 355 6 17 Newton/mm2 7209.1590 ---Other 6 17 --Of a thickness exceeding 1mm but less than 3 mm: 7209.1610 ---Yield strength > 275 6 17 Newton/mm2 7209.1690 ---Other 6 17 --Of a thickness of 0.5 mm or more but not exceeding 1mm: 7209.1710 ---Yield strength > 275 6 17 Newton/mm2 7209.1790 ---Other 6 17 --Of a thickness of less than 0.5 mm: 7209.1810 ---Thickness < 0.3 mm 6 17 7209.1890 ---Other 6 17 -Not in coils, not further worked than cold-rolled (cold-reduced) 7209.2500 --Of a thickness of 3 mm or more 6 17 7209.2600 --Of a thickness exceeding 6 17 1mm but less than 3mm 7209.2700 --Of a thickness of 0.5 mm 6 17 or more but not exceeding l mm 7209.2800 --Of a thickness of less than 0.5 mm 6 17 7209.9000 -Other 6 17 72.10 Flat-rolled products of iron or non-alloy steel, of a width of 600 mm or more, clad, plated or coated: -Plated or coated with tin: 7210.1100 --Of a thickness of 0.5 mm 10 20 or more 7210.1200 --Of a thickness of less than 0.5 mm 5 20 7210.2000 -Plated or coated with lead, 4 20 including terneplate 7210.3000 -Electrolytically plated or coated with zinc 8 20 Tariff No. Description of Goods Import Duty Rates

330
M.F.N % General % -Otherwise plated or coated with zinc: 7210.4100 --Corrugated 8 20 7210.4900 --Other 4 20 7210.5000 -Plated or coated with chromium oxides 8 20
or with chromium and chromium oxides -Plated or coated with aluminium:
7210.6100 --Plated or coated with 8 20 aluminium-zinc alloys 7210.6900 --Other 8 20 7210.7000 Painted, varnished or 4 20 coated with plastics 7210.9000 -Other 8 20 72.11 Flat-rolled products of iron or non-alloy steel, of a width of less than 600 mm, not clad, plated or coated: -Not further worked than hot-rolled: 7211.1300 --Rolled on four faces or in a closed box 6 30
pass, of a width exceeding 150 mm and a thickness of not less than 4 mm, not in coil and with out patterns in relief
7211.1400 --Other, of a thickness of 6 30 4. 75mm or more 7211.1900 --Other 6 30 -Not further worked than cold-rolled (cold-reduced): 7211.2300 --Containing by weight less 6 30 than 0.25% of carbon 7211.2900 --Other 6 30 7211.9000 -Other 6 30 72.12 Flat-rolled products of iron or non-alloy steel, of a width of less than 600 mm, clad, plated or coated: 7212.1000 -Plated or coated with tin 5 20 7212.2000 -Electrolytically plated or 8 20 coated with zinc 7212.3000 -Otherwise plated or coated 8 20 with zinc 7212.4000 -Painted, varnished or coated with 4 20 plastics 7212.5000 -Otherwise plated or coated 8 20 7212.6000 -Clad 8 20 72.13 Bars and rods, hot-rolled, in irregularly wound coils,of iron or non-alloy steel: 7213.1000 -Containing indentations, ribs, grooves or 4.8 20 other deformations produced during the rolling process 7213.2000 -Other, of free-cutting steel 4.8 20 -Other: 7213.9100 --Of circular cross-section 5 20 measuring less than 14 mm in diameter 7213.9900 --Other 5 20 72.14 Other bars and rods of iron or non-alloy steel, not further worked than forged, hot-rolled, hot-drawn or hot-extruded, but including those twisted after rolling: 7214.1000 -Forged 7 20

331
Tariff No. Description of Goods Import Duty Rates M.F.N % General % 7214.2000 -Containing indentations, ribs, grooves 3 20
or other deformations produced during the rolling process or twisted after rolling
7214.3000 -Other, of free-cutting steel 7 20 -Other: 7214.9100 --Of rectangular cross section 3 20 (other than square) 7214.9900 --Other 3 20 72.15 Other bars and rods of iron or non-alloy steel: 7215.1000 -Of free-cutting steel, not further worked 7 20 than cold- formed or cold-finished 7215.5000 -Other, not further worked than 7 20 cold-formed or cold-finished 7215.9000 -Other 3 20 72.16 Angles, shapes and sections of iron or non-alloy steel: -U, I or H sections, not further worked than hot- rolled, hot-drawn or extruded, of a height of less than 80 mm: 7216.1010 ---H sections 3 14 7216.1090 ---Other 3 14 -L or T sections, not further worked than hot-rolled, hot-drawn or extruded, of a height of less than 80 mm: 7216.2100 --L sections 6 17 7216.2200 --T sections 6 14 -U, I or H sections, not further worked , than hot-rolled hot-drawn or extruded of a height of 80 mm or more: 7216.3100 --U sections 6 14 7216.3200 --I sections 6 14 --H sections: 7216.3310 ---Of a height of 200mm or more 6 14 7216.3390 ---Other 6 14 -L or T sections, not further worked than hot rolled, hot-drawn or extruded, of a height of 80 mm or more: 7216.4010 ---L sections 3 17 7216.4020 ---T sections 3 14
-Other angles, shapes and sections, not further worked than hot-rolled, hot- drawn or extruded:
7216.5010 ---Z sections 6 14 7216.5090 ---Other 3 20
-Angles, shapes and sections, not further worked than cold-formed or cold-finished:
7216.6100 --Obtained from flat-rolled products 3 20 7216.6900 --Other 3 20 -Other: 7216.9100 --Cold-formed or cold- 3 20 finished from flat-rolled products 7216.9900 --Other 3 20 72.17 Wire of iron or non-alloy steel: 7217.1000 -Not plated or coated, 8 40 whether or not polished 7217.2000 -Plated or coated with zinc 8 40 7217.3000 -Plated or coated with other base metals 8 40 Tariff No. Description of Goods Import Duty Rates

332
M.F.N % General % 7217.9000 -Other 8 40 III. -STAINLESS STEEL 72.18 Stainless steel in ingots or other primary forms; semi-finished products of stainless steel: 7218.1000 -Ingots and other primary forms 2 11 -Other: 7218.9100 --Of rectangular (other than square) 2 11 cross-section 7218.9900 --Other 2 11 72.19 Flat-rolled products stainless steel, of a width of 600 mm or more: -Not further worked than hot-rolled, in coils: 7219.1100 --Of a thickness exceeding 4 14 10 mm 7219.1200 --Of a thickness of 4.75 mm 4 14 or more but not exceeding 10 mm 7219.1300 --Of a thickness of 3 mm or 4 14 more but less than 4.75 mm 7219.1400 --Of a thickness of less 4 14 than 3 mm -Not further worked than hot-rolled, not in coils: 7219.2100 --Of a thickness exceeding 11.8 40 10 mm 7219.2200 --Of a thickness of 4.75 mm 11.8 40 or more but not exceeding 10 mm 7219.2300 --Of a thickness of 3 mm or 11.8 40 more but less than 4.75 mm --Of a thickness of less than 3 mm: 7219.2410 ---Of a thickness exceeding 11.8 40 1mm, but less than 3 mm 7219.2420 ---Of a thickness of 0.5 mm 11.8 40 or more but not exceeding 1mm 7219.2430 ---Of a thickness of less than 0.5mm 11.8 40 -Not further worked than cold rolled (cold-reduced) 7219.3100 --Of a thickness of 4.75 mm or more 12 40 7219.3200 --Of a thickness of 3 mm or more 12 40 but less than 4.75 mm 7219.3300 --Of a thickness exceeding 2 40 l mm but less than 3mm 7219.3400 --Of a thickness of 0.5 mm or more 12 40 but not exceeding l mm 7219.3500 --Of a thickness of less than 0.5 mm 12 40 7219.9000 Other 12 40 72.20 Flat-rolled products stainless steel, of a width of less than 600 mm: -Not further worked than hot-rolled: 7220.1100 Of a thickness of 4.75 mm or more 10 20 7220.1200 Of a thickness of less than 4. 75mm 10 20 -Not further worked than cold-rolled (cold-reduced) 7220.2010 ---Of a width of less than 10 20 300 mm 7220.2090 ---Other 10 20 7220.9000 -Other 10 20 Tariff No. Description of Goods Import Duty Rates M.F.N % General %

333
72.21 Bars and rods, hot-rolled, in irregularly wound coils, of stainless steel: 7221.0000 Bars and rods, hot-rolled in, irregularly 10 20 wound coils, of stainless steel 72.22 Other bars and rods of stainless steel; angles, shapes and sections of stainless steel: -Bars and rods, not further worked than hot-rolled, hot-drawn or extruded: 7222.1100 --Of circular cross-section 12.2 40 7222.1900 --Other 12.2 40 7222.2000 -Bars and rods, not further worked 12.4 40 than cold formed or cold-finished 7222.3000 -Other bars and rods 12.4 40 7222.4000 -Angles, shapes and sections 10 17 72.23 Wire of stainless steel: 7223.0000 Wire of stainless steel 10 20 IV. -OTHER ALLOY STEEL HOLLOW DRILL BARS AND RODS, OF ALLOY OR NON-ALLOY STEEL 72.24 Other alloy steel in ingots or other primary forms; semi-finished products of other alloy steel: 7224.1000 -Ingots and other primary forms 2 11 -Other: 7224.9010 Raw casting forging stocks, individual 2 11 piece weight of 10 tonne or more 7224.9090 ---Other 2 11 72.25 Flat-rolled products of other alloy steel, of width of 600 mm or more: -Of silicon-electrical steel: 7225.1100 --Grain-oriented 3 20 7225.1900 --Other 6 20 7225.2000 -Of high speed steel 3 17 7225.3000 -Other, not further worked than 3 14 hot-rolled, not in coils 7225.4000 -Other, not further worked 3 17 than hot-rolled not in coils 7225.5000 -Other, not further worked 3 17 than cold-roll (cold- reduced) -Other: 7225.9100 --Electrolytically plated or coated with 7 17 7225.9200 --Otherwise plated or coated with zinc 7 17 7225.9900 --Other 7 17 72.26 Flat-rolled products of other alloy steel, of width of less than 600 mm: -Of silicon-electrical steel: 7226.1100 --Grain-oriented 3 20 7226.1900 --Other 3 20 7226.2000 -Of high speed steel 3 20 -Other: 7226.9100 --Not further worked than 3 20 hot-rolled 7226.9200 --Not further worked than 3 20 cold-rolled (cold- reduced) Tariff No. Description of Goods Import Duty Rates M.F.N % General % 7226.9300 --Electrolytically plated 7 20
334
or coated with zinc 7226.9400 --Otherwise plated or 7 20 coated with zinc 7226.9900 --Other 7 20 72.27 Bars and rods, hot-rolled, in irregularly wound coils, of other alloy steel: 7227.1000 -Of high speed steel 3 20 7227.2000 -Of silico-manganese steel 6 20 7227.9000 -Other 3 20 72.28 Other bars and rods of other alloy steel; angles, shapes and sections, of alloy steel; hollow drill bars and rods, of alloy or non-alloy steel: 7228.1000 -Bars and rods, of high speed steel 3 20 7228.2000 -Bars and rods, of silico-manganese steel 6 20 7228.3000 -Other bars and rods, not further worked 3 20 than hot- rolled, hot-drawn or extruded 7228.4000 -Other bars and rods, not further worked 3 20 than forged 7228.5000 -Other bars and rods, not further worked 3 20 than cold formed of cold-finished 7228.6000 -Other bars and rods 3 20 -Angles, shapes and sections: 7228.7010 ---Shapes of crawler tread 6 17 7228.7090 ----Other 6 17 7228.8000 -Hollow drill bars and rods 7 35 72.29 Wire of other alloy steel 7229.1000 -Of high speed steel 4.8 20 7229.2000 -Of silico-manganese steel 7 20 7229.9000 -Other 7 20
China's Import Duty Rates for Iron and Steel Articles from 1 January 2003:
(Sources: The Customs General Administration of the P.R.C, cited in CEIS 0321, 2003, arts 021, 022, 023, 024, 025, 026, 027, 028 Tariff No. Description of Goods Import Duty Rates M.F.N % General % 73.01 Sheet piling of iron or steel, whether or not drilled, punched or made from assembled elements; welded angles, shapes and sections, of iron or steel: 7301.1000 - Sheet piling 7 20 7301.2000 - Angles, shapes and sections 7 30 73.02 Railway or tramway track construction material
of iron or steel, the following: rails, check rails and rack rails, switch blades, crossing frogs, point rods and other crossing pieces, sleepers (cross-ties), fish-plates, chairs chair wedges, sole plates (base plates), clips, bedplates, ties and other material specialised for jointing or fixing rails:
7302.1000 Rails 6 14 Tariff No. Description of Goods Import Duty Rates M.F.N % General % 7302.3000 - Switch blades, crossing frogs, 8 17 point rods other crossing pieces

335
7302.4000 - Fish-plates and sole plates 7 17 - Other: 7302.9010 Sleepers (cross-ties) 6 14 7302.9090 - Other 7 17 73.03 Tubes, pipes and hollow profiles, of cast iron 7303.0010 - Tubes and pipes of circular cross-section, 4 40 of the internal diameter of 500 mm or more 7303.0090 - Other 6 40 73.04 Tubes, pipes and hollow profiles, seamless, of iron (other than cast iron) or steel: - Line pipe of a kind used for oil or gas pipelines: 7304.1010 - 215.9 mm =< external 5 17 diameter =< 406.4 mm 7304.1020 -- 114.3 mm < external 5 17 diameter < 215.9 mm 7304.1030 - External diameter <= 114.3 mm 5 17 7304.1090 - Other 5 17 - Casing, tubing and drill pipe, of a kind used in drilling for oil or gas: -- Drill pipe: 7304.2110 External diameter <= 168.3 mm 4 17 7304.2190 - Other 4 17 7304.2900 Other 4 17
- Other, of circular cross section, of iron or non alloy steel: - --Cold-drawn or cold- rolled (cold-reduced):
7304.3110 Boiler tubes and pipes 4 17 7304.3120 Geological casing and drill pipes 8 17 7304.3190 Other 4 37 -- Other: 7304.3930 - Boiler tubes and pipes 4 17 7304.3920 Geological casing and drill pipes 5 17 7304.3990 - Other 4 17 Other, of circular cross-of stainless Steel:--Cold drawn or cold-rolled (cold-reduced): 7304.4110 Boiler tubes and pipes 10 17 7404.4190 - Other 10 40 -- Other: 7304.4910 Boiler tubes and pipes 10 17 7304.4990 - Other 10 40
- Other, of circular cross section, of other alloy steel: - --Cold drawn or cold-rolled (cold reduced):
7304.5110 Boiler tubes and pipes 4 17 7304.5120 - Geological casing and drill pipes 4 17 7304.5190 Other 4 17 -- Other: 7304.5910 Boiler tubes and pipes 4 17 7304.5920 Geological casing and drill pipes 4 17 7304.5990 Other 4 17 7304.9000 Other 4 17 Tariff No. Description of Goods Import Duty Rates M.F.N % General % 73.05 Other tubes and pipes (for example, welded, riveted or similarly closed), having circular cross-sections, the external diameter of which

336
exceeds 406.4 mm, of iron or steel:- Line pipe of a kind used for oil or gas pipelines 7305.1100 Longitudinally submerged arc welded 7 17 7305.1200 Other, longitudinally welded 3 17 7305.1900 Other 7 17 7305.2000 Casing of a kind used in drilling for oil 7 17 or gas Other, welded: 7305.3100 Longitudinally welded 6 30 7305.3900 Other 6 30 7305.9000 Other 6 30 73.06 Other tubes, pipes and hollow profiles (for example, open seam or welded, riveted or similarly closed), of iron or steel: 7306.1000 Line pipe of a kind used for oil 7 17 or gas pipelines 7306.2000 Casing and tubing of a kind used in 3 17 drilling for oil or gas 7306.3000 Other, welded, of circular cross-section, 3 30 of iron or non-alloy steel 7306.4000 - Other, welded, of circular cross-section 6 30 of stainless steel 7306.5000 Other, welded, of circular cross-section, 3 30 of other alloy steel 7306.6000 - Other, welded, of non-circular 3 30 cross-section 7306.9000 - Other 6 30 73.07 Tube or pipe fittings (for example, coupling, elbows, sleeves), of iron or steel: Cast fittings: 7307.1100 Of non-malleable cast iron 5 20 7307.1900 Other 8 20 - Other, of stainless steel: 7307.2100 Flanges 8.4 20 7307.2200 Threaded elbows, bends and sleeves 8.4 20 7307.2300 Butt welding fittings 8.4 20 7307.2900 Other 8.4 20 - Other: 7307.9100 Flanges 7 20 7307.9200 Threaded elbows, bends and sleeves 4 20 7307.9300 Butt welding fittings 7 20 7307.9900 Other 4 20 73.08 Structures (excluding prefabricated of heading No.94.06) and parts of
structures (for example, bridges and bridge-sections, lock-gates, towers, lattice masts, roofs, roofing frameworks, doors and windows frames and thresholds for doors, shutters, balustrades, pillars and columns), of iron or steel; plates, rods, angles, shapes, plates, rods, angles, shapes, section, tubes and the like, prepared for use in structures, of iron or steel:

337
Tariff No. Description of Goods Import Duty Rates M.F.N % General % 7308.1000 - Bridges and bridge-sections 8 30 7308.2000 Towers and lattice masts 8.4 30 7308.3000 Doors, windows and their frames 13 50 7308.4000 -Equipment for scaffolding, shuttering 8.4 30 , propping or pit-propping 7308.9000 -Other 6.1 30 73.09 Reservoirs, tanks, vats and similar containers for any material (other than compressed or liquefied gas), of iron or steel, of a capacity exceeding 300 litres whether or not lined or heat insulated, but not fitted with mechanical or thermal equipment: 7309.0000 Reservoirs, tanks, vats and similar 10.5 35
containers for any material (other than compressed or liquefied gas), of iron or steel, of a capacity exceeding 300 Litre, whether or not lined or heat insulated, but not fitted with mechanical or thermal equipment
73.10 Tanks, casks, drums, cans, boxes and similar containers, for any material (other than compressed or liquefied gas), of iron or steel, of a capacity not exceeding 300 Litre, whether or not lined or heat- insulated, but not fitted with mechanical or thermal equipment. 7310.1000 -Of a capacity of 50 Litre or more 10.5 40 -Of a capacity of less than 50 Litre 7310.2100 Cans which are to be closed by 17.5 70 soldering or crimping 7310.2900 --Other 17.5 70 73.11 Containers for compressed or liquefied gas of iron or steel: 7311.0010 -For retail packing 17.5 70 7311.0090 ---Other 8 17 73.12 Stranded wire, ropes, cables, plaited bands, slings and the like, of iron or steel, not electrically insulated: 7312.1000 -Stranded wire, ropes and cables 4 20 7312.9000 -Other 4 20 73.13 Barbed wire of iron or steel; twisted hoop or single flat wire, barbed or not, and loosely twisted double wire, of a kind used for fencing, of iron or steel: 7313.0000 Barbed wire of iron or steel; twisted 7 70
hoop or single flat wire, barbed or not, and loosely twisted double wire, of a kind used for fencing, of iron or steel
73.14 Cloth (including endless bands), grill, netting and fencing, of iron or steel wire; expanded metal of iron or steel:-Woven cloth: --Endless bands for machinery, of stainless steel: 7314.1210 ---For technical use 12 20 7314.1290 ---Other 12 70 --Other endless bands for machinery: 7314.1310 ---For technical use 8 20 7314.1390 Other 12 70 --Other woven cloth, of stainless steel: 7314.1410 For technical use 12 20 Tariff No. Description of Goods Import Duty Rates

338
M.F.N % General % 7314.1490 ---Other 12 70 --Other: 7314.1910 For technical use 7 20 7314.1990 Other 12 70 7314.2000 -Grill, netting and fencing, welded at the 7 7
intersection of wire with a maximum cross- sectional dimension of 3 mm or more and having a mesh size of 100 sq cm or more
-Other grill, netting and fencing, weld the intersection: 7314.3100 --Plated or coated with zinc 7 70 7314.3900 --Other 7 70 -Other grill, netting and fencing: --Plated or coated with zinc: 7314.4110 ---For technical use 8 20 7314.4190 Other 10 70 --Coated with plastics: 7314.4210 For technical use 8 20 7314.4290 ---Other 10 70 --Other: 7314.4910 ---For technical use 8 20 7314.4990 Other 10 70 7314.5000 Expanded metal 8 70 73.15 Chain and parts thereof, of iron or steel: -Articulated link chain and parts thereof: --Roller chain: 7315.1110 ---For bicycles 12 80 7315.1120 For motorcycles 12 80 7315.1190 -Other 12 80 7315 1200 --Other chain 12 80 7315.1900 --Parts 12 80 7315.2000 -Skid chain 12 80 -Other chain: 7315.8100 --Stud-link 12 80 7315.8200 --Other, welded link 12 80 7315.8900 --Other 12 80 7315.9000 -Other parts 10 80 73.16 Anchors, grapnels and parts thereof, of iron or steel: 7316.0000 Anchors, grapnels and parts thereof, 10 40 of iron or steel 73.17 Nails, tacks, drawing pins, corrugated nails, staples (other than those of heading No.83.05) and similar articles, of iron or steel, whether or not with heads of other material, but excluding such articles with heads of copper: 7317.0000 Nails, tacks, drawing pins, corrugated 10 80
nails, staples (other than those of heading No.83.05) and similar articles, of iron or steel, whether or not with heads of other material, but excluding such articles with heads of copper
73.18 Screws, bolts, nuts, coach screws, screw books, rivets, cotters, cotter-pins, washers (including spring washers) and similar articles, of iron or steel:
-Threaded articles: 7318.1100 --Coach screws 10 80 Tariff No. Description of Goods Import Duty Rates M.F.N % General %

339
7318.1200 --Other wood screws 10 80 7318.1300 --Screw hooks and screw 10 80 rings 7318.1400 --Self-tapping screws 10 80 7318.1500 --Other screws and 8 80 bolts, whether or not with their nuts or washers 7138.1600 --Nuts 8 80 7318.1900 --Other 5 80 -Non-threaded articles: 7318.2100 --Spring washers and other lock washers 10 80 7318.2200 --Other washers 10 80 7318.2300 --Rivets 10 80 7318.2400 --Cotters and cotter-pins 10 80 7318.2900 --Other 10 80 73.19 Sewing needles, knitting needles, bodkins, crochet hooks, embroidery stilettos and similar articles, for use in the hand, of iron or steel: safety pins and other pins of iron or steel, not elsewhere specified or included: 7319.1000 -Sewing, darning or embroidery needles 10 80 7319.2000 -Safety pins 10 90 7319.3000 -Other pins 10 90 7319.9000 -Other 10 80 73.20 Springs and leaves for springs, of iron or steel -Leaf-springs and leaves thereof: 7320.1010 ---For railway 6 14 locomotives and rolling stock 7320.1090 ---Other 10 50 -Helical springs: 7320.2010 ---For railway 6 14 locomotives and rolling stock 7320.2090 ---Other 10 50 -Other: 7320.9010 ---For railway 6 14 locomotives and rolling stock 7320.9090 ---Other 12 50 73.21 Stoves, ranges, grates, cookers (including those with subsidiary boilers for
central heating), barbecues, braziers, gas-rings, warmers and similar non-electric domestic appliances, and parts thereof, of iron or steel: -Cooking appliances and plate warmers:
7321.1100 --For gas fuel or for both gas and other 15 80 --For liquid fuel: 7321.1210 ---Kerosene cooking stoves 21 80 7321. 290 ---Other 21 80 7321.1300 --For solid fuel 21 80 -Other appliances: 7321.8100 --For gas fuel or for both gas 23 80 and other fuels 7321.8200 --For liquid fuel 21 80 7321.8300 --For solid fuel 21 80 7321.9000 -Parts 12 80

340
Tariff No. Description of Goods Import Duty Rates M.F.N % General % 73.22 Radiators for central heating, not electrically heated, and parts thereof, of iron
or steel; air heaters and hot air distributors (including distributors which can also distribute fresh or conditioned air), not electrically heated, incorporating a motor-driven fan or blower, and parts thereof, of iron or steel:
-Radiators and parts thereof: 7322.1100 --Of cast iron 21 80 7322.1900 --Other 21 80 7322.9000 -Other 20 80 73.23 Table, kitchen or other household articles and parts thereof, of iron or steel;
iron or steel wool; pot scourers and scouring or polishing pads, gloves and the like, of iron or steel:
7323.1000 -Iron or steel wool; pot scourers and 14 80 scouring or polishing pads, gloves and the like -Other: 7323.9100 --Of cast iron, not enamelled 20 80 7323.9200 --Of cast iron, enamelled 20 100 7323.9300 --Of stainless steel 12 80 --Of iron (other than cast iron) or steel, enamelled 7323.9410 ---Mixing pans 20 100 7323.9420 ---Cooking pans 20 100 7323.9430 ---Roasting stove 20 100 7323.9490 ---Other 20 100 7323.9900 --Other 20 80 73.24 Sanitary ware and parts thereof, of iron or steel: 7324.1000 -Sinks and wash basins, of stainless steel 18 80 -Baths: 7324.2100 --Of cast iron, whether or not enamelled 16.7 100 7324.2900 --Other 30 100 7324.9000 -Other, including parts 25 100 73.25 Other cast articles of iron or steel: -Of non-malleable cast iron: 7325.1010 ---For technical use 7 40 7325.1090 ---Other 20 90 -Other: 7325.9100 --Grinding balls and similar articles 10.5 40 for mills --Other: 7325.9910 ---For technical use 10.5 40 7325.9990 ---Other 20 90 73.26 Other articles of iron or steel: -Forged or stamped, but not further worked: 7326.1100 --Grinding balls and similar articles 10.5 40 for mills --Other: 7326.1910 ---For technical use 10.5 40 7326.1990 ---Other 20 90 -Articles of iron or steel wire: 7326.2010 ---For technical use 10 40 7326.2090 ---Other 18 90 -Other: 7326.9010 ---For technical use 10.5 40 7326.9090 ---Other 10.4 90

341
9.18 China Steel companies Data base
(Sources: China Steel Statistics, 2000, 2001 and 2002 and Iron & Steel Works of the World, Edition 14, 2001, pp.73 and various publications)
Producer Name Address Province
Angang Anshan Iron & Steel Company Tiexi District, Anshan City, Liaoning 114021 Liaoning
Anyang Anyang Iron & Steel Group
Company Limited
Meiyuanzhuang, Tiexi District, Anyang City,
Henan 455004 Henan
Baogang Baotou Iron & Steel Company Kundulun District, Baotou City, Inner
Mongolia Autonomous Region 014010 Neimenggu
Baoshan Baoshan Iron & Steel CompanyFujin Road, Baoshan District, Shanghai City
201900 Shanghai
Beigang Beigang Group Company LimiteHongan Street, Fulaerji District, Qiqihaer City,
Helongjiang 161041 Helongjiang
Beitai Beitai Iron & Steel General WorkBetai Town, Pingshan District, Benxi City,
Liaoning 117017 Liaoning
Bengang Benxi Iron & Steel Company Renmin Road, Pingshan District, Benxi City,
Liaoning 117000 Liaoning
Changgang Changzhi Iron & Steel Group
Company Limited
Guxian Village, Changzhi City, Shanxi
046031 Shanxi
Changte Changcheng Special Steel
(Group) company Limited
Sanhe Street, Jiangyou City, Sichuan
621701 Sichuan
Chengdu Chengdu Iron & Steel Works Tuanjie Street (South Section), Qingbaijiang
District, Chengdu City, Sichuan 610303 Sichuan
Chenggang Chengde Iron & Steel Group
Company Limited
Luanhe Town, Shuangluan District, Chengde
City, Hebei 067002 Hebei
Chengwu Chengdu Seamless Steel Tube
Plant
Dongfeng Road (south Section), Jinjiang
District, Chengdu City, Sichuan 6110069 Sichuan
Chonggang Chongqing Iron & Steel Group
Company Limited Dadukou District, Chongqing City, 400081 Chongqing
Chongte Chongqing Special Steel Group
Company Limited
Suangbei Street, Shapingba District,
Chongqing City, 630032 Chongqing
Daerzha Dalian No 2 Steel Rolling Mill Zhoushuizi, Ganjijngzi District, Dalian City,
Liaoning 116033 Liaoning
Dagang Dalian Steel Plant Gongxing Road, Ganjingzi District, Dalian
City, Liaoning 116031 Liaoning
Dazhou Dazhou Iron & Steel Works Xiwai Town, Dazhou City, Sichuan 635002 Sichuan
342
Producer Name Address Province
Daye Daye Steel (Group) Company
Limited
Huangshi Road, Huangshi City, Hubei
435001 Hubei
Donggang Dongfang Iron & Steel Company
Limited Xialu District, Huangshi City, Hubei 435004 Hubei
Dazha Dalian Steel Rolling Mill Fuguo Street, Shahekou District, Dalian City,
Liaoning 116022 Liaoning
Egang Echeng Iron & Steel Works Wuchang Road, Ezhou City, Hubei 436002 Hubei
Fugang Fushun Iron and Steel CompanyHeping Street, Wanghua District, Fushun
City, Liaoning 113001 Liaoning
Fushun Fushun Iron and Steel CompanyGongnong Street, Wanghua District, Fushun
City, Liaoning 113001 Liaoning
Guangdong Guangdong Shaoguan Iron &
Steel Group
Xiehe Road 10, Xizeng Road, 512123,
Guangzhou Guangdong
Guanggang Guangzhou Iron & Steel
Company
Baihedong, Fangcun District, Guangzhou
City, Guangdong 510381 Guangdong
Guangzha Guangzhou Steel Rolling Mill Gexin Road, Haizhu District, Guangzhou City,
Guangdong 510250 Guangdong
Guigang Guiyang Steel Plant Youzha Street, Nangming District, Guiyang
city, Guizhou 550005 Guizhou
Guisheng Guizhou Steel Wire Rope Plant Taoxi Road, Zunyi City, Guizhou 563000 Guizhou
Hangang Handan Iron & Steel General
Works
Fuxing Street, Fuxing District, Handan City,
Hebei 056015 Hebei
Hanggang Hangzhou Iron & Steel Group
Company
Banshan Road, Gongsu District, Hangzhou
City, Zhejiang 310022 Zhejiang
Hazha Haerbin Steel Rolling Mill Youfang Street, Xiangfang District, Haerbin
City, Heilongjiang 150300 Heilongjiang
Hegang Hefei Iron & Steel Company Hongguang Street, Dongshi District, Hefei
City, Anhui 230011 Anhui
Hengguan Hengyang Steel Tube Plant Dasuxincun, Hengyang City, Hunan 421001 Hunan
Hugang Huhehaote Iron & Steel Works Hugang Road, Huhehaote City, Inner
Mongolia Autonomous Region 010050 Neimenggu
Huguan Huladao Steel Tube General
Works
Xinggong Street, Lianshan District, Jinxi City,
Liaoning 125001 Liaoning
Hu Yichang Shanghai Yichang Sheet
Company Limited
SitangTown, Baoshan District, Shanghai City,
200431 Shanghai
Jiangsu Jiangsu Xigang Group 124 Tangnan Road, 214026 Wuxi Jiangsu
343
Producer Name Address Province
Jigang Jinan Iron & Steel Group
Company
Industry Road (North), Jinan City, Shandong
250101 Shandong
Jiugang Jiuquan Iron & Steel Group
Company
Xiongguan Road, Jiayuguan City, Gansu
735100 Gansu
Kungang Kunming Iron & Stee+B76l
Company
Langjiazhuang, Anning County, Kunming city,
Yunnan 650302 Yunnan
Laigang Laiwu Iron & Steel General WorkYouyi Street, Gangcheng District, Laiwu City,
Shandong 271104 Shandong
Langang Lanzhou Iron & Steel Group
Company
Donggang Town, Chengguan District,
Lanzhou City, Gansu 730020 Gansu
Lengtie Lengshuijiang Iron & Coke
General Works Lengshuijiang City, Hunan 417500 Hunan
Lingang Linfen Iron & Steel Company No 3 Qiaodong, Linfen City, Shanxi 041000 Shanxi
Linggang Lingyuan Iron & Steel CompanyLingbei Street, Lingyuan City, Liaoning
122500 Liaoning
Liugang liuzhou Iron & Steel Group
Company
No. 117 Beicui Road, Liubei District, Liuzhou
City, Guangxi Autonomous Region 724300 Guangxi
Luegang Lueyang Iron & Steel Works Dagoukou, Chengguan town, Lueyang
County, Shaanxi 724300 Shaanxi
Luogang Luoyang Steel Plant Guanlin Town, Luoyang City, Henan 471023 Henan
Maanshan Maanshan Iron & Steel Co Ltd 8 Hong Qi Zhong Road, 243003 Maanshan Anhui
Meishan Shanghai Meishan Group
Company Limited
Zhonghuamenwai, Nanjing City, Jiangsu
210039 Jiangsu
Nanchang Nanchang Iron & Steel Compan
Limited
Loujiaji, Nanjing City, Jiangxi Province
210035 Jiangxi
Nanjing Nanjing Iron & Steel Group
Company Limited
Xiejiadian, Dachang District, Nanjing City,
Jiangsu Province 210035 Jiangsu
Nanzha Nanjing General Steel Rolling MChanghong Road, Jianye District, Nanjing
City, Jiangsu 210017 Jiangsu
Pangang Panzhihua Iron & Steel Group
Company
Dong District, Panzhihua City, Sichuan
617067 Sichuan
Pinggang Pinxiang Iron & Steel Works Xiangdong District, Pingxiang City, Jiangxi
337019 Jiangxi
Pugang Shanghai Pudong Iron & Steel
(Group) Company Limited
300 Shangnan Road, Pudong District,
Shanghai City 200126 Shanghai
Qinggang Qingdao Iron & Steel Group
Company
Zhuyi Road, Chuncang District, Qingdao City,
Shandong 266043 Shandong
Sanming Sanming Iron & Steel Works Liexi Street, Sanming City, Fujian 365000 Fujian

344
Producer Name Address Province
Shaangang Shaanxi Steel Plant Xingfu Road, East Suburb, Xian City, Shaanxi
710043 Shaanxi
Baoshang Shanghai Baosteel Group CorpFujin Road, Baoshan District, Shanghai City
201900 Shanghai
Shangang 1 Shanghai No. 1 Iron & Steel
(Group) Company Limited
735 Changjiang Road, Baoshan District,
Shanghai City 200431 Shanghai
Shangang 3 Shanghai No. 3 Iron & Steel
(Group) Company Limited 1151 Xinzhaozhou Road, 200011 Shanghai
Shangang 5 Shanghai No. 5 Iron & Steel
(Group) Company Limited
332 Tongji Road, Baoshan District, Shanghai
City 200940 Shanghai
Shaogang Shaoguan Iron & Steel Group
Company
maba, Qujiang County, Shaoguan City,
Guangdong 512123 Guangdong
Shenxian Shenyang Wire Rod Mill Block 1, Xinggong Street, Tiexi District,
Shenyang City, Liaoning 110025 Liaoning
Shenzha Shenyang General Steel Rolling
Mill
Block 2, Xinggong Street, Tiexi District,
Shenyang City, Liaoning 110021 Liaoning
Shenzong Shenyang Iron & Steel General
Works
Chenxiangtun District, Shenyang City,
Liaoning 110112 Liaoning
Shigang Shijiazhuang Iron & Steel WorksHeping Road (East), Changan District,
Shijiazhuang City, Hebei 050031 Hebei
Shizuishan Ningxia Shizuishan Iron & Steel
Works
Hebin District, Shizuishan City, Ningxia
Autonomous Region 753202 Ningxia
Shougang Shoudu Iron & Steel Company Changdongmen, Shijingshan District, Beijing
City 100041 Beijing
Shuigang Shuisheng Iron & Steel Group
Company
Zhongshan District, Shuicheng County,
Guizhou, 553028 Guizhou
Sugang Sugang Group company Limited Hulan Town Suzhou City, Jiangsu 215151 Jiangsu
Taigang Taiyuan Iron & Steel Group
Company Jiancaoping, Taiyuan City, Shanxi 030003 Shanxi
Tanggang Tangshan Iron & Steel Group
Company Limited
Binhe Road, Lubei District, Tangshan City,
Hebei 063016 Hebei
Tiangang Tianjin Tiangang Group Compan
Limited
Zhangdazhuang Street, Hedong District,
Tianjin City 300180 Tianjin
Tianguan Tianjin PIpe Company Wuxia Street, Dongli District, Tianjin City
330301 Tianjin
Tiantie Tianjin Tiante Metallurigical
Group Company Limited Gengyue Street, She County, Hebei 056404 Hebei
Tonggang Tonghua Iron & Steel Dongshen Road, Erdaojiang District,
Tonghua City, Jilin 134003 Jilin
345
Producer Name Address Province
Weigang Weiyuan Iron & Steel Works Lianjie, Weiyuan County, Neijiang City
Sichuan 642469 Sichuan
Wugang Wuhan Iron & Steel Group
Company
Changqian Street, Qingshan District, Wuhan
City, Hubei 430083 Hubei
Wuhu Wuhu Iron & Steel Works Wugang Road, Wuhu City, Jiangsu 241002 Jiangsu
Wuxi Wuxi Steel Group Tangnan Road, nanchang District, Wuxi City,
Jiangsu 241026 Jiangsu
Wuyang Wuyang Iron & Steel CompanyWugang District, Pingdingshan City, Henan
462500 Henan
Xi'an Xian Iron & Steel Works Hongguang Road, West Suburb, Xian City,
Shaanxi 710077 Shaanxi
Xianggang Xiangtan Iron & Steel CompanyYuetang District, Xiangtan City, Hunan
411101 Hunan
Xigang Xilin Iron & Steel Group CompanXinxing Street, Xilin District, Yichun City,
Helongjiang 153025 Heilongjiang
Xinggang Xingtai Iron & Steel Group
Company Limited
Gangtie Road, Qiaoxi District, Xingtai City,
Hebei 054027 Hebei
Xining Xining Special Steel Group
Company Limited
Chengbei District, Xining City, Qinghai
810005 Qinghai
Xinjiang Xinjiang Bayi Iron & Steel
Company Limited
Toutunhe District, Wulumuqi City, Xinjiang
Autonomous Region. Xinjiang
Xinyu Jiangxi Xinyu Iron & Steel
Company Limited Yushui District, Xinyu City, Jiangxi 336501 Jiangxi
Xuangang Xuanhua Iron & Steel CompanyPailou Steel (East), Xuanhua District,
Xuanhua City, Hebei 075103 Hebei
Xugang Xuzhou Iron & Steel General
Works Yangzhuang, Xuzhou City, Jiangsu 221004 Jiangsu
Yichang Yichang Bayi Iron & Steel Group
Company Limited Wujiagang, Yichang City, Hubei 443001 Hubei
Yingban Yingkou Plate Plant Laobian District, Yingkou City, Liaoning
115005 Liaoning
Zhangdian Zhangdian Iron & Steel Works Zhongxin Road, Zhangdian District, Zibo City,
Shandong 255007 Shandong

346
9.19 State Council
For reference, the following is a list of the new structure of the State Council, which was
adopted on 10 March 2003 at the third plenary meeting of the 10th National People's Congress:
1. Ministry of Foreign Affairs
2. Ministry of National Defence
3. State Development and Reform Commission
4. Ministry of Education
5. Ministry of Science and Technology
6. Commission of Science, Technology and Industry for National Defence
7. State Commission for Nationalities Affairs
8. Ministry of Public Security
9. Ministry of State Security
10. Ministry of Supervision
11. Ministry of Civil Affairs
12. Ministry of Justice
13. Ministry of Finance
14. Ministry of Personnel
15. Ministry of Labor and Social Security
16. Ministry of Land and Resources
17. Ministry of Construction
18. Ministry of Railways
19. Ministry of Communications
20. Ministry of Information Industry
21. Ministry of Water Resources
22. Ministry of Agriculture
23. Ministry of Commerce
24. Ministry of Culture
25. Ministry of Health
26. State Commission for Population and Family Planning
27. People's Bank of China
28 Audit Office.
Source: China Economic Information Service (CEIS 0311 2003, art.049)