1
ABC-CT Study Details: Methodologically rigorous, multi-site evaluation of potential ASD biomarkers in a large sample of children with and without ASD. Feasibility study collected pilot data for the ongoing, longitudinal study involving clinical assessment, video-tracking during play, electroencephalography (EEG), and eye tracking. Inclusion/Exclusion Criteria: ASD: Ages 4-11; Met for ASD criteria based on ADOS-2, ADI-R, and DSM-5; IQ 50-150; stable medication for 8 weeks; no sensory/motor impairments, epilepsy, and genetic/neurological conditions. Typically developing (TD): Ages 4-11; IQ 80-150; stable medication for 8 weeks; no sibling with ASD; no sensory/motor impairments, epilepsy, and genetic/neurological conditions; no clinically elevated score on the Child and Adolescent Inventory, 5 th Edition (CASI-5). Measures: CASI-5: Parent-reported behavior rating scale for DSM-5 disorders in children; variables used were Anxiety subscale T-score and Social Anxiety T-score. Behavior Assessment System for Children, 3 rd Edition (BASC-3), Child—Parent Rating Scale: Parent report of child’s behavior; variable used was Anxiety subscale T-score. Participant Demographics: Diagnostic groups did not differ on sex, [X 2 (1,46)=1.19, p=.336]. However, diagnostic groups significantly differed on Full Scale IQs as measured by the Differential Ability Scales, Second Edition (DAS-II), [t(44)=-4.59, p<.01], and age, [t(44)=2.24, p=.030]. EEG Acquisition: EGI NetAmps 300 & 400 Amplifiers with monthly timing tests for system integrity. EGI 128 Channel HydroCel Nets; video recording to verify net placement. E-prime presentation software; Cedrus stimtracker for precise timing of stimulus. EEG Experiment: Children were presented with standardized, 506x650 pixel photographs of 72 upright faces, inverted faces, and houses (Figure 1). Statistical Analyses: Group differences on the CASI-5 General Anxiety T-score were examined with a one-way ANOVA and Tukey post hoc tests. Three-way repeated measures ANCOVA were used to determine interaction and main effects of group [ASD, ASD+anx (CASI-5 T-score ≥ 60), TD], hemisphere [left, right], and condition [faces upright, faces inverted, houses], while controlling for age and IQ. Relationships between anxiety and neural responses in ASD (collapsed ASD and ASD+anx) and TD groups were examined with Pearson’s r. 1 7 2 3 5 6 Role of Anxiety in the Neural Response to Faces in Children with ASD: Results from the ABC-CT Feasibility Study T. Halligan 1 , A. Naples 1 , B. Lewis 1 , K. Chawarska 1 , R. Bernier 2 , S. Jeste 3 , C.A. Nelson 4 , G. Dawson 5 , S.J. Webb 2 , M. Murias 6 , F. Shic 7 , C. Sugar 3 , J. McPartland 1 (1)Child Study Center, Yale University School of Medicine, New Haven, CT, (2)Psychiatry and Behavioral Sciences, University of Washington, Seattle, WA, (3)University of California, Los Angeles, Los Angeles, CA, (4)Boston Children's Hospital, Boston, MA, (5)Department of Psychiatry and Behavioral Sciences, Duke University Medical Center, Durham, NC, (6)Duke University, Durham, NC, (7)Center for Child Health, Behavior and Development, Seattle Children's Research Institute, Seattle, WA Biomarkers in autism spectrum disorder (ASD) are needed to obtain objective measures of processes underlying social functioning. 39.6%-84.1% of those with ASD have at least one co-morbid anxiety disorder 1, 2 . Exploring the role of anxiety on neural responses to social stimuli measured with event related potentials (ERP) may provide insight into the complex relationship between anxiety and ASD. Objective: Examine relationships between anxiety and neural response to faces in children with and without ASD. n (Male) Age (SD) IQ (SD) CASI-5 Social Anxiety (SD) CASI-5 Anxiety (SD) BASC-3 Anxiety (SD) TD 26 (17) 6.60 (1.98) 114.08 (9.34) 45.05 (4.39) 42.95 (3.95) 44.08 (7.07) ASD 20 (16) 7.99 (2.26) 95.80 (17.33) 56.24 (12.34) 63.29 (13.78) 51.11 (9.78) Figure 1: Trial structure (1500-1800ms): 1. Baseline fixation icon 500-650ms. 2. Stimulus (face upright, face inverted, or house) 500ms. 3. Post trial blank screen 500-650ms. Anxiety Group Differences: As confirmation, CASI-5 Anxiety T-scores significantly differed between ASD, ASD+anx, and TD, F(2,38)=54.21, p<.01. Post-hoc tests revealed differences between ASD and ASD+anx (p<.01) and ASD+anx and TD (p<.01), but no difference between ASD and TD (p=.100). ASD, ASD+anx, and TD groups did not differ on sex [X 2 (2,39)=2.19, p=.335], but differed on IQ [F(2,38)=9.80, p<.01], and on age [F(2,38)=6.14, p<.01]. P100 Mean Amplitude: There was a significant interaction between group, hemisphere, and condition, F(4,64)=3.96, p=.006; this was driven by significant differences in hemispheres by condition, F(2,64)=6.44, p=.003. Specifically, the right hemisphere was largest in faces upright (M=-.81±3.73), followed by inverted faces (M=-.54±3.81), and houses (M=.08±3.82). N170 Mean Amplitude: There was a significant difference between groups based on condition, F(4,64)=3.17, p=.019, such that in the ASD+anx group, there were significant differences between faces upright (M=- 4.81±3.14) and faces inverted (M=-1.06±2.96), p=.025, as well as for faces upright and houses (M=-0.86±4.20), p=.017, but there was no significant difference between faces inverted and houses. There was also a significant difference in left and right hemispheres based on condition, F(2,64)=4.77, p=.012, such that the right hemisphere was largest in faces upright (M=- 4.01±4.79), followed by inverted faces (M=-2.12±4.56), and houses (M=-.39±4.58). Anxiety affected both ASD and TD neural response to social stimuli. More activation in individuals with heightened anxiety symptomology may reflect hypervigilance. These findings suggested that increased anxiety specific to core deficits in ASD (i.e. processing social information) related to larger, more negative amplitudes to both upright faces in the left hemisphere and inverted faces in both hemispheres. Further, individuals with ASD and clinical levels of anxiety displayed a larger amplitude to upright faces compared to other conditions in the right hemisphere. These results indicate that potential ERP biomarkers were sensitive to the effect of anxiety on neural processing and show different patterns for individuals with heightened anxiety. Limitations of the current study include a small sample size and significant age and IQ differences across diagnostic groups. The ongoing study will expand upon this pilot data to address these limitations. ERP Processing: Filtered from 0.1-30Hz, re-referenced to the average reference, segmented from -200ms to 500ms, baseline corrected, and artifact detected. P100 and N170 mean amplitude and latency were extracted from 40-190ms and 120-270ms, respectively, in occipitotemporal electrodes (Figure 2). 1. Muris, P., Steerneman, P., Merckelbach, H., Holdrinet, I., & Meesters, C. (1998). Comorbid anxiety symptoms in children with pervasive developmental disorders. Journal of Anxiety Disorders, 12(4), 387-393. 2. van Steensel, F., Bögels, S., & Perrin, S. (2011). Anxiety Disorders in Children and Adolescents with Autistic Spectrum Disorders: A Meta-Analysis. Clin Child Fam Psychol Rev, 14(3), 302-317. Funding Source: NIH U19 MH108206 (McPartland). McPartland Lab mcp-lab.org [email protected] ABC-CT [email protected] medicine.yale.edu/ycci/researchers/autism/ CASI-5 Correlations: For TD’s only, an increased Anxiety T-Score was significantly related to faster P100 latencies to all stimuli across both hemispheres, r’s≥-.47, p’s<.04. No significant relationships were found between Anxiety T-score and neural response for ASD children. No relationships between neural responses and Social Anxiety T-score for ASD and TD. BASC-3 Correlations: Anxiety T-score was significantly associated with neural responses to upright and inverted faces in the ASD group, p’s<.05, and only in the left hemisphere to inverted faces for TDs, p’s>.05 (Figures 7 and 8). Figure 2: Left and right occipitotemporal electrodes. Figure 4 (left): Neural response to upright faces in both hemispheres across groups. Figure 5 (right): Neural response to inverted faces in both hemispheres across groups. Figure 6: Neural response to houses in both hemispheres across groups. P100 N170 10 5 0 5 0 50 100 150 200 250 300 350 Time (ms) Amplitude (μV) ASD ASD+anx TD Left Hemisphere Right Hemisphere P100 N170 10 5 0 5 0 50 100 150 200 250 300 350 Time (ms) Amplitude (μV) ASD ASD+anx TD Left Hemisphere Right Hemisphere P100 N170 10 5 0 5 0 50 100 150 200 250 300 350 Time (ms) Amplitude (μV) ASD ASD+anx TD Left Hemisphere Right Hemisphere Figure 7: Relationships between BASC-3 Anxiety T-score and N170 amplitude to upright faces in the left and right hemispheres. -35 -30 -25 -20 -15 -10 -5 0 30 40 50 60 70 80 Left N170 Amplitude (μv) BASC-3 Anxiety T-score ASD r=.46*, p=.05 TD r=-.34, p=.09 -35 -30 -25 -20 -15 -10 -5 0 30 40 50 60 70 80 Right N170 Amplitude (μv) BASC-3 Anxiety T-score ASD r=.43, p=.07 TD r=-.12, p=.56 Figure 8: Relationships between BASC-3 Anxiety T-score and N170 amplitude to inverted faces in the left and right hemispheres. -35 -30 -25 -20 -15 -10 -5 0 30 40 50 60 70 80 Right N170 Amplitude (μv) BASC-3 Anxiety T-score ASD r=.49*, p=.03 TD r=-.27, p=.19 -35 -30 -25 -20 -15 -10 -5 0 30 40 50 60 70 80 Left N170 Amplitude (μv) BASC-3 Anxiety T-score ASD r=.48*, p=.04 TD r=-.47*, p=.02

Role of Anxiety in the Neural Response to Faces in

  • Upload
    others

  • View
    2

  • Download
    0

Embed Size (px)

Citation preview

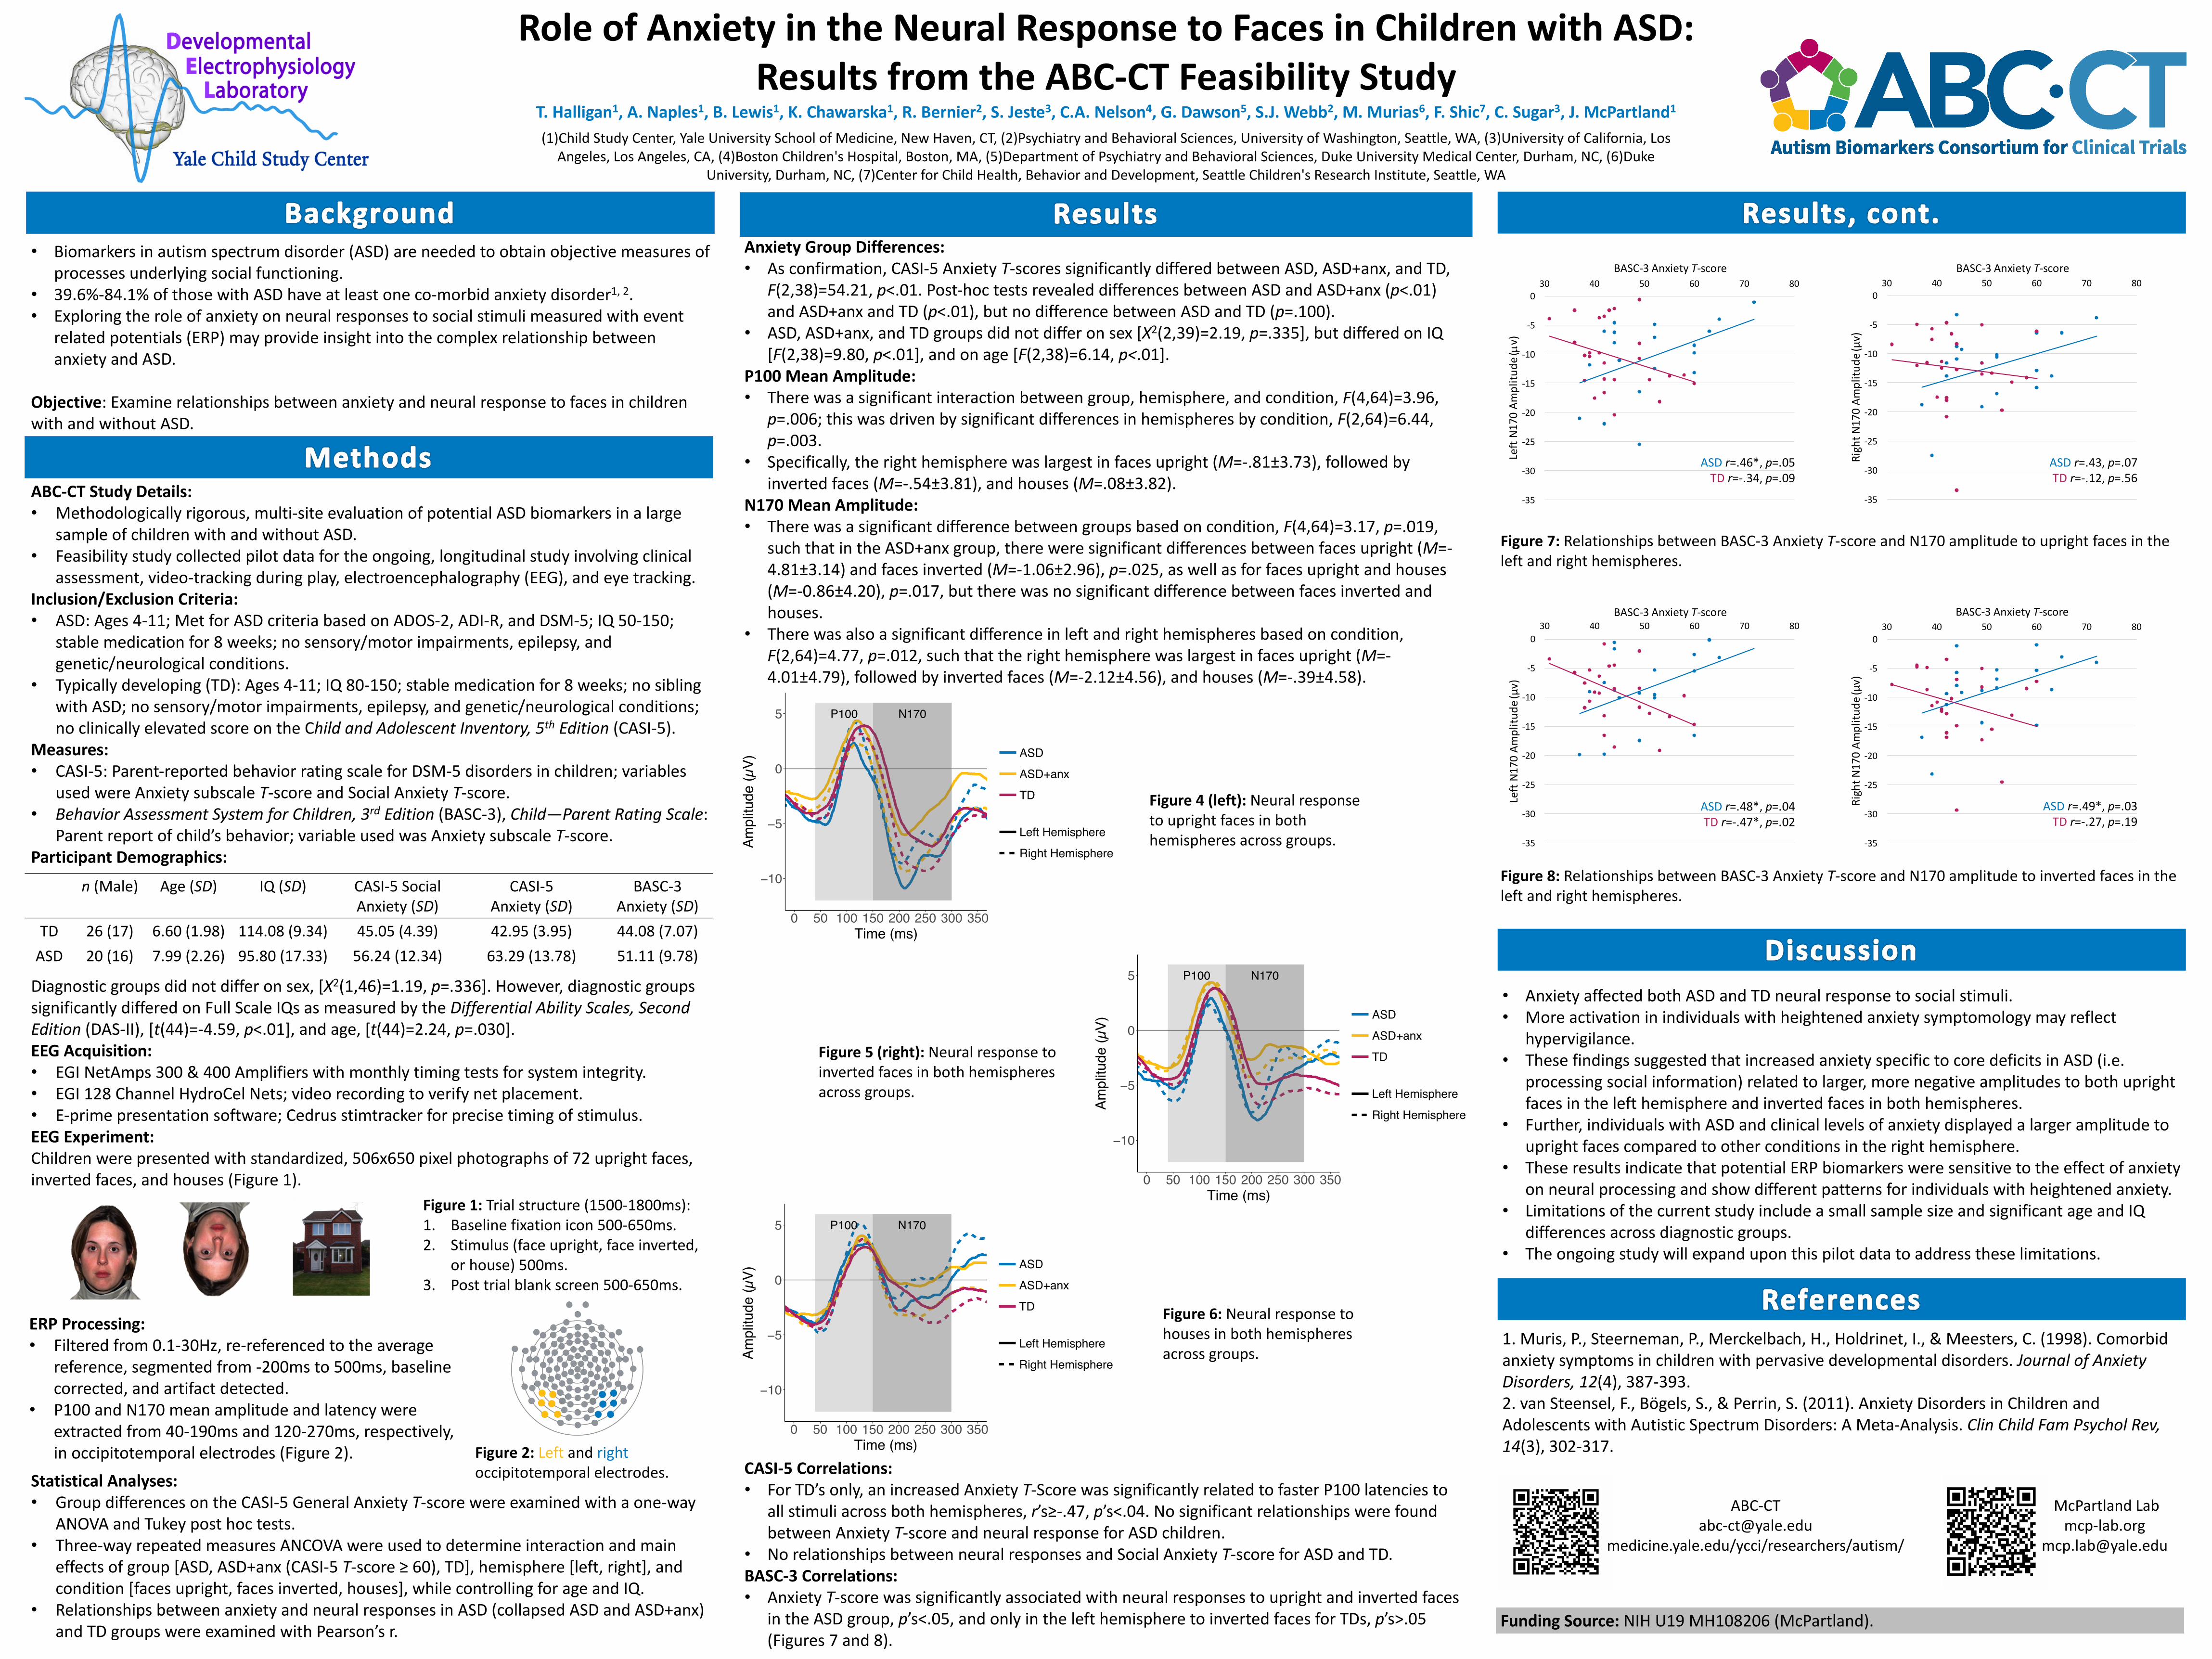
ABC-CT Study Details:• Methodologically rigorous, multi-site evaluation of potential ASD biomarkers in a large

sample of children with and without ASD.• Feasibility study collected pilot data for the ongoing, longitudinal study involving clinical

assessment, video-tracking during play, electroencephalography (EEG), and eye tracking.Inclusion/Exclusion Criteria:• ASD: Ages 4-11; Met for ASD criteria based on ADOS-2, ADI-R, and DSM-5; IQ 50-150;

stable medication for 8 weeks; no sensory/motor impairments, epilepsy, and genetic/neurological conditions.

• Typically developing (TD): Ages 4-11; IQ 80-150; stable medication for 8 weeks; no sibling with ASD; no sensory/motor impairments, epilepsy, and genetic/neurological conditions; no clinically elevated score on the Child and Adolescent Inventory, 5th Edition (CASI-5).

Measures:• CASI-5: Parent-reported behavior rating scale for DSM-5 disorders in children; variables

used were Anxiety subscale T-score and Social Anxiety T-score.• Behavior Assessment System for Children, 3rd Edition (BASC-3), Child—Parent Rating Scale:

Parent report of child’s behavior; variable used was Anxiety subscale T-score.Participant Demographics:

Diagnostic groups did not differ on sex, [X2(1,46)=1.19, p=.336]. However, diagnostic groups significantly differed on Full Scale IQs as measured by the Differential Ability Scales, Second Edition (DAS-II), [t(44)=-4.59, p<.01], and age, [t(44)=2.24, p=.030].EEG Acquisition:• EGI NetAmps 300 & 400 Amplifiers with monthly timing tests for system integrity.• EGI 128 Channel HydroCel Nets; video recording to verify net placement.• E-prime presentation software; Cedrus stimtracker for precise timing of stimulus. EEG Experiment:Children were presented with standardized, 506x650 pixel photographs of 72 upright faces, inverted faces, and houses (Figure 1).

Statistical Analyses:• Group differences on the CASI-5 General Anxiety T-score were examined with a one-way

ANOVA and Tukey post hoc tests.• Three-way repeated measures ANCOVA were used to determine interaction and main

effects of group [ASD, ASD+anx (CASI-5 T-score ≥ 60), TD], hemisphere [left, right], and condition [faces upright, faces inverted, houses], while controlling for age and IQ.

• Relationships between anxiety and neural responses in ASD (collapsed ASD and ASD+anx) and TD groups were examined with Pearson’s r.

1

7

23 5

6

Role of Anxiety in the Neural Response to Faces in Children with ASD: Results from the ABC-CT Feasibility Study

T. Halligan1, A. Naples1, B. Lewis1, K. Chawarska1, R. Bernier2, S. Jeste3, C.A. Nelson4, G. Dawson5, S.J. Webb2, M. Murias6, F. Shic7, C. Sugar3, J. McPartland1

(1)Child Study Center, Yale University School of Medicine, New Haven, CT, (2)Psychiatry and Behavioral Sciences, University of Washington, Seattle, WA, (3)University of California, Los Angeles, Los Angeles, CA, (4)Boston Children's Hospital, Boston, MA, (5)Department of Psychiatry and Behavioral Sciences, Duke University Medical Center, Durham, NC, (6)Duke

University, Durham, NC, (7)Center for Child Health, Behavior and Development, Seattle Children's Research Institute, Seattle, WA

• Biomarkers in autism spectrum disorder (ASD) are needed to obtain objective measures of processes underlying social functioning.

• 39.6%-84.1% of those with ASD have at least one co-morbid anxiety disorder1, 2.• Exploring the role of anxiety on neural responses to social stimuli measured with event

related potentials (ERP) may provide insight into the complex relationship between anxiety and ASD.

Objective: Examine relationships between anxiety and neural response to faces in children with and without ASD.

n (Male) Age (SD) IQ (SD) CASI-5 Social Anxiety (SD)

CASI-5Anxiety (SD)

BASC-3 Anxiety (SD)

TD 26 (17) 6.60 (1.98) 114.08 (9.34) 45.05 (4.39) 42.95 (3.95) 44.08 (7.07)ASD 20 (16) 7.99 (2.26) 95.80 (17.33) 56.24 (12.34) 63.29 (13.78) 51.11 (9.78)

Figure 1: Trial structure (1500-1800ms):1. Baseline fixation icon 500-650ms.2. Stimulus (face upright, face inverted,

or house) 500ms.3. Post trial blank screen 500-650ms.

Anxiety Group Differences:• As confirmation, CASI-5 Anxiety T-scores significantly differed between ASD, ASD+anx, and TD,

F(2,38)=54.21, p<.01. Post-hoc tests revealed differences between ASD and ASD+anx (p<.01) and ASD+anx and TD (p<.01), but no difference between ASD and TD (p=.100).

• ASD, ASD+anx, and TD groups did not differ on sex [X2(2,39)=2.19, p=.335], but differed on IQ [F(2,38)=9.80, p<.01], and on age [F(2,38)=6.14, p<.01].

P100 Mean Amplitude:• There was a significant interaction between group, hemisphere, and condition, F(4,64)=3.96,

p=.006; this was driven by significant differences in hemispheres by condition, F(2,64)=6.44, p=.003.

• Specifically, the right hemisphere was largest in faces upright (M=-.81±3.73), followed by inverted faces (M=-.54±3.81), and houses (M=.08±3.82).

N170 Mean Amplitude:• There was a significant difference between groups based on condition, F(4,64)=3.17, p=.019,

such that in the ASD+anx group, there were significant differences between faces upright (M=-4.81±3.14) and faces inverted (M=-1.06±2.96), p=.025, as well as for faces upright and houses (M=-0.86±4.20), p=.017, but there was no significant difference between faces inverted and houses.

• There was also a significant difference in left and right hemispheres based on condition, F(2,64)=4.77, p=.012, such that the right hemisphere was largest in faces upright (M=-4.01±4.79), followed by inverted faces (M=-2.12±4.56), and houses (M=-.39±4.58).

• Anxiety affected both ASD and TD neural response to social stimuli.• More activation in individuals with heightened anxiety symptomology may reflect

hypervigilance.• These findings suggested that increased anxiety specific to core deficits in ASD (i.e.

processing social information) related to larger, more negative amplitudes to both upright faces in the left hemisphere and inverted faces in both hemispheres.

• Further, individuals with ASD and clinical levels of anxiety displayed a larger amplitude to upright faces compared to other conditions in the right hemisphere.

• These results indicate that potential ERP biomarkers were sensitive to the effect of anxiety on neural processing and show different patterns for individuals with heightened anxiety.

• Limitations of the current study include a small sample size and significant age and IQ differences across diagnostic groups.

• The ongoing study will expand upon this pilot data to address these limitations.

ERP Processing:• Filtered from 0.1-30Hz, re-referenced to the average

reference, segmented from -200ms to 500ms, baseline corrected, and artifact detected.

• P100 and N170 mean amplitude and latency were extracted from 40-190ms and 120-270ms, respectively, in occipitotemporal electrodes (Figure 2).

1. Muris, P., Steerneman, P., Merckelbach, H., Holdrinet, I., & Meesters, C. (1998). Comorbid anxiety symptoms in children with pervasive developmental disorders. Journal of Anxiety Disorders, 12(4), 387-393. 2. van Steensel, F., Bögels, S., & Perrin, S. (2011). Anxiety Disorders in Children and Adolescents with Autistic Spectrum Disorders: A Meta-Analysis. Clin Child Fam Psychol Rev, 14(3), 302-317.

Funding Source: NIH U19 MH108206 (McPartland).

McPartland Labmcp-lab.org

[email protected]

[email protected]

medicine.yale.edu/ycci/researchers/autism/

CASI-5 Correlations:• For TD’s only, an increased Anxiety T-Score was significantly related to faster P100 latencies to

all stimuli across both hemispheres, r’s≥-.47, p’s<.04. No significant relationships were found between Anxiety T-score and neural response for ASD children.

• No relationships between neural responses and Social Anxiety T-score for ASD and TD.BASC-3 Correlations:• Anxiety T-score was significantly associated with neural responses to upright and inverted faces

in the ASD group, p’s<.05, and only in the left hemisphere to inverted faces for TDs, p’s>.05 (Figures 7 and 8).

Figure 2: Left and rightoccipitotemporal electrodes.

Figure 4 (left): Neural response to upright faces in both hemispheres across groups.

Figure 5 (right): Neural response to inverted faces in both hemispheres across groups.

Figure 6: Neural response to houses in both hemispheres across groups.

P100 N170

−10

−5

0

5

0 50 100 150 200 250 300 350Time (ms)

Ampl

itude

(µV)

ASD

ASD+anx

TD

Left Hemisphere

Right Hemisphere

P100 N170

−10

−5

0

5

0 50 100 150 200 250 300 350Time (ms)

Ampl

itude

(µV)

ASD

ASD+anx

TD

Left Hemisphere

Right Hemisphere

P100 N170

−10

−5

0

5

0 50 100 150 200 250 300 350Time (ms)

Ampl

itude

(µV)

ASD

ASD+anx

TD

Left Hemisphere

Right Hemisphere

Figure 7: Relationships between BASC-3 Anxiety T-score and N170 amplitude to upright faces in the left and right hemispheres.

-35

-30

-25

-20

-15

-10

-5

030 40 50 60 70 80

LeftN170Am

plitu

de(µv)

BASC-3AnxietyT-score

ASD r=.46*,p=.05TD r=-.34,p=.09

-35

-30

-25

-20

-15

-10

-5

030 40 50 60 70 80

RightN170Amplitud

e(μv)

BASC-3AnxietyT-score

ASD r=.43,p=.07TD r=-.12,p=.56

Figure 8: Relationships between BASC-3 Anxiety T-score and N170 amplitude to inverted faces in the left and right hemispheres.

-35

-30

-25

-20

-15

-10

-5

030 40 50 60 70 80

RightN170Amplitud

e(μv)

BASC-3AnxietyT-score

ASD r=.49*,p=.03TD r=-.27,p=.19

-35

-30

-25

-20

-15

-10

-5

0

30 40 50 60 70 80

Left

N1

70

Am

pli

tud

e (μ

v)

BASC-3 Anxiety T-score

ASD r=.48*, p=.04

TD r=-.47*, p=.02