Embed Size (px)
Citation preview

ROLE OF AI-2 IN ORAL BIOFILM FORMATION
USING MICROFLUIDIC DEVICES
A Thesis
by
SUN HO KIM
Submitted to the Office of Graduate Studies of Texas A&M University
in partial fulfillment of the requirements for the degree of
MASTER OF SCIENCE
May 2008
Major Subject: Biomedical Engineering

ROLE OF AI-2 IN ORAL BIOFILM FORMATION
USING MICROFLUIDIC DEVICES
A Thesis
by
SUN HO KIM
Submitted to the Office of Graduate Studies of Texas A&M University
in partial fulfillment of the requirements for the degree of
MASTER OF SCIENCE
Approved by:
Chair of Committee, Arul Jayaraman Committee Members, Michael J. McShane Thomas K. Wood Head of Department, Gerard L. Coté
May 2008
Major Subject: Biomedical Engineering

iii
ABSTRACT
Role of AI-2 in Oral Biofilm Formation Using Microfluidic Devices. (May 2008)
Sun Ho Kim, B.Eng., Korea University
Chair of Advisory Committee: Dr. Arul Jayaraman
Biofilms are highly organized bacterial structures that are attached to a surface.
They are ubiquitous in nature and may be detrimental, causing numerous types of
illnesses in living organisms. Biofilms in the human oral cavity are the main cause of
dental caries and periodontal diseases and can act as a source for pathogenic organisms
to spread within the body and cause various types of systemic diseases. Streptococcus
mutans is the primary etiological agent of dental caries, the single most chronic
childhood disease. In many cases, quorum sensing (QS) is required for initial formation
and subsequent development of biofilms and the signaling molecule autoinducer 2 (AI-
2) has been well studied as an inter-species QS signaling molecule. However, recent
reports also suggest that AI-2-mediated signaling is important for intra-species biofilm
formation in both Gram-negative and positive bacteria. Therefore, there is significant
interest in understanding the role of different QS signals such as AI-2 in oral biofilm
formation. Microfluidic devices provide biomimetic environments and offer a simple
method for executing multiple stimuli experiments simultaneously, thus, can be an
extremely powerful tool in the study of QS in biofilms.

iv
In this study, we report conditions that support the development of S. mutans
biofilms in microchannel microfluidic devices, and the effects of extracellular addition
of chemically synthesized (S)-4,5-dihydroxy-2,3-pentanedione (DPD; precursor of AI-2)
on mono-species S. mutans �luxS (AI-2 deficient strain) biofilm formation using a
gradient generating microfluidic device. S. mutans wild type (WT) and �luxS biofilms
were developed in nutrient rich medium (25% brain heart infusion medium, BHI + 1%
sucrose) for up to 48 h. Maximum biofilm formation with both strains was observed
after 24 h, with distinct structure and organization. No changes in S. mutans �luxS
biofilm growth or structure were observed upon exposure to different concentrations of
AI-2 in a gradient generating device (0 to 5 �M). These results were also validated by
using a standard 96-well plate assay and by verifying the uptake of AI-2 by S. mutans
�luxS. Our data suggest that extracellular addition of AI-2 does not complement the luxS
deletion in S. mutans with respect to biofilm formation.
v
DEDICATION
To my wife, Jae Rang,
my grandmother, Nam Hwa,
my parents, K.S. and Shine,
my in-laws, Siyoung and Youngsook,
my sister, Hee Sun,
and my dog, Chic,
whom I love dearly and who have been supportive and caring in all my endeavors.

vi
ACKNOWLEDGEMENTS
I would like to thank my committee chair, Dr. Arul Jayaraman, for his guidance
and support throughout the course of this research, and for allowing me to learn and
grow as a scientist. Your encouraging words have given me strength, self-confidence,
and knowledge that I can accomplish anything. I also thank my committee members, Dr.
Wood and Dr. McShane, for their advice and support.
I especially would like to thank lab members Derek, Tarun, and Manjunath, a.k.a.
‘Bacteria guys’ for their selfless support, and the microdevice expert, Dr. Jeongyun Kim
for his expertise assistance in developing devices and sage advice on research and life.
I also want to extend my appreciation to members of the Wood lab, whom were
always friendly, helpful, and encouraging, and again, Dr. Wood, for allowing me to use
his equipment and invaluable lab materials. Also, thanks to the U.S. Korean Embassy,
Texas A&M University Biomedical Engineering Department., and International Student
Services for the scholarships that have helped me throughout the course of my study.
Thanks also go to my friends, colleagues, the department faculty and staff, and
my academic advisor, Dr. Fidel Fernandez, for making my experience at Texas A&M
University a smooth one. Finally, thanks to my grandmother, father, mother, in-laws,
and sister for their encouragement and to the most important person in my life, my wife
for her patience and love.

vii
TABLE OF CONTENTS
Page
ABSTRACT .............................................................................................................. iii
DEDICATION .......................................................................................................... v
ACKNOWLEDGEMENTS ...................................................................................... vi
TABLE OF CONTENTS .......................................................................................... vii
LIST OF FIGURES................................................................................................... ix
LIST OF TABLES .................................................................................................... xii
1. INTRODUCTION AND BACKGROUND........................................................ 1
1.1 Biofilms................................................................................................ 1 1.2 Biofilms in the oral cavity .................................................................... 2 1.3 Quorum sensing.................................................................................... 3 1.4 Microfabricated devices ....................................................................... 5 1.5 Significance and specific goals ............................................................ 6
2. MATERIALS AND METHODS ........................................................................ 9
2.1 Bacterial strains, culture conditions, and materials.............................. 9 2.2 Saliva collection ................................................................................... 11 2.3 Transformation of S. mutans ................................................................ 11 2.4 Development of PDMS microfludic devices........................................ 12 2.5 Preliminary microfludic device experiments ....................................... 16 2.6 Microfluidic gradient device experiments............................................ 19 2.7 Crystal violet biofilm assay.................................................................. 21 2.8 AI-2 uptake assay ................................................................................. 22
3. RESULTS............................................................................................................ 23
3.1 Selection of biofilm culture conditions ................................................ 23 3.1.1 Simple microchannel device ....................................................... 23 3.1.2 Cell washing and seeding medium.............................................. 23 3.1.3 Seeding time................................................................................ 25 3.1.4 Flow media and flow rate............................................................ 25

viii
Page
3.1.5 Biofilm growth ............................................................................ 27 3.2 Microfluidic gradient experiments ....................................................... 32 3.2.1 Device description....................................................................... 32 3.2.2 Characterization using fluorescein .............................................. 32 3.2.3 Effects of AI-2 gradient on S. mutans �luxS biofilm formation . 34 3.3 Crystal violet biofilm assay.................................................................. 38 3.4 AI-2 uptake assay ................................................................................. 41
4. DISCUSSION, SUMMARY, AND CONCLUSIONS ....................................... 43
4.1 Discussion ............................................................................................ 43 4.2 Summary and conclusions.................................................................... 49 4.3 Future work .......................................................................................... 50
REFERENCES.......................................................................................................... 52
VITA ......................................................................................................................... 62

ix
LIST OF FIGURES
Page FIG. 2.1 Soft lithography procedure for microfluidic device fabrication (A) and operating scheme for microfluidic valve (B).............................. 13 FIG. 2.2 Experimental setup of a microfluidic device experiment. PDMS microfluidic device (a), bacteria seeding syringe (b), pneumatic valve syringe (c), medium input syringes (d), medium outputs (e), and a multi-syringe pump (f) are indicated in the picture. ................ 15 FIG. 2.3 Design of simple microchannel device used in preliminary experiments. Each of the four inlets separate into two sub-channels (lanes) which reconnect at the outlets. .............................................. 18 FIG. 2.4 Gradient generating device. AutoCAD design (A) and picture taken with insertion of food dye (B). .......................................................... 20 FIG. 3.1 Area coverage for initially attached cell clusters of S. mutans in a simple microchannel device with cells washed and seeded in the following conditions: PB, cells washed in PBS and seeded in BHI; PS, cells washed in PBS and seeded in 25% saliva; SB, cells washed in 25% saliva and seeded in BHI; SS, cells washed and seeded in 25% saliva. Two random positions within each channel (four random positions per condition) were analyzed and mean ± standard deviation for each condition is shown. The asterisks (*) indicate statistical significance between PB and PS; and SB and SS, determined using a Student’s t-test (p < 0.005). ......................... 24 FIG. 3.2 Area coverage for initially attached cell clusters of S. mutans seeded in a simple microchannel device for 0.5, 1, 2, and 4 h. Six random positions in the device were analyzed per condition and mean ± standard deviation are shown. Statistical significance of values for adjacent time points were determined using a Student’s t-test. *, p < 0.001; ** p < 0.002. ...................................................... 26

x
Page FIG. 3.3 Growth of S. mutans WT and S. mutans �luxS biofilms in a simple microchannel device. Time courses of mean biofilm thickness (A), biomass (B), and area coverage (C) over 48 h of flow in 25% BHI at 37˚C under 5% CO2. The experiment was repeated twice with two channels observed for each strain and three positions analyzed for each channel at the given time points. Error bars represent pooled standard deviation.................................................................. 28 FIG. 3.4 IMARIS images of S. mutans WT and S. mutans �luxS biofilms formed in 25% BHI at 37˚C under 5% CO2 for 12, 24, 36, and 48 h. The experiment was repeated twice, and one representative image is shown for individual strains at each time point. Grids represent 10 �m spacing. .................................................................................. 30 FIG. 3.5 Characterization of gradient generating device using fluorescein. Fluorescein was pumped through a gradient generating device at 1, 10, and 50 �L/min and fluorescence images of each channel were analyzed, normalized, and plotted as arbitrary units (arb. unit). ....... 33 FIG. 3.6 Effect of AI-2 gradient on S. mutans �luxS biofilm formation in a microfludic gradient device. Mean biofilm thickness (A), biomass (B), and area coverage (C) at 5 and 24 h with flow in 25% BHI at 37˚C under 5% CO2. The experiment was repeated three times and nine positions were averaged (three positions from each experiment) for each data point. Error bars represent pooled standard deviation. 35 FIG. 3.7 IMARIS images of S. mutans �luxS biofilms formed for 5 and 24 h in 25% BHI at 37˚C under 5% CO2 with the introduction of an AI-2 gradient ranging from 0 to 5 �M. The experiment was repeated three times, and one representative image is shown for each time point and AI-2 concentration. Grids represent 10 �m spacing................... 37 FIG. 3.8 Crystal violet assay on the effect of AI-2 on S. mutans �luxS biofilm formation. Cell growth (A) and biofilm formation (B) after 24 h incubation in 25% BHI at 37˚C under 5% CO2. The experiment was repeated three times and nine wells (3 wells from each experiment) were averaged for each data point. Error bars represent pooled standard deviation. ............................................................................ 39

xi
Page FIG. 3.9 AI-2 uptake by S. mutans �luxS was observed at 2 h after start of growth of diluted overnight cultures in 25% saliva supplemented with 1% sucrose. Statistical significance was determined using a Student’s t-test (*, p < 0.01). Induction of AI-2 was assayed as described in Materials and Methods Uninoculated 25% saliva supplemented with 10 �M DPD served as an experimental control. The experiment was conducted in triplicate for two independent cultures and luminescence is expressed as fold change relative to background luminescence with propagation of error presented as error bars. .......................................................................................... 42

xii
LIST OF TABLES
Page
Table 2.1 Strains and plasmids used in this study............................................. 10
Table 3.1 Effects of flow media and flow rates on area coverage .................... 27

1
1. INTRODUCTION AND BACKGROUND
1.1 Biofilms
Biofilms are highly coordinated and organized structures formed by multiple
species of bacteria (76, 83). Nearly 95% of all bacteria in the environment exist as
biofilms rather than as free-floating planktonic cells (6). Biofilms are ubiquitous in
nature, detected in a diverse range of scenarios including medical devices and implants
(7), ship hulls (4), water pipes (73), and even in a space station (32). In most cases,
biofilm formation is deleterious resulting in costly efforts for its management and
control (25). However, not all bacteria in a naturally-occurring multi-species biofilm are
equally harmful (26). Understanding how different bacterial species interact to form
complex biofilms is important for developing approaches to counter biofilm formation.
Biofilm formation is usually sequential, with a reversible loose attachment step,
followed by an irreversible strong attachment, colonization, and production of the
extracellular matrix (6). In multi-species biofilms, secondary colonizers of the biofilm
begin development of the multi-species community soon after the initial irreversible
attachment of the primary colonizer (34). Plaque formation involves a defined
succession of colonization events where the adherence of pathogens such as
Porphyromonas gingivalis follows the attachment of commensal streptococci such as
Streptococcus gordonii (46).
____________ This thesis follows the style of the Journal of Bacteriology.

2
1.2 Biofilms in the oral cavity
The human oral cavity is a complex environment in which nearly 500 different
bacterial species have been identified (51, 69). Complex interactions exist between the
various bacteria leading to the formation of multi-species biofilm communities (17). A
homeostatic balance exists between bacteria in the oral cavity environment and bacteria
detached from the biofilm due to chewing, salivary action, and flow. Disruption of this
balance is the main cause of dental caries and periodontal diseases. The high salivary
flow rates and low nutrient concentrations (carbohydrates) in saliva ensure that biofilms,
and not planktonic cultures, are the preferred mode of growth for oral bacteria. S. mutans
is recognized as the primary etiological agent of dental caries in humans and various
lactobacilli are associated with progression of the lesion (43). Periodontal infections are
usually mixed, most often involving anaerobes such as Treponema denticola and P.
gingivalis. The microaerophile Aggregatibacter actinomycetemcomitans causes a rare
form known as localized juvenile periodontitis.
The Gram-positive streptococci account for nearly 60-90% of the early
colonizing bacteria in the oral cavity (51, 54). Viridans streptococci (including S. mutans,
S. gordonii, and Streptococcus oralis) are ideal early colonizers because they have the
ability to coaggregate with several oral bacterial species and bind with salivary proteins
(33). Typical late colonizers include the oral pathogens A. actinomycetemcomitans and P.
gingivalis that need the presence of a mature and developed biofilm for colonization (37,
48). Early colonizers bind to salivary receptors in the pellicle on tooth surfaces using
specific cell surface-associated adherence proteins responsible for initiating colonization.

3
These bacterial adhesins recognize protein, glycoprotein, or polysaccharide receptors on
various oral surfaces, including other cell types, and exhibit extensive inter- and intra-
generic coaggregation (35). Late colonizers initially attach to fusobacteria, which act as
a bridge between early and late colonizers, then bind to the previously attached bacteria
increasing the thickness and mass of the biofilm (34, 35). Therefore, there is a clear
spatial and temporal order to the formation and development of biofilms in the oral
cavity.
1.3 Quorum sensing
QS is a form of cell-to-cell communication used by bacteria and has been shown
to be required for initial colonization and subsequent formation and development of
many biofilm communities (5, 10, 22, 34, 55). Bacteria use a diverse range of signaling
molecules and mechanisms for cell-to-cell communication and to track their population
densities (15, 18, 83). Monitoring cell density enables each bacterial species to regulate
the expression of a set of target genes depending on the physiological requirement or the
environment in which they are present (18, 66).
In Gram-positive bacteria, QS is used to regulate a variety of processes,
including antibiotic production (62), competence (77), sporulation, and virulence factor
production (13). Gram-positive bacteria use competence-stimulating peptides (CSP) that
are secreted and sensed to achieve QS (31). CSP is encoded by comC, and processed and
secreted by an ABC transporter and accessory protein, encoded by comA and comB,
respectively. Extracellular CSP binds to membrane-bound sensor histidine kinase,

4
encoded by comD, which, with its cognate response regulator, encoded by comE, forms
a two-component signal transduction system involved in regulation of competence (23).
Li et al. discovered the CSP signaling system in S. mutans and showed that it is essential
for genetic competence and biofilm formation (41, 42). Knockout mutants defective in
comC, comD, comE, and comX all showed altered biofilms compared with the wild type,
and comC mutant was the only strain that could be complemented to wild type levels by
exogenous addition of CSP or insertion of a plasmid containing wild type comC (42).
The high specificity of signaling molecules of QS systems to their cognate receptors is a
characteristic that is fully exploited by bacteria. The different CSP used by Gram-
positive bacteria differ from one another in the length of the oligopeptides, amino acid
composition, and post-translational modifications (59).
While CSPs have been identified as an intra-species QS signal, the autoinducer
molecule AI-2 has been recognized as a global inter-species QS molecule (34, 46, 49, 61,
64). First identified in Vibrio harveyi, AI-2 synthesis depends on expression of the luxS
gene (71) that is present in many Gram-negative and positive bacteria. AI-2 mediated
communication is also conveyed through a two-component communication system (15)
and has been well demonstrated between streptococci and other oral bacteria, including
Actinobacillus and Lactobacillus (2, 47). AI-2-mediated cross-talk between S. oralis and
Actinomyces naeslundii has been shown to affect biofilm formation and development
(61). AI-2 of A. actinomycetemcomitans has been shown to complement luxS knockout
mutation in P. gingivalis by modulating expression of luxS-related genes (16). AI-2
signaling has also been shown to regulate aspects of carbohydrate metabolism in S.

5
gordonii and biofilm formation with P. gingivalis (46). These studies suggest that AI-2-
mediated communication is involved in the formation of multi-species oral biofilms.
Recent studies have also shown that luxS is important in intra-species signaling
in both Gram-negative and positive bacteria (1, 9, 11, 12, 19, 38, 39, 58, 67), including
in S. mutans biofilm formation (44, 47, 72, 79, 80, 86). These studies have indirectly led
to the conclusion that AI-2 is involved in intra-species signaling as LuxS activity is
required for the production of AI-2. However, since luxS also plays an important role in
metabolism, these studies have not clearly delineated the metabolic effects of luxS
mutation and the role of AI-2.
1.4 Microfabricated devices
Microfabrication holds great promise as a method to create and control
microenvironments in which cell behavior can be regulated (81). The ability to culture
cells in microfluidic systems offers numerous advantages over traditional benchtop-scale
technologies (50). Bioreactors used for conventional cell culture typically operate in a
batch or semi-batch mode that requires frequent media changes and the use of
mechanical stirring to enhance mass transfer. These processes introduce mechanical
stresses and steep concentration gradients that deviate significantly from those
encountered in their natural habitat. Consequently, the cellular microenvironment is
either severely disrupted or completely unmaintainable, altering the observed growth and
behavior in culture to a great extent (82).

6
In a microfluidic system, cells are exposed to an environment that more closely
mimics their natural surroundings. Single cells or collections of cells can be directly
observed as they respond to stimuli under conditions that are more consistent with actual
physiological settings (29). In terms of chemical biology, microfluidic systems also offer
the unique ability to simultaneously apply different stimuli to a single cell or a collection
of the same cells in order to probe their differential response. Microsystems also offer
the capability of performing these studies in a highly parallel manner by incorporating
hundreds or thousands of cell culture chambers within an area of order 1 cm2 (30). The
inherently small size of microfluidic cell culture systems also makes them ideally suited
for accommodating enough replicates to infer statistically meaningful conclusions (29,
68).
Microfluidic methods have been employed in various biological applications that
range from electrophoresis to cell engineering (14, 50, 60, 74). Soft lithography (81, 85)
with polydimethyl siloxane (PDMS), is customarily used as a stamping technique to
prepare surfaces that are in a quasi-two-dimensional array. This technology has been
advanced recently to include three-dimensional micromolding (53) making possible a
microfluidic system for generating stable soluble or surface-adsorbed gradients (27).
1.5 Significance and specific goals
It has been estimated that 65% of all human bacterial infections are caused by
biofilms (8). Dental biofilm or plaque causes dental caries and periodontal diseases, two
of the most common diseases of the oral cavity (48, 63). Periodontal disease is one of the

7
most common infectious diseases (63) with more than 75% of Americans aged 35 years
and above having some form of gum disease (http://www.fda.gov). Dental caries is the
single most common chronic disease of childhood, being four times more common than
asthma in children aged 5 to 17 (42 versus 9.5%; http://www.cdc.gov). Furthermore,
Americans spent more than $70 billion on dental care in 2002 alone
(http://www.laskerfoundation.org). S. mutans is the primary cause of dental caries (43)
and understanding the initial attachment and subsequent development mechanisms of S.
mutans biofilms is critical for effective management of related diseases. In addition,
infections in the oral cavity can also act as a source for pathogenic organisms to spread
to distant sites in the body and cause systemic diseases such as diabetes, infective
endocarditis, bacterial pneumonia, and cardiovascular diseases (40). Therefore,
understanding the basis of QS in oral biofilm formation is expected to lead to the
development of targets and approaches to control biofilm formation in the oral cavity.
The overall goal of this work is to investigate the effects of AI-2 on intra-species
biofilm formation. We use the early colonizer S. mutans GS-5 as the model streptococci
as it has been extensively studied with regard to biofilm formation (3, 47, 86, 87) and is
the primary etiological agent for the development of dental caries and decay (43). Using
S. mutans as the model oral streptococci, we propose to investigate how AI-2 signaling
impacts biofilm formation. A high throughput microfluidic device model will be used to
investigate the effect of different AI-2 concentrations on biofilm formation. The
proposed work is expected to provide a fundamental understanding of the basis of oral

8
biofilm formation, and can lead to the development of novel approaches for controlling
biofilms in the oral cavity.

9
2. MATERIALS AND METHODS
2.1 Bacterial strains, culture conditions, and materials
The bacterial strains and plasmids used in this study are listed in Table 2.1.
Overnight cultures of S. mutans strains were grown aerobically at 37˚C under 5% CO2 in
BHI (Becton Dickinson & Co., Sparks, MD) supplemented with 1% sucrose (Fisher
Scientific, Fair Lawn, NJ). For selection of transformants of S. mutans and for retaining
the pFW5ø (mutAp-gfp) plasmid in the microfluidic device flow experiments,
spectinomycin (MP Biomedicals Inc., Solon, OH) was added at a final concentration of
800 �g/mL. V. harveyi BB170 was grown aerobically at 30˚C in autoinducer bioassay
(AB) medium (20). S. mutans GS-5 and its luxS mutant were kindly provided by Dr. A.
Yoshida (Kyushu Dental College, Kitakyushu, Japan) and V. harveyi BB170 by Dr. T. K.
Wood (Texas A&M University, College Station, TX). The pFW5ø (mutAp-gfp) plasmid
was a generous gift from Dr. F. Qi (University of Oklahoma, Oklahoma City, OK). DPD
was purchased from Omm Scientific Inc. (Dallas, TX).

10
TABLE 2.1. Strains and plasmids used in this study
Strain or plasmid Relevant characteristics Source or
reference
Strains
S. mutans
GS-5 Wild type; Ems; Kms; serotype c human
isolate
SUNYaBa, (86)
�luxS luxS mutant; Emr; GS-5::pAYLS1101 (86)
V. harveyi
BB170 Reporter strain; sensor 1-, sensor 2+ (70)
Plasmids
pFW5ø (mutAp-gfp) Gfp plasmid; Spr (36)
aSUNYaB, the culture collection in the Department of Oral Biology, State University of
New York, Buffalo, NY.

11
2.2 Saliva collection
Saliva was collected on ice from twelve volunteers, pooled, and treated with 2.5
mM dithiothreitol (Fisher Scientific, Fair Lawn, NJ) to reduce salivary protein
aggregation. The saliva was gently stirred on ice for 10 min, after which it was clarified
by centrifugation at 30,000 × g and 4˚C for 20 min, diluted to 25% with distilled water,
and filter sterilized using a Durapore® 0.22 �m pore size membrane filter (Millipore
Corp., Billerica, MA). Prior to use in experiments, the sterile saliva was thawed on ice
and the precipitate was centrifuged at 1430 × g for 5 min. The clear 25% saliva
supernatant was used in the experiments (56).
2.3 Transformation of S. mutans
Transformation of S. mutans was accomplished according to a previously
published protocol (57). Plasmid DNA was prepared from Escherichia coli by using a
Perfectprep® Plasmid Mini kit (Eppendorf, Hamburg, Germany). Briefly, overnight
cultures of S. mutans grown in BHI at 37˚C with 5% CO2 were diluted 1:20 in pre-
warmed BHI with 10% horse serum. The diluted culture was grown to a turbidity of 0.2
at 600 nm, and 2 �g of plasmid DNA was added to 1 mL of diluted culture. The mixture
was then incubated for 4 h, plated on BHI agar plates containing 800 �g/mL
spectinomycin, and incubated overnight at 37˚C with 5% CO2. Single colonies of the
transformants were then selected and grown overnight in BHI with 800 �g/mL
spectinomycin. Glycerol stocks of the transformants were made and stored at -80˚C.
12
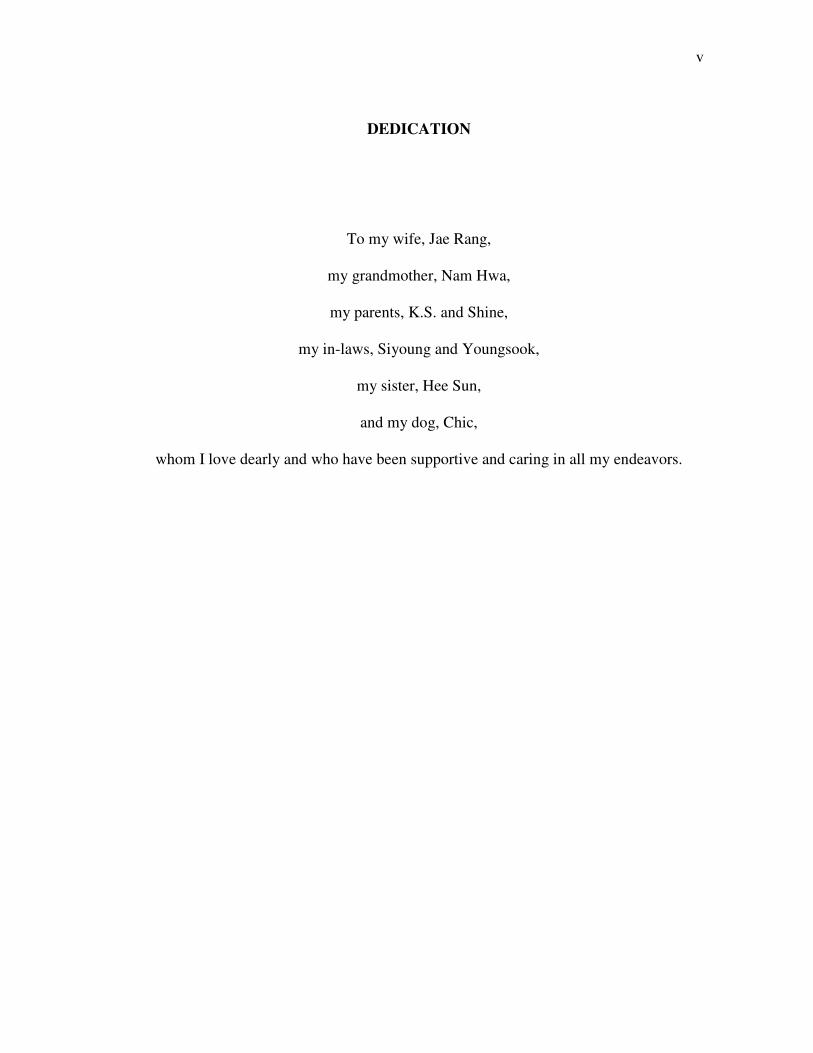
2.4 Development of PDMS microfluidic devices
Soft lithography techniques (81, 85) were used to develop microfluidic devices
with polydimethyl siloxane (PDMS; Sylgard® 184 Silicone Elastomer Kit, Dow
Corning, Midland, MI) (Fig. 2.1). Briefly, masks were designed using AutoCAD 2006
(Autodesk, San Rafael, CA) and printed using a high-resolution printer (Fineline
Imaging Inc., Colorado Springs, CO). The masks were used in 1:1 contact
photolithography of SU-8 50 photoresist (Microchem Corp., Newton, MA) with a
Q4000 mask aligner (Quintel, Morgan Hill, CA) to generate a set of “master” silicon (Si)
wafers consisting of 70 and 90 �m tall structures for a simple microchannel device and a
gradient generating device (27, 28), respectively. PDMS was poured onto the master
wafers and cured at 80˚C for 2 hours and then removed. Inlet and outlet holes were
punched out using a sharpened needle for bulk PDMS structures, and a pair of sharpened
tweezers for thin PDMS membranes (70�m thick) which were used for pneumatic valves
in the gradient generating devices. The bulk PDMS and PDMS membrane molds were
bonded together, and the single or combined PDMS blocks were then bonded onto clean
glass slides (Fisher Scientific, Hampton, NH) by treating surfaces with oxygen plasma at
100mW for 40 sec using a CS-1701 reactive ion etcher (RIE; March Plasma Systems,
Concord, CA). Completed devices were sterilized at 121˚C for 20 min before use.
Tygon® tubing (Fisher Scientific, Hampton, NH) was inserted into the inlets and outlets
to connect the microfluidic channels to medium filled syringes (Becton Dickinson & Co.,
Franklin Lakes, NJ) which were pushed by a KDS230 multi-syringe pump (KD
Scientific Inc., Holliston, MA) (Fig. 2.2).

13
FIG. 2.1. Soft lithography procedure for microfluidic device fabrication (A) and
operating scheme for microfluidic valve (B).
A

14
FIG. 2.1. Continued.
B
15
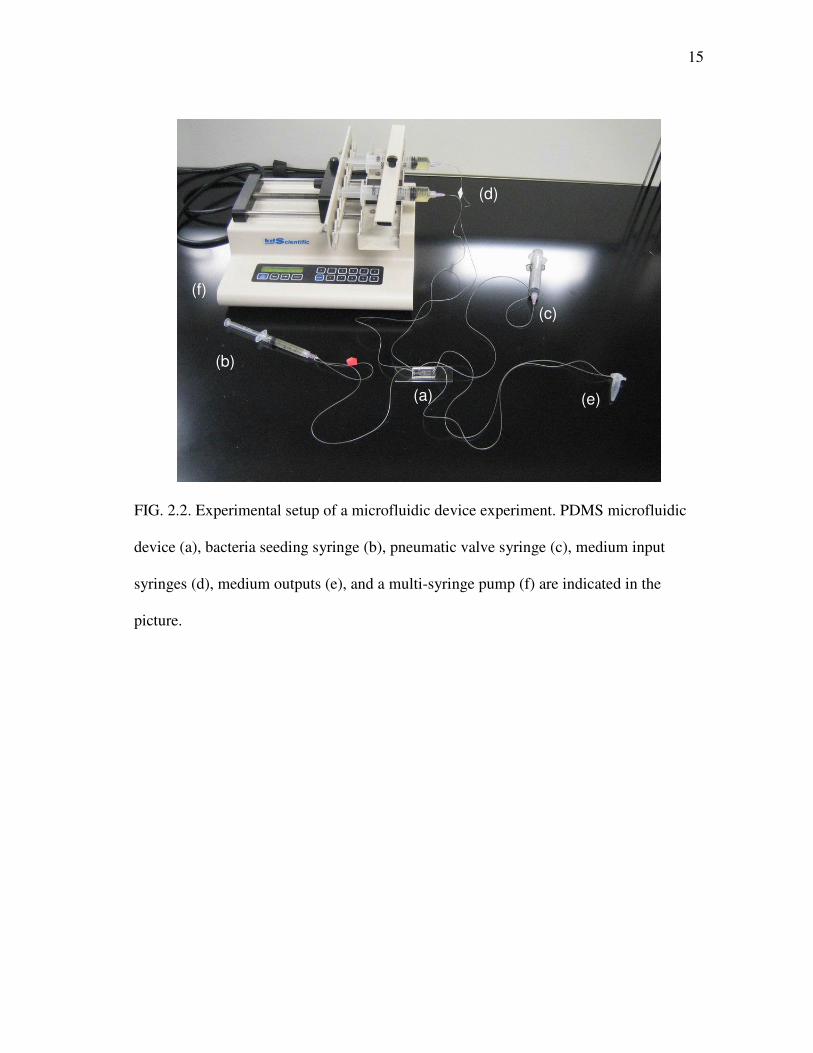
FIG. 2.2. Experimental setup of a microfluidic device experiment. PDMS microfluidic
device (a), bacteria seeding syringe (b), pneumatic valve syringe (c), medium input
syringes (d), medium outputs (e), and a multi-syringe pump (f) are indicated in the
picture.
(f)
(d)
(c)
(b)
(a) (e)

16
2.5 Preliminary microfluidic device experiments
Overnight cultures of S. mutans transformants carrying the green fluorescent
protein (GFP) expressing plasmid (referred to as S. mutans-GFP) were diluted 1:20 and
grown statically for 2 h. Cells were washed twice in either 25% saliva or PBS and
resuspended in either 25% saliva or BHI, both of which were supplemented with 1%
sucrose and 800 �g/mL spectinomycin, to a turbidity of 0.1 at 600 nm. Cells were then
seeded in a microfluidic device for 2 h at 37˚C with 5% CO2. Devices were
preconditioned with 25% saliva for 30 min prior to cell seeding as it has been previously
shown to increase initial attachment of streptococcal cells to glass slide surfaces (56).
The devices were washed with PBS and attached cells were imaged using a Zeiss
Axiovert 200M inverted fluorescence microscope (Carl Zeiss Inc., Thornwood, NY)
with a FITC filter setting. Images were analyzed with Photoshop 6.0 (Adobe, San Jose,
CA) to obtain bacterial area coverage on the glass surfaces within channels. Conditions
resulting in better coverage were used to seed S. mutans cells in the devices for 30 min, 1
h, 2 h, and 4 h to obtain an adequate seeding time using the same method.
Sterile syringes were filled with 25% saliva, 10% BHI, or 25% BHI and flowed
through a microfluidic device in a 37˚C, 5% CO2 environment at 5 �L/min (2.5 �L/min
in each channel) using a multi-syringe pump. Channels were imaged at 5 and 24 h after
start of the flow using a fluorescence microscope and area coverage analyzed as
described above. The flow medium yielding the highest increase in area coverage
between 5 and 24 h of flow was selected for further microfluidic device experiments.

17
Additionally, flow rates of 0.5 �L/min and 5 �L/min (0.25 �L/min and 2.5 �L/min in
each channel) were compared for better biofilm growth using the selected flow medium.
Development of S. mutans biofilm in the devices was monitored for 48 h using
the flow medium and flow rate giving the most biofilm formation in order to obtain a
time point for maximum biofilm growth. Channels were imaged every 12 h using a TCS
SP5 confocal scanning laser microscope (CSLM; Leica Microsystems, Mannheim,
Germany) with a 40× dry objective. Excitation of GFP was induced with an Ar laser at
488 nm and emission was detected at 495 to 550 nm. Color confocal images were
exported as gray scale images and mean thickness, biomass, and area coverage were
determined using COMSTAT image-processing software (24). Three random positions
within each channel were selected for microscope analysis and twenty five z-stack
images were processed at each point. Means and pooled standard deviations were
calculated based on these positions for each channel. Simulated three-dimensional
images of the formed biofilms were obtained using IMARIS (BITplane, Zurich,
Switzerland). Twenty five z-stack images were processed for each three-dimensional
image.
Simple microchannel devices (Fig. 2.3) were used for all preliminary device
experiments, and sucrose and spectinomycin were added to final concentrations of 1%
and 800 �g/mL, respectively, to all flow media used.
18
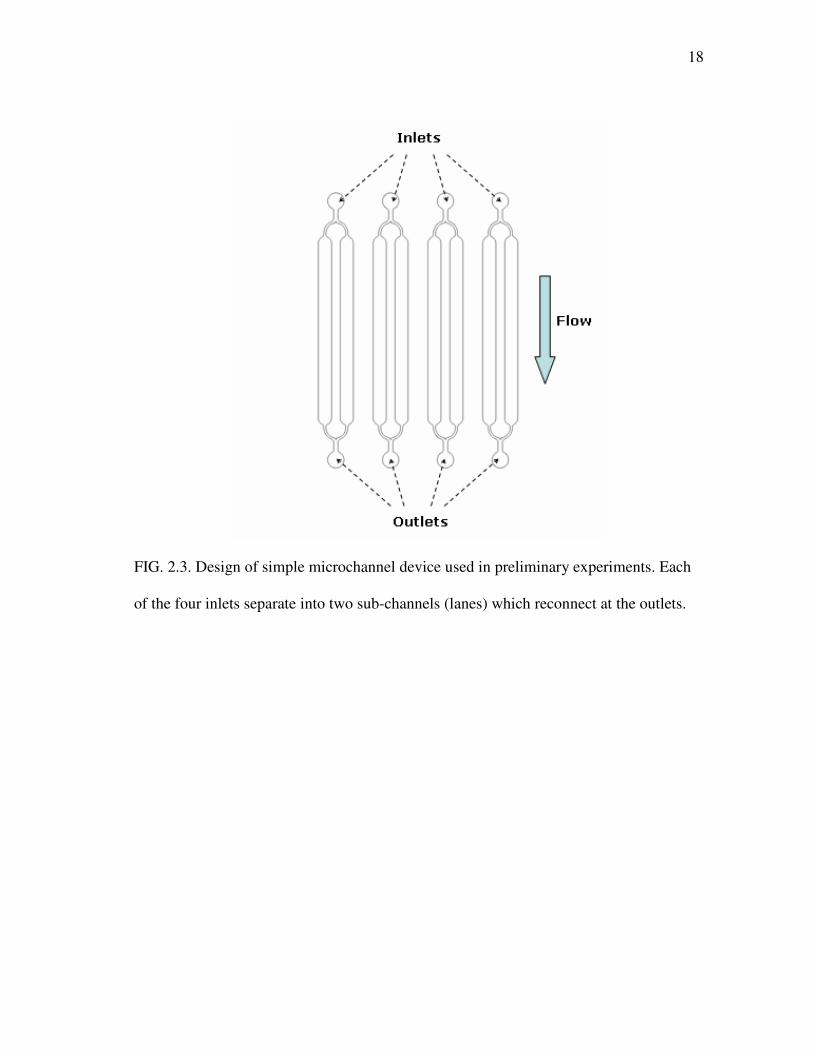
FIG. 2.3. Design of simple microchannel device used in preliminary experiments. Each
of the four inlets separate into two sub-channels (lanes) which reconnect at the outlets.

19
2.6 Microfluidic gradient device experiments
Gradient generating microfludic devices (Fig. 2.4) were preconditioned with 25%
saliva for 30 min. Overnight cultures of S. mutans were diluted 1:20 and grown statically
for 2 h. Cells were washed twice in 25% saliva and resuspended to a turbidity of 0.1 at
600 nm in BHI supplemented with 1% sucrose and 800 �g/mL spectinomycin. The
pneumatic valves were opened by pulling an air-filled syringe connected to the
pneumatic-valve channel. Cells were seeded through the seeding channel of the device
and left in a static condition for 2 h at 37˚C with 5% CO2. The two medium input
syringes were supplemented with 0 and 5 �M DPD, respectively. Valves were then
closed and medium was flowed through the device at 10 �L/min (2.5 �L/min in each
channel) in a 37˚C, 5% CO2 environment. Confocal images were taken at 5 and 24 h,
and analyzed using COMSTAT and IMARIS as described above. The device induced
gradient was quantified using fluorescein (Acros Organics, Fair Lawn, NJ) as a
fluorescent tracer at 1, 10, and 50 �L/min flow. Fluorescent images were obtained using
an inverted fluorescence microscope (Carl Zeiss Inc., Thornwood, NY). Gray scale
images were exported and analyzed using Photoshop 6.0 (Adobe, San Jose, CA).

20
FIG. 2.4. Gradient generating device. AutoCAD design (A) and picture taken with
insertion of food dye (B).
Medium inlets
Seeding inlet
Microvalve
Outlets
�
Bottom Top
Pneumatic valve port
A
B

21
2.7 Crystal violet biofilm assay
Microfludic biofilm results were validated using a simple biofilm quantification
assay according to the method of Loo et al. (45) with slight modifications. Briefly,
overnight cultures of S. mutans �luxS were diluted in BHI or 25% saliva to a turbidity of
0.05 at 600 nm and aliquoted 1 mL each into 1.5 mL microcentrifuge tubes (Fisher
Scientific, Hampton, NH). DPD was added to the aliquoted cultures to final
concentrations of 0, 0.05, 0.5, and 5 nM; and 0.05, 0.5, 2, 4, and 5 �M. 300 �L of the
cultures were added to three wells each of a polystyrene 96-well microtiter plate
(Corning Inc., Corning, NY) and incubated for 24 h at 37˚C under 5% CO2, after which
growth was observed by measuring optical density at 600 nm using a Spectramax
340PC384 microplate spectrophotometer (Molecular Devices, Union City, CA). The
culture medium was then removed and 0.1% crystal violet (CV; Acros Organics, Fair
Lawn, NJ) solution was added to each well. After 20 min, the wells were rinsed three
times in distilled water and air dried. The CV in the wells was solubilized in 95%
ethanol and the optical density at 540 nm was evaluated. Wells containing uninoculated
medium were used as an experimental control. Each data point was averaged from nine
replicate wells (three wells from three independent cultures).

22
2.8 AI-2 uptake assay
AI-2 uptake by S. mutans �luxS was monitored by measuring a change in the
amount of extracellular AI-2 with time in a S. mutans �luxS culture. Extracellular AI-2
was assayed using the method of Surette and Bassler (70). Briefly, overnight cultures of
S. mutans �luxS were diluted to a turbidity of 0.05 at 600 nm and grown in 25% saliva
supplemented with 1% sucrose and 10 �M DPD. Supernatants were obtained at 0, 2, 4, 6,
8 h by centrifugation of cultures at 4˚C (13,200 rpm for 5 min) and filter sterilization
using 0.22 �m pore size Fisherbrand® sterile syringe filters (Fisher Scientific, Hampton,
NH). Supernatants were stored at -20˚C until used in the assay. The reporter strain V.
harveyi BB170 was grown overnight in AB medium and diluted 1:5,000 in fresh AB
medium. Supernatants were added 1:10 to the diluted V. harveyi culture and grown at
30˚C for 3 h. Bioluminescence was then measured with a TD-20e luminometer (Turner
Designs, Sunnyvale, CA). Uninoculated 25% saliva supplemented with 1% sucrose was
used to measure background luminescence values and the same medium with addition of
10 �M DPD served as an experimental control. The experiment was conducted in
triplicate for two independent overnight cultures and results are reported as fold changes
relative to background luminescence values with propagation of error presented as error
bars. Growth of S. mutans �luxS was observed by measuring the turbidity at 600 nm of
cultures every 2 h and plotted with the AI-2 assay results.
23
3. RESULTS
3.1 Selection of biofilm culture conditions
3.1.1 Simple microchannel device
A simple 8-lane microchannel device (2 lanes per inlet) was fabricated for
preliminary selection of conditions for S. mutans biofilm formation in PDMS
microfluidic devices (Fig. 2.3). Dimensions of each channel were 10 mm (length) by 600
�m (width) by 70 �m (height). Wall shear stress at the flow rate used (5 �L/min) was
calculated as 1.02 × 10⁻² Pa using CFD software (Fluent Inc., Lebanon, NH).
3.1.2 Cell washing and seeding medium
The effects of cell washing and resuspension media on the initial attachment of S.
mutans cells to the glass surface within a microfluidic device were investigated by
analyzing area coverage of diluted overnight cultures washed in 25% saliva or PBS and
resuspended in 25% saliva or BHI prior to seeding in a simple microchannel device (Fig.
3.1).
Cells resuspended in BHI prior to seeding in the device showed two- to four-fold
higher area coverage compared to cells resuspended in 25% saliva (Fig 3.1; compare
conditions PB and SB with conditions PS and SS). No clear differences in area coverage
were observed among cells washed in PBS and 25% saliva (Fig 3.1; compare conditions
PB and PS with conditions SB and SS) prior to resuspension.

24
FIG. 3.1. Area coverage for initially attached cell clusters of S. mutans in a simple
microchannel device with cells washed and seeded in the following conditions: PB, cells
washed in PBS and seeded in BHI; PS, cells washed in PBS and seeded in 25% saliva;
SB, cells washed in 25% saliva and seeded in BHI; SS, cells washed and seeded in 25%
saliva. Two random positions within each channel (four random positions per condition)
were analyzed and mean ± standard deviation for each condition is shown. The asterisks
(*) indicate statistical significance between PB and PS; and SB and SS, determined
using a Student’s t-test (p < 0.005).
*
*
25
3.1.3 Seeding time
An appropriate cell seeding time for initial attachment of S. mutans to the glass
surface within a microfluidic device was obtained by seeding cells in simple
microchannel devices for 0.5, 1, 2, and 4 h (Fig. 3.2).
Area coverage increased proportionally with seeding times and maximum area
coverage was obtained with 4 h seeding. However, fluorescence images of channels
seeded for 4 h showed formation of bacterial clusters which was due to lateral and
vertical growth of biofilm. Therefore, 2 h seeding, with a mean area coverage of 11.10%,
was implemented in further microfluidic device experiments.
3.1.4 Flow media and flow rate
A flow medium was selected for maximal growth of S. mutans biofilms in
microfluidic devices. Three different types of media (25% saliva, 10% BHI, and 25%
BHI) were used in a simple microchannel device at 5 �L/min for 24 h and area coverage
was analyzed at 5 and 24 h (Table 3.1). The highest increase in area coverage between 5
and 24 h was obtained when flowing 25% BHI (Table 3.1; > 20% increase). Less than
10% increase in area coverage was obtained using low nutrient media (Table 3.1; 25%
saliva and 10% BHI).
The selected medium (25% BHI) was flowed at two different flow rates (5 and
0.5 �L/min; flow rates previously used in our group for S. gordonii biofilm formation)
and the flow rate appropriate for growth of S. mutans biofilms in microfludic devices
was chosen by analyzing and comparing area coverage as described above (Table 3.1).

26
FIG. 3.2. Area coverage for initially attached cell clusters of S. mutans seeded in a
simple microchannel device for 0.5, 1, 2, and 4 h. Six random positions in the device
were analyzed per condition and mean ± standard deviation are shown. Statistical
significance of values for adjacent time points were determined using a Student’s t-test.
*, p < 0.001; ** p < 0.002.
*
*
**

27
Higher values were obtained when flowing medium at 5 �L/min. Limited nutrient
transport is postulated to have caused the smaller increase in area coverage with the
lower flow rate.
TABLE 3.1. Effects of flow media and flow rates on area coverage
Media Flow rate
(�L/min)
Area coverage at
5 h (%)
Area coverage at
24 h (%)
Percent increase in
area coverage (%)
25% saliva 5 8.80 ± 1.00* 8.82 ± 1.20* 0.20
10% BHI 5 13.09 ± 1.75* 14.24 ± 1.25* 8.82
25% BHI 5 11.53 ± 1.32* 15.88 ± 2.05* 37.74
25% BHI 0.5 7.09 ± 2.32* 8.78 ± 1.44* 23.87
* Pooled standard deviation
3.1.5 Biofilm growth
Biofilms of S. mutans WT and S. mutans �luxS were grown in microfluidic
devices for 48 h and observed every 12 h to elucidate growth patterns and obtain
measurement time points of interest for further experiments using microfluidic devices.
Mean thickness, biomass, and area coverage of S. mutans biofilms formed in simple
microchannel devices were determined by COMSTAT analysis (Fig. 3.3), with the
initiation of medium flow immediately after cell seeding as the start point (0 h).
Although highest biofilm values were obtained at 0 h (data not shown), theses values are
28
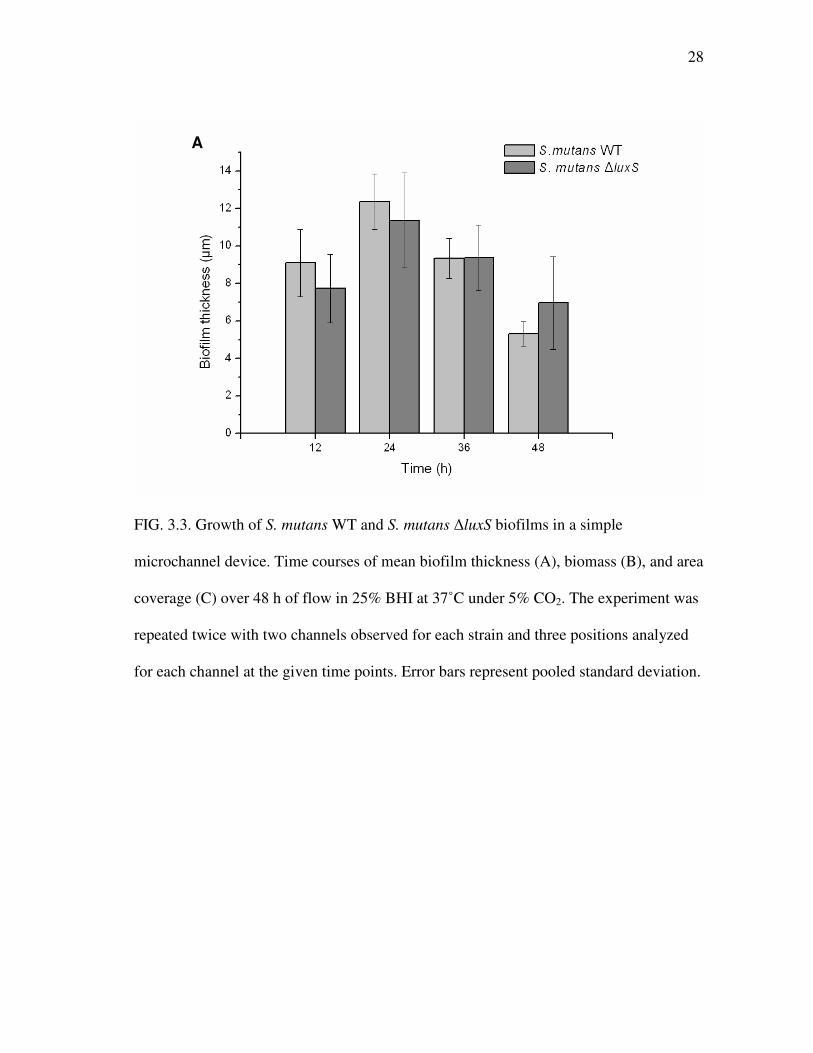
FIG. 3.3. Growth of S. mutans WT and S. mutans �luxS biofilms in a simple
microchannel device. Time courses of mean biofilm thickness (A), biomass (B), and area
coverage (C) over 48 h of flow in 25% BHI at 37˚C under 5% CO2. The experiment was
repeated twice with two channels observed for each strain and three positions analyzed
for each channel at the given time points. Error bars represent pooled standard deviation.
A

29
FIG. 3.3. Continued.
B
C

30 30
12 h 24 h 36 h 48 h
WT
�luxS
FIG. 3.4. IMARIS images of S. mutans WT and S. mutans �luxS biofilms formed in 25% BHI at 37˚C under 5% CO2 for 12,
24, 36, and 48 h. The experiment was repeated twice, and one representative image is shown for individual strains at each time
point. Grids represent 10 �m spacing.
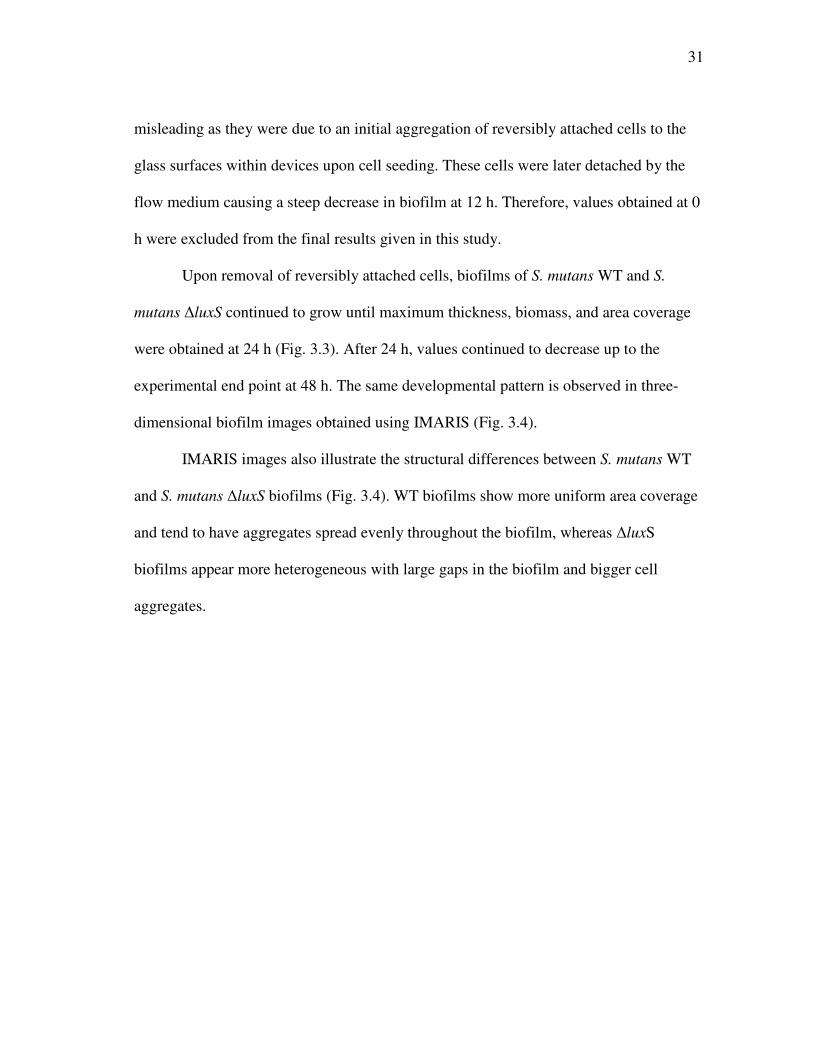
31
misleading as they were due to an initial aggregation of reversibly attached cells to the
glass surfaces within devices upon cell seeding. These cells were later detached by the
flow medium causing a steep decrease in biofilm at 12 h. Therefore, values obtained at 0
h were excluded from the final results given in this study.
Upon removal of reversibly attached cells, biofilms of S. mutans WT and S.
mutans �luxS continued to grow until maximum thickness, biomass, and area coverage
were obtained at 24 h (Fig. 3.3). After 24 h, values continued to decrease up to the
experimental end point at 48 h. The same developmental pattern is observed in three-
dimensional biofilm images obtained using IMARIS (Fig. 3.4).
IMARIS images also illustrate the structural differences between S. mutans WT
and S. mutans �luxS biofilms (Fig. 3.4). WT biofilms show more uniform area coverage
and tend to have aggregates spread evenly throughout the biofilm, whereas �luxS
biofilms appear more heterogeneous with large gaps in the biofilm and bigger cell
aggregates.

32
3.2 Microfluidic gradient experiments
3.2.1 Device description
A microfluidic gradient generating device was designed with a microfluidic
gradient generator (27, 28) consisting of eight outlet channels (Fig. 2.4). Pneumatic
valves were added to the gradient generating device for uniform cell seeding of the
channels (21). Dimensions of each channel were 10 mm (length) by 600 �m (width) by
90 �m (height). Wall shear stress at the flow rate used (10 �L/min) was calculated as
6.41 × 10⁻³ Pa using CFD software (Fluent Inc., Lebanon, NH).
3.2.2 Characterization using fluorescein
The gradient generating device used in this study was characterized by
conducting a fluorescent tracer experiment using fluorescein. Fluorescein (MW 332.3) is
an appropriate analog for AI-2 (MW 132.1) as the molecular weights are comparable.
Fluorescent images of each channel were obtained by a fluorescence microscope and
intensity values were analyzed, normalized and plotted as arbitrary units (arb. unit) (Fig.
3.5). A linear chemical gradient was obtained at a flow rate of 1 �L/min (0.25 �L/min
per channel). 10 �L/min (2.5 �L/min per channel) yielded a fairly linear gradient profile,
while mixing of fluid streams was incomplete at 50 �L/min (12.5 �L/min per channel).
The resulting relative concentration values were used for calculation of AI-2
concentrations in the gradient generating device for later experiments.

33
FIG. 3.5. Characterization of gradient generating device using fluorescein. Fluorescein
was pumped through a gradient generating device at 1, 10, and 50 �L/min and
fluorescence images of each channel were analyzed, normalized, and plotted as arbitrary
units (arb. unit).
1 2 3 4 5 6 7 8 Channel
number (#):
0 1 Input concentrations
(arb. unit):

34
3.2.3 Effects of AI-2 gradient on S. mutans �luxS biofilm formation
The effects of different AI-2 concentrations on mono-species S. mutans �luxS
biofilm formation were investigated by growing S. mutans �luxS biofilms in a gradient
generating device with an AI-2 gradient of 0 to 5 �M. A range of AI-2 concentrations (0,
0.1, 0.6, 2.4, 3.7, 4.7, 4.9, and 5 �M) was generated by adding 5 �M DPD to medium
entering one of the two flow media inlets in the device and 25% BHI supplemented with
1% sucrose and 800 �g/mL spectinomycin was flowed through the device at 10 �L/min
(2.5 �L/min per channel).
After 5 and 24 h, no significant differences were observed in mean biofilm
thickness, biomass, and area coverage amongst channels with different AI-2
concentrations using COMSTAT analysis (Fig. 3.6). In addition, no changes in
phenotype were observed in three-dimensional biofilm images obtained by IMARIS (Fig.
3.7). This suggests that extracellular addition of AI-2 does not affect mono-species S.
mutans �luxS biofilm formation.

35
FIG. 3.6. Effect of AI-2 gradient on S. mutans �luxS biofilm formation in a microfludic
gradient device. Mean biofilm thickness (A), biomass (B), and area coverage (C) at 5
and 24 h with flow in 25% BHI at 37˚C under 5% CO2. The experiment was repeated
three times and nine positions were averaged (three positions from each experiment) for
each data point. Error bars represent pooled standard deviation.
A

36
FIG. 3.6. Continued.
B
C

37 37
0 �M 0.1 �M 2.4 �M 5 �M
5 h
24 h
FIG. 3.7. IMARIS images of S. mutans �luxS biofilms formed for 5 and 24 h in 25% BHI at 37˚C under 5% CO2 with the
introduction of an AI-2 gradient ranging from 0 to 5 �M. The experiment was repeated three times, and one representative
image is shown for each time point and AI-2 concentration. Grids represent 10 �m spacing.

38
3.3 Crystal violet biofilm assay
Results obtained in the AI-2 gradient device experiment were confirmed by
growing S. mutans �luxS in a 96-well microtiter plate for 24 h at 37˚C under 5% CO2 in
BHI supplemented with 1% sucrose and DPD added at varying concentrations ranging
from 0 to 5 �M (0, 0.05, 0.5, and 5 nM; and 0.05, 0.5, 2, 4, and 5 �M). To eliminate the
possibility that S. mutans growth medium components or metabolic products were
interfering with AI-2-mediated biofilm formation, S. mutans �luxS cultures were also
grown in 25 % saliva supplemented with 1% sucrose and the same concentrations of
DPD. Cells cultured in BHI typically yielded three-fold higher growth and four- to five-
fold higher biofilm formation compared to cells grown in saliva.
No significant effects of AI-2 on mono-species S. mutans �luxS cell growth and
biofilm formation were observed in either medium at the AI-2 concentrations used (Fig.
3.8). BHI and saliva grown cultures both reached the same respective optical densities
for growth and biofilm formation at the AI-2 concentrations tested. These results are in
agreement with those of the AI-2 gradient device experiment and substantiate our
supposition that AI-2 does not play a critical role in mono-species S. mutans �luxS
biofilm formation.

39
FIG. 3.8. Crystal violet assay on the effect of AI-2 on S. mutans �luxS biofilm formation.
Cell growth (A) and biofilm formation (B) after 24 h incubation in 25% BHI at 37˚C
under 5% CO2. The experiment was repeated three times and nine wells (3 wells from
each experiment) were averaged for each data point. Error bars represent pooled
standard deviation.
A

40
FIG. 3.8. Continued.
B

41
3.4 AI-2 uptake assay
AI-2 uptake by S. mutans �luxS was investigated by monitoring extracellular AI-
2 levels of S. mutans �luxS cultures grown in 25% saliva supplemented with 1% sucrose
and 10 �M DPD over a period of 8 h. 25% saliva supplemented with 1% sucrose was
chosen as the medium for culture growth as previous results (47, 72) have shown that
supernatants collected from cultures grown in BHI have cause interference in V. harveyi
induced luminescence. Cell-free supernatants were collected every 2 h and induction of
AI-2 was detected by V. harveyi BB170 reporter strain. Results are reported as fold
changes relative to background luminescence values of uninoculated 25% saliva
supplemented with 1% sucrose. A six-fold decrease in extracellular AI-2 was detected at
2 h after start of growth of diluted overnight cultures (OD600 = 0.1345) and the decreased
level persisted up to 8 h. Statistical significance was confirmed using a Student’s t-test (p
< 0.01). No significant changes in AI-2 levels were observed in experimental controls
(uninoculated medium supplemented with 10 �M DPD) (Fig. 3.9). These results indicate
uptake of extracellular AI-2 by S. mutans �luxS.

42
FIG. 3.9. AI-2 uptake by S. mutans �luxS was observed at 2 h after start of growth of
diluted overnight cultures in 25% saliva supplemented with 1% sucrose. Statistical
significance was determined using a Student’s t-test (*, p < 0.01). Induction of AI-2 was
assayed as described in Materials and Methods Uninoculated 25% saliva supplemented
with 10 �M DPD served as an experimental control. The experiment was conducted in
triplicate for two independent cultures and luminescence is expressed as fold change
relative to background luminescence with propagation of error presented as error bars.
* * *
*

43
4. DISCUSSION, SUMMARY, AND CONCLUSIONS
4.1 Discussion
QS-based communication in oral biofilm formation is extremely complex as it
involves hundreds of different bacterial species that dynamically interact in a specific
colonization sequence to form such highly organized structures (34). Despite its
significance, there is very little information available on its role in oral biofilm formation.
Previous methods used to study oral biofilm formation include the use of chemostats,
disks suspended in liquid culture, constant depth film fermentors (CDFF), and flow cells
(82). Each system has its unique advantages, but none of them can fully mimic the
natural oral environment (82). Microfluidic systems are advantageous as they can be
rigorously controlled to mimic the natural cellular environment (29). Moreover, a broad
range of experimental stimuli can be tested simultaneously and a high level of statistical
significance can be obtained by conducting multiple replicas in parallel (30). Hence,
microfluidic devices can be used as an extremely powerful tool in the study of biofilms.
In this study, we report conditions for sufficient development of S. mutans biofilms in a
simple microchannel device (Fig. 2.3), and the effects of AI-2 on mono-species S.
mutans �luxS biofilm formation using a gradient generating device (Fig. 2.4).
Prior studies have shown that washing cells in 25% saliva before seeding flow
cells increases the initial attachment of oral bacteria to the glass surface (56). In our
simple microchannel device, no clear changes in the initial attachment of cells to the
glass surface due to saliva washing were observed for S. mutans (Fig. 3.1). However,
44
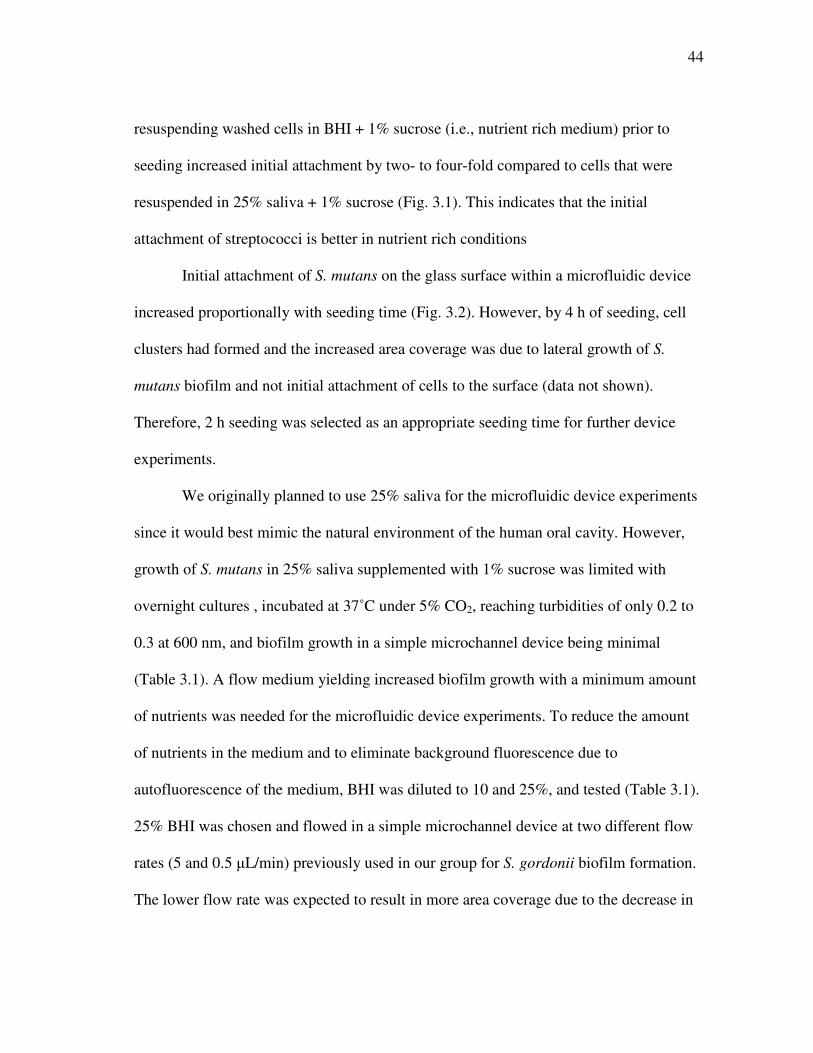
resuspending washed cells in BHI + 1% sucrose (i.e., nutrient rich medium) prior to
seeding increased initial attachment by two- to four-fold compared to cells that were
resuspended in 25% saliva + 1% sucrose (Fig. 3.1). This indicates that the initial
attachment of streptococci is better in nutrient rich conditions
Initial attachment of S. mutans on the glass surface within a microfluidic device
increased proportionally with seeding time (Fig. 3.2). However, by 4 h of seeding, cell
clusters had formed and the increased area coverage was due to lateral growth of S.
mutans biofilm and not initial attachment of cells to the surface (data not shown).
Therefore, 2 h seeding was selected as an appropriate seeding time for further device
experiments.
We originally planned to use 25% saliva for the microfluidic device experiments
since it would best mimic the natural environment of the human oral cavity. However,
growth of S. mutans in 25% saliva supplemented with 1% sucrose was limited with
overnight cultures , incubated at 37˚C under 5% CO2, reaching turbidities of only 0.2 to
0.3 at 600 nm, and biofilm growth in a simple microchannel device being minimal
(Table 3.1). A flow medium yielding increased biofilm growth with a minimum amount
of nutrients was needed for the microfluidic device experiments. To reduce the amount
of nutrients in the medium and to eliminate background fluorescence due to
autofluorescence of the medium, BHI was diluted to 10 and 25%, and tested (Table 3.1).
25% BHI was chosen and flowed in a simple microchannel device at two different flow
rates (5 and 0.5 �L/min) previously used in our group for S. gordonii biofilm formation.
The lower flow rate was expected to result in more area coverage due to the decrease in

45
wall shear stress, but interestingly, the higher flow rate yielded higher values (Table 3.1).
It is likely that there exists a balance between the wall shear stress and nutrient transport,
where at the lower flow rate, while shear is relatively less, the transport of nutrients is
limited. In contrast, at the higher flow rate, while shear is high, nutrient transport is
extensive. Thus, we speculate that sufficient nutrient transport subdued the limiting
effects of the higher wall shear stress at the higher flow rate, resulting in increased area
coverage values.
Growth of S. mutans WT and S. mutans �luxS biofilms under flow in a simple
microchannel device both peaked at 24 h growth. Mean biofilm thickness, biomass, and
area coverage of S. mutans WT and S. mutans �luxS at each of the time points were
similar and followed the same overall trend (Fig. 3.3). Our data on the dynamics of
biofilm development as well as the maximum thickness are consistent with those
reported for different strains of S. mutans in flow cells (52, 65, 78). Structural
differences between S. mutans WT and S. mutans �luxS biofilms were observed in three-
dimensional biofilm images acquired by IMARIS (Fig. 3.4). S. mutans WT biofilms
show relatively consistent area coverage with evenly spread aggregates, whereas S.
mutans �luxS biofilms exhibit irregular area coverage with bigger cell aggregates. This
is in agreement with observations made on biofilm structure of S. mutans �luxS in other
studies (47, 80, 86).
AI-2 has been primarily studied as an inter-species signaling molecule (34, 46,
49, 61, 64), but recent studies also show its effects in intra-species signaling with respect
to mono-species biofilm development of both Gram-positive and negative bacteria (1, 9,

46
19, 38, 39, 58, 67), including those of mono-species S. mutans (44, 47, 72, 79, 80, 86).
Therefore, we initially focused on determining the effects of AI-2 signaling on S. mutans
biofilm formation. A range of AI-2 concentrations (0, 0.1, 0.6, 2.4, 3.7, 4.7, 4.9, and 5
�M) was generated in the gradient generating microfluidic device and the effects of
different AI-2 concentrations on mono-species S. mutans �luxS biofilm formation were
investigated. Different concentrations were simultaneously tested as accurate AI-2
concentrations in the oral cavity are not known, and the range of concentrations used in
different studies in the literature varies widely. For example, sub-nanomolar levels of
synthetic DPD were used for dual-species biofilm formation of A. naeslundii and S.
oralis �luxS (0.08, 0.8, 8, 80, and 800 nM; mutualistic growth complemented at 0.8 nM)
(61), and S. mutans UA159 �luxS (0.04, 0.08, 8, 80, 800, and 8000 nM; addition of 75.6
�M was used for genetic analysis) (72). 1:1000 dilution of a partially purified AI-2
suspension from A. actinomycetemcomitans that induced a 400-fold luminescence in V.
harveyi was used for its luxS mutant (67), and synthetic DPD was added to final
concentrations of 72 �M for Salmonella typhimurium �luxS (9), 1 nM to 100 �M for
Lactobacillus rhamnosus �luxS (38), and 0.2 to 11 �M for E. coli (19). No distinct
differences in biofilm growth and architecture were observed under different AI-2
concentrations (Fig. 3.6). Three-dimensional images generated using IMARIS are in
agreement with these observations (Fig. 3.7).
Results to the AI-2 gradient experiment were further validated by growing S.
mutans �luxS cultures in a standard 96-well microtiter plate and determining biofilm
using the crystal violet assay (45). No apparent distinctions in growth or biofilm

47
formation were observed in wells with different AI-2 concentrations, which are in
agreement with results from the AI-2 gradient experiment. The experiment was repeated
with 25% saliva and similar results were obtained, although cell growth and biofilm
formation values were much less in cultures grown in 25% saliva compared to those
grown in BHI. Our data suggest that an extracellular addition of AI-2 does not affect
mono-species S. mutans �luxS biofilm formation.
To eliminate the possibility that the lack of effect of AI-2 on S. mutans �luxS
biofilm formation was due to lack of uptake of the synthetic AI-2, we determined the
kinetics of AI-2 uptake by S. mutans �luxS. For these experiments, cultures were grown
in 25% saliva supplemented with 1% sucrose as supernatants obtained from S. mutans
grown in BHI have been shown to interfere with luminescence of V. harveyi reporter
strain in the AI-2 assay (47, 72). AI-2 uptake was observed at 2 h after start of growth of
diluted overnight cultures (OD600 = 0.1345; Fig. 3.8). This result indicates that the
synthetic AI-2 was being taken up by S. mutans �luxS. Moreover, the experimental
control values remained constant, reconfirming that our results were not due to AI-2
degradation (Fig. 3.8).
Our results on the inability of AI-2 to complement the luxS mutation with respect
to biofilm formation are in agreement with very recent studies conducted on the effects
of AI-2 in mono-species oral biofilm formation, where extracellular addition of synthetic
DPD did not influence luxS deficient strains of mono-species oral bacteria in regard to
biofilm formation (61, 72). Interestingly, Rickard et al. report that although an
extracellular addition of synthetic DPD did not affect biofilm formation of S. oralis luxS

48
mutant alone, it increased mutualistic growth of dual-species biofilm formed by S. oralis
and A. naeslundii (61). Similar observations have been reported by McNab et al. for luxS
mutant of S. gordonii (46), where no significant differences in biofilm formation
between wild type and luxS mutant strain of S. gordonii were observed. However,
integration of an intact copy of luxS was necessary for complementation of dual-species
biofilm formed by S. gordonii luxS mutant and P. gingivalis. These results suggest that
AI-2 may function solely as an inter-species quorum sensing signal in streptococcal
biofilm formation.
Furthermore, the redundancy and complexity associated with QS signaling may
also lead to difficulties in investigating the effects of AI-2. Several bacteria are known to
communicate with multiple QS systems. For instance, V. harveyi utilizes three
autoinducers (HAI-1, AI-2, and CAI-1) and three cognate receptors (LuxN, LuxQ, and
CqsA) in parallel to direct information into a shared regulatory pathway (i.e., the three
signals converge on a single response regulator to process information). Pseudomonas
aeruginosa responds to multiple autoinducers in a temporally ordered sequence (75).
Oral bacterial cells are also known to communicate by a QS CSP signaling system (34,
87). The CSP system is essential for genetic competence in S. mutans (41) and is
involved in biofilm formation (42, 87). We propose that the CSP system may be
connected with the AI-2 QS system similar to that observed in V. harveyi, where the
absence of AI-2 signaling can possibly be compensated by the CSP signaling pathway.
Lastly, little is known about the phenotypes regulated by AI-2 in oral bacteria
(84). Lebeer et al. (38) imply that the AI-2 signaling is highly integrated in the central

49
metabolism and physiology of bacterial cells and report that the addition of metabolic
compounds (cysteine, biotin, folic acid, and pantothenic acid) rescued biofilm growth
defects in L. rhamnosus �luxS, whereas extracellular addition of AI-2 had no effect (38).
Furthermore, a very recent study by Sztajer et al. (72) reports changes in gene
expression of S. mutans �luxS could not be restored by addition of extracellular AI-2.
Therefore, the deletion of luxS in S. mutans may likely be affecting aspects of oral
bacterial physiology and metabolism that have not yet been identified and thus, have not
been taken into consideration in this study.
4.2 Summary and conclusions
We developed a novel method for studying QS in oral biofilm formation using a
microfluidic device fabricated with simple soft lithography techniques (81, 85). We
successfully obtained appropriate conditions for growth of S. mutans biofilms in a
microfluidic system using a simple microchannel device (Fig. 2.3). Cell preconditioning,
seeding times, flow medium and flow rates, and duration of biofilm growth were tested
and conditions giving the most initial attachment and growth of biofilm were
implemented on an AI-2 gradient experiment. The effects of multiple concentrations of
AI-2 on mono-species S. mutans �luxS biofilm formation were determined by flowing a
gradient of AI-2 (0 to 5 �M) in a gradient generating device (Fig. 2.4) and imaging
microfluidic channels with a CSLM. Image stacks were analyzed using COMSTAT (Fig.
3.6) and three-dimensional biofilm images produced by IMARIS software (Fig. 3.7). No
evident changes in biofilm formation (mean thickness, biomass, and area coverage) due

50
to addition of AI-2 were observed. Results were verified using a crystal violet biofilm
assay (45) and AI-2 uptake by S. mutans �luxS was confirmed using a V. harveyi AI-2
assay (70). The main conclusions from this work are:
1. Microfluidic devices provide a simple and powerful method for study of QS
in bacterial biofilm formation.
2. Extracellular addition of AI-2 does not complement the luxS deletion in S.
mutans with respect to biofilm formation.
4.3 Future work
Extracellular addition of QS signaling molecule AI-2 had no effect on formation
and development of S. mutans �luxS biofilm. However, AI-2 has been shown to
successfully restore luxS mutants to wild type levels in a dual-species biofilm (46, 61).
This suggests that AI-2 may function only as an inter-species signal in oral bacteria.
Therefore, we propose to investigate if external addition of AI-2 can promote dual-
species biofilm formation of S. mutans. For these experiments, we will use a natural
commensal partner strain of S. mutans (e.g. S. gordonii) that is present in the oral cavity.
These studies will be conducted with luxS deficient strains (with each strain expressing
either GFP or red fluorescent protein, RFP) to accurately determine the effect of
externally added AI-2 on dual-species biofilm formation as well as its effect on each
strain.
An alternative signaling pathway may be compensating for the reduction in AI-2
in S. mutans �luxS. The CSP QS pathway has been shown to play a role in S. mutans

51
biofilm formation (42) and is a likely candidate for investigation. Therefore, we propose
to study the coordinated effects of CSP and AI-2 mediated QS using a S. mutans mutant
deficient in both comC and luxS with supplementation of different CSP or AI-2.

52
REFERENCES
1. Ahmed, N. A., F. C. Petersen, and A. A. Scheie. 2007. AI-2 quorum sensing affects antibiotic susceptibility in Streptococcus anginosus. J. Antimicrob. Chemother. 60:49-53.
2. Blehert, D. S., R. J. Palmer, Jr., J. B. Xavier, J. S. Almeida, and P. E. Kolenbrander. 2003. Autoinducer 2 production by Streptococcus gordonii DL1 and the biofilm phenotype of a luxS mutant are influenced by nutritional conditions. J. Bacteriol. 185:4851-4860.
3. Burne, R. A., Z. T. Wen, Y.-Y. M. Chen, and J. E. C. Penders. 1999. Regulation of expression of the fructan hydrolase gene of Streptococcus mutans GS-5 by induction and carbon catabolite repression. J. Bacteriol. 181:2863-2871.
4. Characklis, W. G. 1990. Microbial fouling, p. 523-584. In W. G. Characklis, and Marshall, K. C. (ed.), Biofilms. Wiley, NY.
5. Charlton, T., M. Givskov, R. deNys, J. B. Andersen, M. Hentzer, S. Rice, and S. Kjelleberg. 2001. Genetic and chemical tools for investigating signaling processes in biofilms. Methods. Enzymol. 336:108-128.
6. Costerton, J. W., Z. Lewandowski, D. DeBeer, D. Caldwell, D. Korber, and G. James. 1994. Biofilms, the customized microniche. J. Bacteriol. 176:2137-2142.
7. Costerton, J. W., P. S. Stewart, and E. P. Greenberg. 1999. Bacterial biofilms: a common cause of persistent infections. Science 284:1318-1322.
8. Cvitkovitch, D. G., Y. H. Li, and R. P. Ellen. 2003. Quorum sensing and biofilm formation in streptococcal infections. J. Clin. Invest. 112:1626-1632.
9. De Keersmaecker, S. C., C. Varszegi, N. van Boxel, L. W. Habel, K. Metzger, R. Daniels, K. Marchal, D. De Vos, and J. Vanderleyden. 2005. Chemical synthesis of (S)-4,5-dihydroxy-2,3-pentanedione, a bacterial signal

53
molecule precursor, and validation of its activity in Salmonella typhimurium. J. Biol. Chem. 280:19563-19568.
10. De Kievit, T. R., R. Gillis, S. Marx, C. Brown, and B. H. Iglewski. 2001. Quorum-sensing genes in Pseudomonas aeruginosa biofilms: their role and expression patterns. Appl. Environ. Microbiol. 67:1865-1873.
11. DeLisa, M. P., C.-F. Wu, L. Wang, J. J. Valdes, and W. E. Bentley. 2001. DNA microarray-based identification of genes controlled by autoinducer 2-stimulated quorum sensing in Escherichia coli. J. Bacteriol. 183:5239-5247.
12. Domka, J., J. Lee, and T. K. Wood. 2006. YliH (BssR) and YceP (BssS) regulate Escherichia coli K-12 biofilm formation by influencing cell signaling. Appl. Environ. Microbiol. 72:2449-2459.
13. Falcao, J. P., F. Sharp, and V. Sperandio. 2004. Cell-to-cell signaling in intestinal pathogens. Curr. Issues Intest. Microbiol. 5:9-17.
14. Farinas, J., A. W. Chow, and H. G. Wada. 2001. A microfluidic device for measuring cellular membrane potential. Anal. Biochem. 295:138-142.
15. Federle, M. J., and B. L. Bassler. 2003. Interspecies communication in bacteria. J. Clin. Invest. 112:1291-1299.
16. Fong, K. P., W. O. Chung, R. J. Lamont, and D. R. Demuth. 2001. Intra- and interspecies regulation of gene expression by Actinobacillus actinomycetemcomitans LuxS. Infect. Immun. 69:7625-7634.
17. Foster, J. S., and P. E. Kolenbrander. 2004. Development of a multispecies oral bacterial community in a saliva-conditioned flow cell. Appl. Environ. Microbiol. 70:4340-4348.
18. Fuqua, C., M. R. Parsek, and E. P. Greenberg. 2001. Regulation of gene expression by cell-to-cell communication: acyl-homoserine lactone quorum sensing. Annu. Rev. Genet. 35:439-468.

54
19. Gonzalez Barrios, A. F., R. Zuo, Y. Hashimoto, L. Yang, W. E. Bentley, and T. K. Wood. 2006. Autoinducer 2 controls biofilm formation in Escherichia coli through a novel motility quorum-sensing regulator (MqsR, B3022). J. Bacteriol. 188:305-316.
20. Greenberg, E. P., J. W. Hastings, and S. Ulitzur. 1979. Induction of luciferase synthesis in Beneckea harveyi by other marine bacteria. Arch. Microbiol. 120:87-91.
21. Grover, W. H., R. H. C. Ivester, E. C. Jensen, and R. A. Mathies. 2006. Development and multiplexed control of latching pneumatic valves using microfluidic logical structures. Lab Chip 6:623-631.
22. Hammer, B. K., and B. L. Bassler. 2003. Quorum sensing controls biofilm formation in Vibrio cholerae. Mol. Microbiol. 50:101-104.
23. Havarstein, L. S., P. Gaustad, I. F. Nes, and D. A. Morrison. 1996. Identification of the streptococcal competence-pheromone receptor. Mol. Microbiol. 21:863-869.
24. Heydorn, A., A. T. Nielsen, M. Hentzer, C. Sternberg, M. Givskov, B. K. Ersboll, and S. Molin. 2000. Quantification of biofilm structures by the novel computer program COMSTAT. Microbiology 146:2395-2407.
25. Jayaraman, A., P. J. Hallock, R. M. Carson, C. C. Lee, F. B. Mansfeld, and T. K. Wood. 1999. Inhibiting sulfate-reducing bacteria in biofilms on steel with antimicrobial peptides generated in situ. Appl. Microbiol. Biotechnol. 52:267-275.
26. Jayaraman, A., F. B. Mansfeld, and T. K. Wood. 1999. Inhibiting sulfate-reducing bacteria in biofilms by expressing the antimicrobial peptides indolicidin and bactenecin. J. Ind. Microbiol. Biotechnol. 22:167-175.
27. Jeon, N. L., H. Baskaran, S. K. W. Dertinger, G. M. Whitesides, L. Van De Water, and M. Toner. 2002. Neutrophil chemotaxis in linear and complex gradients of interleukin-8 formed in a microfabricated device. Nat. Biotech. 20:826-830.

55
28. Jeon, N. L., S. K. W. Dertinger, D. T. Chiu, I. S. Choi, A. D. Stroock, and G. M. Whitesides. 2000. Generation of solution and surface gradients using microfluidic systems. Langmuir 16:8311-8316.
29. Khademhosseini, A., R. Langer, J. Borenstein, and J. P. Vacanti. 2006. Tissue engineering special feature: microscale technologies for tissue engineering and biology. Proc. Natl. Acad. Sci. USA 103:2480-2487.
30. King, K. R., S. Wang, D. Irimia, A. Jayaraman, M. Toner, and M. L. Yarmush. 2007. A high-throughput microfluidic real-time gene expression living cell array. Lab Chip 7:77-85.
31. Kleerebezem, M., L. E. Quadri, O. P. Kuipers, and W. M. de Vos. 1997. Quorum sensing by peptide pheromones and two-component signal-transduction systems in gram-positive bacteria. Mol. Microbiol. 24:895-904.
32. Koenig, D. W., and D. L. Pierson. 1997. Microbiology of the space shuttle water system. Water Sci. Technol. 35:59-64.
33. Kolenbrander, P. E. 2000. Oral microbial communities: biofilms, interactions, and genetic systems. Annu. Rev. Microbiol. 54:413-437.
34. Kolenbrander, P. E., R. N. Andersen, D. S. Blehert, P. G. Egland, J. S. Foster, and R. J. Palmer, Jr. 2002. Communication among oral bacteria. Microbiol. Mol. Biol. Rev. 66:486-505.
35. Kolenbrander, P. E., and J. London. 1993. Adhere today, here tomorrow: oral bacterial adherence. J. Bacteriol. 175:3247-3252.
36. Kreth, J., J. Merritt, C. Bordador, W. Shi, and F. Qi. 2004. Transcriptional analysis of mutacin I (mutA) gene expression in planktonic and biofilm cells of Streptococcus mutans using fluorescent protein and glucuronidase reporters. Oral Microbiol. Immunol. 19:252-256.
37. Lamont, R. J., and H. F. Jenkinson. 1998. Life below the gum line: pathogenic mechanisms of Porphyromonas gingivalis. Microbiol. Mol. Biol. Rev. 62:1244-1263.

56
38. Lebeer, S., S. C. J. De Keersmaecker, T. L. A. Verhoeven, A. A. Fadda, K. Marchal, and J. Vanderleyden. 2007. Functional analysis of luxS in the probiotic strain Lactobacillus rhamnosus GG reveals a central metabolic role important for growth and biofilm formation. J. Bacteriol. 189:860-871.
39. Li, J., C. Attila, L. Wang, T. K. Wood, J. J. Valdes, and W. E. Bentley. 2007. Quorum sensing in Escherichia coli is signaled by AI-2/LsrR: effects on small RNA and biofilm architecture. J. Bacteriol. 189:6011-6020.
40. Li, X., K. M. Kolltveit, L. Tronstad, and I. Olsen. 2000. Systemic diseases caused by oral infection. Clin. Microbiol. Rev. 13:547-558.
41. Li, Y. H., P. C. Lau, J. H. Lee, R. P. Ellen, and D. G. Cvitkovitch. 2001. Natural genetic transformation of Streptococcus mutans growing in biofilms. J. Bacteriol. 183:897-908.
42. Li, Y. H., N. Tang, M. B. Aspiras, P. C. Lau, J. H. Lee, R. P. Ellen, and D. G. Cvitkovitch. 2002. A quorum-sensing signaling system essential for genetic competence in Streptococcus mutans is involved in biofilm formation. J. Bacteriol. 184:2699-2708.
43. Loesche, W. J. 1996. Microbiology of dental decay and periodontal disease, p. 1169-1184. In S. Baron (ed.), Medical Microbiology, 4th ed. The University of Texas Medical Branch at Galveston, TX.
44. Lonn-Stensrud, J., F. C. Petersen, T. Benneche, and A. A. Scheie. 2007. Synthetic bromated furanone inhibits autoinducer-2-mediated communication and biofilm formation in oral streptococci. Oral. Microbiol. Immunol. 22:340-346.
45. Loo, C. Y., D. A. Corliss, and N. Ganeshkumar. 2000. Streptococcus gordonii biofilm formation: identification of genes that code for biofilm phenotypes. J. Bacteriol. 182:1374-1382.
46. McNab, R., S. K. Ford, A. El-Sabaeny, B. Barbieri, G. S. Cook, and R. J. Lamont. 2003. LuxS-based signaling in Streptococcus gordonii: autoinducer 2 controls carbohydrate metabolism and biofilm formation with Porphyromonas gingivalis. J. Bacteriol. 185:274-284.

57
47. Merritt, J., F. Qi, S. D. Goodman, M. H. Anderson, and W. Shi. 2003. Mutation of luxS affects biofilm formation in Streptococcus mutans. Infect. Immun. 71:1972-1979.
48. Meyer, D. H., and P. M. Fives-Taylor. 1998. Oral pathogens: from dental plaque to cardiac disease. Curr. Opin. Microbiol. 1:88-95.
49. Miller, M. B., and B. L. Bassler. 2001. Quorum sensing in bacteria. Annu. Rev. Microbiol. 55:165-199.
50. Mitchell, P. 2001. Microfluidics—downsizing large-scale biology. Nat. Biotechnol. 19:717-721.
51. Moore, W. E., and L. V. Moore. 1994. The bacteria of periodontal diseases. Periodontol. 2000 5:66-77.
52. Motegi, M., Y. Takagi, H. Yonezawa, N. Hanada, J. Terajima, H. Watanabe, and H. Senpuku. 2006. Assessment of genes associated with Streptococcus mutans biofilm morphology. Appl. Environ. Microbiol. 72:6277-6287.
53. Mrksich, M., C. S. Chen, Y. Xia, L. E. Dike, D. E. Ingber, and G. M. Whitesides. 1996. Controlling cell attachment on contoured surfaces with self-assembled monolayers of alkanethiolates on gold. Proc. Natl. Acad. Sci. USA 93:10775-10778.
54. Nyvad, B., and M. Kilian. 1987. Microbiology of the early colonization of human enamel and root surfaces in vivo. Scand. J. Dent. Res. 95:369-380.
55. Olofsson, A. C., M. Hermansson, and H. Elwing. 2003. N-acetyl-L-cysteine affects growth, extracellular polysaccharide production, and bacterial biofilm formation on solid surfaces. Appl. Environ. Microbiol. 69:4814-4822.
56. Palmer, R. J., Jr., K. Kazmerzak, M. C. Hansen, and P. E. Kolenbrander. 2001. Mutualism versus independence: strategies of mixed-species oral biofilms in vitro using saliva as the sole nutrient source. Infect. Immun. 69:5794-5804.

58
57. Perry, D., and H. K. Kuramitsu. 1981. Genetic transformation of Streptococcus mutans. Infect. Immun. 32:1295-1297.
58. Petersen, F. C., N. A. Ahmed, A. Naemi, and A. A. Scheie. 2006. LuxS-mediated signalling in Streptococcus anginosus and its role in biofilm formation. Antonie Van Leeuwenhoek 90:109-121.
59. Podbielski, A., and B. Kreikemeyer. 2004. Cell density—dependent regulation: basic principles and effects on the virulence of gram-positive cocci. Int. J. Infect. Dis. 8:81-95.
60. Polson, N. A., and M. A. Hayes. 2001. Microfluidics: controlling fluids in small places. Anal. Chem. 73:312A-319A.
61. Rickard, A. H., R. J. Palmer, Jr., D. S. Blehert, S. R. Campagna, M. F. Semmelhack, P. G. Egland, B. L. Bassler, and P. E. Kolenbrander. 2006. Autoinducer 2: a concentration-dependent signal for mutualistic bacterial biofilm growth. Mol. Microbiol. 60:1446-1456.
62. Risoen, P. A., M. B. Brurberg, V. G. Eijsink, and I. F. Nes. 2000. Functional analysis of promoters involved in quorum sensing-based regulation of bacteriocin production in Lactobacillus. Mol. Microbiol. 37:619-628.
63. Sbordone, L., and C. Bortolaia. 2003. Oral microbial biofilms and plaque-related diseases: microbial communities and their role in the shift from oral health to disease. Clin. Oral. Investig. 7:181-188.
64. Schauder, S., and B. L. Bassler. 2001. The languages of bacteria. Genes Dev. 15:1468-1480.
65. Schofield, A. L., T. R. Rudd, D. S. Martin, D. G. Fernig, and C. Edwards. 2007. Real-time monitoring of the development and stability of biofilms of Streptococcus mutans using the quartz crystal microbalance with dissipation monitoring. Biosens. Bioelectron. 23:407-413.

59
66. Schuster, M., C. P. Lostroh, T. Ogi, and E. P. Greenberg. 2003. Identification, timing, and signal specificity of Pseudomonas aeruginosa quorum-controlled genes: a transcriptome analysis. J. Bacteriol. 185:2066-2079.
67. Shao, H., R. J. Lamont, and D. R. Demuth. 2007. Autoinducer 2 is required for biofilm growth of Aggregatibacter (Actinobacillus) actinomycetemcomitans. Infect. Immun. 75:4211-4218.
68. Sia, S. K., and G. M. Whitesides. 2003. Microfluidic devices fabricated in poly(dimethylsiloxane) for biological studies. Electrophoresis 24:3563-3576.
69. Socransky, S. S., and A. D. Haffajee. 1994. Evidence of bacterial etiology: a historical perspective. Periodontol. 2000 5:7-25.
70. Surette, M. G., and B. L. Bassler. 1998. Quorum sensing in Escherichia coli and Salmonella typhimurium. Proc. Natl. Acad. Sci. USA 95:7046-7050.
71. Surette, M. G., M. B. Miller, and B. L. Bassler. 1999. Quorum sensing in Escherichia coli, Salmonella typhimurium, and Vibrio harveyi: a new family of genes responsible for autoinducer production. Proc. Natl. Acad. Sci. USA 96:1639-1644.
72. Sztajer, H., A. Lemme, R. Vilchez, S. Schulz, R. Geffers, C. Y. Y. Yip, C. M. Levesque, D. G. Cvitkovitch, and I. Wagner-Dobler. 2008. Autoinducer-2 regulated genes in Streptococcus mutans UA159 and global metabolic effect of the luxS mutation. J. Bacteriol. 190:401-415.
73. Uhlmann, D., K. Roeske, K. U. Ulrich, and L. Paul. 1998. Bacteria in the bottom sediment of a drinking water reservoir. Int. Rev. Hydrobiol. 83:269-280.
74. Wang, J. 2002. On-chip enzymatic assays. Electrophoresis 23:713-718.
75. Waters, C. M., and B. L. Bassler. 2005. Quorum sensing: cell-to-cell communication in bacteria. Annu. Rev. Cell Dev. Biol. 21:319-346.

60
76. Watnick, P., and R. Kolter. 2000. Biofilm, city of microbes. J. Bacteriol. 182:2675-2679.
77. Ween, O., P. Gaustad, and L. S. Havarstein. 1999. Identification of DNA binding sites for ComE, a key regulator of natural competence in Streptococcus pneumoniae. Mol. Microbiol. 33:817-827.
78. Wen, Z. T., H. V. Baker, and R. A. Burne. 2006. Influence of BrpA on critical virulence attributes of Streptococcus mutans. J. Bacteriol. 188:2983-2992.
79. Wen, Z. T., and R. A. Burne. 2002. Functional genomics approach to identifying genes required for biofilm development by Streptococcus mutans. Appl. Environ. Microbiol. 68:1196-1203.
80. Wen, Z. T., and R. A. Burne. 2004. LuxS-mediated signaling in Streptococcus mutans is involved in regulation of acid and oxidative stress tolerance and biofilm formation. J. Bacteriol. 186:2682-2691.
81. Whitesides, G. M., E. Ostuni, S. Takayama, X. Jiang, and D. E. Ingber. 2001. Soft lithography in biology and biochemistry. Annu. Rev. Biomed. Eng. 3:335-373.
82. Wimpenny, J. W. 1997. The validity of models. Adv. Dent. Res. 11:150-159.
83. Winans, S. C., and B. L. Bassler. 2002. Mob psychology. J. Bacteriol. 184:873-883.
84. Winzer, K., K. R. Hardie, and P. Williams. 2002. Bacterial cell-to-cell communication: sorry, can't talk now - gone to lunch! Curr. Opin. Microbiol. 5:216-222.
85. Xia, Y., and G. M. Whitesides. 1998. Soft lithography. Angew. Chem. Int. Ed. 37:550-575.

61
86. Yoshida, A., T. Ansai, T. Takehara, and H. K. Kuramitsu. 2005. LuxS-based signaling affects Streptococcus mutans biofilm formation. Appl. Environ. Microbiol. 71:2372-2380.
87. Yoshida, A., and H. K. Kuramitsu. 2002. Multiple Streptococcus mutans genes are involved in biofilm formation. Appl. Environ. Microbiol. 68:6283-6291.

62
VITA
Sun Ho Kim received his Bachelor of Engineering degree in Chemical and
Biological Engineering from Korea University in 2005. He entered the Biomedical
Engineering program at Texas A&M University in September 2005 and received his
Master of Science degree in May 2008. His research interests include bacterial biofilms
and quorum sensing.
Name: Sun Ho Kim
Address: 1600 43rd Ave E, #205, Seattle, WA 98112 Email Address: [email protected] Education: B.Eng., Chemical and Biological Engineering, Korea University,
2005 M.S., Biomedical Engineering, Texas A&M University, 2008


![Control of Dental Biofilm and Oral Health Maintenance in ... · oral hygiene through mechanical means in patients with Down syndrome [18]-[22]. Thus, the key to success in promoting](https://img.pdfslide.us/doc/110x75/5fcd08fb841a14489e579a24/control-of-dental-biofilm-and-oral-health-maintenance-in-oral-hygiene-through.jpg)