Embed Size (px)
Citation preview
CHAPTER 3: COMPARISON OF THE CYTOTOXICITY AND
MEMBRANE PERMEABILISING ACTIVITY OF AHSV, BTV AND
EEV NS3 AND IDENTIFICATION OF DOMAINS IN AHSV NS3
THAT MEDIATE THESE ACTIVITIES
49
3.1. INTRODUCTION
Bluetongue virus (BTV), African horsesickness virus (AHSV) and equine encephalosis virus
(EEV) are closely related members of the Orbivirus genus of the family Reoviridae. These
viruses are similar in morphology and molecular constitution but differ greatly in their ability to
cause disease. African horsesickness (AHS) is characterised, in its acute form, by pulmonary
oedema, pleural effusion and haemorrhage, with a mortality rate of up to 90% in susceptible
horses (reviewed in Mellor & Hamblin, 2004). Loss of endothelial cell barrier function is believed
to be the cause of the characteristic pathological features in AHS (Laegreid et al., 1993).
Bluetongue disease exhibits similar vascular changes as AHS (Howerth & Tyler, 1988), with
pulmonary oedema observed in infected sheep, but the mortality rate is much lower (0-50%).
EEV causes a disease characterised by a high morbidity (60-70%) but a low mortality (5%).
Clinical disease occurs infrequently and lesions are attributable to endothelial damage of certain
blood vessels (Coetzer & Erasmus, 1994). Pathological features of orbiviral diseases therefore
include oedema and haemorrhage which have been associated with permeability changes in
endothelial cells.
In the preceding chapter it was shown that in tissue culture the NS3 protein contributes to cell
membrane permeabilisation and virus release during the AHSV life cycle. AHSV NS3 is a small
membrane-associated protein that has previously been implicated in virus release from infected
cells (Stoltz et al., 1996), and in virus virulence (O'Hara et al., 1998). Expression of this protein in
insect cells causes rapid cell death, that is dependant on the integrity of two hydrophobic domains
(HDs) within the protein (Van Staden et al., 1995; Van Staden et al., 1998). Van Niekerk et al.
(2001a) first proposed that AHSV NS3 has viroporin-like characteristics and may therefore
contribute to pathogenesis.
BTV NS3 is essential for the release of virus-like particles from BTV-infected cells and is involved
in the final stages of virus assembly (Hyatt et al., 1991; Hyatt et al., 1993). This protein interacts
with the host-trafficking proteins, as well as VP2 and VP5 of progeny virions, to facilitate the
release of viral particles (Beaton et al., 2002; Wirblich et al., 2006; Bhattacharya & Roy, 2008).
Han & Harty (2004) demonstrated that BTV NS3 has viroporin-like activity as it localizes to the
Golgi apparatus and plasma membrane of transfected cells where it causes an increase in
membrane permeability, this may have important implications for the pathogenicity of BTV
infection.
EEV NS3 gene and protein sequences from South African isolates have been studied and
compared to other cognate orbivirus NS3 sequences. The protein was found to have conserved
motifs similar to those in BTV and AHSV NS3 (Van Niekerk et al., 2003). These include a second
50
in-phase AUG, a highly conserved region, a proline rich region and two hydrophobic domains.
There is about 17% variation between different EEV proteins, which is more than the 10% of that
between BTV NS3 proteins, but much less than the 37% variation observed between different
AHSV NS3 proteins (Van Niekerk et al., 2001b; Van Niekerk et al., 2003). EEV NS3 is postulated
to play a similar role in virus release and subsequent dispersion of EEV.
As the NS3 proteins of EEV, AHSV and BTV potentially contribute to pathogenesis it would be of
interest to study the cytolytic properties of these proteins in the same cell system. This is
particularly important in view of the large differences in the virulence of the different viruses and
the differences in the pathogenicity of the bluetongue, African horsesickness and equine
encephalosis diseases. To compare the cytotoxicity of AHSV, EEV and BTV NS3 these proteins
were expressed in Spodoptera frugiperda (Sf9) insect and Escherichia coli (E. coli) cells. The
domains within AHSV NS3 involved in cytotoxicity and membrane permeabilisation were
additionally investigated through the construction and expression of several truncated mutants in
E. coli.
51
3.2. MATERIALS AND METHODS
3.2.1. Expression of orbiviral NS3 proteins as recombinants in insect cells 3.2.1.1. Cells and baculoviruses Spodoptera frugiperda (Sf9) insect cells were maintained in suspension cultures or as monolayers in Grace’s or TC-100 Insect medium (Highveld Biological) supplemented with 10% FCS (Sigma), 0.8% pluronic F-68 (Sigma) and antibiotics (Highveld Biological). Recombinant baculoviruses expressing NS3 of AHSV-2 or AHSV-4 were obtained from M. van Niekerk (Van Niekerk, 2001) and J. Korsman (UP). The recombinant baculovirus expressing the BTV-10 NS3 gene was a kind gift from Prof. P. Roy (London School of Hygiene and Tropical Medicine, UK). The recombinant baculovirus expressing EEV Bryanston NS3 was obtained from L. Teixeira (UP). As controls, recombinant baculoviruses expressing enhanced green fluorescent protein (eGFP) (M. Victor, UP) and AHSV NS2 (Uitenweerde et al., 1995) were used. 3.2.1.2. Trypan blue cell viability assay Suspension cultures (50 ml) of Sf9 cells at 1 x 10⁶ cells/ml were pelleted at 1000 rpm for 20-30 min. Cells were gently resuspended in inoculum with recombinant baculoviruses at a MOI of 5-10 pfu/cell made up to a total volume of 5 ml with TC-100 medium. Cells were incubated with shaking at 27oC for 1-2 h. The volume was subsequently increased to 50 ml with supplemented TC-100 and incubated with shaking at 27oC. Aliquots were removed every 3 h for 48 h, stained in an equal volume 0.4% Trypan blue (Sigma) and counted using a haemacytometer. 3.2.1.3. CellTiter-BlueTM Cell Viability Assay Suspension cultures of Sf9 cells at 1 x 10⁶ cells/ml were collected at 1000 rpm for 30 min. The cells were mock infected or resuspended in medium containing recombinant baculoviruses expressing AHSV-4 NS3, BTV-10 NS3, EEV-1 NS3 or eGFP at a MOI of 10 pfu/cell. Cells were infected for 3 h at 27oC with shaking. Infected cells were then collected, resuspended in supplemented TC-100 at 4 x 10⁵ cells/ml and 100 µl/well seeded on 96 well plates. Cells were incubated at 27oC and viability monitored at 24 and 48 h p.i. using the CellTiter-BlueTM Cell
Viability Assay (Promega) according to the manufacturer’s instructions. Briefly, a volume of 20 l
CellTiter-BlueTM reagent was added per well and cells incubated at 27 C for a further 3 h. Fluorescence (530-570Ex/580-620Em) was recorded using a Thermo Labsystems Fluoroskan Ascent FL plate reader. Background fluorescence was corrected for by including wells with serum supplemented culture medium in the absence of cells. Fluorescence readings for these wells were subtracted from experimental wells. The percentage viable cells was calculated by expressing the fluorescence in wells containing insect cells infected with baculoviruses as a percentage of the fluorescence in wells containing uninfected (mock) cells. 3.2.2. Expression of orbiviral NS3 proteins, and truncated AHSV NS3 mutants, in E. coli The pET-41a-c vector series (Novagen) was used for recombinant protein expression in bacteria. This vector is designed for the inducible high-level expression of proteins fused to the carboxyl terminal of a glutathione S-transferase (GST)-Tag protein in E. coli (Fig. 3.1).
52
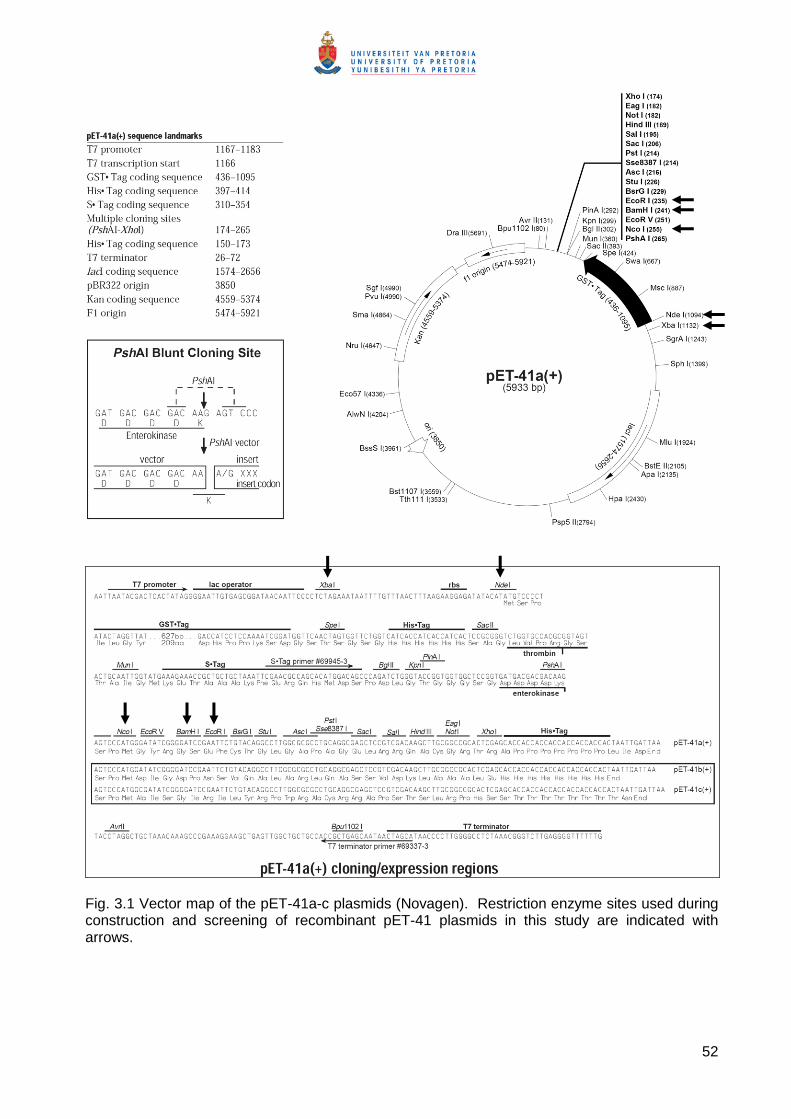
Fig. 3.1 Vector map of the pET-41a-c plasmids (Novagen). Restriction enzyme sites used during construction and screening of recombinant pET-41 plasmids in this study are indicated with arrows.
53
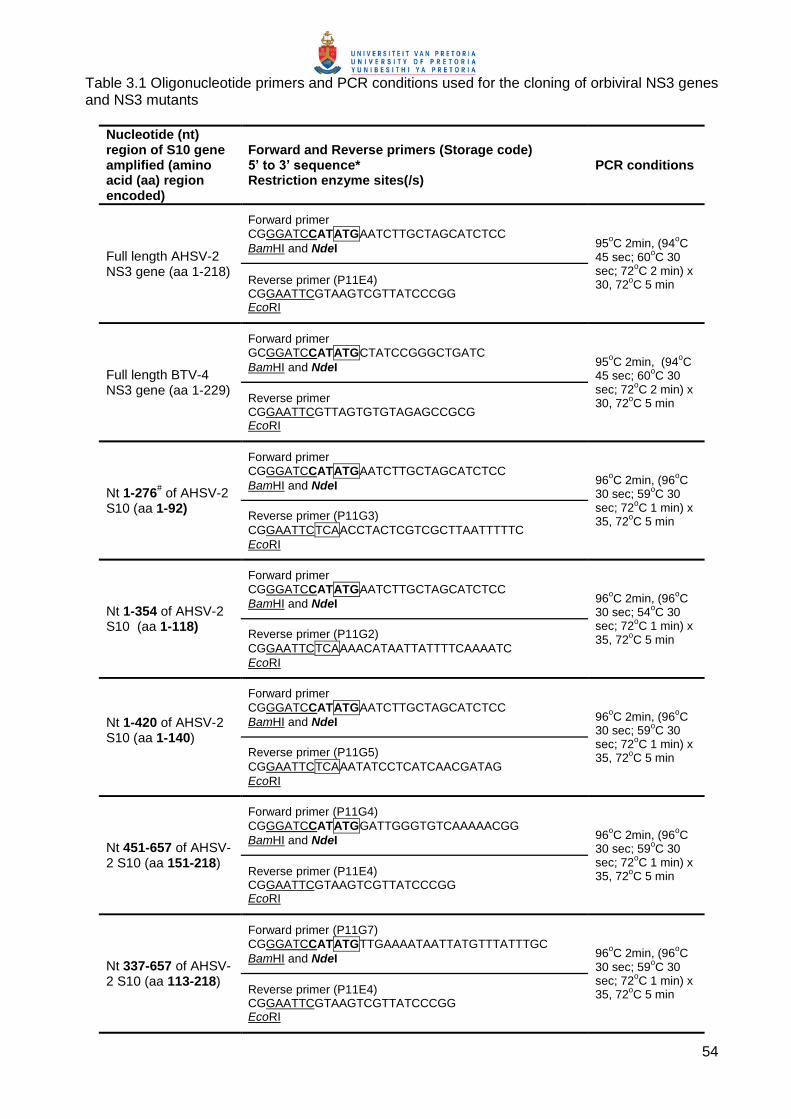
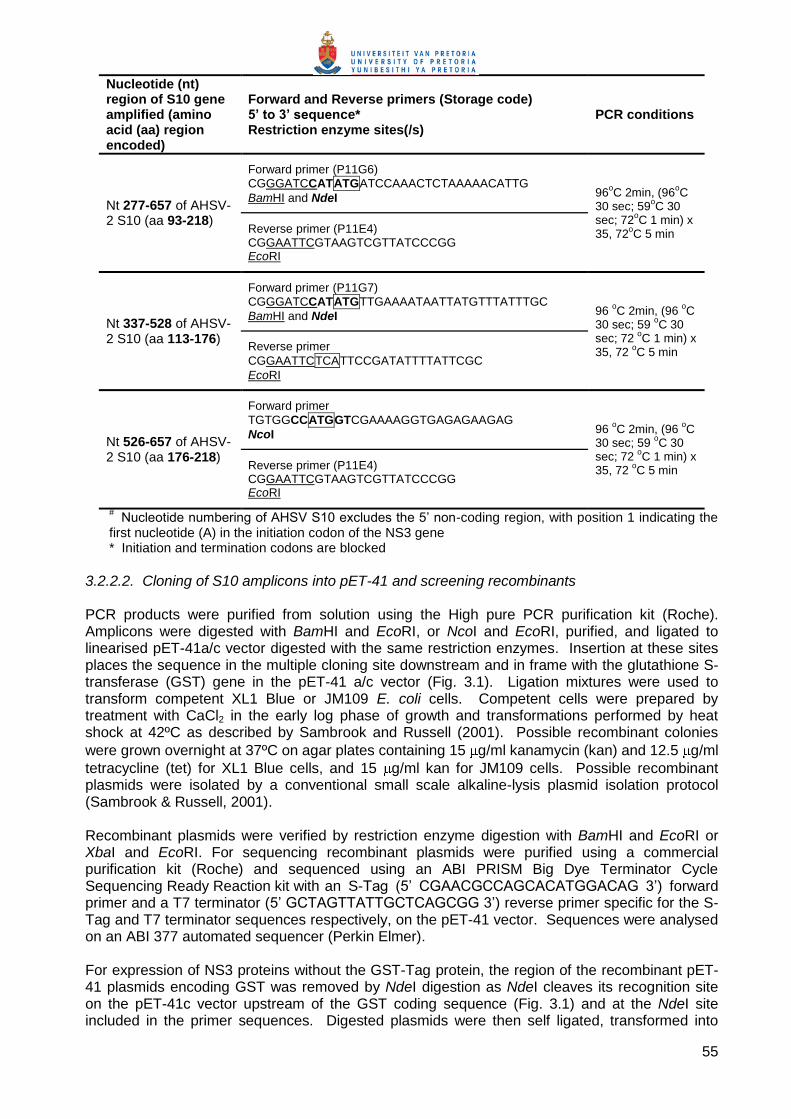
3.2.2.1. PCR amplification of orbiviral S10 genes and truncated AHSV S10 mutants Full length and truncated versions of the AHSV-2 S10 gene were PCR amplified for cloning into pET-41c using a recombinant pFastBac1 plasmid containing a cDNA copy of the AHSV-2 82/61 reference strain NS3 gene as template (kindly provided by Dr. M. van Niekerk, UP). The primers and PCR conditions used are listed in Table 3.1. The primers used during PCR were designed to include codons to initiate and stop translation where necessary, and to create both BamHI and NdeI restriction sites on the 5’ end of the gene and an EcoRI restriction site on the 3’ end of the gene (Table 3.1). The BamHI and EcoRI sites were included for directional cloning into the multiple cloning site (MCS) of pET-41c downstream of, and in frame with, the GST-Tag. This would allow for expression of recombinant proteins as GST-Tag fusions. For expression of recombinant proteins without this Tag protein the NdeI site was included in primer sequences to allow removal of the vector sequence coding for GST (an NdeI site is also present in the vector upstream of the GST-Tag sequence, see Fig. 3.1). PCR amplification with these primers therefore allowed cloning into the pET-41c vector and expression of recombinant proteins with and without the GST-Tag. All truncated versions of the AHSV-2 NS3 gene were amplified as described above except the nucleotide region (526-657) encoding amino acids 176 to 218 of AHSV NS3 (C-terminal region). This region was amplified using the forward primer HS2NS3C-termNco (Table 3.1) with the AHSVNS3pEco reverse primer (Table 3.1). This created an NcoI restriction enzyme site on the 5’ end of the insert and an EcoRI restriction site on the 3’ end. This would allow for the insertion of this NS3 specific sequence into the MCS downstream of the GST-Tag in pET-41a and expression of this region of NS3 as a GST-Tag fusion protein. For cloning of the BTV-4 NS3 gene into pET-41c BTV-4 dsRNA (Van Niekerk et al., 2003) was reverse-transcribed into cDNA and PCR amplified as previously described (Van Niekerk et al., 2001b) using the S10 specific BTV primers listed in Table 3.1. Briefly, approximately 250 ng of dsRNA was denatured in an equal volume 10 mM methylmercuric hydroxide (MMOH) for 10 min at room temperature. To this 2 µl 0.7 M β-mercaptoethanol was added per 10 µl reaction volume to reduce the MMOH and the reaction incubated for 5 min at room temperature in the presence of 40 U RNase inhibitor (recombinant RNasin, Promega). The denatured RNA was added to a cDNA reaction mix containing 100 pmol of each primer, 2.5 mM of each dNTP, reaction buffer and 10 U AMV reverse transcriptase (Promega) and incubated for 90 min at 42oC. The cDNA was then amplified by PCR (2.2.3.2 and Table 3.1). The BTV S10 specific primers were designed to create BamHI and NdeI restriction sites on the 5’ end of the gene and an EcoRI restriction site on the 3’ end of the gene. All PCRs were carried out as described in section 2.2.3.2. and analysed by 1 or 2% agarose gel electrophoresis.
54
Table 3.1 Oligonucleotide primers and PCR conditions used for the cloning of orbiviral NS3 genes and NS3 mutants
Nucleotide (nt) region of S10 gene amplified (amino acid (aa) region encoded)
Forward and Reverse primers (Storage code) 5’ to 3’ sequence* Restriction enzyme sites(/s)
PCR conditions
Full length AHSV-2 NS3 gene (aa 1-218)
Forward primer
CGGGATCCATATGAATCTTGCTAGCATCTCC
BamHI and NdeI 95oC 2min, (94
oC
45 sec; 60oC 30
sec; 72oC 2 min) x
30, 72oC 5 min Reverse primer (P11E4)
CGGAATTCGTAAGTCGTTATCCCGG EcoRI
Full length BTV-4 NS3 gene (aa 1-229)
Forward primer
GCGGATCCATATGCTATCCGGGCTGATC
BamHI and NdeI 95oC 2min, (94
oC
45 sec; 60oC 30
sec; 72oC 2 min) x
30, 72oC 5 min Reverse primer
CGGAATTCGTTAGTGTGTAGAGCCGCG EcoRI
Nt 1-276# of AHSV-2
S10 (aa 1-92)
Forward primer
CGGGATCCATATGAATCTTGCTAGCATCTCC
BamHI and NdeI 96oC 2min, (96
oC
30 sec; 59oC 30
sec; 72oC 1 min) x
35, 72oC 5 min Reverse primer (P11G3)
CGGAATTCTCAACCTACTCGTCGCTTAATTTTTC
EcoRI
Nt 1-354 of AHSV-2 S10 (aa 1-118)
Forward primer
CGGGATCCATATGAATCTTGCTAGCATCTCC
BamHI and NdeI 96oC 2min, (96
oC
30 sec; 54oC 30
sec; 72oC 1 min) x
35, 72oC 5 min Reverse primer (P11G2)
CGGAATTCTCAAAACATAATTATTTTCAAAATC
EcoRI
Nt 1-420 of AHSV-2 S10 (aa 1-140)
Forward primer
CGGGATCCATATGAATCTTGCTAGCATCTCC
BamHI and NdeI 96oC 2min, (96
oC
30 sec; 59oC 30
sec; 72oC 1 min) x
35, 72oC 5 min Reverse primer (P11G5)
CGGAATTCTCAAATATCCTCATCAACGATAG
EcoRI
Nt 451-657 of AHSV-2 S10 (aa 151-218)
Forward primer (P11G4)
CGGGATCCATATGGATTGGGTGTCAAAAACGG
BamHI and NdeI 96oC 2min, (96
oC
30 sec; 59oC 30
sec; 72oC 1 min) x
35, 72oC 5 min Reverse primer (P11E4)
CGGAATTCGTAAGTCGTTATCCCGG EcoRI
Nt 337-657 of AHSV-2 S10 (aa 113-218)
Forward primer (P11G7)
CGGGATCCATATGTTGAAAATAATTATGTTTATTTGC
BamHI and NdeI 96oC 2min, (96
oC
30 sec; 59oC 30
sec; 72oC 1 min) x
35, 72oC 5 min Reverse primer (P11E4)
CGGAATTCGTAAGTCGTTATCCCGG EcoRI
55
Nucleotide (nt) region of S10 gene amplified (amino acid (aa) region encoded)
Forward and Reverse primers (Storage code) 5’ to 3’ sequence* Restriction enzyme sites(/s)
PCR conditions
Nt 277-657 of AHSV-2 S10 (aa 93-218)
Forward primer (P11G6)
CGGGATCCATATGATCCAAACTCTAAAAACATTG
BamHI and NdeI 96oC 2min, (96
oC
30 sec; 59oC 30
sec; 72oC 1 min) x
35, 72oC 5 min Reverse primer (P11E4)
CGGAATTCGTAAGTCGTTATCCCGG EcoRI
Nt 337-528 of AHSV-2 S10 (aa 113-176)
Forward primer (P11G7)
CGGGATCCATATGTTGAAAATAATTATGTTTATTTGC
BamHI and NdeI 96 oC 2min, (96
oC
30 sec; 59 oC 30
sec; 72 oC 1 min) x
35, 72 oC 5 min Reverse primer
CGGAATTCTCATTCCGATATTTTATTCGC
EcoRI
Nt 526-657 of AHSV-2 S10 (aa 176-218)
Forward primer
TGTGGCCATGGTCGAAAAGGTGAGAGAAGAG
NcoI 96 oC 2min, (96
oC
30 sec; 59 oC 30
sec; 72 oC 1 min) x
35, 72 oC 5 min Reverse primer (P11E4)
CGGAATTCGTAAGTCGTTATCCCGG EcoRI
# Nucleotide numbering of AHSV S10 excludes the 5’ non-coding region, with position 1 indicating the
first nucleotide (A) in the initiation codon of the NS3 gene * Initiation and termination codons are blocked
3.2.2.2. Cloning of S10 amplicons into pET-41 and screening recombinants PCR products were purified from solution using the High pure PCR purification kit (Roche). Amplicons were digested with BamHI and EcoRI, or NcoI and EcoRI, purified, and ligated to linearised pET-41a/c vector digested with the same restriction enzymes. Insertion at these sites places the sequence in the multiple cloning site downstream and in frame with the glutathione S-transferase (GST) gene in the pET-41 a/c vector (Fig. 3.1). Ligation mixtures were used to transform competent XL1 Blue or JM109 E. coli cells. Competent cells were prepared by treatment with CaCl2 in the early log phase of growth and transformations performed by heat shock at 42ºC as described by Sambrook and Russell (2001). Possible recombinant colonies
were grown overnight at 37ºC on agar plates containing 15 g/ml kanamycin (kan) and 12.5 g/ml
tetracycline (tet) for XL1 Blue cells, and 15 g/ml kan for JM109 cells. Possible recombinant plasmids were isolated by a conventional small scale alkaline-lysis plasmid isolation protocol (Sambrook & Russell, 2001). Recombinant plasmids were verified by restriction enzyme digestion with BamHI and EcoRI or XbaI and EcoRI. For sequencing recombinant plasmids were purified using a commercial purification kit (Roche) and sequenced using an ABI PRISM Big Dye Terminator Cycle Sequencing Ready Reaction kit with an S-Tag (5’ CGAACGCCAGCACATGGACAG 3’) forward primer and a T7 terminator (5’ GCTAGTTATTGCTCAGCGG 3’) reverse primer specific for the S-Tag and T7 terminator sequences respectively, on the pET-41 vector. Sequences were analysed on an ABI 377 automated sequencer (Perkin Elmer). For expression of NS3 proteins without the GST-Tag protein, the region of the recombinant pET-41 plasmids encoding GST was removed by NdeI digestion as NdeI cleaves its recognition site on the pET-41c vector upstream of the GST coding sequence (Fig. 3.1) and at the NdeI site included in the primer sequences. Digested plasmids were then self ligated, transformed into
56
competent cells, the cells grown and possible recombinant plasmids isolated as described above. Removal of the vector sequence encoding GST was confirmed by digestion of recombinant plasmids with XbaI and EcoRI. The XbaI enzyme cleaves upstream of the NdeI site and the GST-Tag coding sequence on pET-41. A recombinant pET-41a plasmid containing a cDNA copy of the EEV(Bryanston) NS3 gene (pET-EEV NS3) was obtained from L. Teixeira (UP). The sequence encoding the GST-Tag protein had been removed from this recombinant plasmid using a similar protocol (Teixeira, 2005). 3.2.2.3. Transformation of E. coli with recombinant pET-41 plasmids The E. coli expression hosts BL21(DE3)pLysS or BL21(DE3) cells (Novagen) were used for the bacterial recombinant expression of full length and truncated NS3 proteins. Cells were grown to early log phase and made competent by treatment with CaCl2. The recombinant pET-41 plasmids constructed in 3.2.2.1 were used to transform competent cells by heat shock (Sambrook
& Russell, 2001). Transformed cells were selectively grown on agar plates containing 15 g/ml
kan for BL21(DE3) cells, and 15 g/ml kan and 34 g/ml chloramphenicol for BL21(DE3)pLysS cells.
3.2.2.4. Induction and analysis of recombinant protein expression in E. coli Transformed expression hosts were grown and induced as recommended by the manufacturers (Novagen). Single transformed colonies were used to inoculate a small volume (2 to 3 ml) of Luria-Bertani medium (LB) supplemented with appropriate antibiotics. Cultures were grown with
shaking at 37 C to an absorbance at 600 nm (OD600) of 0.6–0.8 units. The cells were diluted 100-
fold in fresh supplemented LB medium and grown at 37 C until an OD600 of 0.5-0.6 was reached.
Recombinant protein expression was induced by the addition of isopropyl- -D-thiogalactoside (IPTG) to a final concentration of 1 mM. Protein expression in cells transformed with pET-41 plasmids expressing recombinant proteins without the GST-Tag was monitored by metabolic labelling of proteins. For this purpose aliquots of each induced culture were taken 10 min prior to labelling and incubated in the presence or
absence of 200 g/ml rifampicin (rif) at 37 C for 10 min. Samples were then labelled with 5
Ci/ml [35S] L-methionine (Perkin Elmer) for 20 or 45 min. Cultures were collected (1 min at 13 200 rpm) and resuspended in 1 x protein solvent buffer (PSB). Protein samples were resolved by standard 15, 18 or 20% SDS-PAGE and soaked overnight in a 20% methanol, 3% glycerol solution. Gels containing 18 or 20% polyacrylamide were dried overnight using a BioRad GelAir Dryer. Gels containing 15% polyacrylamide were dried for 1 to 2 h at 80ºC under vacuum. Dried gels were exposed to an imaging screen-K (BioRad), and scanned using a Personal Molecular Imager FX (BioRad) or exposed to X-ray films in a cassette for 48 h following which they were developed and fixed for visualisation of labelled proteins using standard autoradiographic methods. For the analysis of protein expression in cells transformed with pET-41 plasmids expressing recombinant GST-Tag fusion proteins, samples of induced cultures were taken every 30 min for 2 h, the cells harvested by centrifugation and resuspended in PBS. An equal volume of 2 x PSB was added and proteins analysed by 10 or 12% SDS-PAGE. Gels were stained with 0.05% w/v Coomassie blue and destained in a 5% v/v methanol and 5% v/v acetic acid solution. 3.2.2.5. E. coli cell growth assays Cells transformed with non-recombinant or recombinant pET-41 plasmids were grown and IPTG induced as described above (3.3.2.3). Cell growth was then monitored by measuring the OD600 of cultures every hour for 4 h. All data represent the mean and standard deviation calculated from at least four independent experiments. For cell growth plots the mean OD600 values at each time point were expressed as a percentage of the mean OD600 value for that culture at induction. The
57
percentage growth of recombinant cultures was also calculated relative to that of the control culture (cells transformed with the non-recombinant pET-41 c) i.e. control culture growth was set at 100%. This calculated value was then subtracted from 100% to obtain the percentage inhibition of growth relative to the control culture. 3.2.2.6. Hygromycin B E. coli membrane permeability assay For the Hyg B membrane permeability assay, recombinant cultures were IPTG induced for 30 min
and incubated for a further 20 min in the absence or presence of 500 g/ml Hyg B. Thereafter
samples were labelled for 45 min with 5 Ci/ml [35S] L-methionine (Perkin Elmer). Proteins were resolved and visualised as described (3.3.2.3). Translation levels were estimated by quantifying radiolabelled protein bands in each lane on SDS-PAGE gels using Quantity One 1-D Analysis Software (BioRad). The amount of protein in lanes representing samples metabolically labelled in the presence of Hyg B is then expressed as a percentage of the amount of protein in lanes representing the same culture metabolically labelled in the absence of Hyg B. This percentage is then representative of the percentage cells that where permeabilised to Hyg B, and is referred to as the percentage permeabilised cells. 3.2.2.7. β-galactosidase E. coli membrane permeability assay Recombinant bacterial cultures were grown and induced as described above (3.3.2.3). At 4 h post induction the OD600 of each culture was measured. A volume of 0.5 ml culture was removed, the cells pelleted (1 min at 13 200 rpm) and resuspended in fresh medium. ONPG (o-nitrophenyl-β-D-galactopyranoside) was added to the resuspended pellets at a final concentration of 2 mM and incubated at 30ºC for 10 min. The reaction was stopped through the addition of 200 µl 1 M sodium carbonate buffer (pH 9.5). Cells were pelleted and the absorbance at 420 nm of the supernatant read to measure ONPG cleavage by β-galactosidase within permeabilised cells. OD420 readings were standardised to the bacterial growth (OD600) of that culture. 3.2.2.8. Purification of N- and C-terminal regions of AHSV-2 NS3 3.2.2.8a Analysis of solubility of GST-NS3 Tag fusion proteins BL21(DE3) cells containing recombinant pET-41 plasmids expressing truncated versions of NS3 as GST fusions were grown and induced as described in 3.3.2.3. Induced cultures were incubated at 37oC for 3 h with agitation. Cells were collected by centrifugation at 4000 rpm for 15 min. Cell pellets were frozen and stored at -80oC or used immediately. Cell pellets were resuspend in 4ml Lysis buffer (0.05% Tween 20; 50 mM EDTA; 1 mg/ml lysozyme; 0.7 µg/ml pepstatin; 1 mg/ml pefabloc SC in PBS) per 100 ml starting culture. Cells were incubated on ice for 1 h and sonicated 10 times at 50% duty cycle 3 output for 20 sec followed by 30 sec on ice each. Samples were centrifuged at 2500 g for 15 min. The supernatant (soluble fraction) was transferred to a clean tube and the pellet (particulate fraction) resuspended in an equal volume Lysis buffer. Proteins in the particulate and soluble fractions were analysed by SDS-PAGE and visualised by Coomassie staining. 3.2.2.8b Purification of fusion proteins and cleavage of GST from GST-NS3 fusion proteins Lyophilised glutathione immobilized on cross-linked 4% beaded agarose (Sigma) was allowed to swell in 200 ml/g double distilled water overnight at 4oC. The swelled resin was centrifuged at 500 g for 5 min, washed with ten bed volumes of cold PBS and recentrifuged. An equal volume of PBS was then added to make a 50% glutathione agarose slurry. Soluble fractions of lysates from induced recombinant BL21(DE3) cells were prepared as described above (3.3.2.8a) except that cells were induced for 24 h at 20oC. Soluble fractions were mixed with 50% glutathione agarose slurry (2 ml per 100 ml starting culture) and DTT (dithiothreitol) added to a final concentration of 1 mM. Samples were agitated at room temperature for 1 h and centrifuged at 500 g for 5 min. The resin was washed twice with ten bed
58
volumes cold PBS containing 1% v/v Triton X-100 and once with ten bed volumes of cold PBS, with each wash the sample was mixed by inverting and the resin collected by centrifugation at 500 g for 5 min at 4ºC. For each 1 ml bed volume 2U Thrombin (Boehringer Mannheim GmbH) and 1 ml cold sterile PBS was then added. Samples were incubated overnight at room temperature with gentle agitation and centrifuged at 500 g for 5 min at 4ºC. The supernatant, containing the purified protein, was freeze dried and resuspend in 100-200 µl sterile PBS. The resin was washed once with cold PBS and resuspended in an equal volume PBS. Proteins were analysed by SDS-PAGE and Coomassie staining. The quantification of protein bands was performed using Quantity One 1-D Analysis Software (BioRad).
59
3.3. RESULTS
This part of the study aimed to characterise and compare the cytolytic and membrane
permeabilising properties of the AHSV, BTV and EEV NS3 proteins, and to identify the protein
domains determining these properties. The orbiviral NS3 proteins were therefore recombinantly
expressed and their effects compared in both insect and bacterial cells. The domains within
AHSV NS3 responsible for these activities was subsequently investigated, through the
construction, expression and analysis of truncated mutants of the protein in E. coli. The
expression of these truncated mutants as GST-Tag fusion proteins in E. coli for purification
purposes is also described here.
3.3.1. Comparison of the cytolytic properties of BTV, AHSV and EEV NS3 in Sf9 cells
It was of interest to investigate whether there are any differences in the cytolytic properties of the
AHSV, BTV and EEV NS3 proteins. The proteins were therefore expressed in Sf9 cells using the
recombinant baculovirus expression system. Recombinant baculoviruses had previously been
generated and the expression kinetics of the NS3 proteins characterised (Van Niekerk, 2001;
Teixeira, 2005).
To assess changes in the viability of Sf9 cultures expressing the recombinant orbiviral NS3
proteins a Trypan blue cell viability assay was used (Fig. 3.2). Sf9 cells were infected with wild-
type baculovirus or recombinant baculoviruses expressing AHSV, BTV or EEV NS3 and AHSV
NS2. Samples of infected cells were removed every three hours for 48 hours and Trypan blue
added. The cytoplasm of non-viable or permeabilised Sf9 cells is stained blue by this vital
exclusion dye, while viable and non-permeabilised cells remain unstained. The number of
stained and unstained cells were therefore counted at each time point. The percentage viable
cells was then calculated as the number of unstained cells over the total (stained and unstained)
number of cells x 100.
At 18 h p.i. (Fig. 3.2) there was no difference in the percentage viable cells in cultures infected
with wild-type or recombinant baculoviruses. Expression of recombinant proteins in the
baculovirus expression system occurs under the control of a strong late polihedrin baculovirus
promoter. Recombinant proteins are therefore expressed and detected between 18 and 24 h p.i.
in this system. Control cultures infected with wild-type baculovirus then displayed only a slight
decrease in viability with 84% viable cells still remaining at 48 h p.i.. Similarly, 76% of the cells
infected with a recombinant baculoviruses that express the AHSV NS2 protein still remained
viable at 48 h p.i.. Therefore, over-expression of a recombinant protein, in this case NS2, does
not necessarily negatively impact on the viability of the cells. From 18 h p.i. the viability of cells
60
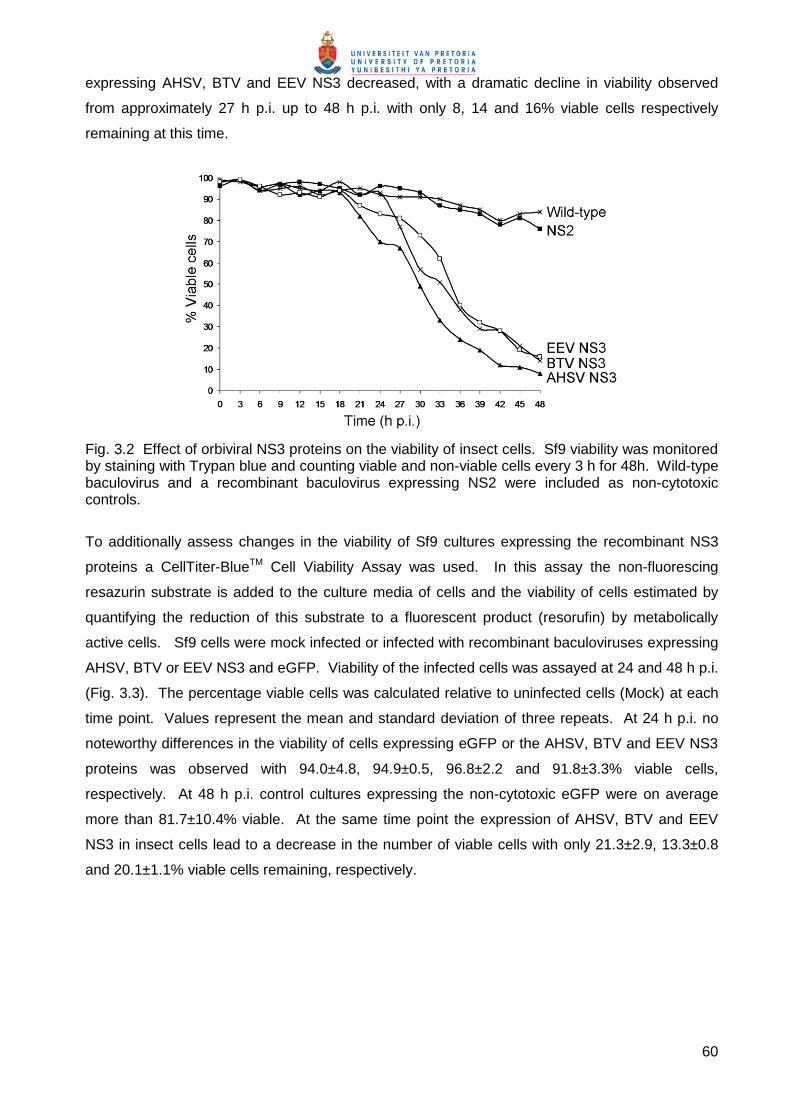
expressing AHSV, BTV and EEV NS3 decreased, with a dramatic decline in viability observed
from approximately 27 h p.i. up to 48 h p.i. with only 8, 14 and 16% viable cells respectively
remaining at this time.
Fig. 3.2 Effect of orbiviral NS3 proteins on the viability of insect cells. Sf9 viability was monitored by staining with Trypan blue and counting viable and non-viable cells every 3 h for 48h. Wild-type baculovirus and a recombinant baculovirus expressing NS2 were included as non-cytotoxic controls.
To additionally assess changes in the viability of Sf9 cultures expressing the recombinant NS3
proteins a CellTiter-BlueTM Cell Viability Assay was used. In this assay the non-fluorescing
resazurin substrate is added to the culture media of cells and the viability of cells estimated by
quantifying the reduction of this substrate to a fluorescent product (resorufin) by metabolically
active cells. Sf9 cells were mock infected or infected with recombinant baculoviruses expressing
AHSV, BTV or EEV NS3 and eGFP. Viability of the infected cells was assayed at 24 and 48 h p.i.
(Fig. 3.3). The percentage viable cells was calculated relative to uninfected cells (Mock) at each
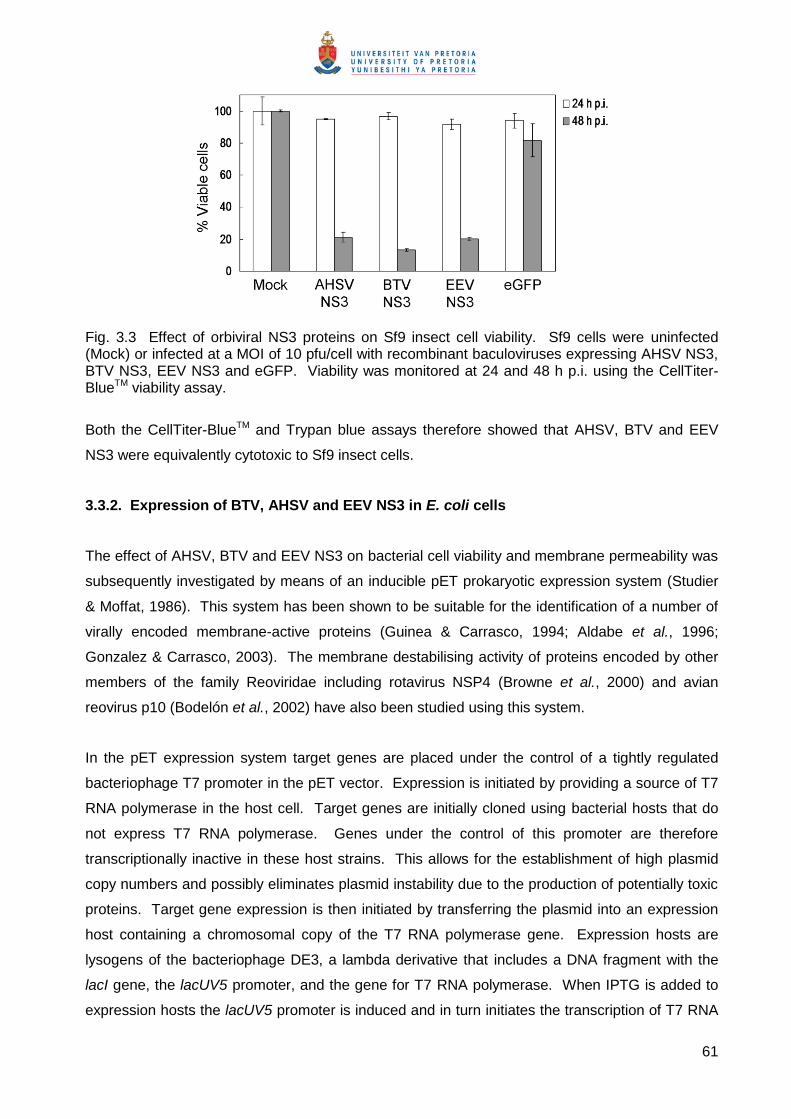
time point. Values represent the mean and standard deviation of three repeats. At 24 h p.i. no
noteworthy differences in the viability of cells expressing eGFP or the AHSV, BTV and EEV NS3
proteins was observed with 94.0±4.8, 94.9±0.5, 96.8±2.2 and 91.8±3.3% viable cells,
respectively. At 48 h p.i. control cultures expressing the non-cytotoxic eGFP were on average
more than 81.7±10.4% viable. At the same time point the expression of AHSV, BTV and EEV
NS3 in insect cells lead to a decrease in the number of viable cells with only 21.3±2.9, 13.3±0.8
and 20.1±1.1% viable cells remaining, respectively.
61
Fig. 3.3 Effect of orbiviral NS3 proteins on Sf9 insect cell viability. Sf9 cells were uninfected (Mock) or infected at a MOI of 10 pfu/cell with recombinant baculoviruses expressing AHSV NS3, BTV NS3, EEV NS3 and eGFP. Viability was monitored at 24 and 48 h p.i. using the CellTiter-BlueTM viability assay.
Both the CellTiter-BlueTM and Trypan blue assays therefore showed that AHSV, BTV and EEV
NS3 were equivalently cytotoxic to Sf9 insect cells.
3.3.2. Expression of BTV, AHSV and EEV NS3 in E. coli cells
The effect of AHSV, BTV and EEV NS3 on bacterial cell viability and membrane permeability was
subsequently investigated by means of an inducible pET prokaryotic expression system (Studier
& Moffat, 1986). This system has been shown to be suitable for the identification of a number of
virally encoded membrane-active proteins (Guinea & Carrasco, 1994; Aldabe et al., 1996;
Gonzalez & Carrasco, 2003). The membrane destabilising activity of proteins encoded by other
members of the family Reoviridae including rotavirus NSP4 (Browne et al., 2000) and avian
reovirus p10 (Bodelón et al., 2002) have also been studied using this system.
In the pET expression system target genes are placed under the control of a tightly regulated
bacteriophage T7 promoter in the pET vector. Expression is initiated by providing a source of T7
RNA polymerase in the host cell. Target genes are initially cloned using bacterial hosts that do
not express T7 RNA polymerase. Genes under the control of this promoter are therefore
transcriptionally inactive in these host strains. This allows for the establishment of high plasmid
copy numbers and possibly eliminates plasmid instability due to the production of potentially toxic
proteins. Target gene expression is then initiated by transferring the plasmid into an expression
host containing a chromosomal copy of the T7 RNA polymerase gene. Expression hosts are
lysogens of the bacteriophage DE3, a lambda derivative that includes a DNA fragment with the
lacI gene, the lacUV5 promoter, and the gene for T7 RNA polymerase. When IPTG is added to
expression hosts the lacUV5 promoter is induced and in turn initiates the transcription of T7 RNA
62
polymerase. The T7 RNA polymerase then transcribes the target gene in the pET plasmid
(Studier, 1991). T7 RNA polymerase is highly selective and when fully induced, the majority of
the host cell’s resources are directed towards target gene expression.
For expression of the orbiviral NS3 proteins in the pET system the pET-41a-c expression vector
series was chosen. This vector was chosen for several reasons. This tightly regulated inducible
system is ideal for the expression of potentially cytotoxic proteins, as described above. In this
vector target genes inserted into the MCS are expressed fused to a 220 amino acid GST-Tag
proteins, that may increase the solubility of fused peptides and facilitates affinity purification. The
cloning of the orbiviral S10 genes into this vector is described in the following section.
3.3.2.1. Cloning AHSV and BTV S10 genes into pET-41c
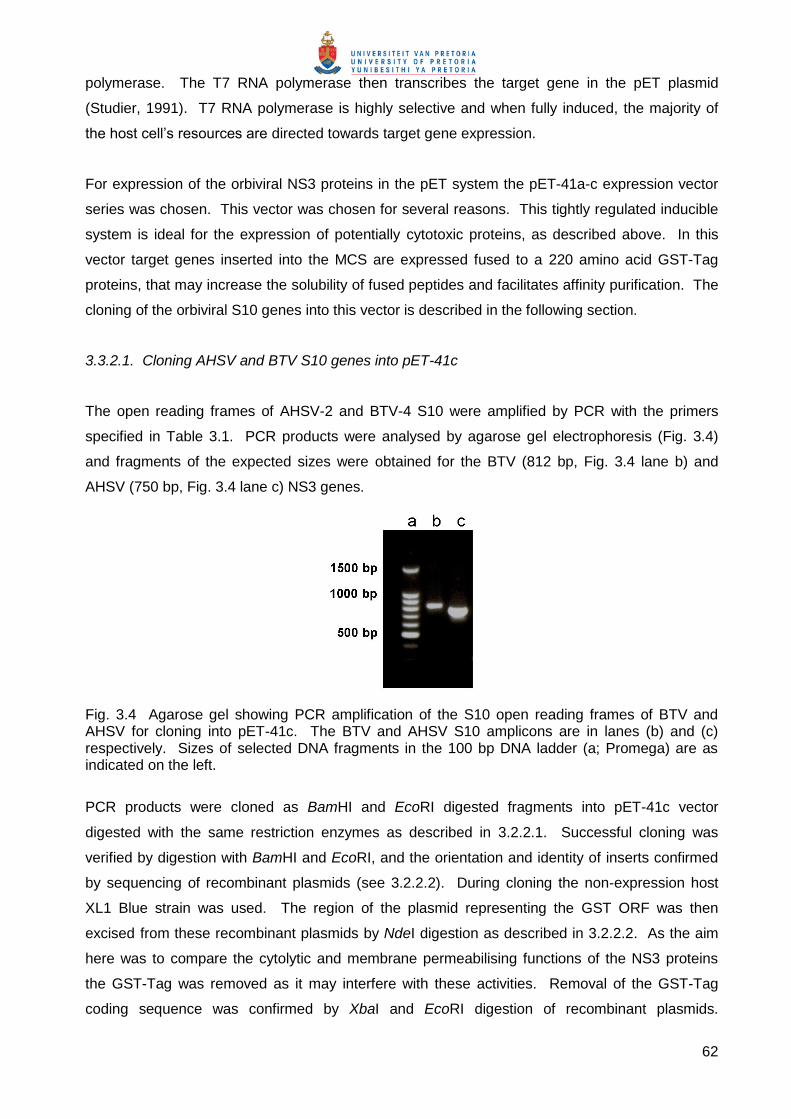
The open reading frames of AHSV-2 and BTV-4 S10 were amplified by PCR with the primers
specified in Table 3.1. PCR products were analysed by agarose gel electrophoresis (Fig. 3.4)
and fragments of the expected sizes were obtained for the BTV (812 bp, Fig. 3.4 lane b) and
AHSV (750 bp, Fig. 3.4 lane c) NS3 genes.
Fig. 3.4 Agarose gel showing PCR amplification of the S10 open reading frames of BTV and AHSV for cloning into pET-41c. The BTV and AHSV S10 amplicons are in lanes (b) and (c) respectively. Sizes of selected DNA fragments in the 100 bp DNA ladder (a; Promega) are as indicated on the left.
PCR products were cloned as BamHI and EcoRI digested fragments into pET-41c vector
digested with the same restriction enzymes as described in 3.2.2.1. Successful cloning was
verified by digestion with BamHI and EcoRI, and the orientation and identity of inserts confirmed
by sequencing of recombinant plasmids (see 3.2.2.2). During cloning the non-expression host
XL1 Blue strain was used. The region of the plasmid representing the GST ORF was then
excised from these recombinant plasmids by NdeI digestion as described in 3.2.2.2. As the aim
here was to compare the cytolytic and membrane permeabilising functions of the NS3 proteins
the GST-Tag was removed as it may interfere with these activities. Removal of the GST-Tag
coding sequence was confirmed by XbaI and EcoRI digestion of recombinant plasmids.
63
Recombinant pET-41 plasmids containing the orbiviral NS3 genes without the GST-Tag
sequences were named pET-AHSV-2 NS3 and pET-BTV-4 NS3.
The EEV S10 ORF had previously been cloned in pET-41a and the GST coding sequence
removed (Teixeira, 2005). The pET-AHSV-2 NS3, pET-BTV-4 NS3 and pET-EEV NS3 plasmids
were transformed into the expression host BL21(DE3)pLysS as described in 3.2.2.3.
3.3.2.2. Analysis of expression of AHSV, BTV and EEV NS3 in E. coli
To analyse the expression of the orbiviral NS3 proteins, transformed E. coli BL21(DE3)pLysS
cells were grown and induced (see 3.2.2.4). Expression of the NS3 proteins in BL21(DE3)pLysS
cells was monitored at 15, 30 and 60 minutes (min) post induction by metabolic labelling at these
times in the presence and absence of rifampicin. Rifampicin is an E. coli polymerase inhibitor. In
the presence of this antibiotic E. coli protein synthesis is therefore inhibited, and the target gene
product expressed from the T7 polymerase promoter in the pET vector is the major protein
synthesised. Proteins in cell extracts were separated by SDS-PAGE and visualised by
phosphorimaging (Fig. 3.5). Cells transformed with the parent pET-41c vector were included as a
control and expressed the GST-Tag protein (35.6 kDa) to high levels (Fig. 3.1D). In the presence
of rifampicin this was the major protein synthesised as expected (Fig. 3.1D, last three lanes). A
novel protein was synthesized from the T7 promoter in cells transformed with pET-AHSV-2 NS3
(Fig. 3.5A), pET-BTV-4 NS3 (Fig. 3.5B) and pET-EEV-NS3 (Fig. 3.5C). In the presence of
rifampicin these were the major proteins synthesised, although expression levels were
significantly lower than that of the GST-Tag protein. The BTV NS3 protein (Fig. 3.5B, last three
lanes) appeared to be expressed to slightly higher levels than the AHSV and EEV NS3 proteins
(Fig. 3.5A and B, last three lanes, respectively).
To compare the relative sizes of the recombinant proteins, proteins from induced cultures were
metabolically labelled in the presence and absence of rifampicin, separated on a 15% SDS-PAGE
gel and visualised by autoradiography (Fig. 3.6). For each recombinant a novel band of the
expected sizes of 23.5 kDa for AHSV NS3, 25 kDa for BTV NS3, 27.2 kDa for EEV NS3 and 35.6
kDa for the GST-Tag protein (indicated by the arrows in Fig. 3.6) was observed. As equivalent
amounts of cell extracts were not loaded on the gel in Fig. 3.6 comparisons of the relative
expression levels of the proteins cannot be made here. The identity of the AHSV and EEV NS3
proteins was furthermore confirmed by immunoblot with monospecific polyclonal antibodies
(results not shown).
64
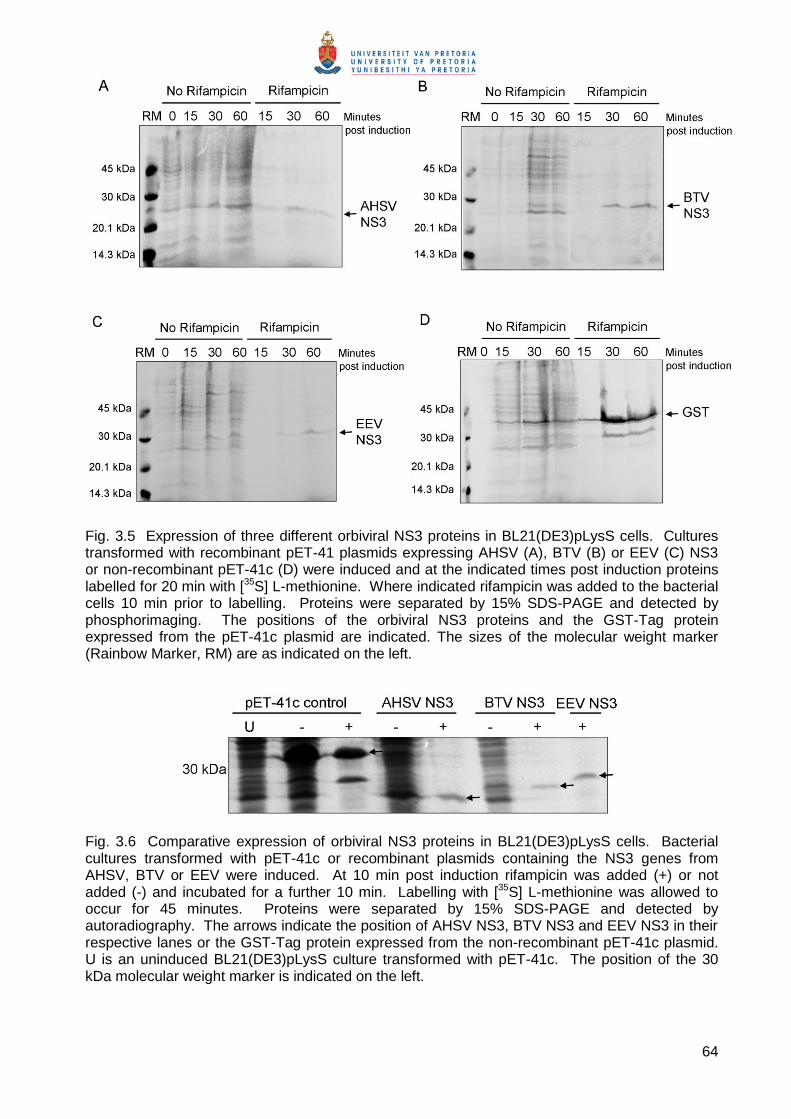
Fig. 3.5 Expression of three different orbiviral NS3 proteins in BL21(DE3)pLysS cells. Cultures transformed with recombinant pET-41 plasmids expressing AHSV (A), BTV (B) or EEV (C) NS3 or non-recombinant pET-41c (D) were induced and at the indicated times post induction proteins labelled for 20 min with [35S] L-methionine. Where indicated rifampicin was added to the bacterial cells 10 min prior to labelling. Proteins were separated by 15% SDS-PAGE and detected by phosphorimaging. The positions of the orbiviral NS3 proteins and the GST-Tag protein expressed from the pET-41c plasmid are indicated. The sizes of the molecular weight marker (Rainbow Marker, RM) are as indicated on the left.
Fig. 3.6 Comparative expression of orbiviral NS3 proteins in BL21(DE3)pLysS cells. Bacterial cultures transformed with pET-41c or recombinant plasmids containing the NS3 genes from AHSV, BTV or EEV were induced. At 10 min post induction rifampicin was added (+) or not added (-) and incubated for a further 10 min. Labelling with [35S] L-methionine was allowed to occur for 45 minutes. Proteins were separated by 15% SDS-PAGE and detected by autoradiography. The arrows indicate the position of AHSV NS3, BTV NS3 and EEV NS3 in their respective lanes or the GST-Tag protein expressed from the non-recombinant pET-41c plasmid. U is an uninduced BL21(DE3)pLysS culture transformed with pET-41c. The position of the 30 kDa molecular weight marker is indicated on the left.
65
3.3.2.3. Viability of E. coli expressing AHSV, BTV and EEV NS3
To compare the effect of the orbiviral NS3 proteins on E. coli cell growth and viability, growth
rates of BL21(DE3)pLysS cells expressing these proteins were monitored. Following induction of
recombinant protein expression in transformed cells, cell density was monitored every hour for
four hours by measurement of the OD600 of cultures. The OD600 values at each time point were
then expressed as a percentage of the OD600 value for that culture at induction. The results are
shown in Fig. 3.7 and represent the mean and standard deviation of at least four independent
measurements. Bacteria transformed with pET-41c, expressing the non-cytotoxic GST-Tag, were
used as a control and grew exponentially over the 240 min period following induction. The
expression of BTV NS3 had little effect on the growth rates of BL21(DE3)pLysS cells as cultures
grew to almost the same levels as the control cells. Cells expressing AHSV and EEV NS3,
however, showed a decrease in cell growth relative to the control. As a measure of these
differences in cell growth the values at 4 hours post induction were calculated as a percentage of
the control cell growth (100%) at this time. Percentage growth inhibition relative to the control
was then calculated by subtracting these values from 100%. Bacteria expressing BTV NS3
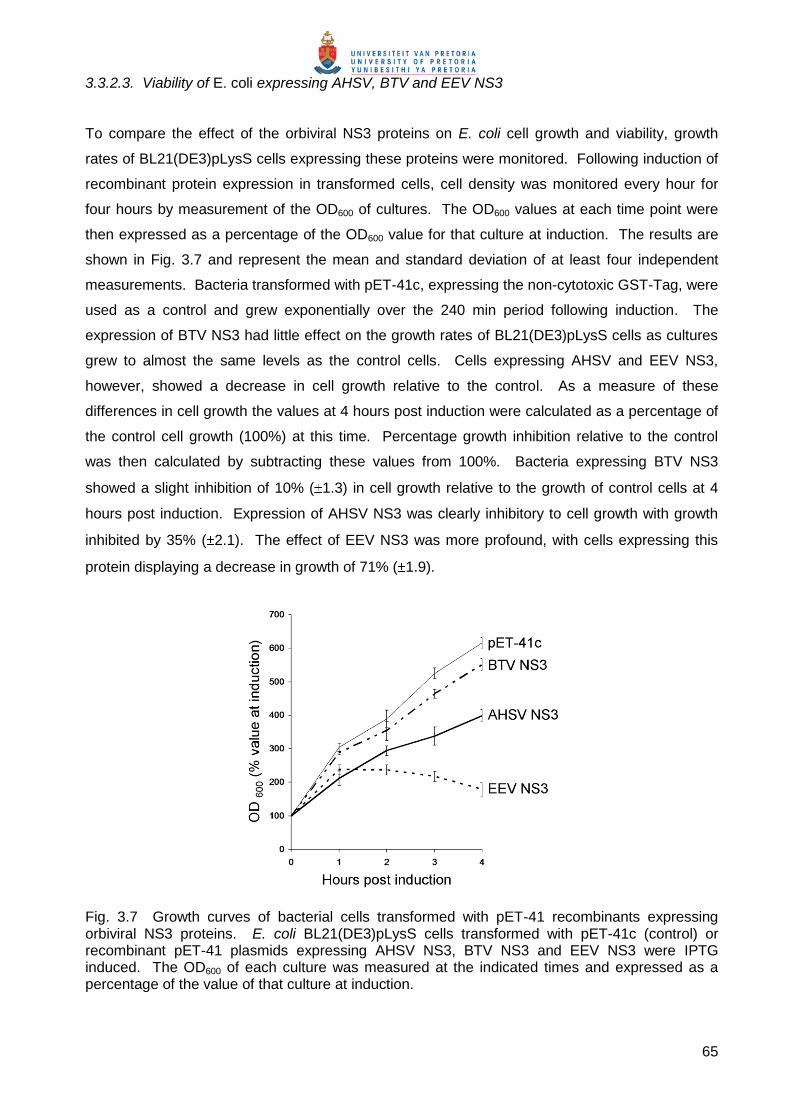
showed a slight inhibition of 10% ( 1.3) in cell growth relative to the growth of control cells at 4
hours post induction. Expression of AHSV NS3 was clearly inhibitory to cell growth with growth
inhibited by 35% ( 2.1). The effect of EEV NS3 was more profound, with cells expressing this
protein displaying a decrease in growth of 71% ( 1.9).
Fig. 3.7 Growth curves of bacterial cells transformed with pET-41 recombinants expressing orbiviral NS3 proteins. E. coli BL21(DE3)pLysS cells transformed with pET-41c (control) or recombinant pET-41 plasmids expressing AHSV NS3, BTV NS3 and EEV NS3 were IPTG induced. The OD600 of each culture was measured at the indicated times and expressed as a percentage of the value of that culture at induction.
66
In the BL21(DE3)pLysS strain disruption of the bacterial inner cell membrane results in release of
T7 lysozyme by the cell and subsequent cell lysis. These cells contain an IPTG-inducible T7
RNA polymerase gene as well as the pLysS plasmid that constitutively expresses T7 phage
lysozyme (Studier & Moffat, 1986; Studier, 1991). This intracellular lysozyme cannot degrade the
cell wall peptidoglycan, as the bacterial membrane forms an impermeable barrier. If however the
membrane is destabilised by recombinant proteins expressed in the cell, the lysozyme can pass
into the periplasmic space and exert its lytic activity on the bacterial cell wall. It was therefore
postulated that the expression of AHSV and EEV NS3 had a membrane destabilising effect on
the E. coli cells, leading to cell lysis that was observed as decreased optical density of cultures.
3.3.2.4. Membrane permeability of E. coli expressing AHSV, BTV and EEV NS3
To determine if the observed cell growth arrest was actually the result of an increase in
permeability of the bacterial inner membrane, a Hyg B membrane permeability assay was
performed. Here protein translation in induced cultures is monitored by metabolic labelling in the
presence and absence of Hyg B, a membrane impermeable translation inhibitor.
BL21(DE3)pLysS cells transformed with recombinant pET-41 plasmids were therefore grown and
induced for 30 min (see 3.2.2.6) then incubated in the presence or absence of Hyg B for a further
20 min and proteins synthesis in these cells monitored by metabolic labelling with [35S] L-
methionine for 45 min. Labelled proteins were then analysed by SDS-PAGE and
phosphorimaging (Fig. 3.8). The amount of protein in each lane was estimated using Quantity
One (BioRad) and the percentage permeabilised cells calculated as the protein expression levels
in the presence of Hyg B over protein expression levels in absence of Hyg B x 100.
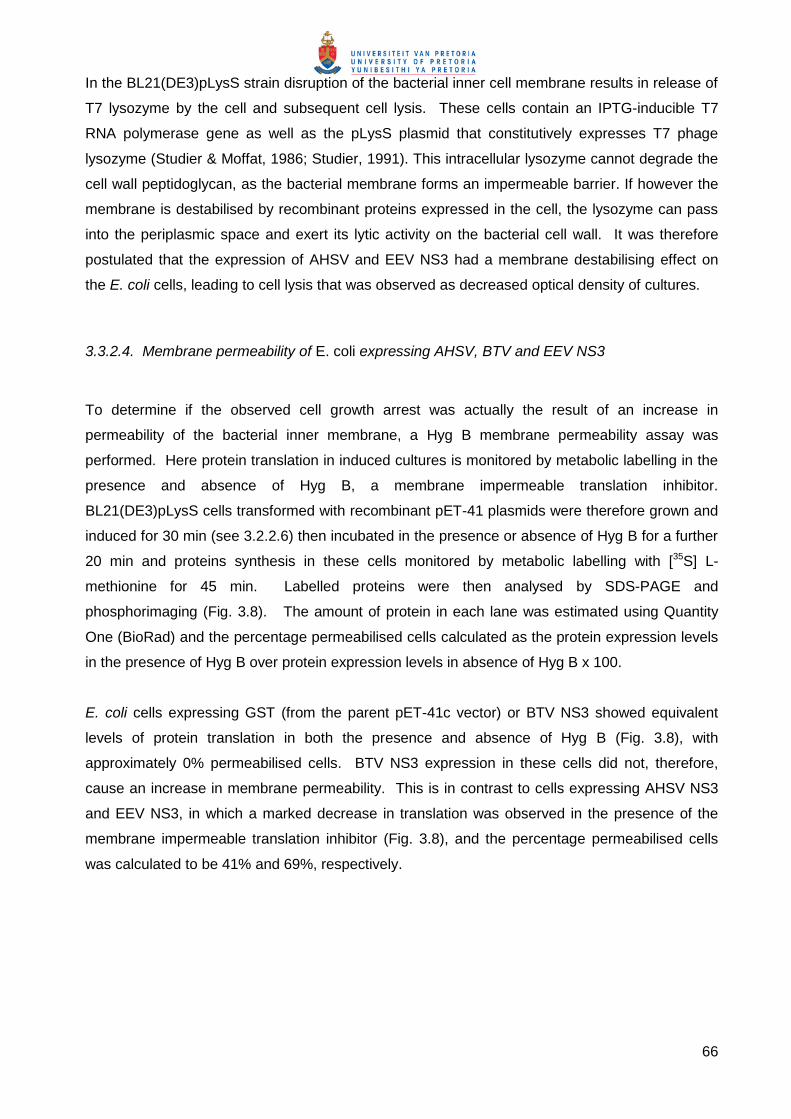
E. coli cells expressing GST (from the parent pET-41c vector) or BTV NS3 showed equivalent
levels of protein translation in both the presence and absence of Hyg B (Fig. 3.8), with
approximately 0% permeabilised cells. BTV NS3 expression in these cells did not, therefore,
cause an increase in membrane permeability. This is in contrast to cells expressing AHSV NS3
and EEV NS3, in which a marked decrease in translation was observed in the presence of the
membrane impermeable translation inhibitor (Fig. 3.8), and the percentage permeabilised cells
was calculated to be 41% and 69%, respectively.
67
Fig. 3.8 Effects of orbiviral NS3 proteins on bacterial cell membrane permeability. E. coli BL21(DE3)pLysS cells transformed with pET-41c (control) or recombinant pET-41 plasmids expressing AHSV NS3, BTV NS3 and EEV NS3 were induced with IPTG. Cultures were then incubated in the presence (+) or absence (-) of Hyg B and proteins radiolabelled. Proteins were resolved by 12% SDS-PAGE and visualised by phosphorimaging.
The cytolytic effect of the AHSV and EEV NS3 proteins appeared therefore to be a consequence
of increased membrane permeability. As the pET expression system proved to be a simple and
rapid means of assessing the cytolytic and membrane permeabilising properties of proteins, we
then used this system to clone and express a variety of truncated forms of AHSV NS3 to
determine which domains within this protein are involved in these activities.
3.3.2. Expression of AHSV NS3 truncated mutants in E. coli cells
Previous studies of membrane permeabilising proteins have implicated a variety of domains
within these proteins as being involved in this activity, directly or indirectly. Of particular
importance are hydrophobic stretches within proteins that may form membrane-spanning
domains that destabilise the membrane. In proteins with more than one hydrophobic domain, one
or more of these regions may be critical for membrane permeabilisation. Other hydrophobic
domains may not be directly involved in membrane destabilisation but necessary for membrane
targeting of the protein. Amino acids adjacent to or outside of these regions may also be
involved, and regions involved in oligomerisation, such as coiled-coil domains, may enhance
permeabilisation activity (Arroyo et al., 1995; Browne et al., 2000; Ciccaglione et al., 2001;
Gonzalez & Carrasco, 2003). In this study a series of truncated versions of AHSV NS3 were
therefore designed to target conserved regions within the protein that may have structural or
functional importance (Fig. 3.9). Several conserved regions have been identified within AHSV
NS3. These are illustrated, and their respective positions in the amino acid sequence indicated,
in the schematic representation of AHSV NS3 in Fig. 3.9. The conserved regions include (i) an
initiation codon (AUG) for NS3A, (ii) a proline-rich region (PRR), (iii) a highly conserved region
(CR) that shows little sequence diversity across all serotypes of AHSV, and (iv) two hydrophobic
domains HDI and HDII (Van Staden et al., 1995; Van Niekerk et al., 2001b; Quan et al., 2008). A
68
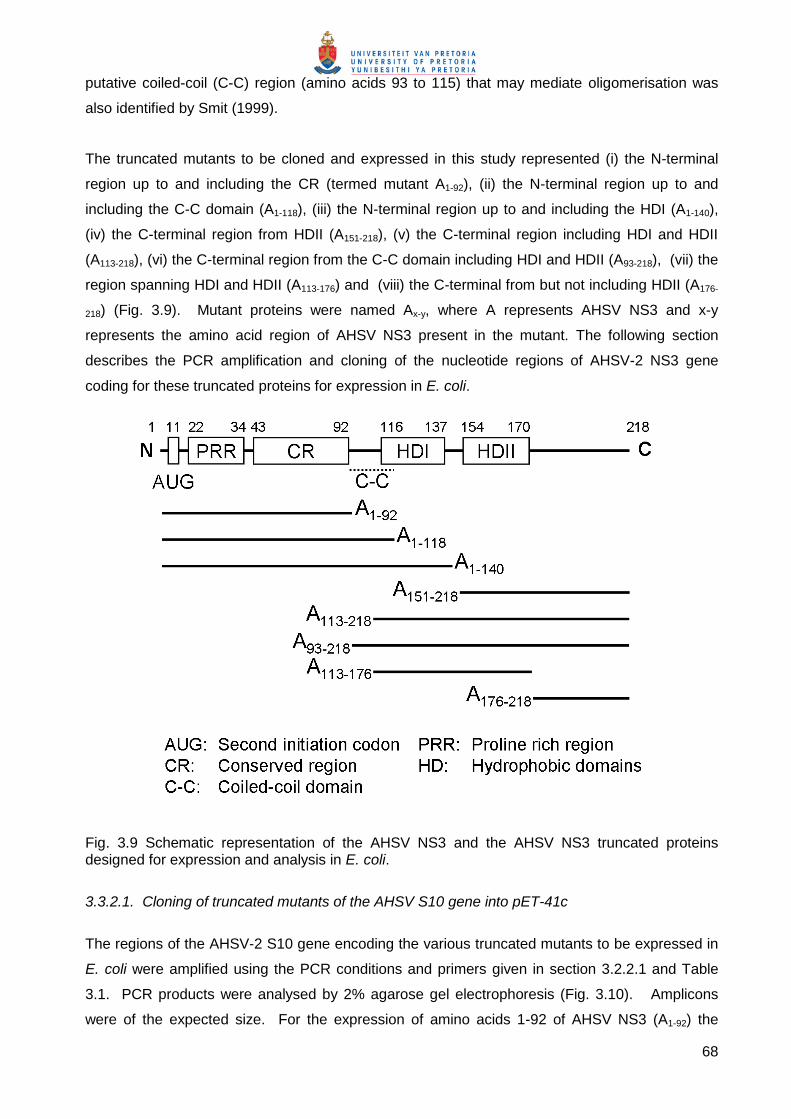
putative coiled-coil (C-C) region (amino acids 93 to 115) that may mediate oligomerisation was
also identified by Smit (1999).
The truncated mutants to be cloned and expressed in this study represented (i) the N-terminal
region up to and including the CR (termed mutant A1-92), (ii) the N-terminal region up to and
including the C-C domain (A1-118), (iii) the N-terminal region up to and including the HDI (A1-140),
(iv) the C-terminal region from HDII (A151-218), (v) the C-terminal region including HDI and HDII
(A113-218), (vi) the C-terminal region from the C-C domain including HDI and HDII (A93-218), (vii) the
region spanning HDI and HDII (A113-176) and (viii) the C-terminal from but not including HDII (A176-
218) (Fig. 3.9). Mutant proteins were named Ax-y, where A represents AHSV NS3 and x-y
represents the amino acid region of AHSV NS3 present in the mutant. The following section
describes the PCR amplification and cloning of the nucleotide regions of AHSV-2 NS3 gene
coding for these truncated proteins for expression in E. coli.
Fig. 3.9 Schematic representation of the AHSV NS3 and the AHSV NS3 truncated proteins designed for expression and analysis in E. coli.
3.3.2.1. Cloning of truncated mutants of the AHSV S10 gene into pET-41c
The regions of the AHSV-2 S10 gene encoding the various truncated mutants to be expressed in
E. coli were amplified using the PCR conditions and primers given in section 3.2.2.1 and Table
3.1. PCR products were analysed by 2% agarose gel electrophoresis (Fig. 3.10). Amplicons
were of the expected size. For the expression of amino acids 1-92 of AHSV NS3 (A1-92) the
69
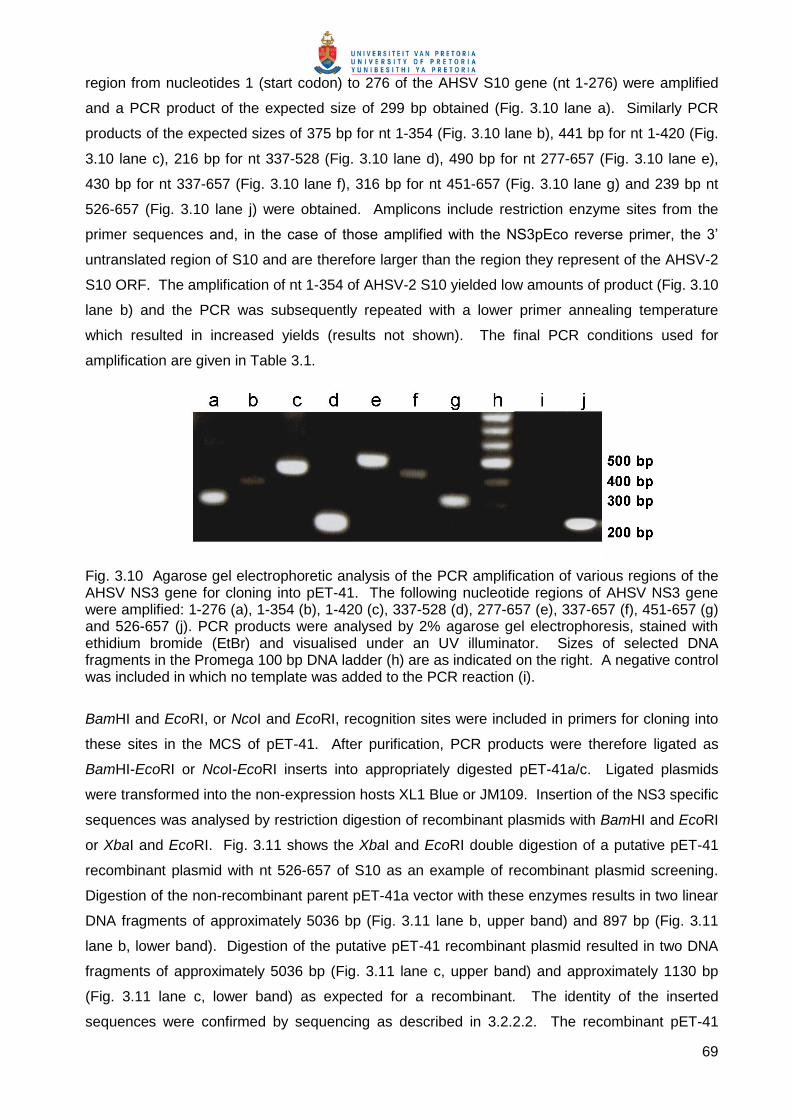
region from nucleotides 1 (start codon) to 276 of the AHSV S10 gene (nt 1-276) were amplified
and a PCR product of the expected size of 299 bp obtained (Fig. 3.10 lane a). Similarly PCR
products of the expected sizes of 375 bp for nt 1-354 (Fig. 3.10 lane b), 441 bp for nt 1-420 (Fig.
3.10 lane c), 216 bp for nt 337-528 (Fig. 3.10 lane d), 490 bp for nt 277-657 (Fig. 3.10 lane e),
430 bp for nt 337-657 (Fig. 3.10 lane f), 316 bp for nt 451-657 (Fig. 3.10 lane g) and 239 bp nt
526-657 (Fig. 3.10 lane j) were obtained. Amplicons include restriction enzyme sites from the
primer sequences and, in the case of those amplified with the NS3pEco reverse primer, the 3’
untranslated region of S10 and are therefore larger than the region they represent of the AHSV-2
S10 ORF. The amplification of nt 1-354 of AHSV-2 S10 yielded low amounts of product (Fig. 3.10
lane b) and the PCR was subsequently repeated with a lower primer annealing temperature
which resulted in increased yields (results not shown). The final PCR conditions used for
amplification are given in Table 3.1.
Fig. 3.10 Agarose gel electrophoretic analysis of the PCR amplification of various regions of the AHSV NS3 gene for cloning into pET-41. The following nucleotide regions of AHSV NS3 gene were amplified: 1-276 (a), 1-354 (b), 1-420 (c), 337-528 (d), 277-657 (e), 337-657 (f), 451-657 (g) and 526-657 (j). PCR products were analysed by 2% agarose gel electrophoresis, stained with ethidium bromide (EtBr) and visualised under an UV illuminator. Sizes of selected DNA fragments in the Promega 100 bp DNA ladder (h) are as indicated on the right. A negative control was included in which no template was added to the PCR reaction (i).
BamHI and EcoRI, or NcoI and EcoRI, recognition sites were included in primers for cloning into
these sites in the MCS of pET-41. After purification, PCR products were therefore ligated as
BamHI-EcoRI or NcoI-EcoRI inserts into appropriately digested pET-41a/c. Ligated plasmids
were transformed into the non-expression hosts XL1 Blue or JM109. Insertion of the NS3 specific
sequences was analysed by restriction digestion of recombinant plasmids with BamHI and EcoRI
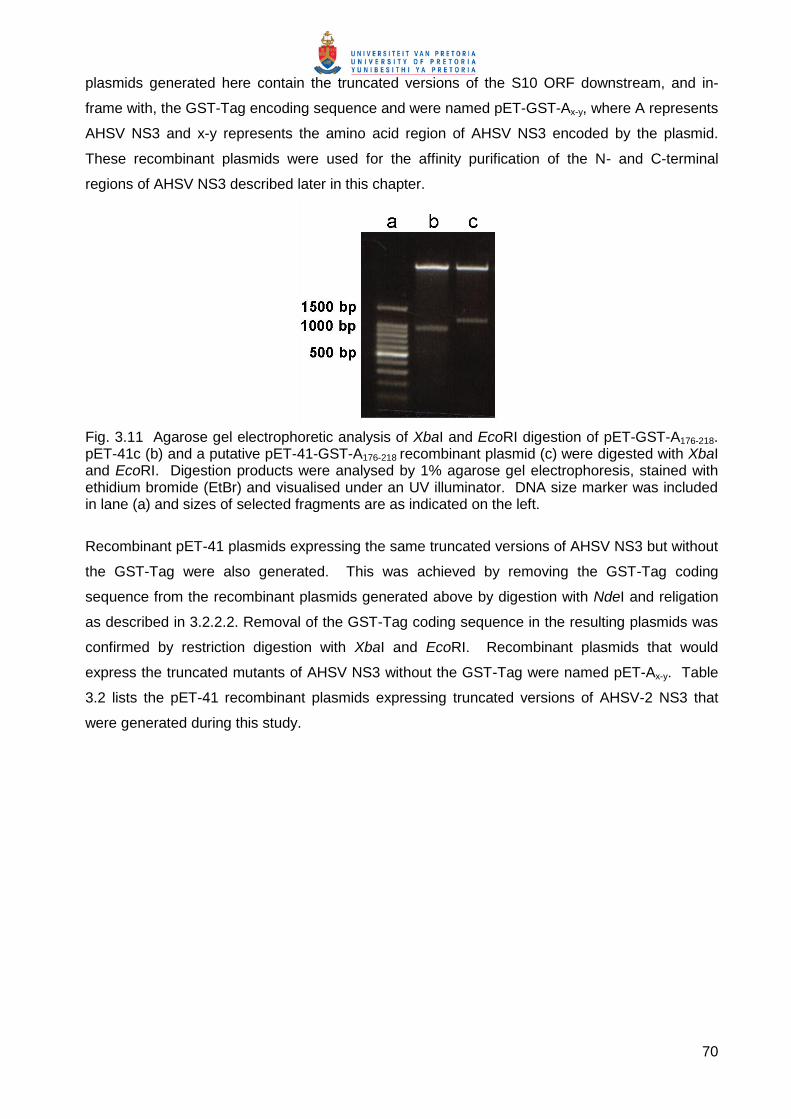
or XbaI and EcoRI. Fig. 3.11 shows the XbaI and EcoRI double digestion of a putative pET-41
recombinant plasmid with nt 526-657 of S10 as an example of recombinant plasmid screening.
Digestion of the non-recombinant parent pET-41a vector with these enzymes results in two linear
DNA fragments of approximately 5036 bp (Fig. 3.11 lane b, upper band) and 897 bp (Fig. 3.11
lane b, lower band). Digestion of the putative pET-41 recombinant plasmid resulted in two DNA
fragments of approximately 5036 bp (Fig. 3.11 lane c, upper band) and approximately 1130 bp
(Fig. 3.11 lane c, lower band) as expected for a recombinant. The identity of the inserted
sequences were confirmed by sequencing as described in 3.2.2.2. The recombinant pET-41
70
plasmids generated here contain the truncated versions of the S10 ORF downstream, and in-
frame with, the GST-Tag encoding sequence and were named pET-GST-Ax-y, where A represents
AHSV NS3 and x-y represents the amino acid region of AHSV NS3 encoded by the plasmid.
These recombinant plasmids were used for the affinity purification of the N- and C-terminal
regions of AHSV NS3 described later in this chapter.
Fig. 3.11 Agarose gel electrophoretic analysis of XbaI and EcoRI digestion of pET-GST-A176-218. pET-41c (b) and a putative pET-41-GST-A176-218 recombinant plasmid (c) were digested with XbaI and EcoRI. Digestion products were analysed by 1% agarose gel electrophoresis, stained with ethidium bromide (EtBr) and visualised under an UV illuminator. DNA size marker was included in lane (a) and sizes of selected fragments are as indicated on the left.
Recombinant pET-41 plasmids expressing the same truncated versions of AHSV NS3 but without
the GST-Tag were also generated. This was achieved by removing the GST-Tag coding
sequence from the recombinant plasmids generated above by digestion with NdeI and religation
as described in 3.2.2.2. Removal of the GST-Tag coding sequence in the resulting plasmids was
confirmed by restriction digestion with XbaI and EcoRI. Recombinant plasmids that would
express the truncated mutants of AHSV NS3 without the GST-Tag were named pET-Ax-y. Table
3.2 lists the pET-41 recombinant plasmids expressing truncated versions of AHSV-2 NS3 that
were generated during this study.
71
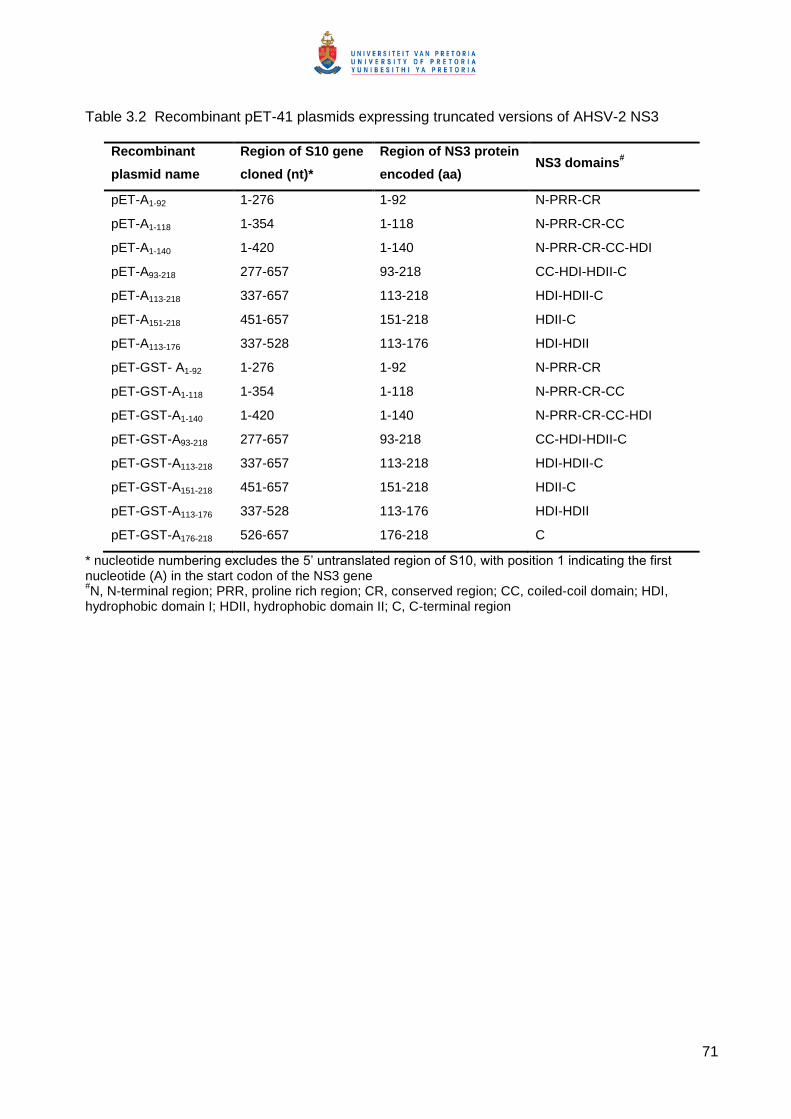
Table 3.2 Recombinant pET-41 plasmids expressing truncated versions of AHSV-2 NS3
Recombinant
plasmid name
Region of S10 gene
cloned (nt)*
Region of NS3 protein
encoded (aa) NS3 domains
#
pET-A1-92 1-276 1-92 N-PRR-CR
pET-A1-118 1-354 1-118 N-PRR-CR-CC
pET-A1-140 1-420 1-140 N-PRR-CR-CC-HDI
pET-A93-218 277-657 93-218 CC-HDI-HDII-C
pET-A113-218 337-657 113-218 HDI-HDII-C
pET-A151-218 451-657 151-218 HDII-C
pET-A113-176 337-528 113-176 HDI-HDII
pET-GST- A1-92 1-276 1-92 N-PRR-CR
pET-GST-A1-118 1-354 1-118 N-PRR-CR-CC
pET-GST-A1-140 1-420 1-140 N-PRR-CR-CC-HDI
pET-GST-A93-218 277-657 93-218 CC-HDI-HDII-C
pET-GST-A113-218 337-657 113-218 HDI-HDII-C
pET-GST-A151-218 451-657 151-218 HDII-C
pET-GST-A113-176 337-528 113-176 HDI-HDII
pET-GST-A176-218 526-657 176-218 C
* nucleotide numbering excludes the 5’ untranslated region of S10, with position 1 indicating the first nucleotide (A) in the start codon of the NS3 gene #N, N-terminal region; PRR, proline rich region; CR, conserved region; CC, coiled-coil domain; HDI,
hydrophobic domain I; HDII, hydrophobic domain II; C, C-terminal region
72
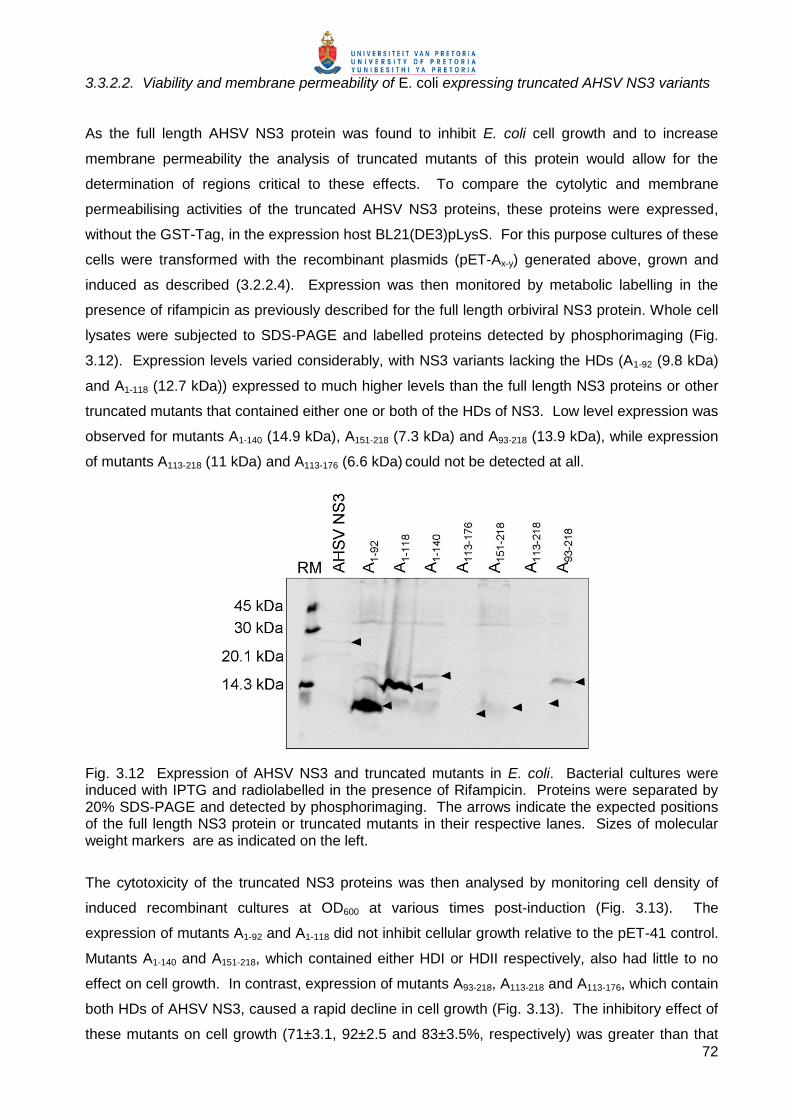
3.3.2.2. Viability and membrane permeability of E. coli expressing truncated AHSV NS3 variants
As the full length AHSV NS3 protein was found to inhibit E. coli cell growth and to increase
membrane permeability the analysis of truncated mutants of this protein would allow for the
determination of regions critical to these effects. To compare the cytolytic and membrane
permeabilising activities of the truncated AHSV NS3 proteins, these proteins were expressed,
without the GST-Tag, in the expression host BL21(DE3)pLysS. For this purpose cultures of these
cells were transformed with the recombinant plasmids (pET-Ax-y) generated above, grown and
induced as described (3.2.2.4). Expression was then monitored by metabolic labelling in the
presence of rifampicin as previously described for the full length orbiviral NS3 protein. Whole cell
lysates were subjected to SDS-PAGE and labelled proteins detected by phosphorimaging (Fig.
3.12). Expression levels varied considerably, with NS3 variants lacking the HDs (A1-92 (9.8 kDa)
and A1-118 (12.7 kDa)) expressed to much higher levels than the full length NS3 proteins or other
truncated mutants that contained either one or both of the HDs of NS3. Low level expression was
observed for mutants A1-140 (14.9 kDa), A151-218 (7.3 kDa) and A93-218 (13.9 kDa), while expression
of mutants A113-218 (11 kDa) and A113-176 (6.6 kDa) could not be detected at all.
Fig. 3.12 Expression of AHSV NS3 and truncated mutants in E. coli. Bacterial cultures were induced with IPTG and radiolabelled in the presence of Rifampicin. Proteins were separated by 20% SDS-PAGE and detected by phosphorimaging. The arrows indicate the expected positions of the full length NS3 protein or truncated mutants in their respective lanes. Sizes of molecular weight markers are as indicated on the left.
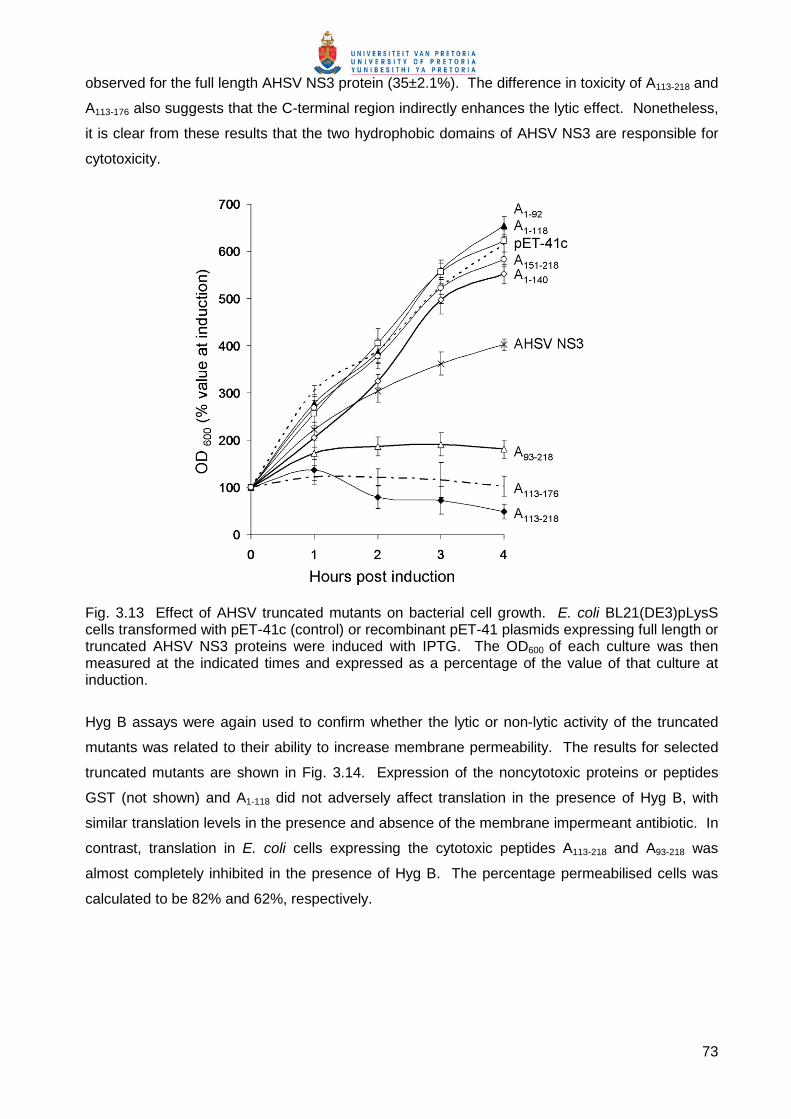
The cytotoxicity of the truncated NS3 proteins was then analysed by monitoring cell density of
induced recombinant cultures at OD600 at various times post-induction (Fig. 3.13). The
expression of mutants A1-92 and A1-118 did not inhibit cellular growth relative to the pET-41 control.
Mutants A1-140 and A151-218, which contained either HDI or HDII respectively, also had little to no
effect on cell growth. In contrast, expression of mutants A93-218, A113-218 and A113-176, which contain
both HDs of AHSV NS3, caused a rapid decline in cell growth (Fig. 3.13). The inhibitory effect of
these mutants on cell growth (71±3.1, 92±2.5 and 83±3.5%, respectively) was greater than that
73
observed for the full length AHSV NS3 protein (35±2.1%). The difference in toxicity of A113-218 and
A113-176 also suggests that the C-terminal region indirectly enhances the lytic effect. Nonetheless,
it is clear from these results that the two hydrophobic domains of AHSV NS3 are responsible for
cytotoxicity.
Fig. 3.13 Effect of AHSV truncated mutants on bacterial cell growth. E. coli BL21(DE3)pLysS cells transformed with pET-41c (control) or recombinant pET-41 plasmids expressing full length or truncated AHSV NS3 proteins were induced with IPTG. The OD600 of each culture was then measured at the indicated times and expressed as a percentage of the value of that culture at induction.
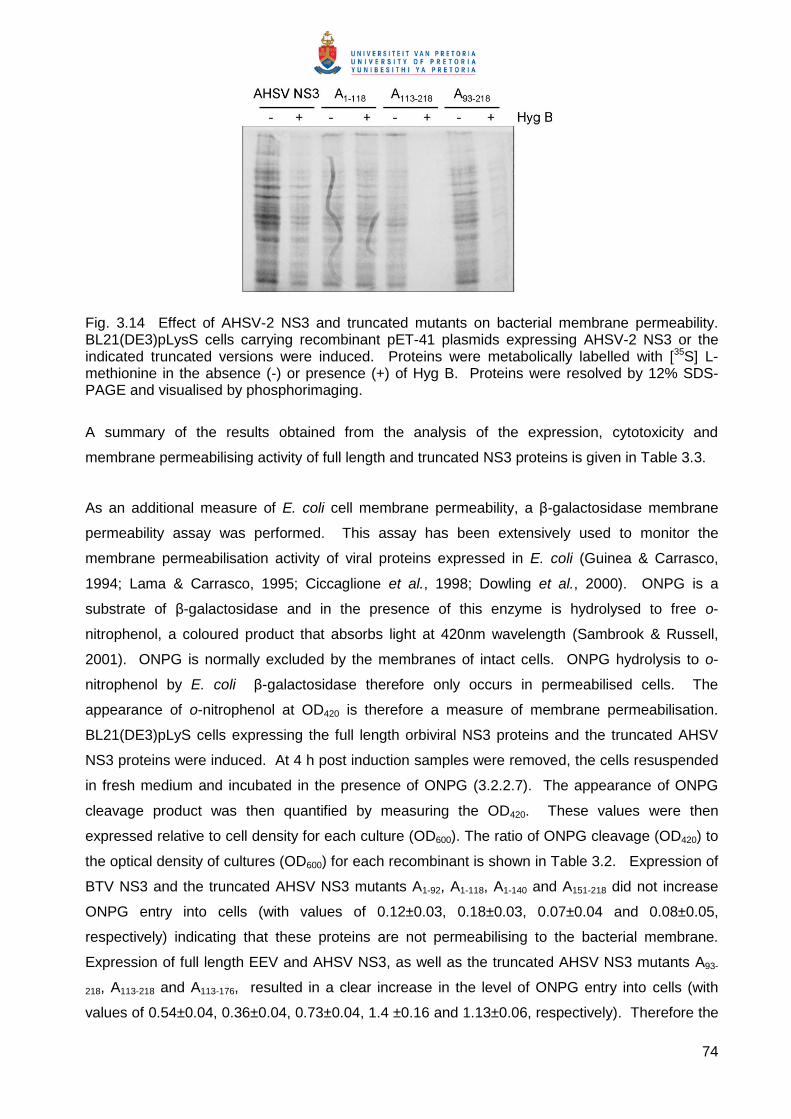
Hyg B assays were again used to confirm whether the lytic or non-lytic activity of the truncated
mutants was related to their ability to increase membrane permeability. The results for selected
truncated mutants are shown in Fig. 3.14. Expression of the noncytotoxic proteins or peptides
GST (not shown) and A1-118 did not adversely affect translation in the presence of Hyg B, with
similar translation levels in the presence and absence of the membrane impermeant antibiotic. In
contrast, translation in E. coli cells expressing the cytotoxic peptides A113-218 and A93-218 was
almost completely inhibited in the presence of Hyg B. The percentage permeabilised cells was
calculated to be 82% and 62%, respectively.
74
Fig. 3.14 Effect of AHSV-2 NS3 and truncated mutants on bacterial membrane permeability. BL21(DE3)pLysS cells carrying recombinant pET-41 plasmids expressing AHSV-2 NS3 or the indicated truncated versions were induced. Proteins were metabolically labelled with [35S] L-methionine in the absence (-) or presence (+) of Hyg B. Proteins were resolved by 12% SDS-PAGE and visualised by phosphorimaging.
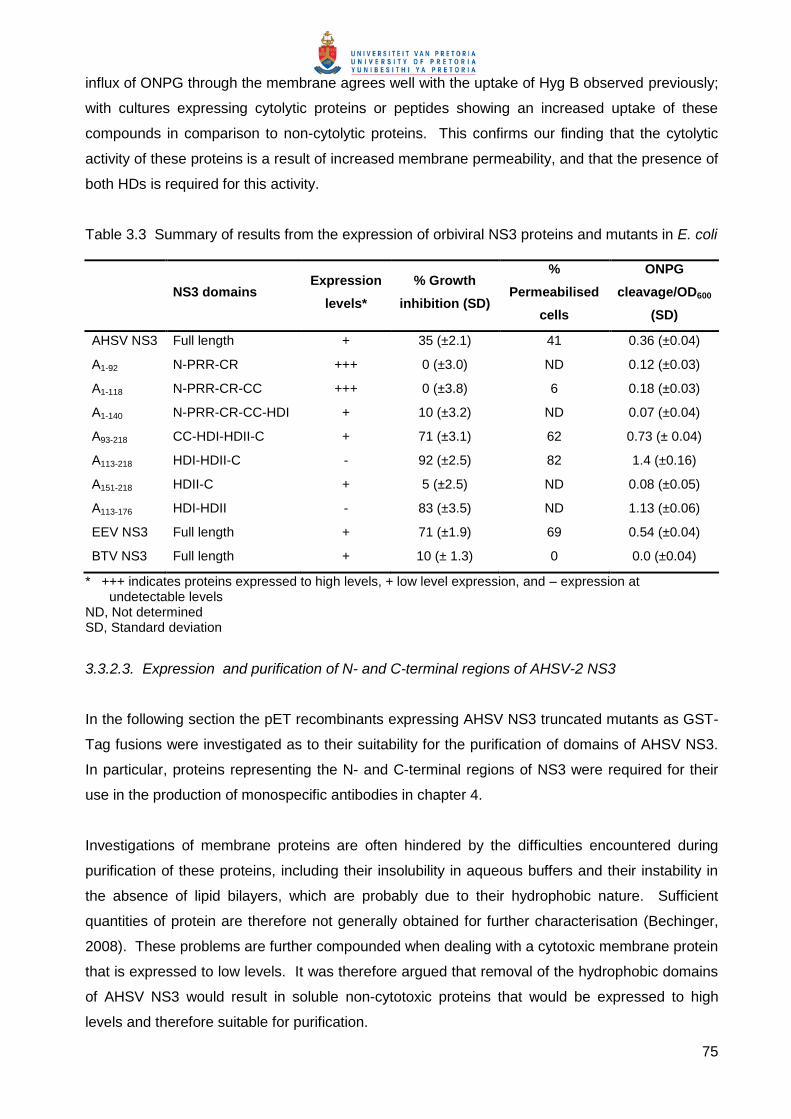
A summary of the results obtained from the analysis of the expression, cytotoxicity and
membrane permeabilising activity of full length and truncated NS3 proteins is given in Table 3.3.
As an additional measure of E. coli cell membrane permeability, a β-galactosidase membrane
permeability assay was performed. This assay has been extensively used to monitor the
membrane permeabilisation activity of viral proteins expressed in E. coli (Guinea & Carrasco,
1994; Lama & Carrasco, 1995; Ciccaglione et al., 1998; Dowling et al., 2000). ONPG is a
substrate of β-galactosidase and in the presence of this enzyme is hydrolysed to free o-
nitrophenol, a coloured product that absorbs light at 420nm wavelength (Sambrook & Russell,
2001). ONPG is normally excluded by the membranes of intact cells. ONPG hydrolysis to o-
nitrophenol by E. coli β-galactosidase therefore only occurs in permeabilised cells. The
appearance of o-nitrophenol at OD420 is therefore a measure of membrane permeabilisation.
BL21(DE3)pLyS cells expressing the full length orbiviral NS3 proteins and the truncated AHSV
NS3 proteins were induced. At 4 h post induction samples were removed, the cells resuspended
in fresh medium and incubated in the presence of ONPG (3.2.2.7). The appearance of ONPG
cleavage product was then quantified by measuring the OD420. These values were then
expressed relative to cell density for each culture (OD600). The ratio of ONPG cleavage (OD420) to
the optical density of cultures (OD600) for each recombinant is shown in Table 3.2. Expression of
BTV NS3 and the truncated AHSV NS3 mutants A1-92, A1-118, A1-140 and A151-218 did not increase
ONPG entry into cells (with values of 0.12±0.03, 0.18±0.03, 0.07±0.04 and 0.08±0.05,
respectively) indicating that these proteins are not permeabilising to the bacterial membrane.
Expression of full length EEV and AHSV NS3, as well as the truncated AHSV NS3 mutants A93-
218, A113-218 and A113-176, resulted in a clear increase in the level of ONPG entry into cells (with
values of 0.54±0.04, 0.36±0.04, 0.73±0.04, 1.4 ±0.16 and 1.13±0.06, respectively). Therefore the
75
influx of ONPG through the membrane agrees well with the uptake of Hyg B observed previously;
with cultures expressing cytolytic proteins or peptides showing an increased uptake of these
compounds in comparison to non-cytolytic proteins. This confirms our finding that the cytolytic
activity of these proteins is a result of increased membrane permeability, and that the presence of
both HDs is required for this activity.
Table 3.3 Summary of results from the expression of orbiviral NS3 proteins and mutants in E. coli
NS3 domains Expression
levels*
% Growth
inhibition (SD)
%
Permeabilised
cells
ONPG
cleavage/OD600
(SD)
AHSV NS3 Full length + 35 (±2.1) 41 0.36 (±0.04)
A1-92 N-PRR-CR +++ 0 (±3.0) ND 0.12 (±0.03)
A1-118 N-PRR-CR-CC +++ 0 (±3.8) 6 0.18 (±0.03)
A1-140 N-PRR-CR-CC-HDI + 10 (±3.2) ND 0.07 (±0.04)
A93-218 CC-HDI-HDII-C + 71 (±3.1) 62 0.73 (± 0.04)
A113-218 HDI-HDII-C - 92 (±2.5) 82 1.4 (±0.16)
A151-218 HDII-C + 5 (±2.5) ND 0.08 (±0.05)
A113-176 HDI-HDII - 83 (±3.5) ND 1.13 (±0.06)
EEV NS3 Full length + 71 (±1.9) 69 0.54 (±0.04)
BTV NS3 Full length + 10 (± 1.3) 0 0.0 (±0.04)
* +++ indicates proteins expressed to high levels, + low level expression, and – expression at undetectable levels
ND, Not determined SD, Standard deviation
3.3.2.3. Expression and purification of N- and C-terminal regions of AHSV-2 NS3
In the following section the pET recombinants expressing AHSV NS3 truncated mutants as GST-
Tag fusions were investigated as to their suitability for the purification of domains of AHSV NS3.
In particular, proteins representing the N- and C-terminal regions of NS3 were required for their
use in the production of monospecific antibodies in chapter 4.
Investigations of membrane proteins are often hindered by the difficulties encountered during
purification of these proteins, including their insolubility in aqueous buffers and their instability in
the absence of lipid bilayers, which are probably due to their hydrophobic nature. Sufficient
quantities of protein are therefore not generally obtained for further characterisation (Bechinger,
2008). These problems are further compounded when dealing with a cytotoxic membrane protein
that is expressed to low levels. It was therefore argued that removal of the hydrophobic domains
of AHSV NS3 would result in soluble non-cytotoxic proteins that would be expressed to high
levels and therefore suitable for purification.
76
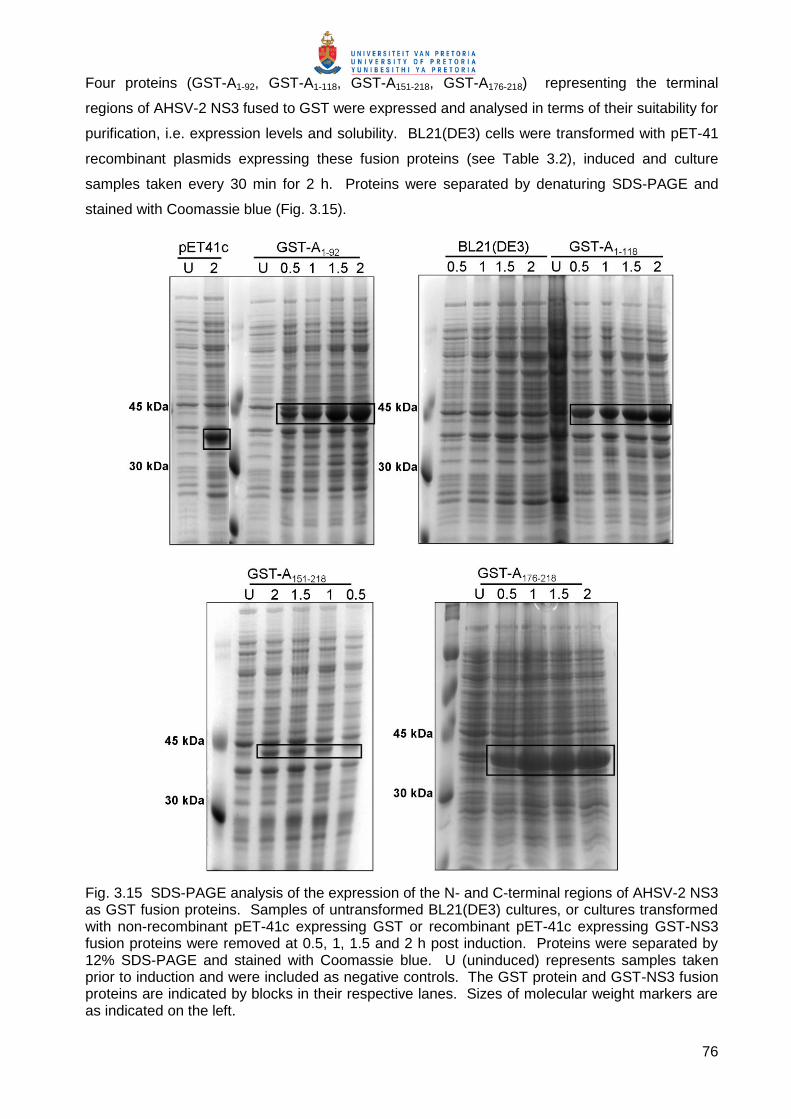
Four proteins (GST-A1-92, GST-A1-118, GST-A151-218, GST-A176-218) representing the terminal
regions of AHSV-2 NS3 fused to GST were expressed and analysed in terms of their suitability for
purification, i.e. expression levels and solubility. BL21(DE3) cells were transformed with pET-41
recombinant plasmids expressing these fusion proteins (see Table 3.2), induced and culture
samples taken every 30 min for 2 h. Proteins were separated by denaturing SDS-PAGE and
stained with Coomassie blue (Fig. 3.15).
Fig. 3.15 SDS-PAGE analysis of the expression of the N- and C-terminal regions of AHSV-2 NS3 as GST fusion proteins. Samples of untransformed BL21(DE3) cultures, or cultures transformed with non-recombinant pET-41c expressing GST or recombinant pET-41c expressing GST-NS3 fusion proteins were removed at 0.5, 1, 1.5 and 2 h post induction. Proteins were separated by 12% SDS-PAGE and stained with Coomassie blue. U (uninduced) represents samples taken prior to induction and were included as negative controls. The GST protein and GST-NS3 fusion proteins are indicated by blocks in their respective lanes. Sizes of molecular weight markers are as indicated on the left.
77
A unique protein band of the expected sizes of 35.6 kDa for the GST-Tag (expressed from pET-
41c), 45.4 kDa for GST A1-92, 48.3 kDa for GST-A1-118, 42.9 for GST-A151-218 and 40.6 kDa for
GST-A176-218, was observed from 30 min post induction (Fig. 3.15). As previously observed
(3.3.2.2) proteins without HDs (GST A1-92, GST A1-118 and GST A176-218) were expressed to high
levels, while proteins containing hydrophobic stretches (GST A151-218) were expressed to low
levels.
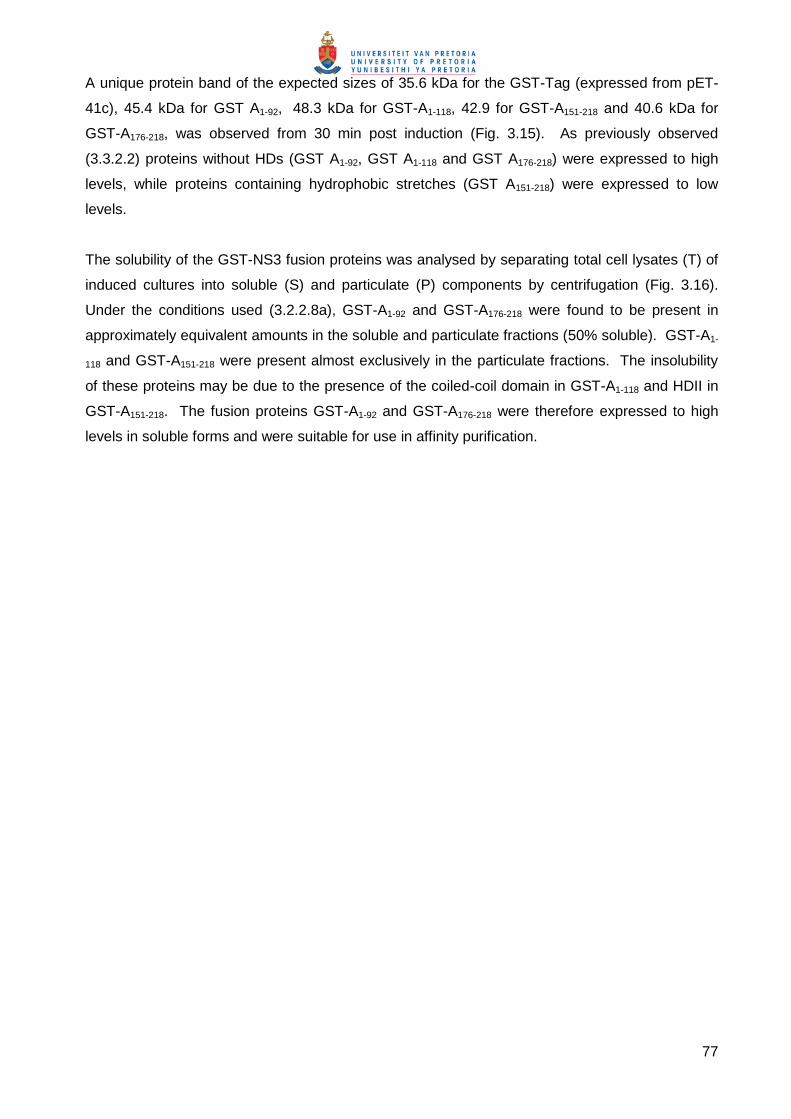
The solubility of the GST-NS3 fusion proteins was analysed by separating total cell lysates (T) of
induced cultures into soluble (S) and particulate (P) components by centrifugation (Fig. 3.16).
Under the conditions used (3.2.2.8a), GST-A1-92 and GST-A176-218 were found to be present in
approximately equivalent amounts in the soluble and particulate fractions (50% soluble). GST-A1-
118 and GST-A151-218 were present almost exclusively in the particulate fractions. The insolubility
of these proteins may be due to the presence of the coiled-coil domain in GST-A1-118 and HDII in
GST-A151-218. The fusion proteins GST-A1-92 and GST-A176-218 were therefore expressed to high
levels in soluble forms and were suitable for use in affinity purification.
78
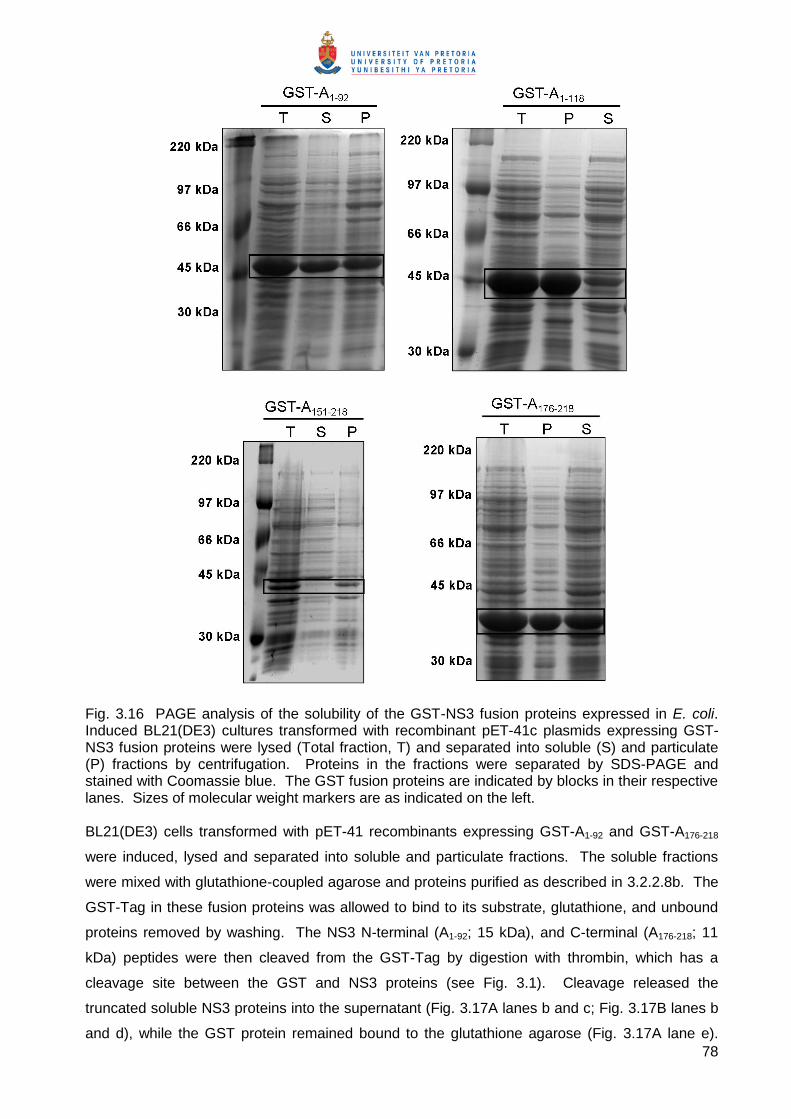
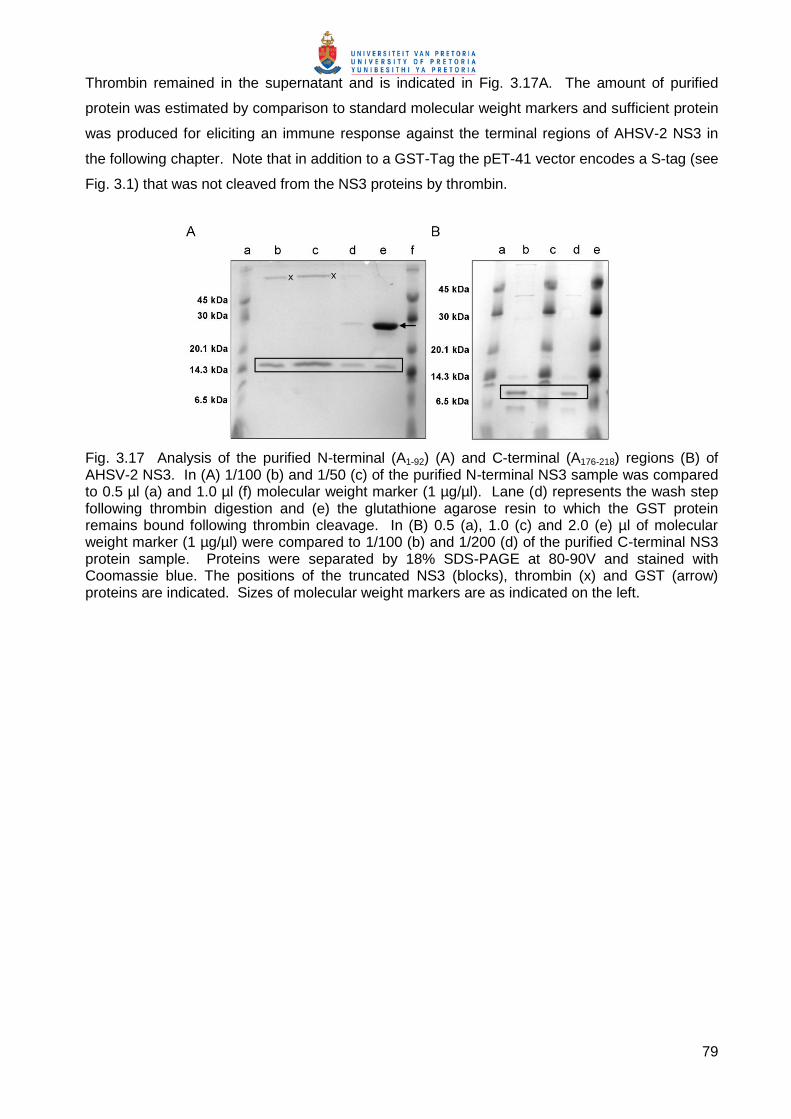
Fig. 3.16 PAGE analysis of the solubility of the GST-NS3 fusion proteins expressed in E. coli. Induced BL21(DE3) cultures transformed with recombinant pET-41c plasmids expressing GST-NS3 fusion proteins were lysed (Total fraction, T) and separated into soluble (S) and particulate (P) fractions by centrifugation. Proteins in the fractions were separated by SDS-PAGE and stained with Coomassie blue. The GST fusion proteins are indicated by blocks in their respective lanes. Sizes of molecular weight markers are as indicated on the left. BL21(DE3) cells transformed with pET-41 recombinants expressing GST-A1-92 and GST-A176-218
were induced, lysed and separated into soluble and particulate fractions. The soluble fractions
were mixed with glutathione-coupled agarose and proteins purified as described in 3.2.2.8b. The
GST-Tag in these fusion proteins was allowed to bind to its substrate, glutathione, and unbound
proteins removed by washing. The NS3 N-terminal (A1-92; 15 kDa), and C-terminal (A176-218; 11
kDa) peptides were then cleaved from the GST-Tag by digestion with thrombin, which has a
cleavage site between the GST and NS3 proteins (see Fig. 3.1). Cleavage released the
truncated soluble NS3 proteins into the supernatant (Fig. 3.17A lanes b and c; Fig. 3.17B lanes b
and d), while the GST protein remained bound to the glutathione agarose (Fig. 3.17A lane e).
79
Thrombin remained in the supernatant and is indicated in Fig. 3.17A. The amount of purified
protein was estimated by comparison to standard molecular weight markers and sufficient protein
was produced for eliciting an immune response against the terminal regions of AHSV-2 NS3 in
the following chapter. Note that in addition to a GST-Tag the pET-41 vector encodes a S-tag (see
Fig. 3.1) that was not cleaved from the NS3 proteins by thrombin.
Fig. 3.17 Analysis of the purified N-terminal (A1-92) (A) and C-terminal (A176-218) regions (B) of AHSV-2 NS3. In (A) 1/100 (b) and 1/50 (c) of the purified N-terminal NS3 sample was compared to 0.5 µl (a) and 1.0 µl (f) molecular weight marker (1 µg/µl). Lane (d) represents the wash step following thrombin digestion and (e) the glutathione agarose resin to which the GST protein remains bound following thrombin cleavage. In (B) 0.5 (a), 1.0 (c) and 2.0 (e) µl of molecular weight marker (1 µg/µl) were compared to 1/100 (b) and 1/200 (d) of the purified C-terminal NS3 protein sample. Proteins were separated by 18% SDS-PAGE at 80-90V and stained with Coomassie blue. The positions of the truncated NS3 (blocks), thrombin (x) and GST (arrow) proteins are indicated. Sizes of molecular weight markers are as indicated on the left.
80
3.4. DISCUSSION
The pathogenesis of BTV, AHSV and EEV has been well characterised on a clinical level
(Burrage & Laegried, 1994; MacLachlan, 1994; Skowronek et al., 1995), yet the molecular basis
of orbivirus virulence and pathogenesis is not well understood and thought to be complex and
multifactorial (Laegreid et al., 1993; O'Hara et al., 1998). Prominent pathological features of
orbiviral diseases include oedema, effusion and haemorrhage, indicative of a loss in endothelial
cell barrier function. Alteration of membrane permeability is a common feature of infection by
cytolytic animal viruses (Carrasco, 1995) resulting in drastic changes in the metabolism of
infected cells and contributing to the development of the cytopathic effect. Proteins that affect
membrane permeability are therefore of particular importance in determining virus virulence.
In this chapter the cytolytic and membrane permeabilising activities of the NS3 proteins of three
different orbiviruses were compared in both insect (Sf9) and E. coli cells. In addition to this, the
regions within AHSV NS3 responsible for membrane destabilisation in E. coli were identified.
Expression of AHSV, EEV and BTV NS3 as baculovirus recombinants in insect cells caused a
marked decline in cell viability, with all three proteins causing similar levels of cytotoxicity at 48 h
p.i. This confirms previous reports of viroporin-like activity for AHSV and BTV NS3 (Van Niekerk
et al., 2001a; Han & Harty, 2004). The EEV NS3 protein, furthermore, has many of the shared
characteristics found in viroporins, in that it is a small virally encoded membrane-associated
protein with two hydrophobic domains. This suggests that EEV NS3 has viroporin-like activity.
This activity is thought to result in not only the efficient release of viral particles from infected cells
but may also contribute to viral pathogenesis and cytopathic effects in infected cells.
Expression of the orbivirus NS3 proteins in bacterial cells showed significant differences in their
cytolytic and membrane permeabilising activity. Both AHSV and EEV NS3 inhibited cell growth in
E. coli, with EEV NS3 having the greatest inhibitory effect on these cells. Expression of these
proteins permeabilised the membrane to Hyg B and ONPG. Both EEV NS3 and AHSV NS3 are
therefore cytotoxic to E. coli, and this lytic effect is a result of increased membrane permeability.
BTV NS3 had little to no effect on E. coli cell growth and membrane permeability. This appears to
be in contrast to our finding that the protein is cytotoxic to insect cells, and previous reports where
BTV NS3 was shown to increase the permeability of COS-1 cells to Hyg B (Han & Harty, 2004).
There are a number of factors that may affect the outcome of studies of the cytolytic properties of
proteins in different cell systems, including the membrane composition of the cells, stability of the
membrane-association of the protein in that system, and post-translation modifications. Many
viroporins have been shown to permeabilise both bacterial and mammalian cells, while other
viroporins such as picornavirus 3A perturbs bacterial but not BHK-21 or HeLa cell membranes
81
(Madan et al., 2008). The lipid composition of the bacterial inner membrane differs significantly
from the plasma membrane of mammalian and insect cells, for example very low levels of
cholesterol are found in the bacterial and ER membrane whereas this is a major component of
the membrane of mammalian cells. It is therefore not surprising that the results from cytotoxicity
and permeability studies in different cell lines may vary. NSP4 of rotavirus, for example,
preferentially interacts with membranes that are rich in both cholesterol and negatively charged
phospholipids (Huang et al., 2001). BTV NS3 is furthermore a glycosylated protein (Wu et al.,
1992), where glycosylation may prevent the protein from being degraded (Bansal et al., 1998).
The absence of this glycosylation in E. coli may therefore lead to decreased stability and
functionality of BTV NS3 in E. coli cells. There is no evidence that either AHSV or EEV NS3 exist
in a glycosylated form and indeed NS3 from some serotypes of AHSV lack glycosylation
sequence motifs (Van Niekerk et al., 2001a). As both EEV and AHSV NS3 were cytotoxic in E.
coli, glycosylation does not appear to play any role in the activity and stability of these proteins.
Using the pET prokaryotic expression system, there are therefore distinct differences between the
effects of NS3 from BTV, AHSV and EEV. Although these effects can not be directly extrapolated
or linked to the effect these proteins have on eukaryotic cells or to the diseases caused by the
respective viruses, it provides evidence for structural and/or functional differences between these
proteins.
To investigate the regions of AHSV NS3 that directly mediate cytotoxicity, and that play a role in
structural stability, we constructed a variety of truncated mutants of the protein. These truncated
mutants were also expressed and analysed in the pET expression system.
Expression levels of truncated mutants varied considerably, with peptides lacking the hydrophobic
domains (A1-92 and A1-118) expressed to much higher levels than the full length NS3 and other
truncated mutants. Truncated mutants without the HDs, representing the N- and C-termini of
NS3, were therefore expressed as GST-Tag fusion proteins (GST-A1-92 and GST-A176-218) and
found to be expressed to high levels in soluble forms. This facilitated the affinity purification of
these peptides for later use in the production of monospecific antibodies to these regions of NS3.
Low expression levels were observed for the peptides that contain only one of the AHSV
hydrophobic domains, A1-140 and A151-218. As these proteins were found not to be lytic to cells, the
explanation for the low levels of synthesis of these peptides is unclear. Expression of the A151-218
truncated mutant as a GST-Tag fusion protein also showed low levels of synthesis of the
recombinant protein. Similar inexplicably low level expression was observed for non-lytic
fragments of HIV gp41 (Arroyo et al., 1995) and rotavirus NSP4 (Browne et al., 2000) in E. coli.
In the case of rotavirus NSP4, peptides representing the soluble regions of the cytoplasmic
domains were expressed to high levels, and those containing hydrophobic domains expressed to
82
low levels (Browne et al., 2000). In our case, low level expression was also observed for A93-218,
while no expression of the A113-218 and A113-176 proteins could be observed. This was probably
linked to the highly lytic effect of these proteins.
AHSV mutants lacking both HDs, or containing either HDI or HDII, did not inhibit cell growth and
did not increase the uptake of Hyg B or ONPG. These truncated mutants were therefore not
cytotoxic and had no membrane permeabilising activity. In contrast, truncated mutants containing
both HDs had a severe negative effect on cell viability and greatly increased the uptake of the
membrane impermeant Hyg B and ONPG. These proteins were therefore highly toxic to E. coli
and this is probably linked to their ability to permeabilise the membrane of these cells.
Interestingly, the cytolytic and membrane permeabilising effects of these mutants was greater
than that observed for the full length protein. Browne and coworkers (2000) report a similar
finding when expressing truncated peptides of rotavirus NSP4 in E. coli, with cytolytic truncated
peptides displaying a more potent lytic and membrane destabilising effect than the full length
protein.
Previous studies of AHSV NS3 in insect cells have implicated both HDs within the protein as
mediating cytotoxicity while studies of BTV NS3 found only one of the HDs to be critical.
Substitution mutational analysis of AHSV NS3 indicated that the cytolytic activity was dependant
on the integrity of the two hydrophobic domains within the protein (Van Niekerk et al., 2001a).
Disruption of either hydrophobic domain prevented the membrane anchoring of NS3 in an in vitro
system, suggesting that the cytotoxicity of AHSV NS3 was dependant on the correct membrane
insertion and topography. In contrast, in a study by Han & Harty (2004), mutation of HDI of BTV
NS3 abolished the protein’s membrane permeabilising activity, while mutation of HDII had no
effect. Predictions of transmembrane (TM) regions using the TMHMM (TransMembrane
prediction using a Hidden Markov Model) program (Krogh et al., 2001) indicated that that both
HDs within BTV-4, AHSV-2 and EEV-1 NS3 would form TM regions. For EEV NS3, both HDI and
HDII have a high probability (1.0) of forming TM regions. In AHSV and BTV NS3, HDI has a
probability of 1.0 to form a TM region, whereas HDII has a probability of only 0.3 and 0.8
respectively. This may suggest that there are different conformational constraints within these
proteins that may affect membrane insertion and stability within the membrane.
In a mutagenesis study of the 2B viroporin of coxsackievirus it was shown that either of the two
predicted transmembrane domains within this protein could mediate membrane binding, but that
the presence of both these domains was necessary for membrane permeabilising activity in
mammalian cells (De Jong et al., 2003). In a follow up study a library of soluble overlapping
peptides that spanned the complete 2B sequence were synthesised and assayed for their ability
to permeabilise cultured cells following extracellular addition. Here it was shown that a peptide
83
corresponding to only one of the transmembrane domains (TM1) could effectively permeabilise
the cell membrane of BHK-21 cells but its addition to bacteria did not affect growth of these cells
(Madan et al., 2007). In a similar peptide-based assay it was shown that the 2B viroporin requires
the cooperation of both transmembrane domains for insertion into, and destabilisation of, bacterial
membranes (Sánchez-Martínez et al., 2008). They suggest that differences could be due to the
differences in charge and phospholipids content of the target membranes used in the various
assays. In bacterial membranes, and the lipid bilayers surrounding organelles, the cytolytic
activity of TM1 requires the cooperation of the second transmembrane domain, possibly for
translocation of TM1 across the bilayer.
In this study cytotoxicity was also found to be affected by other regions within the AHSV NS3
protein not directly involved in or responsible for this activity. Truncation of the C-terminal region
of AHSV NS3 was found to cause a decrease in the membrane permeabilising activity,
suggesting that this region may have a stabilising effect. Removal of the N-terminal region, in
contrast, resulted in enhanced cytotoxicity and membrane permeabilisation. Destabilisation of the
membrane therefore involves both disruption of the lipid bilayer and maintaining a stable
integration into the membrane.
The different orbiviral NS3 primary sequences have a similar predicted secondary structure with
two hydrophobic domains, proposed to oligomerise and span the membrane twice with the N- and
C- termini in the cytoplasm. We have demonstrated here that these proteins do however vary in
terms of which regions are important in interactions with and destabilisation of membranes from
different cell lines. From our data we propose that the mechanisms used by the NS3 proteins to
fulfil these functions are not necessarily exactly the same for the orbiviruses studied.
In chapter 2 it was shown that the NS3 protein plays a central role in determining the membrane
permeabilising and release characteristics of the virus. In this chapter it was shown that AHSV
NS3 when expressed as a recombinant has membrane permeabilising activity. Differences in the
membrane permeabilising and release characteristics of the AHSV-2, -3 and -4 viruses may
depend on the variation within their encoded NS3 proteins. In the following chapter AHSV-2,
AHSV-3 and AHSV-4 NS3 were therefore recombinantly expressed and compared.
CHAPTER 4: COMPARISON OF THE NS3 PROTEINS OF
AHSV-2, AHSV-3 AND AHSV-4
85
4.1. INTRODUCTION
In chapter 2 it was shown that viruses (AHSV-2, AHSV-3 and AHSV-4) encoding NS3 proteins
from the three different phylogenetic clades (γ, β, and α, respectively) permeabilised Vero cell
membranes to Hygromycin B to different extents. These viruses also differed in their release and
cytopathic effect on cells. AHSV-2 infection of Vero cells resulted in the most severe cytopathic
effect, with the highest amounts of membrane permeabilisation and viral release when compared
to the other viruses. Using reassortants, it was shown that while NS3 was not the exclusive
determinant of the cytopathic effects of the virus, it was possibly involved in this together with the
non-structural NS1 protein. The membrane permeabilising and release properties of AHSV-2
however showed clear segregation to reassortants encoding the AHSV-2 NS3 protein. The
membrane permeabilising effect of the virus could therefore be related to the encoded NS3
protein.
Sequence variation between NS3 of AHSV-2, AHSV-3 and AHSV-4, that impacts on the structure
and functioning of these proteins, may therefore be important in determining the differences
observed in the parental viruses. As the amino acid sequence variation between the α, β and γ
NS3 proteins is high (34.7% between AHSV-2 and AHSV-3 and 35.2% between AHSV-2 and
AHSV-4, for example) it was impossible to identify specific amino acid differences that may
impact on this. We therefore set out to firstly determine if NS3 had membrane permeabilising
activity when expressed alone as a recombinant protein and, secondly to identify domains within
the protein that mediated this activity. For this purpose the inducible prokaryotic pET expression
system was used and recombinant expression of AHSV-2 NS3 in E. coli showed that this protein
had membrane destabilising activity (see chapter 3). This is then probably the basis for the
cytotoxicity observed when NS3 was expressed in insect cells (Van Staden et al., 1995; Van
Niekerk et al., 2001a).
In a study by van Niekerk et al. (2001a) substitution mutation of the HDs of NS3, in which the
hydrophobic nature was altered by replacement of nonpolar residues with charged residues,
significantly reduced the cytotoxic effect of the protein and prevented localisation to the outer
plasma membrane of Sf9 cells. The ability of these mutants to associate with membranes was
then analysed using in vitro translation in the presence of microsomal membranes, followed by
treatment with a variety of buffers. Mutants were shown not to be stably integrated or anchored
in these membranes. The cytotoxicity of NS3 was therefore shown to be dependant on
membrane association of the protein, mediated by the two hydrophobic domains. This study did
not exclude the possibility that, following correct membrane association and targeting to the outer
membrane, other regions within the protein could mediate the cytotoxic effect. In chapter 3 a
panel of truncated mutants of AHSV-2 NS3 was therefore constructed and expressed in bacterial
86
cells. The membrane permeabilising activity of NS3 could be directly linked to the two
hydrophobic domains within the protein, and both domains were required for this activity.
Differences in the hydrophobic domains between AHSV-2, AHSV-3 and AHSV-4 NS3, that impact
on their association with membranes, membrane topology and subcellular localisation, may
therefore directly or indirectly impact on their membrane permeabilising effect and cytotoxicity.
In this chapter we therefore set out to compare the AHSV-2, AHSV-3 and AHSV-4 (or α, β and γ)
NS3 proteins. The proteins were initially analysed using several computer programs to predict
whether amino acid sequence variation potentially impacted on various properties of the protein,
such as the ability of the HDs to form transmembrane regions, the topology of the proteins in the
membrane and the localisation of the proteins within the cell. The proteins were then
recombinantly expressed in insect cells, using the baculovirus expression system, as both wild-
type recombinant proteins and as eGFP fusion proteins. The membrane permeabilising activity,
cytotoxicity, membrane association, membrane topology and localisation of these proteins was
then examined for potential differences.
87
4.2. MATERIALS AND METHODS
4.2.1. AHSV-2, AHSV-3 and AHSV-4 NS3 sequence analysis and computational comparison The AHSV-2 (82/61), AHSV-3 (M322/97) and AHSV-4 (HS39/97) NS3 amino acid sequences were aligned using AlignX (Vector NTi, Invitrogen) and the percentage sequence identity for conserved regions calculated. Transmembrane regions were predicted using a TMHMM (TransMembrane prediction using a Hidden Markov Model) transmembrane prediction program (http://www.cbs.dtu.dk/services/TMHMM-2.0/ (Krogh et al., 2001)). The presence of potential nuclear localisation signals (NLS) was analysed using PredictNLS online (http://cubic.bioc.columbia.edu/predictNLS/ (Cokol et al., 2000)). 4.2.2. Expression of AHSV-2, AHSV-3 and AHSV-4 NS3 in Sf9 cells Recombinant baculoviruses expressing NS3 of AHSV-2, AHSV-3 or AHSV-4 were available and have been described previously (3.2.1.1.). Recombinant baculoviruses expressing NS3 of AHSV-3 (Van Staden et al., 1995) and NS3 of AHSV-3 fused to the amino terminal of eGFP (Hatherell, 2007) were available. For the expression of AHSV-2 and AHSV-4 NS3 as eGFP fusion proteins the NS3 genes were cloned into a pFastBac1 baculovirus expression vector containing the eGFP coding sequence and recombinant baculoviruses generated as described in the following section. 4.2.2.1. Cloning of AHSV-2 and AHSV-4 NS3 as eGFP fusions in the BAC-TO-BACTM expression system 4.2.2.1a. Cloning S10 of AHSV-2 and AHSV-4 into pFastBac1-eGFP The AHSV-2 and -4 NS3 genes were PCR amplified from cDNA copies cloned into pCMVScript (from J. Korsman and M. van Niekerk, UP, respectively). In both cases the forward primer NS3pBam (5’ CGGGATCCGTTTAAATTATCCCTTG) was used and included a BamHI restriction site. The reverse primers P11G9 (5’ CGGAATTCGTCTCCATATTTTACATC3’) and P11G8 (5’ CGGAATTCGCTCTCGCCATACTTAATTC3’) specific to the 3’ end of the NS3 genes of AHSV-2 and AHSV-4, respectively, included an EcoRI restriction site and were designed to remove the stop codon, as the NS3 genes were to be cloned upstream of an eGFP gene. PCR reactions were setup as described in 2.2.3.2. and reaction conditions were: one cycle of 2 min at 94oC, followed by 35 cycles of 30 sec at 94oC, 30 sec at 59oC and 60 sec at 72oC, followed by a final cycle at 72oC for 5 min. PCR products were resolved by 1% gel electrophoresis and purified using a High pure PCR purification kit (Roche). Purified PCR products were digested with BamHI and EcoRI and ligated to a pFastBac1 donor vector containing a cloned copy of the gene encoding eGFP (obtained from M. Victor, UP) digested with the same enzymes. Ligated plasmids were transformed by heat shock into CaCl2 competent XL1 Blue cells. Possible recombinant colonies were grown overnight at 37ºC on agar
plates containing 100 g/ml ampicillin and 12.5 g/ml tetracyclin. Possible recombinant plasmids were isolated by a conventional small scale alkaline-lysis plasmid isolation protocol (Sambrook & Russell, 2001) and possible recombinants were screened by digestion with BamHI and EcoRI. For sequencing, recombinant plasmids were purified using a commercial purification kit (Roche) and sequenced using an ABI PRISM Big Dye Terminator Cycle Sequencing Ready Reaction kit with a pPolhFw (5’TTCCGGATTATTCATACC3’) forward primer specific to the pFastBac vector or an eGFPinternal reverse primer (5’GGGCATGGCGGACTTGAAGAAG3’) specific to the eGFP gene. Sequences were analysed on an ABI PRISM 3130xl Genetic Analyzer (Perkin Elmer). Recombinant plasmids were named pFastBac-AHSV-2-NS3-eGFP and pFastBac-AHSV-4-NS3-eGFP.
88
4.2.2.1b. Transposition and isolation of recombinant bacmid DNA Recombinant pFastBac plasmids were transformed into DH10BacTM E. coli cells according to the BAC-to-BACTM Baculovirus expression system manual (Invitrogen Life Technologies, Gaithersburg, MD). Briefly, approximately 10 ng of plasmid was mixed with 100 µl of DMSO competent DH10BacTM cells and incubated on ice for 30 min. The cells were exposed to a heat shock for 90 sec at 42oC and cooled on ice for 2 min. To this 900 µl S.O.C. medium (LB medium containing 250 mM KCl, 10 mM MgCl2 and 20 mM glucose) was added and the cells grown for 4 h at 37oC with agitation. Of this transformation mixture 100 µl was plated onto LB plates containing kan (50 µg/ml), gentamycin (7 µg/ml), tetracyclin (10 µg/ml), X-gal (100 µg/ml) and IPTG (40 µg/ml). Plates were incubated at 37oC for at least 24 h. White colonies were picked, streaked onto fresh LB plates (supplemented as above) and grown overnight to confirm the white phenotype. White colonies were grown overnight in LB medium (supplemented as above) and used for the isolation of bacmid DNA. Bacmid DNA was isolated using a protocol adapted for isolating plasmids greater than 100 kb as outlined in the BAC-to-BACTM Baculovirus expression system manual (Invitrogen Life Technologies, Gaithersburg, MD). DNA pellets were air dried in a sterile laminar flow, dissolved in 40 µl UHQ and used to transfect Sf9 cells. 4.2.2.1c. Transfection of Sf9 cells with recombinant bacmid DNA and amplification of recombinant baculoviruses Sf9 cells were seeded at 1 x 10⁶ cells/well on 6-well plates and allowed to attach for 1 - 2 h. A volume of 6 µl of isolated recombinant bacmid DNA was mixed with 100 µl of non-supplemented TC-100. A 6 µl sample of CELLFECTINTM reagent (Invitrogen Life Technologies) was diluted in 100 µl non-supplemented TC-100. The diluted DNA and lipids were gently mixed, incubated for 45 min at room temperature and the volume increased to 1 ml with non-supplemented TC-100. Cells were rinsed twice with TC-100 and overlaid with the lipid DNA mixture. Transfection was allowed to occur for 5 h at 27oC, after which time the mixture was removed from the cells and replaced with supplemented TC-100. Cells were incubated for a further 91 h and the supernatant stored at 4oC as the primary transfection mixture. Baculoviruses in the primary transfection mixture were amplified on 75 cm2 monolayers of 1 x 10⁷ Sf9 cells in a total volume of 5 ml supplemented TC-100 and incubated overnight at 27oC. The volume was then increased to 12 ml and plates incubated for a total of 4 days. The titre of virus in these stocks was then determined. 4.2.2.1d. Baculovirus titrations
Six-well plates were seeded with 8.5 x 10⁵ Sf9 cells/well (approximately 55% confluency) and the cells allowed to attach for 2 h. Dilution series of the amplified recombinant baculoviruses were prepared in supplemented TC-100. Of each dilution 0.5 ml (in duplicate) was added per well and kept at room temperature for 1 h, with agitation every 12 min. A 2% w/v Agarose, Type VII (Sigma) solution was prepared in ultra high quality water (UHQ), boiled and cooled to about 50oC. A 1% agarose working stock was prepared by the addition of an equal volume double strength Grace’s medium (Highveld Biological), pre-warmed to 38oC. Inoculums were gently aspirated and replaced with 2 ml/well 1% agarose. Plates were incubated at 27oC for 7 days until plaques were visible. Cells were then stained with 0.5 ml/well 0.1% w/v Thiazolyl Blue Tetrazodium Bromide (Sigma) in PBS and left for 24 h at 27oC. The titre (pfu/ml) was calculated as 2 x number of plaques x dilution factor. 4.2.2.2 Western blot analysis of recombinant NS3 expression in Sf9 cells Protein samples were separated by SDS-PAGE and transferred to nitrocellulose membranes (Hybond-C+, Amersham Biosciences) in a submerged EC 140 mini blot apparatus (E-C Apparatus Corporation) at 16-20 V for 1 h in Transfer buffer (25 mM Tris, 192 mM Glycine).
89
Membranes were rinsed for 5 min in PBS and blocked for 30 min in 5% blocking solution (5% w/v low fat milk powder in PBS) with gentle shaking at room temperature. Blocked membranes were incubated with the primary antibody (diluted in 1% blocking solution) overnight at room temperature with gentle agitation. Membranes were washed three times for 5 min each with wash buffer (0.05% v/v Tween-20 in PBS) and reacted with the secondary antibody diluted in 1% blocking solution for 1 h at room temperature with gentle shaking. Membranes were washed as described above followed by a final wash in PBS for 5 min. Detection of bound peroxidase enzyme conjugate was carried out by incubating the membrane in enzyme substrate (60 mg 4-chloro-1-naphtol (Sigma) in 20 ml ice-cold methanol mixed with 60 µl hydrogen peroxide in 100 ml PBS) at room temperature until bands were visible. Membranes were then removed from the enzyme substrate, rinsed with H20 and dried. For identification of eGFP, anti-GFP N-terminal antibodies (Sigma) were used as primary antibody (diluted 1:1000). For identification of AHSV-2 and AHSV-3 NS3, rabbit anti-β-galactosidase(gal)-AHSV-2 and anti-β-gal-AHSV-3 NS3 sera (obtained from M. van Niekerk and V. van Staden, UP respectively; diluted 1:100) were used as primary antibodies. For identification of EEV NS3 guinea pig anti-β-gal-EEV NS3 serum (L. Teixeira, UP; diluted 1:100) was used. The above antibodies were detected with Protein A peroxidase conjugate (Calbiochem; 1:1000 dilution). For identification of AHSV-4 NS3, chicken anti-β-gal-AHSV-4 NS3 antibodies (obtained from J. Korsman; 1:50 dilution) were used and detected with a 1:250 dilution of anti-chicken IgY peroxidase conjugate (Sigma). All antibodies were diluted in 1% blocking solution. All the primary antibodies used were polyclonal monospecific antibodies raised against denatured and gel purified NS3 fused to the C-terminus of β-gal. 4.2.3. Exogenous addition of baculovirus expressed NS3 to Vero cells Sf9 cell monolayers seeded at 1 x 10⁷ cells in 75 cm2 flasks were infected with wild-type baculovirus or with recombinant baculoviruses expressing NS3 of AHSV-2, AHSV-3 or AHSV-4 at a MOI of 5 pfu/cell. Cells were harvested 30 h p.i. and resuspended in lysis buffer without detergent (300mM NaCl; 50mM Tris-HCl, pH 7.5; 1 mM EDTA; 1mM PMSF, 1mM 2-mercaptoethanol) at 2 x 10⁷ cells/ml. Cells were mechanically lysed by dounce homogenisation. Cell lysates were placed on ice and used immediately. Duplicate samples were prepared and used to confirm NS3 protein expression by SDS-PAGE and Western blot. Sf9 cell lysates were mixed with an equal volume of supplemented MEM and added to confluent Vero cells from which the growth medium had been removed. Cells were incubated at room temperature for 180 min, after which time the lysates were removed and the membrane permeability of the Vero cells determined using the Hyg B assay as described in 2.2.6. 4.2.4. Trypan Blue cell viability assay The viability of Sf9 cells infected with recombinant baculoviruses was monitored by Trypan blue staining as described in section 3.2.1.2. 4.2.5. Subcellular fractionation and membrane flotation assay Sf9 cells were seeded on 75 cm3 flasks at 1 x 10⁷ cells/flask and infected with recombinant baculoviruses at a MOI of 2 to 5 pfu/cell. At 48 h p.i. the cells were harvested and washed twice with cold PBS. The membrane flotation assay was based on the method described by Brignati and coworkers (2003). The cells were resuspended in 300 or 500 µl hypotonic buffer (10 mM Tris, 0.2 mM MgCl2 [pH 7.4]) to which protease inhibitors had been added (1 mg/ml pefabloc SC,
0.7 g/ml pepstatin, 1 mM PMSF) and incubated on ice for 30 min. Cells were mechanically lysed by passage through a 29G needle or by douncing 30 times. The nuclei, unlysed cells and debris were collected by low speed centrifugation at 1000 g for 10 min at 4oC. For subcellular fractionations 125 µl of the supernatant following low speed centrifugation was made up to a total volume of 5 ml with hypotonic buffer. This was then separated into soluble and particulate fractions through centrifugation at 100 000 g for 90 min at 4oC. The supernatant was
90
transferred to a clean tube and the particulate fraction resuspended in 5 ml hypotonic buffer. Fluorescence (485Ex/538Em) in each of the fractions was recorded using a Thermo Labsystems Fluoroskan Ascent FL plate reader. For membrane flotation 125 µl of the supernatant, obtained following low speed centrifugation, was combined with 670 µl of 85% sucrose in NTE (100 mM NaCl, 10 mM Tris, 1 mM EDTA [pH 7.4]) to make a final concentration of 71% sucrose. This sample was overlaid with 2920 µl 65% sucrose in NTE and 1290 µl 10% sucrose in NTE in a 5 ml polyallomer tube (Beckman). The gradient was centrifuged at 100 000 g for 18 h at 4oC and fractions collected either from the top using a micropipette or from the bottom of the tube using a needle. The pellet was resuspended in a volume equal to that of the fractions collected. Fractions, from membrane flotation gradients of the wild-type NS3 proteins, were diluted with 2 volumes NTE and mixed. Four volumes of ice cold acetone were then added, the sample mixed well and proteins precipitated at -80ºC for 1 h. Proteins were collected by centrifugation in a tabletop centrifuge at maximum speed for 20 min at 4ºC and resuspended in 30 µl 1 x PSB. Proteins were analysed by standard SDS-PAGE and Western blot. The NS3-eGFP fusion proteins in membrane flotation gradient fractions were detected by measuring fluorescence (485Ex/538Em) using a Thermo Labsystems Fluoroskan Ascent FL plate reader. 4.2.6. Analysis of the membrane topology of AHSV-2 NS3 4.2.6.1. Production of antibodies against N- and C-terminal of AHSV-2 NS3 4.2.6.1a. Immunisation schedule A hen was used for the production of antibodies against the C-terminal region of NS3 and a cock for that against the N-terminal region of NS3. The hen and cock were injected intramuscularly (pectoral muscle) with 150-300 µg antigen in an equal volume of ISA70 (Seppic) oil adjuvant. Antigens (A1-92 and A176-218) were obtained, purified and quantified as described in 3.3.2.3. The hen and cock were injected by Dr M Romito (OVI) and eggs collected in the case of the hen and the cock bled for serum. Following the first inoculations the IgY response was developed by four booster inoculations with the same quantity of antigen at 4 week intervals. Serum was termed anti-N-terminal NS3. 4.2.6.1b. IgY purification A chloroform/PEG 6000 method was used for the purification of IgY from chicken eggs (Tini et al., 2002). Briefly, the egg yolk was separated from the egg white, washed with dH2O, made up to 25 ml with 100 mM Sodium Phosphate buffer (pH 7.6) and mixed vigorously. 20 ml chloroform was then added to the yolk and shaken until the formation of a semisolid phase after which the mixture was centrifuged at 1200 g for 30 min. PEG 6000 was added to the supernatant to a final concentration of 12% w/v and mixed well. Precipitated IgY was collected by centrifugation at 15 800 g for 10 min and resuspended in 1 ml PBS and termed anti-C-terminal NS3. 4.2.6.2. Immunofluorescence assays 4.2.6.2a. Pre-absorption of antibodies The antibodies produced against the terminal regions of AHSV-2 NS3 (4.2.6.1) and anti-β-gal-AHSV-2 NS3 serum (Van Niekerk, 2001) were pre-absorbed prior to their use in immunofluorescence assays. Sf9 cells were seeded on 75 cm3 flasks at a density of 1 x 10⁷ cells per flask, allowed to attach for 1 h and washed with serum free TC-100 medium. Cells were infected with wild type baculovirus at a MOI of 1 pfu/cell in 5 ml medium. At 1-2 h p.i the total volume was increased to 12 ml with medium. Infected cells were harvested 3-4 days p.i. and collected by centrifugation at 2000 g for 10 min. The cells were resuspended in 3 ml 1% blocking solution (1% w/v low fat milk powder in PBS) and lysed by passing the suspension through a 29G
91
needle. Antibodies were added (1:50 dilution for anti-β-gal-AHSV-2 NS3 and anti-C-terminal NS3; 1:25 dilution for anti-N-terminal NS3) to the lysed cells. A volume of 100 µl of the glutathione agarose resin bound to GST, which was retained during the purification of the GST recombinants (3.2.2.8b), was added to bind antibodies against GST. The suspension was incubated for 2 h at room temperature with gentle agitation and bound antibodies removed by centrifugation at 2000 g for 10 min. The supernatant was used in Western blots and immunofluorescent assays. 4.2.6.2b. Immunofluorescence assays Sf9 cells were seeded at a density of 2.5 x 10⁵ cells per well on 24-well tissue culture plates and allowed to attach for 1 h. Cells were infected with wild type baculovirus or recombinant baculovirus expressing AHSV-2 NS3 (Van Niekerk, 2001) at a MOI of 5 pfu/cell. 1 h p.i. the virus inoculums were replaced with 500 µl supplemented TC-100 per well and the infected cells incubated at 27oC. At 27 h p.i. the cells were rinsed with sterile PBS and methanol:acetone (50:50 v/v) added for 30 sec to fixed samples. Cells were then pre-blocked for 30 min with 5% blocking solution (5% w/v low fat milk powder in sterile PBS) and incubated with the pre-absorbed antibodies (4.2.6.2a.) for 1 h at room temperature. Cells were rinsed three times for 5 min each with 0.5% v/v Tween-20 in sterile PBS. Bound anti-β-gal-AHSV-2 NS3 antibodies were detected by incubation with goat anti-rabbit IgG FITC (fluoroscein isothiocyanate) conjugate (Sigma, diluted 1:250 in 1% blocking solution) for 45 min. Bound chicken anti-N-terminal NS3 and anti-C-terminal NS3 antibodies were detected using anti-chicken IgY-FITC conjugate (Sigma, diluted 1:500 in 1% blocking solution). Cells were washed as above and overlaid with PBS until viewed under a Zeiss fluorescent microscope. 4.2.7. Confocal Microscopy Sf9 cells were seeded on sterile coverslips in 6-well plates at 1 x 10⁶ cells/well and infected with recombinant baculoviruses at a MOI of 5 pfu/cell. Unfixed cells were viewed directly at 30 h p.i. using a Zeiss LSM 510 META Laser Scanning Microscope at 489 nm. Images were analysed using Zeiss LSM Image Browser Version 4,0,0,157.
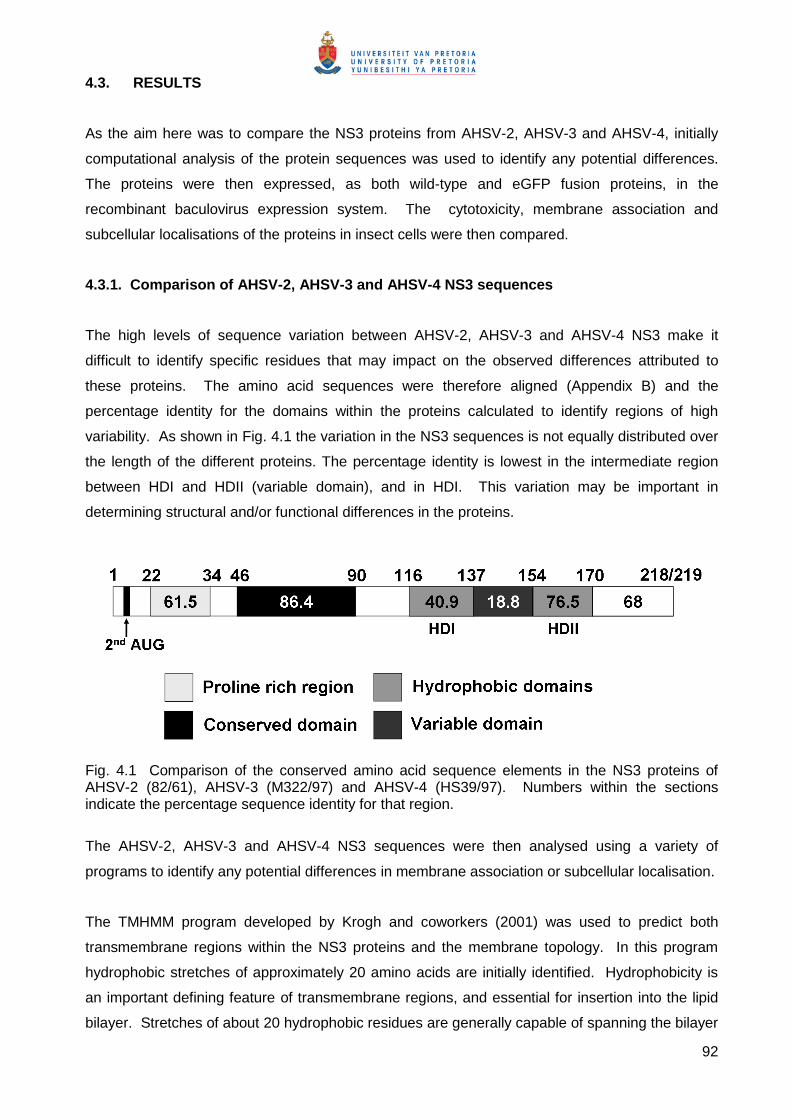
92
4.3. RESULTS
As the aim here was to compare the NS3 proteins from AHSV-2, AHSV-3 and AHSV-4, initially
computational analysis of the protein sequences was used to identify any potential differences.
The proteins were then expressed, as both wild-type and eGFP fusion proteins, in the
recombinant baculovirus expression system. The cytotoxicity, membrane association and
subcellular localisations of the proteins in insect cells were then compared.
4.3.1. Comparison of AHSV-2, AHSV-3 and AHSV-4 NS3 sequences
The high levels of sequence variation between AHSV-2, AHSV-3 and AHSV-4 NS3 make it
difficult to identify specific residues that may impact on the observed differences attributed to
these proteins. The amino acid sequences were therefore aligned (Appendix B) and the
percentage identity for the domains within the proteins calculated to identify regions of high
variability. As shown in Fig. 4.1 the variation in the NS3 sequences is not equally distributed over
the length of the different proteins. The percentage identity is lowest in the intermediate region
between HDI and HDII (variable domain), and in HDI. This variation may be important in
determining structural and/or functional differences in the proteins.
Fig. 4.1 Comparison of the conserved amino acid sequence elements in the NS3 proteins of AHSV-2 (82/61), AHSV-3 (M322/97) and AHSV-4 (HS39/97). Numbers within the sections indicate the percentage sequence identity for that region.
The AHSV-2, AHSV-3 and AHSV-4 NS3 sequences were then analysed using a variety of
programs to identify any potential differences in membrane association or subcellular localisation.
The TMHMM program developed by Krogh and coworkers (2001) was used to predict both
transmembrane regions within the NS3 proteins and the membrane topology. In this program
hydrophobic stretches of approximately 20 amino acids are initially identified. Hydrophobicity is
an important defining feature of transmembrane regions, and essential for insertion into the lipid
bilayer. Stretches of about 20 hydrophobic residues are generally capable of spanning the bilayer
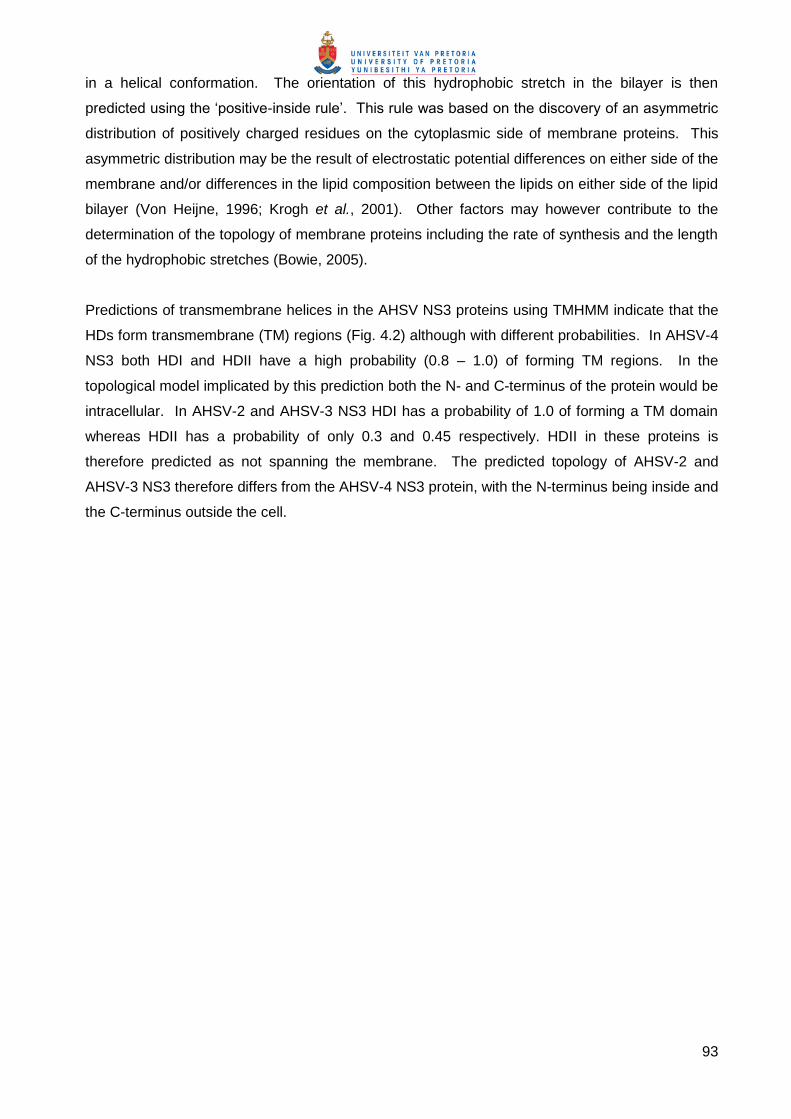
93
in a helical conformation. The orientation of this hydrophobic stretch in the bilayer is then
predicted using the ‘positive-inside rule’. This rule was based on the discovery of an asymmetric
distribution of positively charged residues on the cytoplasmic side of membrane proteins. This
asymmetric distribution may be the result of electrostatic potential differences on either side of the
membrane and/or differences in the lipid composition between the lipids on either side of the lipid
bilayer (Von Heijne, 1996; Krogh et al., 2001). Other factors may however contribute to the
determination of the topology of membrane proteins including the rate of synthesis and the length
of the hydrophobic stretches (Bowie, 2005).
Predictions of transmembrane helices in the AHSV NS3 proteins using TMHMM indicate that the
HDs form transmembrane (TM) regions (Fig. 4.2) although with different probabilities. In AHSV-4
NS3 both HDI and HDII have a high probability (0.8 – 1.0) of forming TM regions. In the
topological model implicated by this prediction both the N- and C-terminus of the protein would be
intracellular. In AHSV-2 and AHSV-3 NS3 HDI has a probability of 1.0 of forming a TM domain
whereas HDII has a probability of only 0.3 and 0.45 respectively. HDII in these proteins is
therefore predicted as not spanning the membrane. The predicted topology of AHSV-2 and
AHSV-3 NS3 therefore differs from the AHSV-4 NS3 protein, with the N-terminus being inside and
the C-terminus outside the cell.
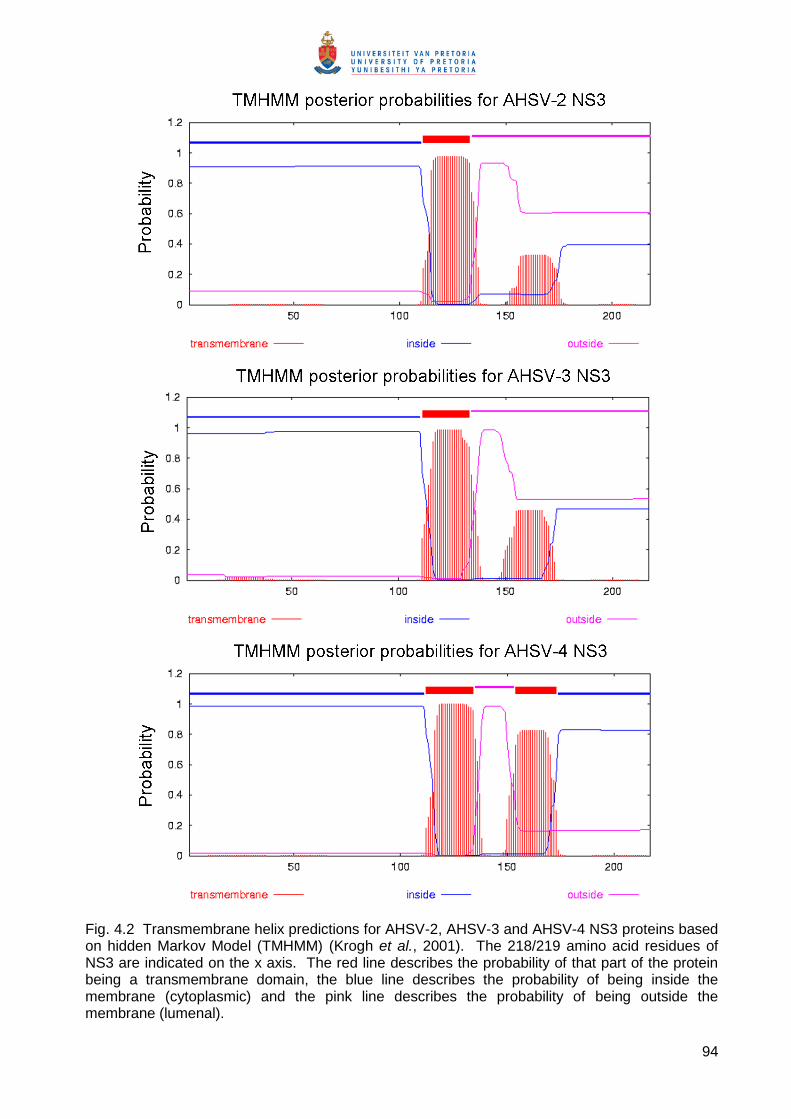
94
Fig. 4.2 Transmembrane helix predictions for AHSV-2, AHSV-3 and AHSV-4 NS3 proteins based on hidden Markov Model (TMHMM) (Krogh et al., 2001). The 218/219 amino acid residues of NS3 are indicated on the x axis. The red line describes the probability of that part of the protein being a transmembrane domain, the blue line describes the probability of being inside the membrane (cytoplasmic) and the pink line describes the probability of being outside the membrane (lumenal).
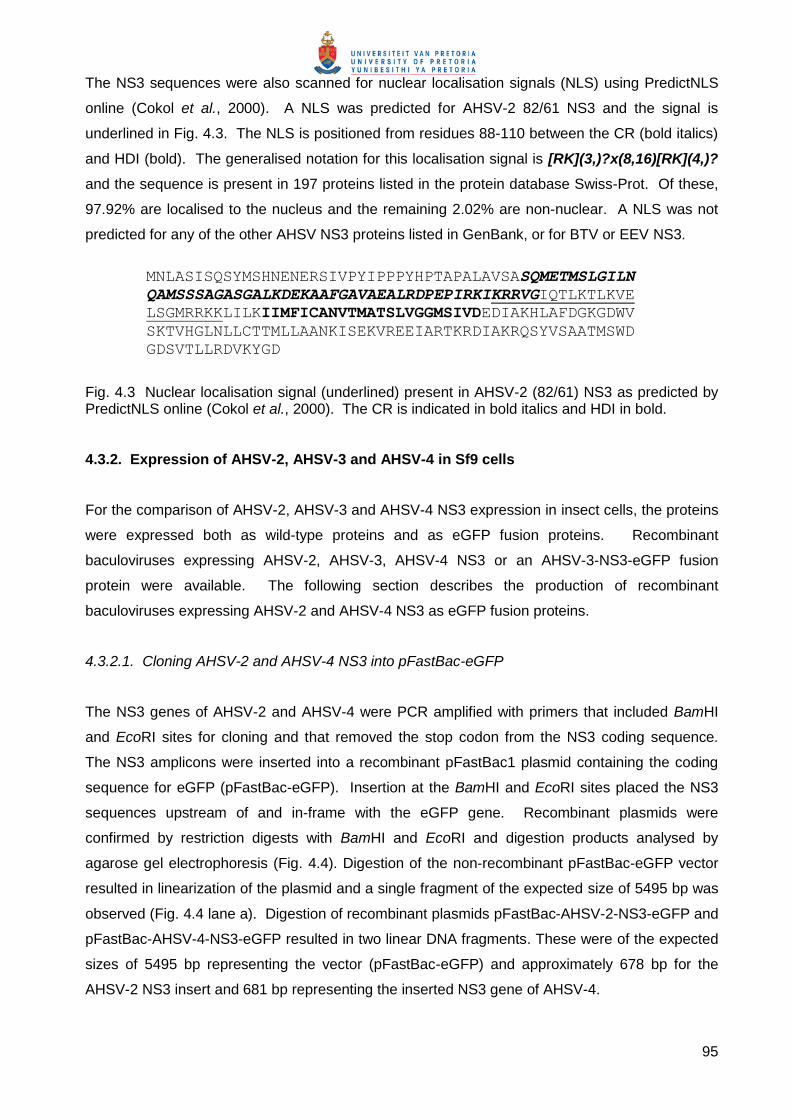
95
The NS3 sequences were also scanned for nuclear localisation signals (NLS) using PredictNLS
online (Cokol et al., 2000). A NLS was predicted for AHSV-2 82/61 NS3 and the signal is
underlined in Fig. 4.3. The NLS is positioned from residues 88-110 between the CR (bold italics)
and HDI (bold). The generalised notation for this localisation signal is [RK](3,)?x(8,16)[RK](4,)?
and the sequence is present in 197 proteins listed in the protein database Swiss-Prot. Of these,
97.92% are localised to the nucleus and the remaining 2.02% are non-nuclear. A NLS was not
predicted for any of the other AHSV NS3 proteins listed in GenBank, or for BTV or EEV NS3.
MNLASISQSYMSHNENERSIVPYIPPPYHPTAPALAVSASQMETMSLGILN
QAMSSSAGASGALKDEKAAFGAVAEALRDPEPIRKIKRRVGIQTLKTLKVE
LSGMRRKKLILKIIMFICANVTMATSLVGGMSIVDEDIAKHLAFDGKGDWV
SKTVHGLNLLCTTMLLAANKISEKVREEIARTKRDIAKRQSYVSAATMSWD
GDSVTLLRDVKYGD
Fig. 4.3 Nuclear localisation signal (underlined) present in AHSV-2 (82/61) NS3 as predicted by PredictNLS online (Cokol et al., 2000). The CR is indicated in bold italics and HDI in bold. 4.3.2. Expression of AHSV-2, AHSV-3 and AHSV-4 in Sf9 cells
For the comparison of AHSV-2, AHSV-3 and AHSV-4 NS3 expression in insect cells, the proteins
were expressed both as wild-type proteins and as eGFP fusion proteins. Recombinant
baculoviruses expressing AHSV-2, AHSV-3, AHSV-4 NS3 or an AHSV-3-NS3-eGFP fusion
protein were available. The following section describes the production of recombinant
baculoviruses expressing AHSV-2 and AHSV-4 NS3 as eGFP fusion proteins.
4.3.2.1. Cloning AHSV-2 and AHSV-4 NS3 into pFastBac-eGFP
The NS3 genes of AHSV-2 and AHSV-4 were PCR amplified with primers that included BamHI
and EcoRI sites for cloning and that removed the stop codon from the NS3 coding sequence.
The NS3 amplicons were inserted into a recombinant pFastBac1 plasmid containing the coding
sequence for eGFP (pFastBac-eGFP). Insertion at the BamHI and EcoRI sites placed the NS3
sequences upstream of and in-frame with the eGFP gene. Recombinant plasmids were
confirmed by restriction digests with BamHI and EcoRI and digestion products analysed by
agarose gel electrophoresis (Fig. 4.4). Digestion of the non-recombinant pFastBac-eGFP vector
resulted in linearization of the plasmid and a single fragment of the expected size of 5495 bp was
observed (Fig. 4.4 lane a). Digestion of recombinant plasmids pFastBac-AHSV-2-NS3-eGFP and
pFastBac-AHSV-4-NS3-eGFP resulted in two linear DNA fragments. These were of the expected
sizes of 5495 bp representing the vector (pFastBac-eGFP) and approximately 678 bp for the
AHSV-2 NS3 insert and 681 bp representing the inserted NS3 gene of AHSV-4.
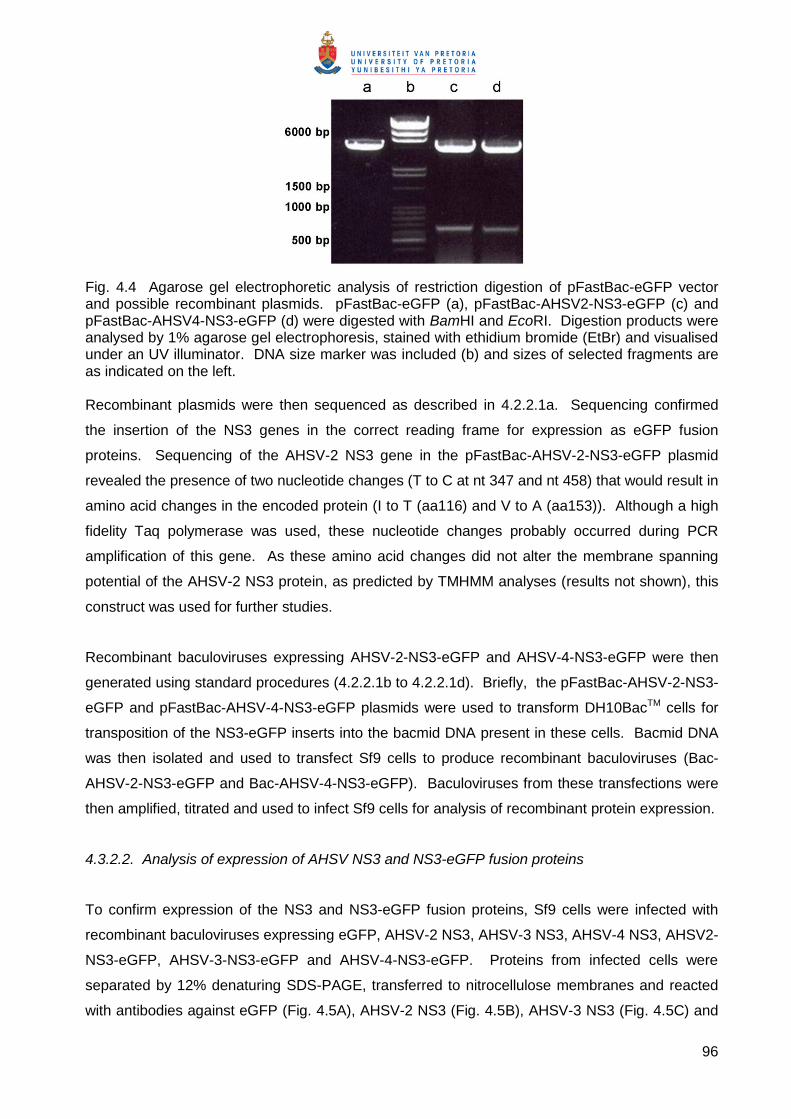
96
Fig. 4.4 Agarose gel electrophoretic analysis of restriction digestion of pFastBac-eGFP vector and possible recombinant plasmids. pFastBac-eGFP (a), pFastBac-AHSV2-NS3-eGFP (c) and pFastBac-AHSV4-NS3-eGFP (d) were digested with BamHI and EcoRI. Digestion products were analysed by 1% agarose gel electrophoresis, stained with ethidium bromide (EtBr) and visualised under an UV illuminator. DNA size marker was included (b) and sizes of selected fragments are as indicated on the left. Recombinant plasmids were then sequenced as described in 4.2.2.1a. Sequencing confirmed
the insertion of the NS3 genes in the correct reading frame for expression as eGFP fusion
proteins. Sequencing of the AHSV-2 NS3 gene in the pFastBac-AHSV-2-NS3-eGFP plasmid
revealed the presence of two nucleotide changes (T to C at nt 347 and nt 458) that would result in
amino acid changes in the encoded protein (I to T (aa116) and V to A (aa153)). Although a high
fidelity Taq polymerase was used, these nucleotide changes probably occurred during PCR
amplification of this gene. As these amino acid changes did not alter the membrane spanning
potential of the AHSV-2 NS3 protein, as predicted by TMHMM analyses (results not shown), this
construct was used for further studies.
Recombinant baculoviruses expressing AHSV-2-NS3-eGFP and AHSV-4-NS3-eGFP were then
generated using standard procedures (4.2.2.1b to 4.2.2.1d). Briefly, the pFastBac-AHSV-2-NS3-
eGFP and pFastBac-AHSV-4-NS3-eGFP plasmids were used to transform DH10BacTM cells for
transposition of the NS3-eGFP inserts into the bacmid DNA present in these cells. Bacmid DNA
was then isolated and used to transfect Sf9 cells to produce recombinant baculoviruses (Bac-
AHSV-2-NS3-eGFP and Bac-AHSV-4-NS3-eGFP). Baculoviruses from these transfections were
then amplified, titrated and used to infect Sf9 cells for analysis of recombinant protein expression.
4.3.2.2. Analysis of expression of AHSV NS3 and NS3-eGFP fusion proteins
To confirm expression of the NS3 and NS3-eGFP fusion proteins, Sf9 cells were infected with
recombinant baculoviruses expressing eGFP, AHSV-2 NS3, AHSV-3 NS3, AHSV-4 NS3, AHSV2-
NS3-eGFP, AHSV-3-NS3-eGFP and AHSV-4-NS3-eGFP. Proteins from infected cells were
separated by 12% denaturing SDS-PAGE, transferred to nitrocellulose membranes and reacted
with antibodies against eGFP (Fig. 4.5A), AHSV-2 NS3 (Fig. 4.5B), AHSV-3 NS3 (Fig. 4.5C) and
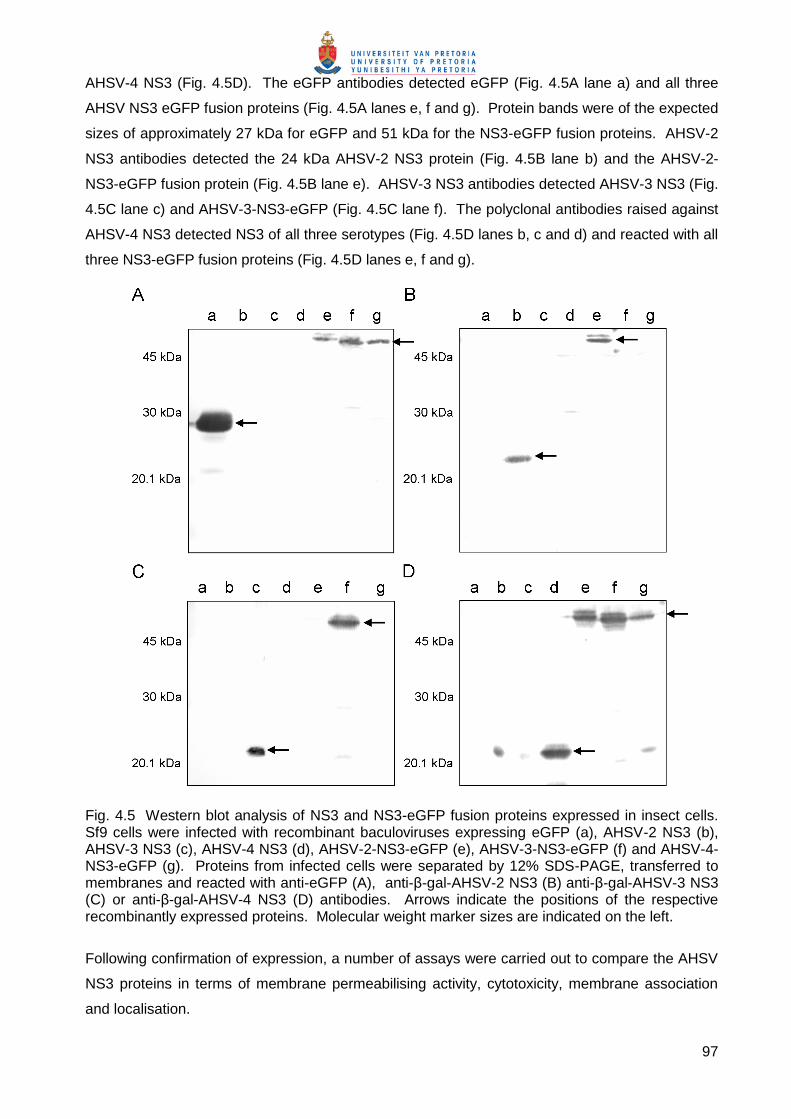
97
AHSV-4 NS3 (Fig. 4.5D). The eGFP antibodies detected eGFP (Fig. 4.5A lane a) and all three
AHSV NS3 eGFP fusion proteins (Fig. 4.5A lanes e, f and g). Protein bands were of the expected
sizes of approximately 27 kDa for eGFP and 51 kDa for the NS3-eGFP fusion proteins. AHSV-2
NS3 antibodies detected the 24 kDa AHSV-2 NS3 protein (Fig. 4.5B lane b) and the AHSV-2-
NS3-eGFP fusion protein (Fig. 4.5B lane e). AHSV-3 NS3 antibodies detected AHSV-3 NS3 (Fig.
4.5C lane c) and AHSV-3-NS3-eGFP (Fig. 4.5C lane f). The polyclonal antibodies raised against
AHSV-4 NS3 detected NS3 of all three serotypes (Fig. 4.5D lanes b, c and d) and reacted with all
three NS3-eGFP fusion proteins (Fig. 4.5D lanes e, f and g).
Fig. 4.5 Western blot analysis of NS3 and NS3-eGFP fusion proteins expressed in insect cells. Sf9 cells were infected with recombinant baculoviruses expressing eGFP (a), AHSV-2 NS3 (b), AHSV-3 NS3 (c), AHSV-4 NS3 (d), AHSV-2-NS3-eGFP (e), AHSV-3-NS3-eGFP (f) and AHSV-4-NS3-eGFP (g). Proteins from infected cells were separated by 12% SDS-PAGE, transferred to membranes and reacted with anti-eGFP (A), anti-β-gal-AHSV-2 NS3 (B) anti-β-gal-AHSV-3 NS3 (C) or anti-β-gal-AHSV-4 NS3 (D) antibodies. Arrows indicate the positions of the respective recombinantly expressed proteins. Molecular weight marker sizes are indicated on the left.
Following confirmation of expression, a number of assays were carried out to compare the AHSV
NS3 proteins in terms of membrane permeabilising activity, cytotoxicity, membrane association
and localisation.
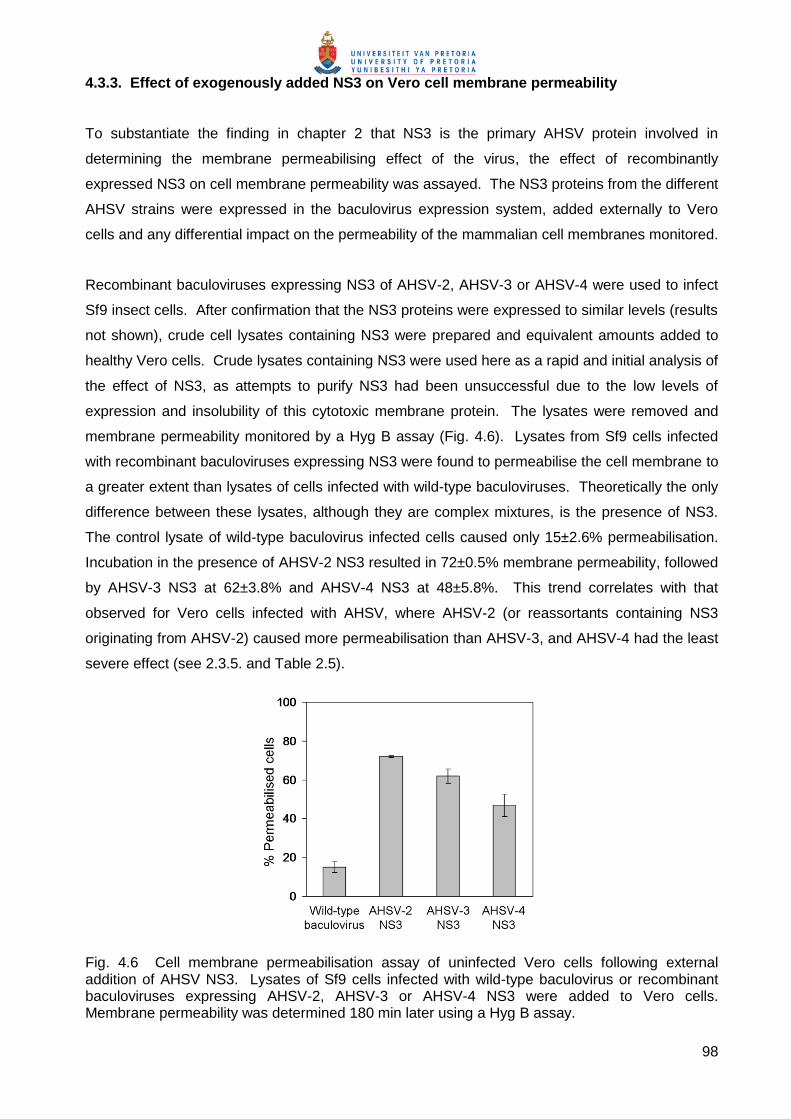
98
4.3.3. Effect of exogenously added NS3 on Vero cell membrane permeability
To substantiate the finding in chapter 2 that NS3 is the primary AHSV protein involved in
determining the membrane permeabilising effect of the virus, the effect of recombinantly
expressed NS3 on cell membrane permeability was assayed. The NS3 proteins from the different
AHSV strains were expressed in the baculovirus expression system, added externally to Vero
cells and any differential impact on the permeability of the mammalian cell membranes monitored.
Recombinant baculoviruses expressing NS3 of AHSV-2, AHSV-3 or AHSV-4 were used to infect
Sf9 insect cells. After confirmation that the NS3 proteins were expressed to similar levels (results
not shown), crude cell lysates containing NS3 were prepared and equivalent amounts added to
healthy Vero cells. Crude lysates containing NS3 were used here as a rapid and initial analysis of
the effect of NS3, as attempts to purify NS3 had been unsuccessful due to the low levels of
expression and insolubility of this cytotoxic membrane protein. The lysates were removed and
membrane permeability monitored by a Hyg B assay (Fig. 4.6). Lysates from Sf9 cells infected
with recombinant baculoviruses expressing NS3 were found to permeabilise the cell membrane to
a greater extent than lysates of cells infected with wild-type baculoviruses. Theoretically the only
difference between these lysates, although they are complex mixtures, is the presence of NS3.
The control lysate of wild-type baculovirus infected cells caused only 15±2.6% permeabilisation.
Incubation in the presence of AHSV-2 NS3 resulted in 72±0.5% membrane permeability, followed
by AHSV-3 NS3 at 62±3.8% and AHSV-4 NS3 at 48±5.8%. This trend correlates with that
observed for Vero cells infected with AHSV, where AHSV-2 (or reassortants containing NS3
originating from AHSV-2) caused more permeabilisation than AHSV-3, and AHSV-4 had the least
severe effect (see 2.3.5. and Table 2.5).
Fig. 4.6 Cell membrane permeabilisation assay of uninfected Vero cells following external addition of AHSV NS3. Lysates of Sf9 cells infected with wild-type baculovirus or recombinant baculoviruses expressing AHSV-2, AHSV-3 or AHSV-4 NS3 were added to Vero cells. Membrane permeability was determined 180 min later using a Hyg B assay.
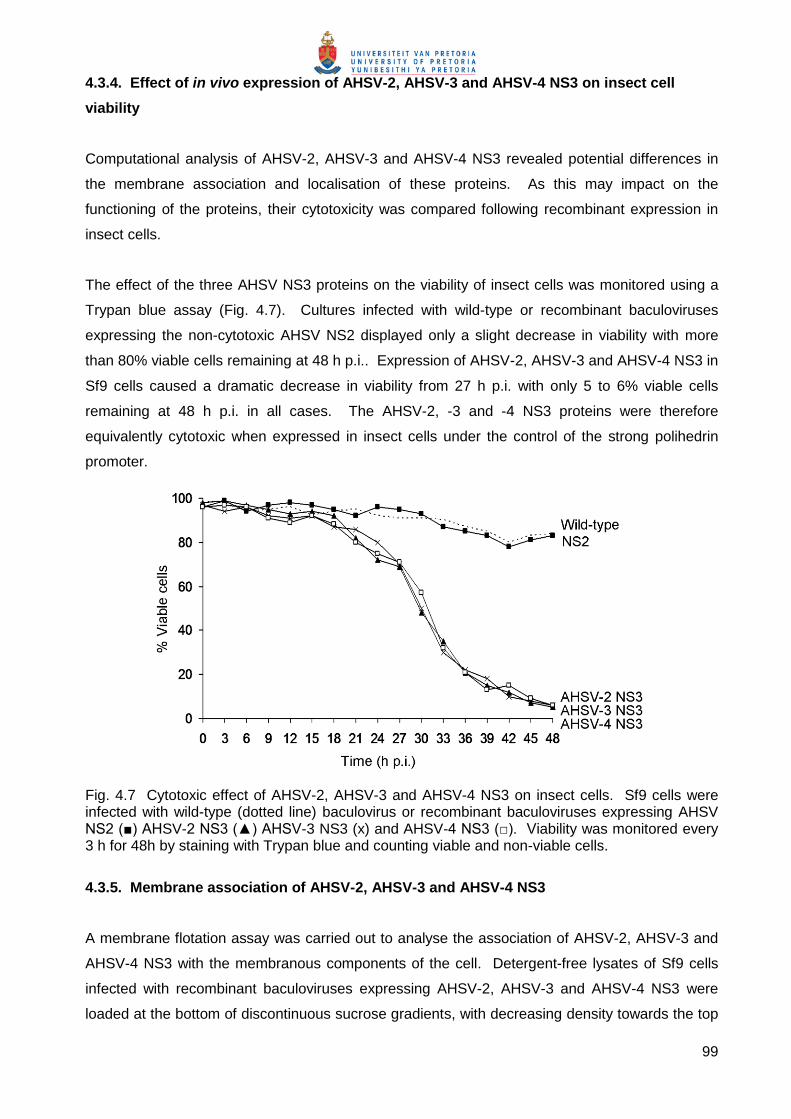
99
4.3.4. Effect of in vivo expression of AHSV-2, AHSV-3 and AHSV-4 NS3 on insect cell
viability
Computational analysis of AHSV-2, AHSV-3 and AHSV-4 NS3 revealed potential differences in
the membrane association and localisation of these proteins. As this may impact on the
functioning of the proteins, their cytotoxicity was compared following recombinant expression in
insect cells.
The effect of the three AHSV NS3 proteins on the viability of insect cells was monitored using a
Trypan blue assay (Fig. 4.7). Cultures infected with wild-type or recombinant baculoviruses
expressing the non-cytotoxic AHSV NS2 displayed only a slight decrease in viability with more
than 80% viable cells remaining at 48 h p.i.. Expression of AHSV-2, AHSV-3 and AHSV-4 NS3 in
Sf9 cells caused a dramatic decrease in viability from 27 h p.i. with only 5 to 6% viable cells
remaining at 48 h p.i. in all cases. The AHSV-2, -3 and -4 NS3 proteins were therefore
equivalently cytotoxic when expressed in insect cells under the control of the strong polihedrin
promoter.
Fig. 4.7 Cytotoxic effect of AHSV-2, AHSV-3 and AHSV-4 NS3 on insect cells. Sf9 cells were infected with wild-type (dotted line) baculovirus or recombinant baculoviruses expressing AHSV NS2 (■) AHSV-2 NS3 (▲) AHSV-3 NS3 (x) and AHSV-4 NS3 (□). Viability was monitored every 3 h for 48h by staining with Trypan blue and counting viable and non-viable cells.
4.3.5. Membrane association of AHSV-2, AHSV-3 and AHSV-4 NS3
A membrane flotation assay was carried out to analyse the association of AHSV-2, AHSV-3 and
AHSV-4 NS3 with the membranous components of the cell. Detergent-free lysates of Sf9 cells
infected with recombinant baculoviruses expressing AHSV-2, AHSV-3 and AHSV-4 NS3 were
loaded at the bottom of discontinuous sucrose gradients, with decreasing density towards the top
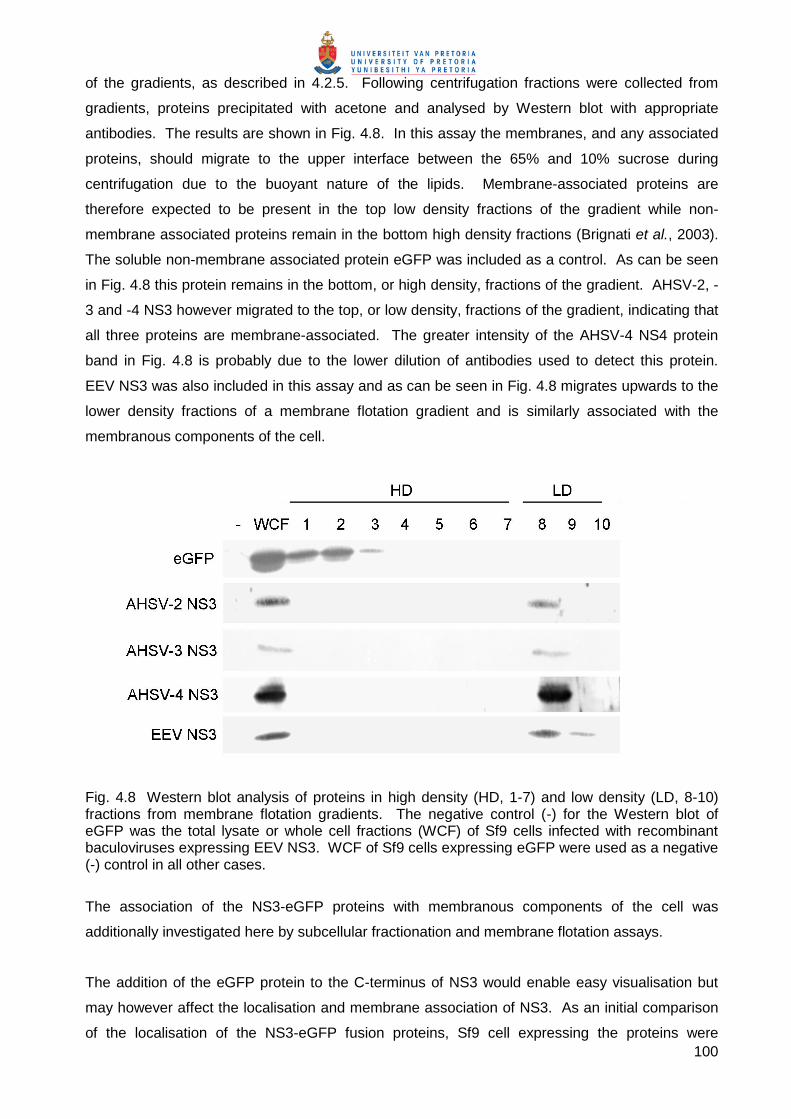
100
of the gradients, as described in 4.2.5. Following centrifugation fractions were collected from
gradients, proteins precipitated with acetone and analysed by Western blot with appropriate
antibodies. The results are shown in Fig. 4.8. In this assay the membranes, and any associated
proteins, should migrate to the upper interface between the 65% and 10% sucrose during
centrifugation due to the buoyant nature of the lipids. Membrane-associated proteins are
therefore expected to be present in the top low density fractions of the gradient while non-
membrane associated proteins remain in the bottom high density fractions (Brignati et al., 2003).
The soluble non-membrane associated protein eGFP was included as a control. As can be seen
in Fig. 4.8 this protein remains in the bottom, or high density, fractions of the gradient. AHSV-2, -
3 and -4 NS3 however migrated to the top, or low density, fractions of the gradient, indicating that
all three proteins are membrane-associated. The greater intensity of the AHSV-4 NS4 protein
band in Fig. 4.8 is probably due to the lower dilution of antibodies used to detect this protein.
EEV NS3 was also included in this assay and as can be seen in Fig. 4.8 migrates upwards to the
lower density fractions of a membrane flotation gradient and is similarly associated with the
membranous components of the cell.
Fig. 4.8 Western blot analysis of proteins in high density (HD, 1-7) and low density (LD, 8-10) fractions from membrane flotation gradients. The negative control (-) for the Western blot of eGFP was the total lysate or whole cell fractions (WCF) of Sf9 cells infected with recombinant baculoviruses expressing EEV NS3. WCF of Sf9 cells expressing eGFP were used as a negative (-) control in all other cases.
The association of the NS3-eGFP proteins with membranous components of the cell was
additionally investigated here by subcellular fractionation and membrane flotation assays.
The addition of the eGFP protein to the C-terminus of NS3 would enable easy visualisation but
may however affect the localisation and membrane association of NS3. As an initial comparison
of the localisation of the NS3-eGFP fusion proteins, Sf9 cell expressing the proteins were
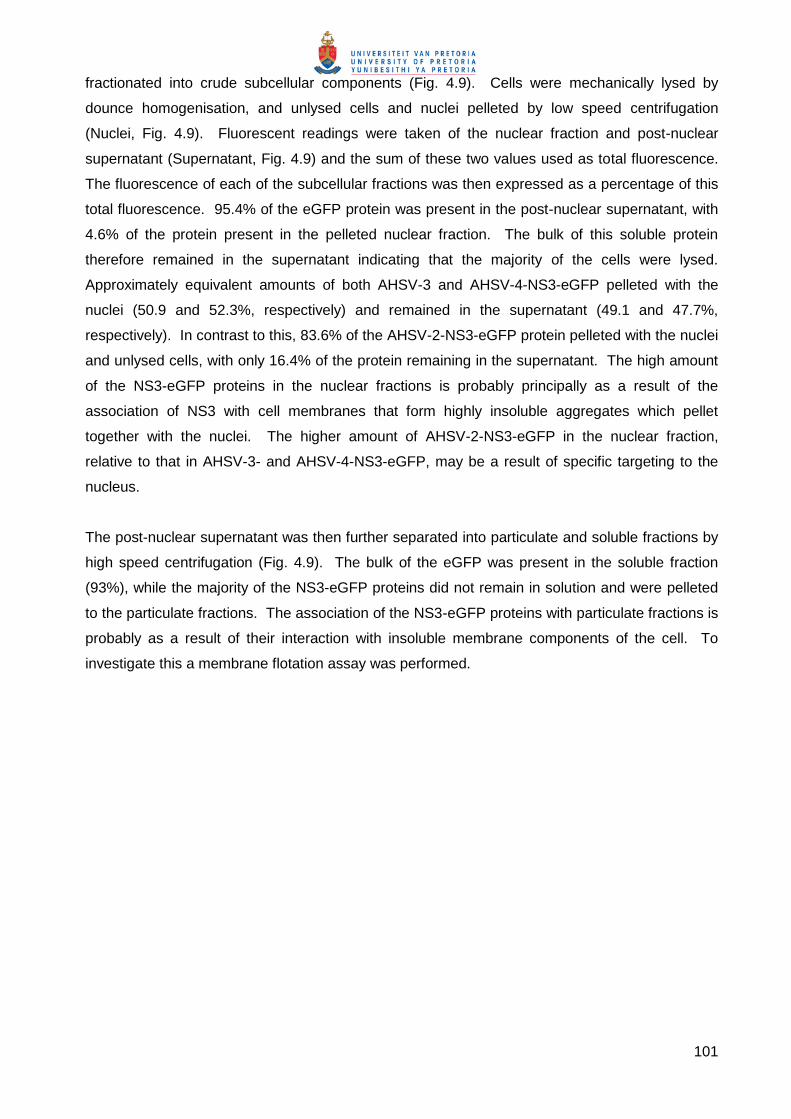
101
fractionated into crude subcellular components (Fig. 4.9). Cells were mechanically lysed by
dounce homogenisation, and unlysed cells and nuclei pelleted by low speed centrifugation
(Nuclei, Fig. 4.9). Fluorescent readings were taken of the nuclear fraction and post-nuclear
supernatant (Supernatant, Fig. 4.9) and the sum of these two values used as total fluorescence.
The fluorescence of each of the subcellular fractions was then expressed as a percentage of this
total fluorescence. 95.4% of the eGFP protein was present in the post-nuclear supernatant, with
4.6% of the protein present in the pelleted nuclear fraction. The bulk of this soluble protein
therefore remained in the supernatant indicating that the majority of the cells were lysed.
Approximately equivalent amounts of both AHSV-3 and AHSV-4-NS3-eGFP pelleted with the
nuclei (50.9 and 52.3%, respectively) and remained in the supernatant (49.1 and 47.7%,
respectively). In contrast to this, 83.6% of the AHSV-2-NS3-eGFP protein pelleted with the nuclei
and unlysed cells, with only 16.4% of the protein remaining in the supernatant. The high amount
of the NS3-eGFP proteins in the nuclear fractions is probably principally as a result of the
association of NS3 with cell membranes that form highly insoluble aggregates which pellet
together with the nuclei. The higher amount of AHSV-2-NS3-eGFP in the nuclear fraction,
relative to that in AHSV-3- and AHSV-4-NS3-eGFP, may be a result of specific targeting to the
nucleus.
The post-nuclear supernatant was then further separated into particulate and soluble fractions by
high speed centrifugation (Fig. 4.9). The bulk of the eGFP was present in the soluble fraction
(93%), while the majority of the NS3-eGFP proteins did not remain in solution and were pelleted
to the particulate fractions. The association of the NS3-eGFP proteins with particulate fractions is
probably as a result of their interaction with insoluble membrane components of the cell. To
investigate this a membrane flotation assay was performed.
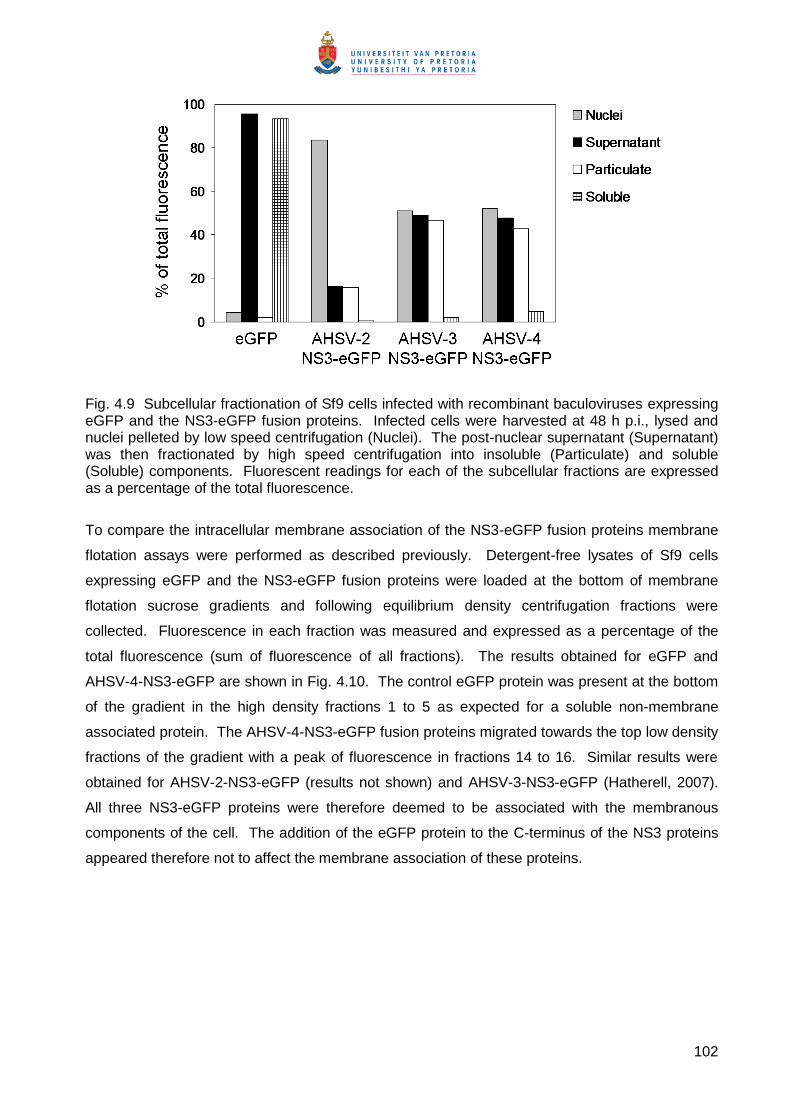
102
Fig. 4.9 Subcellular fractionation of Sf9 cells infected with recombinant baculoviruses expressing eGFP and the NS3-eGFP fusion proteins. Infected cells were harvested at 48 h p.i., lysed and nuclei pelleted by low speed centrifugation (Nuclei). The post-nuclear supernatant (Supernatant) was then fractionated by high speed centrifugation into insoluble (Particulate) and soluble (Soluble) components. Fluorescent readings for each of the subcellular fractions are expressed as a percentage of the total fluorescence.
To compare the intracellular membrane association of the NS3-eGFP fusion proteins membrane
flotation assays were performed as described previously. Detergent-free lysates of Sf9 cells
expressing eGFP and the NS3-eGFP fusion proteins were loaded at the bottom of membrane
flotation sucrose gradients and following equilibrium density centrifugation fractions were
collected. Fluorescence in each fraction was measured and expressed as a percentage of the
total fluorescence (sum of fluorescence of all fractions). The results obtained for eGFP and
AHSV-4-NS3-eGFP are shown in Fig. 4.10. The control eGFP protein was present at the bottom
of the gradient in the high density fractions 1 to 5 as expected for a soluble non-membrane
associated protein. The AHSV-4-NS3-eGFP fusion proteins migrated towards the top low density
fractions of the gradient with a peak of fluorescence in fractions 14 to 16. Similar results were
obtained for AHSV-2-NS3-eGFP (results not shown) and AHSV-3-NS3-eGFP (Hatherell, 2007).
All three NS3-eGFP proteins were therefore deemed to be associated with the membranous
components of the cell. The addition of the eGFP protein to the C-terminus of the NS3 proteins
appeared therefore not to affect the membrane association of these proteins.
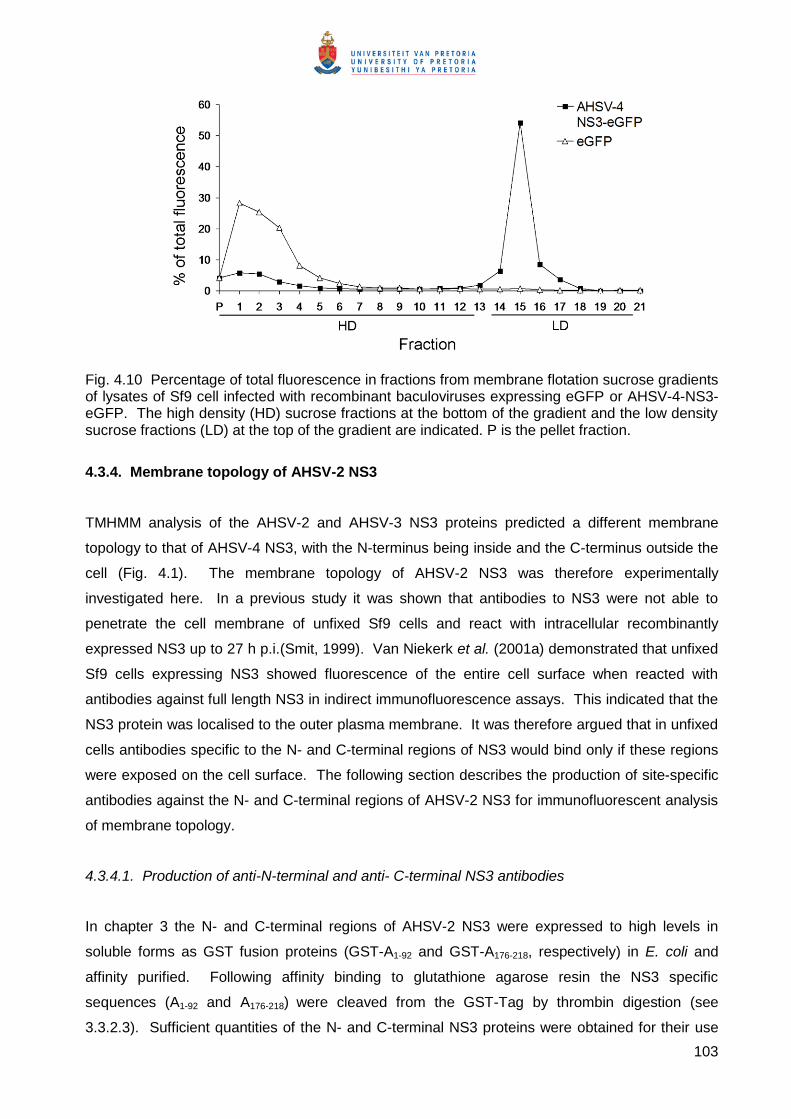
103
Fig. 4.10 Percentage of total fluorescence in fractions from membrane flotation sucrose gradients of lysates of Sf9 cell infected with recombinant baculoviruses expressing eGFP or AHSV-4-NS3-eGFP. The high density (HD) sucrose fractions at the bottom of the gradient and the low density sucrose fractions (LD) at the top of the gradient are indicated. P is the pellet fraction.
4.3.4. Membrane topology of AHSV-2 NS3
TMHMM analysis of the AHSV-2 and AHSV-3 NS3 proteins predicted a different membrane
topology to that of AHSV-4 NS3, with the N-terminus being inside and the C-terminus outside the
cell (Fig. 4.1). The membrane topology of AHSV-2 NS3 was therefore experimentally
investigated here. In a previous study it was shown that antibodies to NS3 were not able to
penetrate the cell membrane of unfixed Sf9 cells and react with intracellular recombinantly
expressed NS3 up to 27 h p.i.(Smit, 1999). Van Niekerk et al. (2001a) demonstrated that unfixed
Sf9 cells expressing NS3 showed fluorescence of the entire cell surface when reacted with
antibodies against full length NS3 in indirect immunofluorescence assays. This indicated that the
NS3 protein was localised to the outer plasma membrane. It was therefore argued that in unfixed
cells antibodies specific to the N- and C-terminal regions of NS3 would bind only if these regions
were exposed on the cell surface. The following section describes the production of site-specific
antibodies against the N- and C-terminal regions of AHSV-2 NS3 for immunofluorescent analysis
of membrane topology.
4.3.4.1. Production of anti-N-terminal and anti- C-terminal NS3 antibodies
In chapter 3 the N- and C-terminal regions of AHSV-2 NS3 were expressed to high levels in
soluble forms as GST fusion proteins (GST-A1-92 and GST-A176-218, respectively) in E. coli and
affinity purified. Following affinity binding to glutathione agarose resin the NS3 specific
sequences (A1-92 and A176-218) were cleaved from the GST-Tag by thrombin digestion (see
3.3.2.3). Sufficient quantities of the N- and C-terminal NS3 proteins were obtained for their use
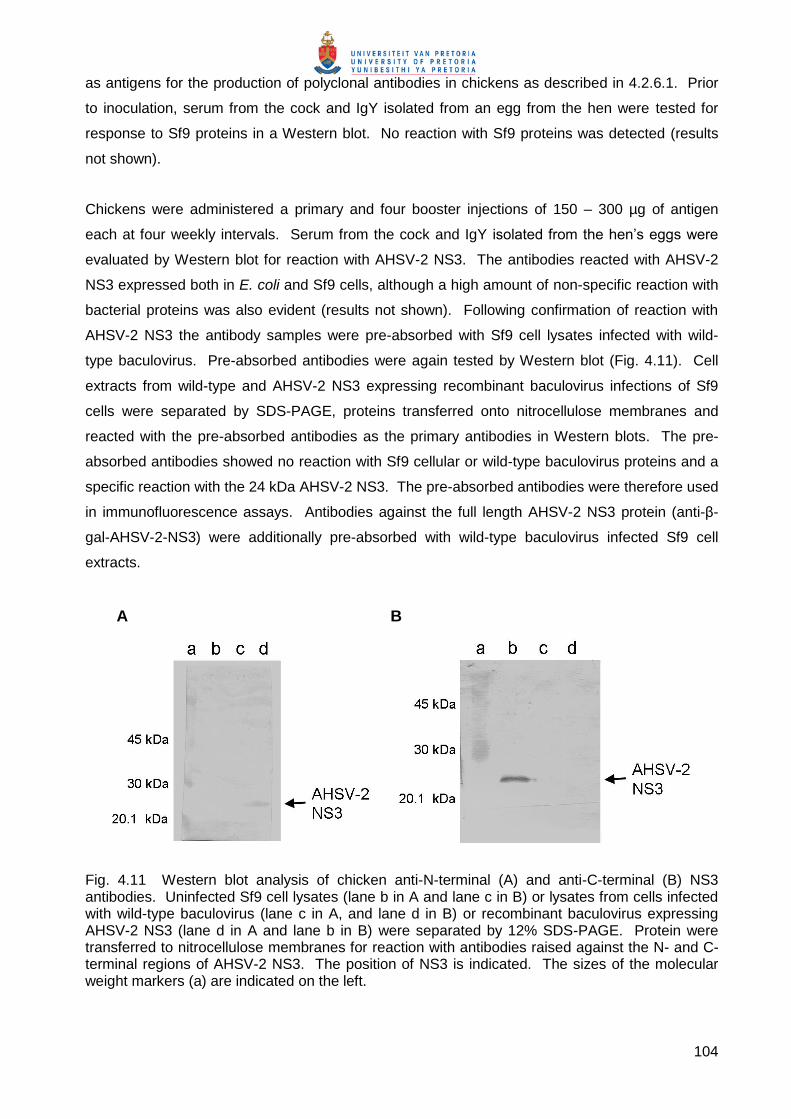
104
as antigens for the production of polyclonal antibodies in chickens as described in 4.2.6.1. Prior
to inoculation, serum from the cock and IgY isolated from an egg from the hen were tested for
response to Sf9 proteins in a Western blot. No reaction with Sf9 proteins was detected (results
not shown).
Chickens were administered a primary and four booster injections of 150 – 300 µg of antigen
each at four weekly intervals. Serum from the cock and IgY isolated from the hen’s eggs were
evaluated by Western blot for reaction with AHSV-2 NS3. The antibodies reacted with AHSV-2
NS3 expressed both in E. coli and Sf9 cells, although a high amount of non-specific reaction with
bacterial proteins was also evident (results not shown). Following confirmation of reaction with
AHSV-2 NS3 the antibody samples were pre-absorbed with Sf9 cell lysates infected with wild-
type baculovirus. Pre-absorbed antibodies were again tested by Western blot (Fig. 4.11). Cell
extracts from wild-type and AHSV-2 NS3 expressing recombinant baculovirus infections of Sf9
cells were separated by SDS-PAGE, proteins transferred onto nitrocellulose membranes and
reacted with the pre-absorbed antibodies as the primary antibodies in Western blots. The pre-
absorbed antibodies showed no reaction with Sf9 cellular or wild-type baculovirus proteins and a
specific reaction with the 24 kDa AHSV-2 NS3. The pre-absorbed antibodies were therefore used
in immunofluorescence assays. Antibodies against the full length AHSV-2 NS3 protein (anti-β-
gal-AHSV-2-NS3) were additionally pre-absorbed with wild-type baculovirus infected Sf9 cell
extracts.
A B
Fig. 4.11 Western blot analysis of chicken anti-N-terminal (A) and anti-C-terminal (B) NS3 antibodies. Uninfected Sf9 cell lysates (lane b in A and lane c in B) or lysates from cells infected with wild-type baculovirus (lane c in A, and lane d in B) or recombinant baculovirus expressing AHSV-2 NS3 (lane d in A and lane b in B) were separated by 12% SDS-PAGE. Protein were transferred to nitrocellulose membranes for reaction with antibodies raised against the N- and C-terminal regions of AHSV-2 NS3. The position of NS3 is indicated. The sizes of the molecular weight markers (a) are indicated on the left.
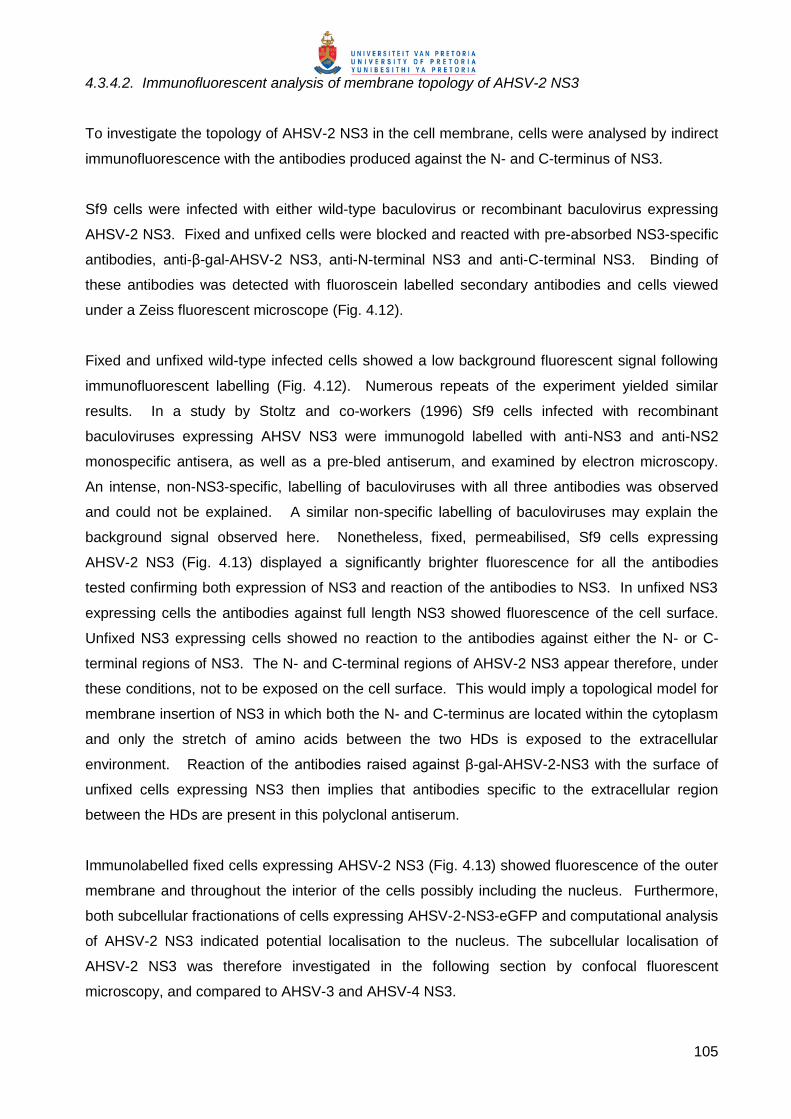
105
4.3.4.2. Immunofluorescent analysis of membrane topology of AHSV-2 NS3
To investigate the topology of AHSV-2 NS3 in the cell membrane, cells were analysed by indirect
immunofluorescence with the antibodies produced against the N- and C-terminus of NS3.
Sf9 cells were infected with either wild-type baculovirus or recombinant baculovirus expressing
AHSV-2 NS3. Fixed and unfixed cells were blocked and reacted with pre-absorbed NS3-specific
antibodies, anti-β-gal-AHSV-2 NS3, anti-N-terminal NS3 and anti-C-terminal NS3. Binding of
these antibodies was detected with fluoroscein labelled secondary antibodies and cells viewed
under a Zeiss fluorescent microscope (Fig. 4.12).
Fixed and unfixed wild-type infected cells showed a low background fluorescent signal following
immunofluorescent labelling (Fig. 4.12). Numerous repeats of the experiment yielded similar
results. In a study by Stoltz and co-workers (1996) Sf9 cells infected with recombinant
baculoviruses expressing AHSV NS3 were immunogold labelled with anti-NS3 and anti-NS2
monospecific antisera, as well as a pre-bled antiserum, and examined by electron microscopy.
An intense, non-NS3-specific, labelling of baculoviruses with all three antibodies was observed
and could not be explained. A similar non-specific labelling of baculoviruses may explain the
background signal observed here. Nonetheless, fixed, permeabilised, Sf9 cells expressing
AHSV-2 NS3 (Fig. 4.13) displayed a significantly brighter fluorescence for all the antibodies
tested confirming both expression of NS3 and reaction of the antibodies to NS3. In unfixed NS3
expressing cells the antibodies against full length NS3 showed fluorescence of the cell surface.
Unfixed NS3 expressing cells showed no reaction to the antibodies against either the N- or C-
terminal regions of NS3. The N- and C-terminal regions of AHSV-2 NS3 appear therefore, under
these conditions, not to be exposed on the cell surface. This would imply a topological model for
membrane insertion of NS3 in which both the N- and C-terminus are located within the cytoplasm
and only the stretch of amino acids between the two HDs is exposed to the extracellular
environment. Reaction of the antibodies raised against β-gal-AHSV-2-NS3 with the surface of
unfixed cells expressing NS3 then implies that antibodies specific to the extracellular region
between the HDs are present in this polyclonal antiserum.
Immunolabelled fixed cells expressing AHSV-2 NS3 (Fig. 4.13) showed fluorescence of the outer
membrane and throughout the interior of the cells possibly including the nucleus. Furthermore,
both subcellular fractionations of cells expressing AHSV-2-NS3-eGFP and computational analysis
of AHSV-2 NS3 indicated potential localisation to the nucleus. The subcellular localisation of
AHSV-2 NS3 was therefore investigated in the following section by confocal fluorescent
microscopy, and compared to AHSV-3 and AHSV-4 NS3.
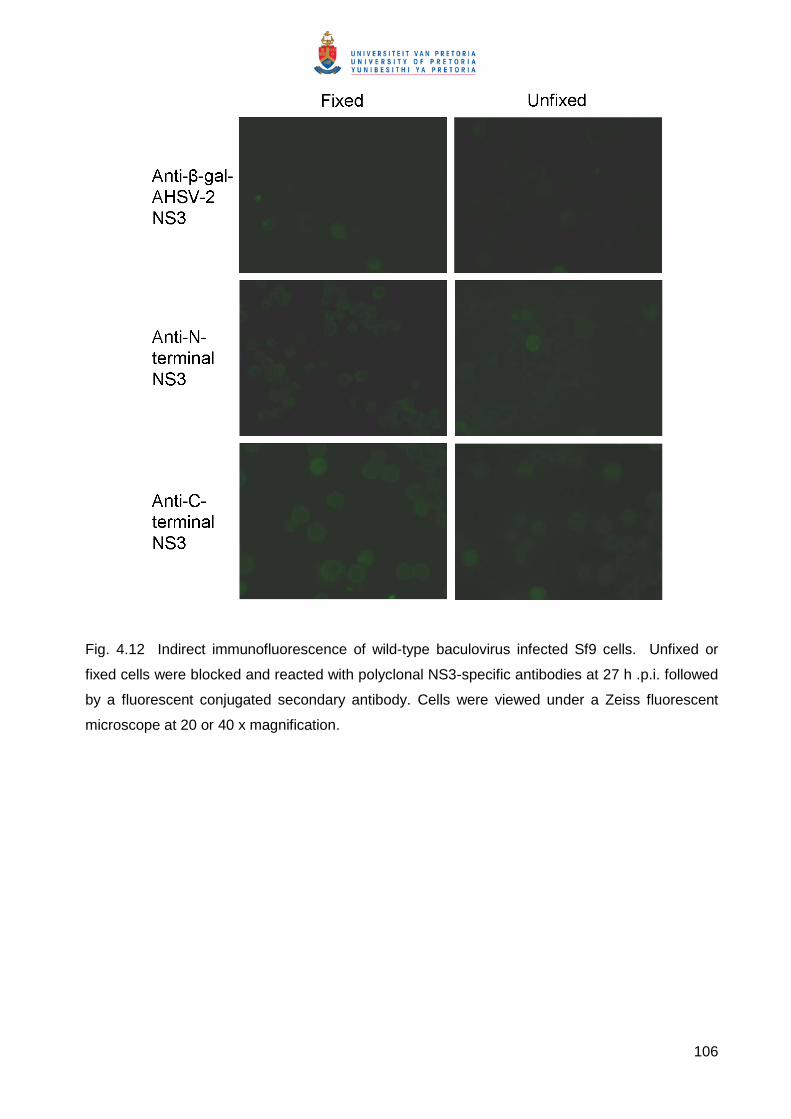
106
Fig. 4.12 Indirect immunofluorescence of wild-type baculovirus infected Sf9 cells. Unfixed or
fixed cells were blocked and reacted with polyclonal NS3-specific antibodies at 27 h .p.i. followed
by a fluorescent conjugated secondary antibody. Cells were viewed under a Zeiss fluorescent
microscope at 20 or 40 x magnification.
107
Fig. 4.13 Indirect immunofluorescence of Sf9 cells infected with recombinant baculoviruses
expressing AHSV-2 NS3. Unfixed or fixed cells were blocked and reacted with polyclonal NS3-
specific antibodies at 27 h .p.i. followed by a fluorescent conjugated secondary antibody. Cells
were viewed under a Zeiss fluorescent microscope at 20 or 40 x magnification.
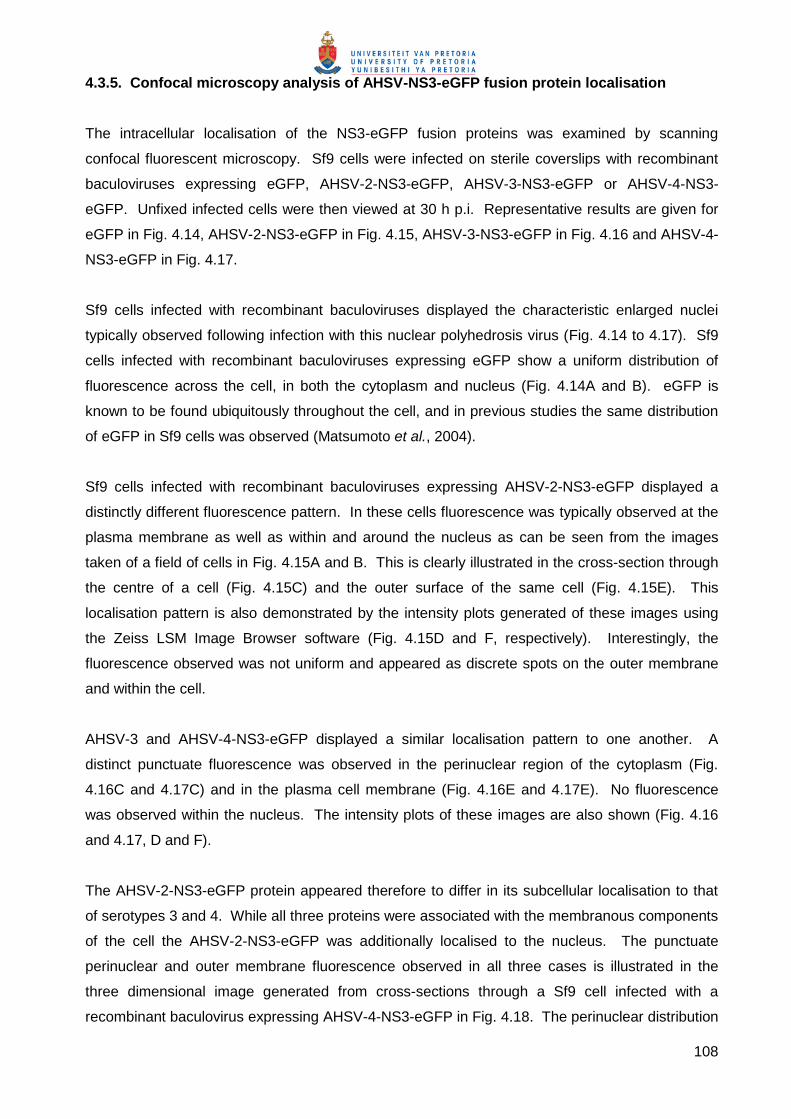
108
4.3.5. Confocal microscopy analysis of AHSV-NS3-eGFP fusion protein localisation
The intracellular localisation of the NS3-eGFP fusion proteins was examined by scanning
confocal fluorescent microscopy. Sf9 cells were infected on sterile coverslips with recombinant
baculoviruses expressing eGFP, AHSV-2-NS3-eGFP, AHSV-3-NS3-eGFP or AHSV-4-NS3-
eGFP. Unfixed infected cells were then viewed at 30 h p.i. Representative results are given for
eGFP in Fig. 4.14, AHSV-2-NS3-eGFP in Fig. 4.15, AHSV-3-NS3-eGFP in Fig. 4.16 and AHSV-4-
NS3-eGFP in Fig. 4.17.
Sf9 cells infected with recombinant baculoviruses displayed the characteristic enlarged nuclei
typically observed following infection with this nuclear polyhedrosis virus (Fig. 4.14 to 4.17). Sf9
cells infected with recombinant baculoviruses expressing eGFP show a uniform distribution of
fluorescence across the cell, in both the cytoplasm and nucleus (Fig. 4.14A and B). eGFP is
known to be found ubiquitously throughout the cell, and in previous studies the same distribution
of eGFP in Sf9 cells was observed (Matsumoto et al., 2004).
Sf9 cells infected with recombinant baculoviruses expressing AHSV-2-NS3-eGFP displayed a
distinctly different fluorescence pattern. In these cells fluorescence was typically observed at the
plasma membrane as well as within and around the nucleus as can be seen from the images
taken of a field of cells in Fig. 4.15A and B. This is clearly illustrated in the cross-section through
the centre of a cell (Fig. 4.15C) and the outer surface of the same cell (Fig. 4.15E). This
localisation pattern is also demonstrated by the intensity plots generated of these images using
the Zeiss LSM Image Browser software (Fig. 4.15D and F, respectively). Interestingly, the
fluorescence observed was not uniform and appeared as discrete spots on the outer membrane
and within the cell.
AHSV-3 and AHSV-4-NS3-eGFP displayed a similar localisation pattern to one another. A
distinct punctuate fluorescence was observed in the perinuclear region of the cytoplasm (Fig.
4.16C and 4.17C) and in the plasma cell membrane (Fig. 4.16E and 4.17E). No fluorescence
was observed within the nucleus. The intensity plots of these images are also shown (Fig. 4.16
and 4.17, D and F).
The AHSV-2-NS3-eGFP protein appeared therefore to differ in its subcellular localisation to that
of serotypes 3 and 4. While all three proteins were associated with the membranous components
of the cell the AHSV-2-NS3-eGFP was additionally localised to the nucleus. The punctuate
perinuclear and outer membrane fluorescence observed in all three cases is illustrated in the
three dimensional image generated from cross-sections through a Sf9 cell infected with a
recombinant baculovirus expressing AHSV-4-NS3-eGFP in Fig. 4.18. The perinuclear distribution
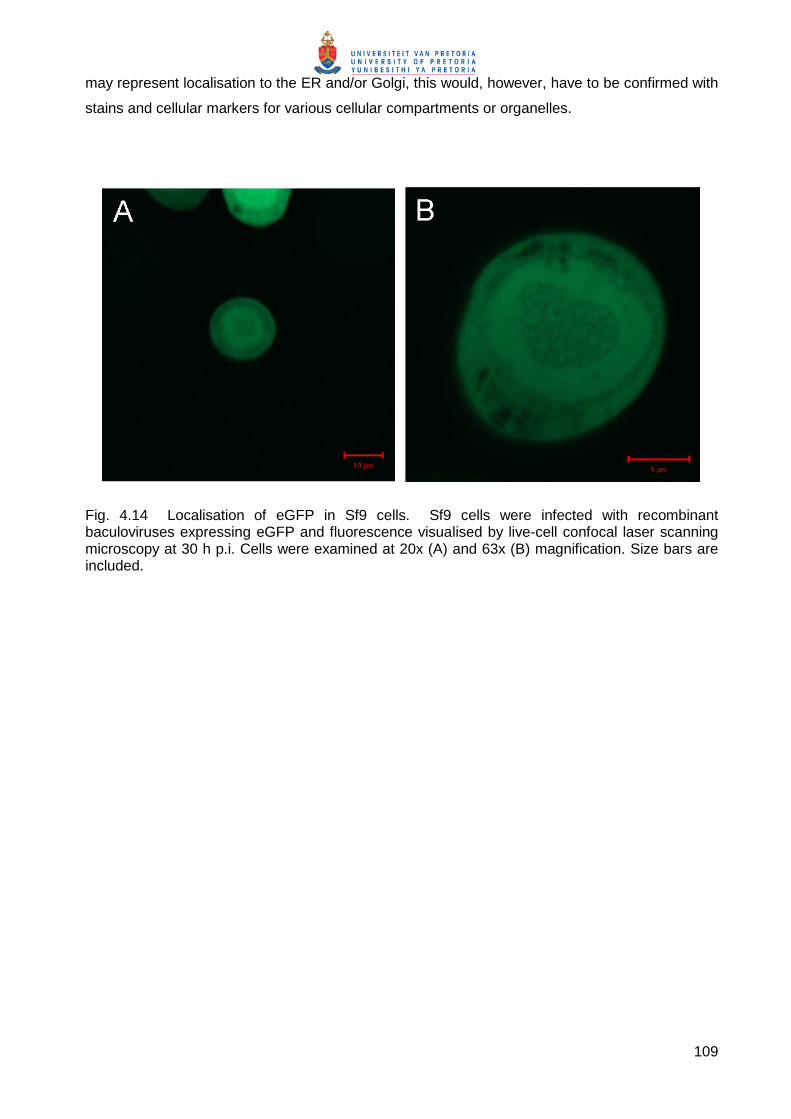
109
may represent localisation to the ER and/or Golgi, this would, however, have to be confirmed with
stains and cellular markers for various cellular compartments or organelles.
Fig. 4.14 Localisation of eGFP in Sf9 cells. Sf9 cells were infected with recombinant baculoviruses expressing eGFP and fluorescence visualised by live-cell confocal laser scanning microscopy at 30 h p.i. Cells were examined at 20x (A) and 63x (B) magnification. Size bars are included.
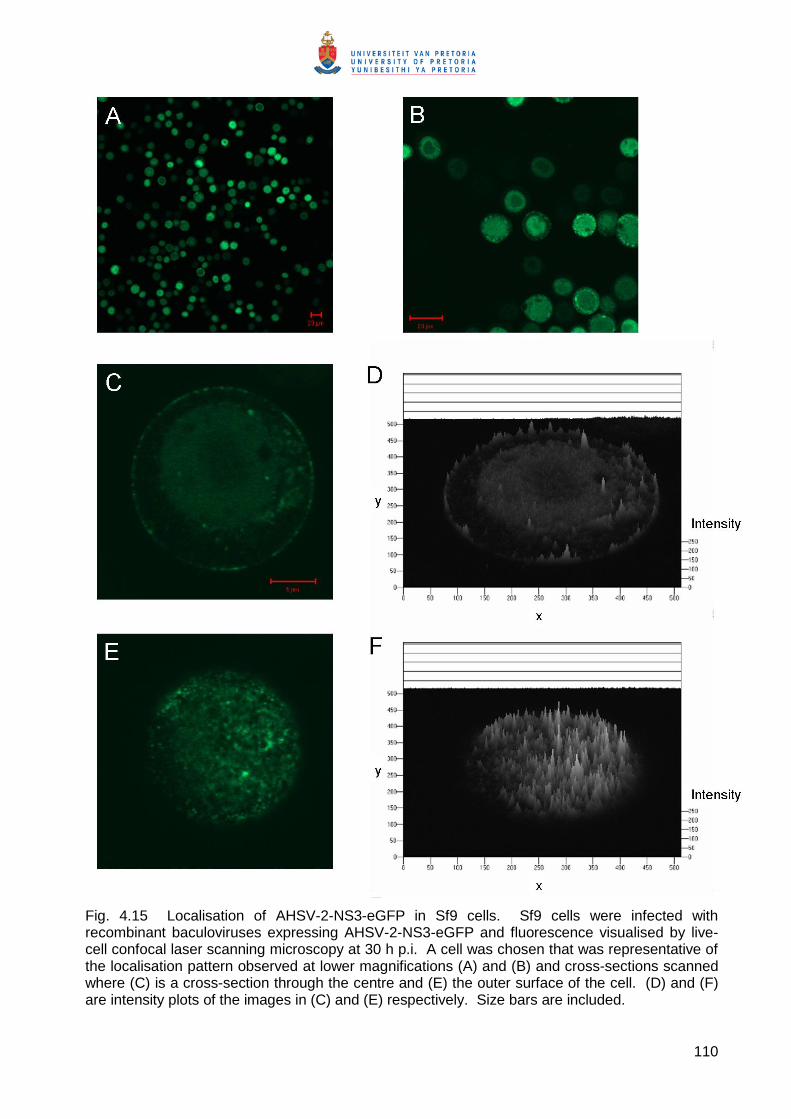
110
Fig. 4.15 Localisation of AHSV-2-NS3-eGFP in Sf9 cells. Sf9 cells were infected with recombinant baculoviruses expressing AHSV-2-NS3-eGFP and fluorescence visualised by live-cell confocal laser scanning microscopy at 30 h p.i. A cell was chosen that was representative of the localisation pattern observed at lower magnifications (A) and (B) and cross-sections scanned where (C) is a cross-section through the centre and (E) the outer surface of the cell. (D) and (F) are intensity plots of the images in (C) and (E) respectively. Size bars are included.
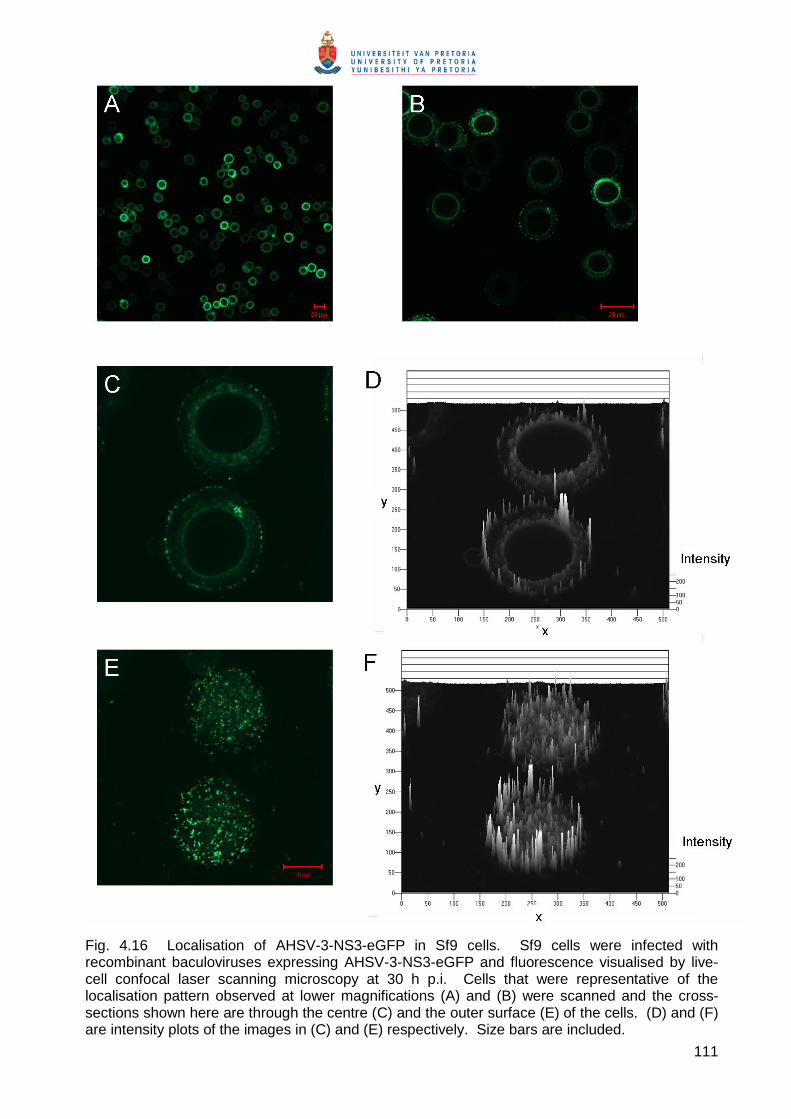
111
Fig. 4.16 Localisation of AHSV-3-NS3-eGFP in Sf9 cells. Sf9 cells were infected with recombinant baculoviruses expressing AHSV-3-NS3-eGFP and fluorescence visualised by live-cell confocal laser scanning microscopy at 30 h p.i. Cells that were representative of the localisation pattern observed at lower magnifications (A) and (B) were scanned and the cross-sections shown here are through the centre (C) and the outer surface (E) of the cells. (D) and (F) are intensity plots of the images in (C) and (E) respectively. Size bars are included.
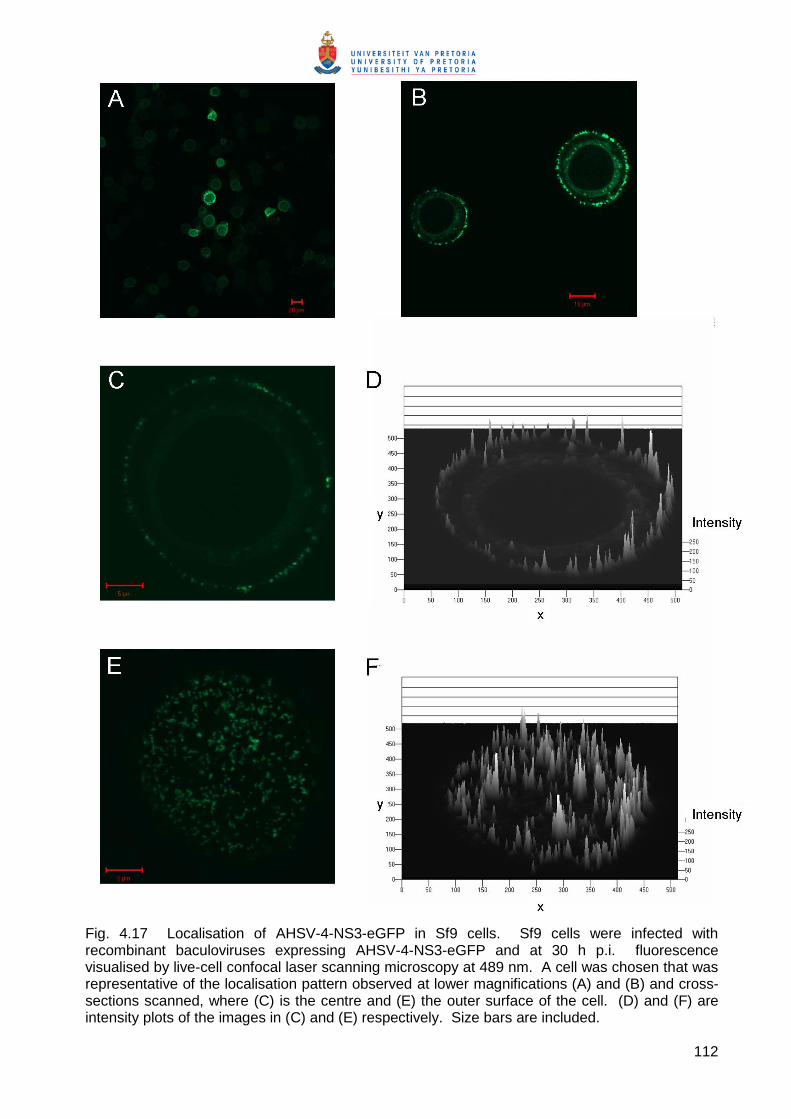
112
Fig. 4.17 Localisation of AHSV-4-NS3-eGFP in Sf9 cells. Sf9 cells were infected with recombinant baculoviruses expressing AHSV-4-NS3-eGFP and at 30 h p.i. fluorescence visualised by live-cell confocal laser scanning microscopy at 489 nm. A cell was chosen that was representative of the localisation pattern observed at lower magnifications (A) and (B) and cross-sections scanned, where (C) is the centre and (E) the outer surface of the cell. (D) and (F) are intensity plots of the images in (C) and (E) respectively. Size bars are included.
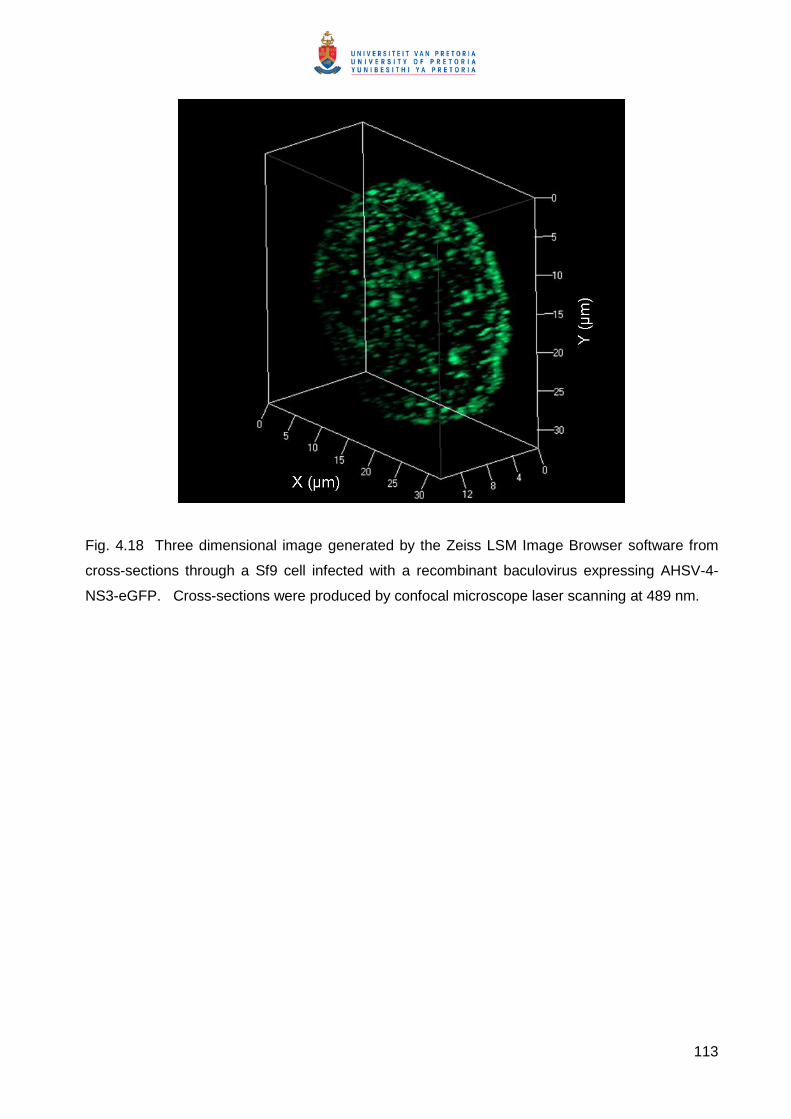
113
Fig. 4.18 Three dimensional image generated by the Zeiss LSM Image Browser software from
cross-sections through a Sf9 cell infected with a recombinant baculovirus expressing AHSV-4-
NS3-eGFP. Cross-sections were produced by confocal microscope laser scanning at 489 nm.
114
4.4. DISCUSSION
The central aim of this part of the study was to compare the γ, β, and α NS3 proteins encoded by
AHSV-2, AHSV-3 and AHSV-4, respectively. This was done to ascertain whether the high level
of variation in sequence between these NS3 proteins affected their structure or function in any
way. Differences may then relate to the phenotypic differences observed in the viruses encoding
these proteins in chapter 2.
As an initial means of comparing the NS3 proteins, amino acid sequence alignments were used
to determine the percentage identity within conserved regions. Two regions of low identity were
identified. The region between the first and second hydrophobic domains was found to have the
lowest percentage identity between the NS3 proteins (18.8%). Quan and co-workers (2008)
identified this region as being a highly variable hydrophilic region, under positive-selective
pressure. This may be explained by the fact that this region is extracellular and therefore under
immunological pressure. This variation is probably not significant in terms of structural and
functional differences between the proteins. The first hydrophobic domain (HDI) was found to
have the next lowest percentage identity (40.9%) between NS3 of the different serotypes. This
domain is predicted to be membrane-spanning in AHSV-3 NS3 (Van Staden et al., 1995) and
mutations in this region abolished both the outer membrane targeting and cytotoxicity of NS3 in
insect cells (Van Niekerk et al., 2001a). In this study it was shown that this hydrophobic domain,
together with HDII, is critical for membrane permeabilisation in E. coli. This variation may then
potentially be significant in determining structural and functional differences, by impacting, for
example, on the ability of this region to span the membrane. The amino acid sequences of the
NS3 proteins were therefore compared using predictive algorithms (such as TMHMM) to
determine the probability of the HDs forming transmembrane (TM) regions and the orientation of
the predicted TM regions in lipid bilayers.
TMHMM analysis of the NS3 amino acid sequences of AHSV-2, AHSV-3 and AHSV-4 revealed
interesting differences in both the membrane-spanning potential of the HDs and the orientation of
these regions in the membrane. HDI in all three amino acid sequences had a high probability of
spanning the membrane (approximately 1.0), while the probability of HDII forming TM regions
was variable (ranging from 0.3 to 0.8). In all three cases HDI was orientated in the lipid bilayer
such that the N-termini of the proteins would be cytoplasmically localised. Sequence differences
in HDI of the three serotypes of NS3 therefore probably do not impact on the ability to span the
membrane, and despite the variation, the overall nature of this region is hydrophobic in all three
cases. Predictions for HDII were both non-membrane and membrane spanning. Other predictive
algorithms, such as Phobius (http://www.cbs.dtu.dk/services/TMHMM-2.0/) or TMMOD
(liao.cis.udel.edu/website/servers/TMMOD/) give similar variable probabilities for the formation of
115
a TM region by HDII. The variation in the probability of this region spanning the membrane
impacted on the predicted orientation of this domain in the membrane. For the TMHMM analysis
performed here the AHSV-2 and AHSV-3 NS3 HDII domains were not predicted to span the
membrane with the result that the C-termini were located extracellularly. As the different
predictive algorithms use different cut-off points for the probabilities, other programs predict a
cytoplasmic localisation of the C-termini. These differences nonetheless raised several questions
with regard to the membrane association and topology of the three NS3 proteins, and the impact
this may have on the functions of the proteins, such as cytotoxicity. Several lines of investigation
were therefore used here to examine the membrane association, membrane topology and
cytotoxicity of the proteins as will be discussed later.
Further computational analysis of the NS3 proteins yielded an unexpected result. In the AHSV-2
(82/61) NS3 protein, used here as representative of the γ NS3 clade, a nuclear localisation signal
was identified. The presence of this NLS was unique to AHSV-2 (82/61) NS3 and was not
identified in other AHSV NS3 proteins, including that from other AHSV-2 strains. This prompted
investigations into the subcellular localisations of the NS3 proteins, the results of which are
outlined later in this discussion.
To investigate the significance, if any, of the potential differences revealed by computational
analyses of the α, β, and γ NS3 proteins, the proteins were expressed and compared in the
recombinant baculovirus expression system. As properties such as cytotoxicity and localisation
were to be investigated the proteins were expressed as both wild-type recombinants and as
eGFP fusions. Wild-type NS3 expressing recombinant baculoviruses were available and were
used to examine differences in membrane permeabilisation, cytotoxicity, membrane association
and membrane topology. Recombinant baculoviruses expressing AHSV-2 and AHSV-4 NS3 with
C-terminal eGFP fusions (a recombinant expressing AHSV-3 NS3 as an eGFP fusion was
available) were generated here and were used to examine the subcellular localisation of NS3.
The expression of the NS3 proteins in the baculovirus system was confirmed by Western blot with
antibodies specific to the AHSV-2, AHSV-3 and AHSV-4 NS3 proteins.
In chapter 2 it was shown that the membrane permeability of Vero cells infected with the parental
viruses encoding AHSV-2, AHSV-3 and AHSV-4 NS3 differed. As the membrane permeabilising
phenotype segregated with NS3 in reassortants, the effect of the AHSV-2, AHSV-3 and AHSV-4
NS3 proteins on Vero cell membrane permeability, in the absence of other AHSV proteins, was
investigated here. Ideally to investigate this the proteins would have to be expressed as
recombinants in these cells using a mammalian expression system. We however decided that for
initial comparisons the NS3 proteins expressed in insect cells would be added to the extracellular
media of healthy Vero cells and their effect on membrane permeability monitored. Similar
116
experiments using the exogenous addition of proteins to cells to study their membrane
permeabilising capabilities are reported in the literature. For example, in a study by Madan et al.
(2007) a synthetic soluble peptide representing the amino-terminal TM region of the picornavirus
viroporin 2B was shown to produce the same permeabilisation effect when added exogenously to
BHK cell monolayers as is observed during infection with picornavirus. This peptide, termed P3,
was shown to insert into lipid bilayers and was located at the cell plasma membrane. In a similar
peptide-based approach it was shown that extracellular 2B peptides had antimicrobial and
antihaemolytic activities (Sánchez-Martínez et al., 2008).
In this study the NS3 proteins were expressed in insect cells, crude lysates prepared and added
exogenously to Vero cell monolayers. Membrane permeability was then monitored using a Hyg B
assay and compared to cells treated with lysates from Sf9 cells infected with wild-type
recombinant baculovirus. AHSV NS3, in the absence of other AHSV proteins, was shown to
increase the permeability of Vero cell membranes, relative to wild-type lysate treated cells.
Incubation in the presence of AHSV-2 NS3 resulted in the highest levels of membrane
permeabilisation followed by AHSV-3, and then AHSV-4 NS3. This shows some similarity to the
relative membrane permeabilisation levels of Vero cells infected with the different strains of
AHSV, where AHSV-2 (or reassortants containing NS3 originating from AHSV-2) caused the
greatest increase in permeability, followed by AHSV-3, and AHSV-4 had the least effect (see
Table 2.5). This lends support to our hypothesis that different forms of AHSV NS3, originating
from either the α, β or γ phylogenetic group, can differentially influence the membrane
permeability of host cells. These differences may potentially be due to a variety of factors that
affect the membrane association, stability within the membrane and levels of permeabilisation
activity of the proteins, for example variation in the TM regions, degree of myristylation and
stretches of positively charged amino acids. Crude lysates were used here as the AHSV NS3
proteins have never successfully been purified in a biologically active and soluble form. Further
studies of the extracellular permeabilising effect of AHSV NS3 are complicated by the difficulties
in purifying this protein as it is cytotoxic, expressed to low levels and highly insoluble. A similar
peptide based approach as that discussed above for picornavirus 2B (Madan et al., 2007;
Sánchez-Martínez et al., 2008), would therefore have to be used.
This assay also raises the question as to whether there is a soluble form of NS3 in the cell lysates
that mediates the membrane permeabilising effect on Vero cells. In studies of rotavirus NSP4
two secreted forms of the protein have been identified, one is a soluble form of the protein which
results from posttranslational modifications of NSP4 (Bugarcic & Taylor, 2006) and the other a
small cleavage product of NSP4 (Zhang et al., 2000). The 66 amino acid cleavage product of
NSP4 has been shown to have enterotoxigenic properties (Zhang et al., 2000). These forms are
117
proposed to mediate the diarrhoea inducing enterotoxic effect of NSP4 (Bugarcic & Taylor,
2006). The possibility of secreted and/or soluble forms of AHSV NS3 remains to be investigated.
As the α, β and γ NS3 proteins differed in their membrane permeabilising effect on Vero cells, we
then examined the endogenous cytotoxic effect on insect cells expressing AHSV-2, AHSV-3 and
AHSV-4 NS3 for differences. The viability of infected cells was monitored using a Trypan blue
assay and all three proteins were found to cause an equivalently rapid and significant decline in
cell viability. This cytotoxicity implies that all three proteins are membrane associated. This was
investigated by discontinuous sucrose gradient centrifugation (or membrane flotation gradients) of
lysates from cells infected with the recombinant baculoviruses. This method has been used to
confirm the membrane association of a number of viral proteins including Dengue virus NS4B
(Miller et al., 2006) and influenza B virus BM2 protein (Paterson et al., 2003). All three AHSV
NS3 proteins were shown to be associated with the membranous components of the cell. The
EEV NS3 protein was included in these assays and also shown to be membrane associated.
This substantiates computer predictions of transmembrane regions within the protein and the
finding that this protein has membrane permeabilising activity in bacterial cells (see chapter 3).
The finding that the NS3 proteins differed in their permeabilising effect on Vero cells but not in Sf9
cells highlights the importance of the target membrane in different assays. A similar finding was
discussed in chapter 3 when comparing results from bacterial and insect cells. When compared
to mammalian cells Sf9 cells have lower levels of sphingomyelin, higher levels of
phosphatidylethanolamine and a lower cholesterol to phospholipid ratio (Marheineke et al., 1998).
The high cytotoxicity of NS3 in Sf9 cells may also be due to the higher level of expression of the
protein (compared to levels observed in AHSV infected cells) under the control of the strong
baculovirus polihedrin promoter. Studies of rotavirus NSP4 indicate that both cell type and
context of expression affect the distribution of NSP4 (Bugarcic & Taylor, 2006). Extrapolations of
findings in different cell systems should therefore be made with caution. It would be of interest to
study the effect of endogenously expressed recombinant AHSV-2, AHSV-3 and AHSV-4 NS3 in
mammalian cells.
TMHMM analyses of AHSV-4 NS3 predicted a double membrane-spanning topology, with both
the N- and C-terminal regions of the protein located within the cytoplasm. In AHSV-2 and -3 NS3,
however, only HDI was predicted to transverse the membrane with the result that the N-terminal
is intracellular while the C-terminal is exposed on the surface of the cell. The N terminus of HCV
NS4B has been reported to assume dual TM topology, with distinct functions on each side of the
ER membrane (Lundin et al., 2003). The hepatitis B virus surface L glycoprotein can act in virus
assembly as a matrix-like protein and in virus entry as a receptor-binding protein by adopting
different membrane topologies (Lambert & Prange, 2001). The Newcastle disease fusion protein
118
exists in two topological forms with respect to membranes, one of which has been proposed to be
involved in cell-to-cell fusion (McGinnes et al., 2003).
In this study we experimentally elucidated the membrane topology of NS3 using antibodies
specific to the N- and C-terminus of the protein and examining the binding to fixed and unfixed
(i.e. permeabilised and unpermeabilised) cells expressing NS3. Similar antibody based
approaches have been used in to determine the topology of a number of viral membrane proteins,
such as the E2p7 protein of hepatitis C virus (Isherwood & Patel, 2005), the BM2 protein of
Influenza B virus (Paterson et al., 2003) and gp41 of HIV-1 (Cheung et al., 2005), and non-viral
membrane proteins such as Nox 2 (Paclet et al., 2004). In HIV-1 infected C8 166 cells and HeLa
cells expressing recombinant gp41 it was shown, using an array of antibodies, that the C-terminal
tail of gp41 is exposed on the cell surface (Cheung et al., 2005). Antibodies to the N-terminal
region of Nox 2 were shown to bind differentiated cell HL60 cells only after permeabilisation,
indicating that the N-terminus of Nox 2 is cytoplasmically orientated (Paclet et al., 2004).
For the production of site-specific antibodies, the N- and C-terminal regions of AHSV-2 NS3 were
expressed as Glutathione S-tranferase (GST) fusion proteins in an inducible prokaryotic
expression system (see chapter 3, 3.3.2.3.). Both the N- terminal and C-terminus fusion proteins
were found to be expressed to high levels in a soluble form and were therefore suitable for affinity
purification. Following binding of the GST-Tag to its substrate (glutathione bound to agarose
resin) the NS3 peptides were cleaved from the GST-Tag using thrombin. Antibodies against
these peptides were raised in chickens and shown to react with AHSV-2 NS3 in Western blots.
These antibodies were then used in indirect immunofluorescent studies of fixed and unfixed Sf9
cells expressing AHSV-2 NS3. Polyclonal antibodies against full length NS3 were used as a
positive control. Binding was detected with a FITC conjugated secondary antibody and cells
viewed under a fluorescent microscope. In fixed cells binding of both the NS3 N- and C-terminal
specific antibodies, as well as those directed against full length NS3, was observed. This
confirmed both the expression of NS3 in these cells and the binding of the antibodies to NS3. In
unfixed cells neither the NS3 N-terminal nor C-terminal specific antibodies bound, while
antibodies against full length NS3 were detected on the cellular membrane. Neither the N- or C-
terminal regions of AHSV-2 NS3 appeared therefore to be exposed on the surface of these cells.
This finding supports the computer-based topology predicted for AHSV NS3 by van Staden and
coworkers (1995) with both hydrophobic domains forming transmembrane regions with the N- and
C-termini cytoplasmically orientated. This model of NS3 should further our understanding of the
mechanism of AHSV NS3-mediated virus release. The location of the N- and C-terminal regions
in the cytoplasm may allow for their interaction with proteins in the cytoplasm, such as membrane
trafficking proteins and proteins within the virus particle. A similar model has been experimentally
119
substantiated for BTV NS3 (Bansal et al., 1998). In BTV NS3 it has been shown that the N-
terminal region interacts with the cellular release factors, p11 and Tsg101 (Beaton et al., 2002;
Wirblich et al., 2006), while the C-terminal region interacts with the outer capsid protein VP2
(Beaton et al., 2002). BTV NS3 additionally binds to VP5, although the domain responsible has
not been elucidated (Bhattacharya & Roy, 2008). The interactions between NS3 and these
proteins form the basis for the model proposed of the NS3 mediated release of BTV from infected
cells (Roy, 2008).
The subcellular localisation of the α, β and γ NS3 proteins in Sf9 cells was further examined here
by fluorescent microscopic analysis of the proteins expressed as eGFP fusions. Using
membrane flotation assays it was shown that these fusion proteins associated with the
membranous components of the cell analogous to the wild-type NS3 proteins. The addition of the
eGFP protein to the C-terminus of NS3 did not therefore influence the membrane association of
the protein and the localisation of the NS3-eGFP fusion proteins should therefore be
representative of wild-type NS3 localisation. The addition of the eGFP protein to NS3 allowed for
direct fluorescent imaging of NS3 in live unfixed cells. Laser scanning confocal fluorescence
microscopy was used to examine the localisation of the proteins within insect cells.
All three NS3-eGFP proteins were detected at the plasma membrane of cells as discrete foci of
fluorescence. This concurs with previous immunofluorescent localisation studies in Sf9 cells,
where NS3 was found to be associated with the outer membrane in unfixed cells (Van Niekerk et
al., 2001a). Cells displayed a uniform or homogenous fluorescence of the cell surface in contrast
to the distinct areas of bright fluorescence observed here. This may represent localisation to
specific domains within the cell membrane, such as lipid rafts. Both rotavirus NSP4 (Storey et al.,
2007) and BTV NS3 (Bhattacharya & Roy, 2008) have been shown to associate with lipid rafts,
and this interaction may be important in the final assembly of progeny virions as well as transport
and release of the virus from the cell.
A distinct punctuate perinuclear fluorescence was also observed for all three NS3-eGFP fusion
proteins in Sf9 cells. This may represent localisation to the internal membrane systems within the
cell, i.e. the ER, the ER-Golgi intermediate compartment (ERGIC) and/or the Golgi apparatus.
The majority of eukaryotic integral membrane proteins are cotranslationally inserted into the ER
membrane. The ER then serves as a gateway for proteins where they may then be targeted to
particular cellular membranes, including all the compartments of the secretory pathway and the
plasma membrane.
Studies of the localisation of viroporins have shown that the majority of the protein in cells resides
intracellularly in the membranes of the ER, ERGIC and/or Golgi, while only a small amount can
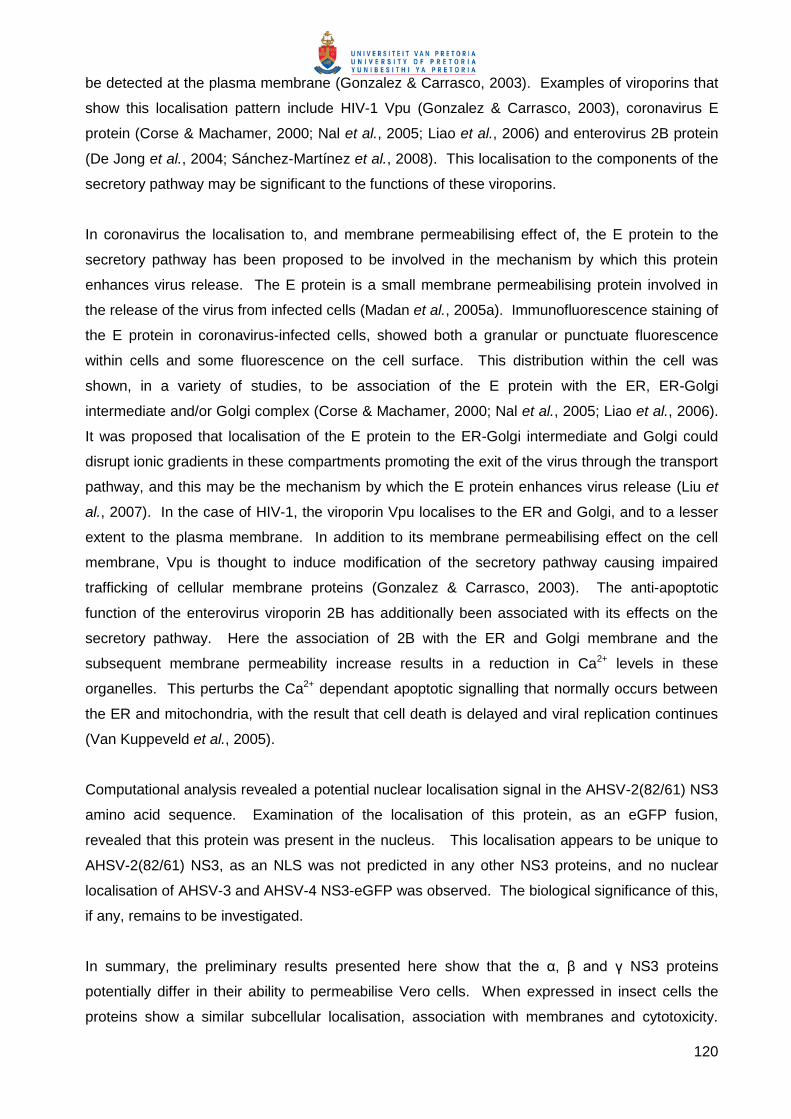
120
be detected at the plasma membrane (Gonzalez & Carrasco, 2003). Examples of viroporins that
show this localisation pattern include HIV-1 Vpu (Gonzalez & Carrasco, 2003), coronavirus E
protein (Corse & Machamer, 2000; Nal et al., 2005; Liao et al., 2006) and enterovirus 2B protein
(De Jong et al., 2004; Sánchez-Martínez et al., 2008). This localisation to the components of the
secretory pathway may be significant to the functions of these viroporins.
In coronavirus the localisation to, and membrane permeabilising effect of, the E protein to the
secretory pathway has been proposed to be involved in the mechanism by which this protein
enhances virus release. The E protein is a small membrane permeabilising protein involved in
the release of the virus from infected cells (Madan et al., 2005a). Immunofluorescence staining of
the E protein in coronavirus-infected cells, showed both a granular or punctuate fluorescence
within cells and some fluorescence on the cell surface. This distribution within the cell was
shown, in a variety of studies, to be association of the E protein with the ER, ER-Golgi
intermediate and/or Golgi complex (Corse & Machamer, 2000; Nal et al., 2005; Liao et al., 2006).
It was proposed that localisation of the E protein to the ER-Golgi intermediate and Golgi could
disrupt ionic gradients in these compartments promoting the exit of the virus through the transport
pathway, and this may be the mechanism by which the E protein enhances virus release (Liu et
al., 2007). In the case of HIV-1, the viroporin Vpu localises to the ER and Golgi, and to a lesser
extent to the plasma membrane. In addition to its membrane permeabilising effect on the cell
membrane, Vpu is thought to induce modification of the secretory pathway causing impaired
trafficking of cellular membrane proteins (Gonzalez & Carrasco, 2003). The anti-apoptotic
function of the enterovirus viroporin 2B has additionally been associated with its effects on the
secretory pathway. Here the association of 2B with the ER and Golgi membrane and the
subsequent membrane permeability increase results in a reduction in Ca2+ levels in these
organelles. This perturbs the Ca2+ dependant apoptotic signalling that normally occurs between
the ER and mitochondria, with the result that cell death is delayed and viral replication continues
(Van Kuppeveld et al., 2005).
Computational analysis revealed a potential nuclear localisation signal in the AHSV-2(82/61) NS3
amino acid sequence. Examination of the localisation of this protein, as an eGFP fusion,
revealed that this protein was present in the nucleus. This localisation appears to be unique to
AHSV-2(82/61) NS3, as an NLS was not predicted in any other NS3 proteins, and no nuclear
localisation of AHSV-3 and AHSV-4 NS3-eGFP was observed. The biological significance of this,
if any, remains to be investigated.
In summary, the preliminary results presented here show that the α, β and γ NS3 proteins
potentially differ in their ability to permeabilise Vero cells. When expressed in insect cells the
proteins show a similar subcellular localisation, association with membranes and cytotoxicity.
121
Although no significant differences between the recombinant α, β and γ NS3 proteins in insect
cells could be identified, the findings presented here should form a good starting point for more
detailed investigations. Of particular interest would be the potential association of NS3 with the
secretory pathway, and association of the N- and C-terminal regions of NS3 with other viral
proteins. This should then further our understanding of the role of NS3 in virus induced
membrane permeabilisation and virus release.