Embed Size (px)
Citation preview

Role of aerobic metabolism in sprint
swimmingEnhancing performance
Dr Jamie Pringle; Dr Mike PeyrebruneEnglish Institute of Sport, Loughborough

Physiological description
Differences between
individuals
Potential to enhance it?
Long v short course differences
Aerobic/efficiency interactions
Disproportional high volume of training
Optimising warm-up
Examples from the research
Sprint v endurance trained
Fitness status
Examples from other sports

Sprinting Definition• Olympic events
• 50m Free & 100m events
• Long Course vs. Short Course
• Duration- 22 to 26 s- 48 to 70 s
• Further adjustments for juniors & sub-elite level

Physiological Physiological descriptiondescription

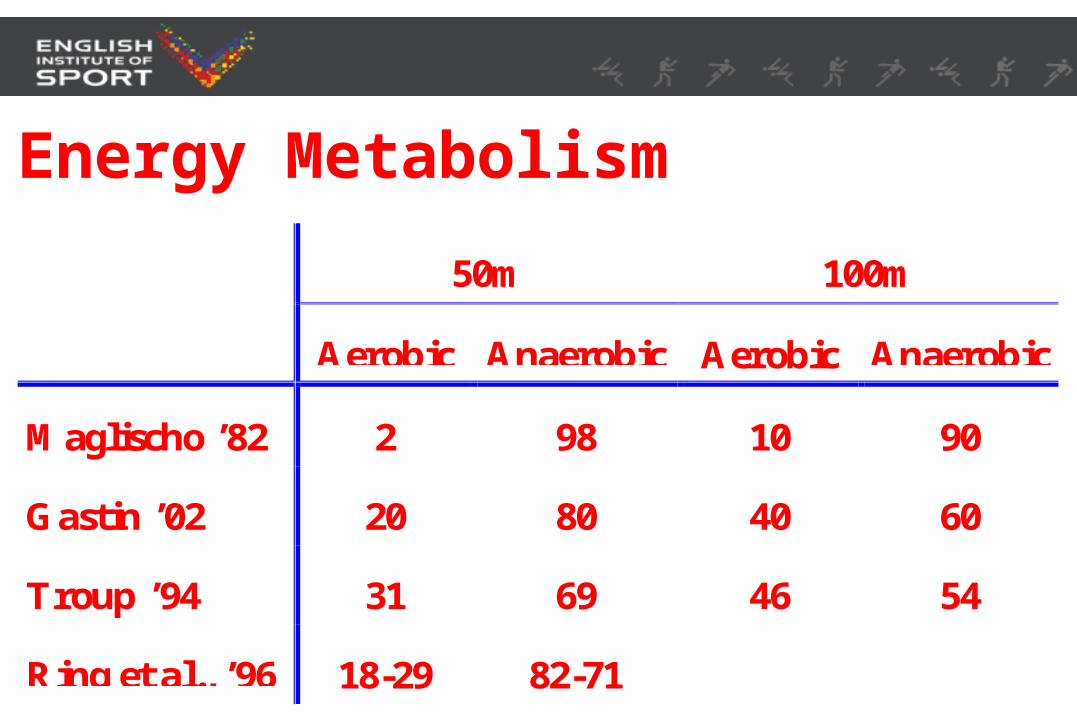
50m 100m
Aerobic Anaerobic Aerobic Anaerobic
Maglischo ’82 2 98 10 90
Gastin ’02 20 80 40 60
Troup ’94 31 69 46 54
Ring et al., ’96 18-29 82-71
Energy Metabolism

From Gastin (2001). Energy System Interaction and Relative Contribution During Maximal Exercise. Sports. Med. 31:725-741
88 73 6355 4944 37 27 21
12 27 3745 5156 63 73 79AEROBIC %
ANAEROBIC %
Review of 30+ studies
Considerably larger aerobic component than previously understood
74.0
26.0
39.6
60.4
0102030405060708090
100
En
erg
y
Con
trib
uti
on (
%)
50m 100m
Distance
Anaerobic Contribution Aerobic Contribution

Differences Differences between between
individualsindividuals

FASTER VO2 KINETICSDECREASES O2
DEFICIT
Cardiac patient or very unfitSedentary
Endurance trained
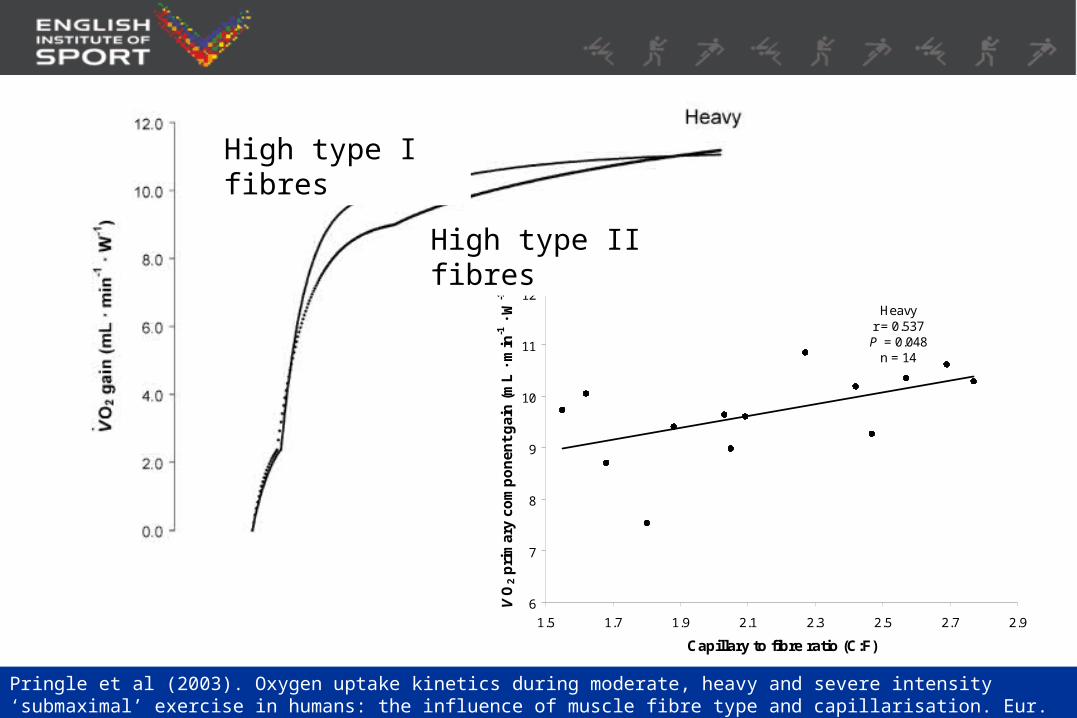
Pringle et al (2003). Oxygen uptake kinetics during moderate, heavy and severe intensity ‘submaximal’ exercise in humans: the influence of muscle fibre type and capillarisation. Eur. J. Appl. Physiol., Vol. 89, pp. 289-290
Heavyr = 0.537 P = 0.048
n = 14
6
7
8
9
10
11
12
1.5 1.7 1.9 2.1 2.3 2.5 2.7 2.9
Capillary to fibre ratio (C:F)
VO
2 p
rim
ary
com
po
nen
t g
ain
(m
L ·
min
-1 ·
W-1
)
.
High type I fibres
High type II fibres

Potential for Potential for enhancement?enhancement?

0
100
200
300
400
500
600
700
Time (s)
Pow
er (W
)
0
100
200
300
400
500
600
700
Time (s)
Pow
er (W
)
0
100
200
300
400
500
600
700
Time (s)
Pow
er (W
)
Anaerobic
Aerobic
Anaerobic work capacity (AWC) and oxygen use – all-out
55% anaerobic
45% aerobic
60 s race

0
100
200
300
400
500
600
700
Time (s)
Pow
er (W
)
Anaerobic
Aerobic
VO2 kinetics
0
100
200
300
400
500
600
700
Time (s)
Pow
er (W
)
Anaerobic
Aerobic
0
100
200
300
400
500
600
700
Time (s)
Pow
er (W
)
0
100
200
300
400
500
600
700
Time (s)
Pow
er (W
)
Anaerobic
Aerobic
The speed at which VO2 rises
0
500
1000
1500
2000
2500
3000
3500
4000
4500
0 30 60 90 120 150 180
Time (s)
VO
2 (
mL
/min
)

0
500
1000
1500
2000
2500
3000
3500
4000
4500
5000
-2 -1 0 1 2 3 4 5 6 7 8 9 10 11 12 13 14 15
Carter, Pringle, Barstow, Doust (2006). Int. J. Sports Med., Vol. 27, pp. 149-157
0
500
1000
1500
2000
2500
3000
3500
4000
4500
5000
-2 -1 0 1 2 3 4 5 6 7 8 9 10 11 12 13 14 15
aerobicaerobic
OO22 deficit deficit
110% VO2 max
2:20 ± 0:06 min:s
100% VO2 max
5:13 ± 0:50 min:s 9:48 ± 0:47 min:s
~95% VO2 max
Total O2 used: 6 L
Total O2 required: 20 L
O2 deficit: 14 L
Total O2 used: 15 L
Total O2 required: 29 L
O2 deficit: 14 L
Total O2 used: 31 L
Total O2 required: 36 L
O2 deficit: 15 L
OO22 deficit deficitOO22 deficit deficit
0
500
1000
1500
2000
2500
3000
3500
4000
4500
5000
-2 -1 0 1 2 3 4 5 6 7 8 9 10 11 12 13 14 15
Time (s)
-120 -60 0 60 120 180 240 300 360
VO
2 (
L.m
in-1
)
0.0
0.5
1.0
1.5
2.0
2.5
3.0
3.5
4.0
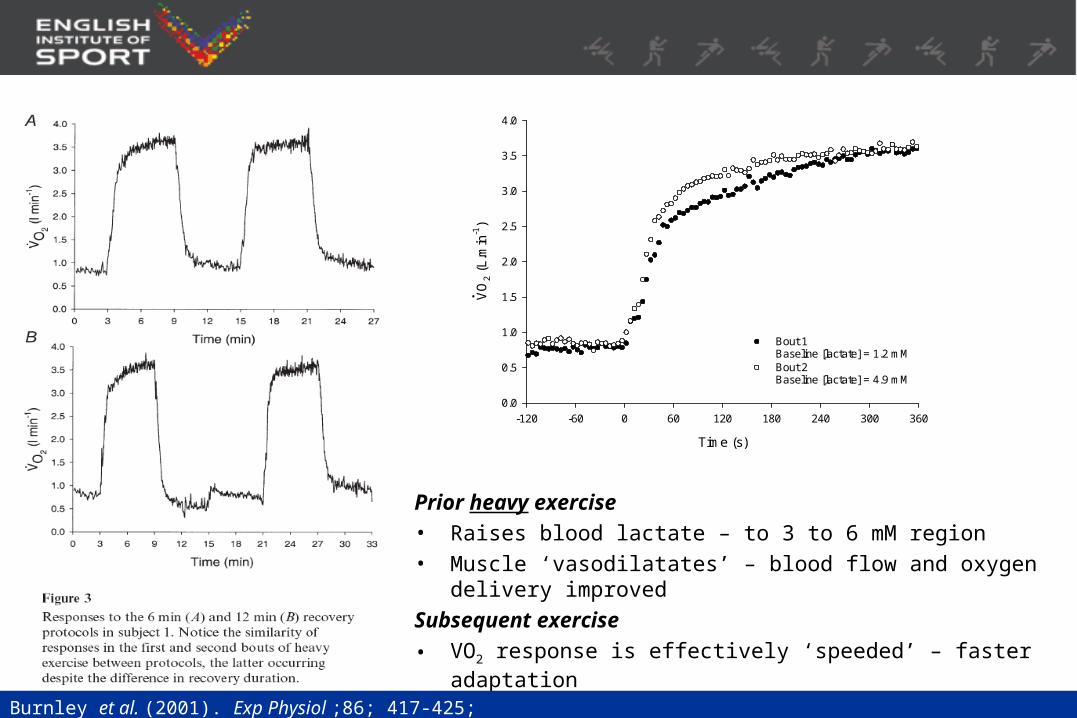
Bout 1Baseline [lactate] = 1.2 mMBout 2Baseline [lactate] = 4.9 mM
.
Prior heavy exercise• Raises blood lactate – to 3 to 6 mM region• Muscle ‘vasodilatates’ – blood flow and oxygen delivery improved
Subsequent exercise
• VO2 response is effectively ‘speeded’ – faster adaptation
• Repeated sprint recovery improved
Burnley et al. (2001). Exp Physiol ;86; 417-425;

Prior heavy exercise• Effect lasts for ~30 min• Lactate elevated for up to an
hour• Balance between
recovery/restoration of AWC and residual effects of vasodilatation
Burnley et al (2006). J. Appl. Physiol., Vol. 101, pp. 1320-1327
10 min 20 min
30 min 40 min
50 min

10 min10 min 2 min2 min 5 min 5 min
70% 70% All-outAll-out
• No warm-upNo warm-up• Moderate: 80% LTModerate: 80% LT• Heavy: 6 min at 50% Heavy: 6 min at 50% • Sprint: 30 s all-out WingateSprint: 30 s all-out Wingate
BloodBlood BloodBlood
Differing types of warm-upDiffering types of warm-up
Sel
f-pa
ced
Fix
ed
Burnley et al. (2005). Medicine & Science in Sports & Exercise. 37(5):838-845

1.0 mM B[La]338 W (+3%)
1.0 mM B[La]330 W
3.0 mM B[La]339 W (+3%)
5.9 mM B[La]324 W (-2%)
Burnley et al. (2005). Medicine & Science in Sports & Exercise. 37(5):838-845
No warm up 6 min easy paced
30 s all-out effort6 min ‘heavy’

Effect of prior heavy and severe intensity exercise on swimming performance in relation to
critical speed and anaerobic distance capacity
Hunt J ,Brickley G, Dekerle J, Pringle J.
Hunt et al, (2009) (submitted)

0 10 20 30 40 50 60 70 80 90 100
Moderate Heavy Severe
% VO2 Max
LT CP VO2 Max
MARKERS OR EXERCISE INTENSITY
Time (min)
pH
Time (min)
[PC
r] %
PCr
pH
Time (min)
[Pi]
%
Pi
10% <CP 10% >CP
MUSCLE METABOLIC RESPONSES TO EXERCISE ABOVE AND BELOW THE ‘CRITICAL POWER’
Jones, Wilkerson, DiMenna, Fulford, Poole (2007). Am J Physiol Regulatory Integrative Comp Physiol, 294:585-593

EFFECT OF PRIOR EXERCISE
Prior heavy intensity exercise enhances exercise tolerance (Carter et
al, 2005)
•Residual acidemia (<5mM; Burnley et el, 2005)= Vasodilation
•Bohr shift in Oxyhaemoglobin dissociation curve = O2 delivery
•Elevated baseline VO2 (short recovery only)
VO2 slow component
O2 Deficit
Prior Severe intensity exercise reduces exercise tolerance (Jones et al, 2003; Carter et al, 2005)
•Depletes anaerobic work capacity (Ferguson et a, 2007; Jones et al, 2007)
•Accumulation of fatigue related metabolites (H+, Pi, K+) (Jones at al, 2007)
Ha = Prior heavy intensity exercise would improve performance whilst severe exercise would decrease performance in proportion to the (known) depletion of the anaerobic work (distance) capacity incurred in the prior exercise bout

STAGE 1 STAGE 2
PRE-TEST/ CONTOL
HEAVY
198 s at 95% of critical speed
SEVERE
180 s at 105% of critical speed
PRIOR EXERCISE CONDITION
PERFORMANCE TEST- SWIM
TRIALS100m Free
100m Free
800m Free
800m Free
NO PRIOR EXERCISE
100m Free
400m Free
800m Free
Measures:
Performance time without prior exercise-Derivation of the d v t relationship and estimation of CSS & ADC.
Performance time for maximal effort swim trials –used to recalculate the CSS & ADC under prior exercise conditions
Methods•Nine trained swimmers (4 female; age, 24 ± 2 years; mass 70 ± 4 kg) participated
•Differences between conditions were tested using repeated measures ANOVA
•Relationships between data assessed using Pearson’s Product Moment Correlation

Results
Measure (Significantly different to control P < 0.05)
Prior exercise Time (s) CSS (m.s-1) ADC (m) SR (cycles.min -1) SL (m.cycle-1)
100m 800m 100m 800m 100m 800m
CONTOL 69.0 ± 3.1672.2 ±
20.5 1.17 ± 0.03 20.1 ± 1.8 45.8 ± 1.5 33.2 ± 1.0 1.34 ± 0.04 1.82 ±0.05
HEAVY 70.0 ± 3.5 666.2 ±
22.0 1.18 ± 0.04 18.1 ± 1.842.1 ±
1.3 32.4 ± 0.81.46 ± 0.04 1.86 ±0.04
SEVERE74.6 ±
3.5670.1 ±
21.2 1.18 ± 0.03 12.7 ± 1.839.9 ±
1.6 32.9 ± 091.55 ± 0.06 1.83 ±0.05
Depletion of ADC (%)
% w
ors
enin
g o
f perf
orm
an
ce
tim
e
•No ergogenic effect after HEAVY warm-up
• Uniqueness of performance protocol
•Anaerobic distance capacity was reduced by ~40% after SEVERE exercise
•The worsening in 100m trial performance after SEVERE prior exercise was significantly related to the reduction in ADC incurred (r = 0.72; P <0.05)
•800 m performance requiring a large aerobic contribution was less affected by reduced anaerobic reserve
• Aerobic ~ 90%; Anaerobic ~10%
• i.e. 40% reduction in 10%
4% reduction in total work is not detectable in this protocol

Pringle and Defever (2008, in press). Pre-exercise vasodilatation enhances total work production by increasing the aerobic contribution to ‘all-out’ cycle exercise and elevating the critical power
0
100
200
300
400
500
600
700
800
900
1000
0 30 60 90 120 150 180
Time (s)
Pow
er outp
ut (W
)
0
10
20
30
40
50
60
0 30 60 90 120 150 180
Time (s)
Tota
l work
achie
ved (kJ
)
0
500
1000
1500
2000
2500
3000
3500
4000
4500
5000
0 30 60 90 120 150 180
Time (s)
VO
2 (m
L/m
in)
.
~10 to 13% more O2 used
Power ~7 to 10 % higher
~7 to 10% more work achieved
Significant beyond ~45 s

0
200
400
600
800
1000
1200
1400
1600
1800
2000
0 10 20 30 40 50 60
Time (s)
Pow
er (W
)Pringle and Defever (2008, in press). Pre-exercise vasodilatation enhances total work production by increasing the aerobic contribution to ‘all-out’ cycle exercise and elevating the critical power
0
2
4
6
8
10
Time (s)
Dista
nce g
ain
ed (m
)
0
200
400
600
800
1000
1200
1400
1600
1800
2000
0 10 20 30 40 50 60
Time (s)
Pow
er (W
)

Long Long v.v. short short coursecourse

Length Dive Swim Approach
1 5 s 6 s 1 s
2 5 s 8 s 1 s
3 4 s 9 s 1 s
4 4 s 10 s 1 s
Total 18 s 33 s 4 s
Short Course
Total Time = 55 seconds
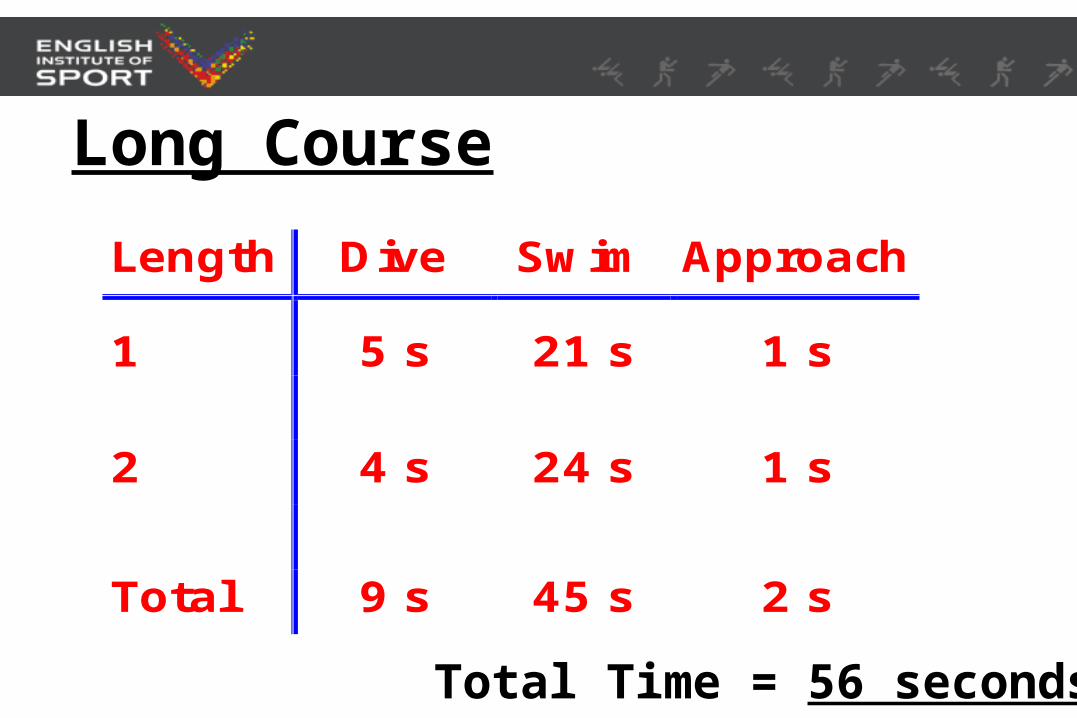
Length Dive Swim Approach
1 5 s 21 s 1 s
2 4 s 24 s 1 s
Total 9 s 45 s 2 s
Long Course
Total Time = 56 seconds

1.Total swim time increases from 33 s to 45 s• Greater stress on aerobic energy sources
2. Swimming ~23 s sustained without a 'recovery‘ rather than 6-10 s
•approximately 3 times the duration without a break - not double.
Long Course vs. Short Course
3. Check Stroke Counts to illustrate: ~ 3 to 1

Economy and Economy and efficiencyefficiency
Maybe the real reason for high volume?

Training volume improves Training volume improves efficiencyefficiency
““I train around 35 hours a week which I train around 35 hours a week which means I probably swim around 120 means I probably swim around 120 km over the seven days. I guess that km over the seven days. I guess that is probably more than a lot of people is probably more than a lot of people drive! … I do two swimming sessions drive! … I do two swimming sessions a day, seven days a week… it's very a day, seven days a week… it's very hard work and the early mornings are hard work and the early mornings are tough but I enjoy the challenge. “tough but I enjoy the challenge. “
Ian Thorpe, BBC Sport 2002Ian Thorpe, BBC Sport 2002

0
10
20
30
40
50
60
0 10 20 30 40 50 60 70 80 90 100 110 120 130 140 150
Power (W)
VO
2 (m
L/kg/m
in)
Efficiency
Swimming speed
Oxy
gen
upta
ke

Coyle (2005)Coyle (2005) Improved muscular efficiency displayed as Tour de Improved muscular efficiency displayed as Tour de France champion matures France champion matures J. Appl PhysiolJ. Appl Physiol 98: 2191-2196 98: 2191-2196
0
1000
2000
3000
4000
5000
6000
7000
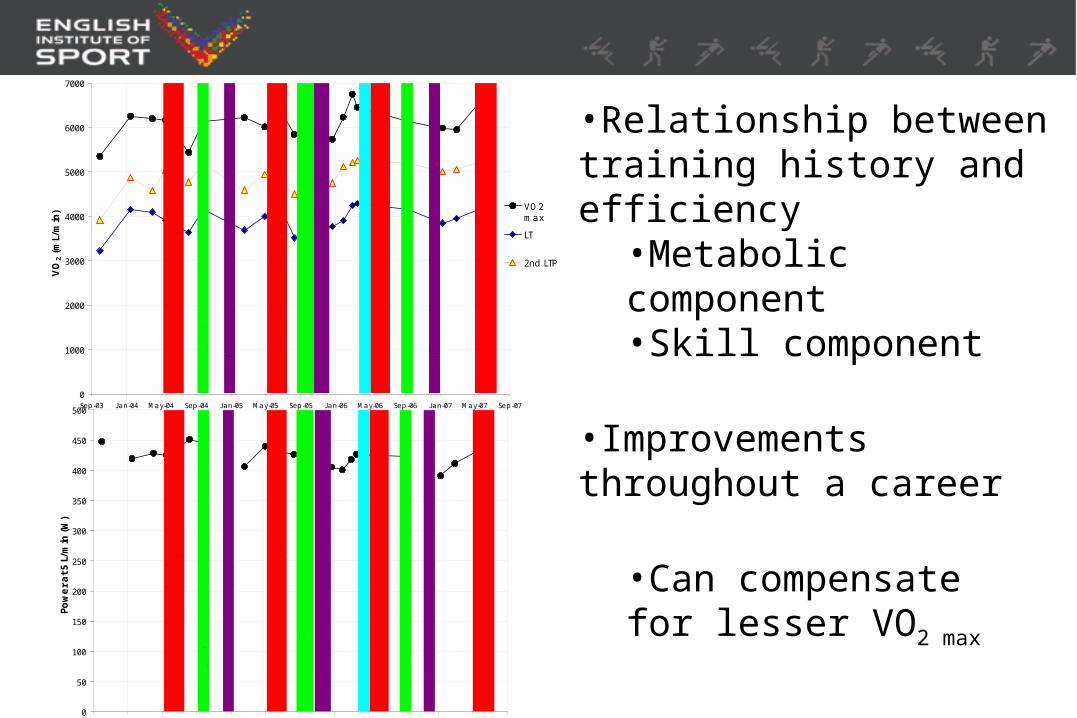
Sep-03 J an-04 May-04 Sep-04 J an-05 May-05 Sep-05 J an-06 May-06 Sep-06 J an-07 May-07 Sep-07
VO
2 (m
L/m
in) VO2
max
LT
2nd LTP.
Com
mon
wea
lth G
ames
, 4t
h an
d 6t
h
Nat
iona
l TT
cha
mps
,10
mile
: 2n
d; 2
5 m
ile:
2nd;
50
mile
1s
t
Nat
iona
l TT
cha
mps
,10,
25,
50,
100
mile
- a
ll 1s
t; 1
2 hr
s 1st
Brit
ish
TT
cha
mps
, 1s
t
Brit
ish
TT
cha
mps
, 2n
d,N
atio
nal p
ursu
it -
3rd
Brit
ish
TT
cha
mps
, 2n
d
Nat
iona
l TT
cha
mps
,10,
50,
bot
h 1s
t; 2
5 -
2nd
Nat
iona
l TT
cha
mps
,10,
50,
bot
h 1s
t; 2
5 -
2nd
6 w
eeks
off
8wee
ks o
ff
6 w
eeks
off
0
50
100
150
200
250
300
350
400
450
500
Sep-03 J an-04 May-04 Sep-04 J an-05 May-05 Sep-05 J an-06 May-06 Sep-06 J an-07 May-07 Sep-07
Pow
er at 5
L/m
in (W
)
Co
mm
onw
ealth
Ga
mes
, 4
th a
nd
6th
Na
tion
al T
T c
ham
ps,1
0 m
ile:
2nd
; 25
mile
: 2
nd;
50
mile
1
st
Na
tion
al T
T c
ham
ps,1
0,
25,
50,
100
mile
- a
ll 1
st;
12
hrs
1
st
Brit
ish
TT
cha
mp
s, 1
st
Brit
ish
TT
cha
mp
s, 2
nd,
Na
tion
al p
urs
uit
- 3r
d
Brit
ish
TT
cha
mp
s, 2
nd
Na
tion
al T
T c
ham
ps,1
0,
50,
bot
h 1s
t; 2
5 -
2nd
Na
tion
al T
T c
ham
ps,1
0,
50,
bot
h 1s
t; 2
5 -
2nd
6 w
ee
ks o
ff
8w
eek
s o
ff
6 w
ee
ks o
ff
•Relationship between training history and efficiency
•Metabolic component•Skill component
•Improvements throughout a career
•Can compensate for lesser VO2 max

Physiological description
Differences between
individuals
Potential to enhance it?
Long v short course differences
Aerobic/efficiency interactions
Disproportional high volume of training
Optimising warm-up
Examples from the research
Sprint v endurance trained
Fitness status
Examples from other sports