Embed Size (px)
Citation preview
Role-focused process-mapping for documenting
software systems usage at Hemlock Printers
By:
Octavio Angel West Barrio
B.A (Graphic Design), Simon Bolivar University, 2004
Project Submitted in Partial Fulfillment of the
Requirements for the Degree of
Master of Publishing
In the Publishing Program
Faculty of Communication, Art and Technology
©Octavio Angel West Barrio 2019
SIMON FRASER UNIVERSITY
Spring 2019
This work is licensed under the Creative Commons Attribution-NonCommercial-NoDerivatives
4.0 international
(http://creativecommons.org/licenses/by-nc-nd/4.0/legalcode)

ii
Approval
Name: Octavio Angel West Barrio
Degree: Master of Publishing
Title of Project: Role-focused process-mapping for documenting
software systems usage at Hemlock Printers
Supervisory Committee: _____________________________________
Juan Pablo Alperín
Senior Supervisor
Assistant Professor
______________________________________
John Maxwell
Supervisor
Associate Professor
________________________________________
Richard Kouwenhoven
Industry Supervisor
President and CEO
Hemlock Printers
Burnaby, BC
Date Approved: April 2, 2019

iii
Abstract
This report introduces readers to the principles of process mapping, a flowchart technique
widely used in manufacturing and engineering for diagnosis, analysis and improvement of
processes and whose advantages can be applied to tasks carried out in Publishing.
We base this exposition on the experience gained during the process mapping of Hemlock
Printers Ltd. a Burnaby-based company with 50 years in the industry, which started a project to
document its workflows and the way software applications were used to automatize them.
We examine the nature of process maps, how the company was conceptualized for study and
the ways to collect information used, followed by a step by step guide to draw these diagrams,
ending with a detailed analysis of selected examples of workflows at Hemlock using these maps
and how to apply them to identify problems and opportunities for improvement.

iv
Dedication
This report is dedicated to my beloved family, my wife Diana and our daughters Katheryn and
Sofia all of whom have joined me in this journey with courage and who fill me with joy every
day.
To my parents, Octavio and Araceli, who have always supported me, cared me and encouraged
me to keep moving forward and who taught me to always give my best effort.
v
Acknowledgements
I would like to express my sincere gratitude to Richard Kouwenhoven, President and Chief
Operating Officer of Hemlock Printers Ltd. who devised, planned and sponsored the process
mapping project at Hemlock that is the foundation of this report and deposited his trust in me
to bring it to fruition while directing and reviewing it and contributing his ample expertise and
knowledge of the printing processes and the company to lead it to a successful result.
My heartfelt thanks to my SFU project supervisors and mentors, Juan Pablo Alperín for his
commitment to oversee the development of this report and contribute his insightful comments,
edits and suggestions. And John Maxwell, who inspired me since the early days of the Publishing
program.
My equally heartfelt thanks to Mike Breukels, Senior VP of Finance & Accounting at Hemlock,
who mentored and encouraged me to aim for a high standard and whose kindness and
leadership keeps inspiring me.
My sincere appreciation to Stan Potma, Director of Estimating and lead of the MIS
implementation team at Hemlock, who is always in the best disposition to answer my questions
and even spare time to share his fascinating stories.
A special mention to Vanessa Hilton, who always hears my personal and professional concerns,
advises me in the kindest manner.
Thanks to the members of the leadership team of Hemlock who supported me, pointing me in
the right direction, solving my doubts, completing my knowledge and sharing their expertise. My
deepest respect to Jeff Taylor, Senior VP Manufacturing & Product development, Daren
McKewan Director of Customer Service and Manager of Digital & Display divisions, Doug Climie,
VP of Sales and Marketing, Peter Madliger, VP of Prepress and Barb Malin director of Fulfillment
Services.
My sincere gratitude to the Hemlock staff who made me feel at home and diligently explained
me the tasks they perform, taking time from their busy agendas to ensure I capture the correct
process or reviewing my imperfect drafts to turn them into accurate representations.
My final, but no less important appreciation goes to the Master of Publishing faculty, staff and
cohort and particularly to Jo-Anne Ray who was always a beacon of light in the path towards
completing the MPub program.
To all of you, I am in debt.

vi
Table of Contents
Approval ........................................................................................................................................... ii
Abstract ........................................................................................................................................... iii
Dedication ....................................................................................................................................... iv
Acknowledgements .......................................................................................................................... v
Table of Contents ............................................................................................................................ vi
List of Tables .................................................................................................................................. viii
List of Figures ................................................................................................................................... ix
List of Acronyms & Abbreviations .................................................................................................... x
Introduction ..................................................................................................................................... 1
Chapter 1 Process mapping ............................................................................................................. 3
1.1. Characteristics and advantages of process maps ................................................................. 3
1.2. Levels of detail in process maps ........................................................................................... 5
1.3. Shapes used in process mapping .......................................................................................... 6
1.4. The Swimlane approach ....................................................................................................... 7
1.5. Calculations using a process map information ..................................................................... 9
1.6. Considerations to help an organization to understand process maps ............................... 10
1.7. Digital tools to draw maps and charts ................................................................................ 11
1.8. Design Guidelines ............................................................................................................... 12
1.9. Chapter 1 summary ............................................................................................................ 13
Chapter 2 Approach to process mapping of Hemlock Printers ..................................................... 14
2.1. The General Order Flow ..................................................................................................... 14
2.2. About Hemlock Printers ..................................................................................................... 15
2.2. Organization ....................................................................................................................... 16
2.2.1. Leadership team ........................................................................................................... 17
2.2.2. Sales .............................................................................................................................. 17
2.2.3. Operations .................................................................................................................... 18
2.2.4. Manufacturing .............................................................................................................. 18
2.2.5. Finance & Administration and IT .................................................................................. 19
2.3. Manufacturing Divisions ..................................................................................................... 19
2.4. The organizational model created for process mapping .................................................... 20
2.4. Management software systems in Hemlock ...................................................................... 21

vii
2.5. Chapter 2 summary ............................................................................................................ 23
Chapter 3 Hemlock process mapping techniques and methodology ........................................... 24
3.1. Graphic style conventions .................................................................................................. 24
3.2. Information gathering and documenting techniques used................................................ 26
3.2.1. Interviews ..................................................................................................................... 26
3.2.2. Reverse engineering of software.................................................................................. 27
3.2.3. Using existing documents ............................................................................................. 28
3.3. General Methodology ........................................................................................................ 29
3.4. Drafting process maps ........................................................................................................ 30
3.4.1. Header Section ............................................................................................................. 30
3.4.2. Draw lanes and add boxes for each process ................................................................ 30
3.4.3. Draw connectors .......................................................................................................... 31
3.4.4. Add notes and special annotations .............................................................................. 32
3.5. Reviews and proofing ......................................................................................................... 33
3.6. Guidelines to organize and publish process maps ............................................................. 34
3.7. Chapter 3 summary ............................................................................................................ 35
Chapter 4 Results of the Hemlock project and selected analysis cases ........................................ 36
4.1. Systems usage in Hemlock ................................................................................................. 36
4.2. Analysis of workflows in process maps .............................................................................. 37
4.2.1. Example 1: The new estimate workflow ...................................................................... 39
4.2.2. Example 2: The paper purchasing workflow ................................................................ 40
4.2.3. Example 3: The time-sheet reporting workflow ........................................................... 43
4.3. Chapter 4 summary ............................................................................................................ 44
Conclusions .................................................................................................................................... 45
Bibliography consulted and Works Cited ...................................................................................... 48

viii
List of Tables
Table 1. Interview notes for process mapping the RFQ at Hemlock………………………………………….27

ix
List of Figures
Figure 1. Example of process map …………………………………………………………………………………………… 4
Figure 2. Visualization levels of Hemlock’s project…………………………………………………. 6
Figure 3. Basic flowchart shapes ……………….……………………………………………………………… 7
Figure 4. Standard process map …………………….………………………………………………………… 8
Figure 5 Swimlane process map example …………………………………………………………………… 9
Figure 6. Process map drawing template ………………………………………………………..…………… 11
Figure 7. Licensed and open source flowchart software ……………………………………………………….… 11
Figure 8. Hemlock’s General Order Flow…………………………………………………………………………. 15
Figure 9. Hemlock Organizational Chart ………………………………………………………………………………. 17
Figure 10. Functional organization and color coding for hemlock operation areas and roles ……21
Figure 11. Core systems of Hemlock ……………………………………………………………………………………22
Figure 12. Master Icon and Key Conventions for Process Mapping ………………….………………… 25
Figure 13. System usage annotation ………………………………………………………………………………… 26
Figure 14. Reverse engineering of Hemlock’s Sales Dashboard …………………………………. 28
Figure 15. Using existing documentation to draft process maps ………………….………………. 29
Figure 16. Hemlock process map header ………………………………………………….……………………. 30
Figure 17. Lane and activity boxes adding ……………………………………………………………………………. 31
Figure 18. Step boxes arranged and connected ………………………………………………………………………. 32
Figure 19. Finished RFQ map with annotations ………………………………………………………………………. 33
Figure 20. Most used systems by operational area in Hemlock………………….……………………………37
Figure 21. Sub-process mapping example ……………………………………………………………………………. 39
Figure 22. Hemlock purchasing department map ………………………………………………………………. 41
Figure 23. Hemlock time hours reporting map ……………………………………………………………………… 43

x
List of Acronyms & Abbreviations
CSR: Customer Service Representative
ERP: Enterprise Resource Planning (system)
FGI: Finished Goods Inventory
KPI: Key Performance Indicator
MPub: Master of Publishing
MSI: Managing Information system
PM: Process map
PSI: Programmed Solutions Incorporated
RFQ: Request for Quote
RMI: Request Material Inventory
ROI: Return of Investment
SFU: Simon Fraser University
WIP: Work in Progress

1
Introduction
Process maps are a visualization technique that can be used to enhance the understanding of
the elements and relationships that make up complex processes. They allow their users to think
out of the box and find solutions, organize, rectify bad practices and set standards for
procedures. While incredibly useful when used in appropriate contexts, process maps are not
widely used. As such, this report lays out the benefits of process maps and how to document
for, design and create them.
Some experts like Paul Harmon, Fernando Vera and Mary Ann Anderson consider the way
process maps provide information in a graphic and easy-to-understand format is what allows us
to take distance from the problem and approach it from a different perspective; my experience
of creating such documents and talking to individuals who participate in the processes they
represent gave me a unique appreciation for this visualization technique and the ways in which
it gives people an overview of a situation and allows them to comprehend how activities flow
from one step to the next.
I acquired this experience during the 2018 summer-term professional placement for the Master
of Publishing program at Simon Fraser University, when I worked as a workflow analyst at
Hemlock Printers Ltd. (a commercial printer based in Burnaby, BC). I joined as part of a project
sponsored and supervised by the company CEO & President, Richard Kouwenhoven who wished
to document the workflows in the company and understand how software platforms were being
used from a role-centered perspective.
Parallel to this project, the implementation of a new managing information system (MIS) that
will control the flow of information through the company was in progress, with the aim to
replace the existing but outdated system in the short term with the goal of adding capability to
provide real-time data for analysis. For a company the size of Hemlock (approximately 200
employees), this was a significant milestone, as these systems allow automated workflows by
transferring a project (job) details from department to department, adding information and
keeping track of it through the whole production process.
Richard Kouwenhoven realized it was critical to generate a model of current operations being
carried out at Hemlock in the form of process maps to have a blueprint of the existing status and
have the capability to measure the changes brought by the new system. This would also help
identify if the proper software services were being replaced for the staff to continue their
regular operations and later, to find ways to optimize them to increase productivity and devise
improvements.
The usefulness of process maps for managing this transition prompted our interest in describing
our experience using this tool to other publishers, who might similarly benefit from a clear
overview of their own activities, facilitate conversations, analyze and find opportunities for
improvement. Using my experience creating process maps at Hemlock, this document presents
the case for using process maps, offers concrete examples from Hemlock as a case study, and

2
explains the methodology for how to create them so that others can use them at their own
organizations. The report is organized in the following manner:
Chapter 1 discusses what Process maps are and how they are useful. Of interest is the cross-
functional technique used at Hemlock, that allows us to clearly define the role each participant
has in a workflow as well as their responsibilities. I also offer design guidelines to ensure the
proper formatting of these documents and finally, the properties of dedicated software tools
available to create them.
Chapter 2 analyses the organization, functional areas, roles and activities done at Hemlock
Printers, I also discuss the main process carried out at the company, called the General Order
Flow which takes a design file from a customer, process it through all the operations in the
company and outputs a finished and printed document, whether it is a book, magazine, poster,
catalogue or wide-format signage.
Chapter 3 covers the design conventions used for Hemlock process mapping, such as special
symbol systems and visual approach. We then describe the information gathering techniques
and the methodology used to create the maps as well as a step by step drawing system which
although simple, is absent in most flowchart and process mapping bibliographies, leading to
difficulties in the creation these documents.
Finally, Chapter 4 describes some guidelines to analyze process maps and extract information
from them to identify problems and opportunities for improvement, followed by case study
examples of some of the processes documented at Hemlock and the solutions devised based on
them. Finally, a short section of recommendation on how to implement changes in processes
with references to more detailed bibliographies for those wishing to expand their knowledge of
the subject.
This report aims to identify the considerations and procedures to follow when publishers
approach their own projects and inspire readers to integrate process maps into their
professional practice. We believe that properly used, these tools can help boost the
productivity, efficiency and chances of success of any project or enterprise.

3
Chapter 1 Process mapping
In this Chapter, I will review the characteristics and structure of process maps, starting with a
brief description of their history, properties, and techniques, followed by tools and software
available to create them. Since process maps are visual communication products, we will cover a
series of design guidelines to increase their effectiveness as well as points to consider when
publishing them.
1.1. Characteristics and advantages of process maps Process maps were the first type of flowchart and have been around for nearly 100 years. They
were introduced in 1921 by Frank and Lillian Gilbreth in a presentation to the American Society
of Mechanical Engineers (ASME) titled: Process Charts: First Steps in Finding the One Best Way to
do Work who proposed them as a tool to analyze and increase the productivity of industrial
operations. 1 Over time, their use has spread to fields as diverse as information technologies,
business and engineering, demonstrating their versatility as communication tools.2 In the 1970s,
they gained popularity among software developers and business administrators and so, they
started to be known outside their industries by the general public.
Just like a flowchart, a process map is a diagram that uses different shaped boxes to represent
activities (steps), of an algorithm, workflow, or process and then connects them with lines and
arrows to show the sequence they are carried out. — the flow.
What makes them different from flow charts is that they contain additional information related
to the process they represent, (i.e. annotations) that can include things like the time it takes an
activity to complete, resources used/produced, or software systems involved, to name a few.
The nature of such annotations depends on what do we want to know about the process, like
Who is doing each part? How long does it take to complete each step? How many resources
they consume? or How much it produces in an hour?
A typical process map looks like the one in Figure 1 below.
1 Wikipedia contributors, "Flowchart," Wikipedia, The Free Encyclopedia, https://en.wikipedia.org/w/index.php?title=Flowchart&oldid=864671209 (accessed October 26, 2018) 2 Gemignani, Zach, et al. Data Fluency: Empowering Your Organization with Effective Data Communication. Wiley, 2015. p 162

4
Figure 1. Example of a process map.3
This is a standard process map showing a printing process which consists of seven operations
(also called sub-processes) depicted as rectangles. It includes annotations around each box
describing the individuals working on a step and the average time it takes to complete each of
them. It provides a clear visualization of the overall workflow, the time each operation is carried
out and which operations occur simultaneously. It also allows us to calculate the average
duration for the whole process by adding the time spent on each operation, which can be
between 6 and 8 days. This is also a useful tool to explain the process to new customer.
Thanks to the additional information in the annotations (on top and below each box in Figure 1),
process maps offer an opportunity for new levels of understanding because they:
• Capture complex tasks in an easy to understand format.
• Contain vital information about who is involved, what kind of data and materials are
flowing and the transaction points between operations, departments and the supply
chain.
• Allow the transfer of knowledge.
• Consistency allow for standardization or in-house processes or implementation of
proved work methods. Which helps to propose and adopt best practices.4
• Add value by offering an opportunity to think outside of the box and ask questions that
can lead to new solutions or improvements.
• Can be continually improved, updated and adapted.
3 Source: Anderson, Mary Ann., et al. Operations Management for Dummies. John Wiley & Sons Canada, Limited, 2013. p. 14 4 Wikipedia contributors, "Best practice," Wikipedia, The Free Encyclopedia, https://en.wikipedia.org/w/index.php?title=Best_practice&oldid=883186054 (accessed March 18, 2019).

5
These characteristics help users get a clearer view of a process, providing relevant data to make
informed decisions and improvements leading to a more effective use of resources,
standardization of processes, waste reduction, quality improvements or increasing production
output. 5
1.2. Levels of detail in process maps These diagrams have the capacity to represent activities of various complexity and are divided
into three levels of detail depending on their scope and use (Figure 2):
Level 1: “Focus on the organization, its basic structure and environment”.6
Level 2: “Focus on processes, ranging from individual operations to value chains that integrate
all the sub-processes and activities necessary to produce a major line of products and services
and which are divided into processes, then sub-processes and so on, as necessary”.7 However,
no matter how large these “super-processes” may be, they are still considered under the Level 2
scope.8
Level 3: “Focuses on the activities that occur within processes and sub-processes”.9 These can
take the form of diagrams or lists of activities to fulfill a specific operation.
5 P. Savory and J. Olson, “Guidelines for Using Process Mapping to Aid Improvement Efforts,” Hospital Material Management Quarterly, 2001, Volume 22, No. 3, pp. 10-16 Downloaded from: http://digitalcommons.unl.edu/cgi/viewcontent.cgi?article=1038&context=imsefacpub 6 Harmon, Paul. Business Process Change: A Manager's Guide to Improving, Redesigning, and Automating Processes. Morgan Kaufmann, 2003. p.131 7 Idem. P.132 8 In this report, we review processes which are part of the value chain in Hemlock Printers, called the
“General Order Flow”, by means of this value chain, Hemlock takes a digital design file from a Customer,
prepares the files for printing, procures raw materials such as paper and ink and turns them into a printed
and finished product. Hemlock value chain is like that represented in Figure 1 but includes many other
processes and sub-processes that cover every step in the production chain in detail. With information
from: Kenton, Will. "Value Chain." Investopedia. https://www.investopedia.com/terms/v/valuechain.asp
(accessed February 22, 2019).
9 Harmon, Paul. Business Process Change: A Manager's Guide to Improving, Redesigning, and Automating Processes. Morgan Kaufmann, 2003. p.132

6
Figure 2. Visualization of the three levels of processes in Hemlock’s project.
Here are the three process levels and how a map in each one looks like. Process A and Process B
stay at the same hierarchy although Process B is a sub-process of A. Level 3 is for documents
describing actions in detail. Diagrams property of Hemlock Printers Ltd, used with permission.
1.3. Shapes used in process mapping Like flowcharts, each box in a process map has a shape that is conventionally associated with a
type of activity. Rectangles are used to represent operations, diamonds for decisions, and ovals
for terminals (start/end). Each of these boxes must represent only ONE activity, no matter how
complex the operation or sub-process it represents is. Figure 3 shows some of the most
common shapes used in process mapping.

7
Figure 3. Basic flowchart shapes.
These are some of the most important shapes used in process mapping. Source: Smartdraw.com
and Mary Ann Anderson et al. in Operations Management for Dummies.10
There are standardized conventions that cover the meaning of each symbol used by field of
application, such as the ISO 5807:1985 that describes the symbols for data, program and
software flowcharts,11 or the ISO 9001:2015 which shows how to map processes for certification
in high quality products and services.12 These offer a specific set of shapes that may vary from
those shown in Figure 3, like a process box with rounded corners or a multiple-choice decision
box shaped like a hexagon. However, unless complying to a specific standard, the system is quite
flexible if you define the meaning of each shape used in your project and make it clear to users.
1.4. The Swimlane approach Many process maps follow the same structure as other flowcharts, aligning boxes from left to
right in the order operations are performed, like the manufacturing process shown in Figure 4
on next page.
10 Figure constructed with information from Smartdraw.com. (2019). Flowchart Symbols. [online] Available at: https://www.smartdraw.com/flowchart/flowchart-symbols.htm [Accessed 29 Nov. 2018] and Anderson, Mary Ann., et al. Operations Management for Dummies. John Wiley & Sons Canada, Limited, 2013. 11 “ISO 5807:1985.” Developing Standards, 17 Sept. 2015, www.iso.org/standard/11955.html. Accessed, Sep. 29, 2018 12 “What Is ISO 9001:2015 – Quality Management Systems?” What Is a Quality Management System? | ASQ, ASQ, asq.org/learn-about-quality/iso-9000/iso-9001-2015/. Accessed: October 12, 2018

8
Figure 4 Standard process map.
This diagram includes operations (OP) and transfer (Transfer) sub-processes. It has annotations
that identify who is responsible for each step on top of each box and its output capacity at the
bottom. Triangle-shaped boxes indicate delays between operations although we don’t know
what is causing them. There are various acronyms used as well: RMI for example means “request
material inventory”, WIP means “work in progress” and FGI is for “finished goods inventory”.
Diagram based on example from Mary Ann Anderson et al. in Operations Management for
Dummies.13
This diagram provides plenty of information to analyse, manage and improve this process.
However, it is not clear how many individuals are involved in it, there is an operator for each
“OP” step, but it is not clear who is responsible for the delays at the various “WIP” boxes. Also, if
we wanted to add information, like set up times, waste or utilization of resources we will be
constrained due to space. However, there is a way to represent this process in a format that
clearly defines the activities taken by each role by using the Swimlane approach.
The Swimlane or cross-functional technique is a process map format that provides even richer
information on who does what. This approach was originated by Geary Rummler and Alan
Brache in 199014 and its name derives from the division of the diagram in lanes (as in a
swimming pool), where every role has one or more activities performed at certain points in the
workflow15.
In this approach, each participant has a lane assigned exclusively, and only their activities will
appear in it, this makes easier to visualize when actions happen and what are the overall
responsibilities of each participant. The company or organization actors are aligned together to
13 Anderson, Mary Ann., et al. Operations Management for Dummies. John Wiley & Sons Canada, Limited, 2013. 14 Harmon, Paul. Business Process Change: A Manager's Guide to Improving, Redesigning, and Automating Processes. Morgan Kaufmann, 2003. p.113 15 Business Analyst Community & Resources | Modern Analyst. “Interview Questions for Business Analysts and Systems Analysts.” What Is a Context Diagram and What Are the Benefits of Creating One? > Business Analyst Community & Resources | Modern Analyst, www.modernanalyst.com/Careers/InterviewQuestions/tabid/128/ID/1804/What-is-a-Swimlane-Diagram.aspx.

9
keep a cohesive entity, whereas external actors are pulled to the borders. As a convention,
Customers are assigned the first (upper lane in a landscape format), while suppliers and third-
party participants are assigned the last lanes (bottom of the diagram in a landscape format).16
Figure 5 uses the same information in Figure 4 and displays it using the swimlane technique.
Figure 5 Swimlane process map example.
This diagram contains the same information from Figure 4, but offers new insights as discussed
in the text. We labelled operations as Printing, Bindery and Shipping for the purposes of section
1.5 below.
The information displayed in Figure 5, clearly shows who is responsible for the delays before and
after each activity of the process, it also let us see who does what at any moment and offers
additional space to add information if required.
1.5. Calculations using a process map information Another trait of process maps is that some of the information they contain can be used to make
calculations to estimate processing times, resource utilization, waste and other factors. Let’s
look back at Figure 5 and suppose it is a process for producing books. OP1 is the Printing
operation, OP2 will be Bindery and OP3, Shipping.
Printing (OP1) can produce 500 books each hour, however, Bindery (OP 2) is able to finish only
300 of these. If Printing works at its maximum output capacity, 200 printed but unfinished books
will stack in front of Bindery every hour (500-300), because it is not as fast. Doing the numbers
for an 8-hour work shift, Print would print 4,000 books (500 x 8) while OP 2 would finish 2,400 of
these (300 x 8), leaving 1,600 unfinished every day (4,000 – 2,400).
16 Harmon, Paul. Business Process Change: A Manager's Guide to Improving, Redesigning, and Automating Processes. Morgan Kaufmann, 2003. P.112

10
Also note that even if Shipping (OP3) can pack and ship 500 books per hour, meaning it can pack
4,000 on the same 8-hour shift, it needs to wait for the Bindery to finish them.
This situation introduces us to the key concept in process mapping of Bottlenecks. Bottlenecks
are defined as the step with the lowest capacity, in this example, Bindery. Bottlenecks are very
important as they highlight activities that need improvements, or which determine the whole
process behavior. In our example, the bottleneck in Bindery would tell a manager to run the
process with a (slower) print-run of 300 books each hour (OP1), because that is the capacity of
the bottleneck, so even if the Printing (OP1) and Shippers (OP3) are faster, they must wait for
the bindery to finish their job before starting. Under these conditions, the process will produce
300 books per hour at its maximum capacity.
As for improving the process, the analysis based on these calculations tell us where we should
focus our efforts and there are several options for this, one is to increase the Bindery capacity to
match the rest (500 books per hour), another is to run a second Bindery (OP4?) in parallel or
outsource part of the process, to name some.
1.6. Considerations to help an organization to understand process maps We have reviewed some benefits process maps have to offer, but all these symbols and
representations are useful only when a project is seen as a communication problem that
requires a good understanding of the subject, be it a company or organization, its industry, or its
internal processes. As producers of such data products, we ideally want to make sure readers
have “the ability to understand and draw meaning from data and the instruments where it is
presented”17. To achieve this focus, it is necessary to ask ourselves the following questions early
in the planning stage:
• What is the purpose of the project?
• Who are the users we are trying to reach?
• What do they know about the subject?
• What do they want to know?
• What do they wish to accomplish?
It is important to consider, every organization has its own “particular way of solving tasks, most
times within an intangible frame of conventions and expected behaviours”18 as producers of
these documents we must become familiar with such conventions, as well as any jargon or
practices used to communicate internally; on some cases, departments and hierarchies also
become balkanized and develop their own norms, conventions and terminology within the
organization, leading to communication problems such as providing and procuring data only a
portion of the individuals can access or understand, when this is the case, it is essential to find a
consensus and define a standard everyone is able to understand. It is worth saying, documents
such as process maps help standardize or establish these practices.
17 Gemignani, Zach, et al. Data Fluency: Empowering Your Organization with Effective Data Communication. Wiley, 2015. p.23 18 Idem p.22
11
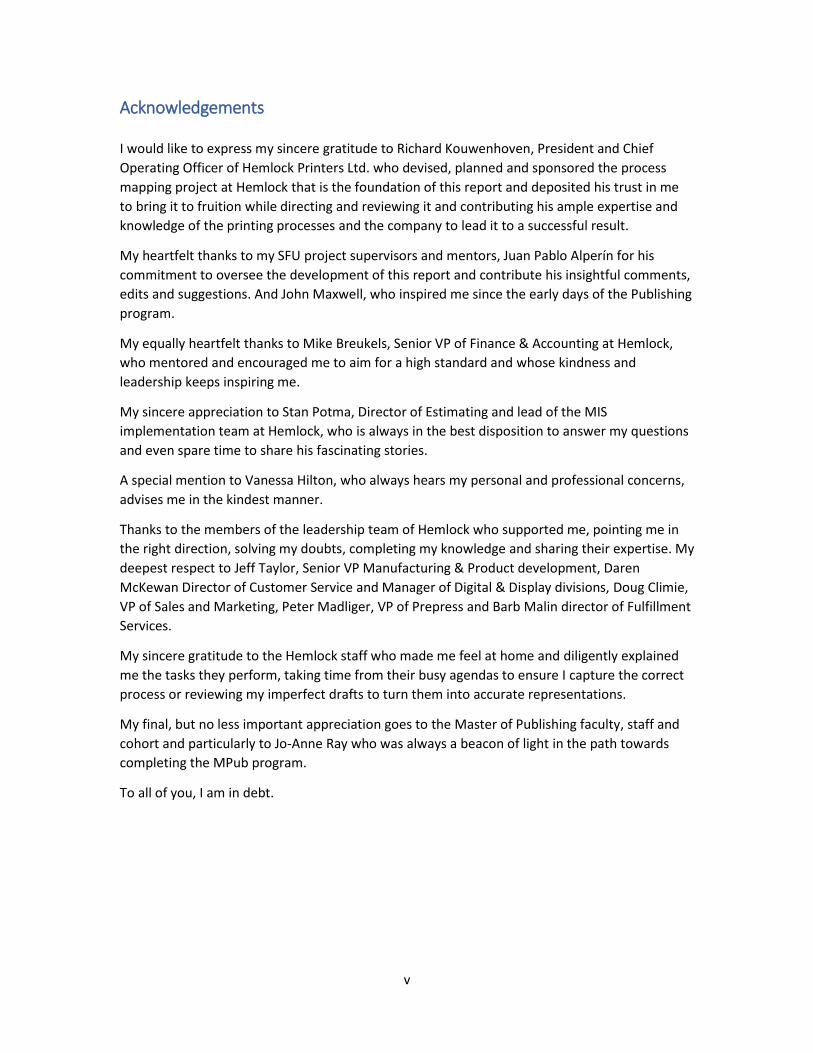
1.7. Digital tools to draw maps and charts Now that we have reviewed the characteristics and benefits of process maps, I will discuss the
ways they can be created. The original tool to draw flowcharts was a template like the one
shown in Figure 6. However, most process maps today are done digitally as this greatly increases
their consistency, widespread distribution and duplicability. Applications like word processors
and design software offer some options to draw them, but there is also specialized software
available, which come in a variety of forms and platforms and in proprietary and open source
licenses.
Figure 6. Process map drawing template.
We see many of the frequently used icons also shown in Figure 3.
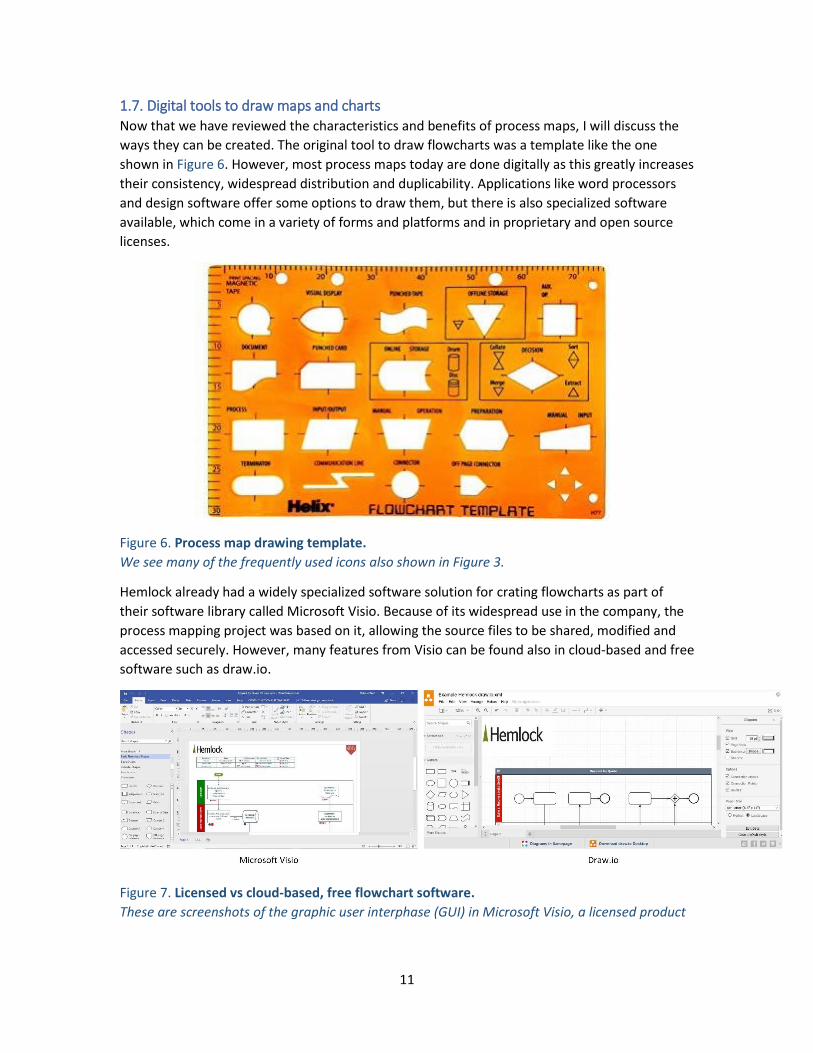
Hemlock already had a widely specialized software solution for crating flowcharts as part of
their software library called Microsoft Visio. Because of its widespread use in the company, the
process mapping project was based on it, allowing the source files to be shared, modified and
accessed securely. However, many features from Visio can be found also in cloud-based and free
software such as draw.io.
Figure 7. Licensed vs cloud-based, free flowchart software.
These are screenshots of the graphic user interphase (GUI) in Microsoft Visio, a licensed product

12
and draw.io a free to use, cloud-based application. Hemlock logo is a Trademark of Hemlock
Printers Ltd, used with permission.
Flowcharting applications offer similar capabilities that include multiple shape and symbol
libraries with drag and drop features, automatic connector lines, text boxes for annotations,
import data and images and some of them even create reports of the shapes used. Because of
this, they are best suited to draw, share and edit process maps and export the files as images,
PDF or publish in HTML or XML to name a few.
1.8. Design Guidelines Process maps are mostly visual documents, so it is important to have some guidelines that help
us improve their appearance and efficiency as communications tools; in Storytelling with data,
Cole Nussbaumer Knaflic lists some points to consider when designing efficient and attractive
visuals and divide them in four categories:
Affordances: “Refers to inherent aspects to the design that make it obvious how the product is
to be used19. In process maps they can be achieved through careful use of typography (bold,
italics, underline) size and color. Observe the following:
• Highlight the relevant parts
• Eliminate distractions
• Create a visual hierarchy You can use font size, gradients of the same color
Accessibility: “Designs should be usable by people of diverse abilities and specialties”.20 For this:
• Keep it simple and clean
• Avoid overloading data
• Use text to explain, reinforce or clarify, always keeping a straightforward language
• Show only relevant data and information
Aesthetics: “In general, people perceive aesthetic designs easier to access and use than those
which are not”.21 This is a subjective topic of course and requires testing with the future users of
these products. It is also important to consider, most companies have a visual identity manual
that can help you understand the rules, colors and styles used, look at existing documents
within the company and consider the following:
• Make it visually pleasing
• Check if logos, corporate fonts and colors are used accordingly to the company visual
identity guidelines
• Organize and distribute the elements on the page so space between shapes is balanced.
19 Knaflic, Cole Nussbaumer. Storytelling with Data: A Data Visualization Guide for Business Professionals. Wiley, 2015. p.128 20 Idem, p 138 21 Idem p.145

13
• Use an underlying grid (like that used on square-ruled paper) to arrange the elements to
the same position and alignment. This will allow a fluent reading and an easy transition
between elements
• Make good use of white space, including margins
• Earth tones allow a better visualization in general as they are more relaxing to read, use
bright colors only to draw attention to specific items or categories and always in
moderate proportions
Acceptance of a new design: “For a design to be effective, it must be accepted by its intended
audience. Humans tend to experience discomfort with change so if you highlight the
characteristics to note how a new design is more beneficial than a past one, the audience will
likely be more open to accept it”.22 Some ways to do this are:
• Provide multiple options and seek input from stakeholders before submitting a final
design
• Show the old and new styles side by side and explain the benefits of the new approach
There are many other considerations that can add value to a design and style to create process
maps, these are beyond the scope of this document but considering recent techniques towards
datafication of workflows,23 processes and lifestyles, it is a good investment of time to keep
learning how to improve the visual effectiveness of these communication tools.
1.9. Chapter 1 summary In this chapter we reviewed the basic characteristics of process maps, introduced the swimlane,
a popular diagramming style used to represent activities more accurately and which was of
great use for Hemlock project as it identifies “who does what” during a process. We also
demonstrated some calculations that can be made with the additional information these
diagrams include and finally presented some guidelines to help readers create visually attractive
maps which is important if we want to enhance their communication potential.
On next chapter, we will cover Hemlock printers and their value chain, focusing on their
organization and operational areas as we did to create a model that serves as the base for the
role-centered process mapping of every process held at this company.
22 Idem pp. 149-150 23 Wikipedia contributors, "Datafication," Wikipedia, The Free Encyclopedia, https://en.wikipedia.org/w/index.php?title=Datafication&oldid=842812215 (accessed October 28, 2018).

14
Chapter 2 Approach to process mapping of Hemlock Printers
In Chapter 1, I discussed the characteristics of process maps which were the tool used to
document Hemlock workflows and the way they were using software to fulfill its value chain to
provide the company leadership with an overview of the existing procedures and help the team
in charge of implementing the new managing information system to understand processes and
services to be replaced and help plan new routes of development. In a later stage, maps will be
used as templates for new workflows that can also be documented and in conjunction, will
provide a picture of the actual changes and improvements achieved, leading to further
optimization.
To achieve a successful process mapping, we first needed to understand Hemlock’s value chain,
fulfilled through the “general order flow”, the company structure, to create a model that
considered the transformation processes involved, the operational areas where they were
carried out and the roles employees were performing to create an abstract model of the
organization. This role-based model served as the foundation to document the tasks, processes
and sub-processes each employee performed using the swimlane approach mentioned in
Chapter 1.
2.1. The General Order Flow Hemlock is a commercial printer, that turns design files provided by customers into high-quality
printed and finished products. Besides printing and binding, they offer special finishing services
like varnish coatings, foil stamping, embossing, folding and die-cutting, they can manufacture
tens of thousands of units everyday and handle several projects at a time.24
For this to happen, its operational areas work together through a series of complex processes.
For any given print project to come to completion, it must go through several operations that
comprise the “general order flow”. Such a project is usually called a job and starts with the
reception of a digital design file provided by a customer along with a request for a quote,
estimating the cost to produce it and if accepted by the customer, proceeding to planning,
proofing, readying for print, manufacturing, and eventually shipping and billing. Every job goes
through a variant version of this process, which, for offset orders, is illustrated in the following
swimlane process map shown in Figure 8 that places each operational area of Hemlock in a lane.
24 An interesting note, the plant has an average of 170 projects scheduled at any given time.

15
Figure 8. Hemlock’s general order flow.
This diagram shows the ideal process for a project (job) is taken from a design file to turn it into
a printed and finished product. It starts with a Request for Quote (RFQ) by the customer sent to
the Sales & Customer Service area, which takes charge of the quoting and planning of the
project. It is then then turned over to the production area where it is proofed and manufactured
using in-house and (sometimes) third-party capabilities. When the job is finished it is shipped by
the shipping department, after this, the job costing passes to Finance & Accounting area for
billing and payment. Diagram and logo are property of Hemlock Printers Ltd, used with
permission.
A process like this is called a super-process, it encompasses many processes and sub processes
within them. For our mapping project, knowing the full set of operations served as a guide that
defined the order to map each stage and allowed us to document the role each participant had
into turning the order into a printed product at every stage of the super-process. When planning
a large-scale project, it is a good idea to first identify the super-process, divide it into smaller
sections until we get to the level of detail we aim to document.
2.2. About Hemlock Printers Hemlock Printers Ltd. Is a Canadian-based commercial printer, founded in 1968, which offers
offset, digital and wide format print services. Nowadays it is “one of the most highly revered
commercial printing companies in world based on innovative, high-end sheetfed perfecting.”25
25PrintAction Staff, “Year in Review: 30 Moments to Shape Canadian Print.” PrintAction, www.printaction.com/headlines/printaction-2017-4500. Consulted on November 19, 2018.

16
with offices and two plants in Burnaby B.C. It also has sales offices in Seattle and San Francisco
and “was the first printer in Western Canada to venture into the US market”.26
Hemlock philosophy is: Integrity, innovation, In Print. The company has grown from a single-man
stationery store-front operation in 1968 to a multinational company that uses cutting-edge
technology on various sites totalling over 100,000 square feet, where they manage and process
thousands of projects every year.27
The company has grown organically through its 50 years of existence, following a pattern where
it first expanded capacities by means of investments in staff and technology to grow its
production capabilities which increased the production output, turnaround times or created
new services which in turn helped expand their customer base.28
For instance, in 1981 Hemlock purchased its first four-colour press, this acquisition enabled to
print faster and in bigger formats, granting the capacity to print more sheets per unit of time
which allowed to serve a higher number of customers and - as it happened- take jobs from
customers with high volume demand like major advertising agencies in Vancouver. This effect
also applies to technical expertise (in 1990 they secured a reputation as a fine art printer),
innovation (sponsored and tested the development of a new “Computer to Plate (CTP)” process
in 1996) and environmental programs (pioneered a zero-carbon program in 2004).29
2.2. Organization The addition of technology and personnel expands the company capacities but also adds more
complexity, new positions must be created to cover previously inexistent roles, additional staff
is required to fulfill traditional tasks, departments diversify and (sometimes) split to manage
new services, and operations become more elaborated. Such changes usually involve new
processes which are integrated into existing workflows. For the process mapping project to
document every process involving the use of software, it was necessary to understand the
general organization of the company and identify the roles that performed each process in the
value chain, then create an abstract model of the operational areas and roles that accurately
represented how each of these roles, worked together to fulfill the general order flow.
Hemlock is organized into five functional areas that cover sales and customer services,
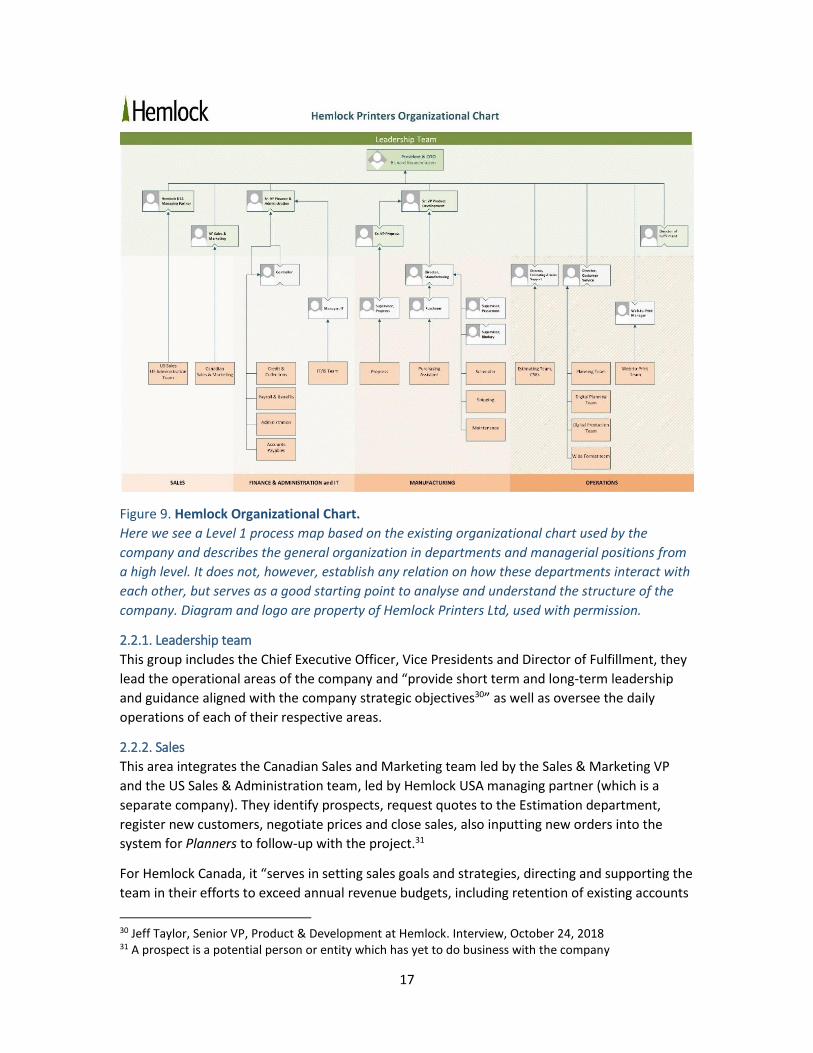
production and fulfillment and finance and accounting. Figure 9 illustrates the overall
organization:
26 Ofori-Dei, Sandra. Building an Efficient Print Production Workflow through Web-to-Print: A Case Study of Hemlock Printers, Simon Fraser University, 2015. p.4 27 Hemlock Printers, Great impressions, colourful legacies, July 2003, BC Business Magazine / Canada Wide, Burnaby, B.C. 2003. 28 Wikipedia contributors, "Organic growth," Wikipedia, The Free Encyclopedia, https://en.wikipedia.org/w/index.php?title=Organic_growth&oldid=874737471 (accessed February 27, 2019). 29 With information from Hemlock Printers, Great impressions, colourful legacies, BC Business Magazine, July 2003, Canada Wide, Burnaby, B.C. p.10 and Interview with Richard Kouwenhoven, CEO & President of Hemlock Printers, November 12, 2018.
17
Figure 9. Hemlock Organizational Chart.
Here we see a Level 1 process map based on the existing organizational chart used by the
company and describes the general organization in departments and managerial positions from
a high level. It does not, however, establish any relation on how these departments interact with
each other, but serves as a good starting point to analyse and understand the structure of the
company. Diagram and logo are property of Hemlock Printers Ltd, used with permission.
2.2.1. Leadership team
This group includes the Chief Executive Officer, Vice Presidents and Director of Fulfillment, they
lead the operational areas of the company and “provide short term and long-term leadership
and guidance aligned with the company strategic objectives30” as well as oversee the daily
operations of each of their respective areas.
2.2.2. Sales
This area integrates the Canadian Sales and Marketing team led by the Sales & Marketing VP
and the US Sales & Administration team, led by Hemlock USA managing partner (which is a
separate company). They identify prospects, request quotes to the Estimation department,
register new customers, negotiate prices and close sales, also inputting new orders into the
system for Planners to follow-up with the project.31
For Hemlock Canada, it “serves in setting sales goals and strategies, directing and supporting the
team in their efforts to exceed annual revenue budgets, including retention of existing accounts
30 Jeff Taylor, Senior VP, Product & Development at Hemlock. Interview, October 24, 2018 31 A prospect is a potential person or entity which has yet to do business with the company

18
and acquiring new clients in the BC and southern Alberta marketplaces. In addition, plays a key
role in the company’s Marketing efforts, including developing printed sales collateral, website
and social media development, organizing events and sponsorships and developing other
promotional opportunities to grow the Hemlock brand”.32
2.2.3. Operations
This area oversees estimating job costs for the customer and the company, divide the job into
printable parts (i.e. a book may be divided in cover, interior pages and possibly a dust jacket),
and managing online web-to-print services. It is divided into the following:
Estimating and Customer Support Representatives: They provide the sales representatives with
quotes for all types of print production under the supervision of the department’s Director. “The
Director also provides pricing support to the sales team if they have an opportunity which would
require special pricing to be competitive, or a different solution to win a project for Hemlock. He
is also responsible to set the pricing in their Management Information System to make sure that
materials are quoted correctly and work with the accounting department to monitor and adjust
estimating standards for equipment and staff”.33
The Planning teams are responsible for creating projects to print jobs, send raw-materials
purchase requests to the production area, manage contacts with outsource suppliers,
contracting their services as required by each project. They also coordinate workflows and keep
track of each job progress, communicate with the customer when required to verify and obtain
approval for proofs and keep them updated about a job status.
The Digital Production team is responsible for planning, scheduling, purchasing, manufacturing
and shipping digital prints jobs. They are considered a separate entity for accounting purposes
and inventory, still, they get jobs inbound from a centralized sales area.
Wide Format Production team, shares similar responsibilities as the digital team but they
manufacture wide format jobs, working closely with third-party suppliers to accomplish the
installation of finished products.
The Web development team oversees several web-based applications which comprise the Web-
to Print system of Hemlock. They create digital platforms where customers can request an
estimate, place orders, submit their print ready-files to get orders printed or manufactured-on-
demand, manage their inventory, get billed, pay, track and fulfill orders.34
2.2.4. Manufacturing
This area is responsible of proofing, scheduling, procuring materials, printing and finishing the
job and shipping to the customers. It is divided into six major departments:
32 Doug Climie, VP Sales & Marketing at Hemlock Canada. Interview, October 21, 2018 33 Stan Potma, Estimating Director at Hemlock, personal interview, October 15, 2018 34 Ofori-Dei, Sandra. Building an Efficient Print Production Workflow through Web-to-Print: A Case Study of Hemlock Printers, Simon Fraser University, pp 35-41

19
The Scheduling department is responsible for programming and calendarizing jobs within the
production facilities of the company based on the Planner specifications, so it can be
manufactured and delivered on time.
The Prepress department receives the graphic designs provided by customers and prepares
them to be printer-ready, checks if the files are correct and the images comply with a minimum
resolution standard, corrects color in files to match the printed process, converts RGB images
into CMYK, generates proofs and color proofs, imposition and exposes plates in high resolution
output35 for the offset presses.
The Purchasing department is responsible of providing just in time paper, materials and
consumables to these print shop as well as managing the paper inventory, receiving invoices,
placing purchase orders and preparing documents to generate payment vouchers to suppliers36.
Pressroom is the area where actual print products are manufactured, after all required
preparations; plates, paper and ink are taken to the press where jobs are printed and finished,
(cut and bind, die-cut or folded depending on the job requirements) or sent to subtrade.
Shipping & Receiving department is responsible for shipping and fulfilling, it is also responsible
for receiving paper and all kind of consumables as well as shipping/receiving outsourced jobs
from third-party suppliers.
Maintenance: This area keeps the building premises in optimum working condition.
2.2.5. Finance & Administration and IT
“The finance & administration department is responsible for invoicing customers, collecting
payments and fulfilling financial obligations with suppliers and partners. They generate financial
and status reports, manage the payroll and employee benefits, keep ledgers and general
accounting, calculate taxes and maintain communications among all areas of the company and
outside actors”.37
The IT/IS department, maintains the network and computer equipment, installs new software,
updates systems and maintains databases, manages security threats and keeps all software in
the company working. Also configure user access privileges to system38.
2.3. Manufacturing Divisions In addition to the overall organization listed above, the company is divided into three
manufacturing divisions, based on the type of printing process they use. All divisions operate
with similar processes but manage them in a very different way.
Division 1 (Litho) comprises the main offices and plant, which are housed in an 80,000 sq. ft
facility since 1986. This is where most of the print jobs for Canada and the US are manufactured
35 Peter Madliger, VP Prepress at Hemlock, Interview, October 15, 2018 36 Lewis Kuiken, Purchasing Officer at Hemlock, Interview, October 18, 2018 37 Mike Breukels, Senior VP Finance at Hemlock, Interview, October 15, 2017 38 Jim de Zwart, IT Manager at Hemlock, Interview, October 15, 2018

20
using several cutting-edge prepress digital equipment, offset presses, bindery, cutting, folding,
die-cutting and other finishing machines.
Division 2 (Digital) is based in a secondary 17,000 square feet facility and is equipped with
digital printers and finishing equipment to manufacture short runs, express orders and other
fulfilment services. It has its own planning, scheduling, billing and shipping staff. For the most
part, it works independently from other divisions.39
Division 4 (Display): This division shares facilities with Division 2, and manufactures display
prints using wide-format digital printers, the size of which allow to print display signs, banners,
mesh banners, interior office graphics, indoor signage and everything that requires a format
bigger than a standard press on paper and special materials.40 Just like division 2, it has its own
planning, scheduling and manufacturing.
2.4. The organizational model created for process mapping Once we understood the company structure, it was necessary to create an abstract model that
satisfied the project needs, allowing to depict the workflows that made possible the fulfilment
of the general order flow shown in Figure 8 and the roles that made them possible. The
organizational chart (Figure 9) shows the company departments but it does not group them in a
functional way or describe the tasks performed, for instance, sales representatives are in close
contact with estimators and planners regardless they belong to different areas of the company.
In order to accurately document the workflows and software usage, a new model based on the
roles performed by staff and some external actors was devised. This role-centered approach
harmonized with the swimlane technique as it had the potential to describe in detail the task
each employee is performing and identify the applications, they use to accomplish them.
39 Except when hybrid projects are handled, these projects include products that are produced in two or more print systems, for example: a magazine where the cover is printed in offset and the interiors in digital printers, or the above-mentioned shells for business cards. 40 "Display." Hemlock. Accessed October 16, 2018. https://www.hemlock.com/portfolio/display/

21
Figure 10. Functional organization and color coding for hemlock operation areas and roles.
The company is divided into three operational areas which incorporate the roles performing the
tasks necessary to function, if you look at Figure 9, you will note this model merges departments
from multiple organizational areas in order to accurately represent the workgroups that enable
the General Order Flow.
Under this scheme, the company was divided into three operational areas, Sales & Customer
service (red), which grouped sales representatives, estimators, planners/coordinators and
customer service representatives. Production (blue) which grouped all manufacturing-related
roles, including scheduling, purchasing, prepress, press room operators and shipping and
Finance & Accounting (yellow), which includes the roles of billing, accounts payables, accounts
receivables, payroll & benefits, reception and IT. External roles were also considered, for the
most common actors outside the company, specially those which interacted with the company
systems such paper merchants whose software systems are connected to the company. Also
note that each area is color coded with roles in tones of the main hue, following the visual
guidelines mentioned in Chapter 1 for an optimal communication.
2.4. Management software systems in Hemlock Because the project required to document the software usage and the resulting process maps
were intended to serve as a guide for the team implementing a new software system, it was also
necessary to list every application used by the company, group them by operational area and
understand which services they were providing to the staff.
As the company grew, there was a corresponding increase in complexity, this is one of the
reasons Hemlock introduced a Managing information System (MIS) in 1999 to enable
communications among departments and automatize tasks. The solution implemented was a

22
product named “PSI”, an acronym for Programmed Solutions Inc. By the company Electronics for
Imaging (EfI).41
Every application in Hemlock worked around a core software system based on PSI which had the
task to collect job-related information such as customer address, order quantities, format or
paper stock, and process it to distribute it to the next recipient in the workflow or help
automatize certain tasks. For example, when an estimator is creating a quote, the system
automatically calculates the weight of the finished product based on the parameters inputted
and consults a database with the shipping costs to provide them with an approximate figure of
the rate to charge.
However, PSI did not cover all the company needs, so for the next 18 years since its
introduction, Hemlock IT kept adding modules, linking other software and developing in-house
applications. The result was a core system linked to each operational area specific solutions that
connected to enable the transmission of data from one department to another, as shown in
Figure 11.
Figure 11. Core systems of Hemlock.
The core systems are all PSI-based and either feed information to the central database or uses it
to process information. Area-specific applications enable departments to operate independently
of the core systems, but their progress is reported back core system via applications such as
JobTracker, PS Internal and PrintFlow. Diagram and logo are property of Hemlock Printers Ltd,
used with permission.
41 Richard Kouwenhoven, CEO & President of Hemlock, Interview, February 15th, 2018. The name is actually that of the developer company, which was bought by EfI merely six months after Hemlock implemented it. EfI kept developing it until year 2010 where they replaced it with other products and turned it into a legacy software.

23
As can be seen, not every application is connected to PSI, however, the services and modules in
the core system are used by every operational area. Of those, some deserve special mention
because they are important communication hubs that automatize critical tasks in the value
chain.
• Printer Site Internal: This is a web-based application that allows sales representatives
(Canadian and US) to request quotes from the estimation team located in the main
plant.
• Job Rocket: This is a browser-based software created for Hemlock by a third-party
company to pull information about jobs from PSI and report it on a webpage. It is used
for consulting and does not allow to input or modify any kind of information.
• Job Tracker: This module was specifically developed in-house and is unique to Hemlock.
It pulls job-related information from PSI, such as customer shipping address, job
specifications and production parameters, reports it and allows operators of different
departments to modify or compliment it to record a job status42.
• Print Flow: Is a Scheduling expansion-module by EfI which allows dynamic scheduling of
jobs.
• Sales Dashboard: This is an in-house developed, web-based application which allow
Sales Representatives manage and register prospects and customers, input orders and,
check schedules, shipping reports, interact with Job Rocket and Job Tracker, and
download resources such as logos, guides and flyers.
• Planning Dashboard: Planners use this dashboard to monitor and manage orders and
jobs, request materials, manage paper and ink inventories and connect with Job Rocket,
Job Tracker and other internal applications.
• Customer Dashboard: Hemlock offers web-to-print services that allow some customers
to order print-on-demand, manufacture-on-demand and pre-finished products directly
from a web-based interface, it also manages online payments and automatically creates
orders for new goods.43
2.5. Chapter 2 summary In this chapter, we reviewed the value chain in Hemlock and the business framework they have
created to fulfill it, we also isolated the roles that perform the essential tasks that make it
possible to quote, prepare, manufacture and deliver a print job and identified the software
systems that help the staff to carry out their duties. We also created an abstract, functional
model that groups these roles as they operate everyday, all this with the intention to set the
foundations for the process mapping project of every workflow in the company. In next chapter,
I will review the graphical style and methods used to gather information and construct process
maps.
42 Jim de Zwart, IT manager at Hemlock, interview, October 13, 2018 43 Ofori-Dei, Sandra. Building an Efficient Print Production Workflow through Web-to-Print: A Case Study of Hemlock Printers, Simon Fraser University, 2015.

24
Chapter 3 Hemlock process mapping techniques and methodology
Once I had a clear vision of the value chain being documented, its processes by area and the
roles involved, it was time to gather the information necessary and build the process maps
required. The first step was to agree on a design style that facilitated the information in a clear
way, for this, some conventions were established. Next, we gathered existing documents that
could help us understand the processes and set out to gather information by means of
interviews, reverse-engineering of software and use of existing documents to create meaningful,
role-centered process maps. These were drawn using the procedure described in the sections
below and thoroughly revised by the staff interviewed, their supervisors and leadership team of
Hemlock.
In this chapter I describe the visual style of Hemlock process maps, the information collection
techniques used, the general methodology to build the diagrams and a step by step process of
how we drew them. This is followed by the technique used to proof and review them and will
conclude with a set of guidelines to organize and publish them for distribution.
3.1. Graphic style conventions
It was already agreed the swimlane system was ideal to document the processes at Hemlock as
it will clearly depict “who was doing what”. We also knew the roles and operational areas of the
company will be colour-coded and it was decided this feature will be used on each lane head, so
readers could identify the areas involved.
A third step was to compile a selection of symbols from the software library and create a Master
Icon and Key conventions for (Hemlock) Process Mapping which also included a guide to the
flows and annotations used explained later. Figure 12 shows this document which serves as the
main reference when interpreting Hemlock process maps and specifies the meaning of each
shape, connector and annotation.

25
Figure 12. Master Icon and Key Conventions for Process Mapping.
The document shown includes every possible shape used in the process mapping of Hemlock, it
also includes details on the organization and software applications naming conventions.
Diagram and logo are property of Hemlock Printers Ltd, used with permission.
To identify the use of systems in each step, a special code was devised in the form of either an
icon or a three-letter code in brackets placed on the lower left corner of each shape allowing
readers to clearly identify the systems used in the process with no need to resort to external
aids (Figure 13).

26
Figure 13. System usage annotations.
The [O] and [PDF] codes below the process box indicate it uses Microsoft Outlook and Adobe
Acrobat as per the reference table on top of the map. Diagram and logo are property of Hemlock
Printers Ltd, used with permission.
3.2. Information gathering and documenting techniques used
Process mapping is always a custom-job, its characteristics change for each project; even among
two companies doing a similar task, no two processes will be the same. To map a process, it is
necessary to gather a significant amount of information before plotting diagrams. This
information is based on a list of requirements which in the case of Hemlock where:
1) A list of stakeholders participating in the process (roles)
2) A list of all the activities that comprise the process, divided by roles
3) The decision points where the process can take different routes depending on the
answer or result of a previous activity
4) The outcomes to those decision points
5) The connections between activities
6) The initial and ending activity of the process
Information was collected in three ways, by means of interviews to key-personnel, reverse
engineering software applications by exploring their functions and links (most were web-based)
and reinterpreting existing documentation to create a base process map that was later enriched
with information gathered with other techniques. Let’s see each of them in detail.
3.2.1. Interviews
This was the most frequently used technique to document processes, talking to key-designated
people performing the roles defined in our operational model, to understand each process and
documenting how they accomplished their tasks, which systems they used and how they
communicated with other areas to do so, separating parts that required software systems from
those done manually.
27
Not every actor in a process needed or could be interviewed to gather information but their role
may be assumed either because they have specific activity to do (e.g. a Customer paying for a
job) or there are specific ways to complete the activity (e.g. paying online by credit card). When
this was the case, other stakeholders can point-out the expected (ideal) outcome and they way
it is accomplished.
Also, some processes are black boxes, where some activities pertain to a specific role and the
process relies on their output without external intervention. When this is the case, the
remaining information must come from the holder of the black box and sometimes, censored to
the rest of the parties involved.44
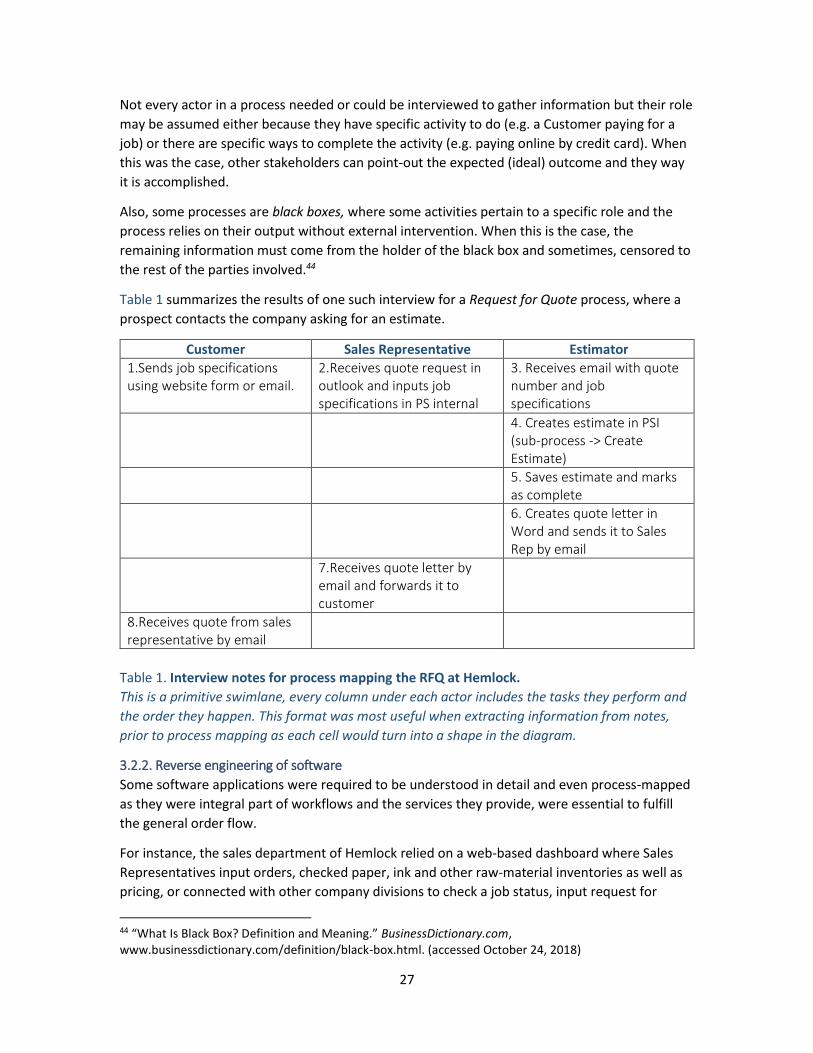
Table 1 summarizes the results of one such interview for a Request for Quote process, where a
prospect contacts the company asking for an estimate.
Customer Sales Representative Estimator
1.Sends job specifications using website form or email.
2.Receives quote request in outlook and inputs job specifications in PS internal
3. Receives email with quote number and job specifications
4. Creates estimate in PSI (sub-process -> Create Estimate)
5. Saves estimate and marks as complete
6. Creates quote letter in Word and sends it to Sales Rep by email
7.Receives quote letter by email and forwards it to customer
8.Receives quote from sales representative by email
Table 1. Interview notes for process mapping the RFQ at Hemlock.
This is a primitive swimlane, every column under each actor includes the tasks they perform and
the order they happen. This format was most useful when extracting information from notes,
prior to process mapping as each cell would turn into a shape in the diagram.
3.2.2. Reverse engineering of software
Some software applications were required to be understood in detail and even process-mapped
as they were integral part of workflows and the services they provide, were essential to fulfill
the general order flow.
For instance, the sales department of Hemlock relied on a web-based dashboard where Sales
Representatives input orders, checked paper, ink and other raw-material inventories as well as
pricing, or connected with other company divisions to check a job status, input request for
44 “What Is Black Box? Definition and Meaning.” BusinessDictionary.com, www.businessdictionary.com/definition/black-box.html. (accessed October 24, 2018)

28
quotes (RFQ) to be sent automatically to estimators via a link to PS Internal and download
resources such as logos, print guides and special promotions.
To document the services provided by this kind of web-based software, it was navigated
following the links and services available. Figure 14 summarizes the procedure used to
document the application.
Figure 14. Reverse engineering of Hemlock sales dashboard.
This diagram shows the procedure followed to navigate and document the web-based software
applications in Hemlock.
Just as we did with interviews, the information gathered was ordained chronologically and a
process map was drawn. In this case, a single lane was used with the role of the staff that uses
such software (e.g. sales representative for the sales dashboard) and software annotations show
the links to other pages or applications and the software system providing the functionality.
3.2.3. Using existing documents
Documents describing the workflows already existed in some departments, they offered an
opportunity to review the process before carrying out interviews and build a starting process
map that would be later completed with the information required by the project.
For instance, we were provided with a list of the activities for the purchasing workflow carried
out by Division 1: Purchasing department, this document even mentioned the software they
used. As such, it was used to create a basic diagram as seen in Figure 15, then several interviews
took place to complete and refine the process map.45
45 In the end, this process proved to be so complex, it had to be split for clarity into three
variants: paper, consumables and general supplies purchases.

29
Figure 15. Using existing documentation to draft process maps.
Existing documentation of the purchasing workflow was provided and used to sketch a basic
workflow. This is a good example of how efficient process maps are at documenting information,
compare the extent of the existing documents on the left with the elegant, streamlined workflow
on the right. Diagram and logo are property of Hemlock Printers Ltd, used with permission.
3.3. General Methodology The method to map Hemlock processes followed was:
1) Identifying and setting the scope: The goal of this first phase is to identify the processes
and tools used by each area and department to understand the scope of the project and
plan a work schedule.
2) Information gathering phase:
a. Carry out interviews with employees fulfilling the main roles being documented.
b. Document software, navigate the application, analyze and document each
option offered by the menu as well as its connections, until all options are
covered.
c. When using existing documents, try to find the author of such documents, if this
is not possible, translate the documents to the new format and fill the gaps by
interviewing people related to the process.
3) Drafting phase: The goal of this phase is to create a first-draft of the process map by:
a. Charting the workflow using the Swimlane system
b. Add notes for software usage
c. Solve discrepancies, dead ends and missing links by interviewing the
interviewees or IT department
4) Review the process:
a. For interviews, approach the interviewee and other stakeholders participating in
the process when applicable reading the maps with them
b. For software, navigate the application again checking if the map contains all
steps of each service.
c. For diagrams based on existing documents, approach the stakeholders as in
item 4a.

30
5) Make changes or adjustments to process maps, review each new version until the
process map is complete.
6) Get revision and approval by a member of the leadership team or authorized officer
managing the area.
7) Submit to CEO for final approval.
3.4. Drafting process maps Here we will explain the way Hemlock process maps were drawn once information was
gathered. It seems many authors of process maps and flowchart guides consider the drawing
procedure an intuitive step, offering few or no examples on how to go through it. Thus, I offer a
simple but complete step by step visual guide based on my experiences to approach this task.
3.4.1. Header Section Start by creating a header that includes the title of the map, process documented, key of
symbols if necessary, map number or code, date it was created and updated and if required.46
Add any brand or logos if necessary (see Figure 16).
Figure 16. Hemlock process map header.
The header includes the basic process information like department, name, date documented and
identifier code, it also offers space for references. Diagram and logo are property of Hemlock
Printers Ltd, used with permission.
3.4.2. Draw lanes and add boxes for each process
A lane for every participant performing a role in the process and activity boxes was added based
on the symbols defined in the Icon and Key conventions for Hemlock Process Mapping, its
header color-coded according to the operational area and role as we stipulated in Figure 8. Each
symbol includes a description of the activity performed. A convenient method found was to go
through the process adding steps in chronological order from left to right (Figure 17).
46 Smith, Fernando Vera. Diagramas De Flujo. Trillas, 1995. p.17

31
Figure 17. Adding lanes and activity boxes.
Steps are drawn based on the information summarized on Table 1. Diagram and logo are
property of Hemlock Printers Ltd, used with permission.
Sometimes, getting shapes fit into a limited space is a major challenge, particularly for very
complex processes. Foreseeing the number of icons required in the busiest lane helps define the
size of the boxes used, if space is a problem, you can separate the map in two parts to allow for
all the activities involved to be clearly depicted. Also consider, conditional expressions always
offer two or more flow ramifications (forks) and require a text specifying the conditions to
follow each outgoing route. Keep them simple and note the options that lead to each route
along the outgoing flows, not in the symbol.
After having added all the symbols to the map, distribute them chronologically from left to right.
Make space for in-between annotations if required, try different layouts. If necessary, print a
version of your map with no connectors and add them manually before moving to the next step.
3.4.3. Draw connectors
Connect the action boxes with arrows pointing in the direction the operation flows from one
box to the other (see Figure 18). Be sure to have all shapes in place before going through this
step. It’s a good idea to keep flows clean and direct so each they can be easily identified.
Bidirectional flows can be depicted with a single connector with two arrowheads or two arrows,
depending on the nature of the flow.47
47 In MS Visio as in similar applications, most symbols have one connector point on each side of the shape, so it is just a matter of choosing one of those points (usually the closer) and drag the cursor to the connection point in the corresponding shape, you can connect several flows to a point or add more connector points.

32
Figure 18. Step boxes arranged and connected.
At this point, a cross-functional workflow is complete, but we still must annotate them to create
a proper process map. Diagram and logo are property of Hemlock Printers Ltd, used with
permission.
Some processes may lead to several outcomes, not necessarily being a decision box, e.g. a
finished document which is both, sent by email and saved in a database. When this is the case,
several connectors (referred to as junction bars) or forks and may require text to clarify the
conditions that lead to each route.48
3.4.4. Add notes and special annotations
Notes add depth to the process map, must be systematic and standardized to avoid confusion.
They can include anything from explanatory texts, production numbers or special codes, in our
case, the most relevant and frequent annotation was that to identify the software used. Also,
we can use different colors on boxes or connector lines of interest to show key activities, ideal
flows, or default routes, use of multiple colors can also identify various processes happening
simultaneously or using shared resources.
48 Harmon, Paul. Business Process Change: A Manager's Guide to Improving, Redesigning, and Automating Processes. Morgan Kaufmann, 2003. p.113

33
Figure 19. Finished RFQ map with annotations.
Note the systems used, the sub-process mark on step 2 on the Estimator lane, indicating there
are other maps detailing this activity which are referenced at the completed references table at
the top. Diagram and logo are property of Hemlock Printers Ltd, used with permission.
Figure 19 shows the finished Request for Quote process map with three participants, besides
the features and design style used. We added a “start” box, this was a feature added later in the
project after finding some problems identifying the starting point. There is also a reference icon
in the form of a small square box with a plus symbol to indicate this activity box links to a sub-
process and has a separate map covering it. Software annotations using the conventions
established at the beginning of the project were also colour-coded to make it easier to identify
the application.
3.5. Reviews and proofing
After completing a process map, it must follow a proofing cycle to ensure the connections make
sense and accurately represent the process, resolving dead ends and discrepancies. Every option
must have a finishing point within the map, or a reference to another map if that is the case.
This phase is essential to correct mistakes and misinterpretations -which are frequent- verify if it
conveys the information it is designed to. The document will also benefit from a copy-edit.49
49 Anderson, Mary Ann., et al. Operations Management for Dummies. John Wiley & Sons Canada, Limited, 2013.

34
As a rule, the more complex a process is, the more reviewers it requires. Ideally, all the
participants in a process should provide feedback, however, sometimes this is not necessary or
even possible.
For this project, the people asked to proof and approve the process maps created were:
1) The interviewee fulfilling the main role.
2) Other people fulfilling a similar or closely-related role.
3) Other Stakeholders appearing in the process map.
4) Managers and/or the VP of the area in question.
5) Hemlock’s President & CEO.
After creating the first draft of each diagram, it is provided (usually as a set) to each interviewee
and read step by step with them, in case corrections, additions or clarifications are needed, a
second and subsequent versions of the diagram are generated, until the reviewers are satisfied
with it, then proceed to the next level in the above list, following the same procedure.
3.6. Guidelines to organize and publish process maps
Once the map set is complete, it will need to be put together and organized with rationales,
references, index and other relevant documents so users can access and understand them50.
The following list suggest the minimum documentation to include when publishing them.
1. Introduction and rationales: These will be useful for new users to learn the context
and goals of the project as well as what to expect from it. It should cover its nature and the
benefits it has to offer, specifying the data and information contained within as well as a
description of each part of the document. If processes involve measures or other calculations,
this should be noted how to operate and apply them. 51
2. Include a reference chart of the graphic system that contains all the symbols,
annotations and conventions used in the diagramming system.
3. Timestamp: Processes by nature, are adapted continuously, sometimes daily, not
giving notice to update them. This piece of data will allow readers know when the processes
were documented and identify if changes or innovations have occurred since then or if the
process is being followed as it is meant to.52
50 Even a single map will need a sort of reference to for readers to interpret the icon and annotation
system it is based on.
51 With information from the following sources: “Structuring Your Essay – 2.” Ryerson University Library & Archives, 24 Nov. 2016, library.ryerson.ca/guides/rusearch/module-two/structuring-your-essay-2/. / (accessed, October 22, 2018) “Writing Advice Home.” Writing Advice, advice.writing.utoronto.ca/planning/intros-and-conclusions/ (accessed, October 22, 2018) 52 Although the participants of a process will usually have an idea of the steps involved by stakeholders, the essential nature is every lane is a Black Box to the rest.
35
4. Indexing: Once all maps, references and introductory texts are created, edited and
completed, it is necessary to order them for consulting. This can be done chronologically,
sequentially (in the order they are taken) or by area of application.
5. Other resources and references like visual or text aids can be devised to help readers
gain a clearer understanding of a project. A master, macroscopic process map illustrating the
super-process, such as the general order flow on Figure 8, or a master process list or previous
documentation to contrast with the new one.
3.7. Chapter 3 summary
This section covered the process of designing, collecting information, drawing, reviewing and
publishing process maps. Although focused on Hemlock’s project, this section also works as a
guide for drawing other types of maps. In the following chapter, we will show some of the maps
created at Hemlock and how they provide opportunities to visualize processes, identify
situations that require attention and look for ways to optimize them.

36
Chapter 4 Results of the Hemlock project and selected analysis cases
So far, we have described the characteristics and guidelines to create visually-efficient process
maps, analyzed Hemlock Printers value chain and created an abstract model of the company
dividing it into operational areas, then explained the techniques and methods used to document
and draw maps for each process of the “general order flow”.
For Hemlock’s process map project, we started mapping the Sales & Customer Service area
based on our abstract model for analysis shown in Figure 10. The reason for this was the roles it
encompasses are the first steps in the general order flow (see Figure 8), after completing the
documentation of every role in this area, we moved to Production, then Finance & Accounting,
following the same order a job moves through the company departments.
In this chapter, we will discuss some results and analyse selected process maps to show some
uses Hemlock has given to process maps created during this project. The General Order Flow in
Figure 8 lists approximately 30 operations but the count for maps documenting Division 1-Litho
was around 60, with an overall count of 84 process maps created. The reason is some processes
include variants or subprocesses that require their own map, like the sales and planning
dashboards which as well other cases of interest such as protocols for payment, credit approvals
or internal material requests.
This is a good example of how process mapping helps identify operations which were assumed
to be part of a process but in fact constitute a separate activity of their own, or how operations
which are assumed to be fulfilled in a single step are (sometimes) distributed across several
processes.
4.1. Systems usage in Hemlock The process maps allowed to identify the activities where software was used and visualize the
frequency of how systems were used by the operational areas of the company, as can be seen in
Figure 20.

37
Figure 20. Most used systems by operational area in Hemlock.
This chart shows the number of processes using each application per operational area. Shipping
has been separated from Production to illustrate the difference in how this department use
systems in a very different proportion than the rest of its operational area. Information used to
build this table is the property of Hemlock Printers, used with permission.
On 49 workflows where PSI enables the processing, transmission or reporting of information, we
see that other core applications such as Job Rocket and Job Tracker are also heavily used,
particularly in Production/Shipping, where at least 75% of the processes use both. This is
interesting as we know the PSI application is used in production areas only to allow employees
to punch hours, the real functionality is powered by PSI in the form of Job Rocket which is used
to pull specifications and Job Tracker which allows to add information to the system, from status
completion, to counts and waste.
What is also interesting, is the heavy reliance on third party systems not connected to PSI, such
as Microsoft Outlook and the Adobe PDF extension, as most of the files shared internally and
externally are in the latter format. This was a key point for the development team of the new
ERP system, as the new platform did not have the ability to publish files in this format and the
feature had to be integrated later based on the analysis that showed the heavy reliance on
PDFs, specially for external communications.
4.2. Analysis of workflows in process maps Although the project had the initial purpose to document the system usage in existing
processes, it also became a valuable tool for assessing situations where the activities and
operations were inefficient or having difficulties. This provided opportunities for improvement,
which is after all, one of the key-features of process maps.
It would be impossible to review all the maps created in this document, but we can offer a few
examples on key cases which will also help us to illustrate some of the most common analysis
points and opportunities for improvement by using process maps. However, before going
9
22
6
12
9
14
6
98
13
68
4
20
4
7
4
21
4 5
SALES AND CUSTOMER SERVICE
PRODUCTION SHIPPING FINANCE & ACCOUNTING
Hemlock systems usage by operational area
PSI MS Outlook Adobe PDF Job Rocket Job Tracker

38
through some case studies found at Hemlock, we need to understand some base points that will
help us identify problems and opportunities for improvement.
1. Identify the bottleneck: As we already explained, this is the step where the process flow
becomes constrained, there is commonly one bottleneck per process, and this is what
determines how fast a process can proceed overall or how much it can produce.53
2. Examine decision boxes and junctions: These offer two or more options based on the answer
to the condition established. A common analysis technique is to document the percentage in
each route occurrence, to gain insights into how often such decision is taken and why. This helps
evaluate if weak choices are necessary, possibly streamlining the process by removing the
decision box, running it parallel to other tasks or batch multiple decisions.54
3. Examine loops: When a process returns to an earlier stage after a decision box and needs to
be run again through part or whole of the process, a loop occurs, some processes can be
indefinitely locked into a loop unless the releasing condition is meet. Loops are sometimes
necessary, but when they involve a waste of time and resources, conditions leading to it should
be re-designed or limited. e.g. A quote rejected due to incorrect information or a manuscript
with persistent errors going forth and back.
4. Check for waste: This is a common point to monitor; if a process is wasting unnecessary
resources or its output is of poor quality, the process may need to be reworked. e.g. Running a
press under its maximum output capacity or (in publishing) returning a manuscript without
having edited it thoroughly.
5. Identify poorly-designed flows or steps: For example, a slow turnaround time by a third-party
supplier that prevents a job to proceed. See if these can be optimized, deviated, improved or
even eliminated. Sometimes, these steps are weak because of external factors that correspond
to a different process which will be exposed when process mapping it.
6. Search for weak links: This means parts of the process where an activity takes a long time to
accomplish, thus, constraining the process, causes for weak links include: lack of training, poor
or unreliable communication channels, frequent equipment failures and the like.
7. Identify Non-Value Aggregated (NVA) steps: NVA steps that do not add any value to the
process output. Sometimes they are required for a process to complete though, e.g.
Transferring a load of paper from a warehouse to the plant is a necessary step but does not add
value to the process. Possible solutions would be to move the warehouse closer or have the
paper delivered directly to the plant by the supplier to be printed.55
53 Anderson, Mary Ann., et al. Operations Management for Dummies. John Wiley & Sons Canada, Limited, 2013. p.27 54 Quiles, Antonette. “HOW DO YOU INTERPRET FLOWCHARTS?” Prezi.com, 22 Sept. 2013,
prezi.com/oafbkusz1stz/how-do-you-interpret-flowcharts/.
55 Based on an example offered by Anderson, Mary Ann., et al. Operations Management for Dummies. John Wiley & Sons Canada, Limited, 2013. p.51

39
8. Check for repeated steps. Some processes go through an unnecessary number of steps,
usually to check quality but also because of unnecessarily repeated activities. A classic example
in publishing, would be an inefficient editing, where the manuscript goes into multiple revisions
because the editor is not providing enough guidance or feedback, the author is not willing to
make changes or comes up with new ideas.56
4.2.1. Example 1: The new estimate workflow
The RFQ process map represented in Figure 18 shows a small icon on the “Estimate Created and
Completed” box, this is an annotation telling us there are other sub-process related. For the RFQ
map, which is a Sales Representative-centered process it was not relevant to show this sub-
process in detail, so it was depicted in Estimator-centered maps, as shown below:
Figure 21. Sub-process mapping example.
This estimator-centered map shows the process to create a New Estimate which is fundamental
to complete the RFQ process. There were 3 variants of this process. Diagram and logo are
property of Hemlock Printers Ltd, used with permission.
This map was required not only because it was important to document estimator’s activities but
because during interviews, sales representatives pointed out they experienced significant delays
(a bottleneck) on RFQs due to estimators taking too long to respond.
56 If you, kind reader, happen to be a member of the Publishing community (probably an MPub student), you may have heard one of those dreadful stories of manuscripts which took seven years in editing. From this perspective those are woefully planned processes and should be avoided.

40
For the most part, software systems were working properly, facilitating the exchange of
information between sales reps and estimators. However, it was found that delays (triangle
shape), occurred mostly when a job required special services, such as foil stamping or
embossing finishes, which are worked by third-party suppliers who must be reached-out by
estimators on a case by case basis to get quotes for such services. Thus, when a customer
requires changes or adjustments, estimators must wait for updated quotes from such external
suppliers. This is in effect, a loop where the quote goes and comes back for revisions following
change in opinions or budget by the customer.57
This fact was known by all parties involved and the leadership team, the use of process maps to
represent the situation allowed for a clearer view of the problem and prompted a change in
protocols to deal with customers regarding sudden changes in design. A more solid solution was
already being worked in the form of a “quick quote” feature in the upcoming system that will
allow sales representatives to offer faster turnaround times for RFQs for simple jobs (only) that
require no intervention from estimators. Although a solution to reduce the request-review loop
on RFQs is still necessary.58
4.2.2. Example 2: The paper purchasing workflow
As we saw in Figure 14, the purchasing department already had some documents listing the
protocol they followed, this information served to sketch a base process map which was
complimented with additional information gathered from interviews, turning into the document
shown in Figure 22.
57 Is common occurrence that when a customer ask for a quote, there is no clear idea of the costs involved, thus, quotes start with a determined amount which is negotiated based on changes to paper, quantities, inks, finishes and other factors. 58 Beyond the general order flow super-process, this loop actually causes delays on the customer side, as they often ask their designers to make changes to the original design to adjust to a budget, leading to waste in resources and time. Another opportunity which an editor should consider before dealing with the printer.

41
Figure 22. Hemlock purchasing department map.
This map shows the complex process of purchasing paper which involves several departments
and conditions that must be met for the workflow to keep going, some of which happen
simultaneously. This is an example where communications among departments is of paramount
importance for the paper to get to the press on time, a critical operation for the general order
flow. Diagram and logo are property of Hemlock Printers Ltd, used with permission.
If we look at Figure 14, we will see a drastic jump from a 11-box sketch diagram based on the
existing notes, to one with 24 for paper purchasing.
This workflow involves several actors to allow the purchasing department to carry out paper
purchases. It is unique in that it has various potential bottlenecks, such as the “settle credit hold
process” conditional which authorizes the purchasing of paper only after certain payment
conditions have been met, the “availability of paper” decision box or even the “reception by
(the) shipping” department step. After analyzing this map, the following conclusions were
reached:
Situation 1, Prepayment required: Some customers with credit holds require making a
prepayment before their job materials are bought, causing a delay in the process.
Solution proposed: This is a bottleneck problem that is solved outside this workflow, before the
job reaches this stage, by asking the customer to pay the advance from earlier stages so its

42
cleared once the job moves to purchasing. The check still must be made though, but ideally, it
will be already freed.59
Situation 2, Paper availability: This is a major problem, an example of a poorly designed or
weak workflow. It also causes potential waste as the estimators and planners have invested
time in quoting and creating a project with specifications for paper and ink based on a specific
paper type not knowing if it is available. Ideally, the paper should be in stock with the supplier,
but the long times at RFQ and estimating causes this to vary, or the stock may have been
discontinued recently, or the turnaround time could be past the job’s deadline. Thus, on many
occasions, the purchasing department suggests a substitute, which leads to run the general
order flow from the estimation process again (different paper means different costs, creating a
loop), waiting time and resources spent.
Solution proposed: Hemlock has a real-time connection to its three major paper merchants to
check for stock in the form of the JIT list application (part of PSI core), but access is only
available to the purchasing department, planners have to their own paper list in the planner
dashboard and estimators rely on catalogue references and base their calculations on
specifications given to them by the sales representatives.
Thus, in the current state, access by estimators and planners to JIT list with the capacity for
planners to reserve paper stocks would be ideal to minimize the risk of shortages and allow the
standardization of tools. This solution will drastically change various workflows, such as that of
figure 19 leading to a restructuring of responsibilities.
Situation 3, Shipping department on inventories: On the shipping department side, there are
also potential problems as they tend to receive shipments as they come, so when order
quantities do not match those required by the purchasing department, there is no way to alert
this to the suppliers to solve the matter quickly, an example of another weak design and lack of
decision capabilities.60
Solution proposed: The shipping department should have access to its own JiT-List messaging
system to paper merchants to let them know when orders are incomplete or incorrect, instead
of having to communicate this to purchasing to solve the matter. A reporting feature directly
linked to other departments involved (planning, scheduling and purchasing) would also send an
update of the situation and solutions available on time.
There are other situations related to this process map, and solutions are in the process to be
implemented in the new ERP system, the diagnose however, has been made based on the
information obtained during the process map.
59 Another fact is Division 2 usually omits this protocol to favor faster turnaround times, their deadlines being tight and paper not requiring additional investment as it is part of the stock in the warehouse. 60 Receiving fewer paper than needed completely stops the production of a job as it cannot be printed
until ink, paper and print plates are ready, by extension it affects scheduling, purchasing and planning.

43
4.2.3. Example 3: The time-sheet reporting workflow
Employees use PSI to punch their work hours, coffee breaks and lunch times, the system keeps
track of those times and generate a report to be used by payroll. Staff supervisors also create
their own reports on this matter and deliver them to the receptionist, who every day, compares
the PSI report with that of the supervisors, exporting the file to Microsoft access and adjusting
the digital report so that it matches the one of the supervisors and finally, creating a hard copy
to be delivered to the payroll administrator.
Figure 23. Hemlock time hours reporting map.
This map shows how paperwork for time hours reporting is tripled by having a report from PSI,
which is compared to the supervisor’s notes (also from PSI) and finally captured in a third
database in MS Access to be printed and input into the payroll system. Diagram and logo are
property of Hemlock Printers Ltd, used with permission.
This is a good example of a repeated process that causes waste of time for the receptionist and
insists on working through a series of hard copy documents instead of through a digital system.
The reasons that lead to the supervisors list are mainly to record actual work time, versus idle
times that are not considered in PSI. The workflow shows how the paperwork is tripled, from a
simple report, to a second report by the supervisors, then to a third version processed a
Microsoft Access file that is finally printed, forwarded and inputted again in the payroll system.
This process could be easily streamlined if everything worked digital, for example, if supervisors
could modify the actual records in PSI and this file could be exported directly into the payroll

44
system. At this moment, there are considerations to allow the new ERP to measure actual work
times only based on the machine operation with the supervisors confirming this, but the results
will still need to be printed in hard copy to be inputted in the payroll system.
4.3. Chapter 4 summary
We started this chapter with an analysis of the frequency on software systems used by each
operational area in Hemlock and found a heavy dependency on PSI and other core applications
as expected. What we did not know was the proportion on how they were being used by
operational area and that third-party applications were equally important, particularly to
provide communication services.
Next, we described some guidelines to identify problems and opportunities for improvement
and went through three process maps describing operations at Hemlock and applied those
guidelines, analyzed the workflow, found problems and proposed viable solutions.
We must clarify some of these solutions make assumptions based on information contained on
maps not shown here, what it important is that information was gathered through the same
project and is documented as well. This means that it is available for distribution among
stakeholders and decision-makers to enable conversations based on a solid reference.
Before such documentation existed, conversations had to take place around the (assumed)
common knowledge of subjects, where important details could be omitted involuntarily or as
part of the balkanization effect mentioned in Chapter 1. Having process maps as reference not
only enhances communication but also allows for a standardization which is fundamental to
reach consensus on improvements.
Finally, the proposed solutions discussed may be feasible but require changes in other processes
and such changes cause systemic changes, meaning they impact other areas in the production
chain, or require investment in new technologies. This is one of the reasons process maps help
members from different operational areas to discuss and find consensus as they provide input
on their own area of expertise, leading to integrated solutions.

45
Conclusions
In previous pages, I summarized a series of concepts to provide readers with the necessary elements to elaborate process maps in an efficient and visually attractive way (Chapter 1). Next, we talked about how abstract models of Hemlock Printers and its core software systems were created for study (Chapter 2). Then, I described the methodology used to create these diagrams, including the techniques to gather information and a brief, guide on how to draw, review and publish them (Chapter 3). Finally, we analyzed some of the diagrams prepared for the company and discussed possible solutions to the problems identified (Chapter 4). Here I will discuss conclusions based on my experience at working on Hemlock’s process mapping project. At the beginning of this document, I described the characteristics and capabilities of process maps with a focus on the swimlane technique, which allows to plot activities by role and, like other process maps, include annotations about subjects of interest. This style proved to be an ideal solution to address Hemlock’s problem as it distinguishes each participant activities in a workflow and offers a clear view of how they use software in processes. The process mapping project provided the company with a documented reference of the workflows in its value chain as they are carried out using the PSI management information system. As expected, this helped visualize and understand how processes take place and relate to each other and has been used to identify the services for data processing, automation and communications that each role requires and verify if the upcoming MIS offers suitable replacements for them. To address this project in an integrated way and successfully map a company the size of
Hemlock (whose complexity is distributed among many staff members), it was essential to have
a general understanding of the value chain and the company organization as described in
Chapter 2. The operational model and list of roles created for study provided solid grounds to
work through the areas of the company and identify the people to look for relevant
information.61 It also helped create a new vision of the value chain. What I originally saw as a
stepped workflow divided by departments, revealed to be a fluid operation consisting of several
sub-processes that rely on many software applications that provide functionality, and intricated
relationships where communication is critical. The simplified model that divides the company
into operational areas helped me to integrate groups of roles performing functions at various
stages.
The project was planned to proceed in a linear way, covering one department at a time, but this
was not always possible because most processes involve people from different departments and
areas. For instance, if you look at Figure 22, you will see there are six roles involved in paper
purchasing. When I was documenting this process, I had to interview people from these areas to
know how they contributed to the process, even if their roles were scheduled to be mapped in a
latter moment.
61 It is important to mention, that for interviews, I was assigned to work with specific advisors and key-personnel from each area appointed by the project director and sponsor, Richard Kouwenhoven.

46
The interviews carried out turned interviewees into active participants of the project, many of
them offered opinions on current processes and suggestions on how to improve them. This
additional input had to be recorded separately, sometimes as alternative process maps, others
as reports but in general, proved highly valuable and were used as a guideline to improve
processes and identify situations that were causing disruptions or highlight services which are
important for the staff to keep in the new system.
The revision phase of (process map) drafts offered some interesting feedback to all parties
involved. Mostly, we focused on correcting imprecisions, but also provided revisors with the
opportunity to visualize a process from a higher perspective (for the first time to many), giving
them a distinct understanding on how a task flowed (perhaps one they had started), how other
departments got involved and what software they used. These were well-known facts, but until
then, people understood it in an abstract or functional way, so it was common to hear an
expression like “Mmmh… so this is what happens!” after those revisions.
While the project was conceived with the purpose of helping the MIS implementation team to
identify the services provided by software and how workflows benefited from them, there were
aggregated values. For instance, areas like Finance & Accounting found value in the new visual
style based on the swimlane and asked to have some of their existing flowcharts to be updated
so they could be used in negotiations with customers.
The project has not been made openly available to staff but is being used as part of an ongoing
discussion with key-personnel to identify problems and propose solutions. These range from re-
configuring MS Outlook to filter emails more efficiently to creating new functions in the
upcoming MIS system.
A future phase of the project aims to create process maps that document the workflows using
this new MIS, to compare the changes done and measure any increases in productivity. Going
even further, a third phase aims to create an ideal workflow regardless of system capabilities
which will set achievable goals for future innovations.
As it is happening in Hemlock, process maps have proved their value to several industries. We
can confirm they are a useful tool to document, plan, innovate and transmit information. This
may not be a surprise as they have existed for a long time and have a considerable support
bibliography that continues to grow. The question is: can we find value for them in publishing
contexts as well? Can they become a tool that we can adapt and use regularly?
Granted, publishing is not a manufacturing industry, but publishers follow complex processes
too, like those aiming to create books and magazines. If process maps are flexible documents
that constitute a convenient and easy to understand way of communication used by industries
to understand themselves and optimize their value chains, certainly we can find ways to use
them. Given the number of people involved in publishing projects, process maps may be helpful
in organizing the workflows and movement of the various documents related to carry a work
through to publication.
For instance, we can create a process map with the workflow of a substantive editing process to
use with writers and customize it for each project, adding annotations for deadlines, word count

47
and number of manuscript revisions forecasted. This will be useful to explain the activities
carried out at every step, establish a work agenda and set deadlines right from the start, then,
as the project advances, we can keep track of progress. Once done, we can use this information
to analyze the evolution of our projects to evaluate the benefits and problems in our ways to
carry them.
Another idea would be to map the processes involved in book production (a super process),
starting from the submission of a manuscript, to substantial and copy editing, graphic design
and layout, print, marketing, launching and promotion, calculating sales and revenue and
looking forward to future editions. This will be useful in many ways: first to visualize the entire
process, assign times for each phase of it. Second, to train and negotiate delivery and work
schedules with writers, editors, printers, distributors and other stakeholders. Third, to
document the events that happen during the process which will in turn provide insights into
which processes are acting as bottlenecks or areas that we can improve.
As tools specifically designed for analysis, with established methodologies for study and
optimization and other benefits mentioned in this document, process maps provide
opportunities to publishing as well, to think out-of-the-box, find opportunities for optimization
or manage operations more efficiently, in effect, helping us to renew and innovate the industry.

48
Bibliography consulted and Works Cited
Anderson, Mary Ann., et al. Operations Management for Dummies. John Wiley & Sons Canada, Limited, 2013. Blackler, Alethea, et. al. “Designing for Intuitive use of Products”, School of Design and Built Environment, Queensland University of Technology, Australia, https://core.ac.uk/download/pdf/10873647.pdf Beal, Vangie. “MIS - Management Information System.” What Is MIS - Management Information System? Webopedia Definition, www.webopedia.com/TERM/M/MIS.html. Business Analyst Community & Resources | Modern Analyst. “Interview Questions for Business Analysts and Systems Analysts.” What Is a Swimlane Diagram? > Business Analyst Community & Resources | Modern Analyst, www.modernanalyst.com/Careers/InterviewQuestions/tabid/128/ID/1804/What-is-a-Swimlane-Diagram.aspx.
Canadian Printer March 24, 2009. “Hemlock Claims First Heidelberg Eco Award.” Marketing
Magazine, marketingmag.ca/green/hemlock-claims-first-heidelberg-eco-award-7699/
“Characterizing the Measurement Process.” ISixSigma, www.isixsigma.com/tools-
templates/measurement-systems-analysis-msa-gage-rr/characterizing-measurement-
process/. Accessed, October 27, 2018
“EFI PrintFlow.” Electronics for Imaging, www.efi.com/products/productivity-software/scheduling/efi-printflow/overview/. “Flowchart Tutorial (Complete Flowchart Guide with Examples).” Creately Blog, 19 Sept. 2018, creately.com/blog/diagrams/flowchart-guide-flowchart-tutorial/. Gemignani, Zach, et al. Data Fluency: Empowering Your Organization with Effective Data Communication. Wiley, 2015. Hemlock Printers, Great impressions, colourful legacies, BC Business Magazine, July 2003, Canada Wide, Burnaby, B.C. Hemlock Printers, www.offsetters.ca/advisory-services/case-studies/hemlock-printers
(accessed October 28, 2018)
“ISO 5807:1985.” Developing Standards, 17 Sept. 2015, www.iso.org/standard/11955.html. Harmon, Paul. Business Process Change: A Manager's Guide to Improving, Redesigning, and Automating Processes. Morgan Kaufmann, 2003. Kenton, Will. "Value Chain." Investopedia. https://www.investopedia.com/terms/v/valuechain.asp (accessed February 22, 2019).

49
Knaflic, Cole Nussbaumer. Storytelling with Data: A Data Visualization Guide for Business Professionals. Wiley, 2015. Market Intelligence for Printing and Publishing.” EFI Advances PSI Management System Functionality with Data Collection and Flexo-Specific Quote Modules - WhatTheyThink, whattheythink.com/news/23387-efi-advances-psi-management-system-functionality-with/.
Ofori-Dei, Sandra. Building an Efficient Print Production Workflow through Web-to-Print: A
Case Study of Hemlock Printers, Simon Fraser University, 2015.
Palmgren, Dale. “Home.” Accounting Software World, www.accountingsoftwareworld.com/software-reviews/exact-macola. Piatt, Jason. “8 Steps to Proper Operational Process Change.” IndustryWeek, 5 Apr. 2017, www.industryweek.com/quality/8-steps-proper-operational-process-change.
Quiles, Antonette. “HOW DO YOU INTERPRET FLOWCHARTS?” Prezi.com, 22 Sept. 2013, prezi.com/oafbkusz1stz/how-do-you-interpret-flowcharts/.
Smartdraw.com. (2019). Flowchart Symbols. [online] Available at: https://www.smartdraw.com/flowchart/flowchart-symbols.htm [Accessed 29 Nov. 2018]. Smith, Fernando Vera. Diagramas De Flujo. Trillas, 1995. “Structuring Your Essay – 2.” Ryerson University Library & Archives, 24 Nov. 2016, library.ryerson.ca/guides/rusearch/module-two/structuring-your-essay-2/. Tickel, Craig. “5 Ways to Improve a Process.” GoLeanSixSigma.com, goleansixsigma.com/5-
ways-improve-process/. (accessed, October 28, 2018).
“Top 28 Free & Premium Flowchart Software - Compare Reviews, Features, Pricing in 2018.” PAT RESEARCH: B2B Reviews, Buying Guides & Best Practices, 21 July 2018, www.predictiveanalyticstoday.com/top-free-flowchart-software/. “What Is Black Box? Definition and Meaning.” BusinessDictionary.com, www.businessdictionary.com/definition/black-box.html. “What Is ISO 9001:2015 – Quality Management Systems?” What Is a Quality Management System? | ASQ, ASQ, asq.org/learn-about-quality/iso-9000/iso-9001-2015/. “What Is Reverse Engineering? - Definition from WhatIs.com.” SearchSoftwareQuality, searchsoftwarequality.techtarget.com/definition/reverse-engineering. Wikipedia contributors, "Best practice," Wikipedia, The Free Encyclopedia, https://en.wikipedia.org/w/index.php?title=Best_practice&oldid=883186054 (accessed March 18, 2019).

50
Wikipedia contributors, "Organic growth," Wikipedia, The Free Encyclopedia, https://en.wikipedia.org/w/index.php?title=Organic_growth&oldid=874737471 (accessed February 27, 2019). Woll, Thomas. Publishing for Profit: Successful Bottom-Line Management for Book Publishers. Chicago Review Press, 2014.

![MONOGRAFIA CONSOLIDADA - Henrique Bawdenbdm.unb.br/bitstream/10483/18874/1/2017_HenriqueBawdenSilveriodeCastro.pdfki dojxp lqgtflr vlqdol]dqgr d dgromr gh suiwlfdv uhjxodwyuldv pdlv](https://img.pdfslide.us/doc/110x75/5e5732dcef7a0e57f006b5e0/monografia-consolidada-henrique-ki-dojxp-lqgtflr-vlqdoldqgr-d-dgromr-gh-suiwlfdv.jpg)