Embed Size (px)
Citation preview

Prod
uct B
roch
ure
| Ver
sion
28.
00
R&S®FSW Signal and Spectrum AnalyzerSetting standards in RF performance and usability
year

2
R&S®FSW Signal and Spectrum AnalyzerAt a glanceThe high-performance R&S®FSW signal and spectrum analyzer was developed to meet demanding customer requirements. Offering low phase noise, wide analysis bandwidth as well as straightforward and intuitive operation, the analyzer makes measurements fast and easy.
Users in the aerospace and defense (A&D) sector and de-velopers of future, wideband communications systems will find plenty of reasons why the R&S®FSW is the right solu-tion for their T&M requirements. With phase noise unparal-leled among signal and spectrum analyzers, the R&S®FSW facilitates the development of oscillators intended for use in radar systems, for example.
The R&S®FSW offers up to 5 GHz analysis bandwidth for measuring wideband-modulated or frequency agile sig-nals. Currently, signal and spectrum analyzers measure different standards (GSM, CDMA2000®, WCDMA, LTE) separately.
The R&S®FSW takes analysis to the next level, providing capability to measure multiple standards simultaneously. Users can quickly and easily detect and eliminate errors caused by interaction between signals.
Featuring a touchscreen user interface, a flat menu structure and straightforward result representation, the R&S®FSW offers exceptional ease of operation. Various measurements can be displayed simultaneously in sepa-rate windows on the large 12.1" screen, which greatly fa-cilitates result interpretation.
Front view of the R&S®FSW.
Rohde & Schwarz R&S®FSW Signal and Spectrum Analyzer 3
BenefitsThe R&S®FSW also scores top marks when it comes to measurement speed. Providing 1000 sweep/s in remote operation and delay-free switching between instrument setups, the R&S®FSW ranks top among the signal and spectrum analyzers available on the market.
Equipped with the R&S®FSW-B71 option, the R&S®FSW can analyze signals in the analog baseband. The R&S®FSW-B17 option allows measurements in the digital baseband.
Key facts ❙ Frequency range from 2 Hz to 8/13.6/26.5/43.5/50/67/85/90 GHz (with external harmonic mixers from Rohde & Schwarz up to 500 GHz)
❙ Low phase noise of –137 dBc (1 Hz) at 10 kHz offset (1 GHz carrier)
❙ –88 dBc dynamic range (with noise cancellation) for WCDMA ACLR measurements
❙ Up to 5 GHz analysis bandwidth ❙ < 0.4 dB total measurement uncertainty up to 8 GHz ❙ Real-time analysis up to 512 MHz bandwidth ❙ High-resolution 12.1" (31 cm) touchscreen for convenient operation
❙ Multiple measurement applications can be run and displayed in parallel
RF performance that meets exacting demands
▷ page 4
Ready for the future
▷ page 6
Designed for convenience – with straightforward result display
▷ page 9
Ideal for analyzing radar systems
▷ page 10
Identifying interaction between signals
▷ page 12
A safe investment
▷ page 13
When speed counts
▷ page 14
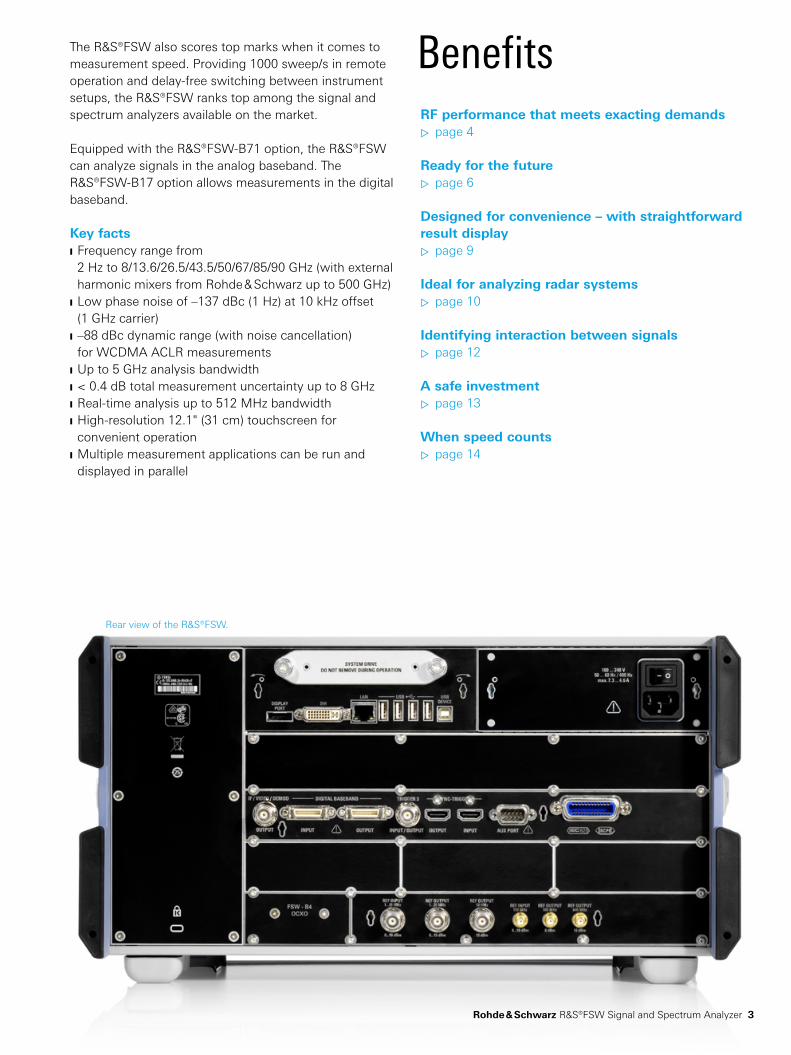
Rear view of the R&S®FSW.

4
RF performance that meets exacting demands
The R&S®FSW redefines the top of the line for signal and spectrum analyzers, offering superior RF performance in terms of phase noise, displayed average noise level (with-out noise cancellation), intermodulation suppression and dynamic range for ACLR and harmonic measurements.
Unmatched phase noise – ideal for measuring oscillators for radar and communications applicationsDevelopers of oscillators, synthesizers or transmit systems benefit from the R&S®FSW analyzer's excellent dynamic range for phase noise measurements. At 10 kHz offset from the carrier, the R&S®FSW achieves phase noise of –137 dBc (1 Hz) for a 1 GHz carrier and –128 dBc (1 Hz) for a 10 GHz carrier. At 100 Hz offset from the carrier, values of –110 dBc (1 Hz) and –90 dBc (1 Hz) are attained. The R&S®FSW therefore outperforms previous analyzers by more than 10 dB.
Phase noise at 10 kHz offset from a 1 GHz
carrier: –137 dBc (1 Hz).
Harmonic measurement with highpass filter
switched on (yellow trace) and off (blue trace).

Rohde & Schwarz R&S®FSW Signal and Spectrum Analyzer 5
Displayed average noise level (DANL) with
preamplifier and noise cancellation switched on.
High sensitivity even at low frequenciesThe DANL of the R&S®FSW at low frequencies is improved by routing the input signal directly to the A/D converter. This yields high sensitivity of –120 dBm (1 Hz) at 2 Hz even in the audio and baseband frequency range – surpassing comparable analyzers by up to 20 dB.
High accuracyThe R&S®FSW offers high level measurement accuracy up to 8 GHz. This means that the analyzer measures signal levels with < 0.4 dB total measurement uncertainty, for ex-ample in the 5.8 GHz ISM band or in satellite communica-tions or radar bands.
Unparalleled dynamic range up to 1 GHz with separate receive pathThe R&S®FSW has a separate receive path optimized for frequencies < 1 GHz. This yields a dynamic range unat-tained so far, for example for measurements on radio sys-tems for public safety and security.
Ultrawideband filters in sweep modeUWB standards such as EN 302 065 call for a 50 MHz filter to be used in sweep mode for peak power measurements, a measurement easily performed with the R&S®FSW. With its optional resolution bandwidths of 28 MHz, 50 MHz and 80 MHz, the R&S®FSW offers unique possibilities for wideband signal testing.
Excellent dynamic range for spurious measurements thanks to low DANLFeaturing a low displayed average noise level (DANL) of typ. –159 dBm (1 Hz) at 2 GHz and –150 dBm (1 Hz) at 25 GHz without using a preamplifier, the R&S®FSW mea-sures spurious emissions quickly and reliably over a wide frequency range. DANL can be further improved by up to 13 dB by means of the analyzer's switch-selected noise cancellation. As a result, users can identify even the small-est of spurious emissions that were previously hidden in the noise floor, and effectively optimize transmit systems.
Harmonic measurements made easy – due to integrated highpass filtersThe R&S®FSW can optionally be equipped with switchable highpass filters (R&S®FSW-B13) for carrier frequencies up to 1.5 GHz for harmonic measurements on transmit sys-tems, resulting in a clear improvement of dynamic range over conventional spectrum analyzers. External filters are no longer needed. This facilitates test system setup for GSM, CDMA2000®, WCDMA, LTE and TETRA systems, for example.
6
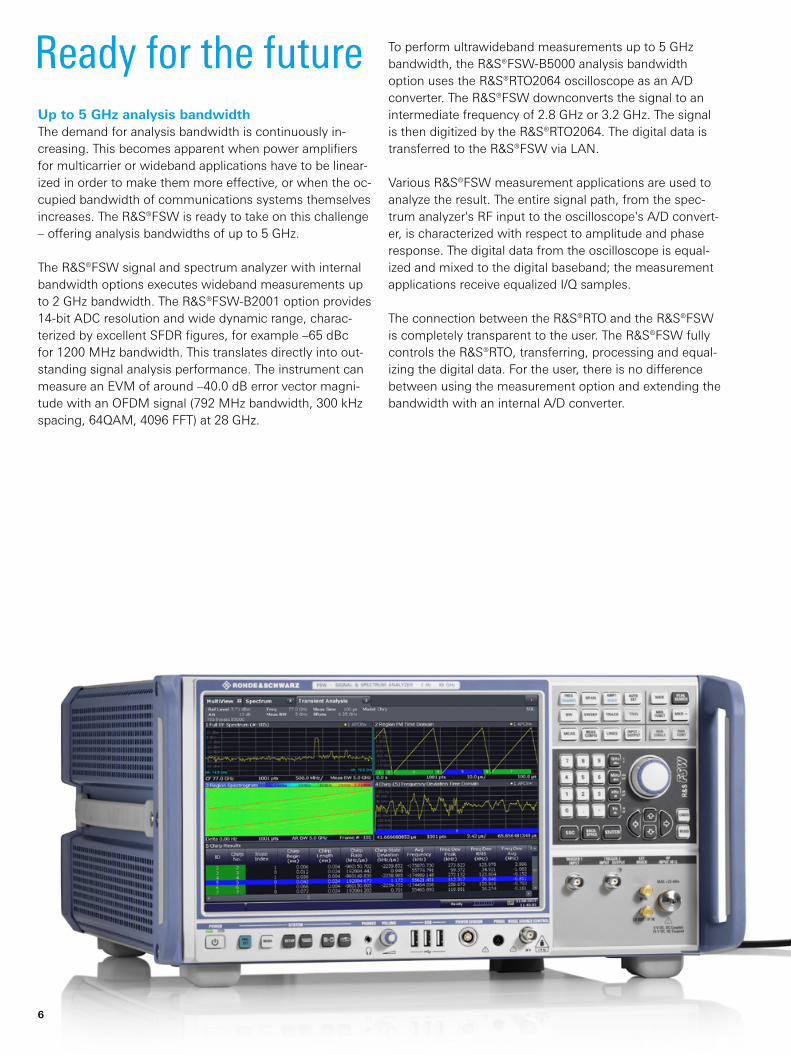
Ready for the future To perform ultrawideband measurements up to 5 GHz bandwidth, the R&S®FSW-B5000 analysis bandwidth option uses the R&S®RTO2064 oscilloscope as an A/D converter. The R&S®FSW downconverts the signal to an intermediate frequency of 2.8 GHz or 3.2 GHz. The signal is then digitized by the R&S®RTO2064. The digital data is transferred to the R&S®FSW via LAN.
Various R&S®FSW measurement applications are used to analyze the result. The entire signal path, from the spec-trum analyzer's RF input to the oscilloscope's A/D convert-er, is characterized with respect to amplitude and phase response. The digital data from the oscilloscope is equal-ized and mixed to the digital baseband; the measurement applications receive equalized I/Q samples.
The connection between the R&S®RTO and the R&S®FSW is completely transparent to the user. The R&S®FSW fully controls the R&S®RTO, transferring, processing and equal-izing the digital data. For the user, there is no difference between using the measurement option and extending the bandwidth with an internal A/D converter.
Up to 5 GHz analysis bandwidthThe demand for analysis bandwidth is continuously in-creasing. This becomes apparent when power amplifiers for multicarrier or wideband applications have to be linear-ized in order to make them more effective, or when the oc-cupied bandwidth of communications systems themselves increases. The R&S®FSW is ready to take on this challenge – offering analysis bandwidths of up to 5 GHz.
The R&S®FSW signal and spectrum analyzer with in ternal bandwidth options exe cutes wideband measurements up to 2 GHz bandwidth. The R&S®FSW-B2001 option provides 14-bit ADC resolution and wide dynamic range, charac-terized by excellent SFDR figures, for example –65 dBc for 1200 MHz bandwidth. This translates directly into out-standing signal analysis performance. The instrument can measure an EVM of around –40.0 dB error vector magni-tude with an OFDM signal (792 MHz bandwidth, 300 kHz spacing, 64QAM, 4096 FFT) at 28 GHz.

Rohde & Schwarz R&S®FSW Signal and Spectrum Analyzer 7
Configuration Maximum analy-sis bandwidth
Applications
Standard 10 MHz ❙ Standard applications and measurements on single carriers, e.g. WCDMA, CDMA2000®, TD-SCDMA, TETRA carriers
R&S®FSW-B28 28 MHz ❙ Modulation measurements on WiMAX™, LTE, WLAN IEEE 802.11a/b/g/p signals
R&S®FSW-B40 40 MHz ❙ Amplifier characterization and linearization ❙ Modulation measurements on WLAN IEEE 802.11n signals
R&S®FSW-B80 80 MHz ❙ Amplifier characterization and linearization ❙ Wideband pulse measurements ❙ Modulation measurements on WLAN IEEE 802.11ac and IEEE 802.11ax signals
R&S®FSW-B160 160 MHz ❙ Amplifier characterization and linearization ❙ Wideband pulse measurements ❙ Modulation measurements on WLAN IEEE 802.11ac signals and IEEE 802.11ax signals
R&S®FSW-B320 320 MHz ❙ Amplifier characterization and linearization ❙ Wideband pulse measurements
R&S®FSW-B512 512 MHz ❙ Amplifier characterization and linearization ❙ Wideband pulsed and automotive radar measurements
R&S®FSW-B1200 1) 1.2 GHz ❙ Wideband modulation measurements for future wireless and satellite communications standards (5G)
❙ Amplifier characterization and linearization ❙ Wideband pulse measurements
R&S®FSW-B2001 1) 2 GHz ❙ Wideband pulse measurements ❙ Wideband measurements on CW and frequency hopping radar systems ❙ Wideband modulation measurements for future wireless and satellite communications standards ❙ Amplifier characterization and linearization
R&S®FSW-B2000 2)
(plus R&S®RTO2044)2 GHz ❙ Modulation measurements on WLAN IEEE 802.11ad signals
❙ Wideband pulsed and automotive radar measurements ❙ Wideband measurements on CW and frequency hopping radar systems ❙ Wideband modulation measurements for future wireless and satellite communications standards
R&S®FSW-B5000 3) (plus R&S®RTO2064)
5 GHz ❙ Wideband pulsed and automotive radar measurements ❙ Wideband measurements on CW and frequency hopping radar systems ❙ Wideband modulation measurements for future wireless and satellite communications standards ❙ Modulation measurements on WLAN IEEE 802.11ay signals
1) Available for R&S®FSW43/50.2) Available for R&S®FSW26/43/50/67/85.3) Available for R&S®FSW43/85.
Signal analysis up to 5 GHz with the
R&S®FSW-B5000 analysis bandwidth option
and an R&S®RTO2064 oscilloscope.

8
High spurious-free dynamic range of > 100 dBcIn addition to A/D converter resolution, the available spu-rious-free dynamic range (SFDR) plays an eminent role when analyzing I/Q data.
With an SFDR well over 100 dBc at 10 MHz, the R&S®FSW offers unprecedented accuracy when it comes to lineariz-ing amplifiers or measuring EVM.
Large I/Q memory depth for seamless recording of long signal sequencesWith the R&S®FSW-B106 option the R&S®FSW has 1320 Msample I/Q memory. Signals can be recorded over extended periods of time, even when analyzing large bandwidths. This makes it easier to identify and analyze sporadic errors.
Deembedding functionThe R&S®FSW-K544 frequency response correction option uses an S-parameter matrix in Touchstone format to com-pensate the frequency response (magnitude and phase) introduced by the cables and fixtures in the measurement setup.
Third-order intermodulation distor-
tion (IM3) of < –70 dBc, measured
with the R&S®FSW-B512 option.
Option Analysis bandwidth (internal)
SFDR
Standard 10 MHz 100 dBc
R&S®FSW-B80 80 MHz 80 dBc
R&S®FSW-B160 160 MHz 78 dBc
R&S®FSW-B320 320 MHz 72 dBc
R&S®FSW-B512 1) 512 MHz 70 dBc
R&S®FSW-B1200 2) 1.2 GHz 65 dBc
R&S®FSW-B2001 2) 2 GHz 60 dBc
1) Not available together with the R&S®FSW-U160, R&S®FSW-B160, R&S®FSW-U320, R&S®FSW-B320, R&S®FSW-U160R and R&S®FSW-B160R options.
2) Available for R&S®FSW43/50. Not with R&S®FSW-B2000.
Analysis bandwidth (internal)
Sampling rate
Maximum recording time
10 MHz 12.5 Msample/s 112 s
20 MHz 25 Msample/s 56 s
40 MHz 50 Msample/s 28 s
80 MHz 100 Msample/s 14 s
160 MHz 200 Msample/s 7 s
320 MHz 400 Msample/s 1.5 s
512 MHz 600 Msample/s 0.76 s
1.2 GHz 1.5 Gsample/s 0.3 s
2 GHz 2.5 Gsample/s 0.18 s
Analysis bandwidth (with R&S®RTO20xx as external digitizer and R&S®RTO-B110 option)
Sampling rate
Maximum recording time
2 GHz 2.5 Gsample/s 79 ms
5 GHz 6.25 Gsample/s 100 ms

Rohde & Schwarz R&S®FSW Signal and Spectrum Analyzer 9
Designed for convenience – with straightforward result display
MultiView: multiple results available at a glanceThe MultiView function enables the user to display multi-ple results simultaneously on the 12.1" touchscreen of the R&S®FSW.
Optimum configuration and combination of measurement applicationsFor example, in one measurement diagram, the user can analyze the wanted spectrum of a radar signal. In a second diagram with separate settings, the signal harmonics can be measured. A third diagram can be activated to measure and statistically evaluate the pulse rise and fall times as well as phase shift keying within a pulse (intrapulse PSK) using the R&S®FSW-K6 application. The desired diagram (measurement application) can be activated by clicking the associated tab. Clicking the MultiView tab will simultane-ously display all active measurements.
The multichannel sequencer makes it possible to run mul-tiple measurement applications virtually in parallel. Mea-suring signals at different frequencies and according to different parameters previously called for a step-by-step approach, i.e. measurements had to be performed one after the other, which was a time-consuming procedure. The new functionality now makes it possible to run dif-ferent measurement applications virtually simultaneously and view all results at a glance. This provides an enormous speed advantage for signal measurements during develop-ment and verification.
MultiView function.
The R&S®FSW turns into a reality what many users desire: configuration, measurement and analysis that are truly intuitive.
Efficient operation thanks to optimized user guidanceFrom block diagrams reflecting the signal flow on the R&S®FSW touchscreen, the user can select a desired ele-ment and access all functions via straightforward dialogs. The R&S®FSW uses flat menu structures throughout, mak-ing it easy to navigate to a desired function or setting. For example, up to eight traces can be configured in a single dialog. Dialog windows are transparent, so that the signal of interest is always visible.
Frequently used control functions are assigned to hardkeys. Via a toolbar, users can quickly access global functions, such as the zoom function or the storage func-tion for saving measurement data and screen content.

10
Ideal for analyzing radar systems
Equipped with the R&S®FSW-K6
pulse measurements option, the
R&S®FSW delivers pulse parame-
ters at the touch of a key.
Rapid identification of spurious emissions, low phase noise, extensive pulse analysis functions and wide analysis bandwidth make the R&S®FSW signal and spectrum ana-lyzer an essential tool in the development and production of radar systems.
Fast identification and analysis of spurious emissionsTo identify spurious emissions from a transmitter or os-cillator, measurements are often carried out over large frequency ranges at narrow analysis bandwidths. Due to its short sweep times, the R&S®FSW delivers results very quickly even for this demanding application.
At 1 kHz resolution bandwidth and a frequency range up to 8 GHz, the R&S®FSW outputs a spectrum with levels down to –100 dBm within 10 s. Using the zoom or the MultiView function, users can investigate detected spu-rious emissions in greater detail while keeping an eye on the overall spectrum.
Low phase noise for oscillator measurementsRadar systems are equipped with highly stable oscillators in order to achieve high resolution. They can accurately determine the speed of moving objects, for example. With its outstanding RF performance, the R&S®FSW is the ideal tool for measuring these oscillators (see page 4).

Rohde & Schwarz R&S®FSW Signal and Spectrum Analyzer 11
Measuring pulse parameters at the touch of a keyCharacterizing radar systems requires numerous pulse pa-rameters to be measured. The R&S®FSW-K6 option mea-sures – at the touch of a key – all relevant parameters such as pulse duration, pulse period, pulse rise and fall times, power drop across a pulse, and intrapulse phase modula-tion, and produces a trend analysis over many pulses. The user selects the results to be displayed simultaneously on the screen. The R&S®FSW delivers a full picture of a radar system within seconds.
The R&S®FSW-K6 option can be upgraded with the R&S®FSW-K6S option to automatically measure the com-pression parameters of modulated pulses. Results such as the mainlobe vs. sidelobe level and the time differences between the mainlobe and the sidelobes are displayed in the results summary table. The user can upload reference pulse waveforms in I/Q format and compare phase and frequency within a pulse with the measured values.
The R&S®FSW-K6 option offers especially efficient memory management for analyzing trends over very long periods. The Segmented I/Q Capture function ensures that I/Q data is only timestamped and stored in memory when a pulse is detected. This feature significantly increases the analysis period – by nearly a factor of 1000 for pulse lengths less than 1 μs and a 1 kHz pulse repetition interval.
Detection of wideband frequency hopping signalsThe R&S®FSW can also analyze frequency agile, pulsed signals where the frequency varies within a pulse (chirp) or from pulse to pulse (hopping). In addition to the R&S®FSW-K6 pulse analysis option, the R&S®FSW-K60 transient analysis option is ideal for radar system manu-facturers and developers who need to characterize fre-quency agile signals, including analysis of hopping se-quences (R&S®FSW-K60H) and chirp frequency response (R&S®FSW-K60C). The R&S®FSW-K60C option displays the frequency response and calculates the deviation from the ideal linear phase, even for nonpulsed FM CW radar sig-nals used in distance radars and fill level measurements. The R&S®FSW-K60H option displays the dwell time, set-tling time, switching time, frequency offset, power and an automatic analysis of the hopping sequence of fast fre-quency hopping, pulsed signals.
Analyzing short pulse rise and fall times Analyzing short pulses requires a wide dynamic range and a large analysis bandwidth. The R&S®FSW has both(see page 6).
Equipped with the R&S®FSW-K60C
transient chirp measurement
option, the R&S®FSW can analyze
FMCW chirps like those used in
automotive radar.

12
Identifying interaction between signals
Multistandard real-time analyzer (MSRT)The multistandard real-time analyzer (MSRT) can be used to detect short, sporadic interference signals and their influence on adjacent signals. The MSRT seamlessly ac-quires the spectrum. As soon as the frequency mask trig-ger is activated, the recorded I/Q data is transferred to the measurement application and analyzed. The data covers a settable time span before and after the trigger event. As with the MSRA, time-correlated dependencies between signals are retained.
Developers of multistandard transmitters use the MSRT to identify the cause and influence of sporadic spurious emis-sions on wanted signals.
Equipped with the pulse analysis option (R&S®FSW-K6) and a transient analysis option (R&S®FSW-K60/-K60C/ -K60H), the MSRT supports other measurement applica-tions for analyzing pulses and frequency agile systems, such as hopping sequences of radar systems.
Multistandard radio analyzer
(MSRA): Signals are captured
once, then analyzed according to
different standards and at different
frequencies in parallel.
Multistandard radio analyzer (MSRA)The constantly growing demand for wireless transmission capacity results in ever more complex signal scenarios. Multistandard transmitters transmit signals according to various standards over a common RF path. Measuring RF signal quality and RF signal interaction poses new chal-lenges for signal and spectrum analyzers, both in terms of speed and the ability to measure different signals in parallel.
The R&S®FSW meets this challenge with its multistandard radio analyzer (MSRA) function. The MSRA simultaneously measures signals of different standards (GSM, WCDMA, LTE, etc.) at different frequencies within 512 MHz analysis bandwidth.

Rohde & Schwarz R&S®FSW Signal and Spectrum Analyzer 13
A safe investment Keeping pace with technological advancementFast innovation cycles, new transmission methods, grow-ing data volumes and ever higher bandwidths mean that analyzers have to constantly cope with new T&M require-ments during their useful life. The R&S®FSW has a mod-ular design, i.e. subassemblies such as the controller, the power supply and the digital backend are inserted into slots on the rear. Optional modules, such as for extending I/Q demodulation bandwidth, are likewise accommodated on the rear. Measurement applications can be activated with a key code.
R&S®Legacy Pro – easy replacement of obsolete analyzersIn a test system, core elements such as spectrum ana-lyzers may have to be replaced, for example because an analyzer becomes inoperative and repair is not possible, or because the user wants to benefit from the higher mea-surement speed of a more state-of-the-art instrument. Re-placement may be required despite test system software having been validated at substantial cost and effort. The R&S®FSW supports the remote control command sets of other Rohde & Schwarz signal and spectrum analyzers, such as the R&S®FSU and R&S®FSQ, as well as those of other manufacturers' legacy instruments (R&S®Lega-cy Pro). Replacing an obsolete analyzer with an R&S®FSW therefore poses no problems. In most cases it is sufficient to verify the response of the R&S®FSW during a measure-ment sequence. Numerous successful reference projects with the R&S®FSV or R&S®FSU prove the efficiency of this replacement approach.
Firmware updates – always in step with new developmentsR&S®FSW firmware updates can be downloaded from a USB flash drive or via LAN. Updates are available free of charge at www.rohde-schwarz.com
Keeping measurement data confidentialTo keep their measurement data confidential, users can ex-change the internal solid state disk (SSD) of the R&S®FSW for another, neutral SSD (R&S®FSW-B18 option). The in-strument can then be sent in for calibration or any other purpose without any confidential measurement data leav-ing the lab. Device-specific alignment data remains in the analyzer, where it is stored separately and independently of user data.

14
When speed counts A wide variety of measurements are needed in order to validate and verify the characteristics of RF ICs, modules and systems under various conditions, for example at dif-ferent frequencies, temperatures or with different supply voltages.
The R&S®FSW effectively supports these measurements by offering high speed, efficient measurement functions and fast switchover between instrument setups. This speeds up test sequences and reduces the time to the fi-nal product.
High measurement rates and fast sweep times with sweep rates of up to 1000 sweep/sWith a sweep rate of up to 800 sweep/s in manual oper-ation and 1000 sweep/s in remote control, the R&S®FSW offers performance superior to that of comparable signal and spectrum analyzers. The R&S®FSW speeds up mea-surements that require a high averaging factor, as are frequently stipulated in test specifications for communica-tions standards.
Measurement speed of the R&S®FSWLocal measurement and display update rate 1001 sweep points 1.25 ms (800/s) (meas.)
Remote measurement, average over 1000 sweeps 1001 sweep points 1.0 ms (1000/s) (meas.)
Remote measurement including data transfer via LAN 5 ms (200/s) (meas.)
Marker peak search 1.7 ms (meas.)
Setting of center frequency including data transfer f ≤ 8 GHz 15 ms (meas.)
f > 8 GHz 65 ms (meas.)

Rohde & Schwarz R&S®FSW Signal and Spectrum Analyzer 15
Fast switchover between instrument setupsWith the R&S®FSW, different instrument setups can be kept in RAM simultaneously to accommodate measure-ments requiring different settings. This minimizes the time to switch between instrument setups and operating modes. For example, test routines that involve switchover between spectrum and modulation measurements are per-formed faster.
Efficient measurement functions speed up operation ❙ Frequency list mode: fast measurement on up to 300 frequencies with different analyzer settings triggered by just a single remote control command
❙ Measurement of different power levels in the time domain in just a single sweep (multisummary marker)
❙ Frequency counter with 0.1 Hz resolution at < 50 ms measurement time
❙ Fast ACP measurement in the time domain using channel filters or in the frequency domain using FFT sweep
Integrated support of R&S®NRP power sensorsThe R&S®FSW supports the operation of up to four R&S®NRP power sensors. This simplifies test system ar-chitecture. No extra, separately controlled base units are needed to connect the sensors, which also speeds up test system control.
R&S®FSW with R&S®NRP40S power sensor.

16
The R&S®FSW-K70 option enables users to flexibly analyze digitally modulated single carriers down to the bit level. The clearly structured operating concept simplifies mea-surements, despite the wide range of analysis tools.
Flexible modulation analysis from MSK to 4096QAM ❙ Modulation formats:
■ 2FSK, 4FSK, 16FSK, 32FSK ■ MSK, GMSK, DMSK ■ BPSK, QPSK, Offset-QPSK, DQPSK, 8PSK, D8PSK, π/4-DQPSK, 3π/8-8PSK, π/8-D8PSK
■ 16QAM, 32QAM, 64QAM, 128QAM, 256QAM, 512QAM, 1024QAM, 2048QAM, 4096QAM
■ 16APSK (DVB-S2), 32APSK (DVB-S2), 2ASK, 4ASK, π/4-16QAM (EDGE), –π/4-16QAM (EDGE), SOQPSK
❙ Analysis length up to 64 000 symbols ❙ 10 MHz internal signal analysis bandwidth (optionally 40/80/160/320/512/1200/2000 MHz and 5 GHz)
Numerous standard-specific default settings ❙ User-definable constellations and mappings ❙ GSM, GSM/EDGE ❙ 3GPP WCDMA, EUTRA/LTE, CDMA2000® ❙ TETRA, APCO25 ❙ Bluetooth®, ZigBee ❙ DECT, DVB-S2
R&S®FSW-K70 optionVector signal analysis application
Clearly structured block diagram
display.

Rohde & Schwarz R&S®FSW Signal and Spectrum Analyzer 17
Flexible analysis tools for detailed signal analysis make troubleshooting really easy ❙ Display choices for amplitude, frequency, phase, I/Q, eye diagram; amplitude, phase or frequency error; constellation or vector diagram
❙ Analysis of RF signals or analog and digital baseband signals
❙ Statistical evaluations ■ Histogram representation ■ Standard deviation and 95th percentile in the result summary
❙ Spectrum analyses of the measurement and error signal considerably support users in finding signal errors such as incorrect filtering or spurious emissions
❙ Flexible burst search for the analysis of complex signal combinations, short bursts or signal mix – capabilities that go beyond the scope of many signal analyzers
❙ Bit error measurements on PRBS data or on known data sequences
❙ Equalizer helps in finding the optimum filter design
32QAM with four screens.
Easy operation with graphical supportThe visualization of the demodulation stages and the as-sociated settings is so clear that even beginners and infre-quent users can find the correct settings. The combination of touchscreen and block diagram simplifies operation and representation.
Based on the description of the signal to be analyzed (e.g. modulation format, continuous or with bursts, symbol rate, transmit filtering), the R&S®FSW-K70 option helps users automatically find useful settings.
18
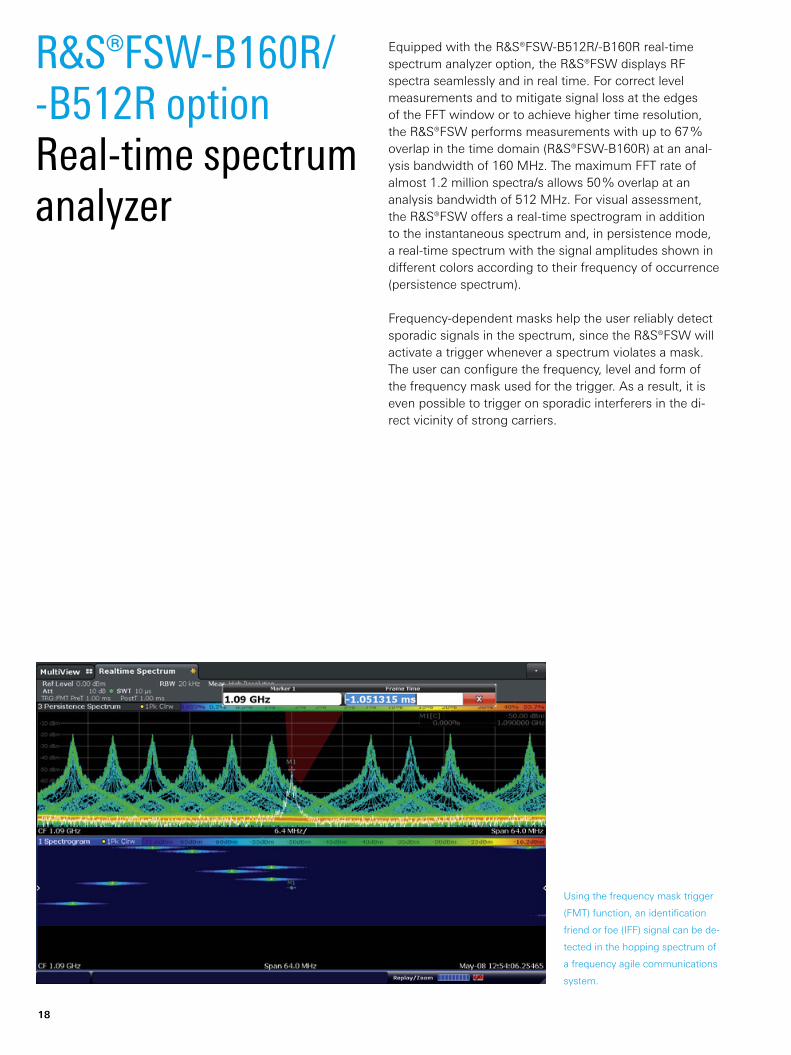
Equipped with the R&S®FSW-B512R/-B160R real-time spectrum analyzer option, the R&S®FSW displays RF spectra seamlessly and in real time. For correct level measurements and to mitigate signal loss at the edges of the FFT window or to achieve higher time resolution, the R&S®FSW performs measurements with up to 67 % overlap in the time domain (R&S®FSW-B160R) at an anal-ysis bandwidth of 160 MHz. The maximum FFT rate of almost 1.2 million spectra/s allows 50 % overlap at an analysis bandwidth of 512 MHz. For visual assessment, the R&S®FSW offers a real-time spectrogram in addition to the instantaneous spectrum and, in persistence mode, a real-time spectrum with the signal amplitudes shown in different colors according to their frequency of occurrence (persistence spectrum).
Frequency-dependent masks help the user reliably detect sporadic signals in the spectrum, since the R&S®FSW will activate a trigger whenever a spectrum violates a mask. The user can configure the frequency, level and form of the frequency mask used for the trigger. As a result, it is even possible to trigger on sporadic interferers in the di-rect vicinity of strong carriers.
R&S®FSW-B160R/ -B512R optionReal-time spectrum analyzer
Using the frequency mask trigger
(FMT) function, an identification
friend or foe (IFF) signal can be de-
tected in the hopping spectrum of
a frequency agile communications
system.

Rohde & Schwarz R&S®FSW Signal and Spectrum Analyzer 19
Without requiring extra equipment the R&S®FSW signal and spectrum analyzer can be configured or retrofitted for the detection of sporadic signals. The R&S®FSW-B160R or R&S®FSW-B512R option makes the R&S®FSW a full-fea-tured signal and spectrum analyzer with built-in real-time analyzer.
The real-time spectrum analyzer included in the R&S®FSW-B160R/-B512R options helps RF design engi-neers detect short and sporadic interference signals and identify their causes (e.g. interference originating from digital circuits or produced during synthesizer frequency switching). Seamless spectrum display is necessary, for example, to analyze existing frequency hopping algorithms or create alternative ones to prevent collisions between signals of different standards operating in the same fre-quency band (e.g. WLAN and Bluetooth®).
Aerospace and defense (A&D) engineers will primarily fo-cus on seamlessly analyzing frequency agile radar signals and detecting unwanted spurious emissions or validat-ing tactical, frequency agile communications systems. Regulatory authorities also need to seamlessly monitor frequency bands and reliably detect unwanted or unli-censed signals. The R&S®FSW with the R&S®FSW-B160R or R&S®FSW-B512R real-time spectrum analyzer option meets this challenge.
When real-time analysis is required and only signals > 15 µs need to be fully and accurately detected, then the R&S®FSW-K160RE option can be installed alongside the R&S®FSW-B160 option.
The persistence spectra 512 MHz
above the ISM band at 2.4 GHz
and below can be simultaneously
displayed thanks to the MultiView
function of the R&S®FSW.
Key parameters in real-time analysisR&S®FSW-B512R R&S®FSW-B160R R&S®FSW-K160RE 1)
FFT length 1024 to 32k 1024 to 16k 1024 to 16k
Max. real-time analysis bandwidth 512 MHz 160 MHz 160 MHz
Max. FFT rate 1 171 875 585 938 58 824
POI 0.91 µs 1.87 µs > 15 µs
RBW freely configurable for span/RBW ratio 6.25 to 6400 6.35 to 3200 6.25 to 3200
1) Not available together with the R&S®FSW-B512 option. R&S®FSW-B160/-B320/-U160 or R&S®FSW-U320 option required.

20
General-purpose measurement applicationsMeasurement application
Measurement parameters Measurement functions
R&S®FSW-K6Pulse measurements
R&S®FSW-K6STime sidelobe 1)
Pulse parameters: ❙ Timing: pulse width, pulse repetition interval, pulse repetition interval, duty cycle, rise/fall time, settling time, timestamp, off time
❙ Frequency: carrier frequency, pulse-to-pulse frequency difference, chirp rate, frequency deviation, frequency error
❙ Power: peak power, average power, peak-to-average power, pulse-to-pulse power
❙ Phase: carrier phase, pulse-to-pulse phase difference, phase deviation, phase error
❙ Amplitude: droop, ripple, overshoot width, top/base power, average on power, average transmitted power, minimum/peak power, peak-to-average/peak-to-min power ratio, pulse-to-pulse power ratio
❙ Time sidelobe: peak-to-sidelobe level, integrated sidelobe level, mainlobe 3 dB width, sidelobe delay, compression ratio, mainlobe power/phase/ frequency, peak correlation
❙ Point-in-pulse measurements: frequency, amplitude, phase versus pulse, trends and histograms for all parameters
❙ Pulse statistics: standard deviation, average, maximum, minimum
❙ Pulse tables ❙ User-defined measurement parameters ❙ Segmented data capturing ❙ Time sidelobe analysis (R&S®FSW-K6S option required)
R&S®FSW-K7Modulation analysis for AM/FM/φM modulated single carriers
❙ Modulation depth (AM) ❙ Frequency deviation (FM) ❙ Phase deviation (φM) ❙ Modulation frequency ❙ THD and SINAD ❙ Carrier power
❙ AF spectrum ❙ RF spectrum ❙ AF scope display ❙ AF filters (lowpass and highpass) ❙ Weighting filters (CCITT) ❙ Squelch
R&S®FSW-K15VOR/ILS measurements
VOR: ❙ Bearing (VOR phase) ❙ 30/9960 Hz AM modulation depth ❙ 30 Hz FM deviation (subcarrier) ❙ 30/9960 Hz AM/30 Hz FM: frequency, K2, K3, THD ❙ Identifier: modulation depth, frequency, codeILS: ❙ DDM, SDM ❙ 90/150 Hz AM modulation depth ❙ 90/150 Hz AM: frequency, K2, K3, THD, phase ❙ Identifier: modulation depth, frequency, code
❙ Reference measurements for calibrating navigation receivers ❙ Production test measurements of ILS/VOR ground stations ❙ Measurement and calibration of ramp testers
R&S®FSW-K17Multicarrier group delay measurements
❙ Group delay (absolute and relative) ❙ Magnitude ❙ Phase
❙ Up to 512 MHz signal capture bandwidth ❙ Calibration (load and save calibration data) for measurement of components and frequency converters
❙ Configurable multicarrier scenarios
R&S®FSW-K18Amplifier measure-ments 2)
R&S®FSW-K18DDirect DPD measurements 3)
❙ AM-AM, AM-PM, EVM ❙ Width of AM-PM and AM-AM curves ❙ Synchronous measurement of RF signal and amplifier current and voltage
❙ Power added efficiency (PAE) on amplifiers with envelope tracking
❙ General amplifier measurements ❙ Polynomial-based digital predistortion (R&S®FSW-K18) ❙ Direct digital predistortion (R&S®FSW-K18D) ❙ Control and synchronization of the R&S®SMW200A vector signal generator
R&S®FSW-K19Noise power ratio measurements
❙ Noise power ratio ❙ Noise power ratio measures the intermodulation and noise floor of RF transponders and components in satellite systems
R&S®FSW-K30Noise figure and gain measurements based on Y-factor method 4)
❙ Noise figure ❙ Noise temperature ❙ Gain ❙ Y factor
❙ Analyzer noise correction (second stage correction) ❙ Measurements on frequency-converting DUTs ❙ Control of a generator as an LO in frequency-converting measurements
❙ SSB and DSB
R&S®FSW-K40Phase noise measurements
❙ SSB phase noise ❙ Residual FM and residual φM ❙ Jitter
❙ 1 Hz to 10 GHz offset range ❙ Selection of resolution bandwidth and number of averages for each offset range
❙ Definable evaluation ranges for residual FM/φM ❙ Signal tracking ❙ Optional suppression of spurious emissions
Various measurement applications
Rohde & Schwarz R&S®FSW Signal and Spectrum Analyzer 21
General-purpose measurement applicationsMeasurement application
Measurement parameters Measurement functions
R&S®FSW-K50Spurious measurements
❙ List with true spurious emissions that violate a predefined threshold
❙ A second threshold can be defined as a hard limit; spurious emissions that violate this threshold are listed in red
❙ Detection of spurious emissions with optimized resolution bandwidth in line with a predefined S/N ratio
❙ At least three times faster than standard measurement through optimal configuration of test parameters
❙ Spot search for further optimization of S/N ratio ❙ Targeted search for spurious emissions ❙ Suppression of internal spurious emissions
R&S®FSW-K54EMC diagnosis and precompliance mea-surements in line with commercial and military standards
❙ Disturbance voltage ❙ Disturbance power ❙ Disturbance radiation
❙ Detectors and resolution bandwidths in line with CISPR 16-1-1 and MIL-STD/DO160
❙ Up to 16 independent measurement markers; linkable to various EMI detectors and measurement times
❙ Limit lines and correction factors for typical measurement tasks
❙ Choice of linear or logarithmic scale on frequency axis ❙ Marker demodulation (AM/FM) for signal identification
R&S®FSW-K544Frequency responsecorrection
❙ SnP file in Touchstone file format ❙ Corrects frequency response (amplitude and phase) of the measurement setup.
R&S®FSW-K60/ -K60C/-K60HTransient analysis
❙ Frequency hopping signals: dwell time, settling time, switching time, frequency deviation, power, phase deviation, power ripple
❙ Chirp signals: frequency deviation, chirp begin, chirp length, chirp rate, chirp state deviation, phase deviation, power, power ripple
❙ Spectrogram and section of spectrogram, tabular display, frequency, frequency error, phase and amplitude versus time, FFT spectrum
❙ Pan and zoom functions to select analysis region using touch gestures supported in spectrogram, spectrum and time domain trace displays
❙ Trends and histograms for all parameters ❙ Hop/chirp statistics: standard deviation, average, maximum, minimum
❙ User-defined measurement parameters
Measurement applications for wireless communications systemsMeasurement application/technology
Power Modulation quality Spectrum measurements
Miscellaneous Special features
R&S®FSW-K10GSM/EDGE/ EDGE Evolution
❙ Power measurement in time domain including carrier power
❙ EVM ❙ Phase/frequency error ❙ Origin offset suppression
❙ Constellation diagram
❙ Modulation spectrum
❙ Transient spectrum
– ❙ Single burst and multiburst ❙ Automatic detection of modulation
R&S®FSW-K72/-K733GPP FDD (WCDMA)
❙ Code domain power ❙ Code domain power versus time
❙ CCDF
❙ EVM ❙ Peak code domain error ❙ Constellation diagram ❙ I/Q offset ❙ Residual code domain error
❙ I/Q imbalance ❙ Gain imbalance ❙ Center frequency error (chip rate error)
❙ Spectrum mask ❙ ACLR ❙ Power measurement
❙ Channel table with channels used on base station
❙ Timing offset ❙ Power versus time
❙ Automatic detection of active channels and decoding of useful information
❙ Automatic detection of encryption code
❙ Automatic detection of HSDPA modulation format
❙ Support of compressed mode signals
❙ Support of HSPA and HSPA+ (HSDPA+ and HSUPA+)
R&S®FSW-K76/-K77TD-SCDMA
❙ Code domain power ❙ Code domain power versus time
❙ CCDF
❙ EVM ❙ Peak code domain error ❙ Constellation diagram ❙ I/Q offset ❙ Residual code domain error
❙ Gain imbalance ❙ Center frequency error (chip rate error)
❙ Spectrum mask ❙ ACLR ❙ Power measurement
❙ Channel table with channels used on base station
❙ Timing offset ❙ Power versus time
❙ Automatic detection of active channels and decoding of useful information
❙ Automatic detection of HSDPA modulation format
❙ Support of HSPA+ (HSDPA+ and HSUPA+)
1) Requires R&S®FSW-K6.2) Requires the R&S®SMW200A vector signal generator.3) Requires R&S®FSW-K18.4) Requires an external noise source, e.g. Noisecom NC346.

22
Measurement applications for wireless communications systemsMeasurement application/technology
Power Modulation quality Spectrum measurements
Miscellaneous Special features
R&S®FSW-K82/-K83CDMA2000®
❙ Carrier power ❙ Code domain power ❙ Code domain power versus time
❙ CCDF
❙ RHO ❙ EVM ❙ Constellation diagram ❙ I/Q offset ❙ I/Q imbalance ❙ Center frequency error
❙ Spectrum mask ❙ ACLR ❙ Power measurement
❙ Channel table with channels used on base station
❙ Timing offset
❙ Automatic detection of active channels and decoding of useful information
❙ Robust demodulation algorithms for reliable measurement of multicarrier signals
R&S®FSW-K84/-K851xEV-DO
❙ Carrier power ❙ Code domain power ❙ Code domain power versus time
❙ CCDF
❙ RHOPilot (R&S®FSW-K84) ❙ RHOData (R&S®FSW-K84) ❙ RHOMAC (R&S®FSW-K84) ❙ RHOOverall
❙ EVM ❙ Constellation diagram ❙ I/Q offset ❙ I/Q imbalance ❙ Center frequency error
❙ Spectrum mask ❙ ACLR ❙ Power measurement
❙ Channel table with channels used on base station
❙ Timing offset
❙ Automatic detection of active channels and decoding of useful information
❙ Robust demodulation algorithms for reliable measurement of multicarrier signals
R&S®FSW-K91WLAN IEEE 802.11a/b/gR&S®FSW-K91PWLAN IEEE 802.11p R&S®FSW-K91NWLAN IEEE 802.11nR&S®FSW-K91ACWLAN IEEE 802.11acR&S®FSW-K91AXWLAN IEEE 802.11ax
❙ Power versus time ❙ Burst power ❙ Crest factor
❙ EVM (pilot, data) ❙ EVM versus carrier ❙ EVM versus symbol ❙ Constellation diagram ❙ I/Q offset ❙ I/Q imbalance ❙ Gain imbalance ❙ Center frequency error ❙ Symbol clock error ❙ Group delay
❙ Spectrum mask ❙ ACLR ❙ Power measurement
❙ Spectrum flatness
❙ Bitstream ❙ Signal field ❙ Constellation versus carrier
❙ Automatic detection of burst type
❙ Automatic detection of MCS index
❙ Automatic detection of bandwidth
❙ Automatic detection of guard interval
❙ Estimation of payload length from burst
❙ IEEE 802.11ax PPDU formats: HE SU PPDU, HE MU PPDU, HE trigger-based PPDU, HE extended range SU PPDU
R&S®FSW-K95WLAN IEEE 802.11ad
❙ Power versus time ❙ PPDU power ❙ Crest factor
❙ EVM (pilot, data) ❙ Constellation diagram ❙ I/Q offset ❙ I/Q imbalance ❙ Gain imbalance ❙ Symbol clock error ❙ Center frequency error ❙ Time skew ❙ Phase error versus symbol
❙ Phase tracking versus symbol
❙ Spectrum mask ❙ Power spectrum ❙ Channel frequency response
❙ Bit error rate ❙ Header information
❙ Bitstream (encoded and decoded)
❙ Automatic detection of PPDU type
❙ Automatic detection of MCS index
R&S®FSW-K100/ -K101/-K104/-K105EUTRA/LTE TDD and FDDUL and DL
❙ Power measurement in time and frequency domains
❙ CCDF
❙ EVM ❙ Constellation diagram ❙ I/Q offset ❙ Gain imbalance ❙ Quadrature error ❙ Center frequency error (symbol clock error)
❙ Spectrum mask ❙ ACLR ❙ Power measurement
❙ Spectrum flatness
❙ Bitstream ❙ Allocation summary list
❙ Averaging over multiple measurements
Automatic detection of modu-lation, cyclic prefix length and cell ID
R&S®FSW-K102EUTRA/LTE MIMO
❙ See R&S®FSW-K100/ -K104 modulation quality measurements for each individual MIMO path
❙ MIMO time alignment for R&S®FSW-K100/-K104
❙ Interband carrier aggregation time alignment
R&S®FSW-K103EUTRA/LTE-Advanced UL
❙ Multicarrier ACLR for FDD and TDD
❙ SEM for contiguously aggregated component carriers

Rohde & Schwarz R&S®FSW Signal and Spectrum Analyzer 23
Measurement applications for wireless communications systemsMeasurement application/technology
Power Modulation quality Spectrum measurements
Miscellaneous Special features
R&S®FS-K100PC/ -K101PC/-K102PC/ -K103PC/-K104PC/ -K105PCLTE FDD, TDD and MIMO
❙ Power measurement in time and frequency domains
❙ CCDF
❙ EVM ❙ Constellation diagram ❙ I/Q offset ❙ Gain imbalance ❙ Quadrature error ❙ Center frequency error (symbol clock error)
❙ Spectrum flatness ❙ Power spectrum ❙ ACLR ❙ Spectrum mask
❙ Bitstream ❙ Allocation summary list
❙ Signal flow diagram
❙ Averaging over multiple measurements
❙ Automatic detection of modulation, cyclic prefix length and cell ID
❙ MIMO measurements (R&S®FS-K102PC/-K103PC)
❙ Windows based analysis soft-ware, to be installed on the R&S®FSW or a separate PC
R&S®FSW-K106NB-IoT DL measurements
❙ Power measurement in time and frequency domains
❙ EVM ❙ Constellation diagram ❙ Frequency error ❙ Sampling error
❙ Spectrum flatness, ACLR, SEM
❙ Allocation summary list
❙ Standalone, guard band and in-band operation
❙ Automatic detection of cell ID
R&S®FSW-K201OneWeb reverse link measurement application
❙ Power measurement in time and frequency domains
❙ CCDF
❙ EVM ❙ Constellation diagram ❙ I/Q offset ❙ Gain imbalance ❙ Quadrature error ❙ Center frequency error (symbol clock error)
❙ Spectrum mask ❙ ACLR ❙ Power measurement
❙ Spectrum flatness
❙ Automatic detection of modulation and cyclic prefix length
R&S®FSW-K118 Verizon 5GTF downlink
❙ Power versus time ❙ CCDF
❙ EVM ❙ EVM xPDSCH ❙ Constellation diagram ❙ I/Q offset ❙ I/Q imbalance ❙ Gain imbalance ❙ Center frequency error
❙ Allocation summary
❙ Multi carrier filter
❙ Automatic detection of Cell ID
R&S®FSW-K119 Verizon 5GTF uplink
❙ Power versus time ❙ CCDF
❙ EVM ❙ EVM xPUSCH ❙ Constellation diagram ❙ I/Q offset ❙ I/Q imbalance ❙ Gain imbalance ❙ Center frequency error
❙ Allocation summary
❙ Multi carrier filter
R&S®FSW-K144 5G NR downlink
❙ Power versus time ❙ EVM ❙ EVM xPDSCH ❙ Constellation diagram ❙ I/Q offset ❙ I/Q imbalance ❙ Gain imbalance ❙ Center frequency error
❙ Spectrum mask ❙ ACLR
❙ Allocation summary
❙ Channel table with channels used on base station
❙ Automatic detection of Cell ID
❙ Support of multiple BW parts
R&S®FSW-K145 5G NR uplink
❙ Power versus time ❙ EVM ❙ EVM xPUSCH ❙ Constellation diagram ❙ Center frequency error
❙ Allocation summary
❙ Channel table with channels used
Support of PUCCH

R&S®FSW-K201. R&S®FSW-K118. R&S®FSW-K106. R&S®FSW-K106. R&S®FSW-K7.
24
Measurement application for wire-connected communications systemsMeasurement application/technology
Power Modulation quality Spectrum measurements
Miscellaneous Special features
R&S®FSW-K192DOCSIS 3.1Downstream
❙ Power ❙ Power versus time ❙ Power versus symbol × carrier
❙ MER versus carrier ❙ MER versus symbol ❙ MER versus symbol × carrier
❙ MER (pilot, data) ❙ Constellation diagram ❙ Center frequency error ❙ Symbol clock error ❙ Group delay
❙ Power measurement
❙ Spectrum flatness
Decoding ❙ LDPC BER ❙ LDPC CWER ❙ Trigger to frame
Automatic detection of ❙ Cyclic prefix ❙ Rolloff ❙ PLC start index ❙ Continuous pilots ❙ NCP ❙ Profile A ❙ NFFT
R&S®FSW-K193DOCSIS 3.1Upstream
❙ Power ❙ Power versus time ❙ Power versus symbol × carrier
❙ MER versus carrier ❙ MER versus symbol ❙ MER versus symbol × carrier
❙ MER (pilot, data) ❙ Constellation diagram ❙ Center frequency error ❙ Symbol clock error ❙ Group delay
❙ Power spectrum ❙ Power versus carrier (synchronous ACP)
❙ Spectrum flatness
❙ Individual results for frame objects
❙ Trigger to frame
Automatic detection of ❙ Cyclic prefix ❙ Rolloff

Rohde & Schwarz R&S®FSW Signal and Spectrum Analyzer 25
Specifications in briefSpecifications in briefFrequency
Frequency range R&S®FSW8 2 Hz to 8 GHz
R&S®FSW13 2 Hz to 13.6 GHz
R&S®FSW26 2 Hz to 26.5 GHz
R&S®FSW43 2 Hz to 43.5 GHz
R&S®FSW50 2 Hz to 50 GHz
R&S®FSW67 2 Hz to 67 GHz
R&S®FSW85 2 Hz to 85 GHz up to 90 GHz with R&S®FSW-B90G option, YIG preselector = off
Aging of frequency reference 1 × 10⁻⁷/year
with R&S®FSW-B4 option 3 × 10⁻⁸/year
Bandwidths
Resolution bandwidths standard filter 1 Hz to 10 MHz,80 MHz (with R&S®FSW-B8 option)
RRC filter 18 kHz (NADC), 24.3 kHz (TETRA), 3.84 MHz (3GPP)
channel filter 100 Hz to 5 MHz
video filter 1 Hz to 10 MHz
I/Q demodulation bandwidth 10 MHz
with R&S®FSW-B28 option 28 MHz
with R&S®FSW-B40 option 40 MHz
with R&S®FSW-B80 option 80 MHz
with R&S®FSW-B160 option 160 MHz
with R&S®FSW-B320 option 320 MHz
with R&S®FSW-B512 option 512 MHz
with R&S®FSW-B1200 option 1.2 GHz
with R&S®FSW-B2001 option 2 GHz 1)
with R&S®FSW-B2000 option 2 GHz 2)
with R&S®FSW-B5000 option 5 GHz 3)
Displayed average noise level (DANL) 2 GHz –156 dBm (1 Hz) (typ.)
with R&S®FSW-B13 option –159 dBm (1 Hz) (typ.)
8 GHz –156 dBm (1 Hz) (typ.)
20 GHz –150 dBm (1 Hz) (typ.)
40 GHz –144 dBm (1 Hz) (typ.)
80 GHz –126 dBm (1 Hz) (typ.)
DANL with preamplifier (R&S®FSW-B24 option) 8 GHz –169 dBm (1 Hz) (typ.)
20 GHz –166 dBm (1 Hz) (typ.)
40 GHz –165 dBm (1 Hz) (typ.)
DANL with noise cancellation, preamplifier off, 2 GHz
–169 dBm (1 Hz) (typ.)
1) Available for the R&S®FSW43 and R&S®FSW50.2) 2 GHz demodulation bandwidth for frequencies > 5.5 GHz. R&S®RTO2044 oscilloscope required. Not available for the R&S®FSW8 and R&S®FSW13.3) Available for the R&S®FSW43 and R&S®FSW85. 5 GHz demodulation bandwidth for frequencies > 9.5 GHz. R&S®RTO2064 oscilloscope required.

26
Specifications in briefIntermodulation
Third-order intercept (TOI) f < 1 GHz +30 dBm (typ.)
f < 3 GHz +25 dBm (typ.)
8 GHz to 26 GHz +17 dBm (typ.)
13.6 GHz to 40 GHz +15 dBm (typ.)
WCDMA ACLR dynamic range with noise cancellation 88 dB
Phase noise
10 kHz offset from carrier 500 MHz carrier –140 dBc (1 Hz) (typ.)
1 GHz carrier –137 dBc (1 Hz) (typ.)
10 GHz carrier –128 dBc (1 Hz) (typ.)
Total measurement uncertainty 8 GHz < 0.4 dB

Rohde & Schwarz R&S®FSW Signal and Spectrum Analyzer 27
Ordering informationDesignation Type Order No.Base unit
Signal and Spectrum Analyzer, 2 Hz to 8 GHz R&S®FSW8 1312.8000K08
Signal and Spectrum Analyzer, 2 Hz to 13.6 GHz R&S®FSW13 1312.8000K13
Signal and Spectrum Analyzer, 2 Hz to 26.5 GHz R&S®FSW26 1312.8000K26
Signal and Spectrum Analyzer, 2 Hz to 43.5 GHz R&S®FSW43 1312.8000K43
Signal and Spectrum Analyzer, 2 Hz to 50 GHz R&S®FSW50 1312.8000K50
Signal and Spectrum Analyzer, 2 Hz to 67 GHz R&S®FSW67 1312.8000K67
Signal and Spectrum Analyzer, 2 Hz to 85 GHz R&S®FSW85 1312.8000K85
Hardware options
OCXO Precision Reference Frequency R&S®FSW-B4 1313.0703.02
Resolution Bandwidths > 10 MHz (for R&S®FSW8/13/26) R&S®FSW-B8 1313.2464.26
Resolution Bandwidths > 10 MHz (for R&S®FSW43/50/67/85) 1) R&S®FSW-B8 1313.2464.02
External Generator Control R&S®FSW-B10 1313.1622.02
Highpass Filters for Harmonic Measurements R&S®FSW-B13 1313.0761.02
Digital Baseband Interface R&S®FSW-B17 1313.0784.02
Spare Solid State Drive (removable hard drive, with firmware, for IPC11 CPU board and Windows 10)
R&S®FSW-B18 1313.0790.10
Analog Baseband Inputs (for R&S®FSW8/13) R&S®FSW-B71 1313.1651.13
Analog Baseband Inputs (for R&S®FSW26/43/50) R&S®FSW-B71 1313.1651.26
Analog Baseband Inputs (for R&S®FSW67) R&S®FSW-B71 1313.1651.67
Analog Baseband Inputs (for R&S®FSW85) R&S®FSW-B71 1313.1651.85
80 MHz Bandwidth for Analog Baseband Inputs R&S®FSW-B71E 1313.6547.02
Oscilloscope Baseband Inputs (Software License) R&S®FSW-B2071 1331.8302.02
Spare Solid State Disk (removable hard drive) R&S®FSW-B18 1313.0790.02/.06
LO/IF Ports for External Mixers (for R&S®FSW26) R&S®FSW-B21 1313.1100.26
LO/IF Ports for External Mixers (for R&S®FSW43/50/67) R&S®FSW-B21 1313.1100.43
LO/IF Ports for External Mixers (for R&S®FSW85) R&S®FSW-B21 1313.1100.85
Preamplifier, 100 kHz to 13.6 GHz (for R&S®FSW8/13) R&S®FSW-B24 1313.0832.13
Preamplifier, 100 kHz to 26.5 GHz (for R&S®FSW26) R&S®FSW-B24 1313.0832.26
Preamplifier, 100 kHz to 43.5 GHz (for R&S®FSW43/50/67) R&S®FSW-B24 1313.0832.43
Preamplifier, 100 kHz to 50 GHz (for R&S®FSW50) R&S®FSW-B24 1313.0832.49
Preamplifier, 100 kHz to 50 GHz (for R&S®FSW50) 1) R&S®FSW-B24 1313.0832.51
Preamplifier, 100 kHz to 67 GHz (for R&S®FSW67) R&S®FSW-B24 1313.0832.66
Preamplifier, 100 kHz to 67 GHz (for R&S®FSW67) 1) R&S®FSW-B24 1313.0832.67
Frequency Extension 90 GHz (for R&S FSW85 only) R&S®FSW-B90G 1331.7693.02
Electronic Attenuator, 1 dB steps R&S®FSW-B25 1313.0990.02
USB Mass Memory Write Protection R&S®FSW-B33 1313.3602.02
Real-Time Spectrum Analyzer, 160 MHz 1), 2) R&S®FSW-B160R 1325.4850.06
Real-Time Spectrum Analyzer, 512 MHz 1), 2) R&S®FSW-B512R 1325.4296.06
28 MHz Analysis Bandwidth R&S®FSW-B28 1313.1645.02
40 MHz Analysis Bandwidth R&S®FSW-B40 1313.0861.02
80 MHz Analysis Bandwidth R&S®FSW-B80 1313.0878.02
160 MHz Analysis Bandwidth 3) R&S®FSW-B160 1325.4850.04
320 MHz Analysis Bandwidth 3) R&S®FSW-B320 1325.4867.04
512 MHz Analysis Bandwidth 4) R&S®FSW-B512 1313.4296.04
1.2 GHz Analysis Bandwidth 5) R&S®FSW-B1200 1331.6400.04
2 GHz Analysis Bandwidth 6) R&S®FSW-B2000 1325.4750.02
2 GHz Analysis Bandwidth 5) R&S®FSW-B2001 1331.6916.04
5 GHz Analysis Bandwidth 7) R&S®FSW-B5000 1331.6997.85
5 GHz Analysis Bandwidth 5), 8) R&S®FSW-B5000 1331.6997.43
I/Q Memory Extension 6 Gbyte for R&S®FSW-B160/320 9) R&S®FSW-B106 1331.6451.02

28
Designation Type Order No.DIG IQ 40G Streaming Out Interface for R&S®FSW for recording of RF signals up to 512 MHz 20)
R&S®FSW-B517 1331.6980.02
Cable for connecting high speed digital baseband interfaces of Rohde & Schwarz instruments (accessory for R&S®FSW-B517)
R&S®DIGIQ-HS 3641.2948.03
Firmware/software
Pulse Measurements R&S®FSW-K6 1313.1322.02
Time Sidelobe Measurement 10) R&S®FSW-K6S 1325.3783.02
Analog Modulation Analysis AM/FM/φM R&S®FSW-K7 1313.1339.02
GSM, EDGE, EDGE Evolution and VAMOS Measurements R&S®FSW-K10 1313.1368.02
VOR/ILS Measurements R&S®FSW-K15 1331.4388.02
Multicarrier Group Delay Measurements R&S®FSW-K17 1313.4150.02
Amplifier Measurements R&S®FSW-K18 1325.2170.02
Direct DPD Measurements 11) R&S®FSW-K18D 1331.6845.02
Noise Power Ratio Measurements R&S®FSW-K19 1331.8283.02
Noise Figure Measurements R&S®FSW-K30 1313.1380.02
Security Write Protection of solid state drive R&S®FSW-K33 1322.7936.02
Phase Noise Measurements R&S®FSW-K40 1313.1397.02
Spurious Measurements R&S®FSW-K50 1325.2893.02
EMI Measurements R&S®FSW-K54 1313.1400.02
Frequency Response Correction R&S®FSW-K544 1338.2716.02
Transient Measurement Application R&S®FSW-K60 1313.7495.02
Transient Chirp Measurement 12) R&S®FSW-K60C 1322.9745.02
Transient Hop Measurement 12) R&S®FSW-K60H 1322.9916.02
Vector Signal Analysis R&S®FSW-K70 1313.1416.02
Multi-Modulation Analysis R&S®FSW-K70M 1338.4177.02
R&S®FSW-K70 BER PRBS Measurements 13) R&S®FSW-K70P 1338.3893.02
3GPP FDD (WCDMA) BS Measurements (incl. HSDPA and HSDPA+) R&S®FSW-K72 1313.1422.02
3GPP FDD (WCDMA) UE Measurements (incl. HSUPA and HSUPA+) R&S®FSW-K73 1313.1439.02
3GPP TDD (TD-SCDMA) BS Measurements R&S®FSW-K76 1313.1445.02
3GPP TDD (TD-SCDMA) UE Measurements R&S®FSW-K77 1313.1451.02
CDMA2000® BS Measurements R&S®FSW-K82 1313.1468.02
CDMA2000® MS Measurements R&S®FSW-K83 1313.1474.02
1xEV-DO BS Measurements R&S®FSW-K84 1313.1480.02
1xEV-DO MS Measurements R&S®FSW-K85 1313.1497.02
IEEE 802.11a/b/g Measurements R&S®FSW-K91 1313.1500.02
IEEE 802.11p Measurements 14) R&S®FSW-K91P 1321.5646.02
IEEE 802.11n Measurements 14) R&S®FSW-K91N 1313.1516.02
IEEE 802.11ac Measurements 14) R&S®FSW-K91AC 1313.4209.02
IEEE 802.11ax Measurements 14) R&S®FSW-K91AX 1331.6345.02
IEEE 802.11ad Measurements R&S®FSW-K95 1313.1639.02
EUTRA/LTE FDD BS Measurements R&S®FSW-K100 1313.1545.02
EUTRA/LTE FDD UE Measurements R&S®FSW-K101 1313.1551.02
EUTRA/LTE BS MIMO Measurements R&S®FSW-K102 1313.1568.02
EUTRA/LTE UL Advanced UL Measurements 15) R&S®FSW-K103 1313.2487.02
EUTRA/LTE TDD BS Measurements R&S®FSW-K104 1313.1574.02
EUTRA/LTE TDD UE Measurements R&S®FSW-K105 1313.1580.02
EUTRA/LTE NB-IoT Downlink Measurements R&S®FSW-K106 1331.6351.02
OneWeb Reverse Link Measurements R&S®FSW-K201 1331.7387.02
VERIZON 5GTF DL Measurements R&S®FSW-K118 1331.7370.02
VERIZON 5GTF UL Measurements R&S®FSW-K119 1331.8060.02
5G NR DL Measurements R&S®FSW-K144 1338.3606.02
5G NR UL Measurements R&S®FSW-K145 1338.3612.02

Rohde & Schwarz R&S®FSW Signal and Spectrum Analyzer 29
Designation Type Order No.160 MHz Real-Time Measurement Application, POI > 15 µs 17) R&S®FSW-K160RE 1313.7766.02
DOCSIS 3.1 OFDM Downstream R&S®FSW-K192 1325.4138.02
DOCSIS 3.1 OFDM Upstream R&S®FSW-K193 1325.4144.02
Extended Dynamic Range for frequencies > 50 GHz (R&S®FSW67) R&S®FSW-U67 1331.5755.02
Improved Sensitivity for frequencies > 43.5 GHz in YIG preselector bypass path (R&S®FSW85)
R&S®FSW-U85 1338.3764.85
Analysis Bandwidth Upgrade from 28 MHz to 40 MHz R&S®FSW-U40 1313.5205.02
Analysis Bandwidth Upgrade from 40 MHz to 80 MHz R&S®FSW-U80 1313.5211.02
Analysis Bandwidth Upgrade from 80 MHz to 160 MHz 18) R&S®FSW-U160 1325.5357.04
Analysis Bandwidth Upgrade from 160 MHz to 320 MHz R&S®FSW-U320 1313.7189.02
Analysis Bandwidth Upgrade from 80 MHz to 512 MHz 4), 18) R&S®FSW-U512 1321.6320.04
Analysis Bandwidth Upgrade from 500 MHz to 512 MHz R&S®FSW-U512A 1321.6320.14
Real-Time Spectrum Analyzer, including analysis bandwidth upgrade from 80 MHz to 160 MHz 2)
R&S®FSW-U160R 1325.5357.06
Real-Time Spectrum Analyzer, including analysis bandwidth upgrade from 80 MHz to 512 MHz 1), 2), 18)
R&S®FSW-U512R 1321.6320.06
Analysis Bandwidth Upgrade from 80 MHz, 160 MHz or 512 MHz to 1.2 GHz 19)
R&S®FSW-U1200 1331.7006.04
Analysis Bandwidth Upgrade from 1.2 GHz to 2 GHz R&S®FSW-U2001 1331.7070.02
160 MHz Real-Time Measurement Application, POI > 15 µs 17) R&S®FSW-K160RE 1313.7766.02
DOCSIS 3.1 OFDM Downstream R&S®FSW-K192 1325.4138.02
DOCSIS 3.1 OFDM Upstream R&S®FSW-K193 1325.4144.02
Extended Dynamic Range for frequencies > 50 GHz (R&S®FSW67) R&S®FSW-U67 1331.5755.02
Improved Sensitivity for frequencies > 43.5 GHz in YIG preselector bypass path (R&S®FSW85)
R&S®FSW-U85 1338.3764.85
Analysis Bandwidth Upgrade from 28 MHz to 40 MHz R&S®FSW-U40 1313.5205.02
Analysis Bandwidth Upgrade from 40 MHz to 80 MHz R&S®FSW-U80 1313.5211.02
Analysis Bandwidth Upgrade from 80 MHz to 160 MHz 18) R&S®FSW-U160 1325.5357.04
Analysis Bandwidth Upgrade from 160 MHz to 320 MHz R&S®FSW-U320 1313.7189.02
Analysis Bandwidth Upgrade from 80 MHz to 512 MHz 4), 18) R&S®FSW-U512 1321.6320.04
Analysis Bandwidth Upgrade from 500 MHz to 512 MHz R&S®FSW-U512A 1321.6320.14
Real-Time Spectrum Analyzer, including analysis bandwidth upgrade from 80 MHz to 160 MHz 2)
R&S®FSW-U160R 1325.5357.06
Real-Time Spectrum Analyzer, including analysis bandwidth upgrade from 80 MHz to 512 MHz 1), 2), 18)
R&S®FSW-U512R 1321.6320.06
Analysis Bandwidth Upgrade from 80 MHz, 160 MHz or 512 MHz to 1.2 GHz 19)
R&S®FSW-U1200 1331.7006.04
Analysis Bandwidth Upgrade from 1.2 GHz to 2 GHz R&S®FSW-U2001 1331.7070.02
1) Export license required.2) Cannot be combined with the R&S®FSW-B160, R&S®FSW-U160 or R&S®FSW-B320 options.3) Not available with option R&S®FSW-B512, R&S®FSW-U512, R&S®FSW-U512A, R&S®FSW-B512R, R&S®FSW-U512R, R&S®FSW-B160R, R&S®FSW-U160R.4) Not available together with the R&S®FSW-U160, R&S®FSW-B160, R&S®FSW-U320, R&S®FSW-B320, R&S®FSW-U160R and R&S®FSW-B160R options.5) Available for R&S®FSW43/50 only. Not with R&S®FSW-B2000.6) R&S®RTO2044 oscilloscope required. Not available for the R&S®FSW8 and R&S®FSW13.7) R&S®RTO2064 oscilloscope required. Available for the R&S®FSW85.8) R&S®RTO2064 oscilloscope required. Available for the R&S®FSW43.9) R&S®FSW-B160, R&S®FSW-B320 or R&S®FSW-B160R required. 10) R&S®FSW-K6 required.11) R&S®FSW-K18 required.12) R&S®FSW-K60 required.13) R&S®FSW-K70 required.14) R&S®FSW-K91 required.15) R&S®FSW-K101 or R&S®FSW-K105 required.16) R&S®FS-K101PC or R&S®FS-K105PC required.17) R&S®FSW-B160, R&S®FSW-U160, R&S®FSW-B320 or R&S®FSW-U320 required.18) R&S®FSW-B80 or R&S®FSW-U80 required.19) For R&S®FSW43 with serial number ≥ 10300.
R&S®FSW-B80 or R&S®FSW-B160/-U160, or R&S®FSW-B320/-U320 or R&S®FSW-B512/-U512A required. Not with R&S®FSW-B160R, -U160R, -B512R, -U512R, -B2000, -U2000.
20) Only with R&S®FSW-B512/-B512R/-B1200/-B2001.

30
The Bluetooth® word mark and logos are registered trademarks owned by Bluetooth SIG, Inc. and any use of such marks by Rohde & Schwarz is under license.CDMA2000® is a registered trademark of the Telecommunications Industry Association (TIA-USA).WiMAX Forum is a registered trademark of the WiMAX Forum. WiMAX, the WiMAX Forum logo, WiMAX Forum Certified, and the WiMAX Forum Certified logo are trademarks of the WiMAX Forum.
WarrantyBase unit 3 years
All other items 1) 1 year
Options
Extended Warranty, one year R&S®WE1 Please contact your local Rohde & Schwarz sales office.Extended Warranty, two years R&S®WE2
Extended Warranty with Calibration Coverage, one year R&S®CW1
Extended Warranty with Calibration Coverage, two years R&S®CW2
Extended Warranty with Accredited Calibration Coverage, one year R&S®AW1
Extended Warranty with Accredited Calibration Coverage, two years R&S®AW2
1) For options that are installed, the remaining base unit warranty applies if longer than 1 year. Exception: all batteries have a 1 year warranty.
Your local Rohde & Schwarz expert will help you determine the optimum solution for your requirements.To find your nearest Rohde & Schwarz representative, visit www.sales.rohde-schwarz.com
Canada
USA
Mexico
Brazil
Colombia
Argentina
UruguayChile
South Africa
UAESaudi Arabia India
Pakistan
Kazakhstan
Azerbaijan
Mongolia
China
Egypt
IsraelAlgeria
Senegal
Nigeria
Kenya
Jordan
Oman
Tunisia
JapanSouthKorea
Malaysia
Indonesia
Australia
Singapore
New Zealand
Philippines
Taiwan
Thailand
Vietnam
Germany
Dallas
Monterrey
Mexico City
Ottawa
Rio de Janeiro
São Paulo
Portland
New DelhiKarachi
Islamabad
HyderabadMumbai
Bangalore
SydneyMelbourne
Canberra
ShanghaiTaipei
Kaohsiung
Tokyo
KanagawaOsaka
SeoulDaejeon
Gumi CityChengdu
Xi'an
Ho Chi Minh City
Beijing
Hong Kong
Penang
Hanoi
Selangor
Los Angeles
Columbia/Maryland
Munich
Cologne
Shenzhen
Guangzhou
United Kingdom
Ukraine
Turkey
Switzerland
Sweden
Spain
Russian Federation
Romania
Bulgaria
Portugal
Poland
Norway
Netherlands
Italy
Hungary
Greece
Malta
France
Finland
Denmark
Czech Republic
Austria
Cyprus
Azerbaijan
LithuaniaLatvia
Estonia
Slovenia
Serbia
Sales level
Sales locations
Service level
Backup service
Area support center
Local service center
Calibration and maintenance with standardized automatic calibration systems
Calibration and maintenance
Maintenance
Rohde & Schwarz R&S®FSW Signal and Spectrum Analyzer 31
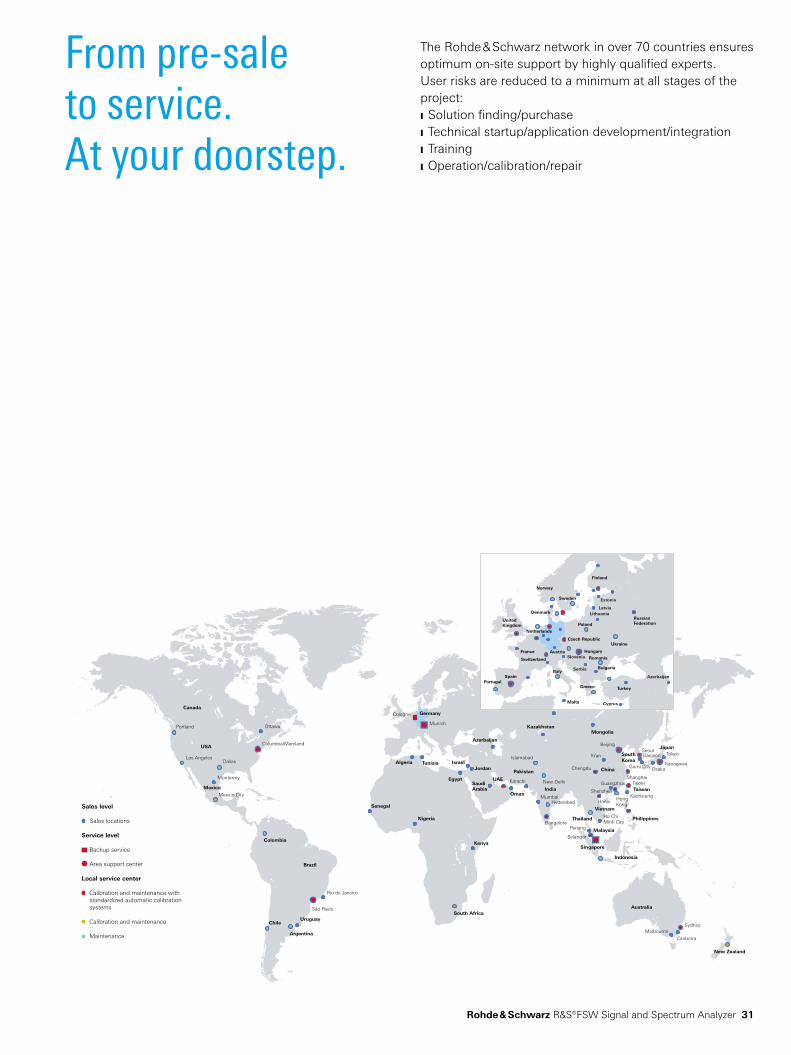
From pre-sale to service. At your doorstep.
The Rohde & Schwarz network in over 70 countries ensures optimum on-site support by highly qualified experts. User risks are reduced to a minimum at all stages of the project: ❙ Solution finding/purchase ❙ Technical startup/application development/integration ❙ Training ❙ Operation/calibration/repair

R&S® is a registered trademark of Rohde & Schwarz GmbH & Co. KG
Trade names are trademarks of the owners
PD 5214.5984.12 | Version 28.00 | August 2018 (as/ch)
R&S®FSW Signal and Spectrum Analyzer
Data without tolerance limits is not binding | Subject to change
© 2011 - 2018 Rohde & Schwarz GmbH & Co. KG | 81671 Munich, Germany
Service that adds value❙ Worldwide ❙ Local and personalized❙ Customized and flexible❙ Uncompromising quality ❙ Long-term dependability
5214
.598
4.12
28.
00 P
DP
1 e
n
Sustainable product design ❙ Environmental compatibility and eco-footprint ❙ Energy efficiency and low emissions ❙ Longevity and optimized total cost of ownership
Certified Environmental Management
ISO 14001Certified Quality Management
ISO 9001
Regional contact ❙ Europe, Africa, Middle East | +49 89 4129 12345 [email protected]
❙ North America | 1 888 TEST RSA (1 888 837 87 72) [email protected]
❙ Latin America | +1 410 910 79 88 [email protected]
❙ Asia Pacific | +65 65 13 04 88 [email protected]
❙ China | +86 800 810 82 28 | +86 400 650 58 96 [email protected]
Rohde & SchwarzThe Rohde & Schwarz electronics group offers innovative solutions in the following business fields: test and mea-surement, broadcast and media, secure communications, cybersecurity, monitoring and network testing. Founded more than 80 years ago, the independent company which is headquartered in Munich, Germany, has an extensive sales and service network with locations in more than 70 countries.
www.rohde-schwarz.com
5214598412