Embed Size (px)
Citation preview
1
Roger Adams Chemical 600 S. Mathews Urbana, IL 61801 DATE: 06-October-2005 TO: Marina Miletic, Head Engineering Manager Scott Slifka, Lab Supervisor FROM: Vincent Ho, Process Engineer Mark Butzow, Process Engineer SUBJECT: Methanol Recovery via Distillation – Rotation 1 REF: Methanol Recovery via Distillation – Rotation 1 Assignment Memo Abstract The main objective of this rotation was to determine the feasibility of obtaining 97 wt% methanol in the distillate stream from a feed stream with 7.5 wt% methanol using batch distillation. The refractometer was chosen as the measurement device, instead of the gas chromatograph, for methanol concentration in samples due to its accuracy and ease of use. A calibration curve with high accuracy was obtained using the refractometer. By carrying out experimental runs with different sets of reflux ratio and reboiler power, it was determined that increasing reboiler power reduces the methanol concentration in the distillate. On the other hand, the methanol concentration increases with increasing reflux ratio until a peak concentration was reached. Thereafter, the concentration decreases with increasing reflux ratio. Replicated runs showed that there is a high reliability of the data obtained from the experimental runs. A distillate stream with 97 wt% methanol was obtained at a reflux ratio of 6.5 and at two reboiler powers of 0.6kW and 0.9kW. An optimum operating window was also defined, beyond which, flooding or weeping occurs. A correlation was also determined which established a relationship between pressure drop in the column and reboiler power, which can be used to predict risk of flooding. Finally, the highest overall column efficiency achieved by the distillation column used in this rotation was 57.1%. Introduction
The overall goal of this project is to determine the commercial feasibility of obtaining at least 97 wt% methanol product from a 7.5 wt% methanol waste stream. A 97 wt% methanol product is the market standard for sale to outside vendors. In order to achieve this goal for this rotation, the effects of changing reflux ratio and reboiler power on methanol concentration were ascertained. The reliability of consistently achieving these methanol product concentrations was also evaluated. In order to predict when flooding or weeping would occur, the operating conditions for the distillation column were also determined, including the extreme limits of operation. Column efficiency was assessed to compare actual runs with theoretical conditions determined using the
2
McCabe-Thiele method. In order to analyze the samples, we used a refractometer to create a calibration curve for methanol/water. Theory
Distillation is used to separate a liquid mixture with components of varying volatilities. By heating up the liquid to its components’ boiling points, separation can be achieved when the vapor phase consists of a larger proportion of the more volatile component. The vapor phase is then condensed to obtain a distillate rich in the more volatile component.
In the distillation column, the liquid stream and the vapor stream come into close contact with each other at each tray. Theoretically, each stream leaves each tray in equilibrium with the other. As the vapor stream rises up the column, it becomes richer in the more volatile component through its contact with the liquid stream.
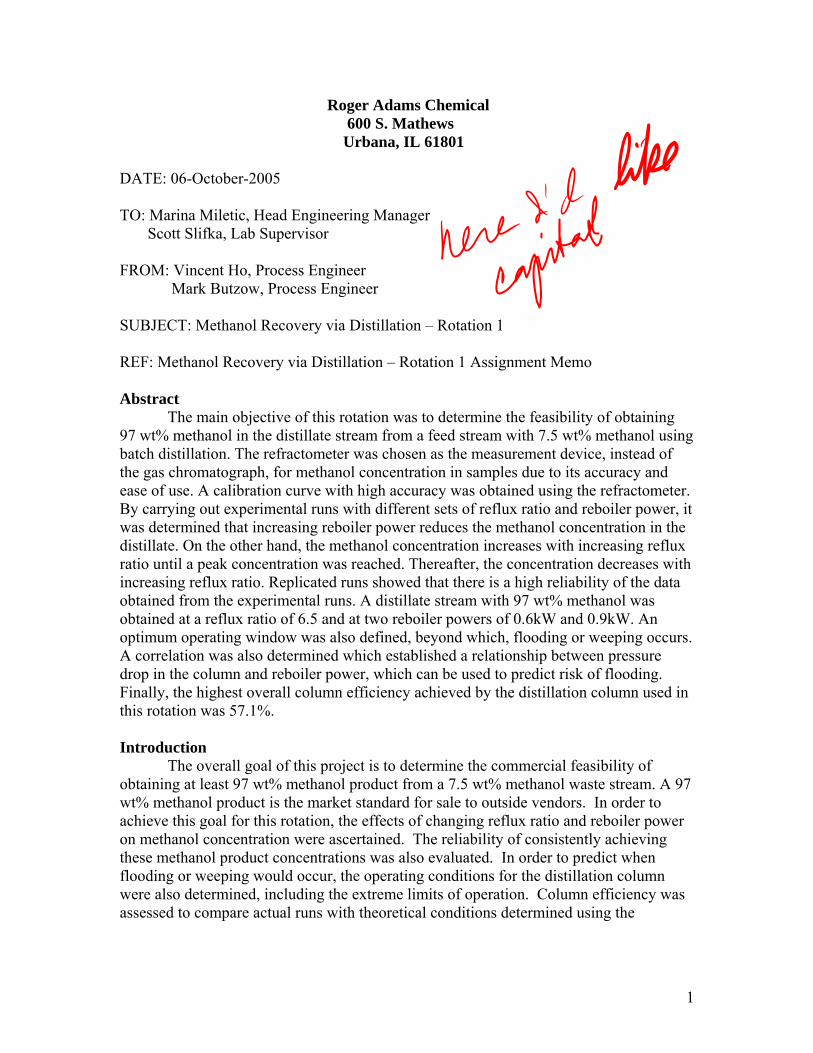
Batch distillation is a special case of distillation. It is the system that was used in this rotation. A schematic of a batch distillation column is included in figure 1, where the feed actually comes from the reboiler tank. The top of the column is the same as the enriching section for a fractional distillation system. There is no stripping section for our column in this case. Henceforth, the system used is basically an enriching column.
Figure 1: A batch distillation column6

3
Entrainment occurs in a distillation column when the high vapor velocity actually causes some of the liquid to go through the perforations in the upper tray from the lower tray, thereby causing inefficient separation. Flooding occurs when the vapor flow rate into the column becomes so high that the vapor starts to hinder the downflow of the liquid stream and cause the liquid to flow up to the upper tray. Flooding occurs at very high rates of liquid and vapor flows. It thus represents a maximum possible operating condition. Flooding will cause inefficient separation.
Weeping also causes inefficient separation of a liquid mixture. It is caused by a small amount of liquid traveling downward in the column through the tray perforations, where the vapor should be coming up through. Weeping can be relieved by increasing the vapor pressure in the column or by decreasing the amount of liquid being held-up. A more serious case of weeping is dumping, in which a large proportion of liquid flows through the tray perforations, instead of the downcomers. This liquid has not been contacted with the rising vapor, thus dumping affects the separation performance of the column. Consequently, dumping must be avoided.
Some of the important equations required for this experiment are stated below: Reflux ratio, R
R is the ratio of the reflux stream to the distillate stream. In this experiment, it could be varied from 0.01 to total reflux, where the entire stream from the condenser is directed back into the column.
LRD
= (1)1
where: R = Reflux Ratio L = Reflux Stream D = Distillate Stream Equation for Enriching Operating Line
11 1
Dn n
R xy xR R
+ = ++ +
(2)1
where: R = Reflux Ratio xD = mole fraction of methanol in distillate yn+1 = mole fraction of methanol in vapor stream leaving stage (n+1) xn = mole fraction of methanol in liquid stream leaving stage n
The slope of the enriching operating line is 1
RR +
, where R is the reflux ratio. By
knowing R and xD, the mole fraction of methanol in the distillate, the enriching line can be drawn on a McCabe-Thiele diagram to determine the theoretical number of trays in a distillation column.

4
Flooding Correlations
1mP k RΔ = (3i)
2nP k RPΔ = (3ii)
where: ΔP = Pressure Drop in column k1, k2 = proportionality constants R = Reflux Ratio RP = Reboiler Power m,n are the respective powers assigned to R and RP
The above generalized correlations for flooding in the distillation column are adapted from two equations which relate the pressure drop in a packed column to the vapor flow rate or the packing factor for a packed column. They are shown below.
1 1.8(vapor flow rate)P kΔ =
1 0.7(packing factor)floodP kΔ =
Height of a Theoretical Plate (HETP)
t
HHETPN
= (4)1
HETP is taken as the height of the column, H over the theoretical number of trays,
Nt. It is often used to assess the column efficiency, by comparing it to the actual tray height. Overall Column Efficiency (E0)
0 100%t
a
NEN
= × (5)5
The Overall Column Efficiency, E0 is the ratio of the theoretical number of trays
Nt, to the actual number of trays, Na. In this case, the theoretical number of trays will not include the reboiler, as this equation is only concerned with the column. Standard Deviation
2
1
( )Standard Deviation =
1
n
i mean
i
x x
n=
−
−
∑ (6)
where n = number of measurements

5
xi = ith measurement xmean = mean of n measurements
The standard deviation is used to compare the results from the replicated runs to determine their consistency. A small standard deviation means that the reliability of obtaining these results is high. A high standard deviation means that the reliability of obtaining these results is low. Weight Percent to Mole Fraction Conversion
% methanol32
% methanol 100 % methanol32 18
MeOHx
wt
wt wt=−
+ (7)
where xMeOH = mole fraction of methanol in feed or distillate wt% methanol = weight percent of methanol in feed or distillate
Equation (7) is used to calculate the mole fraction of methanol in the distillate or feed, using the value of the weight percent of methanol in the distillate or feed. Experimental Apparatus and Procedures Apparatus
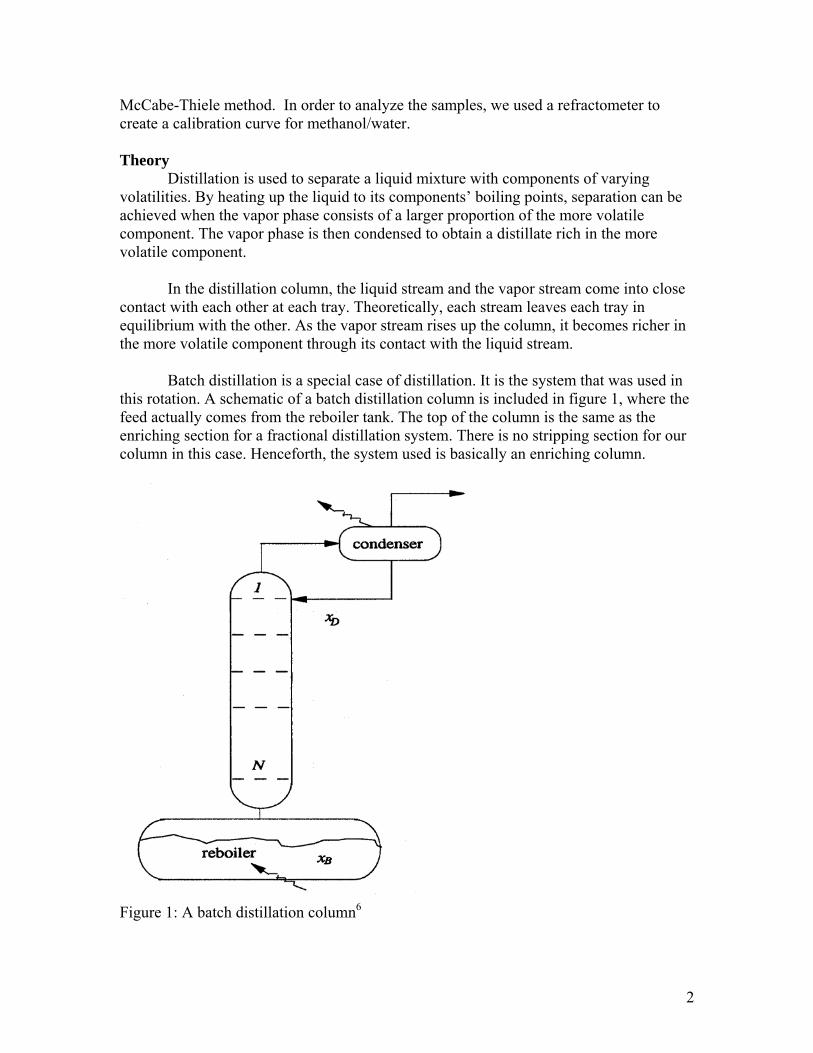
The apparatus used is an interchangeable 50mm diameter sieve tray batch distillation column set up to separate methanol and water. The column has eight sieve trays with down-comers. It is controlled by a microcomputer with distillation software to facilitate human operation of the column. Samples can be collected periodically from a control valve located under the reflux receiver. A schematic of the equipment is included below in figure 3. The feed tank also serves as the reboiler which feeds the vapor stream into the distillation column. The vapor which comes out of the top of the column is then directed to the condenser where it is condensed to a liquid stream. Part of this stream is then channeled back into the column as the reflux stream and the rest is stored in a receiver tank. Temperatures at various parts of the equipment are measured by the temperature sensors located at these parts and displayed on the computer.
The samples would be analyzed for methanol concentration using one of the two methods available. The first is using a refractometer (shown in figure 2) to measure the refractive index of the solution. The measured refractive index would then be matched to a calibrated curve of refractive indices versus known methanol concentrations. The other method is using an Agilent 6850 Gas Chromatograph. The area under the peak obtained from the gas chromatograph can be matched using a calibrated curve of peak areas versus known methanol concentrations.
6
Figure 2: Refractometer
Figure 3: Schematic of the distillation equipment2 Procedures Calibration of Methanol/Water
Both the refractometer and the gas chromatograph (GC) were used to calibrate the methanol/water system for use in determining the methanol concentration of the distillate. Eleven samples of methanol mixed with water were prepared, according to the volume proportions described in Table 1 below.
Sample taken here

7
Table 1 sample volume% methanol weight% methanol
1 0 0.02 10 8.13 20 16.54 30 25.35 40 34.56 50 44.27 60 54.38 70 64.99 80 76.0
10 90 87.711 100 100.0
These samples were then used to determine their respective refractive index using
the refractometer and also their respective peak area using the GC. To prevent any error from arising, the same individual was assigned to do the refractometer or GC measurement. For the refractometer, three readings were taken and then the mean of them was calculated. Using the respective weight percent values as shown in table 1 and their respective refractive index or peak area, the calibration curves were plotted and a best fit line was fitted to the data points. Experimental Runs
For this rotation, each distillation run was carried out at a constant reflux ratio and a constant reboiler power. For example, run 1 was carried out at a reflux ratio of 4.5 and a reboiler power of 0.5kW. It was realized then that the reboiler was taking too long to heat up. Due to time constraints, a decision was made to preheat the reboiler at the start of each laboratory period. The reboiler power would be set at maximum, at total reflux, to heat the reboiler tank till the temperature of the top of the column reaches about 60oC, which is less than the boiling point of methanol. Then the heating was stopped and the corresponding reflux ratio for each run was entered. The run began when the reboiler power has been set to the corresponding value for each particular run. Samples were taken of the distillate every five minutes and their refractive indices were measured using the refractometer. Three readings were taken and the mean of them was calculated. As with the calibration, the same individual was assigned to take the measurement. Using the equation of the calibration curve obtained, the methanol concentration of each sample was calculated. Each run was stopped when the refractive indices have remained unchanged for at least two readings. It was then assumed that the distillation run has reached its steady state.
8
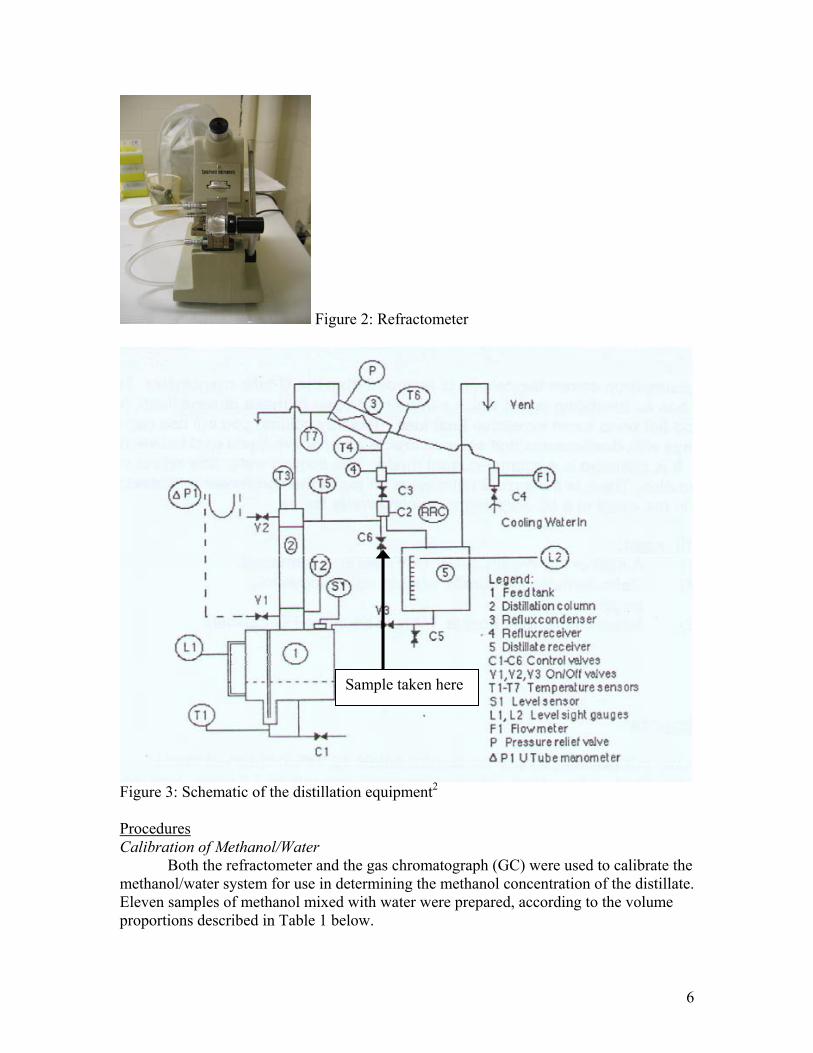
Figure 4: Relationship between number of theoretical stages and reflux ratio5
The range for the reflux ratio for the runs was determined in this manner. The minimum reflux ratio, Rmin was determined, as shown in figure III.1 in Appendix III. First, the enriching line for minimum reflux was drawn and its slope was determined. With this value, Rmin was determined to be about 3.37. The minimum reflux ratio has to be above the Rmin, as Figure 4 showed that there is infinite number of stages at Rmin. The optimum R should be about 1.2 to 1.5 times Rmin
1, which is equal to 4.04 to 5.06. High reflux ratios are undesirable commercially, due to the high heating and cooling costs6. Thus, the maximum R for this experiment was set at 8, which was already higher than the theoretical optimum R.
The range of the reboiler power was determined in this manner. The minimum reboiler power was set at 0.5kW, as too low a reboiler power will result in long production time, which is undesirable commercially. The maximum reboiler power was set at 1.8kW, as a relatively high reboiler power will lead to entrainment and ultimately flooding in the column which will decrease the methanol concentration in the distillate product.
To assess the reliability of obtaining the results consistently, some of the runs
were replicated. Due to time constraints, not all runs could be replicated. A decision was made to carry out run 9 and 10 each at constant reflux ratio and varying reboiler power from 0.6kW to 1.8kW. Increments of 0.3kW were made after a steady state had been reached at each particular reboiler power. The rationale of this decision was to generate more data from each run, as each run will consist of ‘sub-runs’ with constant reflux ratio and reboiler power. These runs can also be used to determine flooding conditions for a particular reflux ratio, as the reboiler power is increased by steps until the column floods. The data of these two runs were compared to runs at constant reflux ratio and reboiler power to assess their accuracies. For example, run 12 (R = 3.5, RP = 0.6kW) was carried out to determine the viability of run 9, and the data for

9
runs 3 (R = 6.5, RP = 1.2kW) and 4 (R = 6.5, RP = 1.5kW) were compared to the data from run 10. Results and Discussion Calibration of Refractometer and Gas Chromatograph (GC)
The two calibration curves obtained for the refractometer and GC are shown below in figure 5 and figure 6 respectively.
Calibration curve of Refractive Index vs. Methanol Concentration
y = -9.371560E-12x5 + 2.326393E-09x4 - 2.377475E-07x3 + 7.999297E-06x2 + 1.342876E-04x + 1.334568E+00
R2 = 9.994867E-011.328
1.33
1.332
1.334
1.336
1.338
1.34
1.342
1.344
0 10 20 30 40 50 60 70 80 90 100
Methanol concentration/wt%
Ref
ract
ive
Inde
x
Figure 5: Calibration curve for Refractometer
10
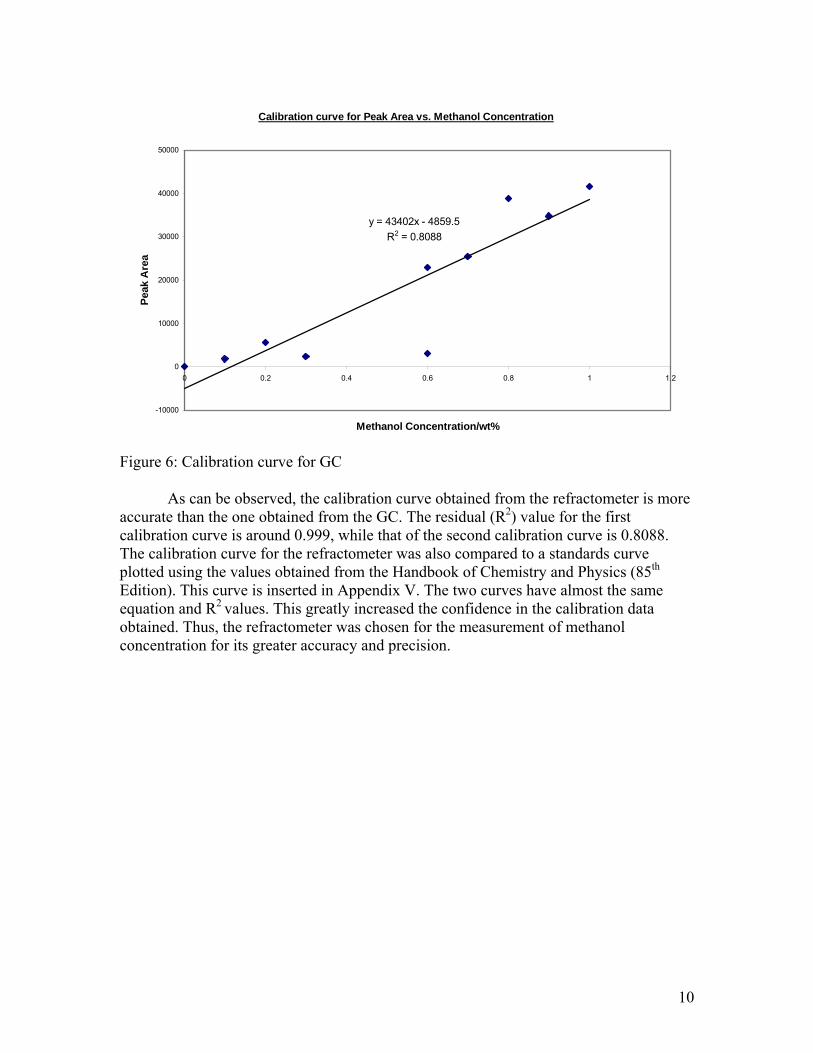
Calibration curve for Peak Area vs. Methanol Concentration
y = 43402x - 4859.5R2 = 0.8088
-10000
0
10000
20000
30000
40000
50000
0 0.2 0.4 0.6 0.8 1 1.2
Methanol Concentration/wt%
Peak
Are
a
Figure 6: Calibration curve for GC
As can be observed, the calibration curve obtained from the refractometer is more
accurate than the one obtained from the GC. The residual (R2) value for the first calibration curve is around 0.999, while that of the second calibration curve is 0.8088. The calibration curve for the refractometer was also compared to a standards curve plotted using the values obtained from the Handbook of Chemistry and Physics (85th Edition). This curve is inserted in Appendix V. The two curves have almost the same equation and R2 values. This greatly increased the confidence in the calibration data obtained. Thus, the refractometer was chosen for the measurement of methanol concentration for its greater accuracy and precision.

11
T-xy diagram for methanol/water
0
20
40
60
80
100
120
0 0.2 0.4 0.6 0.8 1
xA,yA
T/o C bubble point curve
dew point curve
Figure 7: T-xy diagram for methanol/water
Since the calibration curve obtained for the refractometer is parabolic, at a certain refractive index, it is possible to obtain two values for methanol concentration. Thus, the T-xy diagram for methanol/water in figure 7 was used to determine which of the two values was the correct one. The temperature at the top of the column (shown as T3 in the data tables in Appendix I) was used to determine which of the two possible refractive indices is correct. An example of how this was done is shown in Appendix III, the Hand Calculation section.
There were also other factors which were taken into consideration when choosing
between the refractometer and GC. Firstly, the run time for the refractometer was about one minute, considerably less than the three minutes run time for the GC. A GC also requires a high maintenance cost. The level of skill and care needed for operating the GC is also very high, as it is a delicate instrument. Error could be easily introduced if there is a lag between the injection time and the start time for the run. Comparatively, the refractometer is easy to use and error is kept to a minimum, as long as not too little or too much sample is used. Consequently, the refractometer was an obvious choice as the method of concentration measurement. Outline of Experimental Runs
The experimental runs and their respective parameters are outlined in table 2 below.

12
Table 2: Experimental Design Run RP/kW R Replicate?
1 0.5 4.5No 2 1.2 4.5Yes 3 1.2 6.5Yes 4 1.5 6.5Yes 5 0.6 4.5No 6 0.6 6.5Yes 7 1.2 4.5 --- 8 1.2 8No 9 Varying 3.5 ---
10 Varying 6.5 --- 11 0.6 8No 12 0.6 3.5No 13 0.9 7.25No
The experimental runs were carried out according to the conditions set out in table
2 and the results are shown below in table 3. No results were obtained for run 1 and 4, as run 1 was abandoned, as the reboiler was taking too long to heat up. For run 4, the column was flooding and the methanol concentration in the distillate was decreasing. Thus no steady state value was obtained.
Table 3: Experimental Results Run RP/kW R [MeOH]/wt%
10 0.9 6.5 97.110 0.6 6.5 96.8
6 0.6 6.5 96.83 1.2 6.5 93.6
10 1.2 6.5 92.75 0.6 4.5 91.88 1.2 8 90.87 1.2 4.5 90.82 1.2 4.5 89.9
11 0.6 8 82.613 0.9 7.25 79.5
9 0.6 3.5 71.212 0.6 3.5 68.3
9 0.9 3.5 66.69 1.2 3.5 64.69 1.5 3.5 64.69 1.8 3.5 60.2
Effect of changing Reflux Ratio on methanol concentration
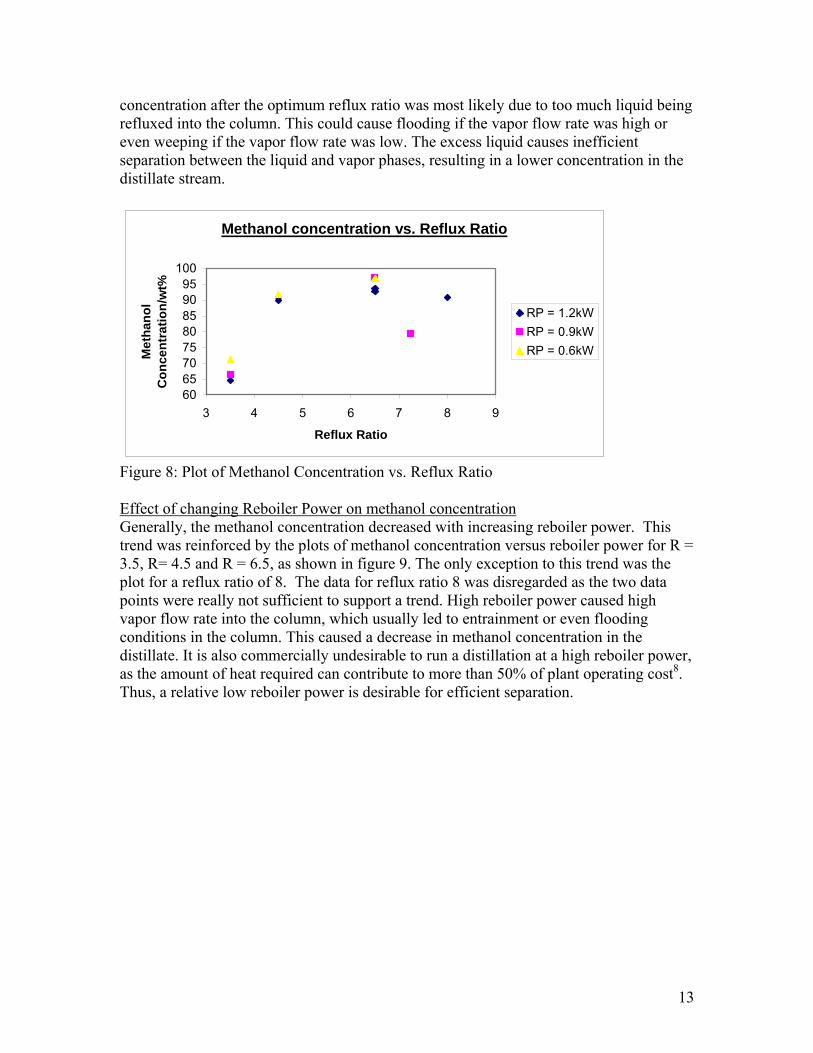
There is an interesting trend when looking at the plots of reflux ratio versus methanol concentration in figure 8. The methanol concentration increased as the reflux ratio was increased. This observation agrees with the theoretical prediction, as a higher reflux ratio will lead to better separation. The concentration then peaked at a reflux ratio of 6.5. Thereafter, the methanol concentration actually decreased. The decrease in
13
concentration after the optimum reflux ratio was most likely due to too much liquid being refluxed into the column. This could cause flooding if the vapor flow rate was high or even weeping if the vapor flow rate was low. The excess liquid causes inefficient separation between the liquid and vapor phases, resulting in a lower concentration in the distillate stream.
Methanol concentration vs. Reflux Ratio
6065707580859095
100
3 4 5 6 7 8 9
Reflux Ratio
Met
hano
l C
once
ntra
tion/
wt%
RP = 1.2kWRP = 0.9kWRP = 0.6kW
Figure 8: Plot of Methanol Concentration vs. Reflux Ratio Effect of changing Reboiler Power on methanol concentration Generally, the methanol concentration decreased with increasing reboiler power. This trend was reinforced by the plots of methanol concentration versus reboiler power for R = 3.5, R= 4.5 and R = 6.5, as shown in figure 9. The only exception to this trend was the plot for a reflux ratio of 8. The data for reflux ratio 8 was disregarded as the two data points were really not sufficient to support a trend. High reboiler power caused high vapor flow rate into the column, which usually led to entrainment or even flooding conditions in the column. This caused a decrease in methanol concentration in the distillate. It is also commercially undesirable to run a distillation at a high reboiler power, as the amount of heat required can contribute to more than 50% of plant operating cost8. Thus, a relative low reboiler power is desirable for efficient separation.

14
Methanol Concentration vs. Reboiler Power
55
65
75
85
95
0.5 1 1.5 2
Reboiler Power/kW
Met
hano
l C
once
ntra
tion/
wt%
R = 3.5R = 4.5R = 6.5R = 8
Figure 9: Plot of Methanol Concentration vs. Reboiler Power Reliability of consistency of results The reliability of the data was confirmed by replicating runs to verify that the data were consistent with previous runs. Four different runs were replicated, each from different areas of our design matrix. The differences between the initial and replicated runs were very small; proof of the precision of the data is shown by the low standard deviations, ranging from 0 to 2.051wt%, as shown in table 4. As can be seen in table 4, the low standard deviations showed that runs 9 and 10 are viable experimentally. Table 4: Standard Deviation values for replicated runs
R RP/kW [MeOH]1/wt% [MeOH]2/wt% Mean [MeOH]/wt%Standard Deviation/wt%
4.5 1.2 89.9 90.8 90.4 0.6366.5 1.2 93.6 92.7 93.2 0.6366.5 0.6 96.8 96.8 96.8 0.0003.5 0.6 71.2 68.3 69.8 2.051
Operating conditions for Flooding
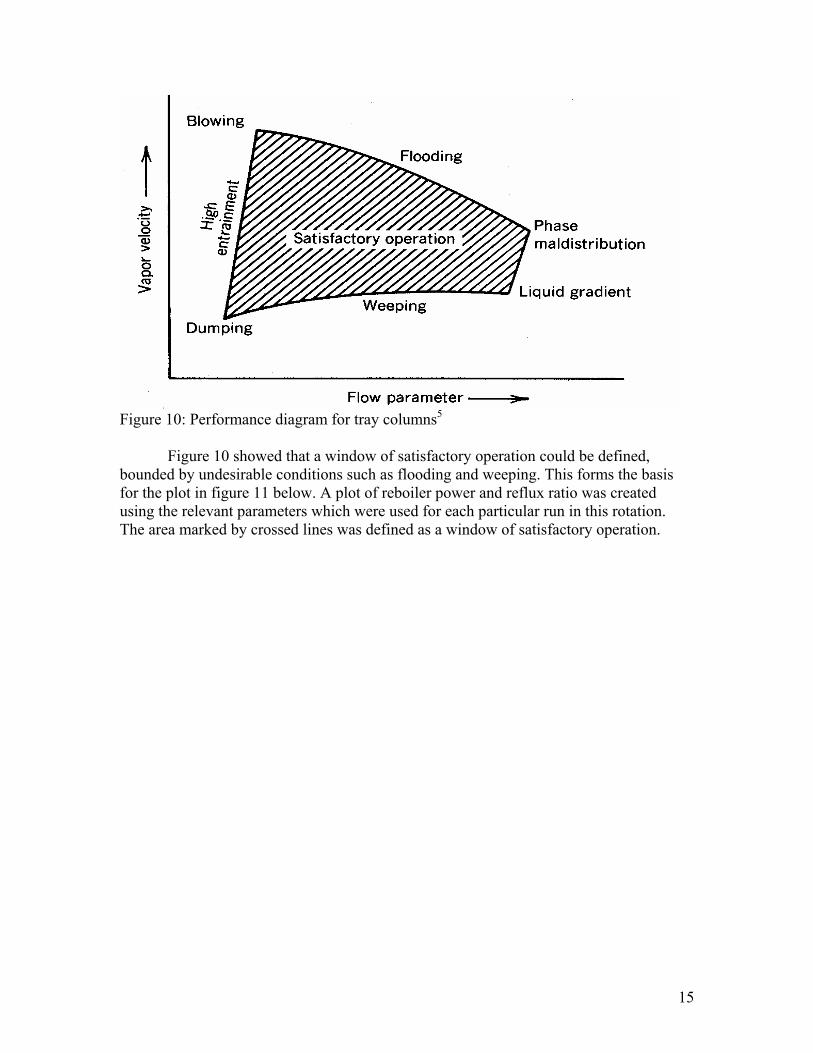
It was stated in the theory section that flooding leads to inefficient separation. Thus, it should be avoided, by tuning the operating conditions. As can be seen in figure 10, a high vapor velocity coupled with a high flow parameter leads to flooding in a distillation column. The flow parameter represents a ratio of liquid to vapor kinetic energies5. As a result, a high reflux ratio will lead to a high flow parameter, since it introduced more liquid into the column. A high reboiler power will lead to an increase in vapor velocity, as more vapor is produced. Consequently, a high reflux ratio coupled with a high reboiler power will most probably lead to flooding in the distillation column.
15
Figure 10: Performance diagram for tray columns5
Figure 10 showed that a window of satisfactory operation could be defined, bounded by undesirable conditions such as flooding and weeping. This forms the basis for the plot in figure 11 below. A plot of reboiler power and reflux ratio was created using the relevant parameters which were used for each particular run in this rotation. The area marked by crossed lines was defined as a window of satisfactory operation.

16
Reboiler Power vs. Reflux Ratio
00.10.20.30.40.50.60.70.80.9
11.11.21.31.41.51.61.71.81.9
2
3 4 5 6 7 8 9
Reflux Ratio
Reb
oile
r Pow
er/k
W
Flooding
Weeping
Figure 11: Plot of Reboiler Power vs. Reflux Ratio
At R = 4.5, the distillate methanol concentration obtained was determined to be above 90 wt% for all the reboiler power values tested. At R = 6.5, the distillate methanol concentration obtained was determined to be about or above 97 wt%, the desired concentration, for RP = 0.6kW to RP = 0.9kW. When the RP was increased to 1.2kW at R = 6.5, the methanol concentration started to decrease to a steady state value of around 90 wt%. When the RP was further increased to 1.5kW, the methanol concentration started to decrease and no steady state value was obtained after a period of time. It was also observed that there was violent bubbling in the top two trays in the column and volumes of liquid were being forced up the downcomer to the upper tray. Thus, flooding was suspected. At R = 7.25 and RP = 0.9kW, the distillate methanol concentration was determined to be 79.5 wt%. This showed that an increase in reflux ratio from 6.5 to 7.25 actually led to a decrease in the methanol concentration at the same RP of 0.9kW. Thus, weeping was suspected. A higher reflux ratio means that a larger volume of liquid is coming down the column and if the vapor rate is not high enough, the liquid will start to flow through the perforations in the sieve trays, without much contact with the vapor. This led to weeping in the column, which depressed the methanol concentration in the distillate.

17
Determination of generalized Flooding Correlations To determine the values of k1, k2, m and n in equations 3i and 3ii, either R or RP
were kept constant while the other was varied. The relationship between pressure drop and reflux ratio is shown in figure 12, while that between pressure drop and reboiler power is shown in figure 13.
Pressure Drop vs. Reflux Ratio
40
50
60
70
80
90
100
3 4 5 6 7 8 9
Reflux Ratio
Pres
sure
Dro
p/m
mH
2O
RP = 1.2kWRP = 0.9kWRP = 0.6kW
Figure 12: Plot of Pressure Drop vs. Reflux Ratio
It can be seen from figure 12 that at different reboiler powers, the relationship between the pressure drop and reflux ratio changes. At RP = 1.2kW, as the reflux ratio increases, the pressure drop increases. At RP = 0.9kW, as the reflux ratio increases, the pressure drop decreases. At RP = 0.6kW, as the reflux ratio increases, the pressure drop does not show an increasing or decreasing trend. It was thus concluded that there was no discernible relationship between the pressure drop in a column and the reflux ratio.
Pressure Drop vs. Reboiler Power
30405060708090
100
0.5 1 1.5 2
Reboiler Power
Pres
sure
Dro
p/m
mH
2O
R = 3.5R = 4.5R = 6.5R = 8
Figure 13: Plot of Pressure Drop vs. Reboiler Power

18
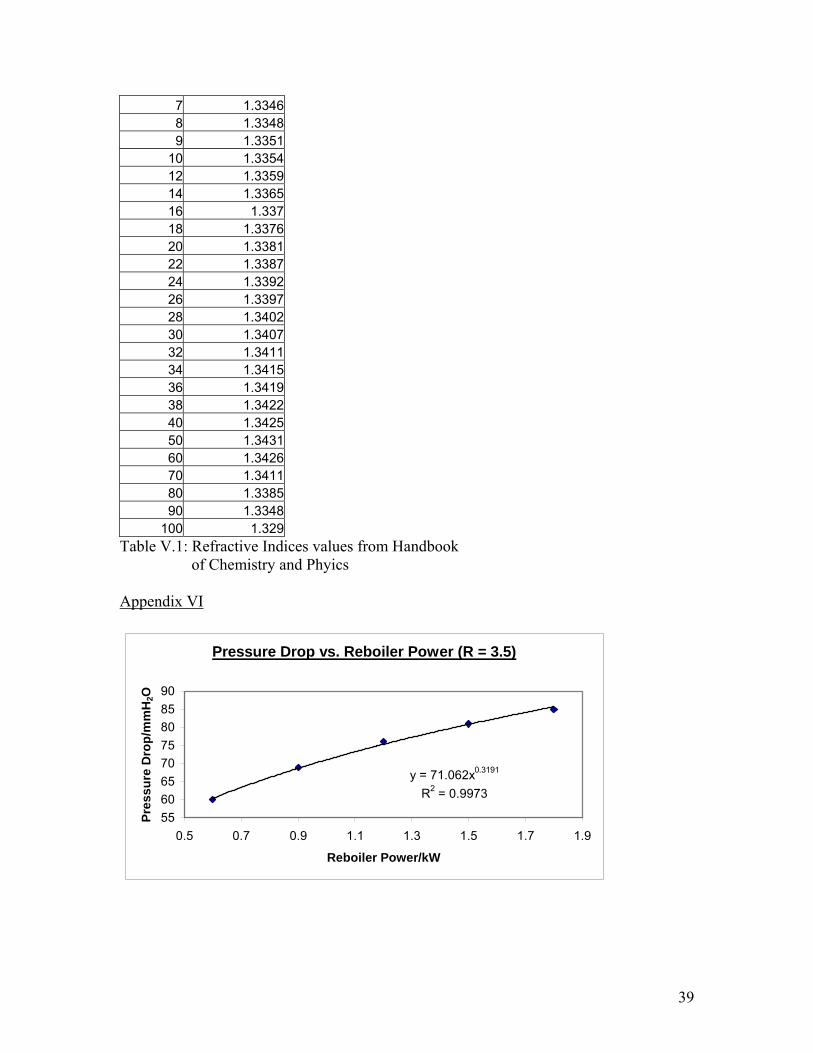
Figure 13 shows an increasing relationship between the pressure drop in a column and the reboiler power. A correlation equation between pressure drop and reboiler power was determined for each reflux ratio and the corresponding values of k2 and n were determined. Table 5 shows the respective equations. The various plots are inserted in Appendix VI.
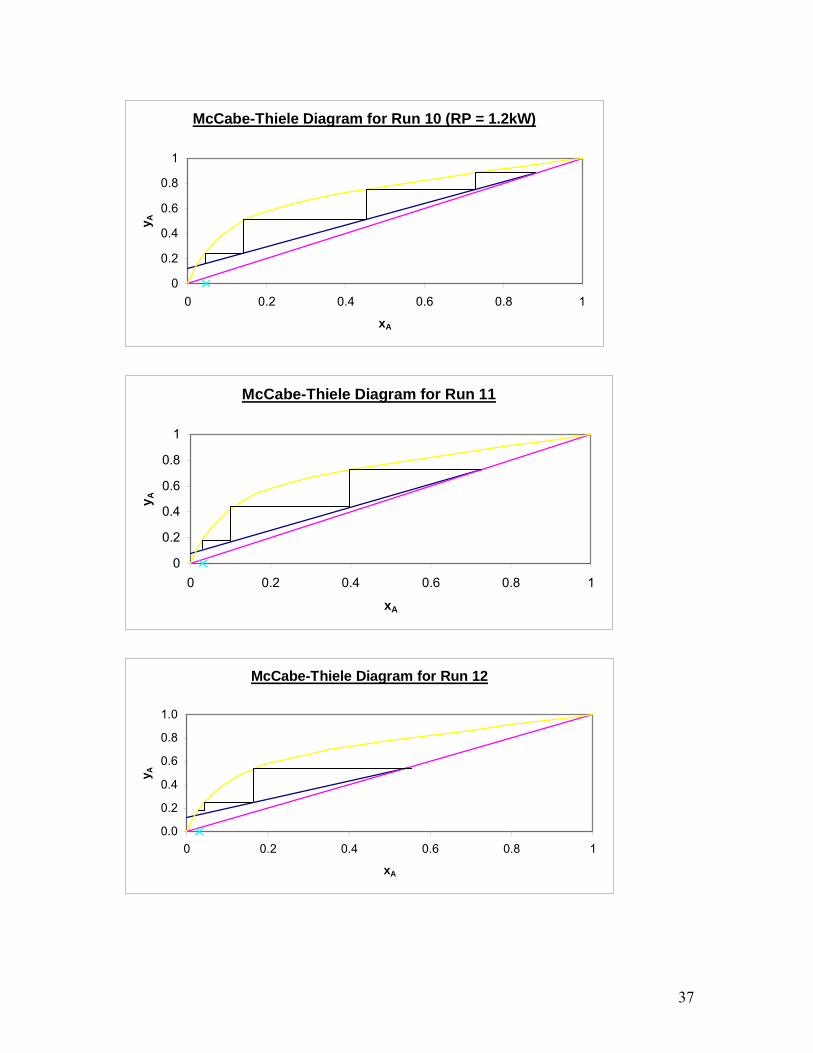
Table 5: Correlation Equations for Flooding R Equation RP range/kW R2 3.5 ΔP = 71.062(RP)0.3191 0.6 – 1.8 0.99734.5 ΔP = 72.831(RP)0.9426 0.6 – 1.2 0.99796.5 ΔP = 68.115(RP)0.5059 0.6 – 1.2 0.961 8 ΔP = 80.014(RP)0.8249 0.6 – 1.2 1 These equations can be used to predict flooding in the distillation column for each reflux ratio and the corresponding range of reboiler power, as shown in table 5. Since flooding usually occurs at high reboiler power and high reflux ratio, as can be seen in run 4 (RP = 1.5kW, R = 6.5), the correlation equations for R = 6.5 and R = 8 can be used to calculate the pressure drop for any value of reboiler power chosen. A relatively high value of calculated pressure drop will mean a higher risk of flooding. Using figure 11, a suitable value of reboiler power could be chosen to avoid flooding in the column. This could be verified using the relevant equation to calculate the expected pressure drop. Column Efficiency For each run, the McCabe-Thiele diagram was prepared and the number of theoretical number of stages was stepped off using the McCabe-Thiele method. An example is shown in Appendix III. The McCabe Thiele method includes the reboiler as a theoretical stage. To determine overall column efficiency, only the stages in the column should be taken into account5. This fact was considered in the calculation of the overall column efficiency. It was measured that the actual column height is 44cm. There are eight trays in the column. Thus, the actual tray height is 5.5cm. By comparing the actual tray height with the values of HETP in table 6, it can be observed that this particular column used was not very efficient, since for the same column height, the same degree of separation could be achieved with less number of trays. This was confirmed by the values of the overall column efficiency, E0. The highest value for E0 obtained was 57.1%, while the lowest was 12.5%. To improve the separation, the efficiency of the column has to be increased.

19
Table 6: HETP and Overall Column Efficiency values for each run Run R RP/kW E0/% HETP/cm
6 6.5 0.6 57.1 9.610 6.5 0.9 55.3 1010 6.5 0.6 49.4 11.1
5 4.5 0.6 47.9 11.57 4.5 1.2 47.5 11.63 6.5 1.2 46.6 11.82 4.5 1.2 43.8 12.6
10 6.5 1.2 36.9 14.98 8 1.2 35.9 15.3
11 8 0.6 24.6 22.313 7.25 0.9 23.4 23.5
9 3.5 0.6 22.5 24.412 3.5 0.9 20.3 27.1
9 3.5 0.6 20.3 27.19 3.5 1.2 17.9 30.89 3.5 1.8 12.5 44
Sources of Error
There were several sources of error which were observed during the experiments. Firstly, the reboiler power was fluctuating for each run by 0.1 to 0.2kW. Thus, there was no constant heating of the reboiler tank. Consequently, the vapor flow rate into the distillation column could vary and affect the separation of methanol and water. Secondly, the external conditions in which the distillation was carried out in could not be controlled to be the same for every run. For each week’s laboratory period, the different external conditions, such as different room temperatures, affect the cooling rates of the column during operation. This will affect the operating efficiency of the column.
There could be error involved in taking the measurements from the manometer, as
the water levels were fluctuating during the distillation runs and thus, an exact pressure drop reading could not be obtained. This could affect the accuracy of the pressure drop readings.
A residual amount of reflux stream actually accumulates in the sample collecting
valve during the runs. This residual amount will affect the concentration of the sample being taken. To prevent any error from arising from this, this residual amount was removed, prior to obtaining the sample to ensure accuracy of the results. Conclusions and Recommendations Conclusion
The refractometer was chosen as the method of concentration measurement for the methanol/water samples based on ease of use, relatively short run time, and superior accuracy compared with the gas chromatograph. The desired methanol concentration in the distillate of 97 wt% was achieved at a reflux ratio of 6.5 and at both reboiler powers of 0.6kW and 0.9kW. Up to a reflux ratio of 6.5, the methanol concentration in the distillate increased with increasing reflux ratio. An increase in reflux ratio over 6.5 led to

20
a gradual decrease in methanol concentration. Generally, the methanol concentration of the distillate stream decreased with increasing reboiler power. The relatively low standard deviations of the data obtained from the replicated runs prove that the data obtained were consistent and reliable. A window of optimum operation was defined, beyond which flooding or weeping occurs. Correlation equations between pressure drop in column and reboiler power were obtained for certain reflux ratios. There appeared to be no discernible relationship between pressure drop and reflux ratio. Although, the desired methanol concentration in the distillate could be obtained, the efficiency of the distillation column was assessed to be at best 57.1%. Recommendations Suggestions for next rotation
For the next rotation, the engineers should try to shrink the size of the operating window, by carrying out runs with values of reflux ratio and reboiler power which are in the window itself. They should also replicate as many runs as possible to ensure the accuracy of the data obtained. They could also improve upon the flooding correlations determined in this rotation, by carrying out experimental runs similar to run 9 and 10 of this rotation. Each run will be carried out at a constant reflux ratio and varying reboiler powers. The data obtained from these type of runs generate viable plots of pressure drop versus reboiler power. A correlation equation can then be determined between pressure drop and reboiler power for each reflux ratio. These runs can also be carried out till flooding occurs, which is signaled by a continuous reduction in methanol concentration in the distillate. The value of the pressure drop at flooding conditions can then be noted down.
It would be beneficial to replace the insulation on the current distillation column
because, currently, a lot of heat was being lost to the surroundings during distillation runs. The reboiler can be preheated, at total reflux, by setting the reboiler power to maximum, until the temperature of the top of the column reaches around 60oC, which is less than the boiling point of methanol. This will save a lot of time on the first run of each lab period. Low feed concentration is always a problem. It would be better to empty about half of the still pot into a separate container and then refill using new methanol/water solution. This should be able to set the feed concentration at around 7.5 wt% methanol. It would be time consuming if the next rotation wishes to obtain an exact feed concentration of 7.5 wt% methanol. It is advisable to carry on with the runs even if the feed concentration is not exactly 7.5 wt%. Suggestions for improving the performance of the distillation equipment
To maximize the performance of the distillation equipment, the diameter of the perforations in the sieve trays can be decreased to minimize entrainment. Furthermore, the weir height can also be decreased to reduce the hold up in each tray, since the liquid must flow over the weir in order to enter the downcomer. A high liquid hold up usually results in liquid back up in the downcomer. Reducing weir height also decreases the likelihood of weeping.

21
If the cost of replacing the column is too high, then de-entrainments devices9 can be installed in the columns to increase the efficiency of the trays. These devices basically capture and return the liquid to the lower tray during entrainment.
The distillation equipment is usually run at constant reflux ratio to achieve the
desired methanol concentration in the distillate. After the desired concentration has been achieved, the equipment can then be run at variable reflux ratios to maintain the desired concentration, till the operation is constrained by mass balance limitations.
Nomenclature R Reflux Ratio L Reflux Stream D Distillate Stream xD Mole fraction of methanol in distillate ΔP Pressure Drop in column RP Reboiler Power xF Mole fraction of methanol in feed HETP Height of a Theoretical Tray H Height of Column Nt Theoretical Number of Trays Na Actual Number of Trays E0 Overall Column Efficiency yn+1 mole fraction of methanol in vapor stream
leaving stage n+1 xn mole fraction of methanol in liquid stream
leaving stage n Rmin Minimum Reflux Ratio R2 Residual value MeOH Methanol XMeOH Mole fraction of methanol References
1. Geankopolis, C.J. Transport Processes and Separation Process Principles. USA: Prentice Hall, 2003.
2. Miletic M. Microcomputer-Controlled Distillation Unit Manual. Roger Adams Chemical, Inc. 2005.
3. Miletic M. Methanol Recovery via Distillation – Rotation 1 Assignment Memo (Date: August 17, 2005). Roger Adams Chemicals, Inc. 2005.
4. Perry, Robert. Green, Don. Perry’s Chemical Engineers’ Handbook (7th Edition). USA: McGraw Hill, 1997
5. Fair, J. “Distillation” Handbook of Separation Process Technology. Rousseau, R. USA: Wiley-Interscience, 1987. Pages 229-339.
6. <http://www.engr.pitt.edu/chemical/undergrad/ lab_manuals/trayed_distillation.pdf> 7. Diwekar, Urmila. Batch Distillation – Simulation, Optimal Design and Control.
USA: Taylor & Francis, 1995. 8. <http://www.engr.pitt.edu/chemical/undergrad/ lab_manuals/packed_bed_rev_jan02.pdf>
22
9. N. S. Yang, K. T. Chuang, A. Afacan. Improving the Efficiency and Capacity of Methanol-Water Distillation Trays. Ind. Eng. Chem. Res. 2003, 42, 6601-6606.
10. D. L. Bennett, K. W. Kovak. Optimize Distillation Columns. Chemical Engineering Progress, May 2000.
Content of Appendix Appendix I: Raw Data from Calibration and Distillation Runs Appendix II: Processed Data Appendix III: Hand Calculation Example for Rmin and Run 2 Appendix IV: McCabe Thiele Diagrams Appendix V: Calibration data from Handbook of Chemistry and Physics (85th Edition) Appendix VI: Plots of Pressure Drop vs. Reboiler Power

23
Appendix I vol% methanol weight% methanol Refractive Index measurement 1 measurement 2 measurement 3 mean
0 0.0 1.3345 1.3346 1.3345 1.33453310 8.1 1.336 1.336 1.3365 1.33616720 16.5 1.338 1.338 1.338 1.33830 25.3 1.34 1.34 1.34 1.3440 34.5 1.342 1.342 1.3415 1.34183350 44.2 1.343 1.34325 1.343 1.34308360 54.3 1.343 1.343 1.343 1.34370 64.9 1.3425 1.3425 1.3425 1.342580 76.0 1.3405 1.3405 1.3405 1.340590 87.7 1.3365 1.3365 1.3365 1.3365
100 100.0 1.3295 1.329 1.329 1.329167Table I.1: Calibration data for refractometer wt% Methanol vol% Methanol Area Under Peak
0.0 0 11816.5 0.1 183630.8 0.2 573343.2 0.3 248472.7 0.6 310372.7 0.6 2300080.6 0.7 2545087.7 0.8 3890094.1 0.9 34850
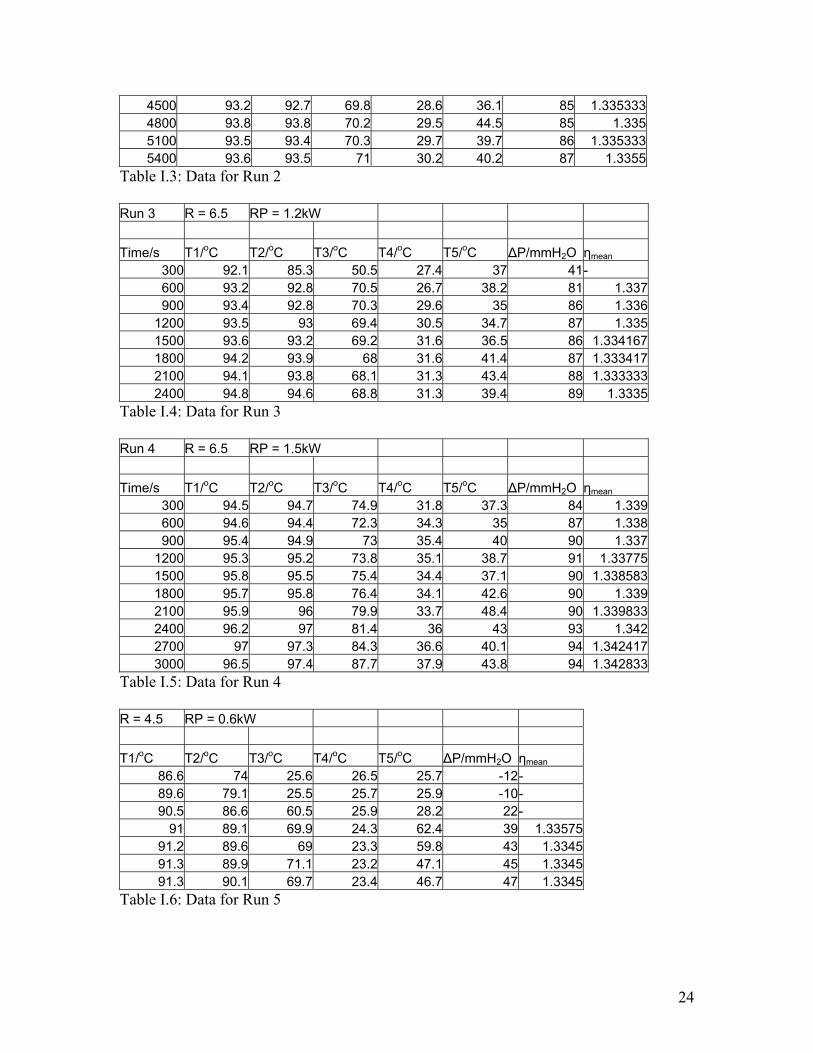
100.0 1 41620Table I.2: Calibration data for GC Run 2 R = 4.5 RP = 1.2kW Time/s T1/oC T2/oC T3/oC T4/oC T5/oC ΔP/mmH2O ηmean
300 40.1 26.2 24 24.5 24 7- 600 45 27.9 24 24.3 24 4.5- 900 49.5 29.2 24 24.3 24 5-
1200 54.8 31.6 24 24.2 23.9 5- 1500 58.6 34.5 24 24.3 23.9 5.5- 1800 62.8 37.9 24.4 24.8 24.5 6- 2100 67.7 43.1 23.9 24.5 24.5 6.5- 2400 71.8 46.9 24.4 24.8 24.7 6.5- 2700 76.2 53.1 24 24.3 24.2 9- 3000 80.9 60.7 24 24.2 24.2 10- 3300 85.1 68.8 24.4 24.8 25 9- 3600 90.7 78.7 24.2 24.4 25.1 9- 3900 93.4 91.7 74.4 22.9 44 87 1.3425834200 92.9 92.7 70.8 27 32.3 83 1.3385
24
4500 93.2 92.7 69.8 28.6 36.1 85 1.3353334800 93.8 93.8 70.2 29.5 44.5 85 1.3355100 93.5 93.4 70.3 29.7 39.7 86 1.3353335400 93.6 93.5 71 30.2 40.2 87 1.3355
Table I.3: Data for Run 2 Run 3 R = 6.5 RP = 1.2kW Time/s T1/oC T2/oC T3/oC T4/oC T5/oC ΔP/mmH2O ηmean
300 92.1 85.3 50.5 27.4 37 41- 600 93.2 92.8 70.5 26.7 38.2 81 1.337 900 93.4 92.8 70.3 29.6 35 86 1.336
1200 93.5 93 69.4 30.5 34.7 87 1.335 1500 93.6 93.2 69.2 31.6 36.5 86 1.334167 1800 94.2 93.9 68 31.6 41.4 87 1.333417 2100 94.1 93.8 68.1 31.3 43.4 88 1.333333 2400 94.8 94.6 68.8 31.3 39.4 89 1.3335
Table I.4: Data for Run 3 Run 4 R = 6.5 RP = 1.5kW Time/s T1/oC T2/oC T3/oC T4/oC T5/oC ΔP/mmH2O ηmean
300 94.5 94.7 74.9 31.8 37.3 84 1.339 600 94.6 94.4 72.3 34.3 35 87 1.338 900 95.4 94.9 73 35.4 40 90 1.337
1200 95.3 95.2 73.8 35.1 38.7 91 1.33775 1500 95.8 95.5 75.4 34.4 37.1 90 1.338583 1800 95.7 95.8 76.4 34.1 42.6 90 1.339 2100 95.9 96 79.9 33.7 48.4 90 1.339833 2400 96.2 97 81.4 36 43 93 1.342 2700 97 97.3 84.3 36.6 40.1 94 1.342417 3000 96.5 97.4 87.7 37.9 43.8 94 1.342833
Table I.5: Data for Run 4 R = 4.5 RP = 0.6kW T1/oC T2/oC T3/oC T4/oC T5/oC ΔP/mmH2O ηmean
86.6 74 25.6 26.5 25.7 -12- 89.6 79.1 25.5 25.7 25.9 -10- 90.5 86.6 60.5 25.9 28.2 22-
91 89.1 69.9 24.3 62.4 39 1.3357591.2 89.6 69 23.3 59.8 43 1.334591.3 89.9 71.1 23.2 47.1 45 1.334591.3 90.1 69.7 23.4 46.7 47 1.3345
Table I.6: Data for Run 5

25
Run 6 R = 6.5 RP = 0.6kW Time/s T1/oC T2/oC T3/oC T4/oC T5/oC ΔP/mmH2O ηmean
300 91.2 90.4 74.7 24.2 54.6 45 1.33650600 91.8 90.2 71.6 23.7 58.2 49 1.33550900 91.7 90.3 68.9 23.5 59.4 49 1.33408
1200 91.8 90.6 67.7 23.4 47.5 49 1.333001500 91.9 90.6 66.7 23.1 61.7 48 1.332081800 92.2 90.8 66.4 23.1 58.5 48 1.331502100 92.1 90.9 66.2 23.7 59 48 1.331252400 92.4 91.3 65.9 23 53.2 48 1.33142
Table I.7: Data for Run 6 Run 7 R = 4.5 RP = 1.2kW Time/s T1/oC T2/oC T3/oC T4/oC T5/oC ΔP/mmH2O ηmean
300 92.5 91.9 71.8 25.5 51.2 80 1.33533600 93.1 92.5 71.2 29.4 46.4 85 1.33467900 92.9 92.5 71.5 30.5 54.1 88 1.33467
1200 93.8 93.2 70.9 30.1 44.4 89 1.33500Table I.8: Data for Run 7 Run 8 R = 8 RP = 1.2kW Time/s T1/oC T2/oC T3/oC T4/oC T5/oC ΔP/mmH2O ηmean
300 93.5 92.6 72 28.9 45.3 84 1.3355600 94.1 92.5 71.2 30 42.4 93 1.3345900 94.5 93.2 70.9 36.5 43.9 102 1.334583
1200 94.3 93.5 71 31 44.8 99 1.3351500 94.3 93.8 71 31.3 57.1 99 1.3345831800 94.9 94.4 71.3 30.8 38.5 98 1.334667
Table I.9: Data for Run 8 R = 3.5 RP = Varying T1/oC T2/oC T3/oC T4/oC T5/oC ΔP/mmH2O ηmean
93.8 91.5 69.4 29.3 52.2 29 1.33258 94.4 92.8 80.2 29.3 64.5 46 1.33883 94.2 93.2 81.4 27.2 63.8 56 1.34183 94.1 93.2 82.7 26.7 52.2 61 1.34150 94.8 93.5 84 26.2 53.2 60 1.34150 94.3 94.1 85.9 26.1 51.9 70 1.34208 95.5 94.8 85.5 25.7 48.7 69 1.34200 94.6 94.5 83.6 26.9 65.9 69 1.34208 94.7 94.6 86.4 26.4 49.9 70 1.34225 95.6 94.8 84.7 26.8 67.7 75 1.34225
95 94.9 84 27.8 36.3 75 1.34275

26
95.4 95.5 86.4 27.2 45.2 76 1.34250 95.2 95.2 87.7 27.7 43 76 1.34250 95.6 96 87.7 30.1 53.5 81 1.34250 95.7 95.6 89 31.4 44.5 81 1.34250
96 96.8 89.4 33.3 53.5 85 1.34292 96.2 97 91.2 34.5 70.3 85 1.34283 95.9 96.2 90.7 34.6 42.7 85 1.34292
Table I.10: Data for Run 9 Run10 R = 6.5 RP = Varying kW Time/s T1/oC T2/oC T3/oC T4/oC T5/oC ΔP/mmH2O ηmean
300 91.5 87.8 70.2 24.8 45.3 46 1.33650600 91.7 90.8 68.4 22.6 54.6 53 1.33467900 91.8 90.4 67.0 22.0 51.3 53 1.33300
1200 92.9 90.7 66.3 22.1 54.9 51 1.332001500 92.0 90.8 66.2 22.2 59.6 51 1.331671800 92.2 91.0 66.4 22.1 43.6 52 1.331752100 92.2 91.0 66.1 22.0 44.3 53 1.331502400 92.3 91.3 66.1 22.1 52.7 54 1.331502700 92.5 91.7 66.7 23.1 40.6 58 1.332003000 92.5 91.9 66.1 24.8 41.8 59 1.331503300 92.8 92.0 65.8 25.6 54.2 59 1.331253600 93.5 92.7 65.8 26.0 44.6 62 1.331253900 93.0 92.5 66.7 26.7 51.2 62 1.331254200 93.7 92.4 69.3 28.1 37.6 66 1.334004500 93.2 93.6 69.8 30.1 49.3 81 1.333754800 93.8 93.1 69.4 31.1 37.1 79 1.333505100 94.8 93.5 69.3 30.5 41.5 77 1.333755400 94.3 93.8 70.3 30.5 38.0 76 1.334005700 95.1 95.1 71.5 22.7 40.3 78 1.335506000 94.7 94.4 71.5 34.4 37.8 77 1.335176300 95.7 94.8 71.4 34.6 39.1 76 1.335256600 95.6 95.1 73.6 34.1 40.2 76 1.336506900 96.2 96.0 76.5 33.4 38.2 77 1.33825
Table I.11: Data for Run 10 Run 11 R = 8 RP = 0.6kW Time/s T1/oC T2/oC T3/oC T4/oC T5/oC ΔP/mmH2O ηmean
300 88.6 81.0 53.2 31.4 45.0 -17- 600 90.3 84.5 48.9 27.7 43.8 -16- 900 93.5 90.1 54.9 29.4 42.1 12-
1200 93.9 93.2 74.2 27.6 50.9 42 1.338001500 94.0 93.5 73.9 25.6 52.7 44 1.337001800 94.3 93.9 74.8 25.5 64.2 46 1.336832100 94.3 94.5 75.3 24.0 43.2 46 1.337502400 95.2 93.9 75.6 23.9 49.0 51 1.33800

27
2700 94.4 94.2 75.9 23.8 62.2 51 1.338503000 94.6 94.4 75.7 23.7 61.5 54 1.338503300 94.7 94.9 75.5 23.7 49.1 52 1.338503600 94.6 94.4 76.3 24.7 48.0 53 1.33850
Table I.12: Data for Run 11 Run 12 R = 3.5 RP = 0.6kW Time/s T1/oC T2/oC T3/oC T4/oC T5/oC ΔP/mmH2O ηmean
300 94.6 93.0 78.8 24.7 54.7 44 1.33800 600 94.8 94.5 82.5 24.4 52.6 52 1.34100 900 95.9 95.7 83.3 24.2 52.9 52 1.34200
1200 94.8 94.6 83.4 24.2 51.9 52 1.34200 Table I.13: Data for Run 12 Run 13 R = 7.25 RP = 0.9kW Time/s T1/oC T2/oC T3/oC T4/oC T5/oC ΔP/mmH2O ηmean
300 96.2 95.3 81.8 24.6 48.0 56 1.34150600 94.6 94.8 79.3 24.0 39.1 58 1.34050900 95.3 95.4 78.1 24.8 46.2 59 1.33983
1200 95.4 95.5 77.2 24.7 41.5 59 1.339501500 96.2 96.2 78.6 24.7 45.4 59 1.33950
Table I.14: Data for Run 13 Run Refractive Index 1 1.3355 2 1.3355 3 1.3355 4 1.3355 5 1.3355 6 1.3355 7 1.3355 8 1.3355 9 1.3355 10 1.336 11 1.3355 12 1.3355 13 1.3355 Table I.15 Data for Refractive Indices of feed solution

28
Run Number of theoretical Stages (raw)
Number of theoretical stages
1 2 4.5 3.53 4.73 3.734 5 4.83 3.836 5.57 4.577 4.8 3.88 3.875 2.875
9i 2.8 1.8 9ii 2.625 1.625 9iii 2.43 1.43 9iv 2 1 10i 4.95 3.95 10ii 5.42 4.42 10iii 3.95 2.95
11 2.97 1.9712 2.625 1.62513 2.87 1.87
Table I.16: Number of Theoretical Stages Appendix II Run RP/kW R [MeOH]/wt% xMeOH
10 0.9 6.5 97.1 0.9510 0.6 6.5 96.8 0.944
6 0.6 6.5 96.8 0.9443 1.2 6.5 93.6 0.891
10 1.2 6.5 92.7 0.8775 0.6 4.5 91.8 0.8638 1.2 8 90.8 0.8487 1.2 4.5 90.8 0.8482 1.2 4.5 89.9 0.833
11 0.6 8 82.6 0.72813 0.9 7.25 79.5 0.686
9 0.6 3.5 71.2 0.58212 0.6 3.5 68.3 0.548
9 0.9 3.5 66.6 0.5299 1.2 3.5 64.6 0.5079 1.5 3.5 64.6 0.5079 1.8 3.5 60.2 0.459
Table II.1: Values of methanol concentration in distillate and respective mole fraction for each run
29
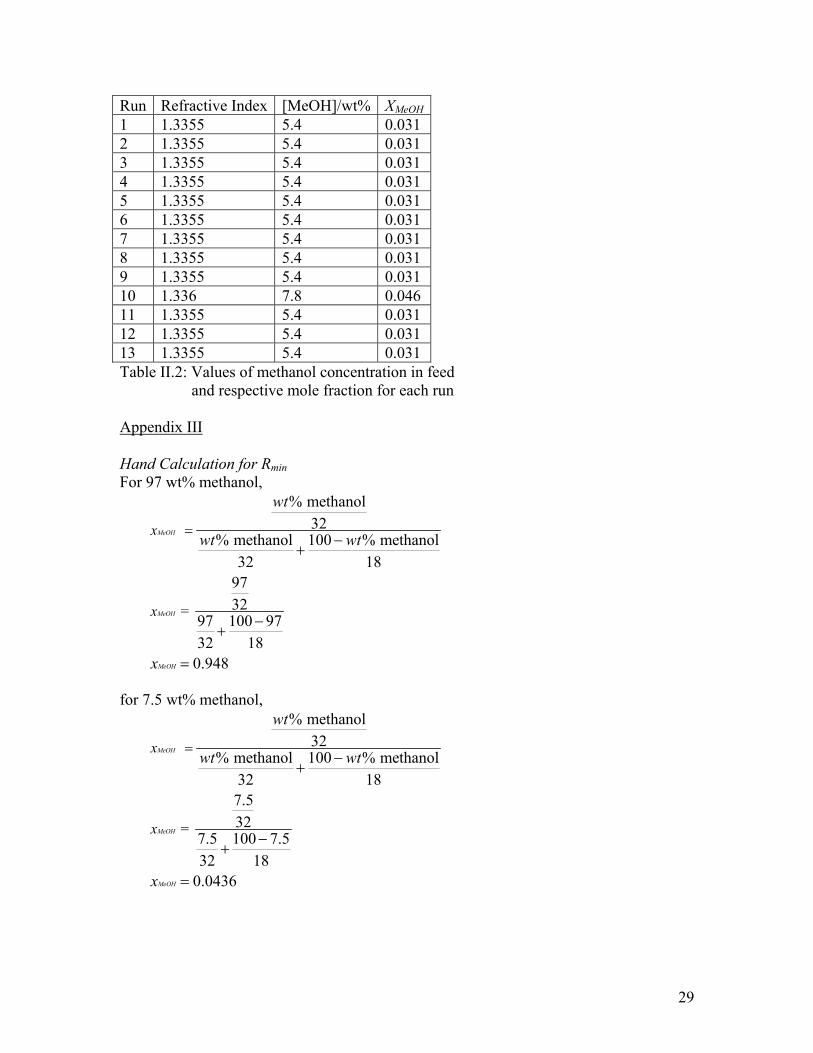
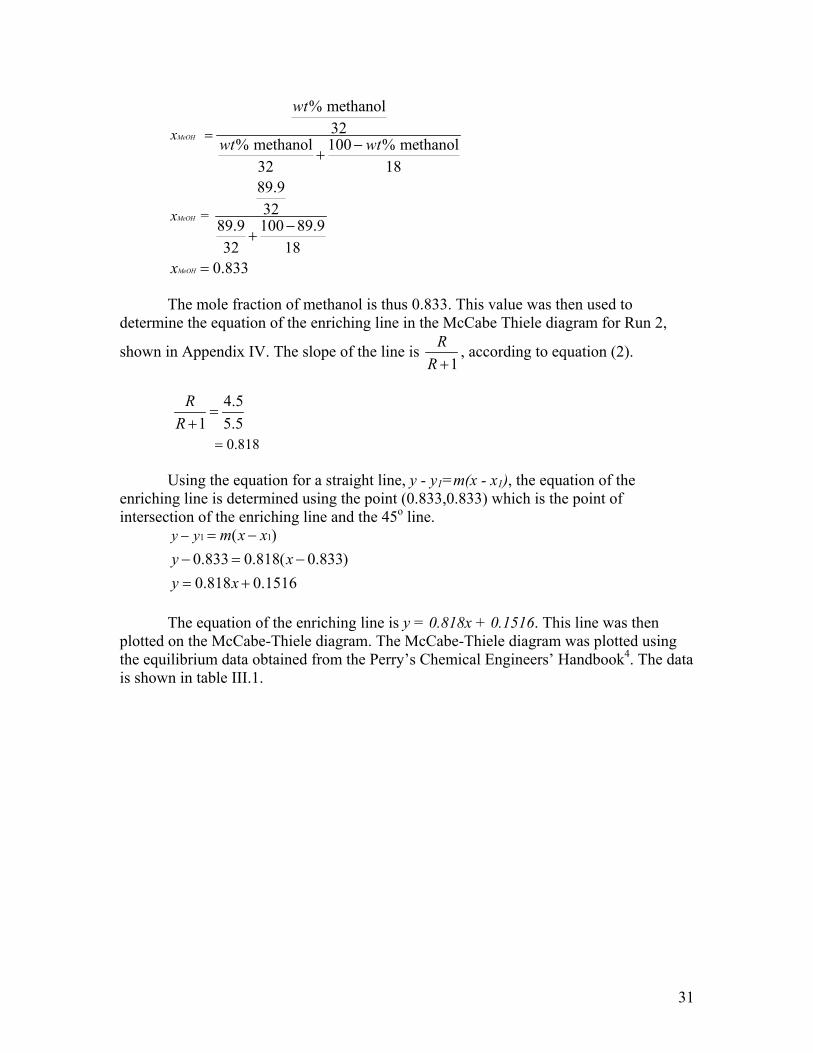
Run Refractive Index [MeOH]/wt% XMeOH1 1.3355 5.4 0.031 2 1.3355 5.4 0.031 3 1.3355 5.4 0.031 4 1.3355 5.4 0.031 5 1.3355 5.4 0.031 6 1.3355 5.4 0.031 7 1.3355 5.4 0.031 8 1.3355 5.4 0.031 9 1.3355 5.4 0.031 10 1.336 7.8 0.046 11 1.3355 5.4 0.031 12 1.3355 5.4 0.031 13 1.3355 5.4 0.031 Table II.2: Values of methanol concentration in feed and respective mole fraction for each run Appendix III Hand Calculation for Rmin For 97 wt% methanol,
=
% methanol32
% methanol 100 % methanol32 18
9732
97 100 9732 18
0.948
MeOH
MeOH
MeOH
x
x
wt
wt wt
x
=−
+
−+
=
for 7.5 wt% methanol,
=
% methanol32
% methanol 100 % methanol32 18
7.532
7.5 100 7.532 18
0.0436
MeOH
MeOH
MeOH
x
x
wt
wt wt
x
=−
+
−+
=

30
Plot of Equilibrium Data for Methanol/Water
0
0.2
0.4
0.6
0.8
1
0 0.1 0.2 0.3 0.4 0.5 0.6 0.7 0.8 0.9 1
xA
y A
Enriching Line for Rmin
Figure III.1: Determination of Rmin
min
min
min
0.948 0.2167slope of enriching line = 0.948 0
= 0.771
0.77113.37
RRR
−−
=+=
Hand Calculation for Run 2
From table I.3, the steady state value of the refractive index is 1.3355. Using the Solver function in Microsoft Excel and the equation of the calibration curve, the value for the methanol concentration was calculated. Since T3 was 71oC, using the T-xy diagram for methanol/water, it was determined that the methanol concentration has to be the larger of the two possible values.
The equation of the calibration curve is:
12 5 9 4 7 3 6 2 49.37156 10 2.326393 10 2.377475 10 7.999297 10 1.342876 10 1.334568y x x x x x− − − − −= − × + × − × + × + × +
By using the Solver function, the value of x was solved for by setting y = 1.3355. x was determined to be 89.9. The steady state methanol concentration of the distillate for run 2 was thus 89.9 wt%. This value is then converted to mole fraction of methanol using equation (7).
31
=
% methanol32
% methanol 100 % methanol32 1889.932
89.9 100 89.932 18
0.833
MeOH
MeOH
MeOH
x
x
wt
wt wt
x
=−
+
−+
=
The mole fraction of methanol is thus 0.833. This value was then used to determine the equation of the enriching line in the McCabe Thiele diagram for Run 2,
shown in Appendix IV. The slope of the line is 1
RR +
, according to equation (2).
0.818
4.51 5.5
RR
=
=+
Using the equation for a straight line, y - y1=m(x - x1), the equation of the enriching line is determined using the point (0.833,0.833) which is the point of intersection of the enriching line and the 45o line.
1 1( )
0.833 0.818( 0.833)0.818 0.1516
y y m x xy xy x
− = −− = −= +
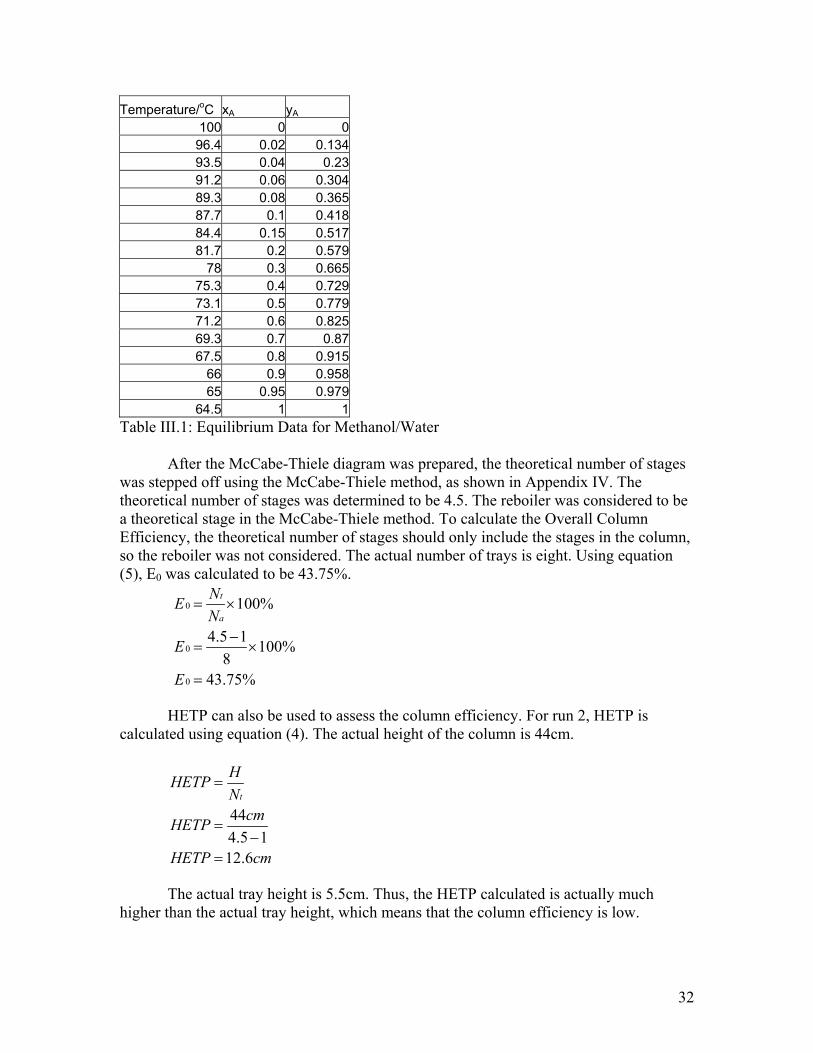
The equation of the enriching line is y = 0.818x + 0.1516. This line was then plotted on the McCabe-Thiele diagram. The McCabe-Thiele diagram was plotted using the equilibrium data obtained from the Perry’s Chemical Engineers’ Handbook4. The data is shown in table III.1.
32
Table III.1: Equilibrium Data for Methanol/Water After the McCabe-Thiele diagram was prepared, the theoretical number of stages was stepped off using the McCabe-Thiele method, as shown in Appendix IV. The theoretical number of stages was determined to be 4.5. The reboiler was considered to be a theoretical stage in the McCabe-Thiele method. To calculate the Overall Column Efficiency, the theoretical number of stages should only include the stages in the column, so the reboiler was not considered. The actual number of trays is eight. Using equation (5), E0 was calculated to be 43.75%.
0
0
0
100%
4.5 1 100%8
43.75%
t
a
NEN
E
E
= ×
−= ×
=
HETP can also be used to assess the column efficiency. For run 2, HETP is calculated using equation (4). The actual height of the column is 44cm.
444.5 112.6
t
HHETPN
cmHETP
HETP cm
=
=−
=
The actual tray height is 5.5cm. Thus, the HETP calculated is actually much higher than the actual tray height, which means that the column efficiency is low.
Temperature/oC xA yA 100 0 096.4 0.02 0.13493.5 0.04 0.2391.2 0.06 0.30489.3 0.08 0.36587.7 0.1 0.41884.4 0.15 0.51781.7 0.2 0.579
78 0.3 0.66575.3 0.4 0.72973.1 0.5 0.77971.2 0.6 0.82569.3 0.7 0.8767.5 0.8 0.915
66 0.9 0.95865 0.95 0.979
64.5 1 1

33
Appendix IV
McCabe-Thiele Diagram for Run 2
0
0.2
0.4
0.6
0.8
1
0 0.1 0.2 0.3 0.4 0.5 0.6 0.7 0.8 0.9 1
xA
y A
McCabe-Thiele Diagram for Run 3
0
0.2
0.4
0.6
0.8
1
0 0.1 0.2 0.3 0.4 0.5 0.6 0.7 0.8 0.9 1
xA
y A
McCabe-Thiele Diagram for Run 5
0
0.2
0.4
0.6
0.8
1
0 0.1 0.2 0.3 0.4 0.5 0.6 0.7 0.8 0.9 1
xA
y A

34
McCabe-Thiele Diagram for Run 6
0
0.2
0.4
0.6
0.8
1
0 0.1 0.2 0.3 0.4 0.5 0.6 0.7 0.8 0.9 1
xA
y A
McCabe-Thiele Diagram for Run 7
0
0.2
0.4
0.6
0.8
1
0 0.1 0.2 0.3 0.4 0.5 0.6 0.7 0.8 0.9 1
xA
y A
McCabe-Thiele Diagram for Run 8
0
0.2
0.4
0.6
0.8
1
0 0.1 0.2 0.3 0.4 0.5 0.6 0.7 0.8 0.9 1
xA
y A

35
McCabe-Thiele Diagram for Run 9 (RP= 0.6kW)
0
0.2
0.4
0.6
0.8
1
1.2
0 0.2 0.4 0.6 0.8 1 1.2
xA
y A
McCabe-Thiele Diagram for Run 9 (RP = 0.9kW)
0
0.2
0.4
0.6
0.8
1
0 0.2 0.4 0.6 0.8 1
xA
y A
McCabe-Thiele Diagram for Run 9 (RP = 1.2,1.5kW)
0
0.2
0.4
0.6
0.8
1
0 0.2 0.4 0.6 0.8 1
xA
y A

36
McCabe-Thiele Diagram for Run 9 (RP = 1.8kW)
0
0.2
0.4
0.6
0.8
1
0 0.2 0.4 0.6 0.8 1
xA
y A
McCabe-Thiele Diagram for Run 10 (RP = 0.6kW)
0
0.2
0.4
0.6
0.8
1
0 0.2 0.4 0.6 0.8 1
xA
y A
McCabe-Thiele Diagram for Run 10 (RP= 0.9kW)
0
0.2
0.4
0.6
0.8
1
0 0.2 0.4 0.6 0.8 1
xA
y A
37
McCabe-Thiele Diagram for Run 10 (RP = 1.2kW)
0
0.2
0.4
0.6
0.8
1
0 0.2 0.4 0.6 0.8 1
xA
y A
McCabe-Thiele Diagram for Run 11
0
0.2
0.4
0.6
0.8
1
0 0.2 0.4 0.6 0.8 1
xA
y A
McCabe-Thiele Diagram for Run 12
0.0
0.2
0.4
0.6
0.8
1.0
0 0.2 0.4 0.6 0.8 1
xA
y A

38
McCabe-Thiele Diagram for Run 13
0
0.2
0.4
0.6
0.8
1
0 0.2 0.4 0.6 0.8 1
xA
y A
Appendix V
refractive index vs mass%
y = -9.45306E-12x5 + 2.62035E-09x4 - 2.84901E-07x3 + 9.80273E-06x2 + 1.53273E-04x + 1.33308E+00R2 = 9.99796E-011.328
1.33
1.332
1.334
1.336
1.338
1.34
1.342
1.344
0 20 40 60 80 100 120
mass%
refra
ctiv
e in
dex
mass% refractive index
0.5 1.3331 1 1.3332 2 1.3334 3 1.3336 4 1.3339 5 1.3341 6 1.3343
39
7 1.3346 8 1.3348 9 1.3351
10 1.3354 12 1.3359 14 1.3365 16 1.337 18 1.3376 20 1.3381 22 1.3387 24 1.3392 26 1.3397 28 1.3402 30 1.3407 32 1.3411 34 1.3415 36 1.3419 38 1.3422 40 1.3425 50 1.3431 60 1.3426 70 1.3411 80 1.3385 90 1.3348
100 1.329 Table V.1: Refractive Indices values from Handbook of Chemistry and Phyics Appendix VI
Pressure Drop vs. Reboiler Power (R = 3.5)
y = 71.062x0.3191
R2 = 0.9973
5560657075808590
0.5 0.7 0.9 1.1 1.3 1.5 1.7 1.9
Reboiler Power/kW
Pres
sure
Dro
p/m
mH
2O

40
Pressure Drop vs. Reboiler Power (R = 4.5)
y = 72.831x0.9426
R2 = 0.997940
50
60
70
80
90
100
0.5 0.6 0.7 0.8 0.9 1 1.1 1.2 1.3
Reboiler Power
Pres
sure
Dro
p/m
mH
2O
Pressure Drop vs. Reboiler Power (R = 6.5)
y = 68.115x0.5059
R2 = 0.961
50
55
60
65
70
75
80
0.5 0.6 0.7 0.8 0.9 1 1.1 1.2 1.3
Reboiler Power/kW
Pres
sure
Dro
p/m
mH
2O
Pressure Drop vs. Reboiler Power (R = 8)
y = 80.014x0.8249
R2 = 1
40
50
60
70
80
90
100
0.5 0.6 0.7 0.8 0.9 1 1.1 1.2 1.3
Reboiler Power/kW
Pres
sure
Dro
p/m
mH
2O