Embed Size (px)
Citation preview

RODS AND TUBES AS AE WAVEGUIDES
KANJI ONO1 and HIDEO CHO2
1 University of California, Los Angeles, California, USA 2 Aoyama Gakuin University, Sagamihara, Kanagawa, Japan.
Abstract
We have examined the wave propagation behavior in aluminum rods and tubes using laser techniques along with conventional sensors. The velocity characteristics agree between theory and experiment, but substantial signal dispersion effects were observed. Waveform fidelity is completely absent with the use of waveguides. Pointed waveguides often used in practice showed less signal broadening. The wave attenuation is high in certain frequency ranges. Tube waveguides showed similar pulse broadening as the solid rod type, but with more attenuation. Implications of the observed behavior for the application of AE waveguides are discussed. Keywords: Waveguides, rods, tubes, wave propagation, dispersion, waveform fidelity 1. Introduction
Waveguides have been used in acoustic emission (AE) testing to protect sensors from ex-treme environment. Common examples include AE sensing at high and low temperatures, and under corrosive chemical solutions and gases. The presence of intense radiation and magnetic fields also necessitates the use of waveguides. Rods are typically employed as AE waveguides. One end of a waveguide is glued, welded, brazed, soldered, fastened, or pressed to structure, while a sensor is coupled to the opposite end. Among many reports of successful uses of waveguides, Hsu and Ono (1) used brazed rod waveguides to conduct high-temperature deforma-tion studies; Rodgers and Tilley (2) are using stud-welded rod waveguides in their work on creep crack detection in fossil-fuel power plant piping; Allevato (3) has been using a pointed-end waveguides, pressure-coupled to petroleum-refinery vessels. However, no systematic study on AE waveguides has been reported (4). Thus, questions remain; Is the rod the best shape? If so, what diameter to use? Is tube a better waveguide? Can we get more design choices? In some ap-plications (e.g., cryogenics), tubes can be advantageous due to lower heat conduction and less mass. This provided an impetus to compare rod and tube waveguides in typical AE application environment.
For the history of wave propagation theory, see (4). Also consult Redwood (5), Graff (6) and Rose (7). In rods, simple kinematical theory says that the velocity of wave propagation has a fixed value at the low frequency limit, in terms of the Young’s modulus E and mass density ρ, as given by
Vrod = E / ρ . This is called rod velocity or bar velocity and applies to both phase and group velocities. At higher frequencies, wave propagation is dispersive and the velocities vary widely. Wave propa-gation in tubes (or hollow cylinders) has a higher level of complexity due to the presence of in-ner surfaces. Gazis (8) established the theoretical basis of wave propagation in tubes and derived characteristic frequency equations. This theory is the foundation of current understanding of waves in tubes. Nishino et al. (9) examined Gazis theory and clarified the modes of wave propa-
J. Acoustic Emission, 22 (2004) 243 © 2004 Acoustic Emission Group
gation, differentiating certain flexural and torsional wave modes. They also developed computa-tional software and calculated dispersion relations for several sets of tube geometry. A commer-cial software package (DISPERSE) is also available.
In this study, we examine the wave propagation behavior in rods and tubes in conditions that may arise in typical AE application environment for waveguides. 2. Experiment
Experiment on rod/tube waves mostly utilized a through-transmission technique. A series of basic tests utilized a YAG laser (Continuum; 3 mJ output) and a laser interferometer (Thalen La-ser; SH-140) with 20 kHz to 20 MHz bandwidth. A 140-kHz PZT sensor (Dunegan S140B) was used as a receiver with a preamplifier (NF 9913A) or as a transmitter with a 150V, 0.6-µs rise time pulser. A more practical series used piezoelectric sensors on both ends. Some pulse-echo experiments were conducted as well, especially for higher frequencies. Pulse generator was ei-ther AE simulator (AE Associates) or ultrasonic pulser/receiver (Panametrics 5050PR or 5052PR). For transmitter and receiver, AE or ultrasonic sensors of various resonance frequency were used; 30 kHz (AET AC30L), 150 kHz (PAC R15), 175 kHz (AET AC175L), 375 kHz (AET AC375L), 500 kHz (PAC PICO), 750 kHz (AET AC750L), 1 MHz (Automation Ind., 1 MHz-0.5”), 2.25 MHz (Automation Ind., 2.25 MHz-0.5”), 5 MHz (Automation Ind., 5 MHz-0.25”), 10 MHz (Automation Ind., 1 MHz-0.25”). Most AE sensors were used in pair. Wave-forms, both input pulse and received and amplified signals, were recorded using a transient re-corder. Wavelet transform (WT) analysis was performed using AGU-Vallen WT program.
Sample rods used are of aluminum alloy (2024-T3) with diameter of 3.2 mm, 6.4 mm, 9.5
mm, 11.1 mm and 12.7 mm. Metric rods of 300-mm length were also used and a 10-mm rod had a tapered end (1.6 mm end diameter, reduced over 22 mm). Tubes of 6.4 mm, 9.5 mm and 12.7 mm were used and their diameter-to-wall-thickness (d/t) ratios ranged from 5 to 10. In most ex-periment, the rod/tube length was ~150 mm, but rods/tubes of shorter and longer length were also used. 3. Results and Discussion 3.1 Laser experiments
Figure 1 summarizes a set of results from laser experiments. YAG laser pulse imparts a fast rise-time, short impulse, containing a broad range of frequency. The spot size is ~1 mm in di-ameter. Laser excitation and detection require no contact.
When the rod diameter is large, we found a “thick-rod” behavior. Figure 1(a) and (b) show
the waveforms and WT of 10-mm rod (300 mm length). This is essentially the Green’s function of the rod waveguide. The left end corresponds to the laser excitation (at 20 µs). For 10-mm rod, the initial waves arrive with the rod velocity at high frequency above 800 kHz, followed by stronger packets at 2.8-3.3 mm/µs (arriving at 106 µs). The strong peaks have the peak frequency above 1 MHz. A long 300-kHz slow component starts at 145 µs (2.07 mm/µs) and peaks at ~290 µs (~1 mm/µs). This 300-kHz component corresponds to the L(0,1)-rod wave and its fre-quency is equivalent to the longitudinal waves resonating across the rod cross section. The same wave modes were found at proportionately higher frequencies in thinner rods. Lower frequency components below 225 kHz are absent. Reverberation continues beyond 10 ms. Initial 3.9-ms portion is shown in Fig. 1(b). In this figure, the digitization rate is lower and the first strong peak
244
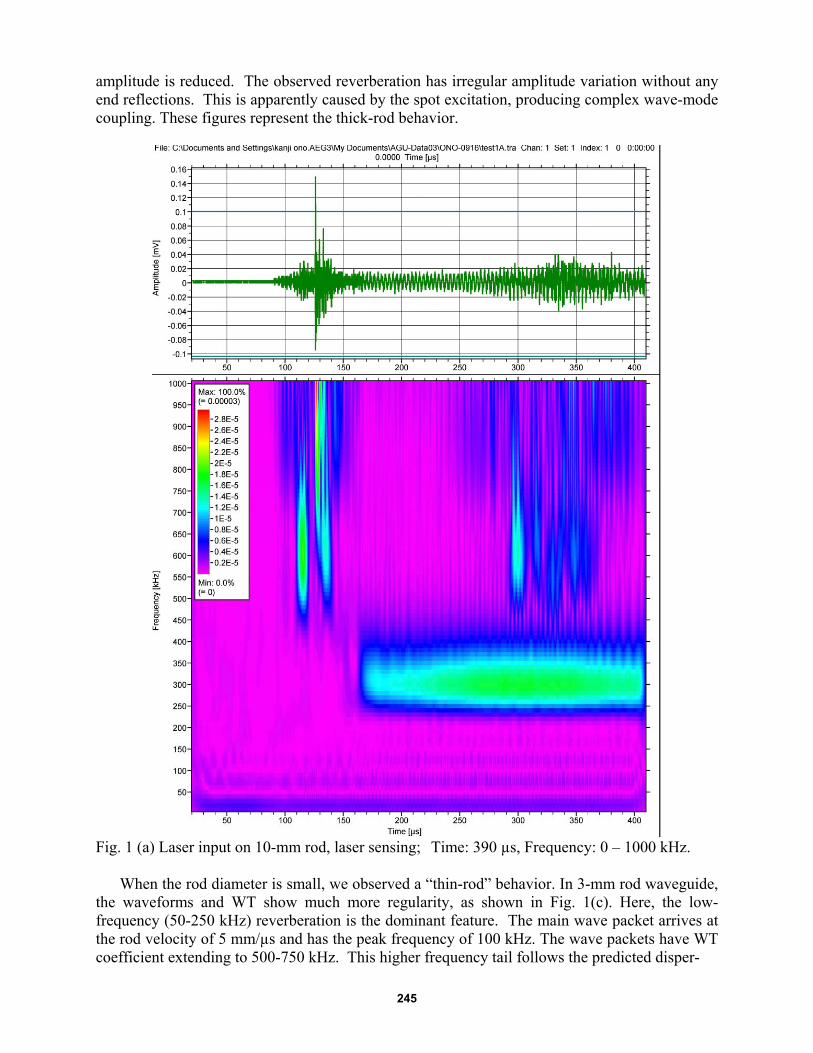
amplitude is reduced. The observed reverberation has irregular amplitude variation without any end reflections. This is apparently caused by the spot excitation, producing complex wave-mode coupling. These figures represent the thick-rod behavior.
Fig. 1 (a) Laser input on 10-mm rod, laser sensing; Time: 390 µs, Frequency: 0 – 1000 kHz.
When the rod diameter is small, we observed a “thin-rod” behavior. In 3-mm rod waveguide,
the waveforms and WT show much more regularity, as shown in Fig. 1(c). Here, the low-frequency (50-250 kHz) reverberation is the dominant feature. The main wave packet arrives at the rod velocity of 5 mm/µs and has the peak frequency of 100 kHz. The wave packets have WT coefficient extending to 500-750 kHz. This higher frequency tail follows the predicted disper-
245
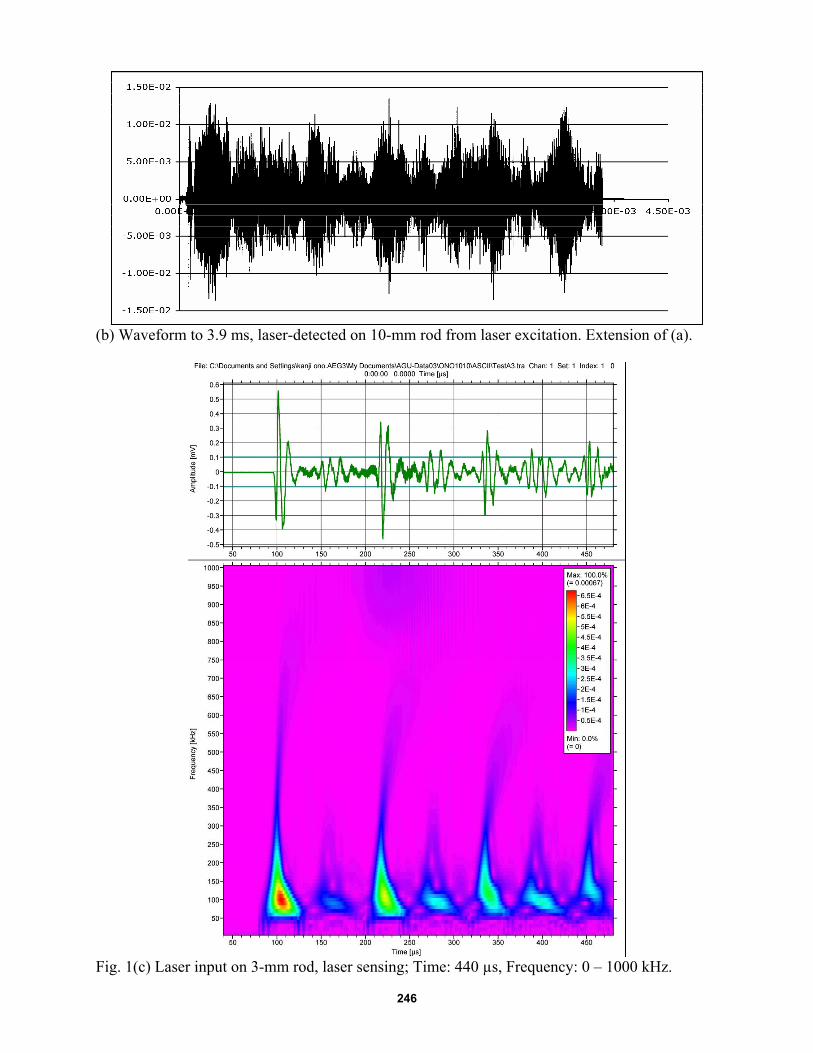
(b) Waveform to 3.9 ms, laser-detected on 10-mm rod from laser excitation. Extension of (a).
Fig. 1(c) Laser input on 3-mm rod, laser sensing; Time: 440 µs, Frequency: 0 – 1000 kHz.
246
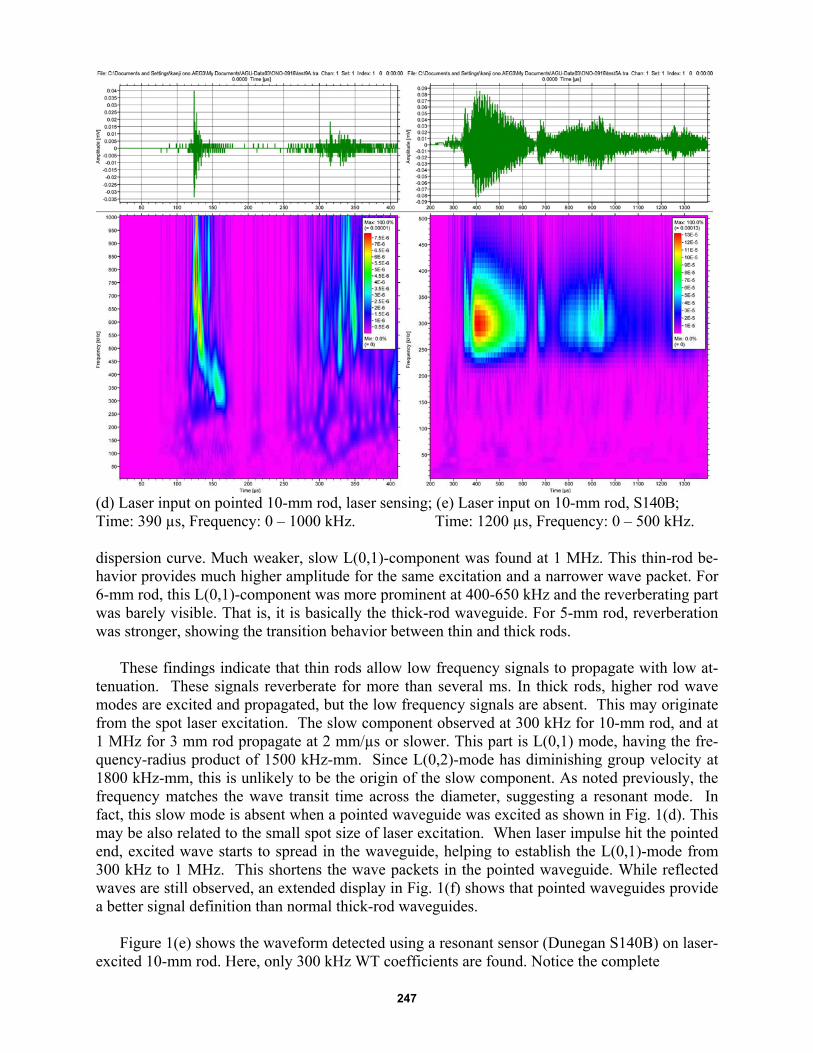
(d) Laser input on pointed 10-mm rod, laser sensing; (e) Laser input on 10-mm rod, S140B; Time: 390 µs, Frequency: 0 – 1000 kHz. Time: 1200 µs, Frequency: 0 – 500 kHz. dispersion curve. Much weaker, slow L(0,1)-component was found at 1 MHz. This thin-rod be-havior provides much higher amplitude for the same excitation and a narrower wave packet. For 6-mm rod, this L(0,1)-component was more prominent at 400-650 kHz and the reverberating part was barely visible. That is, it is basically the thick-rod waveguide. For 5-mm rod, reverberation was stronger, showing the transition behavior between thin and thick rods.
These findings indicate that thin rods allow low frequency signals to propagate with low at-tenuation. These signals reverberate for more than several ms. In thick rods, higher rod wave modes are excited and propagated, but the low frequency signals are absent. This may originate from the spot laser excitation. The slow component observed at 300 kHz for 10-mm rod, and at 1 MHz for 3 mm rod propagate at 2 mm/µs or slower. This part is L(0,1) mode, having the fre-quency-radius product of 1500 kHz-mm. Since L(0,2)-mode has diminishing group velocity at 1800 kHz-mm, this is unlikely to be the origin of the slow component. As noted previously, the frequency matches the wave transit time across the diameter, suggesting a resonant mode. In fact, this slow mode is absent when a pointed waveguide was excited as shown in Fig. 1(d). This may be also related to the small spot size of laser excitation. When laser impulse hit the pointed end, excited wave starts to spread in the waveguide, helping to establish the L(0,1)-mode from 300 kHz to 1 MHz. This shortens the wave packets in the pointed waveguide. While reflected waves are still observed, an extended display in Fig. 1(f) shows that pointed waveguides provide a better signal definition than normal thick-rod waveguides.
Figure 1(e) shows the waveform detected using a resonant sensor (Dunegan S140B) on laser-
excited 10-mm rod. Here, only 300 kHz WT coefficients are found. Notice the complete
247
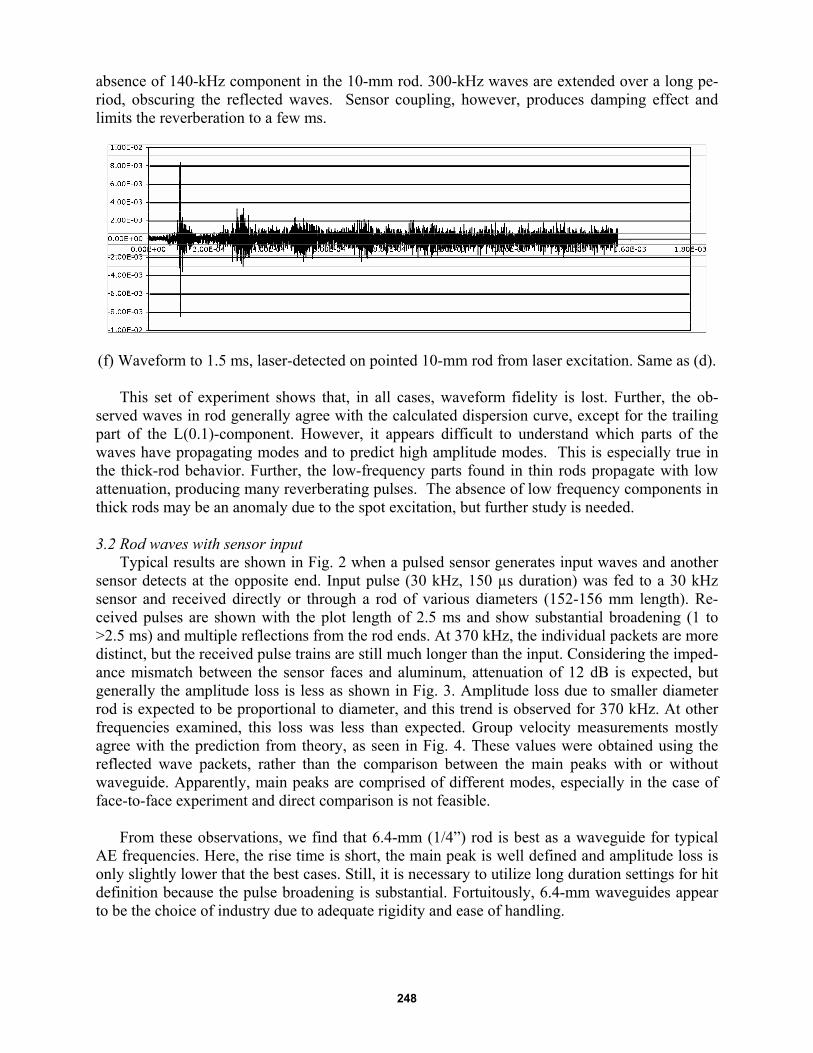
absence of 140-kHz component in the 10-mm rod. 300-kHz waves are extended over a long pe-riod, obscuring the reflected waves. Sensor coupling, however, produces damping effect and limits the reverberation to a few ms.
(f) Waveform to 1.5 ms, laser-detected on pointed 10-mm rod from laser excitation. Same as (d).
This set of experiment shows that, in all cases, waveform fidelity is lost. Further, the ob-served waves in rod generally agree with the calculated dispersion curve, except for the trailing part of the L(0.1)-component. However, it appears difficult to understand which parts of the waves have propagating modes and to predict high amplitude modes. This is especially true in the thick-rod behavior. Further, the low-frequency parts found in thin rods propagate with low attenuation, producing many reverberating pulses. The absence of low frequency components in thick rods may be an anomaly due to the spot excitation, but further study is needed. 3.2 Rod waves with sensor input
Typical results are shown in Fig. 2 when a pulsed sensor generates input waves and another sensor detects at the opposite end. Input pulse (30 kHz, 150 µs duration) was fed to a 30 kHz sensor and received directly or through a rod of various diameters (152-156 mm length). Re-ceived pulses are shown with the plot length of 2.5 ms and show substantial broadening (1 to >2.5 ms) and multiple reflections from the rod ends. At 370 kHz, the individual packets are more distinct, but the received pulse trains are still much longer than the input. Considering the imped-ance mismatch between the sensor faces and aluminum, attenuation of 12 dB is expected, but generally the amplitude loss is less as shown in Fig. 3. Amplitude loss due to smaller diameter rod is expected to be proportional to diameter, and this trend is observed for 370 kHz. At other frequencies examined, this loss was less than expected. Group velocity measurements mostly agree with the prediction from theory, as seen in Fig. 4. These values were obtained using the reflected wave packets, rather than the comparison between the main peaks with or without waveguide. Apparently, main peaks are comprised of different modes, especially in the case of face-to-face experiment and direct comparison is not feasible.
From these observations, we find that 6.4-mm (1/4”) rod is best as a waveguide for typical
AE frequencies. Here, the rise time is short, the main peak is well defined and amplitude loss is only slightly lower that the best cases. Still, it is necessary to utilize long duration settings for hit definition because the pulse broadening is substantial. Fortuitously, 6.4-mm waveguides appear to be the choice of industry due to adequate rigidity and ease of handling.
248
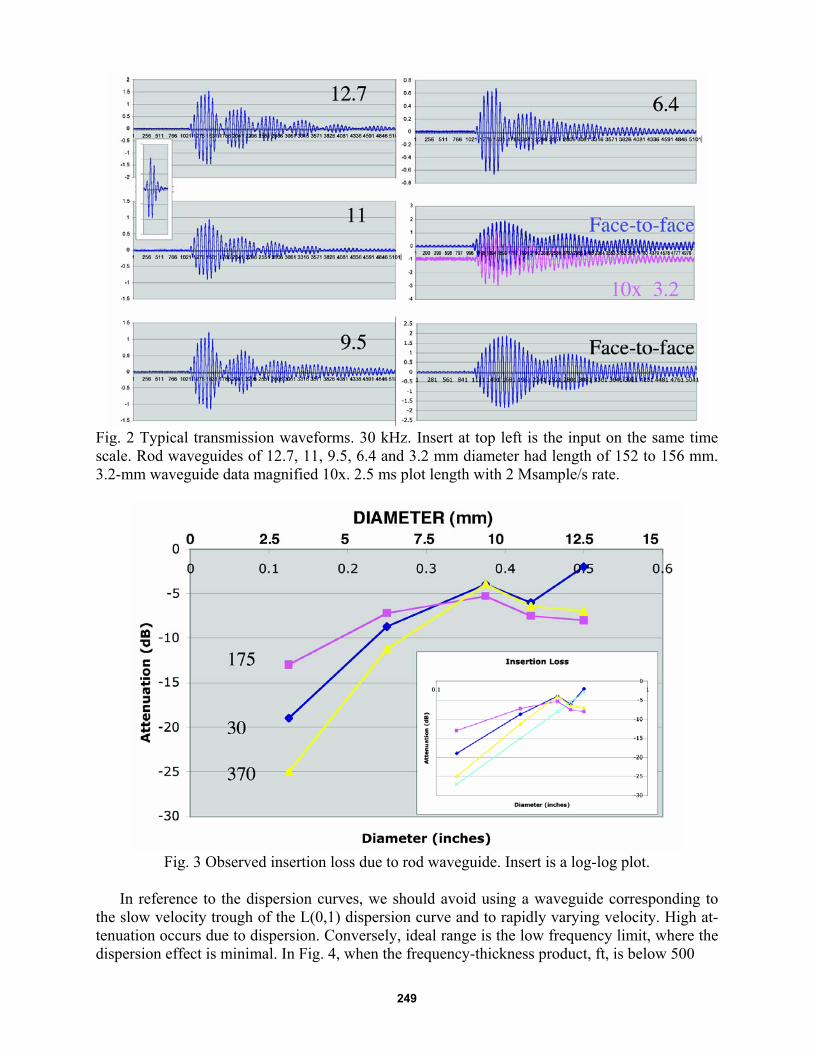
Fig. 2 Typical transmission waveforms. 30 kHz. Insert at top left is the input on the same time scale. Rod waveguides of 12.7, 11, 9.5, 6.4 and 3.2 mm diameter had length of 152 to 156 mm. 3.2-mm waveguide data magnified 10x. 2.5 ms plot length with 2 Msample/s rate.
Fig. 3 Observed insertion loss due to rod waveguide. Insert is a log-log plot.
In reference to the dispersion curves, we should avoid using a waveguide corresponding to
the slow velocity trough of the L(0,1) dispersion curve and to rapidly varying velocity. High at-tenuation occurs due to dispersion. Conversely, ideal range is the low frequency limit, where the dispersion effect is minimal. In Fig. 4, when the frequency-thickness product, ft, is below 500
249
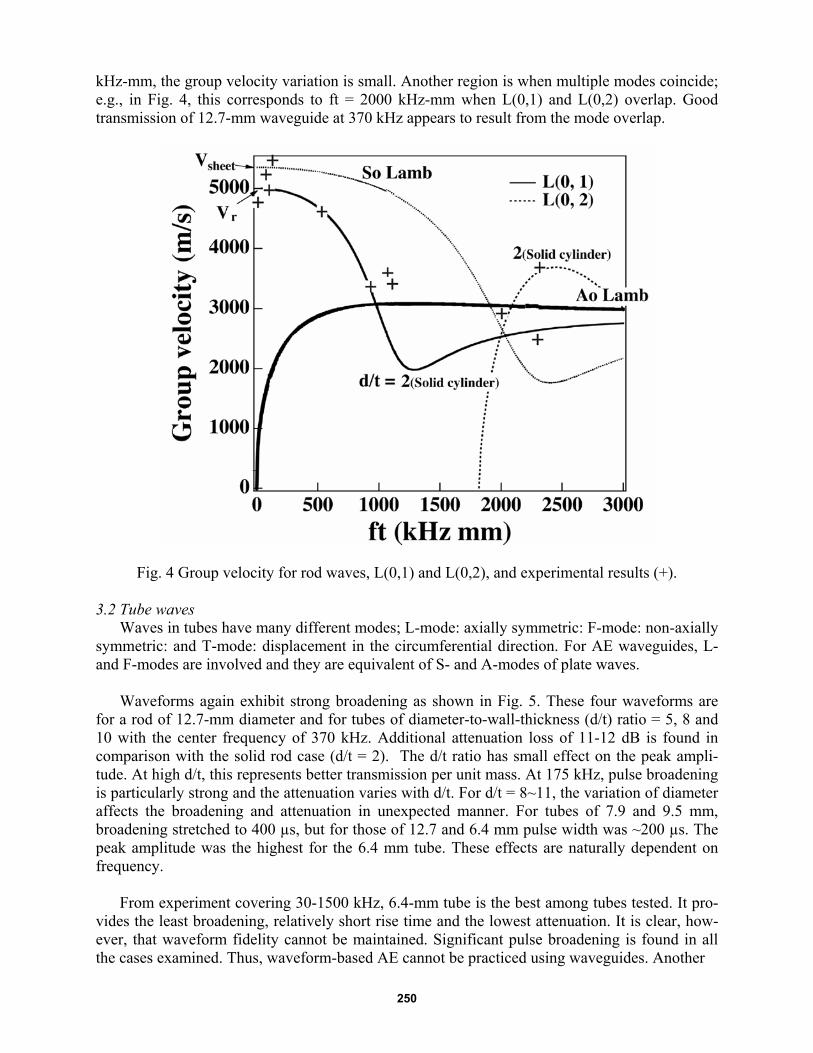
kHz-mm, the group velocity variation is small. Another region is when multiple modes coincide; e.g., in Fig. 4, this corresponds to ft = 2000 kHz-mm when L(0,1) and L(0,2) overlap. Good transmission of 12.7-mm waveguide at 370 kHz appears to result from the mode overlap.
Fig. 4 Group velocity for rod waves, L(0,1) and L(0,2), and experimental results (+). 3.2 Tube waves
Waves in tubes have many different modes; L-mode: axially symmetric: F-mode: non-axially symmetric: and T-mode: displacement in the circumferential direction. For AE waveguides, L- and F-modes are involved and they are equivalent of S- and A-modes of plate waves.
Waveforms again exhibit strong broadening as shown in Fig. 5. These four waveforms are
for a rod of 12.7-mm diameter and for tubes of diameter-to-wall-thickness (d/t) ratio = 5, 8 and 10 with the center frequency of 370 kHz. Additional attenuation loss of 11-12 dB is found in comparison with the solid rod case (d/t = 2). The d/t ratio has small effect on the peak ampli-tude. At high d/t, this represents better transmission per unit mass. At 175 kHz, pulse broadening is particularly strong and the attenuation varies with d/t. For d/t = 8~11, the variation of diameter affects the broadening and attenuation in unexpected manner. For tubes of 7.9 and 9.5 mm, broadening stretched to 400 µs, but for those of 12.7 and 6.4 mm pulse width was ~200 µs. The peak amplitude was the highest for the 6.4 mm tube. These effects are naturally dependent on frequency.
From experiment covering 30-1500 kHz, 6.4-mm tube is the best among tubes tested. It pro-vides the least broadening, relatively short rise time and the lowest attenuation. It is clear, how-ever, that waveform fidelity cannot be maintained. Significant pulse broadening is found in all the cases examined. Thus, waveform-based AE cannot be practiced using waveguides. Another
250

Fig. 5 Waveforms from transmission experiment with tubes of different diameter at 370 kHz. d/t-ratios ranged from 7.8 to 11.2. Note high amplitude on 6.4 mm data. Display range: 422 µs. rule of waveguide usage is to avoid the frequency-thickness ranges that result in a dip on the ve-locity vs. ft curves. Such a region produces strong dispersion effect and results in high attenua-tion and pulse broadening as in the case of rod waveguide. This can be found from calculated dispersion curves, but trials may be needed when the calculation is unavailable. Fig. 6 Group velocity data; theory (for d/t = 3, 5 and 10). Experiment with d/t = 7.8 (solid circle) and d/t = 8.6 (circle with +).
251
As for the dispersion behavior, experimental velocity generally agrees well with calculation. This is illustrated in Fig. 6, which shows typical data for measured group velocity for tubes with diameter-to-wall-thickness (d/t) ratio of 8.6 and 7.8. Again, it is difficult to predict the range of frequency or mode that provide low attenuation. 4. Conclusions 1. Waveguides are useful in expanding the condition of AE sensor usage. However, significant pulse broadening occurs. One must avoid using waveguides for achieving waveform fidelity. In fact, some common sample shapes must be reevaluated for use in waveform-based AE testing. 2. In using rod waveguides, pick low “ft” region with Vrod or when L(0,1) and L(0,2) curves in-tersect and avoid “Velocity Trough”, where propagation velocity dips sharply. Tubes add addi-tional attenuation (of up to 12 dB in the conditions evaluated). 3. As practical AE waveguides, commonly used 6.4-mm rods are apparently the best choice and a pointed end improves pulse definition. 4. Consider pulse broadening in AE setup so that individual events are counted appropriately. For detecting surface or plate waves, other design guide is needed as attachment or coupling de-sign influences the transfer of waves onto the waveguide. References 1. S. Hsu and K. Ono, Proc. 5-th International Acoustic Emission Symp. 1980, Japanese Society NDI, Tokyo, pp. 294-303. 2. J. Rodgers and R. Tilley, Proc. EPRI Plant Maintenance Conference, 1999, EPRI, pp. 6D-1 to 6D-13. 3. C. Allevato, presented at 46-th Meeting of AEWG, Portland, Oregon, 2003. 4. K. Ono, H. Nishino and H. Cho, Proc. 14-th AE Conference, JSNDI, 2003, pp. 29-38. 5. M. Redwood, Mechanical Waveguides, 1960, Pergamon Press, New York. 6. K.F. Graff: Wave Motion in Elastic Solids, 1975, Dover, New York. (Ch. 8) 7. J.L. Rose: Ultrasonic Waves in Solid Media, 1999, Cambridge University Press, Cambridge. 8. D.C. Gazis, J. Acoust. Soc. Am., 31, 1959, 568. 9. H. Nishino, S. Takashina, F. Uchida, M. Takemoto, and K. Ono, Japanese J. Applied Physics, Part 1, 40 (1), 2001, 364-70.
252