Embed Size (px)
Citation preview
�
Manuscript received by the Editor February 11, 2014; revised manuscript received March 2, 2014. *This work was sponsored by the NSFC (41104066), �73 Program of China (No. 2014CB23�006), NSTMP of China (Nos. 2011ZX05004-003 and 2011ZX0502�-003), and 12th 5-Year Basic Research Program of CNPC (No. 2011A-3601).1. Research Institute of Petroleum Exploration and Development, PetroChina, Beijing 100083, China.2. Istituto Nazionale di Oceanografia edi Geofisica Sperimentale (OGS), Borgo Grotta Gigante 42c, Sgonico, Trieste 34010, Italy.3. Amu Darya Petroleum Company Ltd., CNPC, Beijing 102200, China.♦Corresponding Author: Ba Jing (Email: [email protected])© 2014 The Editorial Department of APPLIED GEOPHYSICS. All rights reserved.
Rock physics modeling of heterogeneous carbonate reservoirs: porosity estimation and hydrocarbon detection*
APPLIED GEOPHYSICS, Vol.11, No.1 (March 2014), P. 9-22, 13 Figures.DOI: 10.1007/s11770-014-0413-9
Yu Hao1, Ba Jing1♦, Carcione Jose2, Li Jin-Song1, Tang Gang1, Zhang Xing-Yang1, He Xin-Zhen3, and Ouyang Hua3
Abstract: In heterogeneous natural gas reservoirs, gas is generally present as small patch-like pockets embedded in the water-saturated host matrix. This type of heterogeneity, also called “patchy saturation”, causes significant seismic velocity dispersion and attenuation. To establish the relation between seismic response and type of fluids, we designed a rock physics model for carbonates. First, we performed CT scanning and analysis of the fluid distribution in the partially saturated rocks. Then, we predicted the quantitative relation between the wave response at different frequency ranges and the basic lithological properties and pore fluids. A rock physics template was constructed based on thin section analysis of pore structures and seismic inversion. This approach was applied to the limestone gas reservoirs of the right bank block of the Amu Darya River. Based on poststack wave impedance and prestack elastic parameter inversions, the seismic data were used to estimate rock porosity and gas saturation. The model results were in good agreement with the production regime of the wells.Keywords: Rock physics modeling, Biot–Rayleigh theory, heterogeneity, porosity, saturation, velocity dispersion, gas reservoir detection
Introduction
In recent years, because of the requirements for climate-change mitigation policies and low-carbon economy, unconventional oil and gas resources, espe-cially from heterogeneous natural gas reservoirs, are of particular interest to oil companies worldwide (Roehl and Choquette, 1�85). The use of natural gas resources is an effective way to relieve the severe pressure on oil demand as well as to guarantee future energy sources.
Natural gas is mainly found in reservoirs with strong
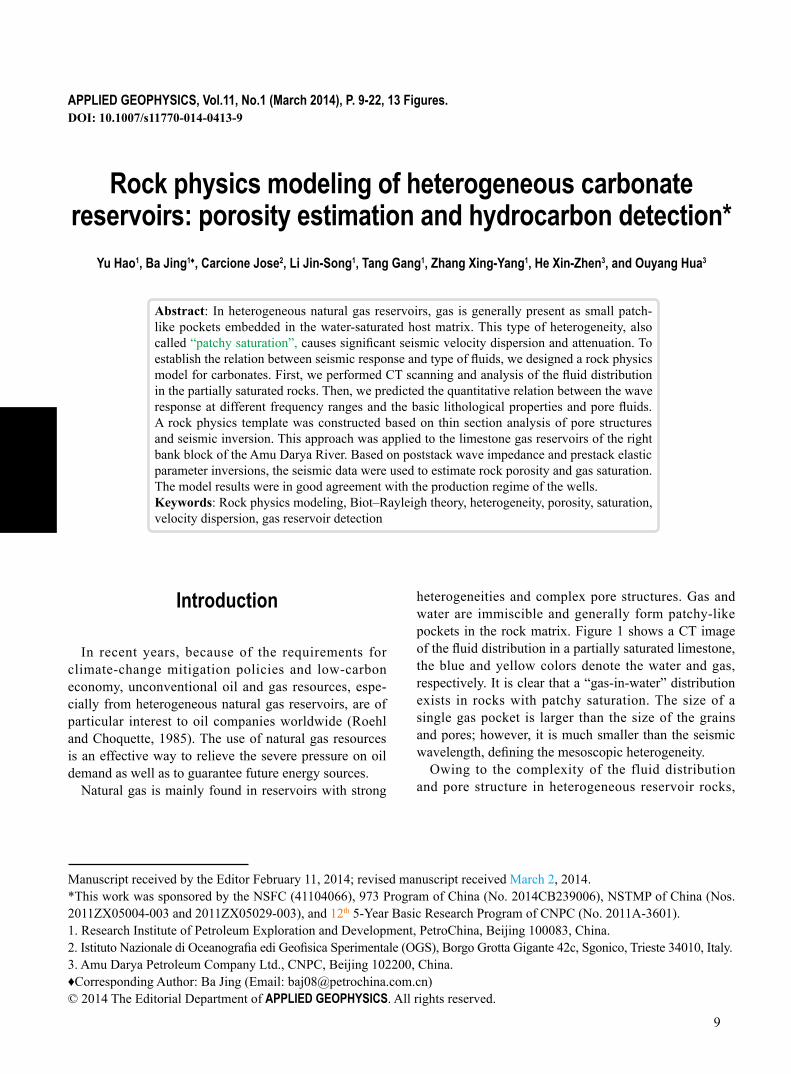
heterogeneities and complex pore structures. Gas and water are immiscible and generally form patchy-like pockets in the rock matrix. Figure 1 shows a CT image of the fluid distribution in a partially saturated limestone, the blue and yellow colors denote the water and gas, respectively. It is clear that a “gas-in-water” distribution exists in rocks with patchy saturation. The size of a single gas pocket is larger than the size of the grains and pores; however, it is much smaller than the seismic wavelength, defining the mesoscopic heterogeneity.
Owing to the complexity of the fluid distribution and pore structure in heterogeneous reservoir rocks,
10
Porosity estimation and hydrocarbon detection
250 μm
water and gas are difficult to discriminate. To detect gas using seismic data, the correct wave response of partially saturated rocks should be first investigated and ascertained. Thus, a precise prediction of gas presence in complex reservoir environments can be possible.
ory (Dvorkin and Nur, 1993). Besides the effect of fluid mixtures on wave propagation, Nie et al. (2012) also included the viscoelasticity related to the solid skeleton. However, these studies consider that water and gas are mixed as equivalent fluids in the pores, i.e., Gassmann’s theory, and the mesoscopic heterogeneity is ignored. Liu et al. (200�, 2010) studied seismic wave propagation considering spherical mesoscopic patches and alternating gas- and water-saturated plane layers by using poroelas-ticity theory. The methods are unsuitable for actual engi-neering conditions because of the difficulty in modeling and reproducing the wave features. The mesoscopic loss theory has been widely used by one of us (e.g., Carcione et al., 2003; Carcione et al., 2013) and reviews can be found in Carcione (2007), Carcione et al. (2010), and Müller et al. (2010).
Pride et al. (2004) introduced the “double porosity” theory to analyze the seismic response of patchy saturated media. In this theory, the two types of pores are interpreted as gas- and water-saturated. Ba et al. (2008a, 2008b) and Ba (2010) further studied seismic waves in double porosity media, showing that waves in this type of media, for instance, tight sandstones from southwest China, may exhibit significant dispersion in the seismic frequency band. For the purpose of deriving a set of suitable wave propagation equations, which are based on physically measurable parameters and concise expressions to satisfy the needs of practical applications, Ba et al. (2010, 2011) derived the Biot–Rayleigh equations (BR equations). These equations are based on the classical Biot theory and are appropriate for describing wave propagation in partially saturated rocks with mesoscopic heterogeneities. Ba et al. (2012) successfully applied the BR theory to gas reservoir detection. Moreover, by comparing the model results to experimental data for the Casino sandstone in South Australia, Sun et al. (2012) showed the validity of the BR equations to model waves in sandstone reservoirs.
Presently, there is no accepted effective wave propa-gation theory to characterize the wave responses in natu-ral inhomogeneous partially saturated reservoirs. One of the main issues is the difficulty to adapt theory to solve practical problems. Ba et al. (2013a, 2013b) attempted to achieve this by using the BR equations to detect hydro-carbons in limestone reservoirs by means of rock physics templates. In the present work, CT scanning is used to analyze the patchy gas features. Moreover, the reservoir pore structures around each single well are investigated by thin section analysis and seismic data calibration; therefore, the lateral heterogeneities in the carbonates of the target area are considered and a well-calibrated
Fig.1 CT scan of the fluid distribution in limestone (porosity is 6.86% and air saturation is 69.2%).
Blue and yellow colors denote water and air, respectively.
One classical approach is the Biot–Gassmann theory, which was introduced by Gassmann (1951) and Biot (1�56a, 1�56b) when studying wave propagation in fluid-saturated porous media. However, the Biot–Gassmann theory is not suitable for real complex media, owing to the assumption of a single (effective) fluid saturating the pore space. White (1�75) introduced a new theory by considering porous media saturated with water and gas, where gas is present as spherical pockets or patches periodically distributed in the water-saturated host matrix. Subsequently, Dutta and Seriff (1�7�a) reformulated White’s theory so that the predicted P-wave velocity at low frequencies coincides with that predicted by the classical Biot theory (Dutta and Odé, 1�7�b). Johnson et al. (1�87) introduced the branching function approach to analyze the seismic wave dispersion and attenuation at low and high frequencies, making an approximation at intermediate frequencies. His theory is not restricted to spherical patches. Over the past decade, wave propagation has been simulated in 1D and 3D stochastic patchy-saturated media and compared with measured data in carbonates and sandstones (Müller et al., 2010; Gurevich et al., 1997; Toms et al., 2006). They concluded that the simulation provides reasonable characterization and prediction of the wave response in rocks.
Nie et al. (2004) considered the effect of partial satu-ration within the framework of the so-called BISQ the-
11
Yu et al.
seismic inversion of the rock physics parameters is per-formed.
The following methodology is developed to estimate the porosity and hydrocarbon saturation in heteroge-neous limestone gas reservoirs of the right bank block of the Amu Darya River. First, we perform CT scans on partially saturated rocks to analyze the fluid distri-bution. Second, we choose the rock physics modeling method for application to the actual reservoirs based on fluid substitution. The rock physics templates are calibrated using seismic data. Finally, rock porosity and fluid saturation are estimated by combining rock physics data and seismic inversion results. The proposed methodology is validated by comparing the estimates with well production data.
Gas pockets in partially saturated limestone: CT scan results
The Metajan area is located on the right bank block of Amu Darya River and is characterized by a nearly East–West trending anticline. The target stratum is a Callovian–Oxfordian limestone and the reservoir is developed in an open platform with sedimentary facies that include intraplatform bioclastic grain banks, interbank sea, and intraplatform reefs.
The limestone reservoirs of the XVm layer is of medi-um to high porosity and average permeability, consisting of intraclastic, pelletal, and oolitic limestones. The high-porosity limestone mainly consists of calcite and clay. Locally, there are small amounts of dolomite and gyp-sum. Generally, sparry calcite cement is observed in the pores. The porosity and permeability of the reservoirs varies from 0.18 % to 24.1 % and from 0.0006 mD to 38� mD, respectively, with average values of 7.0� % and
2.18 mD. The model assumes that the mineral mixture is a composite of calcite and clay, and the lower porosity limit of the high-quality reservoirs is set at 8 %.
To investigate the pore structure characteristics and fluid distribution in the Metajan carbonate samples, CT scans are performed on a sample partially saturated with water. The advantage of CT scanning is that it obtains a 3D image of the pore structure and fluid distribution without damaging the pores.
The limestone sample was collected from a well in the Metajan district. It is cylinder of 12 mm in diameter and the size of sample is such that the immiscible fluids are discernible. The CT scans were performed with a “NanoTom CT” from GE and a resolution of 1 μm. The sample was immersed in water for 15 h prior to scanning. The voltage was 85 kV, the current was 85 mA, and the resolution was 5.4 μm. It took 75 min to obtain 1500 projected 2D images and then 3D reconstruction was performed. Pores, water, and air are recognized by using a mathematical morphology approach and the watershed algorithm. The results are shown in Figure 1. The immiscible air and water are clearly distributed in patches of different sizes, and the air pockets are mostly surrounded by water. Air tends to occupy the larger pores, whereas most of the small pores are saturated with water.
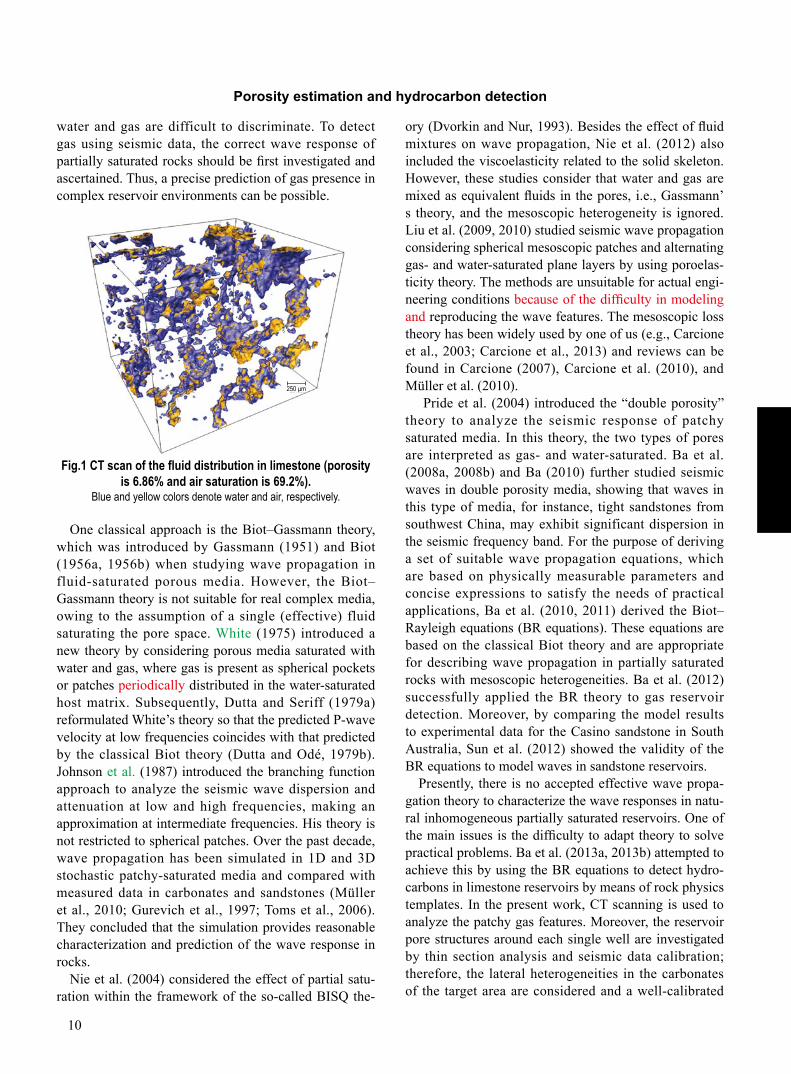
Figures 2 and 3 show that there are more water pockets in the range of 10−7–10−3 mm3, whereas air is present in the mesoscopic range of 10−3–10−1 mm3 with a volume exceeding the average grain (pore) size. The largest air pocket has a volume of 0.288 mm3 with a spherical radius greater than 0.41 mm, if we consider the volume of the adjacent mineral grains. Because the average porosity of the Metajan gas reservoirs is larger than that of the scanned sample (0.0686), it is inferred that the in situ size of the gas patches is larger, i.e., in the mm–cm range. Moreover, the comparison of Figures 2b
(a) Water pockets. (b) Air pockets.Fig.2 Histograms of the number of fluid pockets versus pocket size.
120
100
Wate
r poc
ket n
umbe
rs
Water pocket volume (log (mm3))
80
60
40
20
0-7 -6 -5 -4 -3 -2 -1 0
70
60
Wate
r poc
ket n
umbe
rs
Water pocket volume (log (mm3))
50
40
30
20
10
0-7 -6 -5 -4 -3 -2 -1 0
12
Porosity estimation and hydrocarbon detection
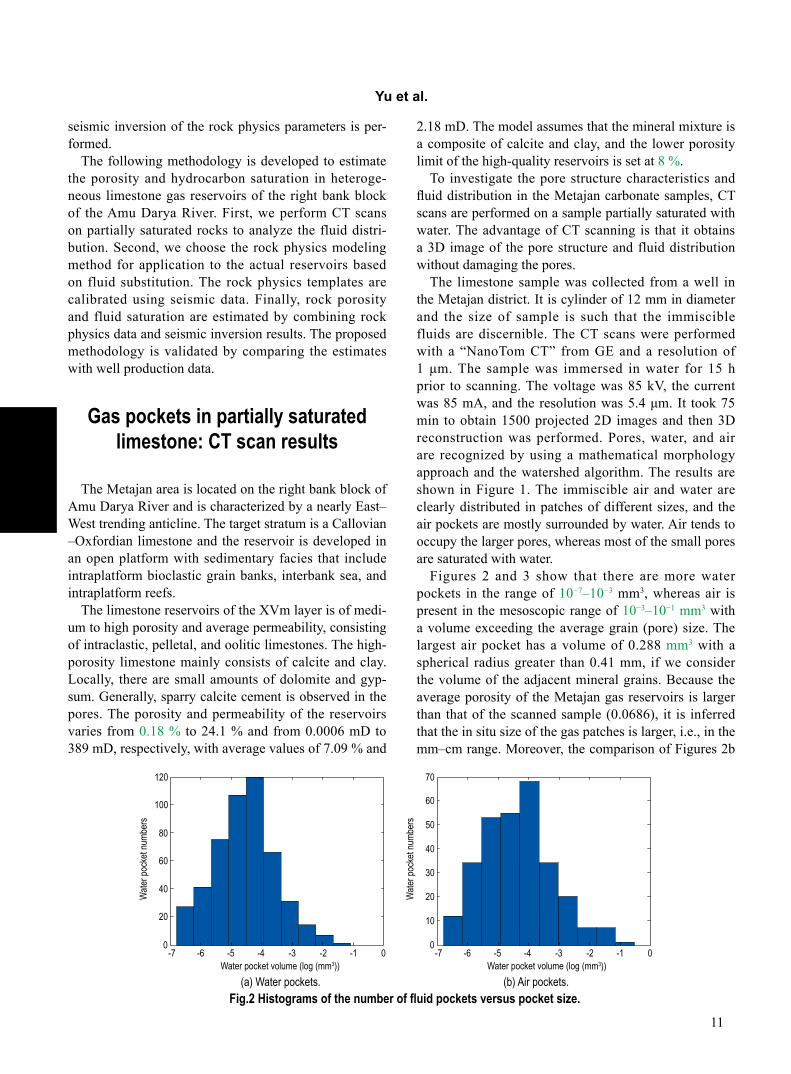
and 3 shows that although less air pockets are observed as the threshold of the pocket size increases, the volume ratio of the air pockets increases sharply, which means that most of the gas is contained in the mesoscopic patches.
Fig.3 Histogram of the air volume versus air pocket size.The volume of air pockets are counted in different ranges of sizes and then divided by the total pore volume.
Biot–Rayleigh theory for wave propagation in a patchy saturated
medium
Biot (1�56a, 1�56b) assumed that the pores are of the same type. On the other hand, Berryman and Wang (1��5, 2000) derived the wave equations for double porosity media; however, they did not analyze the wave-induced relaxation effect between the two kinds of pores. Consequently, the double-porosity equations can be regarded as the superposition of two sets of single-porosity Biot equations. The predicted P-wave velocity dispersion and attenuation at seismic frequencies remain weak as in classical Biot theory, which does not agree with the actual measurements. The same problem exists in the three-phase (solid, fluid, and gas) wave theory developed by Santos et al. (1��0a, 1��0b). Zhao et al. (2010) introduced viscoelasticity into the latter theory, attempting to improve its performance in predicting P-wave attenuation.
Pride et al. (2004) extended the double-porosity wave equations by introducing local fluid flow oscillations. Their approach is similar to the branching function method presented by Johnson (1987, 2001). More recently, Ba et al. (2008a, 2008b) and Ba (2010) proposed an extension of the Pride et al. equation. Nevertheless, there are several drawbacks in the double-
porosity theory, such as the complexity of the equations, the undetermined parameters, and the physical behavior at intermediate frequencies. Ba et al. (2010, 2011) modeled the fluid oscillations and the relaxation process owing to wave propagation, assuming spherical heterogeneities. The oscillations of the local fluid flow were described by means of the generalized Rayleigh theory (Rayleigh, 1�17) combined with the equations for fluid-saturated double-porosity medium. The Biot–Rayleigh (BR) theory describes the local fluid flow in a double-porosity medium saturated with only one type of fluid. Fluid flow-induced velocity dispersion and wave attenuation are then predicted.
Ba et al. (2012, 2013a) and Sun et al. (2012, 2013) extended the BR theory to single-porosity medium saturated with two immiscible fluids, typically, gas and water, where the gas pockets are generally treated as inclusions in the water-saturated host medium. The BR equations are
2 (1) (2)1 2 2 1
(1) (2) (1) (2)11 12 13 1 2
( ) ( ) ( )
( ) ( ),
N A N e Q Q
b b
u
u U U u U u U (1a)
(1) (1) (1)
1 1 2 12 22 1( ) ( ),Q e R bu U u U (1b)
(2) (2) (2)
2 2 1 13 33 2( ) ( ),Q e R bu U u U (1c)
(1) (2)2 1 1 2 1 2 2 1
2 22 21 2 20 1 1 2 20
1 0 010
( ( )) ( ( ))
1 1 ,3 3f
Q e R Q e R
R R (1d)
where u = [u1,u2,u3], U(1) = [U1(1),U2
(1),U3(1)], and U(2) =
[U1(2),U2
(2),U3(2)] are the spatial displacement vectors of
three phases (solid, fluid 1, and fluid 2), respectively, and subscripts 1, 2, and 3 denote the three different directions in vector space. The quantity ζ is the fluid deformation increment of the local fluid flow, induced by compressional waves. eij, ξij
(1), and ξij(2) are expressed as
1 ( ),2
jiij
j i
uuex x
(1)(1)(1) 1 ( ) ,
2ji
ij ijj i
UUx x
(2)(2)(2) 1 ( ) ,
2ji
ij ijj i
UUx x
0.35
0.3
Volum
e of a
ir poc
kets/
Total
pore
volum
e
Air pocket volume (log (mm3))
0.25
0.2
0.15
0.05
0.1
0-7 -6 -5 -4 -3 -2 -1 0
13
Yu et al.
where x1, x2, and x3 are the spatial coordinates, 1 and 2 are the porosities of the two regions saturated with
different fluids. The total porosity is = 1 + 2, 10 and 20 are the local porosities in the two regions, and for the
case of a single skeleton saturated with two fluids 10 = 20 = . Let 1 correspond to the water-saturated pores
(the fluid in the host medium) and 2 to the gas-saturated pores (the fluid in the inclusions). Then, 1/ denotes the water saturation and 2/ the gas saturation. Moreover, ρf 1 and η1 are the density and viscosity of the fluid in the host medium and ρf 2 and η2 are the same quantities for the inclusions. The quantity R0 is the radius of the gas pocket and κ is the rock permeability.
Ba et al. (2012) and Sun et al. (2013) verified the applicability of equation (1) in describing the wave propagation in partially saturated rocks. The elastic parameters A, N, Q1, R1, Q2, and R2, the densities ρ11, ρ12, ρ13, ρ22, and ρ33, and the dissipation coefficients b1 and b0 are presented and related to the physical properties of the minerals, matrix, fluids, and pore structure (see Appendix A).
Rock physics modeling
1. Dry-rock moduliGenerally, the construction of a rock physics template
for natural reservoirs is a three-step process. First, the minerals and their proportions are considered to calculate the elastic parameters and densities of the solid part (mineral mixture). Second, by using empirical or theoretical formulas, the elastic parameters and density of the dry-rock matrix are estimated by taking into account the mineral composition, the pore structure, and the degree of consolidation of the rock. Then, the effect of the pore fluids is modeled in the fluid substitution.
The approaches to obtain the dry-rock moduli are
mainly based on the Voigt–Reuss–Hill average, the Hashin–Shtrikman–Hill average, the time average equation, and self-consistent theories. We use the Voigt–Reuss–Hill average
1
1
1 1 ,2
N
g i i Ni i
i i
M f MfM
(2)
where Mg is the elastic modulus of the mineral mixture, fi and Mi are the volume ratio and elastic modulus of the ith mineral, and N is the number of minerals. For the Metajan limestone, only calcite (> �5 %) and clay (< 5 %) are considered. The properties of calcite are bulk modu-lus 76.8 GPa, shear modulus 32 GPa, and density 2.71 g/cm3. The properties of clay are bulk modulus 25 GPa, shear modulus 9 GPa, and density 2.55 g/cm3 (Mavko et al., 200�).
The bulk modulus Kb of the dry rock is an essential input parameter for fluid substitution. The empirical formula of Pride et al. (2004) for sandstones is used here to obtain the dry-rock moduli of the limestone
(1 )
,1
sb
KKc
(3a)
(1 ),
1s
b c (3b)
where μb is the shear modulus of the dry skeleton, and Ks and μs are the bulk and shear moduli of the mineral mixture. The empirical parameters c and c' are related to the degree of consolidation or cementation. Pride et al. (2004) suggested that c is 1.5–20 for sandstones, whereas c/c' is 1.5–3. We assume c = 10 and c' = 7 for the Metajan limestone.
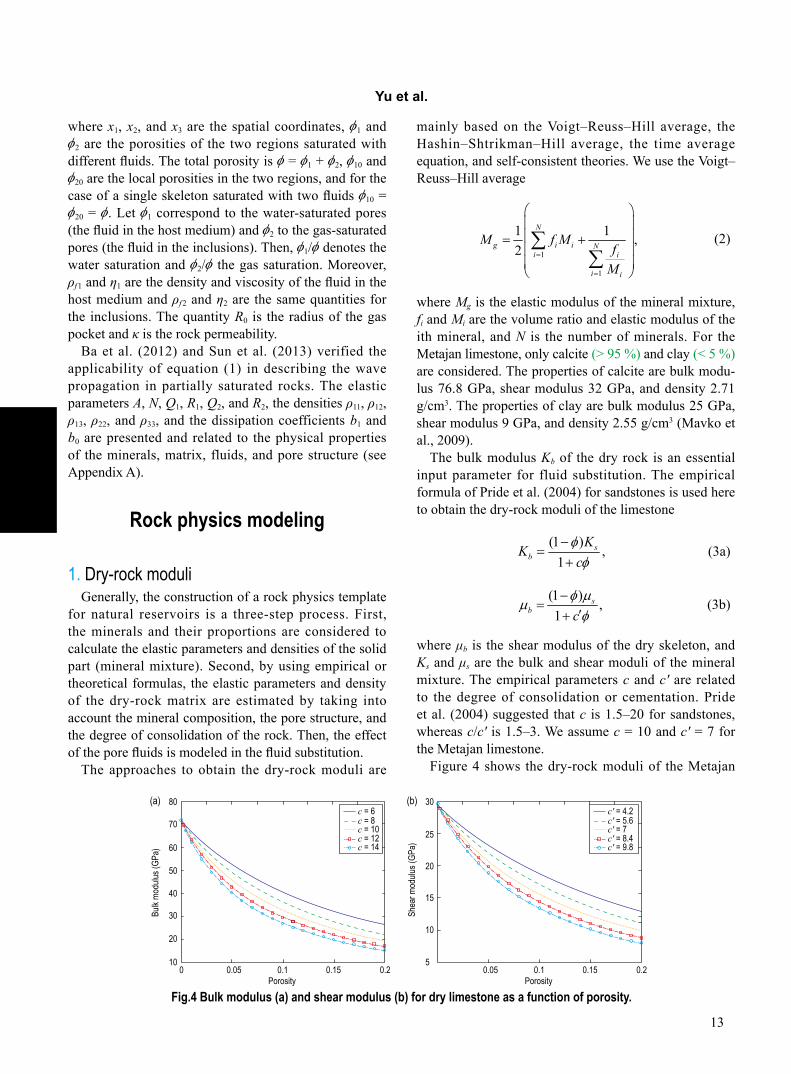
Figure 4 shows the dry-rock moduli of the Metajan
Fig.4 Bulk modulus (a) and shear modulus (b) for dry limestone as a function of porosity.
80(a) (b)
70
Bulk
modu
lus (G
Pa)
Porosity
60
50
40
20
30
100 0.05 0.1 0.15 0.2
c = 6c = 8c = 10c = 12c = 14
30
Shea
r mod
ulus (
GPa)
Porosity
25
20
15
10
50.05 0.1 0.15 0.2
c' = 4.2c' = 5.6c' = 7c' = 8.4c' = 9.8
14
Porosity estimation and hydrocarbon detection
limestone as a function of porosity. As expected, the moduli decrease with increasing porosity. It can be shown that they also decrease with increasing c and c'. Generally, the deviations of real data from theoretical curves are larger for carbonates than sandstone.
2. Fluid substitution using the BR theoryFluid substitution based on the Gassmann equations
neglects the effect of wave dispersion and attenuation in partially saturated rocks; therefore, the P-wave velocities are frequency-independent (Xu and White, 1��5). BR theory can be applied to fluid substitution to build frequency-dependent rock physics models. Because the effect of velocity dispersion is considered, fluid substitution using patchy saturation theory has the potential to relate wave responses at different frequency bands. As shown by Sams et al. (1��7), the dispersion effect can be extremely significant in reservoir rocks.
By substituting the plane wave solutions into equa-tion (1), the velocities and attenuation coefficients of the three compressional waves can be computed (see Appen-
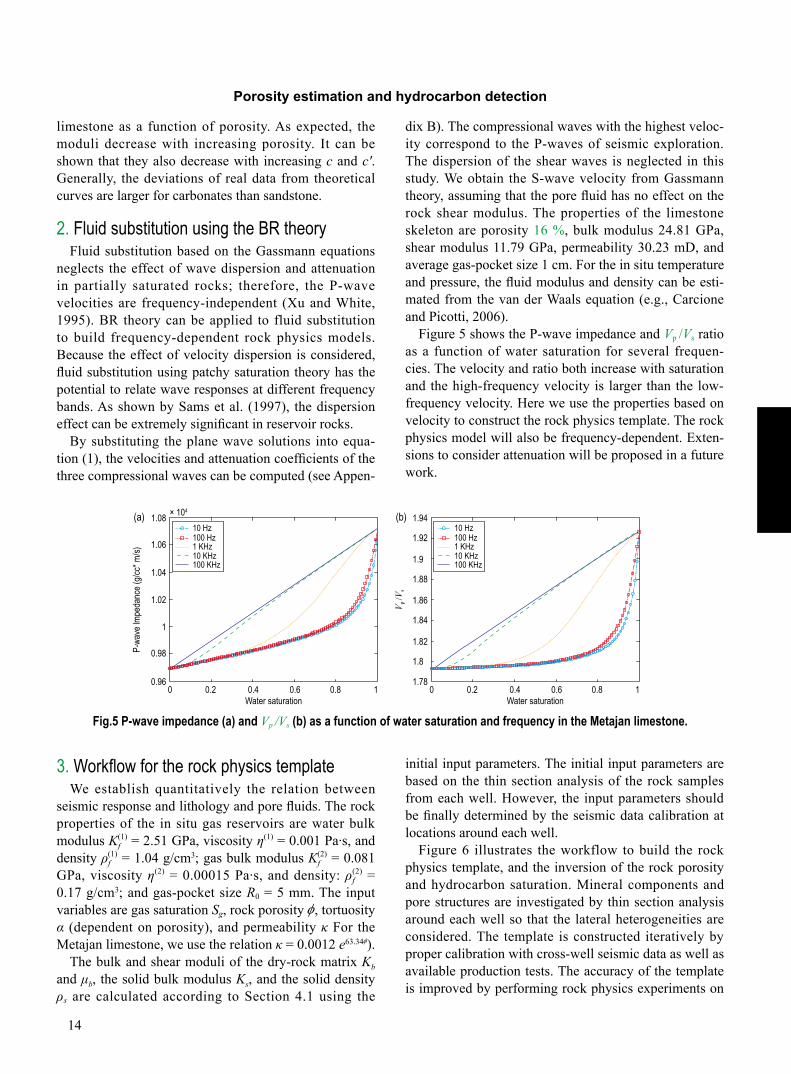
dix B). The compressional waves with the highest veloc-ity correspond to the P-waves of seismic exploration. The dispersion of the shear waves is neglected in this study. We obtain the S-wave velocity from Gassmann theory, assuming that the pore fluid has no effect on the rock shear modulus. The properties of the limestone skeleton are porosity 16 %, bulk modulus 24.81 GPa, shear modulus 11.79 GPa, permeability 30.23 mD, and average gas-pocket size 1 cm. For the in situ temperature and pressure, the fluid modulus and density can be esti-mated from the van der Waals equation (e.g., Carcione and Picotti, 2006).
Figure 5 shows the P-wave impedance and Vp /Vs ratio as a function of water saturation for several frequen-cies. The velocity and ratio both increase with saturation and the high-frequency velocity is larger than the low-frequency velocity. Here we use the properties based on velocity to construct the rock physics template. The rock physics model will also be frequency-dependent. Exten-sions to consider attenuation will be proposed in a future work.
Fig.5 P-wave impedance (a) and Vp /Vs (b) as a function of water saturation and frequency in the Metajan limestone.
3. Workflow for the rock physics templateWe establish quantitatively the relation between
seismic response and lithology and pore fluids. The rock properties of the in situ gas reservoirs are water bulk modulus Kf
(1) = 2.51 GPa, viscosity η(1) = 0.001 Pa·s, and density ρf
(1) = 1.04 g/cm3; gas bulk modulus Kf(2) = 0.081
GPa, viscosity η(2) = 0.00015 Pa·s, and density: ρf(2) =
0.17 g/cm3; and gas-pocket size R0 = 5 mm. The input variables are gas saturation Sg, rock porosity , tortuosity α (dependent on porosity), and permeability κ For the Metajan limestone, we use the relation κ = 0.0012 e63.34 ).
The bulk and shear moduli of the dry-rock matrix Kb and μb, the solid bulk modulus Ks, and the solid density ρs are calculated according to Section 4.1 using the
initial input parameters. The initial input parameters are based on the thin section analysis of the rock samples from each well. However, the input parameters should be finally determined by the seismic data calibration at locations around each well.
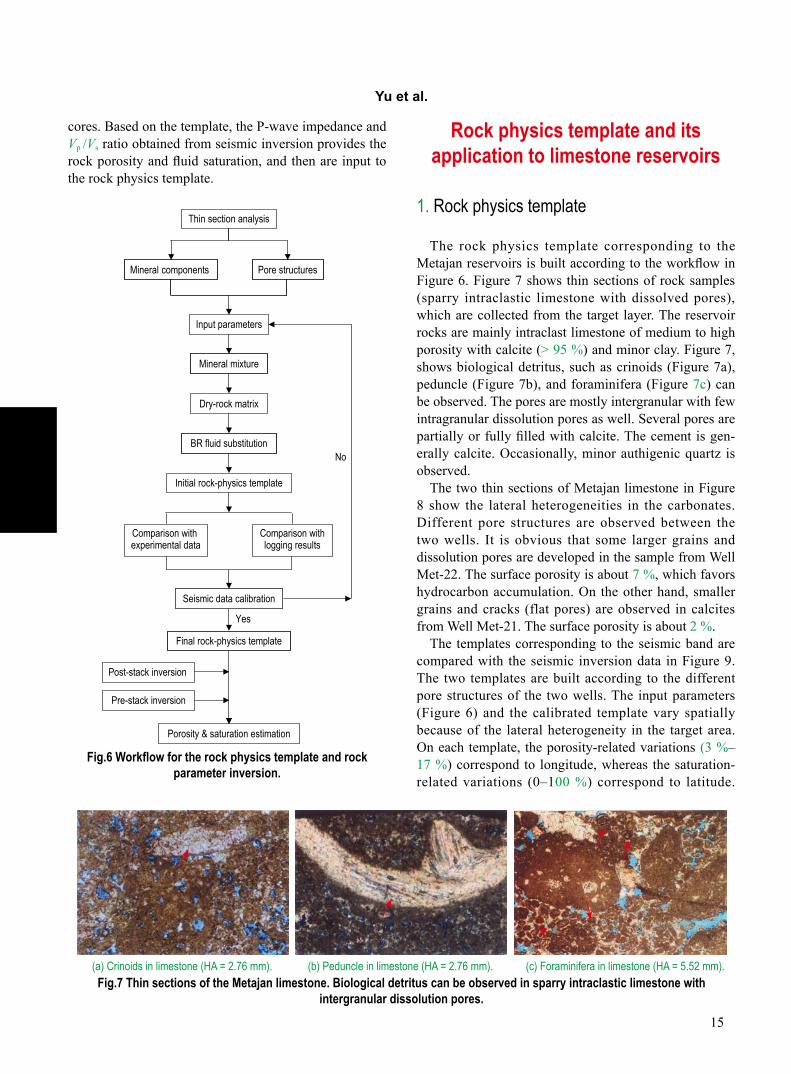
Figure 6 illustrates the workflow to build the rock physics template, and the inversion of the rock porosity and hydrocarbon saturation. Mineral components and pore structures are investigated by thin section analysis around each well so that the lateral heterogeneities are considered. The template is constructed iteratively by proper calibration with cross-well seismic data as well as available production tests. The accuracy of the template is improved by performing rock physics experiments on
1.08 × 10⁴(a) (b)
1.06
P-wa
ve lm
peda
nce (
g/cc*
m/s)
Water saturation
1.04
1.02
1
0.98
0.960 0.2 0.4 0.6 0.8 1
Water saturation0 0.2 0.4 0.6 0.8 1
10 Hz 100 Hz1 KHz 10 KHz 100 KHz
10 Hz 100 Hz1 KHz 10 KHz 100 KHz
1.94
1.92
1.9
1.88
1.86
1.84
1.82
1.8
1.78
V p/V
s
15
Yu et al.
cores. Based on the template, the P-wave impedance and Vp /Vs ratio obtained from seismic inversion provides the rock porosity and fluid saturation, and then are input to the rock physics template.
Rock physics template and its application to limestone reservoirs
1. Rock physics template
The rock physics template corresponding to the Metajan reservoirs is built according to the workflow in Figure 6. Figure 7 shows thin sections of rock samples (sparry intraclastic limestone with dissolved pores), which are collected from the target layer. The reservoir rocks are mainly intraclast limestone of medium to high porosity with calcite (> �5 %) and minor clay. Figure 7, shows biological detritus, such as crinoids (Figure 7a), peduncle (Figure 7b), and foraminifera (Figure 7c) can be observed. The pores are mostly intergranular with few intragranular dissolution pores as well. Several pores are partially or fully filled with calcite. The cement is gen-erally calcite. Occasionally, minor authigenic quartz is observed.
The two thin sections of Metajan limestone in Figure 8 show the lateral heterogeneities in the carbonates. Different pore structures are observed between the two wells. It is obvious that some larger grains and dissolution pores are developed in the sample from Well Met-22. The surface porosity is about 7 %, which favors hydrocarbon accumulation. On the other hand, smaller grains and cracks (flat pores) are observed in calcites from Well Met-21. The surface porosity is about 2 %.
The templates corresponding to the seismic band are compared with the seismic inversion data in Figure �. The two templates are built according to the different pore structures of the two wells. The input parameters (Figure 6) and the calibrated template vary spatially because of the lateral heterogeneity in the target area. On each template, the porosity-related variations (3 %–17 %) correspond to longitude, whereas the saturation-related variations (0–100 %) correspond to latitude.
(a) Crinoids in limestone (HA = 2.76 mm). (b) Peduncle in limestone (HA = 2.76 mm). (c) Foraminifera in limestone (HA = 5.52 mm).Fig.7 Thin sections of the Metajan limestone. Biological detritus can be observed in sparry intraclastic limestone with
intergranular dissolution pores.
Fig.6 Workflow for the rock physics template and rock parameter inversion.
Mineral mixture
Dry-rock matrix
BR fluid substitution
Initial rock-physics template
Porosity & saturation estimation
Post-stack inversion
Final rock-physics template
Comparison withlogging results
Comparison withexperimental data
No
Pore structuresMineral components
Thin section analysis
Seismic data calibration
Input parameters
Pre-stack inversion
Yes
Seismic data calibration
16
Porosity estimation and hydrocarbon detection
The data (Figure �) are extracted from the inverse data traces in the depth range of the target stratum and at the borehole locations. The XVm reservoirs were qualitatively classified into three categories, namely, water reservoirs, gas reservoirs, and low-porosity rocks, which are shown as blue, yellow, and pink, respectively. Comparisons show that the gas reservoirs are located close to the latitude curve of full gas saturation, whereas
the water reservoir data are located closer to the full water saturation curve. The pink triangles (low-porosity rocks), which are considered the least promising for gas production, are mainly located on the right-hand side of the longitude curve for porosity 0.05. According to the template, the rocks with relatively higher porosity (> 0.12) and lower gas saturation (< 50 %) may also be considered gas reservoirs for potential production.
(a) Dissolution pores in a sample from Well Met-22 (HA = 5.52 mm).
(b) Cracks in a sample from Well Met-21 (HA = 5.52 mm).
Fig.8 Thin sections of Metajan limestone. Different pore structures are observed between samples from Well Met-22 and Well Met-21.
(a) The calibrated rock physics template around Well Met-22. (b) The calibrated rock physics template around Well Met-21.Fig.9 The rock physics templates of Met-22 and Met-21, corresponding to Figures 8a and 8b, respectively.
Fig.10 Statistical results of reservoir porosity versus percentage in the XVm layer of the Metajan limestone.
The seismic data (all symbols in Figure �) and the template also suggest that most of the reservoir rocks have porosity of 0.05–0.13 in good agreement with core data from the target stratum. For example, in Figure 10, almost 54 % of the reservoir limestone has porosity in the range 5 %–12.5 %, which contributes to the major gas production of the whole stratum. Moreover, it is also evident in Figure � that the best quality gas reservoirs are those with porosity 8 %–13 %.
2. Porosity and gas saturation from seismic dataBased on the former analysis, we established the
appropriate rock physics templates for the seismic
1.7
1.75
1.85
1.90
1.95
2
V p/V
s
1.8
GasWaterLow porosity
Por = 5%
Por = 13%
Sw = 100%
Sw = 0
P-wave Impedance (g/cc*km/s)9 10 11 12 13 14 15 16
GasWaterLow porosity
1.7
1.75
1.85
1.90
1.95
2
V p/V
s
1.8
P-wave Impedance (g/cc*km/s)9 10 11 12 13 14 15 16
4.5
19.5
13.1
2.9
21.4
38.6
0~2.5 2.5~5 5~7.5 7.5~10 10~12.5 12.5~15
50
40
30
20
10
0
Perce
ntage
(%)
4.5
19.5
13.1
2.9
21.4
38.6
50
40
30
20
10
0
Porosity (%)
17
Yu et al.
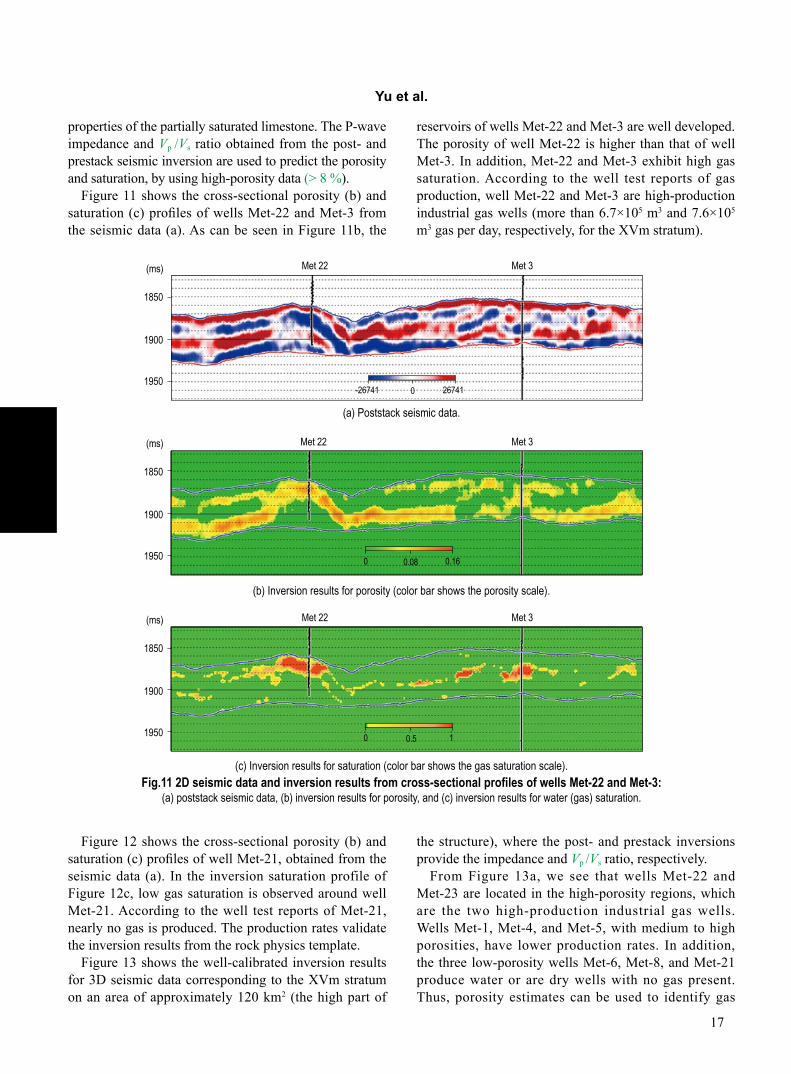
properties of the partially saturated limestone. The P-wave impedance and Vp /Vs ratio obtained from the post- and prestack seismic inversion are used to predict the porosity and saturation, by using high-porosity data (> 8 %).
Figure 11 shows the cross-sectional porosity (b) and saturation (c) profiles of wells Met-22 and Met-3 from the seismic data (a). As can be seen in Figure 11b, the
reservoirs of wells Met-22 and Met-3 are well developed. The porosity of well Met-22 is higher than that of well Met-3. In addition, Met-22 and Met-3 exhibit high gas saturation. According to the well test reports of gas production, well Met-22 and Met-3 are high-production industrial gas wells (more than 6.7×10⁵ m3 and 7.6×10⁵ m3 gas per day, respectively, for the XVm stratum).
(a) Poststack seismic data.
(b) Inversion results for porosity (color bar shows the porosity scale).
(c) Inversion results for saturation (color bar shows the gas saturation scale).Fig.11 2D seismic data and inversion results from cross-sectional profiles of wells Met-22 and Met-3:
(a) poststack seismic data, (b) inversion results for porosity, and (c) inversion results for water (gas) saturation.
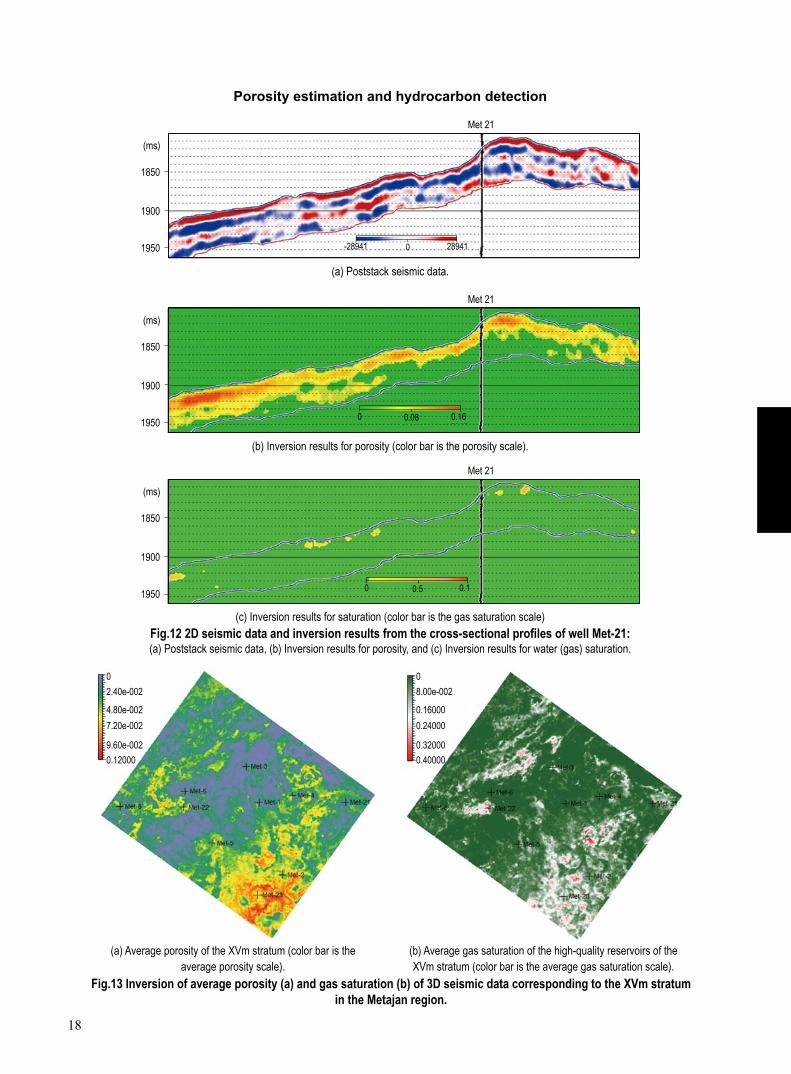
Figure 12 shows the cross-sectional porosity (b) and saturation (c) profiles of well Met-21, obtained from the seismic data (a). In the inversion saturation profile of Figure 12c, low gas saturation is observed around well Met-21. According to the well test reports of Met-21, nearly no gas is produced. The production rates validate the inversion results from the rock physics template.
Figure 13 shows the well-calibrated inversion results for 3D seismic data corresponding to the XVm stratum on an area of approximately 120 km2 (the high part of
the structure), where the post- and prestack inversions provide the impedance and Vp /Vs ratio, respectively.
From Figure 13a, we see that wells Met-22 and Met-23 are located in the high-porosity regions, which are the two high-production industrial gas wells. Wells Met-1, Met-4, and Met-5, with medium to high porosities, have lower production rates. In addition, the three low-porosity wells Met-6, Met-8, and Met-21 produce water or are dry wells with no gas present. Thus, porosity estimates can be used to identify gas
Met 22(ms)
1850
1900
-26741 2674101950
Met 3
Met 22 Met 3(ms)
1850
1900
1950 0 10.5
Met 22 Met 3(ms)
1850
1900
1950 0 0.160.08
18
Porosity estimation and hydrocarbon detection
2.40e-0020
4.80e-0027.20e-002
9.60e-0020.12000
8.00e-0020
0.160000.24000
0.320000.40000
(b) Inversion results for porosity (color bar is the porosity scale).
(c) Inversion results for saturation (color bar is the gas saturation scale)Fig.12 2D seismic data and inversion results from the cross-sectional profiles of well Met-21: (a) Poststack seismic data, (b) Inversion results for porosity, and (c) Inversion results for water (gas) saturation.
Met 21
(ms)
1850
1900
1950 -28941 289410
(a) Poststack seismic data.
Met 21
(ms)
1850
1900
1950 0 0.160.08
Met 21
(ms)
1850
1900
1950 0 0.10.5
(a) Average porosity of the XVm stratum (color bar is the average porosity scale).
(b) Average gas saturation of the high-quality reservoirs of the XVm stratum (color bar is the average gas saturation scale).
Fig.13 Inversion of average porosity (a) and gas saturation (b) of 3D seismic data corresponding to the XVm stratum in the Metajan region.
1�
Yu et al.
Ba, J., 2010, Wave propagation theory in double-porosity medium and experimental analysis on seismic responses: Scientia Sinica - Phys, Mech & Astron (in Chinese), 40(11), 1398 – 1409.
Ba, J., Cao, H., Carcione, J. M., Tang, G., Yan, X, F,, Sun, W. T., and Nie, J. X., 2013a, Multiscale rock-physics templates for gas detection in carbonate reservoirs: Journal of Applied Geophysics, 93, 77 – 82.
Ba, J., Cao, H., and Yao, F. C., 2010, Velocity dispersion of P-waves in sandstone and carbonate: Double-porosity theory and local fluid flow theory: 80th Ann. Internat. Mtg, Soc. Expl. Geophys., Expanded Abstracts, Expanded Abstracts, 2557 – 2563.
Ba, J., Cao, H., Yao, F. C., and Nie, J. X., 2008b, Double-porosity rock model and Squirt flow for laboratory frequency band: Appl. Geophys., 5(4), 261 – 276.
Ba, J., Cao, H., Yao, F. C., Yang, Z. F., and Nie, J. X., 2009, Pore heterogeneity induces double-porosity in Guang’an sandstone: CPS/SEG Beijing 2009, Beijing, China.
Ba, J., Carcione, J. M., Cao, H., Du, Q. Z., Yuan, Z. Y., and Lu, M. H., 2012, Velocity dispersion and attenuation of P waves in partially-saturated rocks: Wave propagation equations in double-porosity medium: Chinese J. Geophys. (in Chinese), 55(1), 219 – 231.
Ba, J., Carcione, J. M., and Nie, J. X., 2011, Biot-Rayleigh theory of wave propagation in double-porosity media: J. Geohpys. Res., 116, B06202, doi: 10.1029/2010JB008185.
Ba, J., Nie, J. X., Cao, H., and Yang, H. Z., 2008a, Mesoscopic f lu id f low s imula t ion in double -porosity rocks: Geophys. Res. Lett., 35, L04303, doi: 10.1029/2007GL032429.
Ba, J., Yan, X. F., Chen, Z. Y., et al., 2013b, Rock physics model and gas saturation inversion for heterogeneous gas reservoirs: Chinese J. Geophys. (in Chinese), 56(5), 16�6 – 1706.
Batzle, M., Han, D., and Hofmann, R., 2006, Fluid mobility and frequency-dependent seismic velocity - Direct measurements: Geophysics, 71(1), N1 – N9.
Berryman, J. G., and Wang, H. F., 1995, The elastic coefficients of double-porosity models for fluid transport in jointed rock: J. Geophys. Res., 100, 24611 – 24627.
Berryman, J. G., and Wang, H. F., 2000, Elastic wave propagation and attenuation in a double-porosity dual-permeability medium: Int. J. Rock Mech. Min. Sci., 37, 63 – 78.
Biot, M. A., 1�56a, Theory of propagation of elastic waves in a fluid-saturated porous solid: I. Low-frequency range: J. Acoust. Soc. Am., 28(2), 168 – 178.
Biot, M. A., 1�56b, Theory of propagation of elastic waves in a fluid-saturated porous solid: II. Higher frequency range: J. Acoust.Soc. Am., 28(2), 179 – 191.
reservoirs with some confidence. However, there may be exceptions; for example, well Met-3 with low to average porosity is a high-production gas well, whereas well Met-2 that is located in the high-porosity regions is a dry well. Figure 13b shows the distribution of the average gas saturation of the high-quality reservoirs (porosity > 0.08). Wells Met-3, Met-22, and Met-23 are all located in the high gas saturation regions, which can be clearly discriminated from the other wells. From well productions tests, wells Met-3 and Met-22 are highly gas-saturated and well Met-23 has medium to high gas saturation. The estimated results are consistent with the production rates.
Conclusions
The Biot–Rayleigh theory describing wave propagation in patchy saturated media was used to relate wave properties to porosity and saturation. A flowchart for building rock physics templates has been proposed for carbonates, specifically, for the limestone of the XVm stratum in the Metajan area on the right bank block of Amu Darya River, where gas is produced. The lateral heterogeneities of the carbonate pore structures are investigated by using thin sections. Based on seismic data calibrations, the rock physics templates are constructed for the specific parameter inversions. The porosity and fluid saturation are then estimated at different locations. The seismic data inversion is based on post- and prestack approaches for obtaining the impedance and seismic velocity. The results are verified by checking the reported production rates for different wells.
Acknowledgements
JB is grateful to Professor Dehua Han for helpful discussions during his visit to the University of Houston. We thank Professor Shisheng Yang who helped performing the thin section analysis.
References
Adam, L., Batzle, M., and Brevik, I., 2006, Gassmann’s fluid substitution and shear modulus variability in carbonates at laboratory seismic and ultrasonic frequencies: Geophysics, 71(6), F13 – F183.
20
Porosity estimation and hydrocarbon detection
Cadoret, T., Marion, D., and Zinszner, B., 1995, Influence of frequency and fluid distribution on elastic wave velocities in partially saturated limestones: J. Geophys. Res., 100, 9789 – 9803.
Carcione, J. M., 2007, Wavefields in real media. Theory and numericalsimulation of wavepropagation in anisotropic, anelastic, porous and electromagnetic media (Second edition): Elsevier.
Carcione, J. M., Gurevich, B., Santos, J. E., and Picotti, S., 2013, Angular and frequency dependent wave velocity and attenuation in fractured porous media: Pure and Applied Geophysics, doi: 10.1007/s00024-012-0636-8.
Carcione, J. M., Helle, H. B., and Pham, N. H., 2003, White’s model for wave propagation in partially saturated rocks: Comparison with poroelastic numerical experiments: Geophysics, 68, 1389 – 1398.
Carcione, J. M., and Picotti, S., 2006, P-wave seismic attenuation by slow-wave diffusion: Effects of inhomogeneous rock properties: Geophysics, 71(3), O1 – O8.
Carcione, J. M., Morency, C., and Santos, J. E., 2010, Computational poroelasticity - A review: Geophysics, 75, A229 – A243.
Chen, X. L., and Tang, X. M., 2012, Numerical study on the characteristics of acoustic logging response in the fluid-filled borehole embedded in crack-porous medium: Chinese J. Geophys. (in Chinese), 55(6), 2129 – 2140.
Dutta, N. C., and Odé, H., 1�7�b, Attenuation and dispersion of compressional waves in fluid-filled porous rocks with partial gas saturation (White model), Part I-Biot theory: Geophysics, 44, 1777 – 1788.
Dutta, N. C., and Seriff, A. J., 1979a, On White’s model of attenuation in rocks with partial gas saturation: Geophysics, 44(11), 1806 – 1812.
Dvorkin, J., and Nur, A., 1993, Dynamic poroelasticity: A unified model with the Squirt and the Biot mechanisms: Geophysics, 58(4), 524 – 533.
Gassmann, F,. 1951, Über die Elastizität poröser Medien: Vier. der Natur. Gesellschaft in Zürich, 96, 1 – 23.
Gurevich, B., Zyrianov, V. B., and Lopatnikov, S. L., 1997, Seismic attenuation in finely layered porous rocks: Effects of fluid flow and scattering: Geophysics, 62(1), 319 – 324.
Johnson, D. L., 2001, Theory of frequency dependent acoustics in patchy saturated porous media: J. Acoust. Soc. Am., 110(2), 682 – 694.
Johnson, D. L., Koplik, J., and Dashen, R., 1987, Theory of dynamic permeability and tortuosity in fluid-saturated porous media: J. Fluid Mech., 176, 379 – 402.
Liu, J., Ma, J. W., and Yang, H. Z., 2009, Research on dispersion and attenuation of P wave in periodic layered-model with patchy saturation: Chinese J. Geophys. (in
Chinese), 52(11), 2879 – 2885.Liu, J., Ma, J. W., and Yang, H. Z., 2010, Research on
P-wave’s propagation in White’s sphere model with patchy saturation: Chinese J. Geophys. (in Chinese), 53(4), 954 – 962.
Mavko, G., Mukerji, T., and Dvorkin, J., 2009, The rock physics handbook - Tools for seismic analysis of porous media (2nd Edition), Cambridge University Press.
Müller, T. M., Gurevich, B., and Lebedev, M., 2010, Seismic wave attenuation and dispersion resulting from wave-induced flow in porous rocks-A review: Geophysics, 75(5), 75A147 – 75A164.
Nie, J. X., Ba, J., Yang, D. H., Yan, X. F., Yuan, Z. Y., and Qiao, H. P., 2012, BISQ model based on a Kelvin-Voigt viscoelastic frame in a partially saturated porous medium: Applied Geophysics, 9(2), 213 – 222.
Nie, J. X., Yang, D. H., and Yang, H. Z., 2004, Inversion of reservoir parameters based on the BISQ model in partially saturated porous media: Chinese J. Geophys. (in Chinese), 47(6), 1101 – 1105.
Pride, S. R., Berryman, J. G., and Harris, J. M., 2004, Seismic attenuation due to wave-induced flow: J. Geophys. Res., 109, B01201, doi: 10.1029/2003JB002639.
Rayleigh, L., 1�17, On the pressure developed in a liquid during the collapse of a spherical cavity: Philos. Mag., 34, 94 – 98.
Roehl, P. O., and Choquette, P. W., 1�85, Carbonate Petroleum Reservoirs, New York, Springer – Verlag.
Sams, M. S., Neep, J. P., Worthington, M. H., and King, M. S., 1��7, The measurement of velocity dispersion and frequency-dependent intrinsic attenuation in sedimentary rocks: Geophysics, 62, 1456 – 1464.
Santos, J. E., Corberó, J. M., and Douglas, J., 1990a, Static and dynamic behavior of a porous solid saturated by a two-phase fluid: J. Acoust. Soc. Am., 87, 1428 – 1438.
Santos, J. E., Douglas, J., Corberó, J. M., and Lovera, O. M., 1��0b, A model for wave propagation in a porous medium saturated by a two-phase fluid: J. Acoust. Soc. Am., 87, 1439 – 1448.
Sun, W. T., Ba, J., Muller, T. M., Carcione, J. M., Cao, H., Du, Q. Z., and Yan, X. F., 2012, P-wave dispersion and attenuation in patchy-saturated Rocks. White, Dutta and Biot-Rayleigh theories: 74th EAGE Expanded Abstracts.
Toms, J., Müller, T. M., Ciz, R., et al., 2006, Comparative review of theoretical models for elastic wave attenuation and dispersion in partially saturated rocks: Soil Dynamics and Earthquake Engineering, 26(6 – 7), 548 – 565.
White, J. E., 1975, Computed seismic speeds and attenuation in rocks with partial gas saturation: Geophysics, 40(2), 224 – 232.
Xu, S. Y., and White, R. E., 1��5, A physical model for shear-wave velocity prediction: Geophysical Prospecting,
21
Yu et al.
44, 687 – 717. Zhao, H. B., Wang, X. M., Chen, S. M., and Li, L. L.,
2010, Acoustic responses characteristics of unsaturated
porous media: Science China Physics, Mechanics and Astronomy, 53, 1388 – 1396.
Appendix A
Biot’s elastic parameters in equation (1) are
2 (1)1 1 2
(1)1 2 1 2
2 (2)2 1 2
(2)1 2 1 2
2(1 )3
(1 / ) /1 / / ( )
(1 / ) /,
1 / / ( )
s
b s s f
b s s f
b s s f
b s s f
A K N
K K K KK K K K
K K K KK K K K
(A-1a)
1 2 11 (1)
1 2 1 2
(1 / ),
1 / / ( )b s s
b s s f
K K KQK K K K
(A-1b)
1 2 22 (2)
1 2 1 2
(1 / ),
1 / / ( )b s s
b s s f
K K KQK K K K
(A-1c)
1 2 11 (1)
1 2 1 2
( ),
1 / / ( )s
b s s f
KRK K K K
(A-1d)
1 2 22 (2)
1 2 1 2
( ),
1 / / ( )s
b s s f
KRK K K K
(A-1e)
,bN (A-1f)
where K and μ are the bulk and shear moduli , respectively. The subscripts s, b, and f denote the grain,
rock skeleton, and fluid. The superscripts (1) and (2) represent the host medium (typically a water-saturated matrix) and the inclusions (the gas-saturated region), respectively.
Biot’s density parameters are
1 2 11 12 13(1 ) ,s (A-2a)
(1)1 12 22 ,f (A-2b)
(2)2 13 33 ,f (A-2c)
(1)22 1 ,f (A-2d)
(2)33 2 ,f (A-2e)
1 1(2
(A-2f)
where α is the tortuosity, and ρ f (1) and ρ f
(2) is the density of the fluid in the host medium and inclusions, respectively.
Biot’s dissipation parameters are
( ) 0 , 1,2.i i iib i (A-3)
where η (i) is the fluid viscosity and κ is the permeability.
Appendix B
Substituting the harmonic plane waves u = u0ei(ωt–k·x) and U (m) = U
0(m)ei(ωt–k·x), m = 1, 2 into the wave propagation
equations, we obtain the matrix equations for the complex wavenumbers k of the P- and S-waves,
2 2 2
11 11 12 12 13 1312 2 2
21 21 22 22 23 23
2 2 2 231 31 32 32 33 33
0,
a k b a k b a k ba k b a k b a k ba k b a k b a k b
u
U
U
(B-1)
where
11 2 1 1 2 12 ( ) ,a A N i Q Q x
211 11 1 2( ),b i b b
12 1 2 1 1 2 2( ) ,a Q i Q Q x 212 12 1,b i b
13 2 2 1 1 2 3( ) ,a Q i Q Q x 213 13 2 ,b i b
22
Porosity estimation and hydrocarbon detection
21 1 1 2 1,a Q iR x 221 12 1,b i b
22 1 1 2 2 ,a R iR x 222 22 1,b i b
23 1 2 3 ,a iR x 23 0,b
31 2 2 1 1,a Q iR x 231 13 2 ,b i b
32 2 1 2 ,a iR x 32 0,b
33 2 2 1 3,a R iR x 233 33 2 ,b i b
and
1 2 1 1 2( ) / ,x i Q Q Z 2 2 1 / ,x i R Z 3 1 2 / ,x i R Z
2 2 22 20 1 2 20 2 21 2 20 0
2 1 1 210 10
( ).3 3
f Ri RZ R R
Because the solid and fluid displacements are arbitrary, the determinant of the matrix must be zero, which yields the dispersion relation between the angular frequency ω and the scalar wavenumber k.
2 2 211 11 12 12 13 13
2 2 221 21 22 22 23 23
2 2 231 31 32 32 33 33
0,
a k b a k b a k ba k b a k b a k ba k b a k b a k b
(B-2)
Consequently, the P-wave dispersion and attenuation can be represented by the complex velocity v = ω/k (Carcione, 2007),
11Re ,Pv v Re( ) .
2Im( )vQv
(B-3)
The largest velocity in the three solutions corresponds to the P-waves used in seismic exploration.
Yu Hao received his Ph.D. degree at the Research Institute of Petroleum Exploration and Development in 2013, majoring in Exploration Geophysics. His current research interests include seismic data interpretation and rock physics modeling.


![Biot Rayleigh theory of wave propagation in double ... · Dutta and Odé [1979a, 1979b] solved the problem exactly using Biot theory and confirmed White’s results. The meso-scopic](https://img.pdfslide.us/doc/110x75/5c4d5e7a93f3c30e021346cf/biot-rayleigh-theory-of-wave-propagation-in-double-dutta-and-ode-1979a.jpg)