Embed Size (px)
Citation preview
by Robin V. Davis, P.G. Project Manager Utah Department of Environmental Quality Leaking Underground Storage Tanks [email protected] 801-536-4177
Evaluating Purging and Sampling Methods to Determine
Representativeness of Soil Vapor Data
Platform Session Wednesday March 25, 2015
1:30pm to 5:00pm
Association for Environmental Health & Sciences (AEHS) 25th Annual International Conference on Soil, Sediment, Water & Energy
San Diego, California
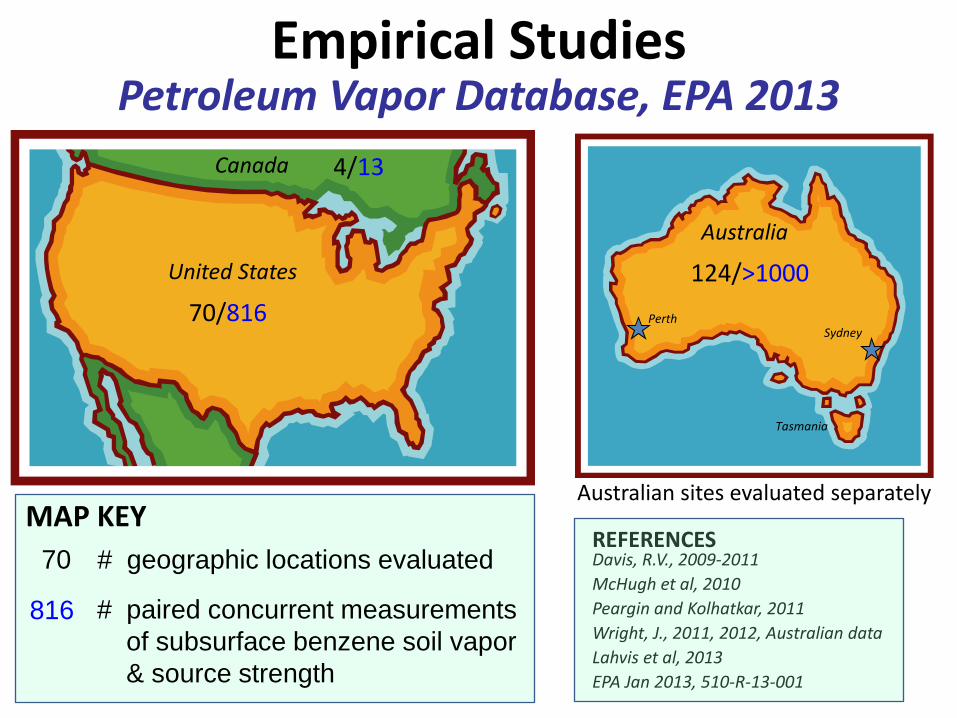
124/>1000
Perth Sydney
Tasmania
Australia
Davis, R.V., 2009-2011
McHugh et al, 2010
Peargin and Kolhatkar, 2011
Wright, J., 2011, 2012, Australian data
Lahvis et al, 2013
EPA Jan 2013, 510-R-13-001
REFERENCES
4/13
70/816
Canada
United States
MAP KEY
# geographic locations evaluated
# paired concurrent measurements
of subsurface benzene soil vapor
& source strength
70
Empirical Studies Petroleum Vapor Database, EPA 2013
Australian sites evaluated separately
816
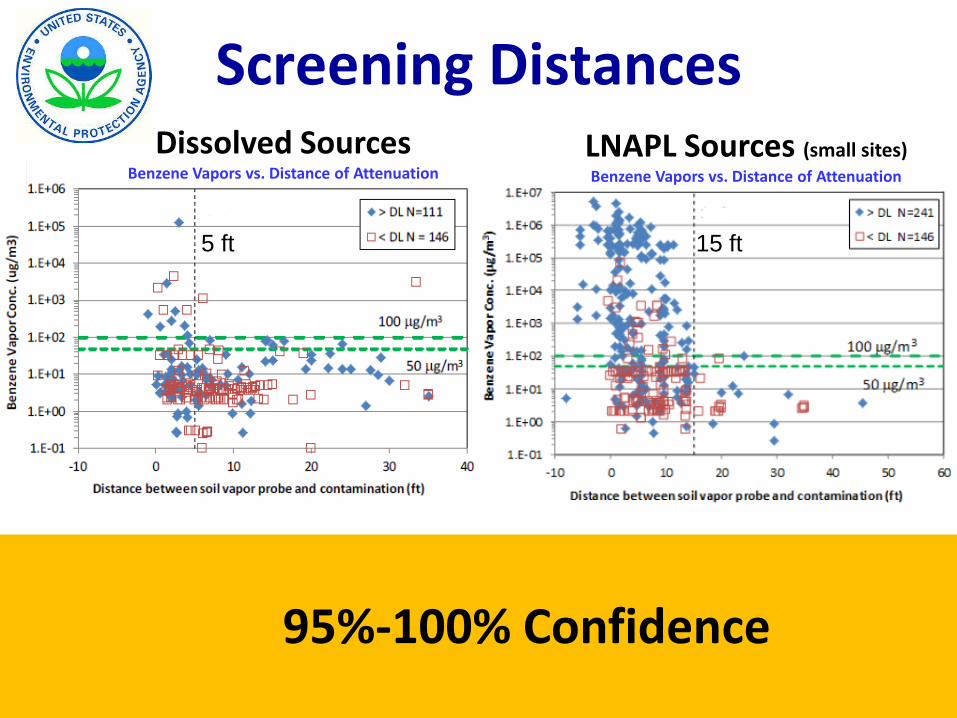
Screening Distances
95%-100% Confidence
Dissolved Sources Benzene Vapors vs. Distance of Attenuation
LNAPL Sources (small sites) Benzene Vapors vs. Distance of Attenuation
5 ft 15 ft
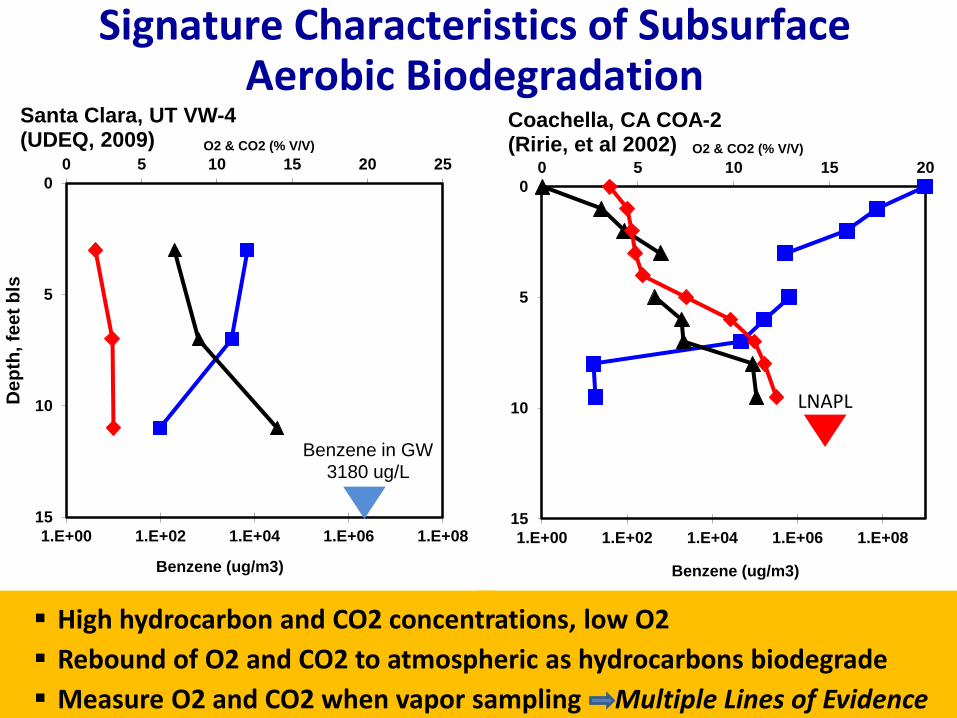
High hydrocarbon and CO2 concentrations, low O2
Rebound of O2 and CO2 to atmospheric as hydrocarbons biodegrade
Measure O2 and CO2 when vapor sampling Multiple Lines of Evidence
1.E+00 1.E+02 1.E+04 1.E+06 1.E+08
0
5
10
15
0 5 10 15 20
Benzene (ug/m3)
O2 & CO2 (% V/V)
Coachella, CA COA-2 (Ririe, et al 2002)
LNAPL
1.E+00 1.E+02 1.E+04 1.E+06 1.E+08
0
5
10
15
0 5 10 15 20 25
Benzene (ug/m3)
De
pth
, fe
et
bls
O2 & CO2 (% V/V)
Santa Clara, UT VW-4 (UDEQ, 2009)
Benzene in GW 3180 ug/L
Signature Characteristics of Subsurface Aerobic Biodegradation
1.E+00 1.E+02 1.E+04 1.E+06 1.E+08
0
2
4
6
8
10
0 5 10 15 20
Benzene (ug/m3)
O2 & CO2 (% V/V)
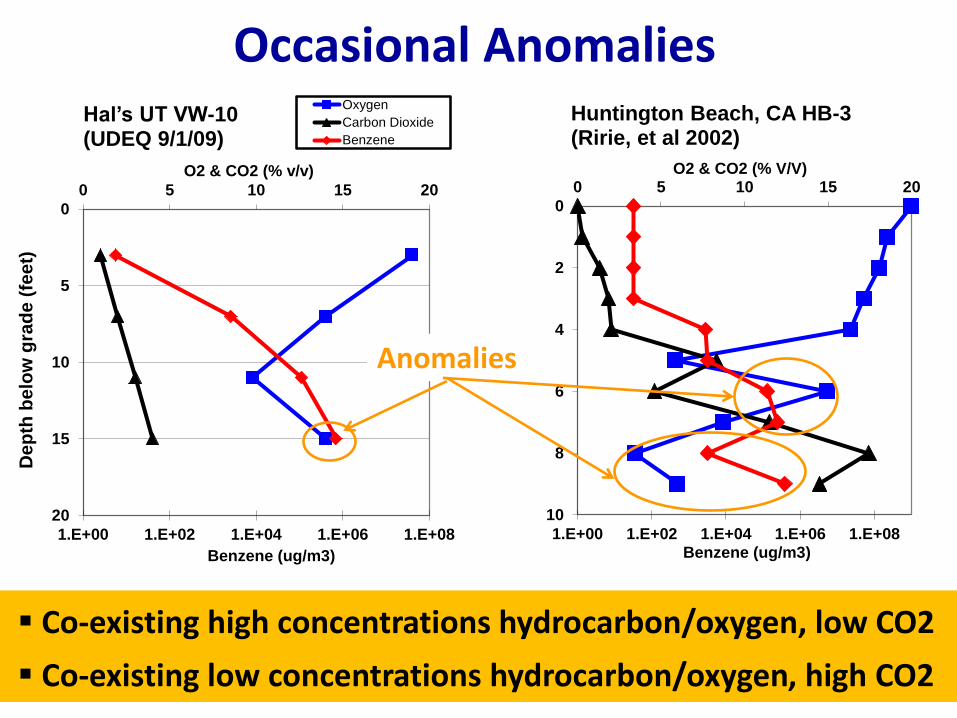
Huntington Beach, CA HB-3 (Ririe, et al 2002)
O2%
CO2%
Occasional Anomalies
Co-existing high concentrations hydrocarbon/oxygen, low CO2
Co-existing low concentrations hydrocarbon/oxygen, high CO2
1.E+00 1.E+02 1.E+04 1.E+06 1.E+08
0
5
10
15
20
0 5 10 15 20
Benzene (ug/m3)
De
pth
be
low
gra
de
(fe
et)
O2 & CO2 (% v/v)
Hal’s UT VW-10 (UDEQ 9/1/09)
Oxygen
Carbon Dioxide
Benzene
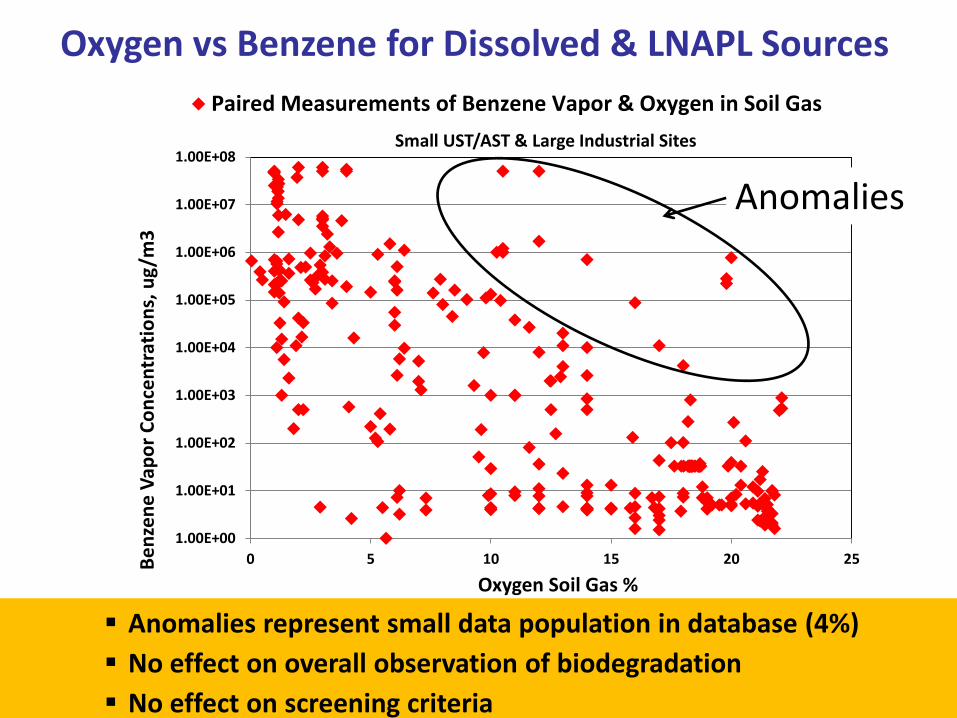
Anomalies
1.00E+00
1.00E+01
1.00E+02
1.00E+03
1.00E+04
1.00E+05
1.00E+06
1.00E+07
1.00E+08
0 5 10 15 20 25Be
nze
ne
Vap
or
Co
nce
ntr
atio
ns,
ug
/m3
Oxygen Soil Gas %
Small UST/AST & Large Industrial Sites
Paired Measurements of Benzene Vapor & Oxygen in Soil Gas
Oxygen vs Benzene for Dissolved & LNAPL Sources
Anomalies represent small data population in database (4%)
No effect on overall observation of biodegradation
No effect on screening criteria
Anomalies
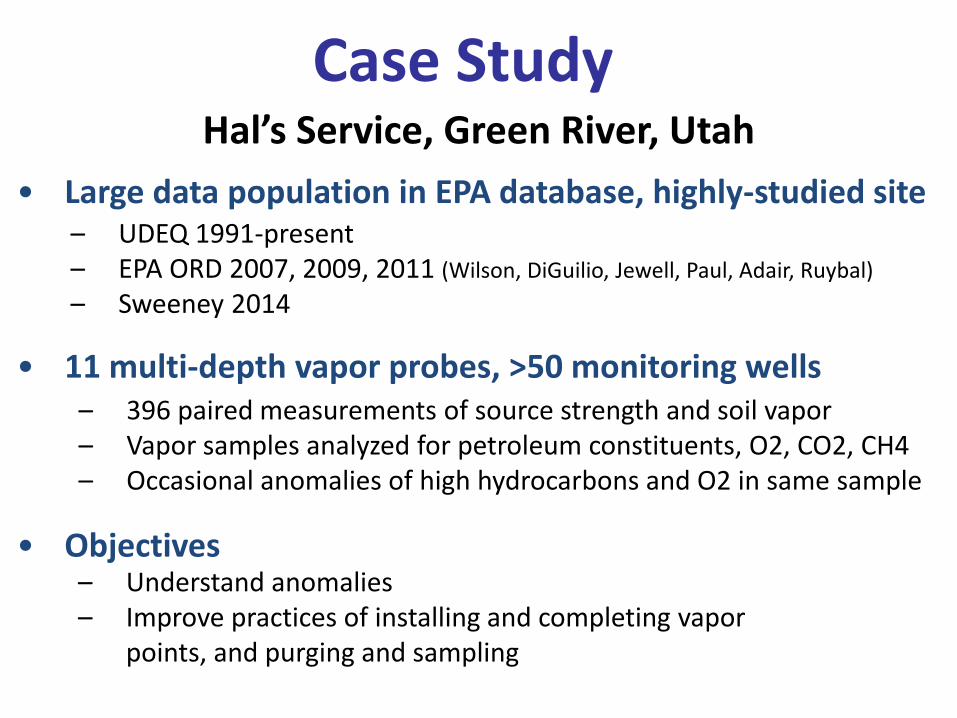
Case Study
• Large data population in EPA database, highly-studied site – UDEQ 1991-present – EPA ORD 2007, 2009, 2011 (Wilson, DiGuilio, Jewell, Paul, Adair, Ruybal)
– Sweeney 2014
• 11 multi-depth vapor probes, >50 monitoring wells
Hal’s Service, Green River, Utah
– 396 paired measurements of source strength and soil vapor – Vapor samples analyzed for petroleum constituents, O2, CO2, CH4 – Occasional anomalies of high hydrocarbons and O2 in same sample
– Understand anomalies – Improve practices of installing and completing vapor
points, and purging and sampling
• Objectives
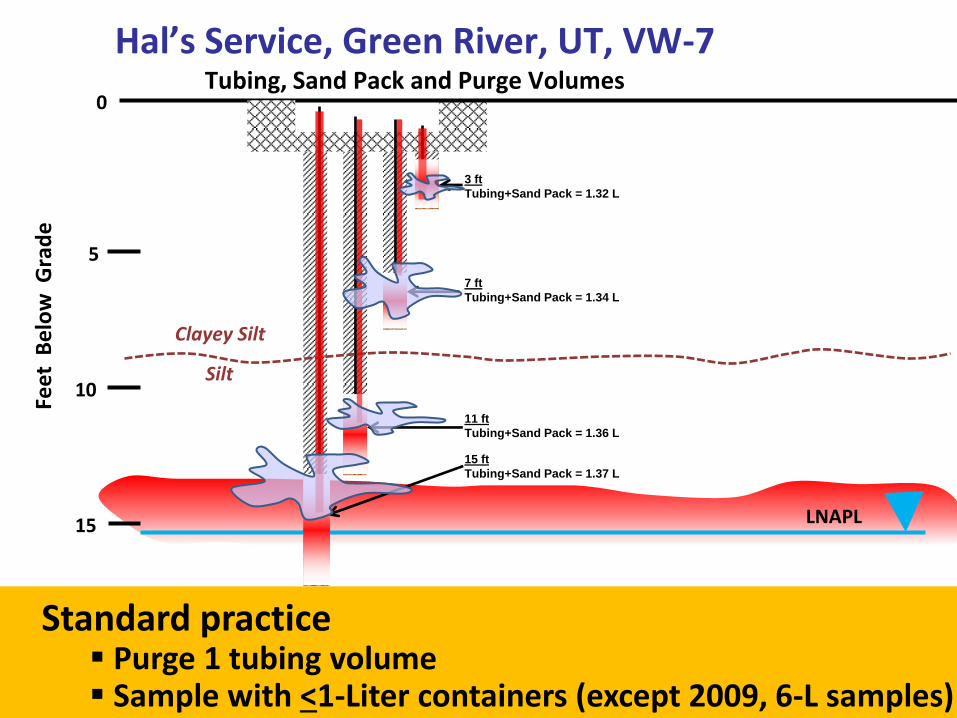
Hal’s Service, Green River, UT, VW-7 Tubing, Sand Pack and Purge Volumes
v
v
Fee
t B
elo
w G
rad
e
0
15
10
5
v
v
v LNAPL
Clayey Silt
Silt
3 ft
Tubing+Sand Pack = 1.32 L
7 ft
Tubing+Sand Pack = 1.34 L
11 ft
Tubing+Sand Pack = 1.36 L
15 ft
Tubing+Sand Pack = 1.37 L
Standard practice Purge 1 tubing volume Sample with <1-Liter containers (except 2009, 6-L samples)
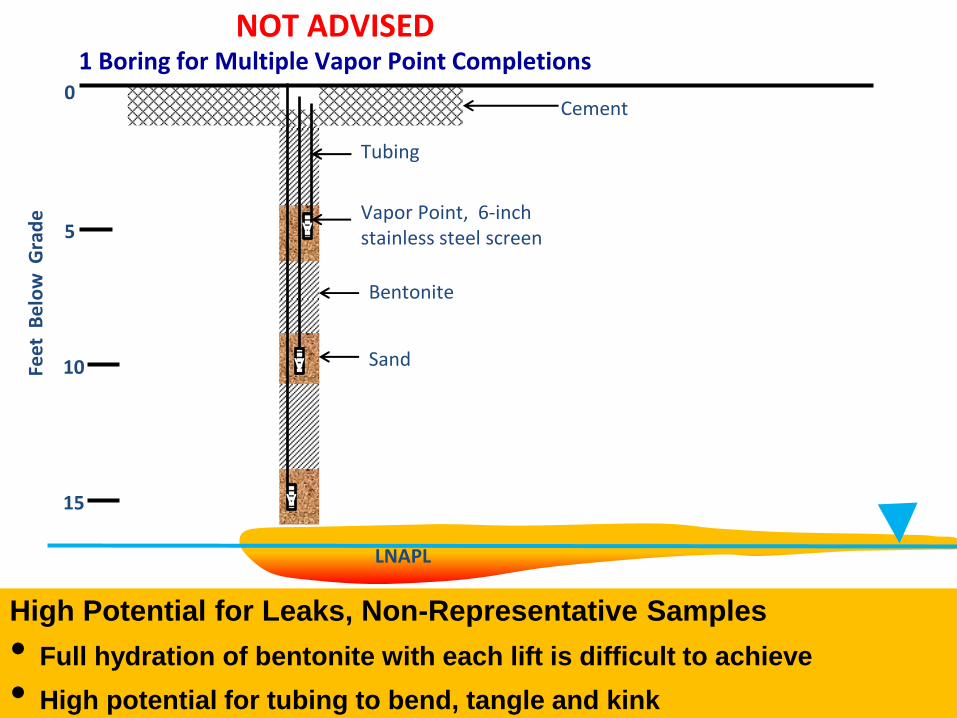
NOT ADVISED 1 Boring for Multiple Vapor Point Completions
v Fee
t B
elo
w G
rad
e
0
15
10
5
Cement
Bentonite
Sand
Tubing
Vapor Point, 6-inch stainless steel screen
v
v
LNAPL
High Potential for Leaks, Non-Representative Samples
• Full hydration of bentonite with each lift is difficult to achieve
• High potential for tubing to bend, tangle and kink
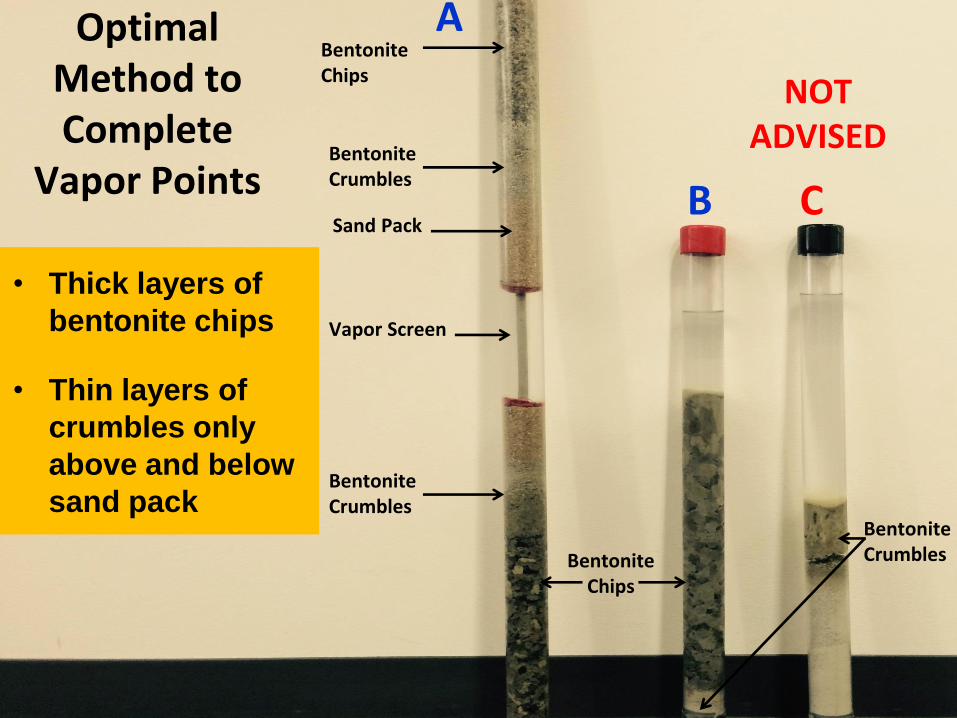
Bentonite Chips
Vapor Screen
Bentonite Crumbles
Bentonite Crumbles Bentonite
Chips
Sand Pack
A
B C
NOT ADVISED
Bentonite Crumbles
Optimal Method to Complete
Vapor Points
• Thick layers of
bentonite chips • Thin layers of
crumbles only
above and below
sand pack
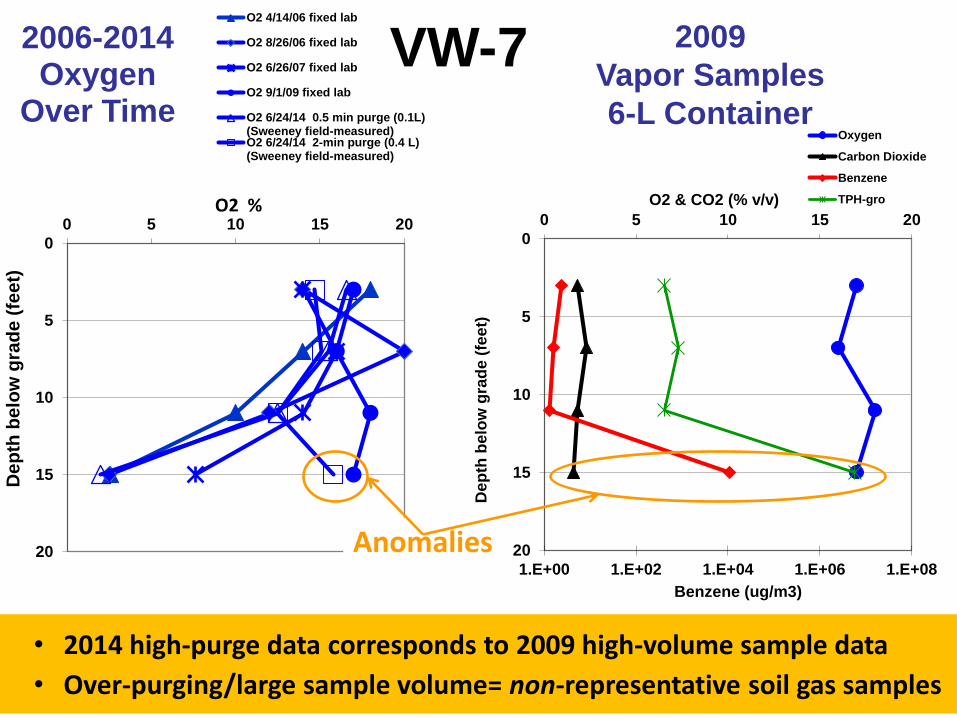
0
5
10
15
20
0 5 10 15 20
De
pth
be
low
gra
de
(fe
et)
2006-2014 Oxygen
Over Time
O2 4/14/06 fixed lab
O2 8/26/06 fixed lab
O2 6/26/07 fixed lab
O2 9/1/09 fixed lab
O2 6/24/14 0.5 min purge (0.1L)(Sweeney field-measured)O2 6/24/14 2-min purge (0.4 L)(Sweeney field-measured)
O2 %
• 2014 high-purge data corresponds to 2009 high-volume sample data
• Over-purging/large sample volume= non-representative soil gas samples
1.E+00 1.E+02 1.E+04 1.E+06 1.E+08
0
5
10
15
20
0 5 10 15 20
Benzene (ug/m3)
De
pth
be
low
gra
de
(fe
et)
O2 & CO2 (% v/v)
VW-7 9/1/09
Oxygen
Carbon Dioxide
Benzene
TPH-gro
Anomalies
2009
Vapor Samples
6-L Container
VW-7
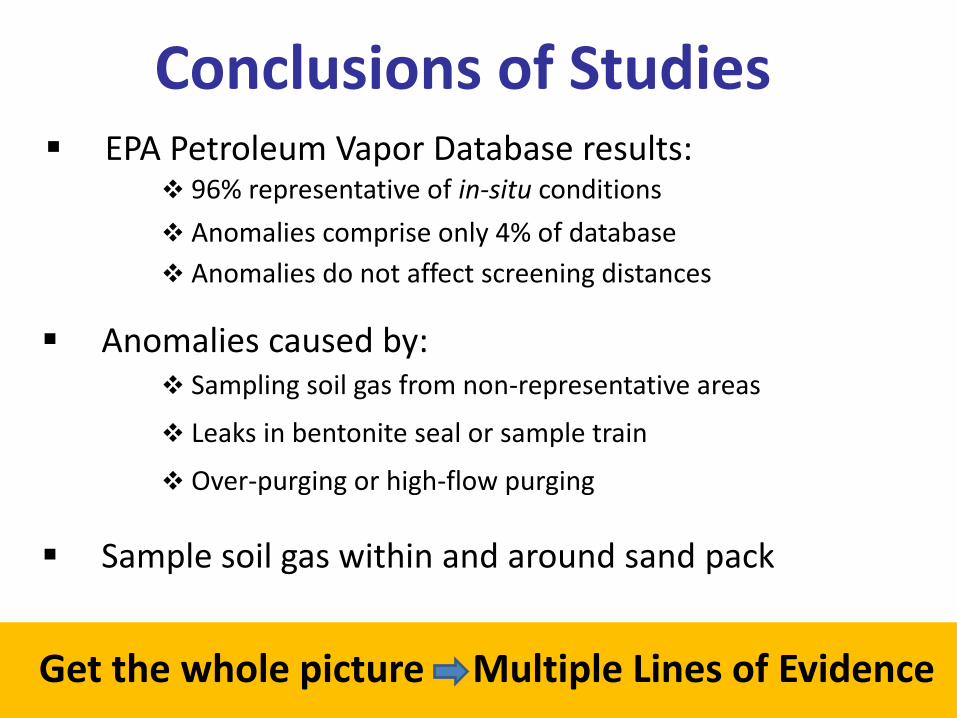
Conclusions of Studies
Sample soil gas within and around sand pack
EPA Petroleum Vapor Database results:
Analyze for hydrocarbons, O2 and CO2
Anomalies caused by:
Anomalies comprise only 4% of database
96% representative of in-situ conditions
Anomalies do not affect screening distances
Get the whole picture Multiple Lines of Evidence
Leaks in bentonite seal or sample train
Over-purging or high-flow purging
Sampling soil gas from non-representative areas