Embed Size (px)
Citation preview
Robert W. ChristophersonCharlie Thomsen
Chapter 5 Global
Temperatures
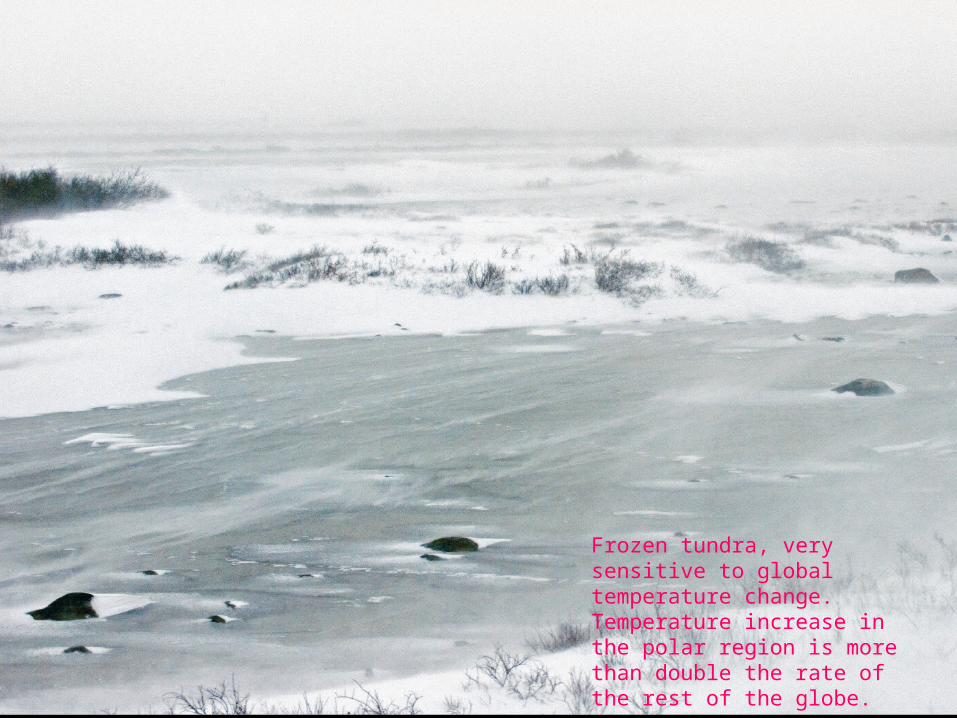
Frozen tundra, very sensitive to global temperature change. Temperature increase in the polar region is more than double the rate of the rest of the globe.
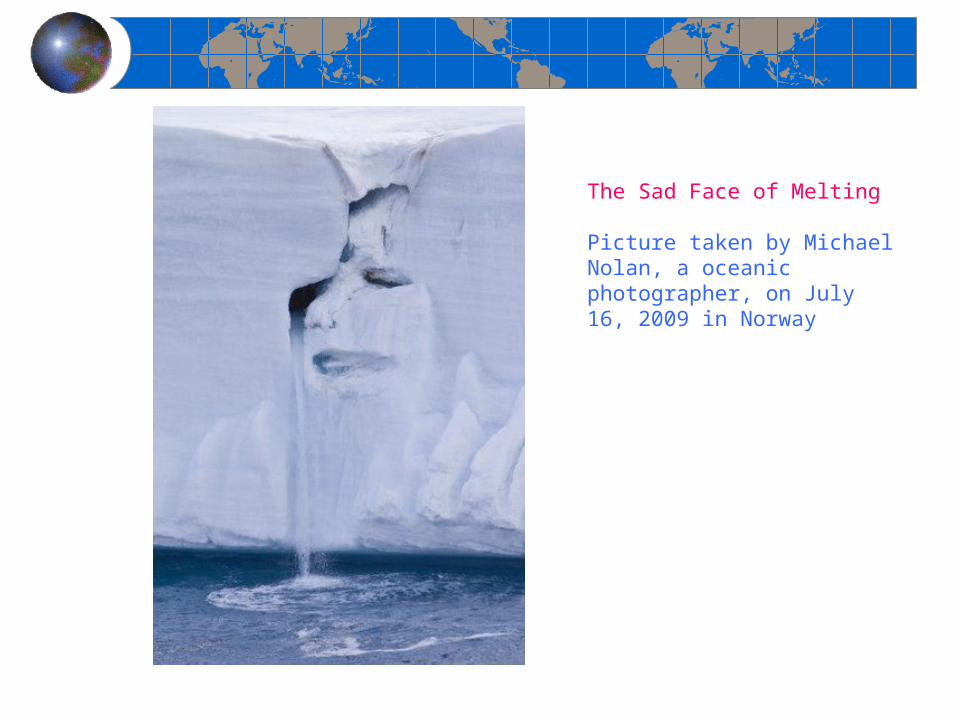
The Sad Face of Melting
Picture taken by Michael Nolan, a oceanic photographer, on July 16, 2009 in Norway
Temperature Concepts and Measurement
Principal Temperature Controls
Earth’s Temperature Patterns
Air Temperature and the Human Body
Global Temperatures
Temperature is a measure of average kinetic energy (motion) of individual molecules in matter.
Heat always transfer in the direction from higher temperature to lower temperature.
High temperature does not necessarily mean more heat.
Temperature
Temperature Scales Fahrenheit
Celsius
Kelvin
Measuring TemperatureMechanical (shrink/expansion)
Electric
Temperature Concepts and Measurement
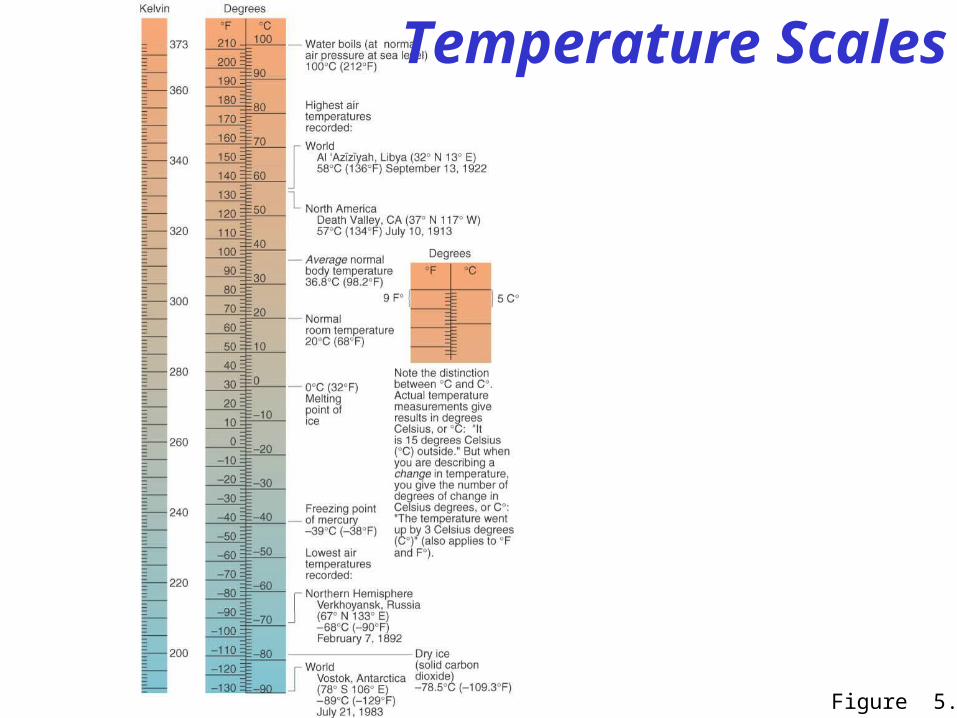
Temperature Scales
Figure 5.1
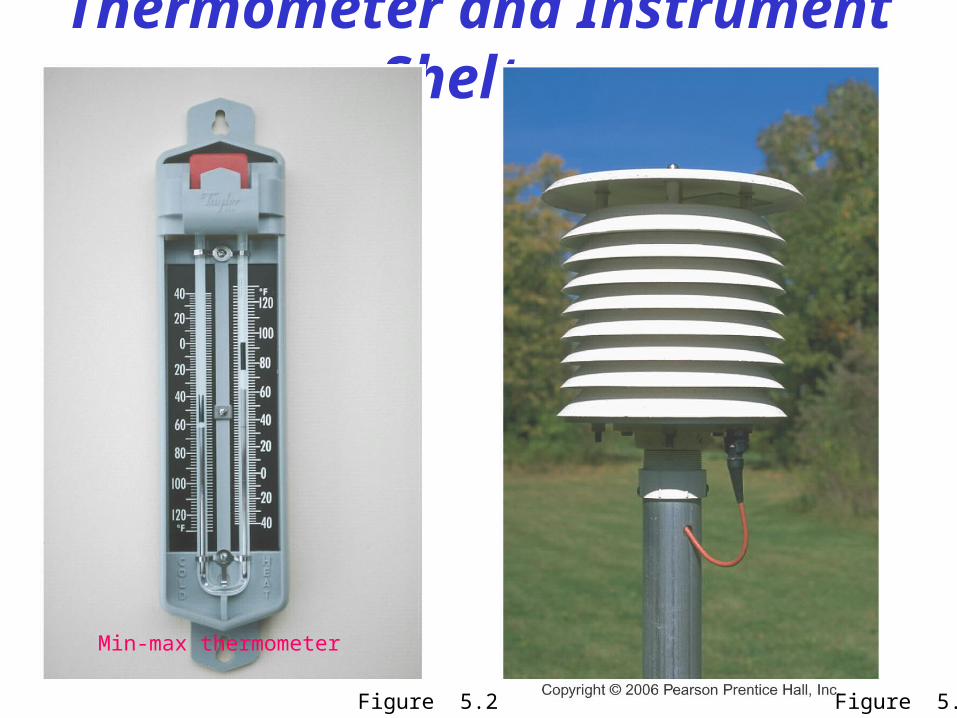
Thermometer and Instrument Shelter
Figure 5.2 Figure 5.3
Min-max thermometer
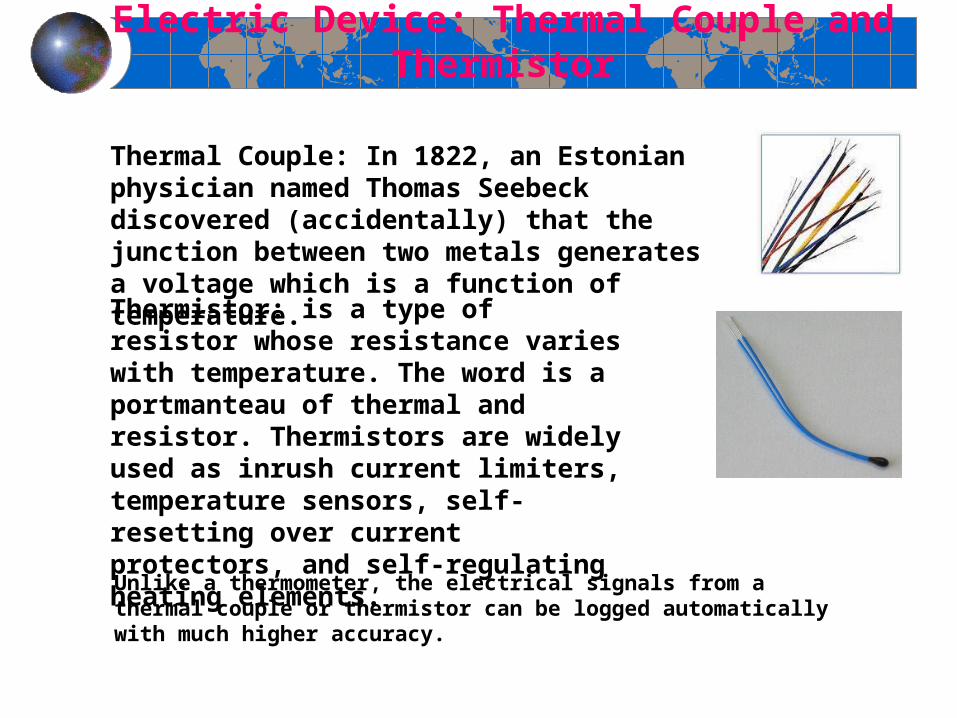
Electric Device: Thermal Couple and Thermistor
Thermistor: is a type of resistor whose resistance varies with temperature. The word is a portmanteau of thermal and resistor. Thermistors are widely used as inrush current limiters, temperature sensors, self-resetting over current protectors, and self-regulating heating elements.
Thermal Couple: In 1822, an Estonian physician named Thomas Seebeck discovered (accidentally) that the junction between two metals generates a voltage which is a function of temperature.
Unlike a thermometer, the electrical signals from a thermal couple or thermistor can be logged automatically with much higher accuracy.
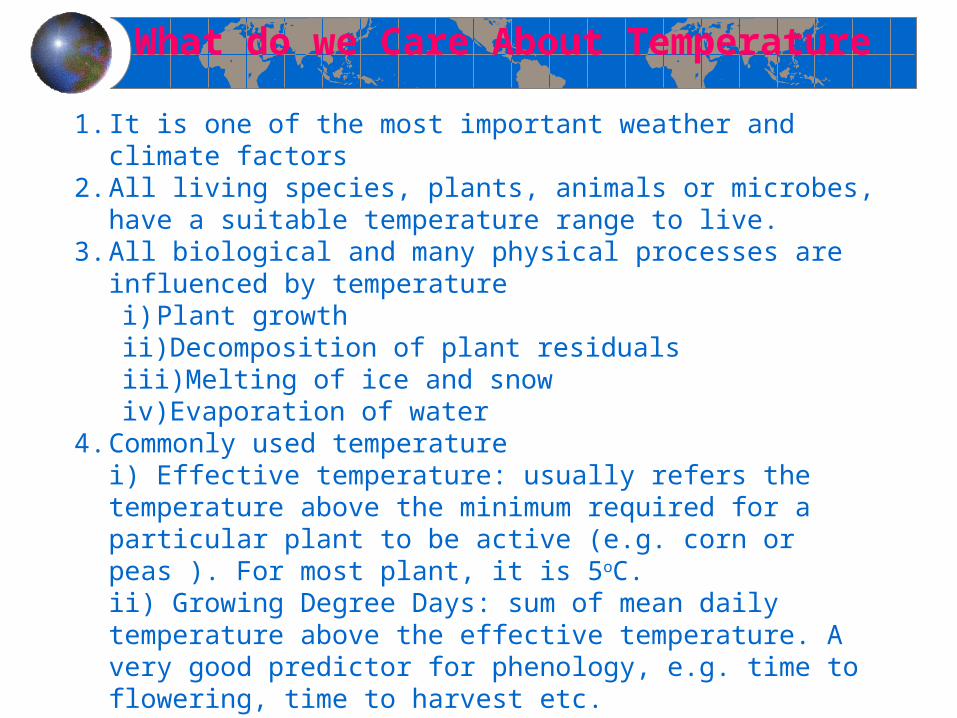
What do we Care About Temperature
1. It is one of the most important weather and climate factors2. All living species, plants, animals or microbes, have a suitable
temperature range to live.3. All biological and many physical processes are influenced by temperature
i) Plant growthii) Decomposition of plant residualsiii) Melting of ice and snowiv) Evaporation of water
4. Commonly used temperaturei) Effective temperature: usually refers the temperature above the minimum required for a particular plant to be active (e.g. corn or peas ). For most plant, it is 5oC.ii) Growing Degree Days: sum of mean daily temperature above the effective temperature. A very good predictor for phenology, e.g. time to flowering, time to harvest etc.
iii) Extreme low/high temperature: can be a determinant factor limiting certain species spatial distribution.
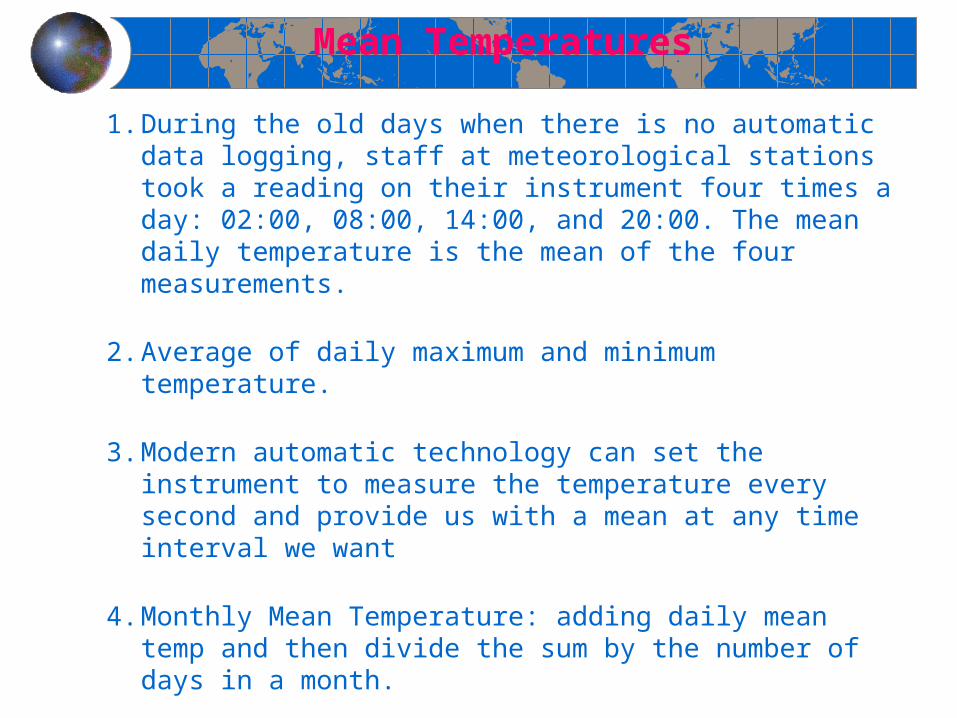
Mean Temperatures
1. During the old days when there is no automatic data logging, staff at meteorological stations took a reading on their instrument four times a day: 02:00, 08:00, 14:00, and 20:00. The mean daily temperature is the mean of the four measurements.
2. Average of daily maximum and minimum temperature.
3. Modern automatic technology can set the instrument to measure the temperature every second and provide us with a mean at any time interval we want
4. Monthly Mean Temperature: adding daily mean temp and then divide the sum by the number of days in a month.
5. Annual Mean Temperature: adding the monthly mean temperature, and divide the sum by 12.
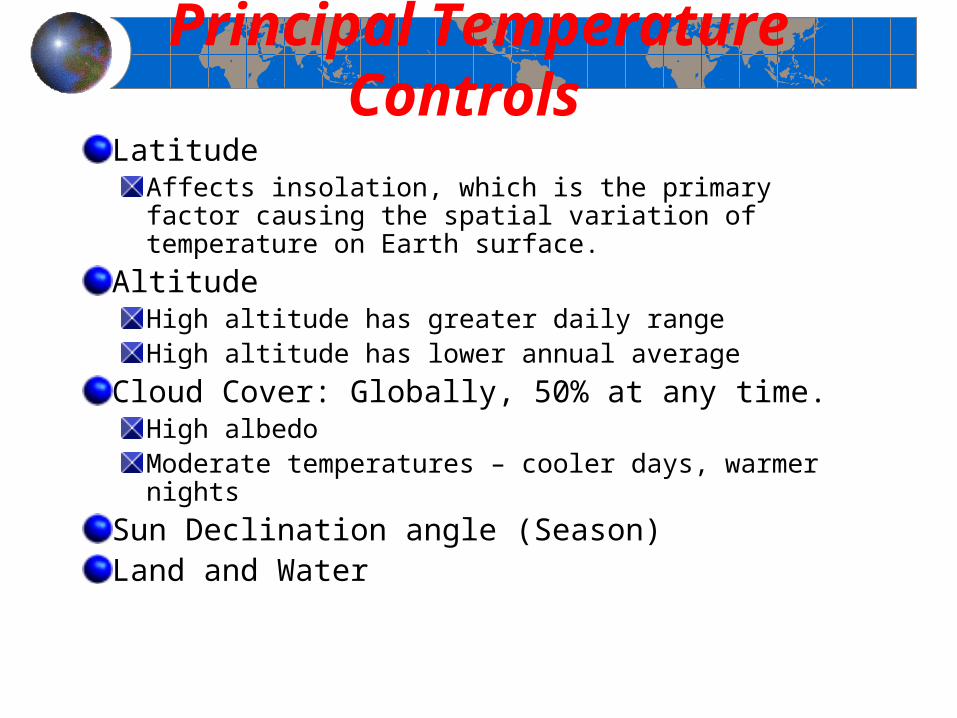
Latitude Affects insolation, which is the primary factor causing the spatial variation of temperature on Earth surface.
Altitude High altitude has greater daily rangeHigh altitude has lower annual average
Cloud Cover: Globally, 50% at any time. High albedoModerate temperatures – cooler days, warmer nights
Sun Declination angle (Season)Land and Water
Principal Temperature Controls
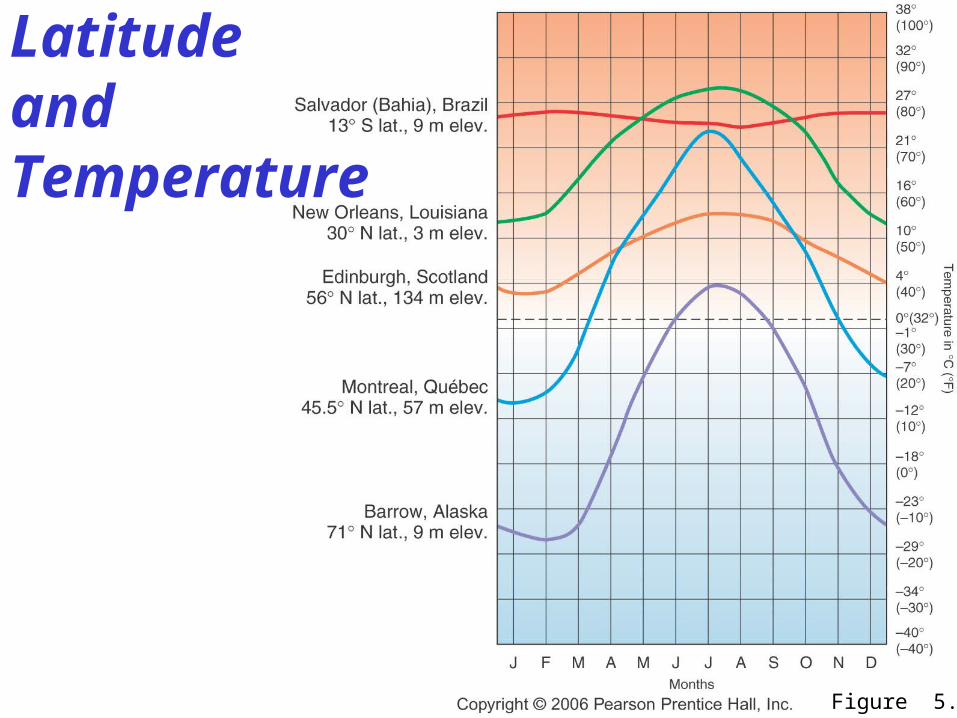
Latitude and Temperature
Figure 5.4
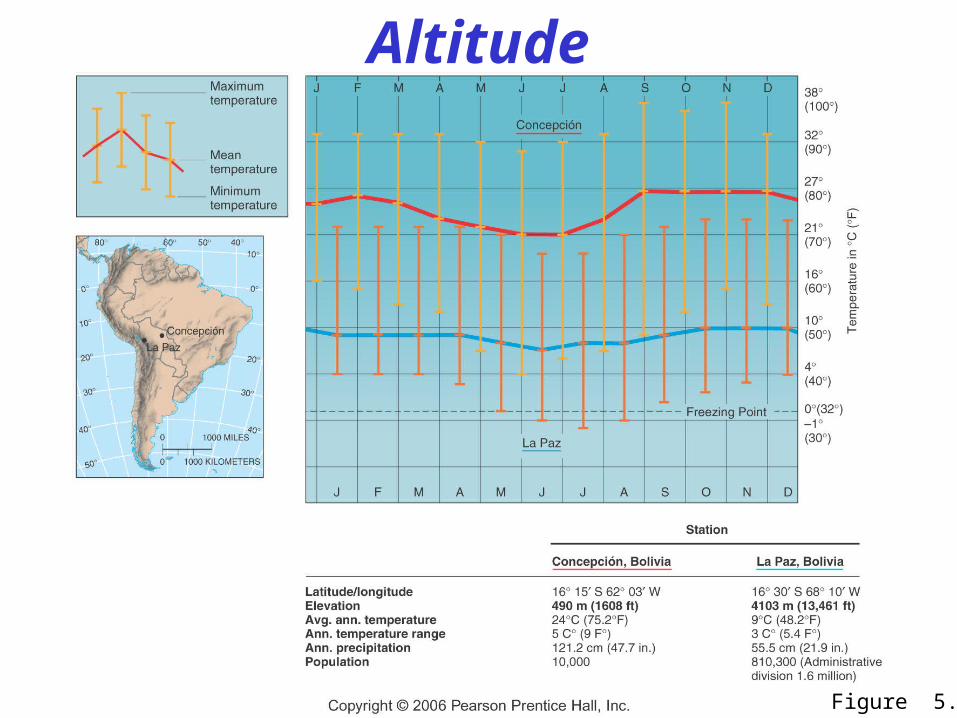
Altitude
Figure 5.5
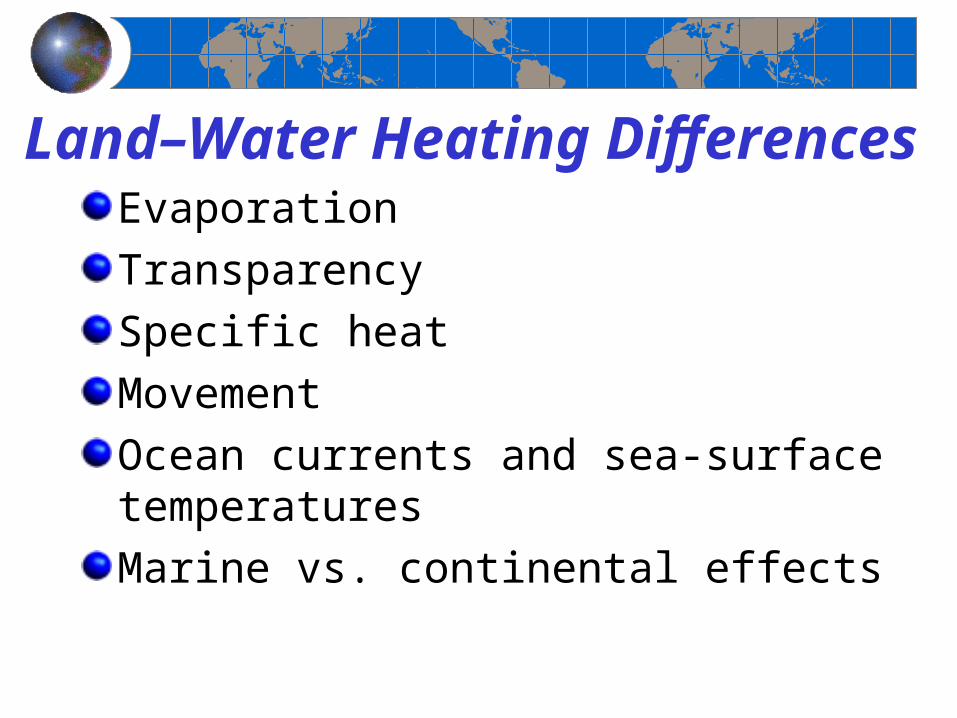
Evaporation
Transparency
Specific heat
Movement
Ocean currents and sea-surface temperatures
Marine vs. continental effects
Land–Water Heating Differences
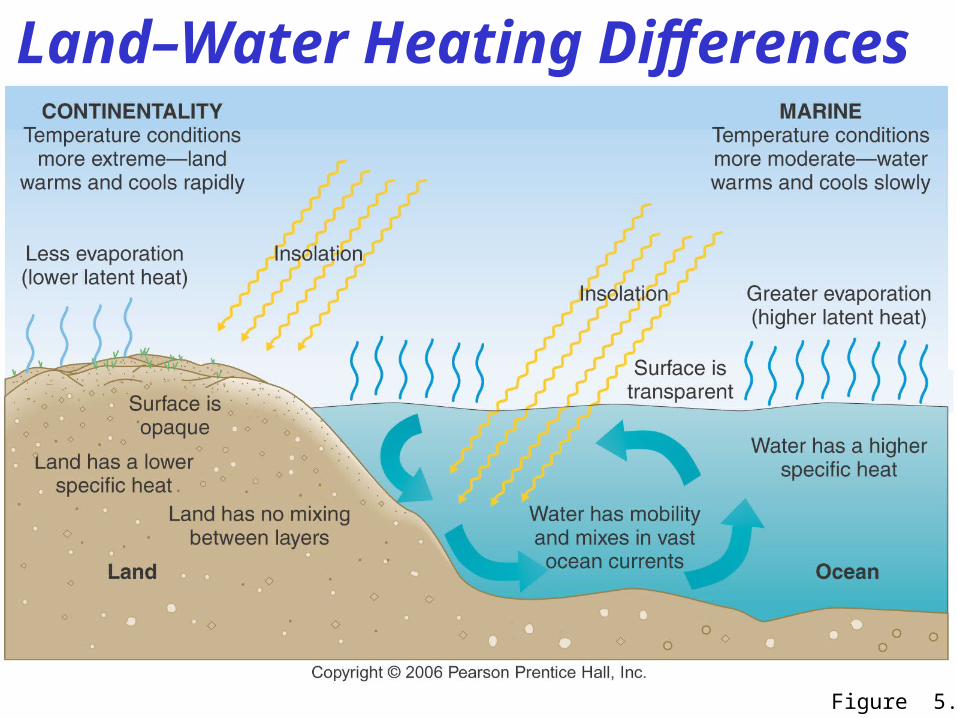
Land–Water Heating Differences
Figure 5.7
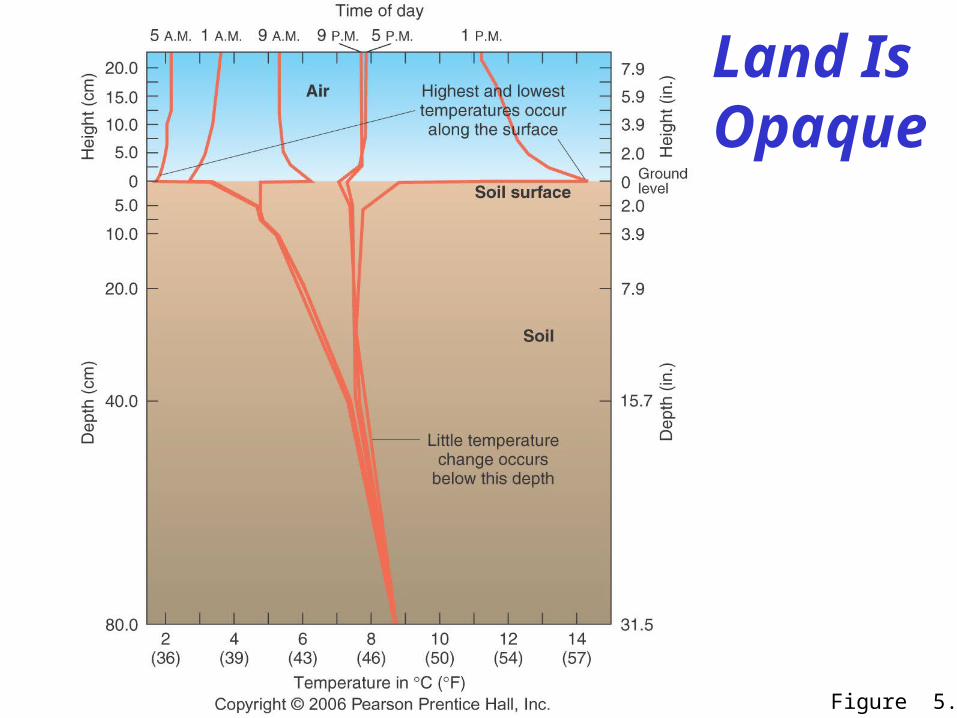
Land Is Opaque
Figure 5.8
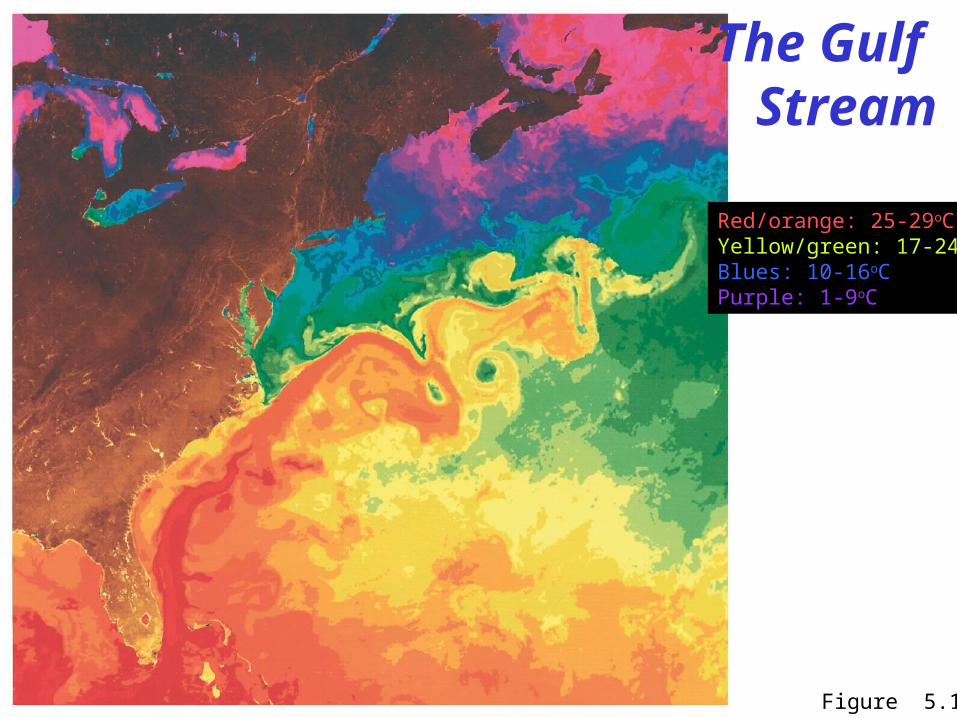
The Gulf Stream
Figure 5.10
Red/orange: 25-29oCYellow/green: 17-24oCBlues: 10-16oCPurple: 1-9oC
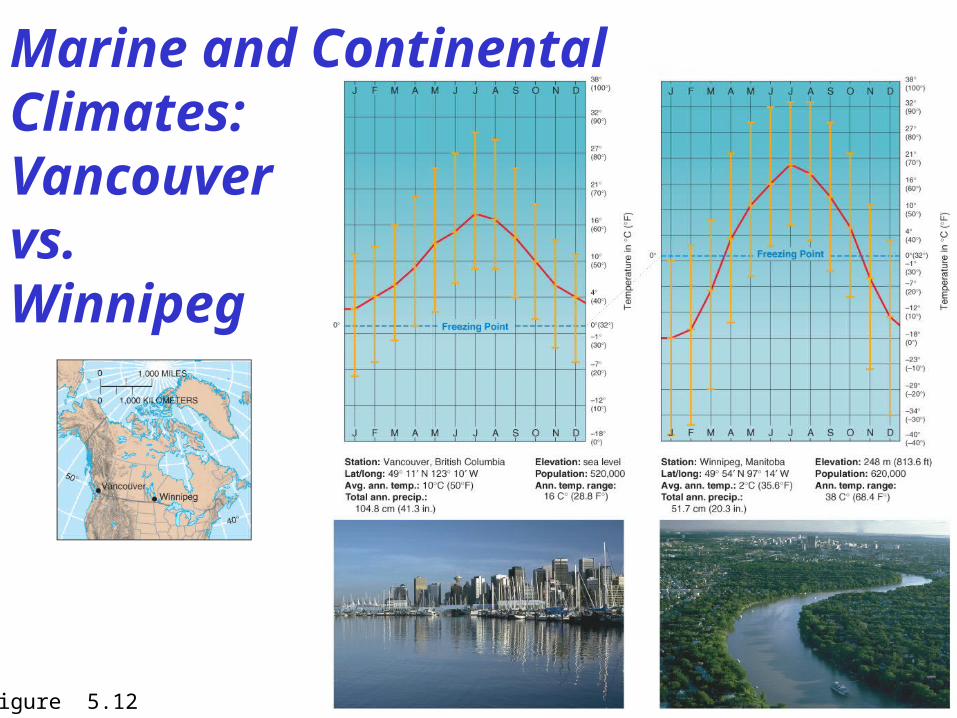
Marine and Continental Climates:Vancouvervs.Winnipeg
Figure 5.12
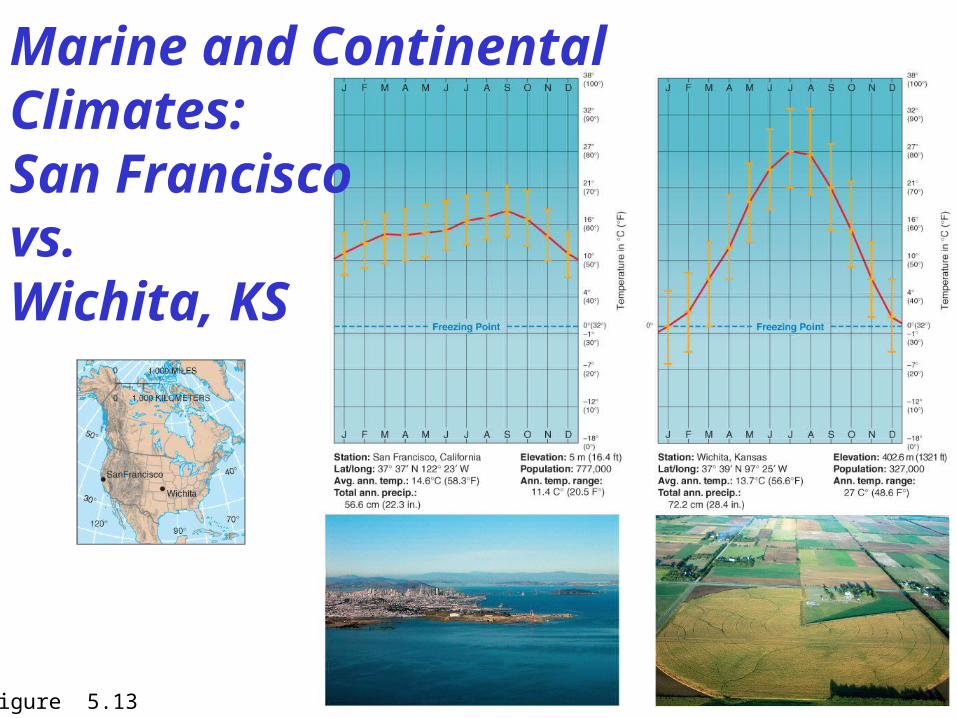
Figure 5.13
Marine and Continental Climates:San Franciscovs.Wichita, KS
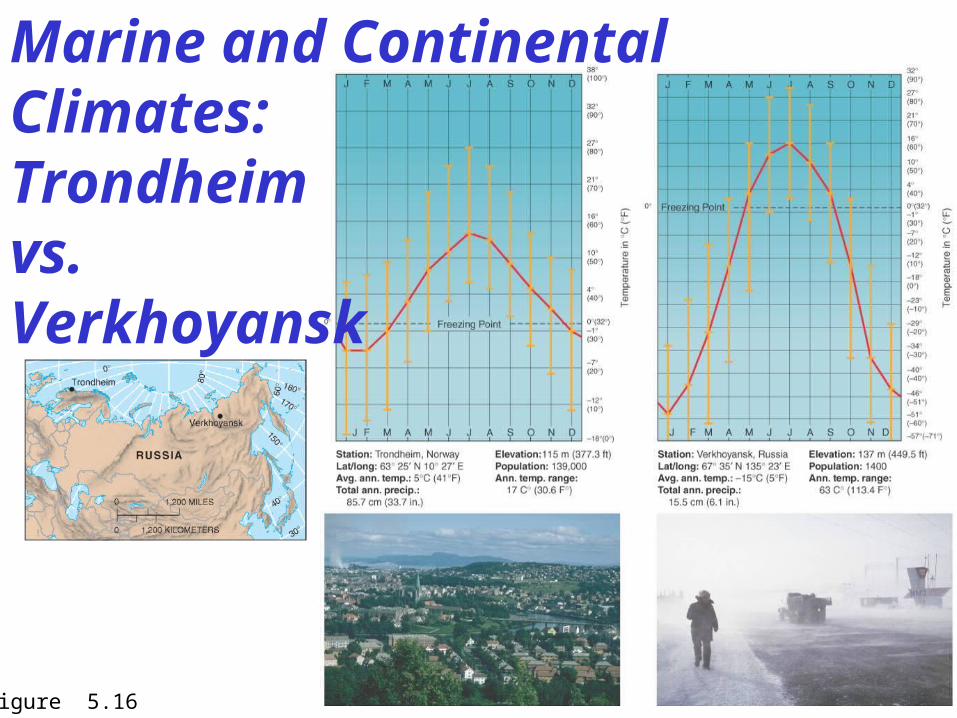
Marine and Continental Climates:Trondheimvs.Verkhoyansk
Figure 5.16
January Temperature Map Thermal equator movement southward
More pronounced over large continents
July Temperature Map Thermal equator movement northward
More pronounced over large continents
Annual Temperature Range Map Continentality
Earth’s Temperature Patterns
(b)
(c)
(a)
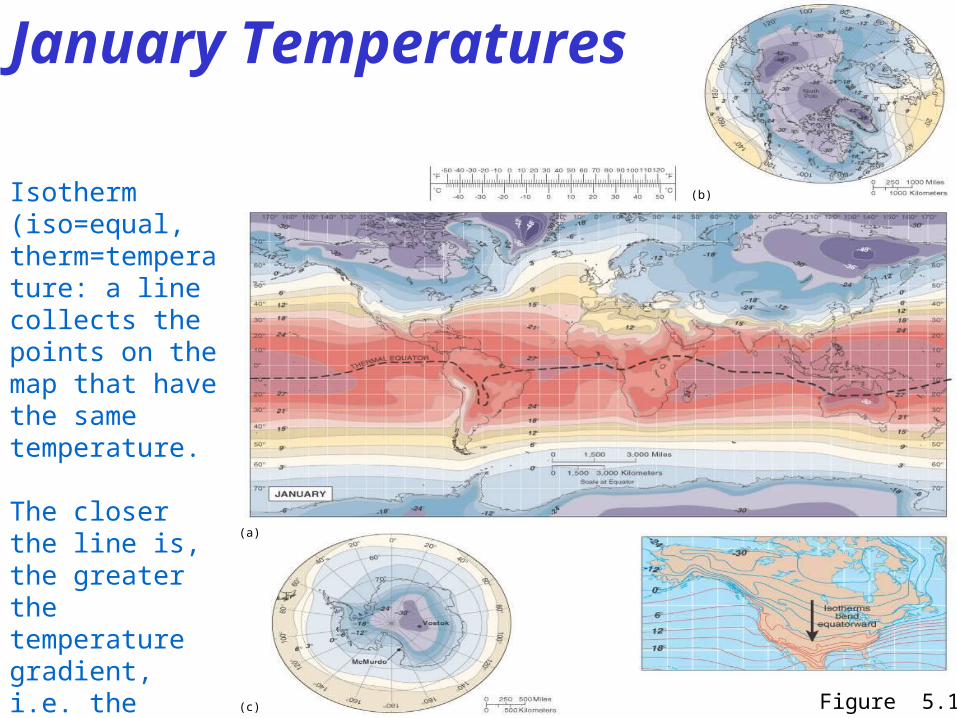
January Temperatures
Figure 5.14
Isotherm (iso=equal, therm=temperature: a line collects the points on the map that have the same temperature.
The closer the line is, the greater the temperature gradient, i.e. the faster the temperature changes in space.
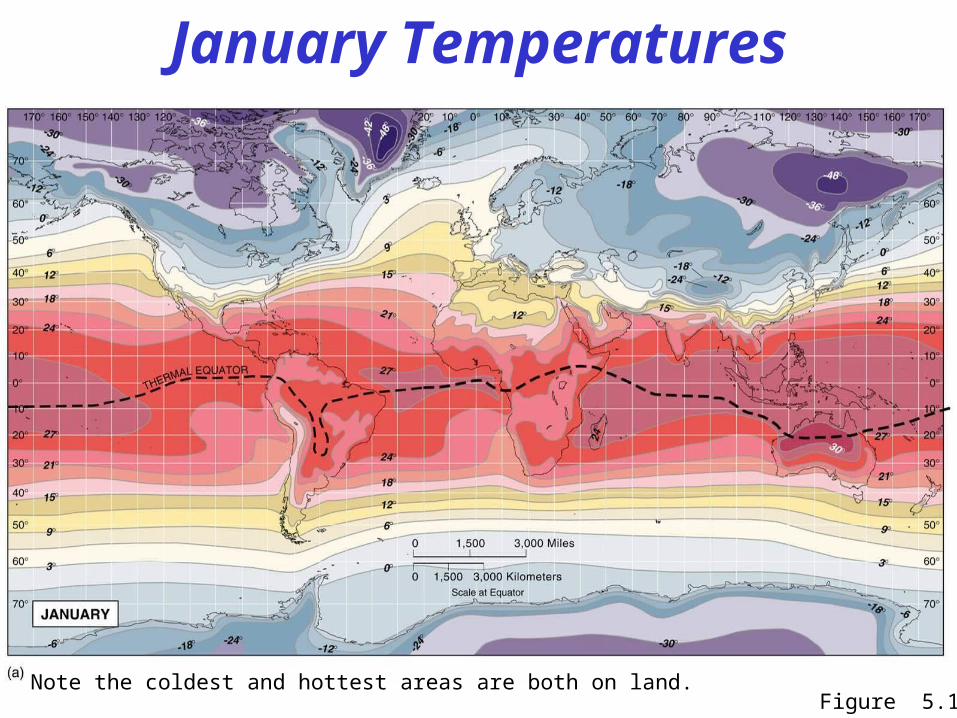
January Temperatures
Figure 5.14Note the coldest and hottest areas are both on land.
(c)
(b)
(a)
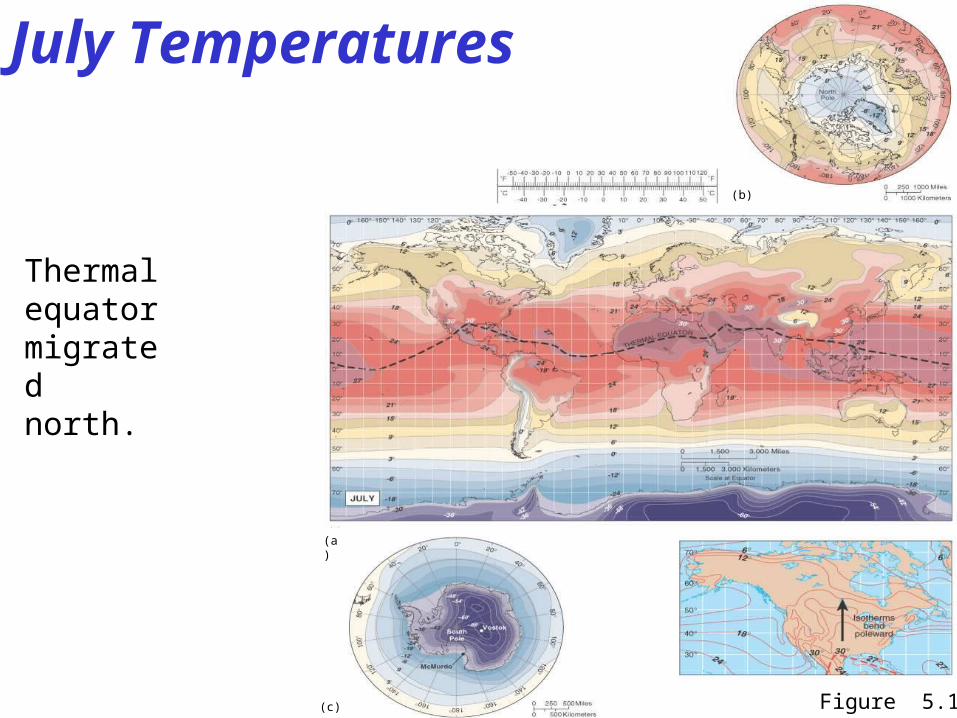
July Temperatures
Figure 5.17
Thermal equator migrated north.
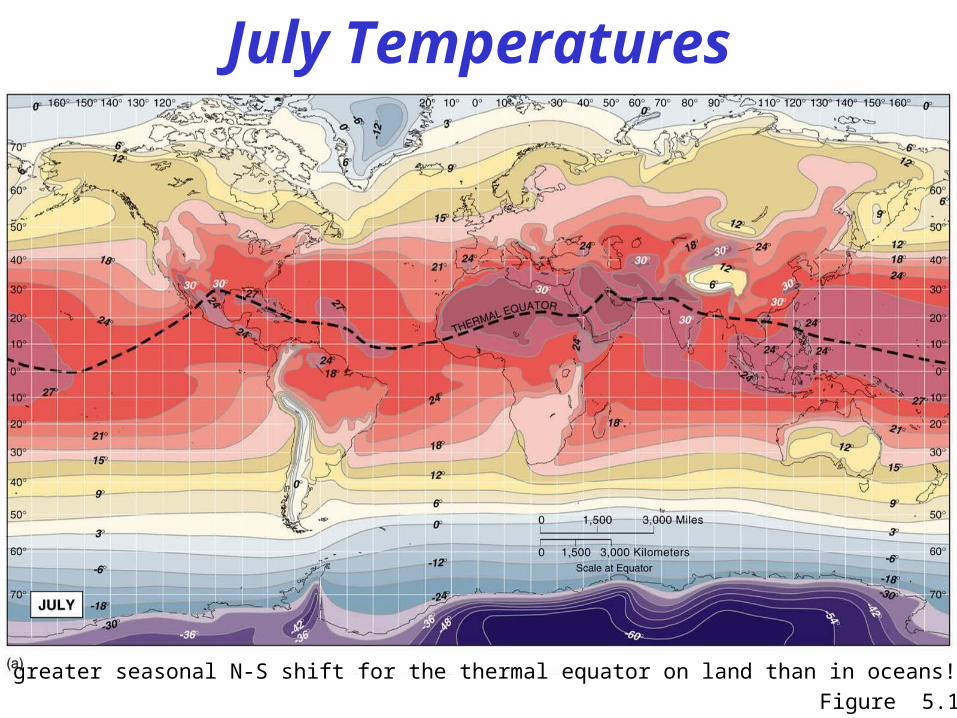
July Temperatures
Figure 5.17
There is a greater seasonal N-S shift for the thermal equator on land than in oceans! Why?
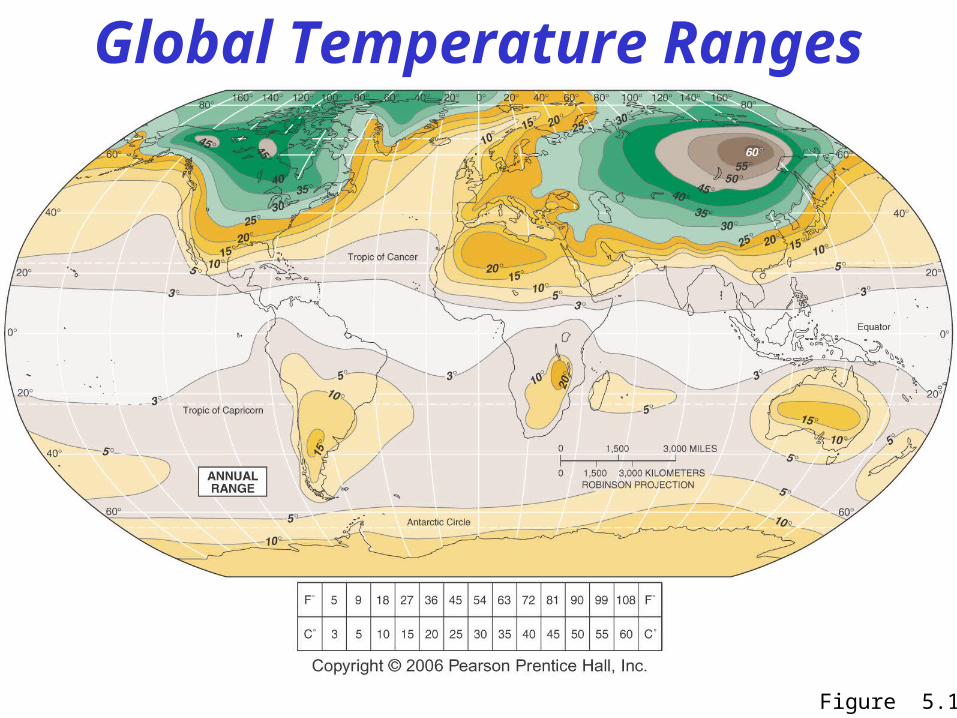
Global Temperature Ranges
Figure 5.19
Wind chillCorrelates cold and wind speed
Heat indexCorrelates heat and humidity
Air Temperature and the Human Body
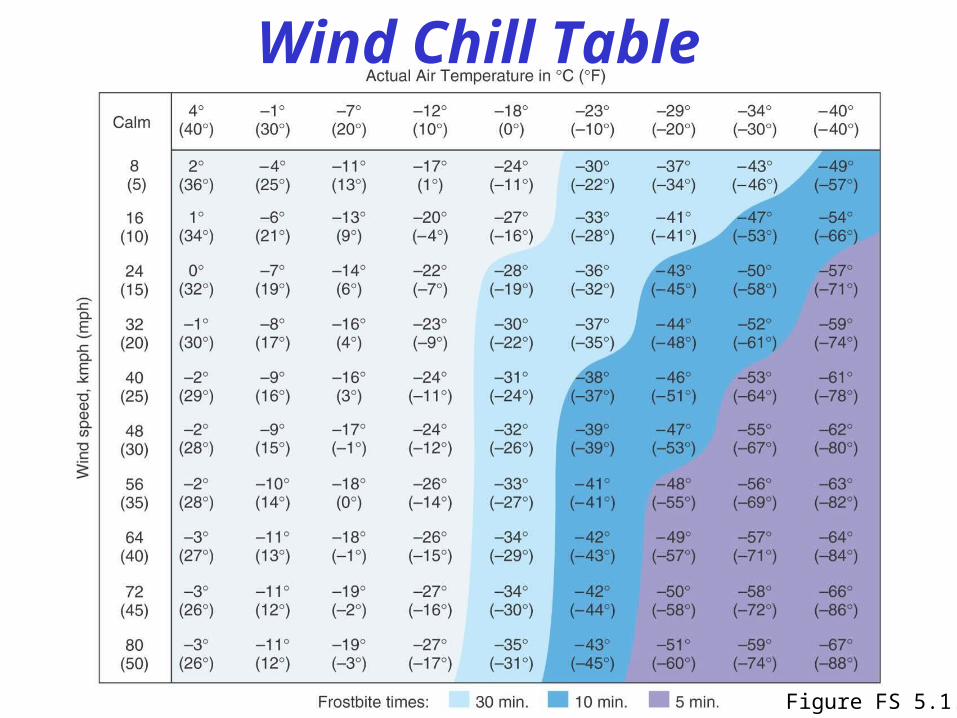
Wind Chill Table
Figure FS 5.1.1
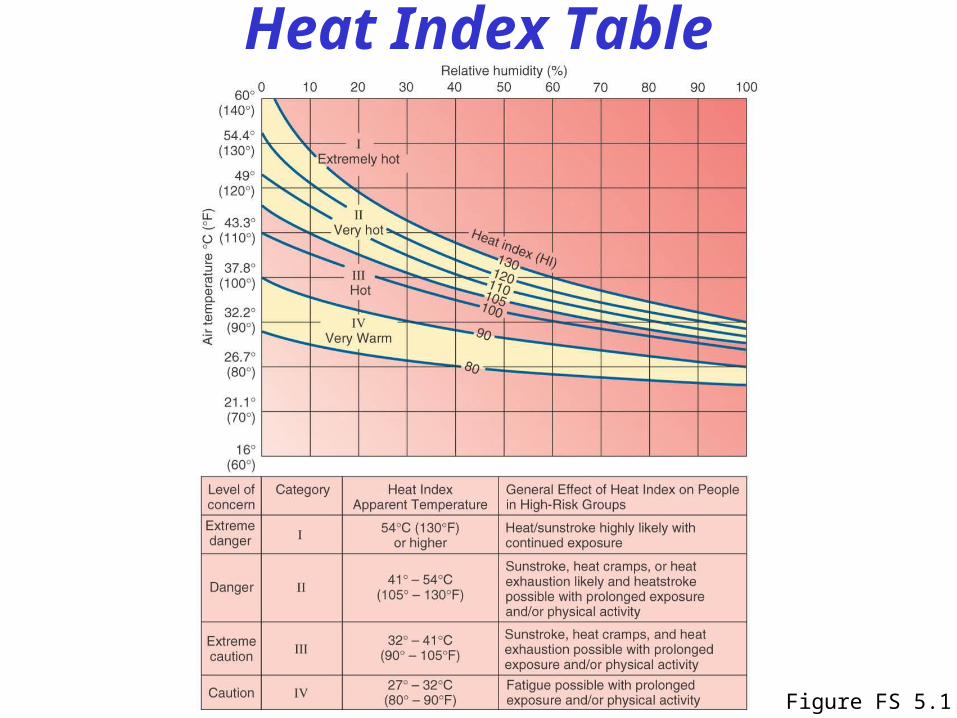
Heat Index Table
Figure FS 5.1.2