Embed Size (px)
Citation preview

Robert Osada, Tom FunkhouserBernard Chazelle, and David
DobkinPrinceton University
Matching 3D Models With Shape Distributions

Shape Similarity Determine similarity between 3D
shapes
ComputerGraphics
ComputerVision
Computational Biology
[Caltech][Insulin, PDB]

Previous Work in 2D Shape representations
Fourier analysis [Arbter90] Turning function [Arkin91] Size function [Uras95]
Metrics for comparing curves Hausdorff Fréchet Bottleneck etc.

Previous Work in 3D High-level representations
Generalized cylinders [Binford71] Medial axis [Bardinet00] Skeletons [Bloomenthal99]
Statistical Moments [Reeves45, Prokop92] Crease angle [Besl94] Shells decomposition around centroid
[Ankerst99] Extended Gaussian Images [Horn84] etc.

Desired Properties Match global properties of shape Invariance
Rotation, translation, scale, mirror Robustness
Noise, cracks, insertions and deletions Practicality
Concise representation Efficient comparison Working with degenerate models

Our Approach Shape distributions
Concise shape descriptor Common parameterization Function of random points
3D Model ShapeDistribution
Parameterization
Random sampling

Our Approach
SimilarityMeasure
Parameterization
Parameterization
3DModel
ShapeDistribution
ShapeFunction

Issues Which shape function? How to compare shape distributions?
Parameterization
Parameterization
SimilarityMeasure

Issues Which shape function? How to compare shape distributions?
Parameterization
Parameterization
SimilarityMeasure

Which Shape Function? Computationally simple options (~
1s) Based on random points Angles, distances, areas, volumes
A3 D1
D2 D3
[Ankerst99]
D4

Shape Function – D2 Distance between
two random points on surface Line Segment Circle
Triangle Cube
Cylinder Sphere
Two adjacent spheres
Two spheres moving apart

Which Shape Function? Sneak preview

Shape Function – Key Questions Invariant?
Rotation, translation, mirror (not scale)
Robust? Noise, cracks, insertions and deletions
Descriptive?

Issues Which shape function? How to compare shape
distributions?
Parameterization
Parameterization
SimilarityMeasure
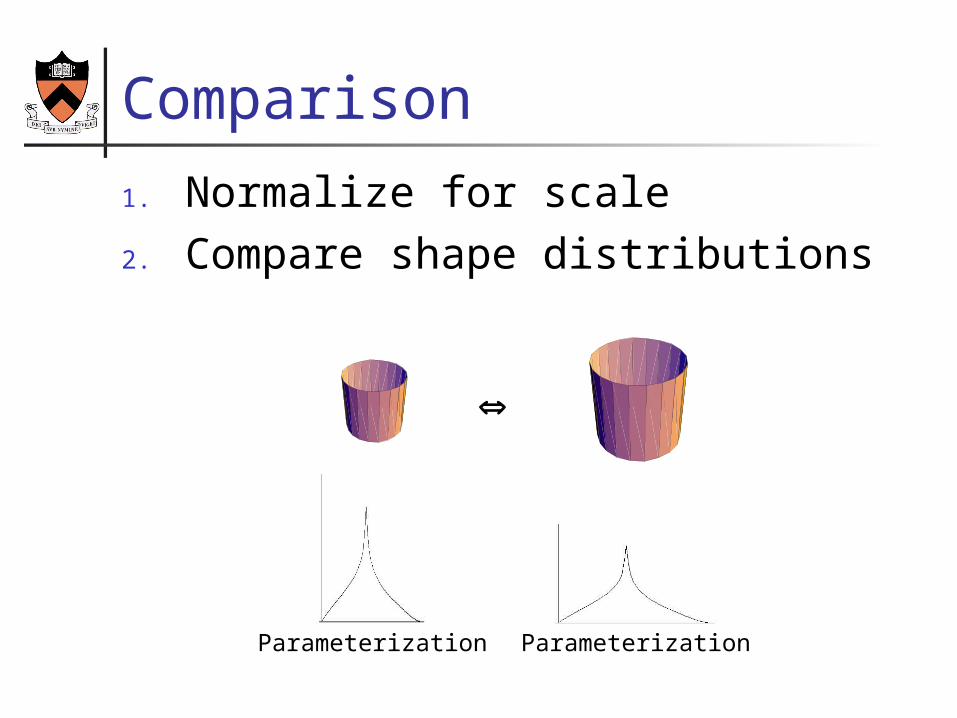
Comparison
1. Normalize for scale2. Compare shape distributions
Parameterization Parameterization

Normalization for Scale
max mean search

Compare shape distributions Computationally simple options
(~ .1ms) Ln norms of densities (PDF) or
cumulative densities (CDF) More complex options
Earth mover’s distance, Bhattacharyaa distance.
PDF CDF

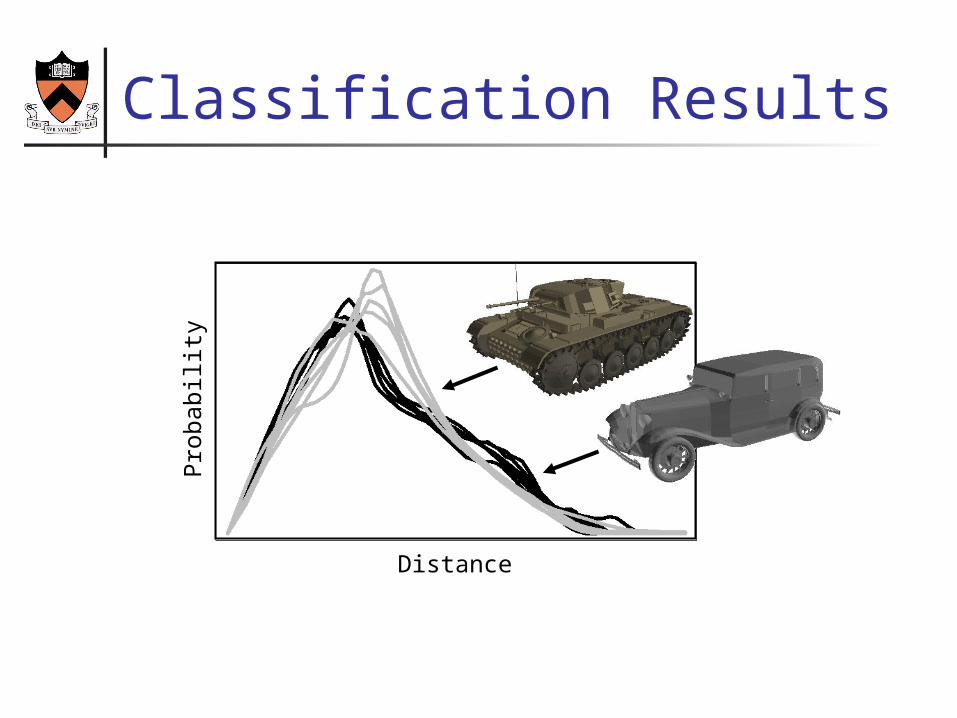
Experimental Results Goal is to address the following:
Is the method robust? How well does it classify?
Shape Function
Normalization
Comparison
• • •A3 D1 D2
D3 D4Max Mean
SearchPDF L1 L2 L
CDF L1 L2 L

Robustness Experiment 10 Models
Car Chair Human Missile Mug
Phone Plane Skateboard Sub Table

Robustness Experiment 6 Transforms
Rotate, scale, mirror, noise, delete, insert
Total of 70 models
1% Noise 5% Deletion

Robustness Results Resulting distributions stable
7 Mugs
Distance
Pro
babili
ty
7 Missiles

Classification Experiment 133 Models
categorized into25 Groups
Large variety within a group among groups
4 Mugs
6 Cars
3 Boats

Classification Results
4 Balls5 Animals 2 Belts 3 Blimps 3 Boats
6 Cars 8 Chairs 3 Claws 4 Helicopters11
Humans
3 Lamps 3 Lightnings6
Missiles 4 Mugs4
Openbooks
Classification Results
Distance
Pro
babili
ty

4 Balls5 Animals 2 Belts 3 Blimps 3 Boats
6 Cars 8 Chairs 3 Claws 4 Helicopters11
Humans
3 Lamps 3 Lightnings6
Missiles 4 Mugs4
Openbooks
Classification Results
Line Segment Circle
Triangle Cube
Cylinder Sphere
Two adjacent spheres
Two spheres moving apart

NearestNeighbor1st
Tier2nd
Tier
Classification Results Avoid bias due to varying group sizes
Query
…
Resu
lts

an ba be bl bo car chair cl he human la li mis mug op pen ph plane ri sk so sp sub ta tank
animal
ball
beltblimp
boat
car
chair
claw
helicopter
human
lamp
lightning
missle
mug
openbook
pen
phone
plane
rifle
skateboard
sofa
spaceship
sub
table
tank
an ba be bl bo car chair cl he human la li mis mug op pen ph plane ri sk so sp sub ta tank
animal
ball
beltblimp
boat
car
chair
claw
helicopter
human
lamp
lightning
missle
mug
openbook
pen
phone
plane
rifle
skateboard
sofa
spaceship
sub
table
tank
Similarity matrix Nearest Neighbor 1st Tier 2nd Tier
Blocks Tanks Mugs Humans Airplanes Boats
Classification Results

Classification Results
ShapeFunction
FirstTier
SecondTier
Nearest Neighbor
A3 38% 54% 55%
D1 35% 48% 56%
D2 49% 66% 66%
D3 42% 58% 58%
D4 32% 42% 47%
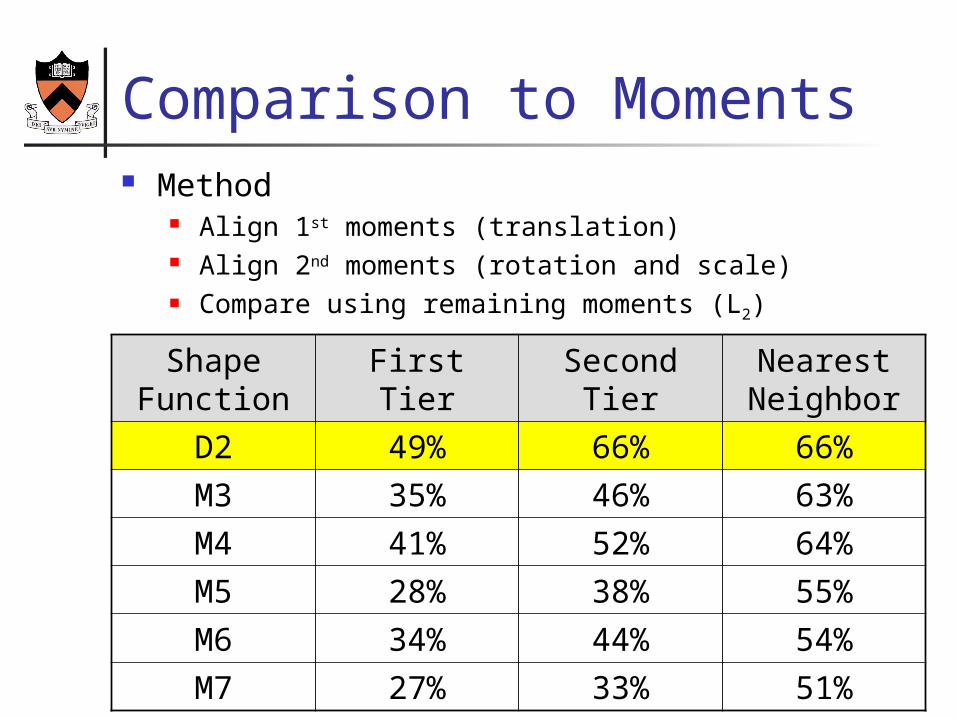
Comparison to Moments Method
Align 1st moments (translation) Align 2nd moments (rotation and scale) Compare using remaining moments (L2)
ShapeFunction
FirstTier
SecondTier
NearestNeighbor
D2 49% 66% 66%
M3 35% 46% 63%
M4 41% 52% 64%
M5 28% 38% 55%
M6 34% 44% 54%
M7 27% 33% 51%

Conclusion – Properties Match global properties of shape Invariance
Rotation, translation, scale, mirror Robustness
Noise, cracks, insertions and deletions Practicality
Concise representation Efficient comparison Works for degenerate models

Conclusion – Key Ideas
Sampling gives common parameterization Simplifies comparison
Comparing distributions is fast and easy Avoids registration, correspondence, etc.
Simple shape functions are discriminating Method suitable as preclassifier

Future Work Use a larger and more controlled
database Combine shape distributions with
other classifiers into a working shape-based retrieval system

Thank you Sloan
Foundation NSF


![· near-linear space) algorithms by Welzl [20], Chazelle and Welzl [9], Matoušek and Welzl [ 19], and Chazelle et al. [8]. This culminated in a solution by Matoušek [17], which](https://img.pdfslide.us/doc/110x75/5f0914a67e708231d425238c/mountpapersdcg12-lower-boundpdf-near-linear-space-algorithms-by-welzl-20.jpg)


![Subdivision Primer CS426, 2000 Robert Osada [DeRose 2000]](https://img.pdfslide.us/doc/110x75/56649d5e5503460f94a3d3f6/subdivision-primer-cs426-2000-robert-osada-derose-2000.jpg)