Embed Size (px)
Citation preview
7/23/2019 Robert Coyle
http://slidepdf.com/reader/full/robert-coyle 1/91
National College of Ireland
Higher Diploma in Science in Data Analytics
2013/2014
Robert Coyle
X13109278
The Use of Twitter Activity as a Stock Market
Predictor
7/23/2019 Robert Coyle
http://slidepdf.com/reader/full/robert-coyle 2/91
The Use of Twitter Activity as a Stock Market Predictor 2
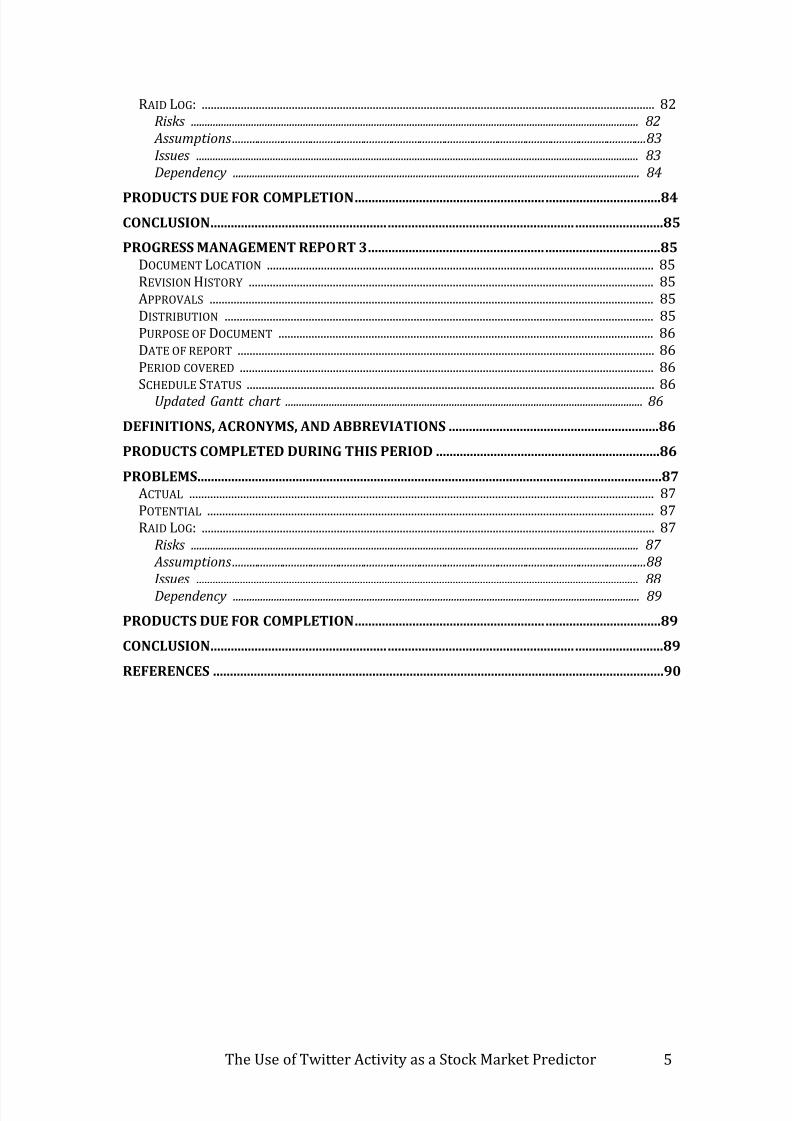
Table of Contents
ABSTRACT ........................................................................................................................................... 6
DEFINITIONS, ACRONYMS, AND ABBREVIATIONS ................................................................ 6
INTRODUCTION ................................................................................................................................. 7
RELATED WORK ................................................................................................................................ 8
SYSTEMS AND DATASETS .............................................................................................................. 8 DESIGN AND ARCHITECTURE ......................................................................................................................... 8
Brief description of work carried out .................................................................................................... 8 DATASETS .......................................................................................................................................................... 8
Gathering of Twitter Data. ......................................................................................................................... 9
Gathering of Stock Price Data ................................................................................................................ 15 Data Preparation ......................................................................................................................................... 16
REQUIREMENTS ............................................................................................................................................. 17 Data requirements ....................................................................................................................................... 17 User requirements ............... ................ ................ ................ ............... ................. ............... ................ .......... 17 Usability requirements............................................................................................................................... 17 Functional Requirements ......................................................................................................................... 17
TESTING AND EVALUATION ........................................................................................................19 SYSTEMS TESTING. ........................................................................................................................................ 19
Apple Stock ...................................................................................................................................................... 19 Microsoft Stock .............................................................................................................................................. 25
Tesla Stock .............. ................ ................ ................ ............... ................ ................ ................. ............... .......... 33 FORMULA FOR PREDICTING STOCK MOVEMENT ..................................................................................... 36
Formula Used ................................................................................................................................................. 36 Apple Stock Prediction ............................................................................................................................... 36 Microsoft Stock Prediction ....................................................................................................................... 40 Tesla Stock Prediction ................................................................................................................................ 43
CONCLUSION .....................................................................................................................................46
FURTHER DEVELOPMENT ...........................................................................................................47
BIBLIOGRAPHY ................................................................................................................................48
APPENDIX ..........................................................................................................................................48 Project Materials: ......................................................................................................................................... 48
PROJECT PROPOSAL ......................................................................................................................49 INTRODUCTION .............................................................................................................................................. 49 BACKGROUND ................................................................................................................................................ 49 TECHNICAL APPROACH ................................................................................................................................ 50 SPECIAL RESOURCES REQUIRED ................................................................................................................. 50 PROJECT PLAN ............................................................................................................................................... 51 TECHNICAL DETAILS .................................................................................................................................... 51 SYSTEMS/DATASETS .................................................................................................................................... 51 EVALUATION/TEST AND ANALYSIS ........................................................................................................... 51 CONSULTATION WITH SPECIALIZATION PERSONS................................................................................... 52
REQUIRMENTS SPECIFICATION .................................................................................................53
7/23/2019 Robert Coyle
http://slidepdf.com/reader/full/robert-coyle 3/91
The Use of Twitter Activity as a Stock Market Predictor 3
DOCUMENT CONTROL .................................................................................................................................. 53 REVISION HISTORY ....................................................................................................................................... 53 DISTRIBUTION LIST ...................................................................................................................................... 53 RELATED DOCUMENTS ................................................................................................................................. 53 1 INTRODUCTION .......................................................................................................................................... 54
1.1 PURPOSE .................................................................................................................................................. 54 1.2 PROJECT SCOPE ...................................................................................................................................... 54 1.2.1 In Scope .................................................................................................................................................. 54 1.2.2 Out of Scope ......................................................................................................................................... 55
1.3 DOCUMENT SCOPE ................................................................................................................................. 55 1.4 DEFINITIONS, ACRONYMS, AND ABBREVIATIONS ............................................................................. 55
2 USER REQUIREMENTS DEFINITION ......................................................................................55 2.1 USER CHARACTERISTICS ....................................................................................................................... 55
3 REQUIREMENTS SPECIFICATION ...........................................................................................56 3.1 FUNCTIONAL REQUIREMENTS ............................................................................................................. 56 3.1.1 USE CASE DIAGRAM – OVERALL FUNCTIONAL REQUIREMENTS ................... .................... ......... 57
3.1.2 REQUIREMENT 1: ACQUIRE DATA 1 AND 2 ................................................................................... 57 3.1.2.1 Description & Priority ................................................................................................................. 57 3.1.2.2 Use Case.............................................................................................................................................. 58 Scope .................................................................................................................................................................. 58 Description ...................................................................................................................................................... 58 Use Case Diagram ........................................................................................................................................ 58 Flow Description ........................................................................................................................................... 58
3.1.3 REQUIREMENT 2: CLEAN DATA 1 AND 2 ....................................................................................... 60 3.1.3.1 Description & Priority ................................................................................................................. 60 3.1.3.2 Use Case.............................................................................................................................................. 60 Scope .................................................................................................................................................................. 60 Description ...................................................................................................................................................... 60 Use Case Diagram ........................................................................................................................................ 61 Flow Description ........................................................................................................................................... 61
3.1.4 REQUIREMENT 2: ANALYZE DATA .................................................................................................. 63 3.1.4.1 Description & Priority ................................................................................................................. 63 3.1.4.2 Use Case.............................................................................................................................................. 63 Scope .................................................................................................................................................................. 63 Description ...................................................................................................................................................... 63 Use Case Diagram ........................................................................................................................................ 64 Flow Description ........................................................................................................................................... 64
3.1.5 REQUIREMENT 2: PUBLISH DATA ................................................................................................... 65 3.1.5.1 Description & Priority ................................................................................................................. 65
3.1.5.2 Use Case.............................................................................................................................................. 66 Scope .................................................................................................................................................................. 66 Description ...................................................................................................................................................... 66 Use Case Diagram ........................................................................................................................................ 66 Flow Description ........................................................................................................................................... 67
3.2 NON-FUNCTIONAL REQUIREMENTS ................................................................................................... 68 3.2.1 Availability: Must Have .................................................................................................................. 68 3.2.2 Storage Requirements: Must Have ............................................................................................ 68 3.2.3 Connection Reliability: Must Have ............................................................................................ 68 3.2.4 Connection Speed: Must Have ..................................................................................................... 68 3.2.5 Backup and Recovery: Must Have ............................................................................................. 68 3.2.6 Program to clean data: Must Have ........................................................................................... 68 3.2.7 Software Analysis tools: Must Have .......................................................................................... 68 3.2.8 Communication Requirements: Must Have ........................................................................... 69
7/23/2019 Robert Coyle
http://slidepdf.com/reader/full/robert-coyle 4/91
The Use of Twitter Activity as a Stock Market Predictor 4
3.2.9 Security: Must Have ......................................................................................................................... 69 3.2.9 Data Validation: Must Have ......................................................................................................... 69
5 INTERFACE REQUIREMENTS ...................................................................................................69 5.1 GUI ........................................................................................................................................................... 69
An example of a analysis of tweets. ...................................................................................................... 69
Examples of tweets analyzed on Microsoft Excel and Geo Flow ............................................. 69 Analysis of tweets using R language .................................................................................................... 71 Example of Excel Data for intro to Regression. .............................................................................. 71 Example of analysis completed on R Studio. .................................................................................... 72
6 ANALYSIS EVOLUTION ...............................................................................................................72
PROGRESS MANAGEMENT REPORT 1 ......................................................................................73 DOCUMENT LOCATION ................................................................................................................................. 73 REVISION HISTORY ....................................................................................................................................... 73 APPROVALS .................................................................................................................................................... 73 DISTRIBUTION ............................................................................................................................................... 73 PURPOSE OF DOCUMENT ............................................................................................................................. 74 DATE OF REPORT ........................................................................................................................................... 74 PERIOD COVERED .......................................................................................................................................... 74 SCHEDULE STATUS ........................................................................................................................................ 74
Updated Gantt chart ................................................................................................................................... 74
DEFINITIONS, ACRONYMS, AND ABBREVIATIONS ..............................................................74
PRODUCTS COMPLETED DURING THIS PERIOD ..................................................................75
PROBLEMS.........................................................................................................................................75 ACTUAL ........................................................................................................................................................... 75 POTENTIAL ..................................................................................................................................................... 75 RAID LOG: ....................................................................................................................................................... 76
Risks .................................................................................................................................................................... 76 Assumptions .................................................................................................................................................... 77 Issues .................................................................................................................................................................. 77 Dependency ..................................................................................................................................................... 77
PRODUCTS DUE FOR COMPLETION ..........................................................................................77 PROJECT ISSUES STATUES ............................................................................................................................ 78
CONCLUSION .....................................................................................................................................78
PROGRESS MANAGEMENT REPORT 2 ......................................................................................79 DOCUMENT LOCATION ................................................................................................................................. 79 REVISION HISTORY ....................................................................................................................................... 79
APPROVALS .................................................................................................................................................... 79 DISTRIBUTION ............................................................................................................................................... 79 PURPOSE OF DOCUMENT ............................................................................................................................. 80 DATE OF REPORT ........................................................................................................................................... 80 PERIOD COVERED .......................................................................................................................................... 80 SCHEDULE STATUS ........................................................................................................................................ 80
Updated Gantt chart ................................................................................................................................... 80
DEFINITIONS, ACRONYMS, AND ABBREVIATIONS ..............................................................80
PRODUCTS COMPLETED DURING THIS PERIOD ..................................................................81
PROBLEMS.........................................................................................................................................81
ACTUAL ........................................................................................................................................................... 81 POTENTIAL ..................................................................................................................................................... 81
7/23/2019 Robert Coyle
http://slidepdf.com/reader/full/robert-coyle 5/91
The Use of Twitter Activity as a Stock Market Predictor 5
RAID LOG: ....................................................................................................................................................... 82 Risks .................................................................................................................................................................... 82 Assumptions .................................................................................................................................................... 83 Issues .................................................................................................................................................................. 83 Dependency ..................................................................................................................................................... 84
PRODUCTS DUE FOR COMPLETION ..........................................................................................84 CONCLUSION .....................................................................................................................................85
PROGRESS MANAGEMENT REPORT 3 ......................................................................................85 DOCUMENT LOCATION ................................................................................................................................. 85 REVISION HISTORY ....................................................................................................................................... 85 APPROVALS .................................................................................................................................................... 85 DISTRIBUTION ............................................................................................................................................... 85 PURPOSE OF DOCUMENT ............................................................................................................................. 86 DATE OF REPORT ........................................................................................................................................... 86 PERIOD COVERED .......................................................................................................................................... 86 SCHEDULE STATUS ........................................................................................................................................ 86
Updated Gantt chart ................................................................................................................................... 86
DEFINITIONS, ACRONYMS, AND ABBREVIATIONS ..............................................................86
PRODUCTS COMPLETED DURING THIS PERIOD ..................................................................86
PROBLEMS.........................................................................................................................................87 ACTUAL ........................................................................................................................................................... 87 POTENTIAL ..................................................................................................................................................... 87 RAID LOG: ....................................................................................................................................................... 87
Risks .................................................................................................................................................................... 87 Assumptions .................................................................................................................................................... 88 Issues .................................................................................................................................................................. 88 Dependency ..................................................................................................................................................... 89
PRODUCTS DUE FOR COMPLETION ..........................................................................................89
CONCLUSION .....................................................................................................................................89
REFERENCES .....................................................................................................................................90
7/23/2019 Robert Coyle
http://slidepdf.com/reader/full/robert-coyle 6/91
The Use of Twitter Activity as a Stock Market Predictor 6
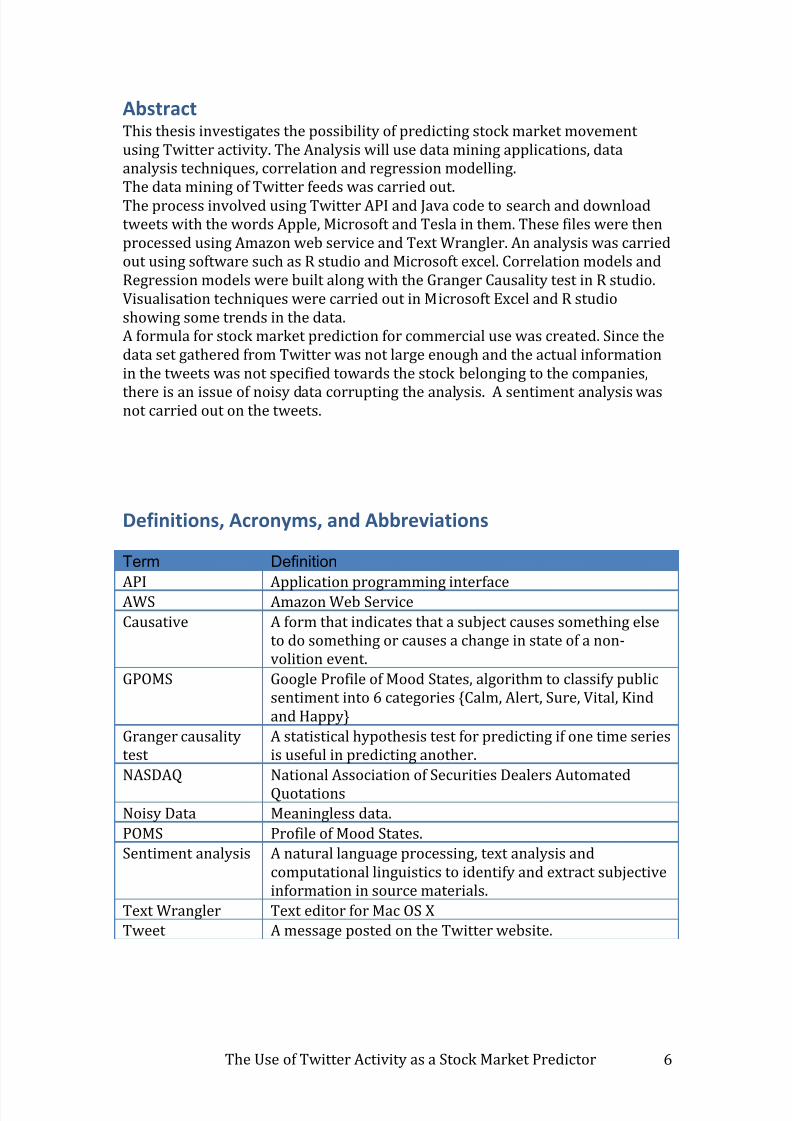
AbstractThis thesis investigates the possibility of predicting stock market movementusing Twitter activity. The Analysis will use data mining applications, dataanalysis techniques, correlation and regression modelling.The data mining of Twitter feeds was carried out.The process involved using Twitter API and Java code to search and downloadtweets with the words Apple, Microsoft and Tesla in them. These files were thenprocessed using Amazon web service and Text Wrangler. An analysis was carriedout using software such as R studio and Microsoft excel. Correlation models andRegression models were built along with the Granger Causality test in R studio.Visualisation techniques were carried out in Microsoft Excel and R studioshowing some trends in the data.A formula for stock market prediction for commercial use was created. Since thedata set gathered from Twitter was not large enough and the actual informationin the tweets was not specified towards the stock belonging to the companies,
there is an issue of noisy data corrupting the analysis. A sentiment analysis wasnot carried out on the tweets.
Definitions, Acronyms, and Abbreviations
Term Definition
API Application programming interfaceAWS Amazon Web Service
Causative A form that indicates that a subject causes something elseto do something or causes a change in state of a non-volition event.
GPOMS Google Profile of Mood States, algorithm to classify publicsentiment into 6 categories {Calm, Alert, Sure, Vital, Kindand Happy}
Granger causalitytest
A statistical hypothesis test for predicting if one time seriesis useful in predicting another.
NASDAQ National Association of Securities Dealers AutomatedQuotations
Noisy Data Meaningless data.
POMS Profile of Mood States.
Sentiment analysis A natural language processing, text analysis andcomputational linguistics to identify and extract subjectiveinformation in source materials.
Text Wrangler Text editor for Mac OS X
Tweet A message posted on the Twitter website.
7/23/2019 Robert Coyle
http://slidepdf.com/reader/full/robert-coyle 7/91
The Use of Twitter Activity as a Stock Market Predictor 7
Introduction
The stock market is an essential way for companies to raise money.
Companies can raise additional financial capital by being publicly traded in orderto expand their business by selling shares of ownership.Historically it is known that share prices can have a major influence on economicactivities and can be an indicator of social mood.The stock market movements has always been a rich and interesting subject withsuch many factors to be analysed that for a long time it would be consideredunpredictable.The application of new computerized mathematical methods over the past fewdecades developed by companies such as Merrill Lynch and other financialmanagement companies have created models that can maximize their returns
while minimizing their risks.
Stock market prediction has been around for years but it has been giving a newmethod of prediction thanks to the rise of social media.The objective of this project is to analyse Twitter feeds for activities and trendsassociated with a brand and to see how their stock market shares are related andif they are affected to the twitter activity.
This analysis will look at the relationship of the amount of tweets for threespecific brands on the NASDAQ, Apple, Microsoft and Tesla. The search for eachcompany’s symbols on the NASDAQ within those returned tweets would be
conducted as an additional exploration of stock conversation on Twitter.These brands where chosen since they are innovative technology companies thatare on the same stock exchange. Therefore gathering of the twitter data was nottime zone dependent.
Stock market data was collected from the Yahoo Finance website, there theyprovide historical data for the NASDAQ.Java scripts were used to acquire the tweets through Twitters API service.The Tweets for each brand were then counted using Amazon Web Service andText Wrangler.
The counted tweets were subsequently analysed using R studio werecorrelational and regression models were built and Granger Causality Test wasperformed.The Data was then visualised in Excel and R studio and the creation of a formulafor commercial use was attempted.
7/23/2019 Robert Coyle
http://slidepdf.com/reader/full/robert-coyle 8/91
The Use of Twitter Activity as a Stock Market Predictor 8
Related Work
In the previous study Stock Market Prediction Using Twitter I researched papersin relation to sentiment analysis of social media for the prediction of stockmarket movement. The social media in question was Twitter.The investigated looked at the correlation between the public mood and thestock market movement and how it can be used to predict stock market prices.The use of sentiment analysis was used to translate the tweets into moods usingalgorithms such as Google Profile of Mood States.The process of using a sentiment analysis on the tweets proved to be an accurateanalysis of the data.Analysing Twitter activity does not provide sufficient behavioural attitudestowards the investors and an accurate prediction of stock movement cannot beascertained. Sentiment analysis provides the investigation with an insight intothe public attitude. The more detailed sentiment analysis on the Twitter data
along with a reliable stock data the more superior and accurate the results.Twitter activity along might not give the insight the stockbroker needs to makechallenging decisions in buying or selling shares.
Systems and Datasets
Design and Architecture
Brief description of work carried out
The system was designed to acquire twitter and stock market data and comparethe two data sets for a relationship.
For the Twitter data the use of JAVA script, AWS script and Text Wranglerwere used to clean the data.
The financial data was acquired from the Yahoo Finance website. The datawas downloaded in excel format then saved as a CSV file.
Then the results from the cleaned Twitter data were placed with thefinancial cleaned data in excel.
Grangers Causality implemented in R Studio to find if the Twitter time’s series was useful at forecasting the stock prices time series.
A correlation model was built to confirm the relation between the twodata types.
Then excel was used to visualizes and confirm the relation.
Datasets
There were two forms of datasets.The first dataset acquired was the Twitter feeds.Historical tweets proved to be difficult since Twitter had sold on theirinformation to external parties. These companies, such as DataSift offer analysison historical data. While this would have been beneficial to the original projectproposal the budget of the project was zero.
Twitter launched a Historical Data Grant scheme, which allowed academicstudents to send in their proposal to gain access to Twitters historical data.
7/23/2019 Robert Coyle
http://slidepdf.com/reader/full/robert-coyle 9/91
The Use of Twitter Activity as a Stock Market Predictor 9
A proposal on behalf of this project was sent into the Data Grant scheme but areply from Twitter returned far too late into the project.
Subsequently from these dates the historical stock market data was gatheredfrom Yahoo Finance.
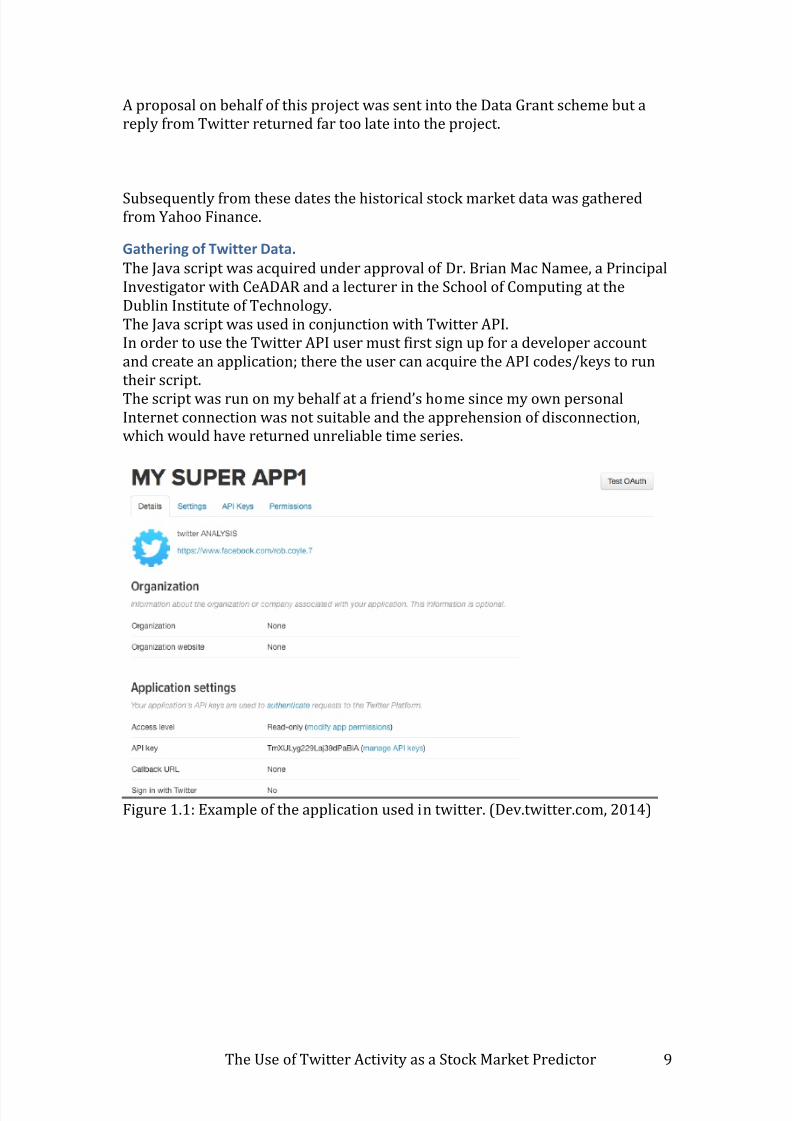
Gathering of Twitter Data.
The Java script was acquired under approval of Dr. Brian Mac Namee, a PrincipalInvestigator with CeADAR and a lecturer in the School of Computing at theDublin Institute of Technology. The Java script was used in conjunction with Twitter API.In order to use the Twitter API user must first sign up for a developer accountand create an application; there the user can acquire the API codes/keys to runtheir script.
The script was run on my behalf at a friend’s home since my own personal Internet connection was not suitable and the apprehension of disconnection,which would have returned unreliable time series.
Figure 1.1: Example of the application used in twitter. (Dev.twitter.com, 2014)
7/23/2019 Robert Coyle
http://slidepdf.com/reader/full/robert-coyle 10/91
The Use of Twitter Activity as a Stock Market Predictor 10
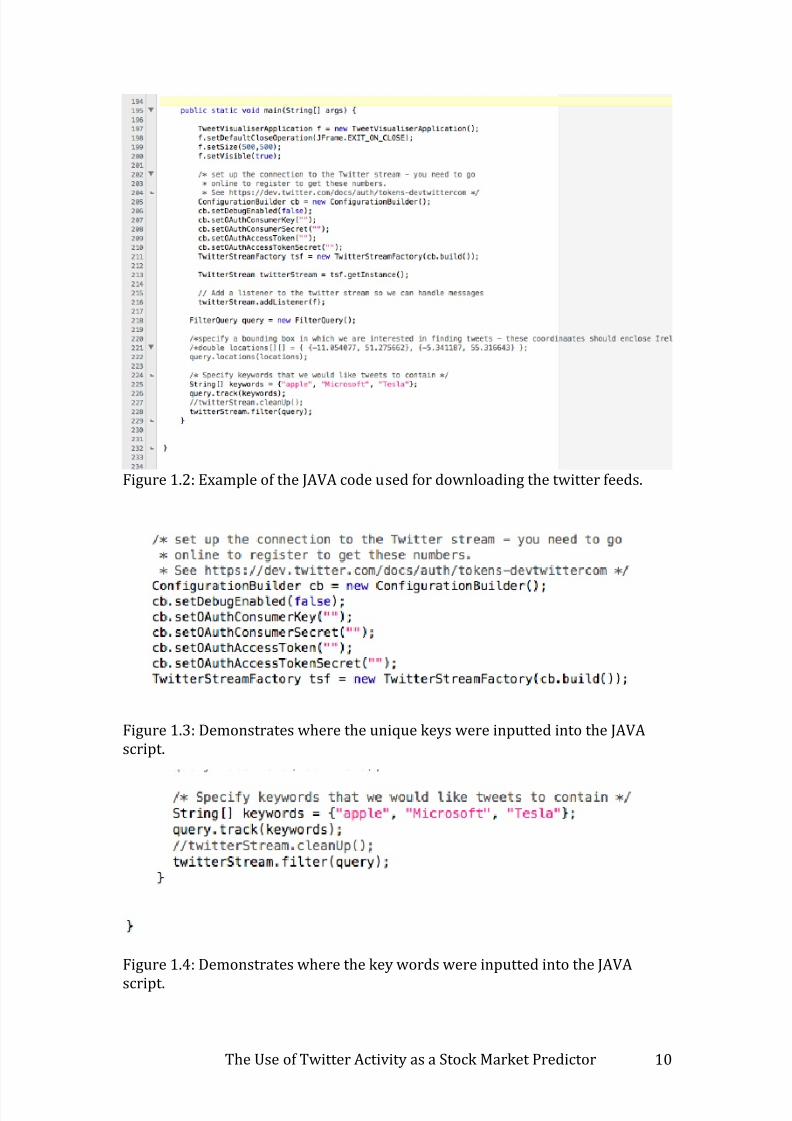
Figure 1.2: Example of the JAVA code used for downloading the twitter feeds.
Figure 1.3: Demonstrates where the unique keys were inputted into the JAVAscript.
Figure 1.4: Demonstrates where the key words were inputted into the JAVA
script.
7/23/2019 Robert Coyle
http://slidepdf.com/reader/full/robert-coyle 11/91
The Use of Twitter Activity as a Stock Market Predictor 11
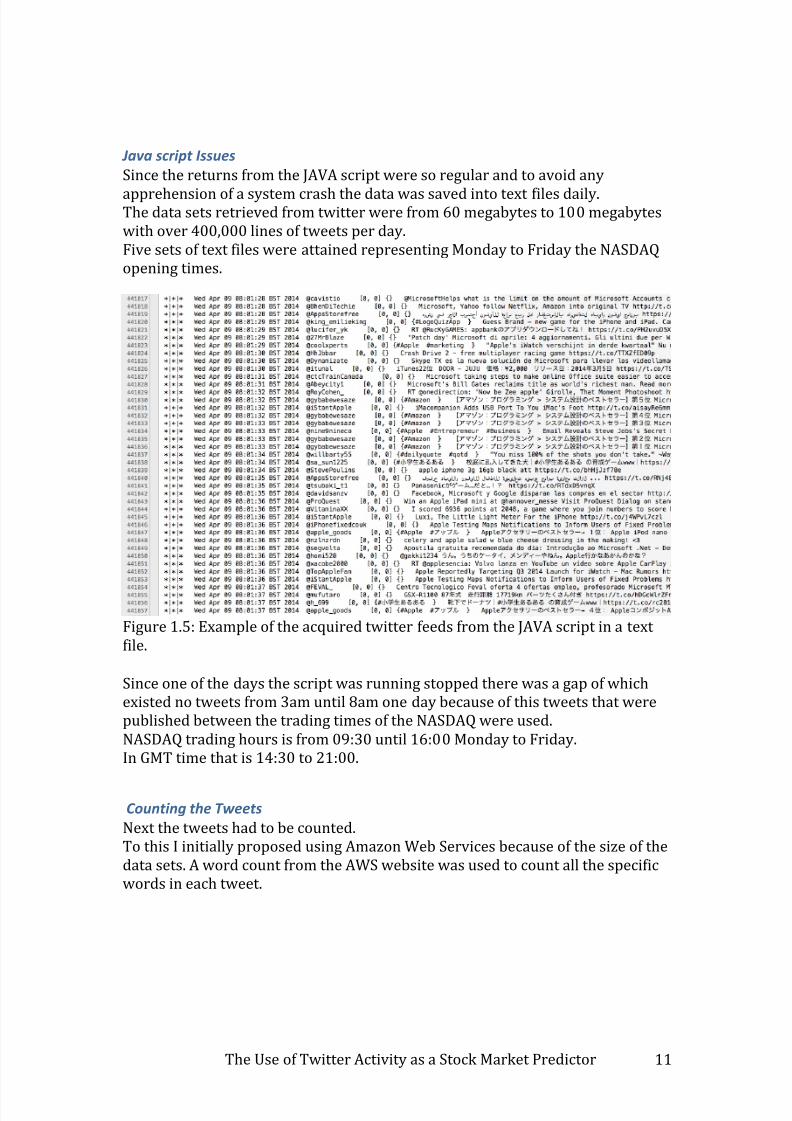
Java script Issues
Since the returns from the JAVA script were so regular and to avoid any
apprehension of a system crash the data was saved into text files daily.The data sets retrieved from twitter were from 60 megabytes to 100 megabyteswith over 400,000 lines of tweets per day.Five sets of text files were attained representing Monday to Friday the NASDAQopening times.
Figure 1.5: Example of the acquired twitter feeds from the JAVA script in a textfile.
Since one of the days the script was running stopped there was a gap of whichexisted no tweets from 3am until 8am one day because of this tweets that werepublished between the trading times of the NASDAQ were used.NASDAQ trading hours is from 09:30 until 16:00 Monday to Friday.In GMT time that is 14:30 to 21:00.
Counting the Tweets
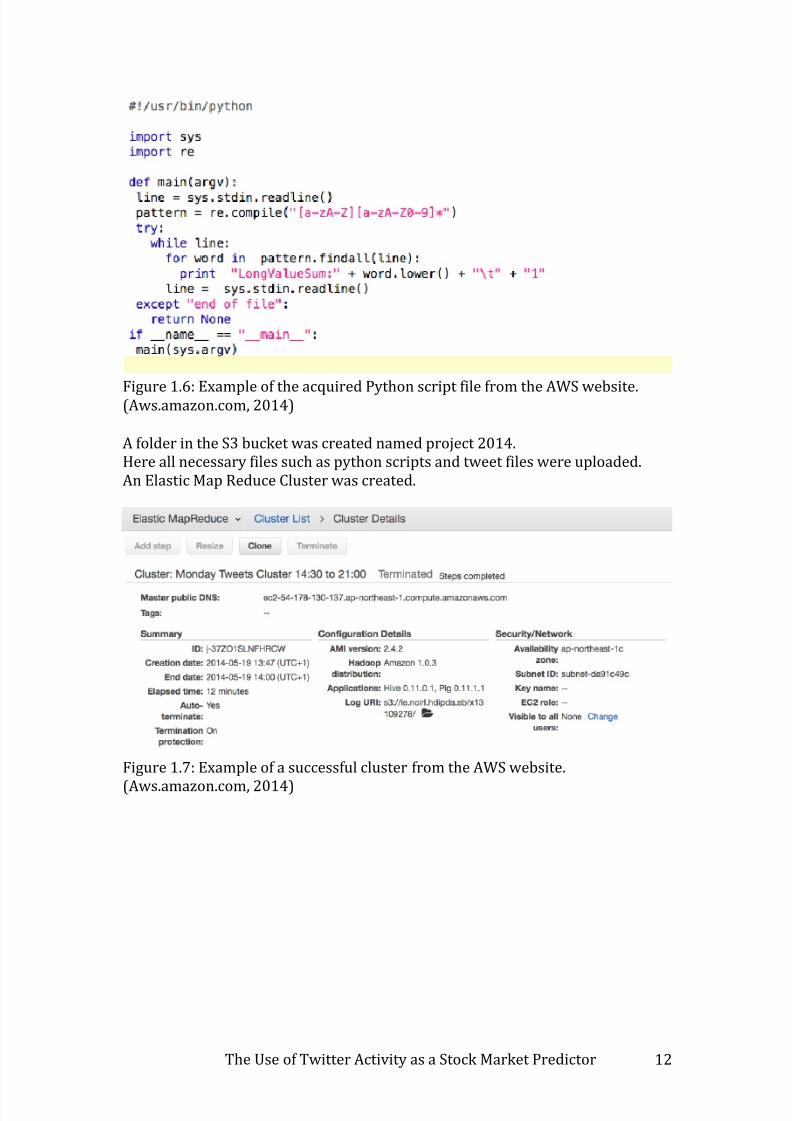
Next the tweets had to be counted.To this I initially proposed using Amazon Web Services because of the size of thedata sets. A word count from the AWS website was used to count all the specificwords in each tweet.
7/23/2019 Robert Coyle
http://slidepdf.com/reader/full/robert-coyle 12/91
The Use of Twitter Activity as a Stock Market Predictor 12
Figure 1.6: Example of the acquired Python script file from the AWS website.(Aws.amazon.com, 2014)
A folder in the S3 bucket was created named project 2014.Here all necessary files such as python scripts and tweet files were uploaded.An Elastic Map Reduce Cluster was created.
Figure 1.7: Example of a successful cluster from the AWS website.
(Aws.amazon.com, 2014)
7/23/2019 Robert Coyle
http://slidepdf.com/reader/full/robert-coyle 13/91
The Use of Twitter Activity as a Stock Market Predictor 13
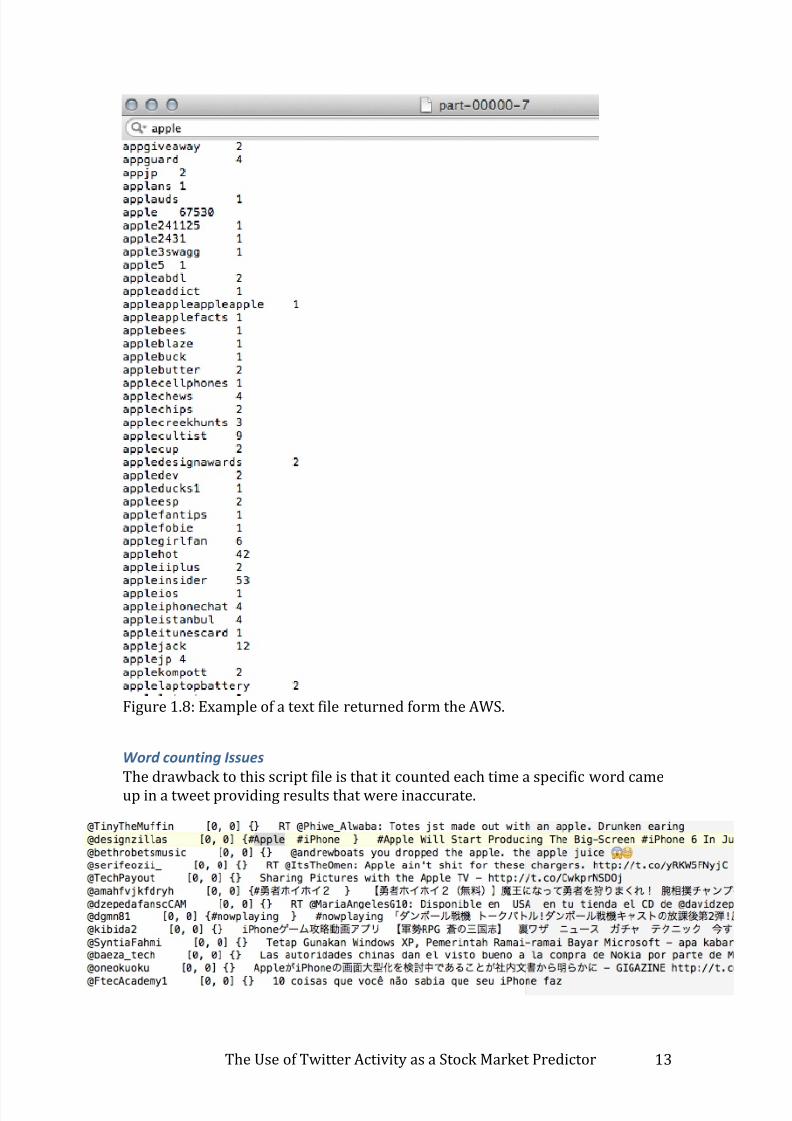
Figure 1.8: Example of a text file returned form the AWS.
Word counting Issues
The drawback to this script file is that it counted each time a specific word cameup in a tweet providing results that were inaccurate.
7/23/2019 Robert Coyle
http://slidepdf.com/reader/full/robert-coyle 14/91
The Use of Twitter Activity as a Stock Market Predictor 14
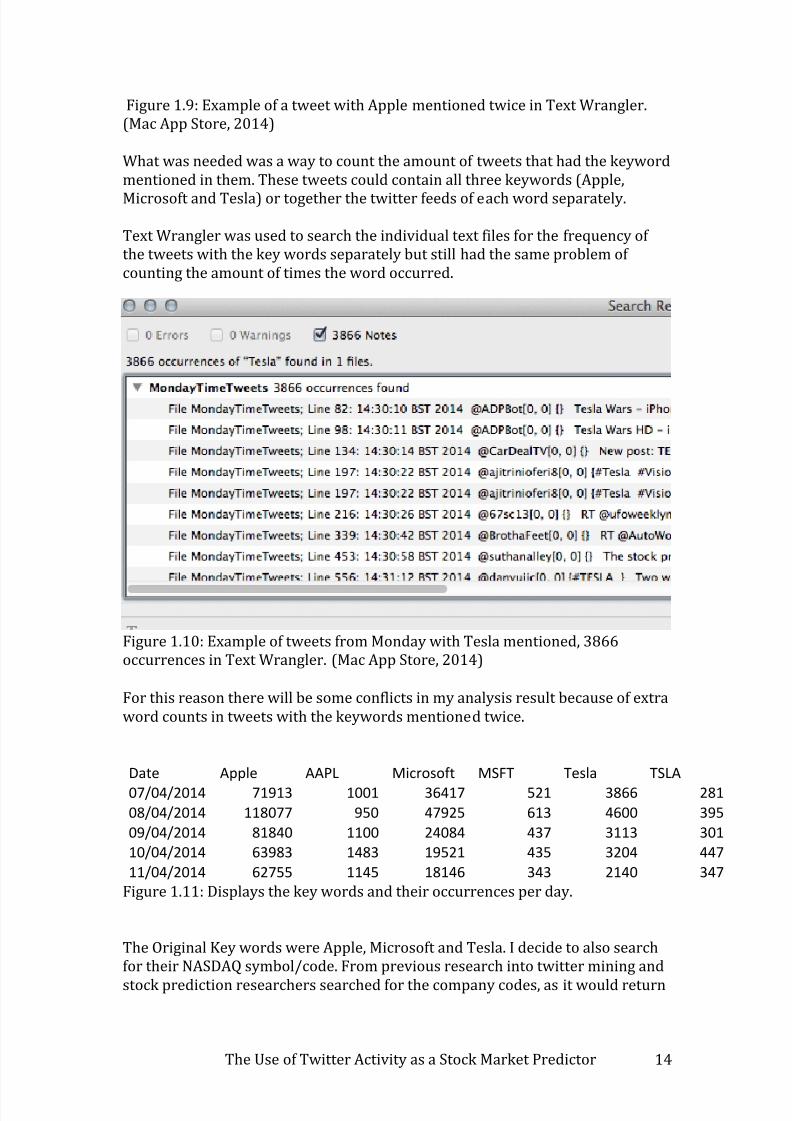
Figure 1.9: Example of a tweet with Apple mentioned twice in Text Wrangler.(Mac App Store, 2014)
What was needed was a way to count the amount of tweets that had the keywordmentioned in them. These tweets could contain all three keywords (Apple,
Microsoft and Tesla) or together the twitter feeds of each word separately.
Text Wrangler was used to search the individual text files for the frequency ofthe tweets with the key words separately but still had the same problem ofcounting the amount of times the word occurred.
Figure 1.10: Example of tweets from Monday with Tesla mentioned, 3866occurrences in Text Wrangler.
(Mac App Store, 2014)
For this reason there will be some conflicts in my analysis result because of extraword counts in tweets with the keywords mentioned twice.
Date Apple AAPL Microsoft MSFT Tesla TSLA
07/04/2014 71913 1001 36417 521 3866 281
08/04/2014 118077 950 47925 613 4600 395
09/04/2014 81840 1100 24084 437 3113 301
10/04/2014 63983 1483 19521 435 3204 447
11/04/2014 62755 1145 18146 343 2140 347
Figure 1.11: Displays the key words and their occurrences per day.
The Original Key words were Apple, Microsoft and Tesla. I decide to also searchfor their NASDAQ symbol/code. From previous research into twitter mining and
stock prediction researchers searched for the company codes, as it would return
7/23/2019 Robert Coyle
http://slidepdf.com/reader/full/robert-coyle 15/91
The Use of Twitter Activity as a Stock Market Predictor 15
more accurate tweet count where people were tweeting about the actual stock ofthe company.
Gathering of Stock Price Data
Once the twitter feeds had being gathered the financial data could bedownloaded. The historical stock prices had to be the same dates as the Twitterfeeds. The data was downloaded in excel format then saved as a CSV file for usein R for analysis.Historical data sets of stock prices can only obtained per day at the minimumfrom Yahoo Finance otherwise it would have to be streamed from directly fromthe NASDAQ website, which I did not have the access to.Ideally hourly stock prices would have worked by matching the time series withthe Twitter feeds.Data sets of stock prices were collected from the Yahoo Finance website for allthree companies.
Each set had seven columns consisting of Date, Open, High, Low, Close, Volumeand Adjusted Close.
Date is the day of trading.
Open is the opening price of the stock at the start of the days trading.
High is the highest price of the stock form that day.
Low is the lowest price of the stock from that day.
Close is the closing price of the stock at the end of the days trading.
Volume the number of shares traded that day.
Adjusted Close is the after trading hours price. The difference betweenthe open and close price.
7/23/2019 Robert Coyle
http://slidepdf.com/reader/full/robert-coyle 16/91
The Use of Twitter Activity as a Stock Market Predictor 16
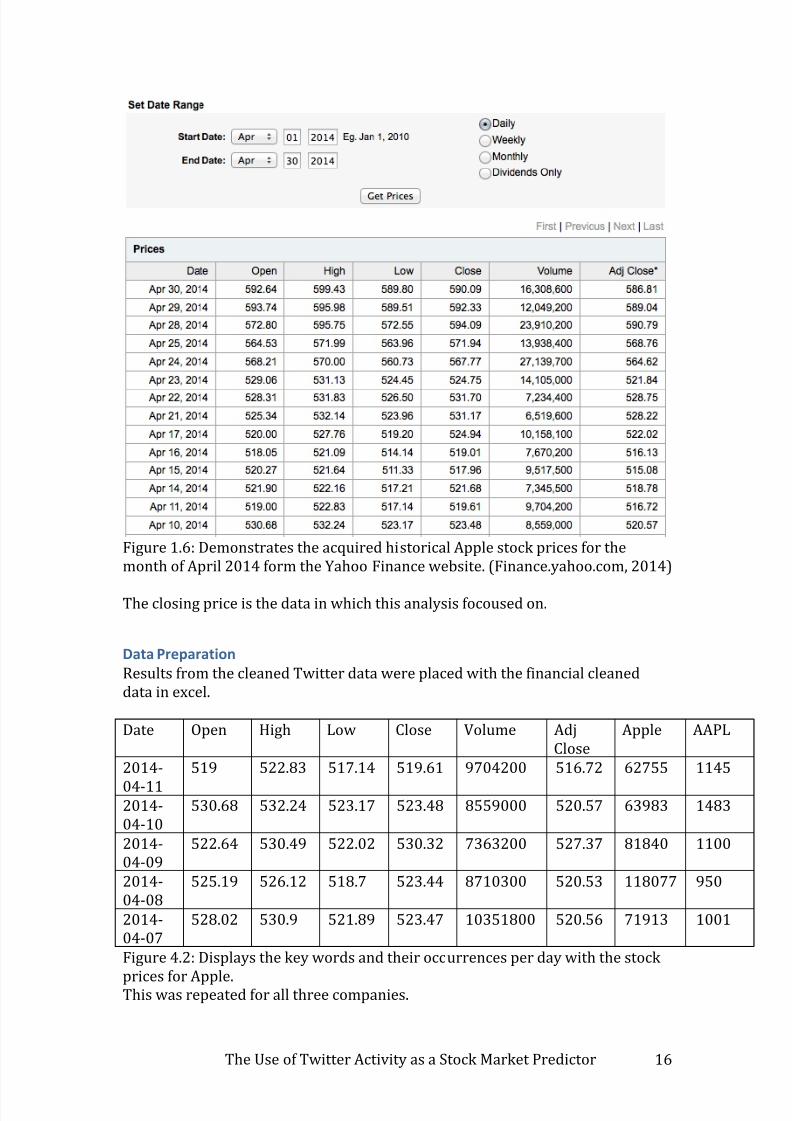
Figure 1.6: Demonstrates the acquired historical Apple stock prices for themonth of April 2014 form the Yahoo Finance website. (Finance.yahoo.com, 2014)
The closing price is the data in which this analysis focoused on.
Data Preparation
Results from the cleaned Twitter data were placed with the financial cleaneddata in excel.
Date Open High Low Close Volume AdjClose
Apple AAPL
2014-
04-11
519 522.83 517.14 519.61 9704200 516.72 62755 1145
2014-04-10
530.68 532.24 523.17 523.48 8559000 520.57 63983 1483
2014-04-09
522.64 530.49 522.02 530.32 7363200 527.37 81840 1100
2014-04-08
525.19 526.12 518.7 523.44 8710300 520.53 118077 950
2014-04-07
528.02 530.9 521.89 523.47 10351800 520.56 71913 1001
Figure 4.2: Displays the key words and their occurrences per day with the stock
prices for Apple.This was repeated for all three companies.
7/23/2019 Robert Coyle
http://slidepdf.com/reader/full/robert-coyle 17/91
The Use of Twitter Activity as a Stock Market Predictor 17
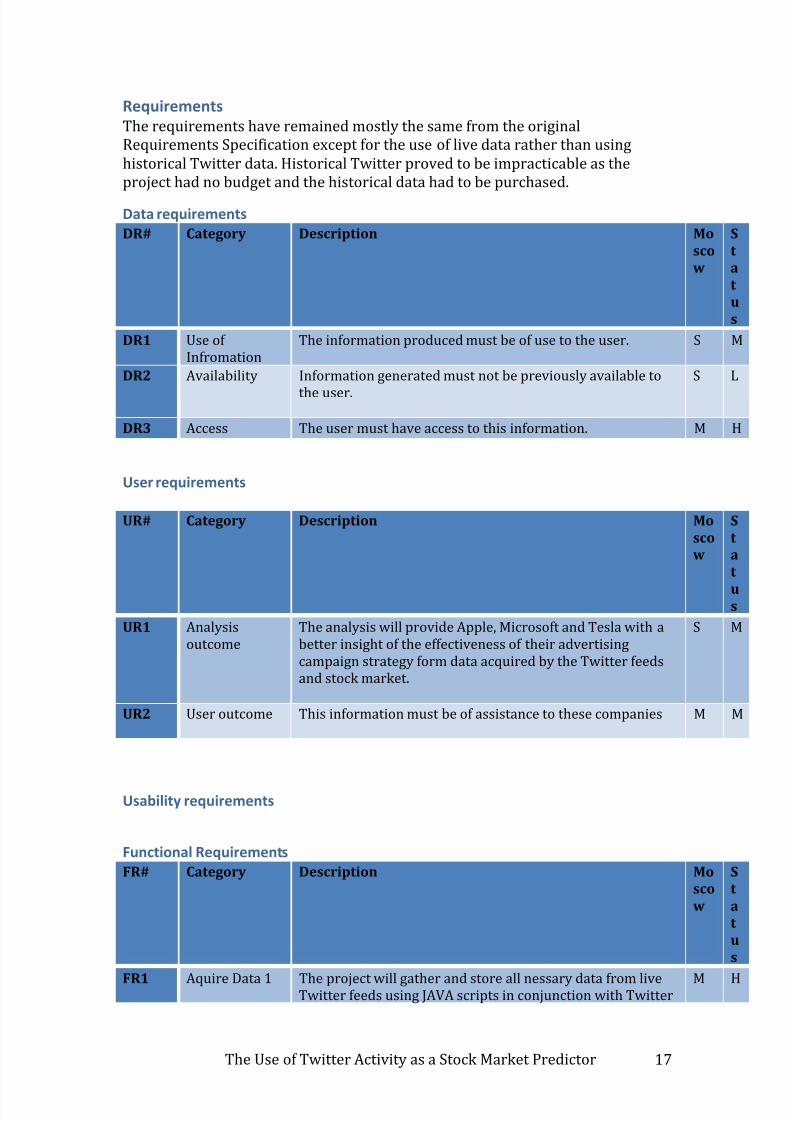
Requirements
The requirements have remained mostly the same from the originalRequirements Specification except for the use of live data rather than usinghistorical Twitter data. Historical Twitter proved to be impracticable as theproject had no budget and the historical data had to be purchased.
Data requirements
DR# Category Description Mo
sco
w
S
t
a
t
u
s
DR1 Use ofInfromation
The information produced must be of use to the user. S M
DR2 Availability Information generated must not be previously available to
the user.
S L
DR3 Access The user must have access to this information. M H
User requirements
UR# Category Description Mo
sco
w
S
t
a
t
us
UR1 Analysisoutcome
The analysis will provide Apple, Microsoft and Tesla with abetter insight of the effectiveness of their advertisingcampaign strategy form data acquired by the Twitter feedsand stock market.
S M
UR2 User outcome This information must be of assistance to these companies M M
Usability requirements
Functional Requirements
FR# Category Description Mo
sco
w
S
t
a
t
u
s
FR1 Aquire Data 1 The project will gather and store all nessary data from liveTwitter feeds using JAVA scripts in conjunction with Twitter M H
7/23/2019 Robert Coyle
http://slidepdf.com/reader/full/robert-coyle 18/91
The Use of Twitter Activity as a Stock Market Predictor 18
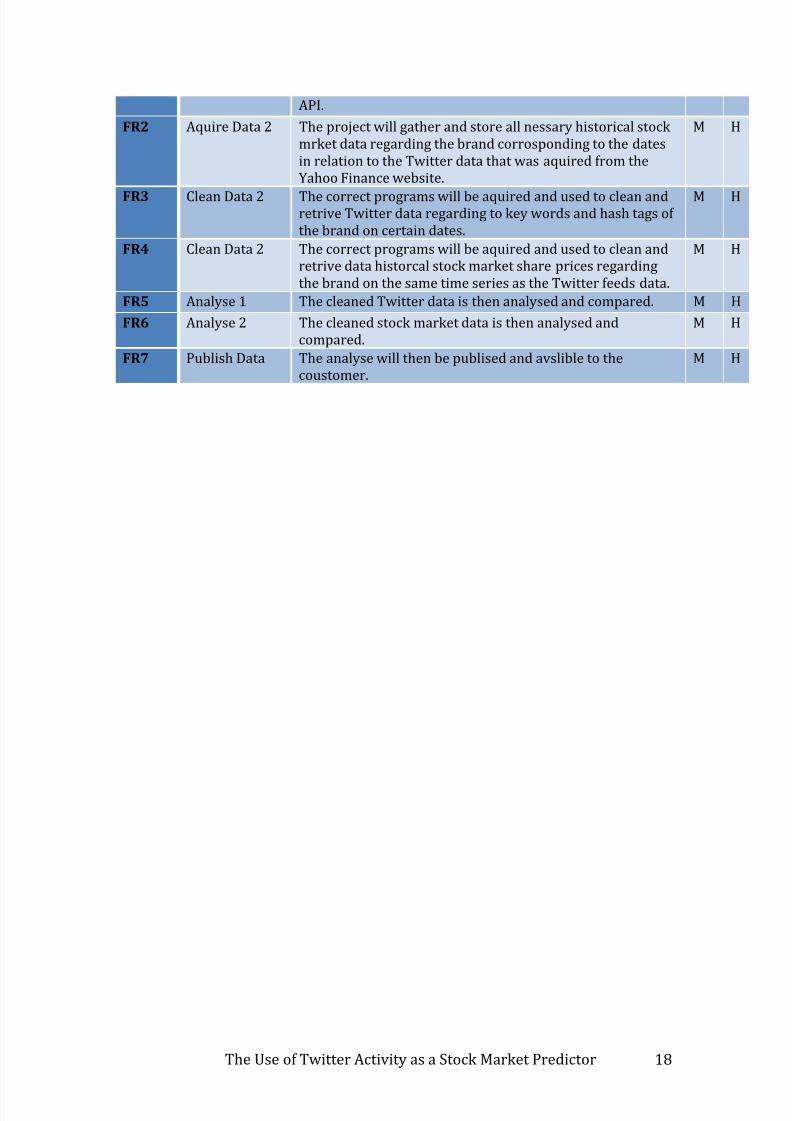
API.
FR2 Aquire Data 2 The project will gather and store all nessary historical stockmrket data regarding the brand corrosponding to the datesin relation to the Twitter data that was aquired from theYahoo Finance website.
M H
FR3 Clean Data 2 The correct programs will be aquired and used to clean andretrive Twitter data regarding to key words and hash tags ofthe brand on certain dates.
M H
FR4 Clean Data 2 The correct programs will be aquired and used to clean andretrive data historcal stock market share prices regardingthe brand on the same time series as the Twitter feeds data.
M H
FR5 Analyse 1 The cleaned Twitter data is then analysed and compared. M H
FR6 Analyse 2 The cleaned stock market data is then analysed andcompared.
M H
FR7 Publish Data The analyse will then be publised and avslible to thecoustomer.
M H
7/23/2019 Robert Coyle
http://slidepdf.com/reader/full/robert-coyle 19/91
The Use of Twitter Activity as a Stock Market Predictor 19
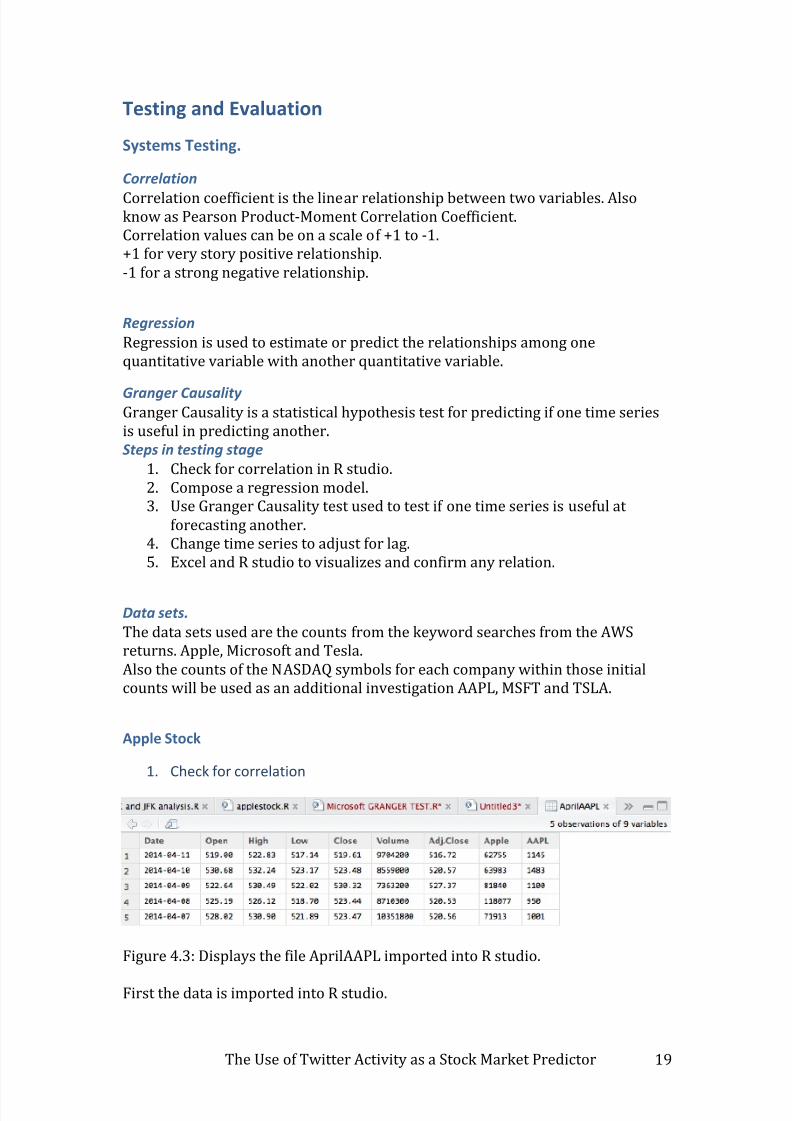
Testing and Evaluation
Systems Testing.
Correlation
Correlation coefficient is the linear relationship between two variables. Alsoknow as Pearson Product-Moment Correlation Coefficient.Correlation values can be on a scale of +1 to -1.+1 for very story positive relationship.-1 for a strong negative relationship.
Regression
Regression is used to estimate or predict the relationships among onequantitative variable with another quantitative variable.
Granger CausalityGranger Causality is a statistical hypothesis test for predicting if one time seriesis useful in predicting another.Steps in testing stage
1. Check for correlation in R studio.2. Compose a regression model.3. Use Granger Causality test used to test if one time series is useful at
forecasting another.4. Change time series to adjust for lag.5. Excel and R studio to visualizes and confirm any relation.
Data sets.
The data sets used are the counts from the keyword searches from the AWSreturns. Apple, Microsoft and Tesla.Also the counts of the NASDAQ symbols for each company within those initialcounts will be used as an additional investigation AAPL, MSFT and TSLA.
Apple Stock
1. Check for correlation
Figure 4.3: Displays the file AprilAAPL imported into R studio.
First the data is imported into R studio.
7/23/2019 Robert Coyle
http://slidepdf.com/reader/full/robert-coyle 20/91
The Use of Twitter Activity as a Stock Market Predictor 20
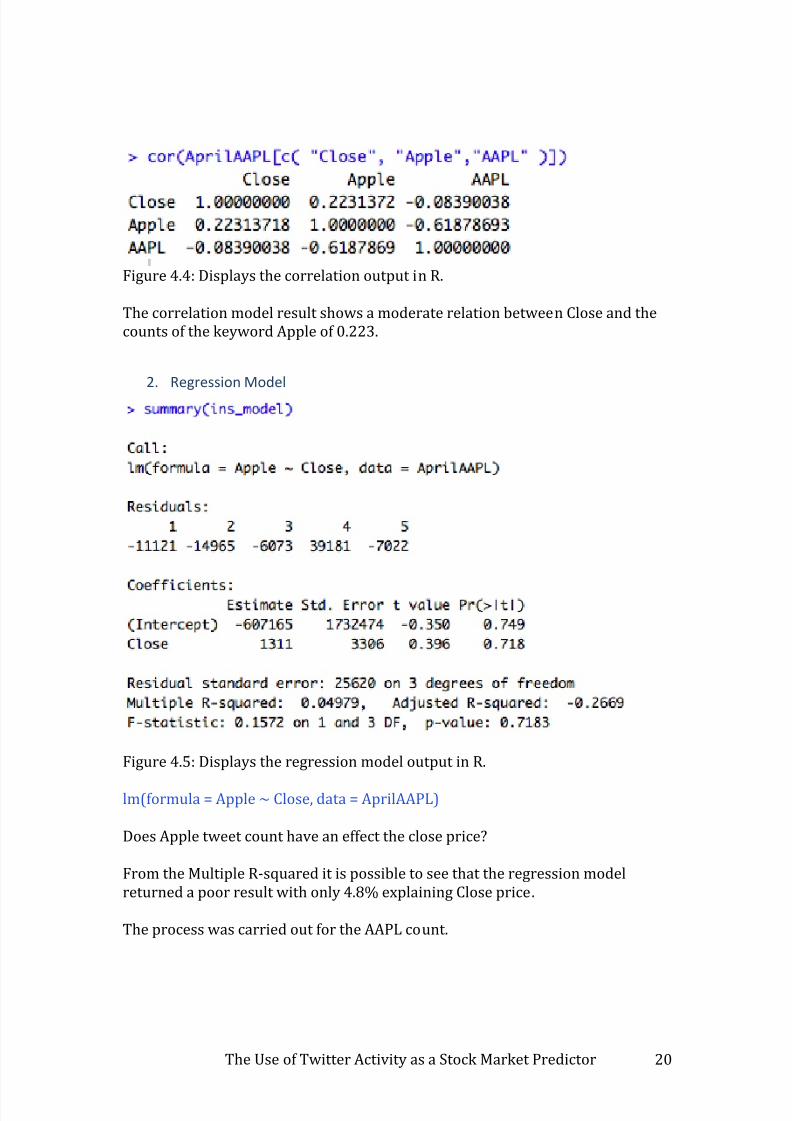
Figure 4.4: Displays the correlation output in R.
The correlation model result shows a moderate relation between Close and thecounts of the keyword Apple of 0.223.
2. Regression Model
Figure 4.5: Displays the regression model output in R.
lm(formula = Apple ~ Close, data = AprilAAPL)
Does Apple tweet count have an effect the close price?
From the Multiple R-squared it is possible to see that the regression modelreturned a poor result with only 4.8% explaining Close price.
The process was carried out for the AAPL count.
7/23/2019 Robert Coyle
http://slidepdf.com/reader/full/robert-coyle 21/91
The Use of Twitter Activity as a Stock Market Predictor 21
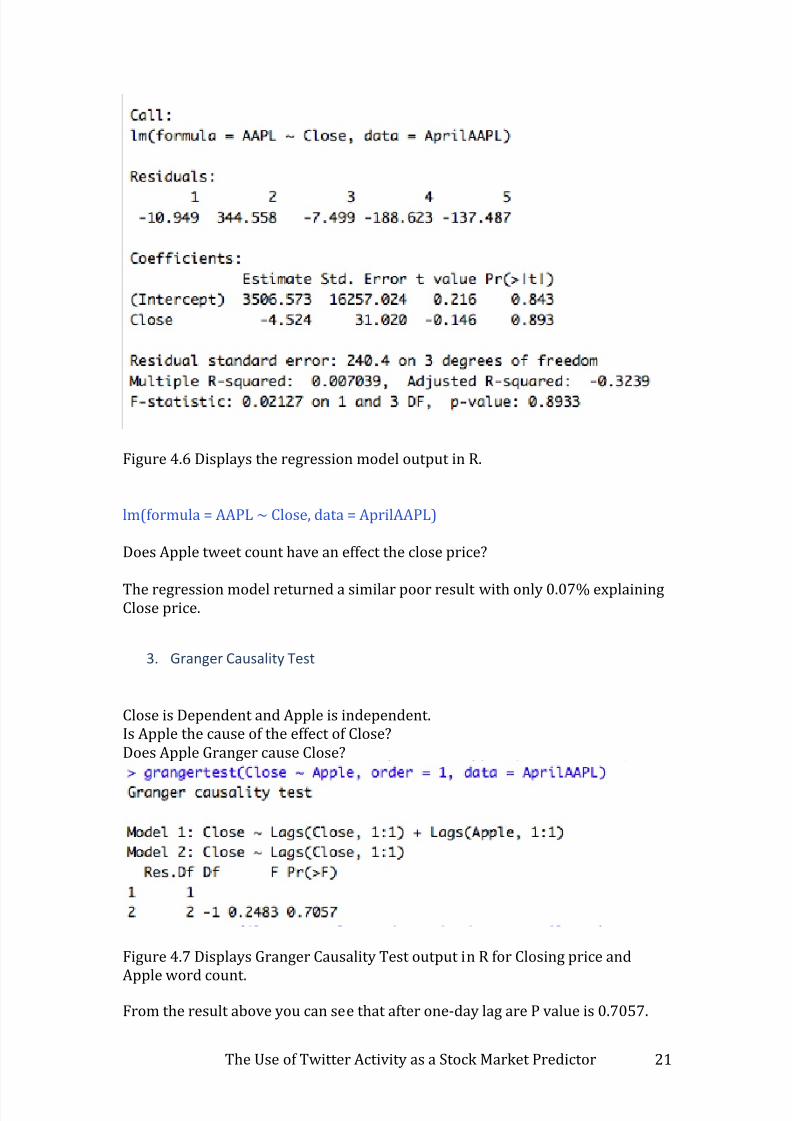
Figure 4.6 Displays the regression model output in R.
lm(formula = AAPL ~ Close, data = AprilAAPL)
Does Apple tweet count have an effect the close price?
The regression model returned a similar poor result with only 0.07% explainingClose price.
3. Granger Causality Test
Close is Dependent and Apple is independent.Is Apple the cause of the effect of Close?Does Apple Granger cause Close?
Figure 4.7 Displays Granger Causality Test output in R for Closing price and
Apple word count.
From the result above you can see that after one-day lag are P value is 0.7057.
7/23/2019 Robert Coyle
http://slidepdf.com/reader/full/robert-coyle 22/91
The Use of Twitter Activity as a Stock Market Predictor 22
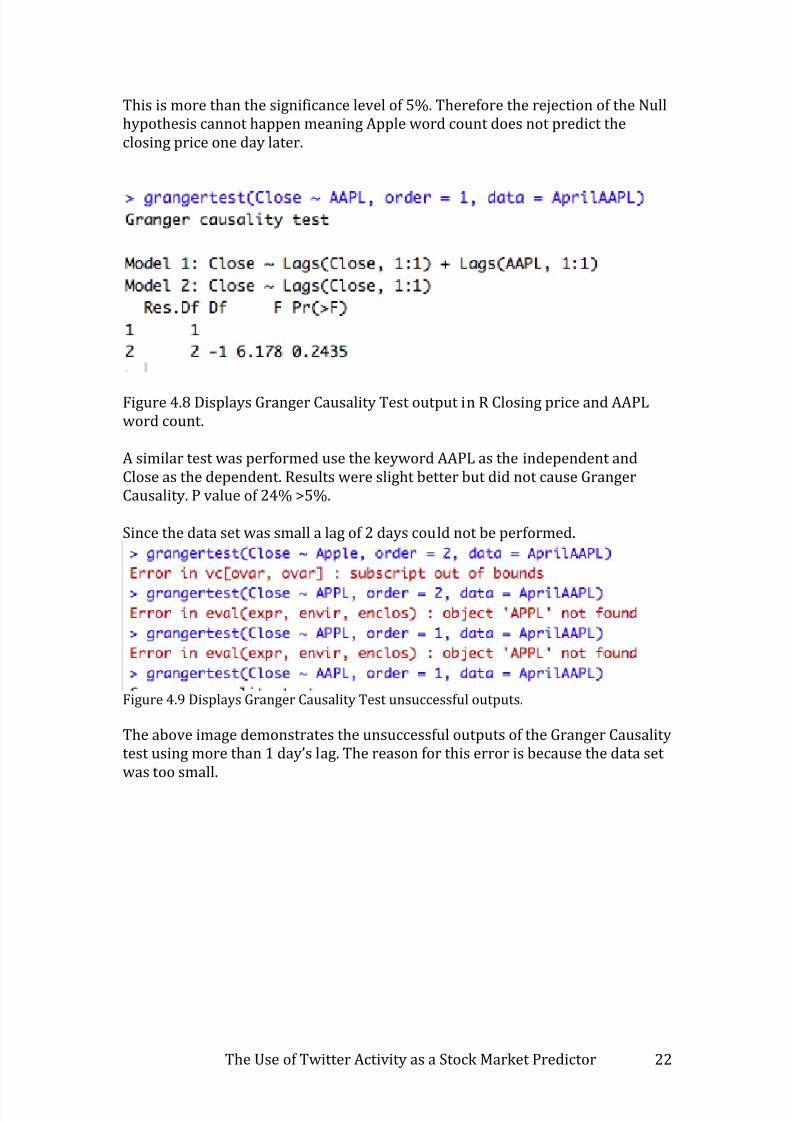
This is more than the significance level of 5%. Therefore the rejection of the Nullhypothesis cannot happen meaning Apple word count does not predict theclosing price one day later.
Figure 4.8 Displays Granger Causality Test output in R Closing price and AAPLword count.
A similar test was performed use the keyword AAPL as the independent andClose as the dependent. Results were slight better but did not cause GrangerCausality. P value of 24% >5%.
Since the data set was small a lag of 2 days could not be performed.
Figure 4.9 Displays Granger Causality Test unsuccessful outputs.
The above image demonstrates the unsuccessful outputs of the Granger Causalitytest using more than 1 day’s lag. The reason for this error is because the data setwas too small.
7/23/2019 Robert Coyle
http://slidepdf.com/reader/full/robert-coyle 23/91
The Use of Twitter Activity as a Stock Market Predictor 23
4. Visualization.
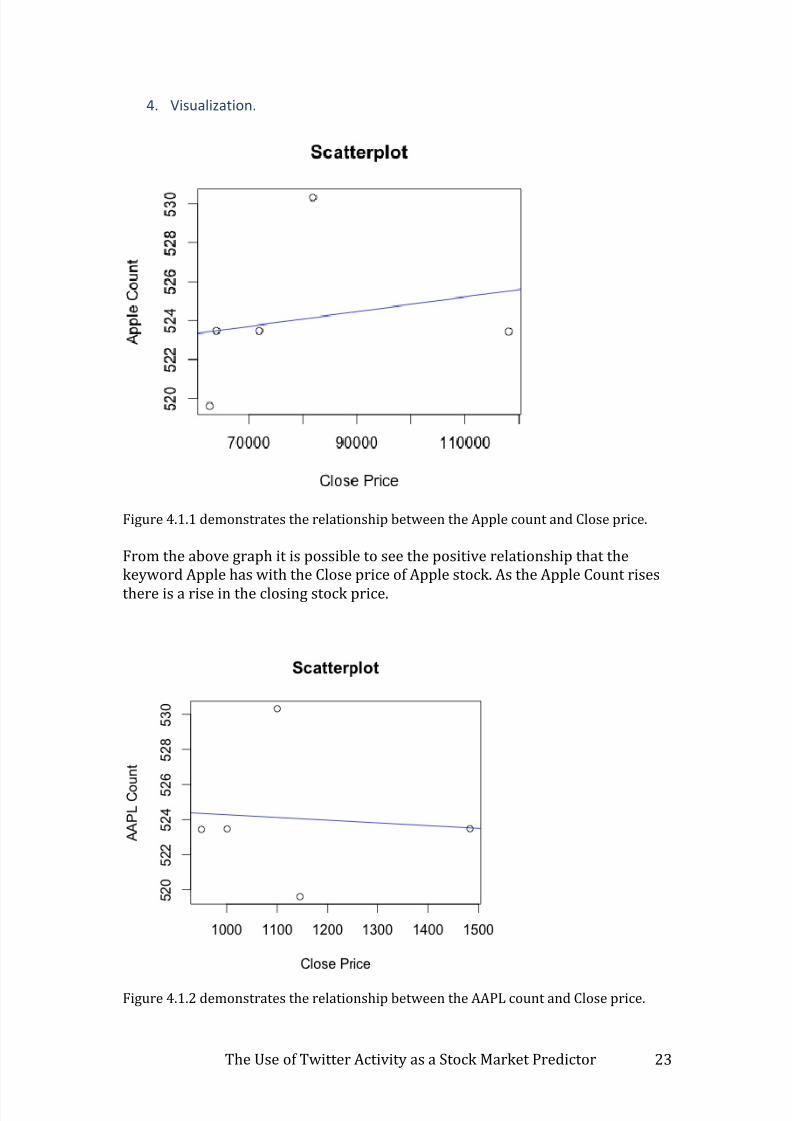
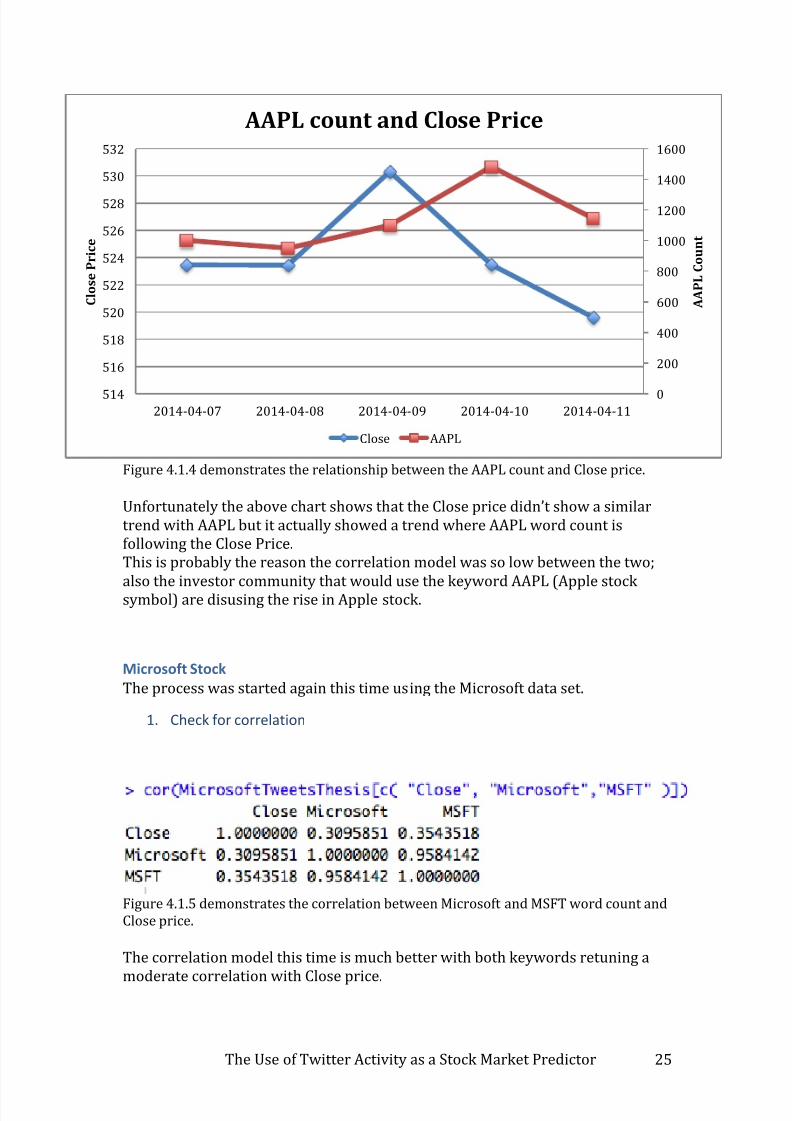
Figure 4.1.1 demonstrates the relationship between the Apple count and Close price.
From the above graph it is possible to see the positive relationship that thekeyword Apple has with the Close price of Apple stock. As the Apple Count rises
there is a rise in the closing stock price.
Figure 4.1.2 demonstrates the relationship between the AAPL count and Close price.
7/23/2019 Robert Coyle
http://slidepdf.com/reader/full/robert-coyle 24/91
The Use of Twitter Activity as a Stock Market Predictor 24
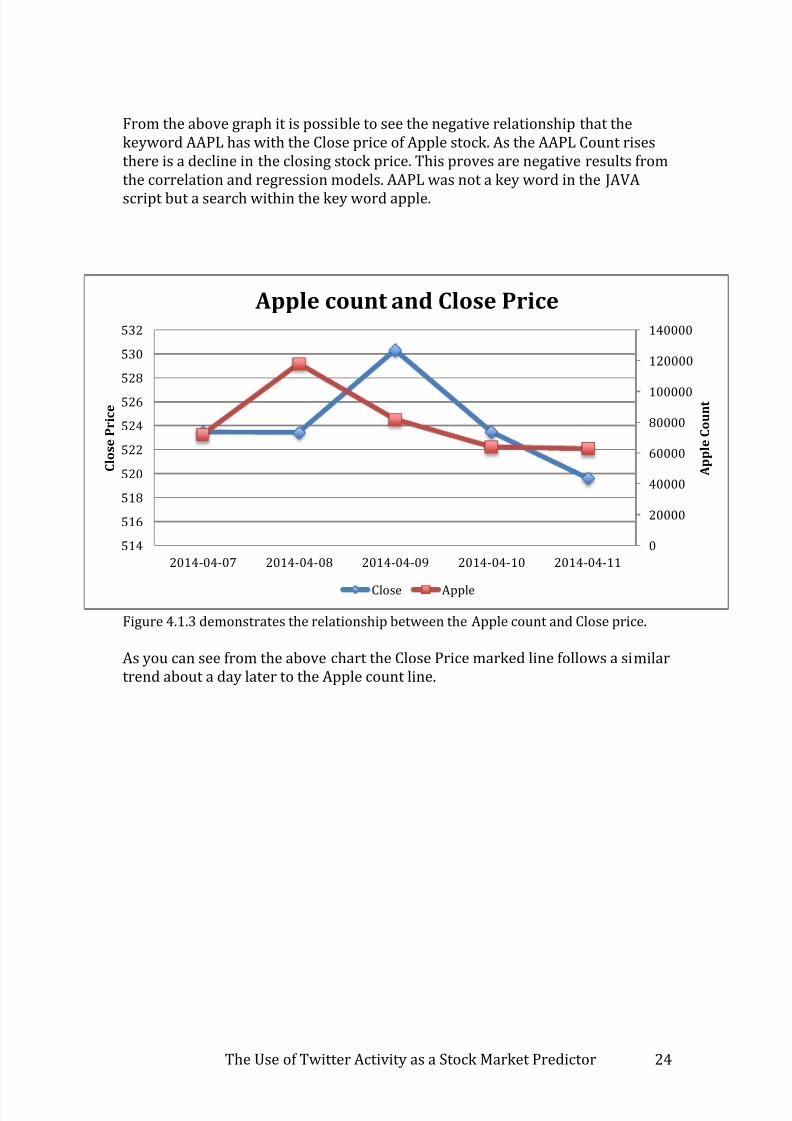
From the above graph it is possible to see the negative relationship that thekeyword AAPL has with the Close price of Apple stock. As the AAPL Count risesthere is a decline in the closing stock price. This proves are negative results fromthe correlation and regression models. AAPL was not a key word in the JAVA
script but a search within the key word apple.
Figure 4.1.3 demonstrates the relationship between the Apple count and Close price.
As you can see from the above chart the Close Price marked line follows a similartrend about a day later to the Apple count line.
0
20000
40000
60000
80000
100000
120000
140000
514
516
518
520
522
524
526
528
530
532
2014-04-07 2014-04-08 2014-04-09 2014-04-10 2014-04-11
A p p l e C o u n t
C l o s e P r i c e
Apple count and Close Price
Close Apple
7/23/2019 Robert Coyle
http://slidepdf.com/reader/full/robert-coyle 25/91
The Use of Twitter Activity as a Stock Market Predictor 25
Figure 4.1.4 demonstrates the relationship between the AAPL count and Close price.
Unfortunately the above chart shows that the Close price didn’t show a similartrend with AAPL but it actually showed a trend where AAPL word count isfollowing the Close Price.This is probably the reason the correlation model was so low between the two;also the investor community that would use the keyword AAPL (Apple stocksymbol) are disusing the rise in Apple stock.
Microsoft Stock
The process was started again this time using the Microsoft data set.
1. Check for correlation
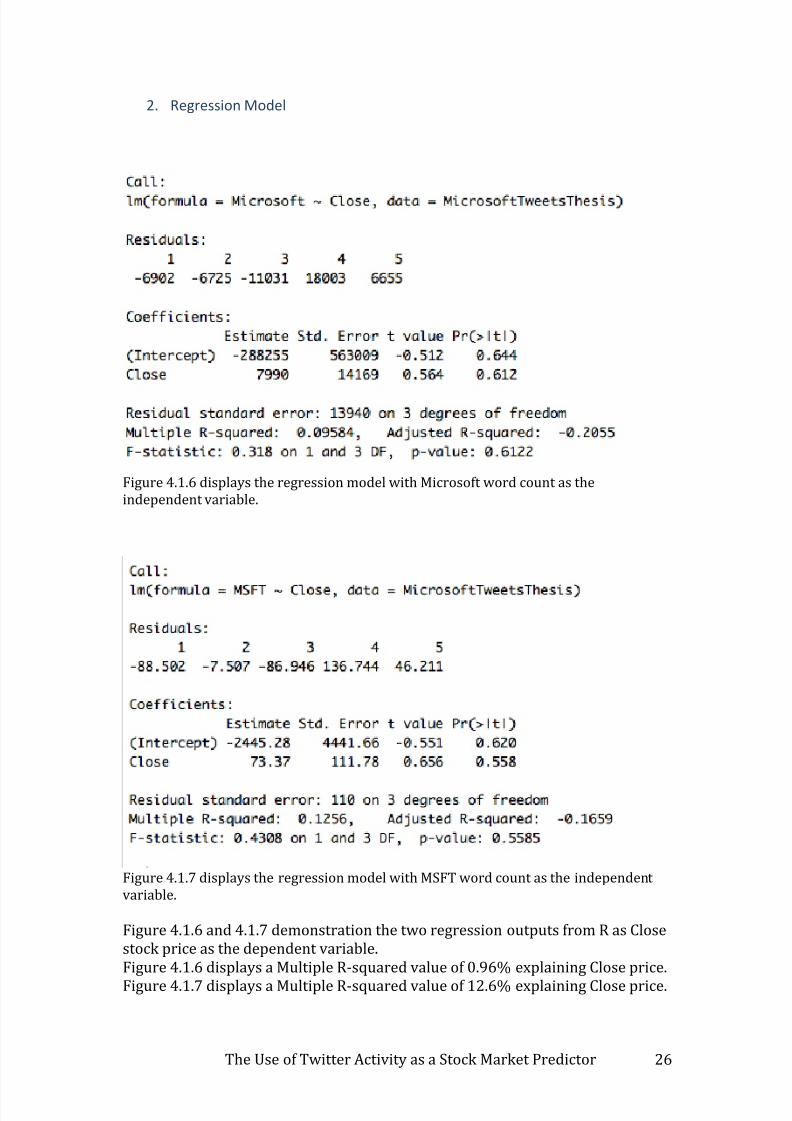
Figure 4.1.5 demonstrates the correlation between Microsoft and MSFT word count andClose price.
The correlation model this time is much better with both keywords retuning a
moderate correlation with Close price.
0
200
400
600
800
1000
1200
1400
1600
514
516
518
520
522
524
526
528
530
532
2014-04-07 2014-04-08 2014-04-09 2014-04-10 2014-04-11
A A P L C o u n t
C l o s e P r i c e
AAPL count and Close Price
Close AAPL
7/23/2019 Robert Coyle
http://slidepdf.com/reader/full/robert-coyle 26/91
The Use of Twitter Activity as a Stock Market Predictor 26
2. Regression Model
Figure 4.1.6 displays the regression model with Microsoft word count as theindependent variable.
Figure 4.1.7 displays the regression model with MSFT word count as the independentvariable.
Figure 4.1.6 and 4.1.7 demonstration the two regression outputs from R as Closestock price as the dependent variable.Figure 4.1.6 displays a Multiple R-squared value of 0.96% explaining Close price.
Figure 4.1.7 displays a Multiple R-squared value of 12.6% explaining Close price.
7/23/2019 Robert Coyle
http://slidepdf.com/reader/full/robert-coyle 27/91
The Use of Twitter Activity as a Stock Market Predictor 27
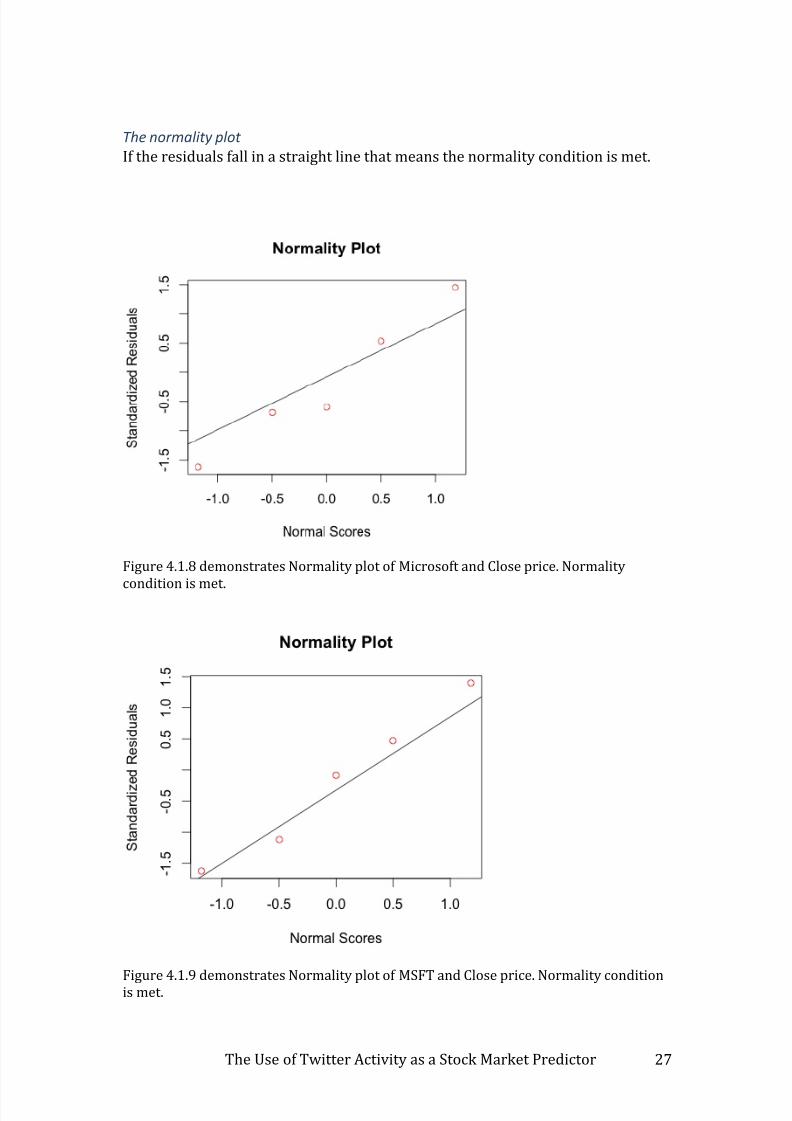
The normality plot
If the residuals fall in a straight line that means the normality condition is met.
Figure 4.1.8 demonstrates Normality plot of Microsoft and Close price. Normality
condition is met.
Figure 4.1.9 demonstrates Normality plot of MSFT and Close price. Normality conditionis met.
7/23/2019 Robert Coyle
http://slidepdf.com/reader/full/robert-coyle 28/91
The Use of Twitter Activity as a Stock Market Predictor 28
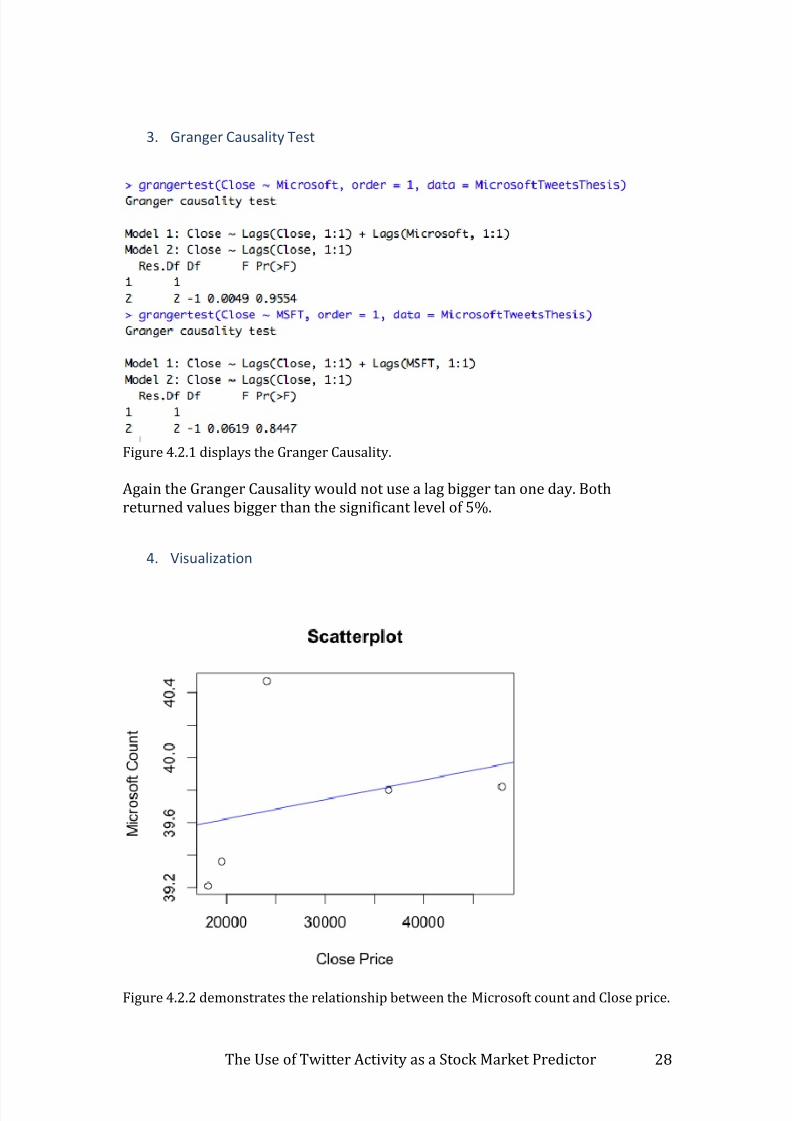
3. Granger Causality Test
Figure 4.2.1 displays the Granger Causality.
Again the Granger Causality would not use a lag bigger tan one day. Bothreturned values bigger than the significant level of 5%.
4. Visualization
Figure 4.2.2 demonstrates the relationship between the Microsoft count and Close price.
7/23/2019 Robert Coyle
http://slidepdf.com/reader/full/robert-coyle 29/91
The Use of Twitter Activity as a Stock Market Predictor 29
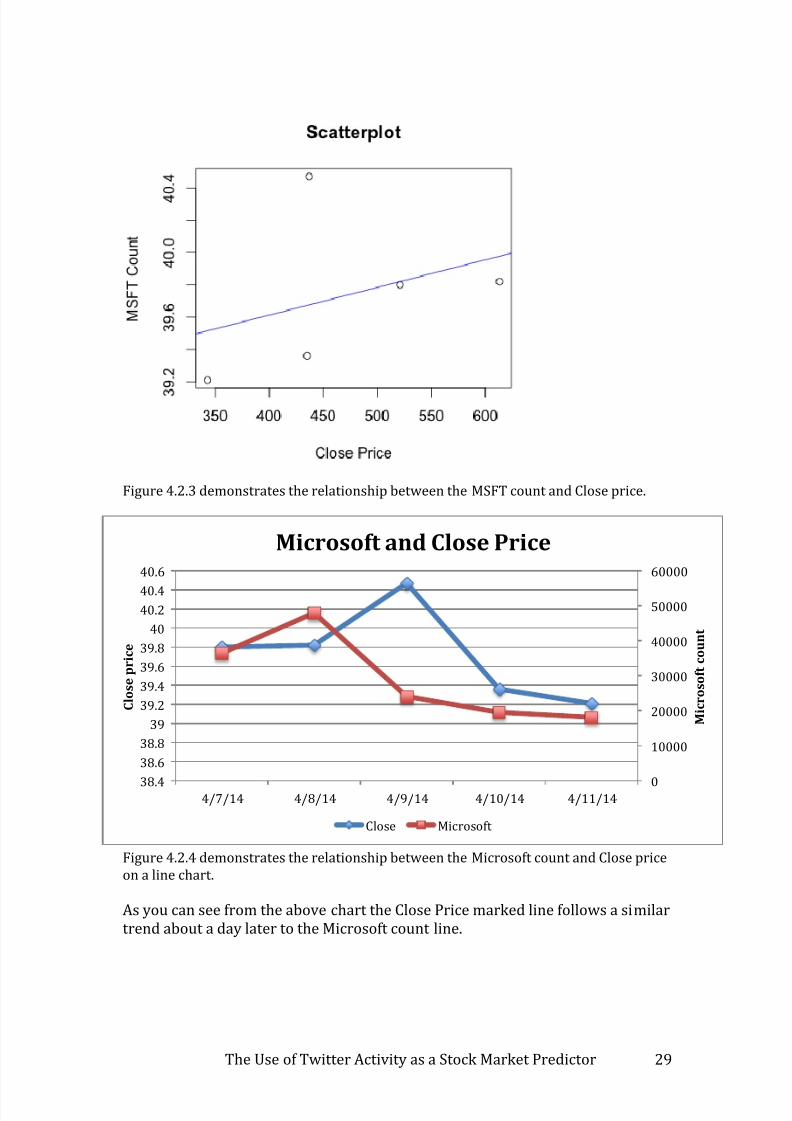
Figure 4.2.3 demonstrates the relationship between the MSFT count and Close price.
Figure 4.2.4 demonstrates the relationship between the Microsoft count and Close priceon a line chart.
As you can see from the above chart the Close Price marked line follows a similartrend about a day later to the Microsoft count line.
0
10000
20000
30000
40000
50000
60000
38.4
38.6
38.8
39
39.2
39.4
39.6
39.8
40
40.240.4
40.6
4/7/14 4/8/14 4/9/14 4/10/14 4/11/14
M i c r o s o f t c o u n t
C l o s e p r i c e
Microsoft and Close Price
Close Microsoft
7/23/2019 Robert Coyle
http://slidepdf.com/reader/full/robert-coyle 30/91
The Use of Twitter Activity as a Stock Market Predictor 30
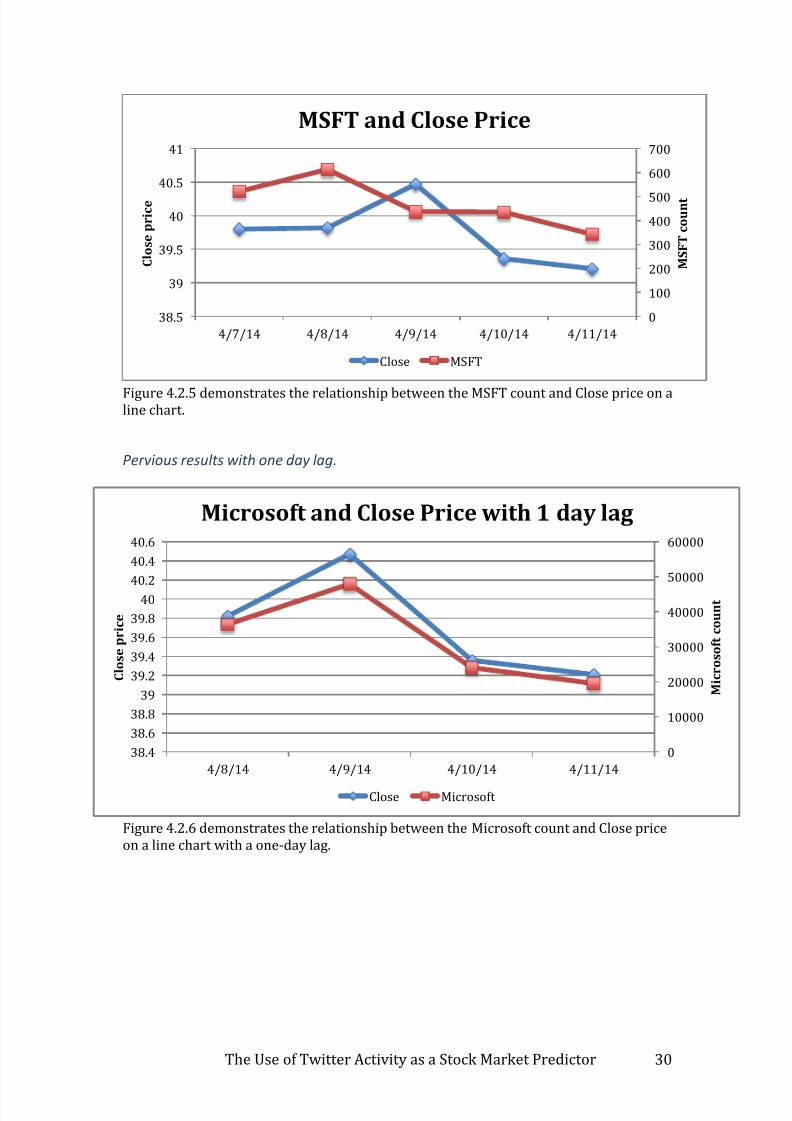
Figure 4.2.5 demonstrates the relationship between the MSFT count and Close price on aline chart.
Pervious results with one day lag.
Figure 4.2.6 demonstrates the relationship between the Microsoft count and Close priceon a line chart with a one-day lag.
0
100
200
300
400
500
600
700
38.5
39
39.5
40
40.5
41
4/7/14 4/8/14 4/9/14 4/10/14 4/11/14
M S F T c o u n t
C l o s e p r i c e
MSFT and Close Price
Close MSFT
0
10000
20000
30000
40000
50000
60000
38.4
38.6
38.8
39
39.2
39.4
39.6
39.8
40
40.2
40.4
40.6
4/8/14 4/9/14 4/10/14 4/11/14
M i c r o s o f t c o u n t
C l o s e p r i c e
Microsoft and Close Price with 1 day lag
Close Microsoft
7/23/2019 Robert Coyle
http://slidepdf.com/reader/full/robert-coyle 31/91
The Use of Twitter Activity as a Stock Market Predictor 31
Figure 4.2.7 demonstrates the relationship between the MSFT count and Close price on aline chart with a one-day lag.
The decision was made to perform a manual lag in excel by moving the dates ofthe Microsoft count forward to see if the lines in the chart match up.This lag would mean that the tweet counts about Microsoft happened on thesame dates as the actual Closing price.The results from the two graphs show that visually there is a relationshipbetween the word counts and the Close stock price.
A correlation and regression model was built again using the lagged data.
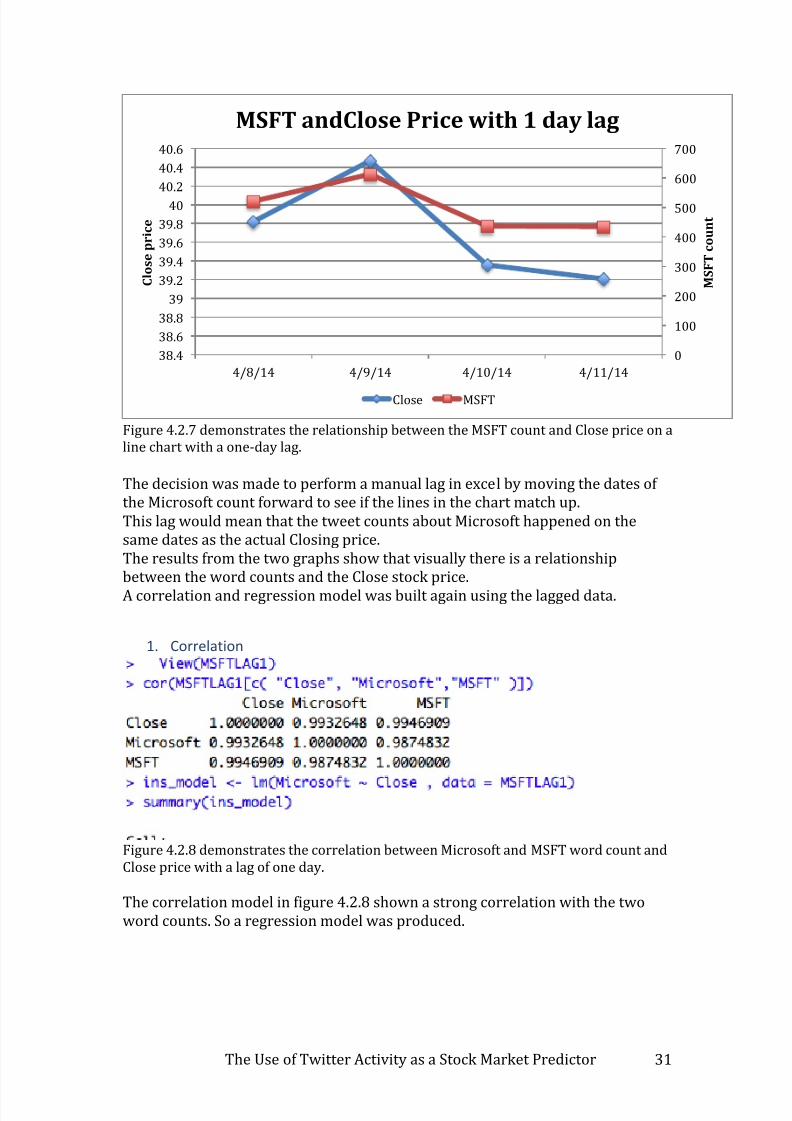
1. Correlation
Figure 4.2.8 demonstrates the correlation between Microsoft and MSFT word count andClose price with a lag of one day.
The correlation model in figure 4.2.8 shown a strong correlation with the twoword counts. So a regression model was produced.
0
100
200
300
400
500
600
700
38.4
38.6
38.8
39
39.2
39.4
39.6
39.8
40
40.2
40.4
40.6
4/8/14 4/9/14 4/10/14 4/11/14
M S F T c o u n t
C l o s e p r i c e
MSFT andClose Price with 1 day lag
Close MSFT
7/23/2019 Robert Coyle
http://slidepdf.com/reader/full/robert-coyle 32/91
The Use of Twitter Activity as a Stock Market Predictor 32
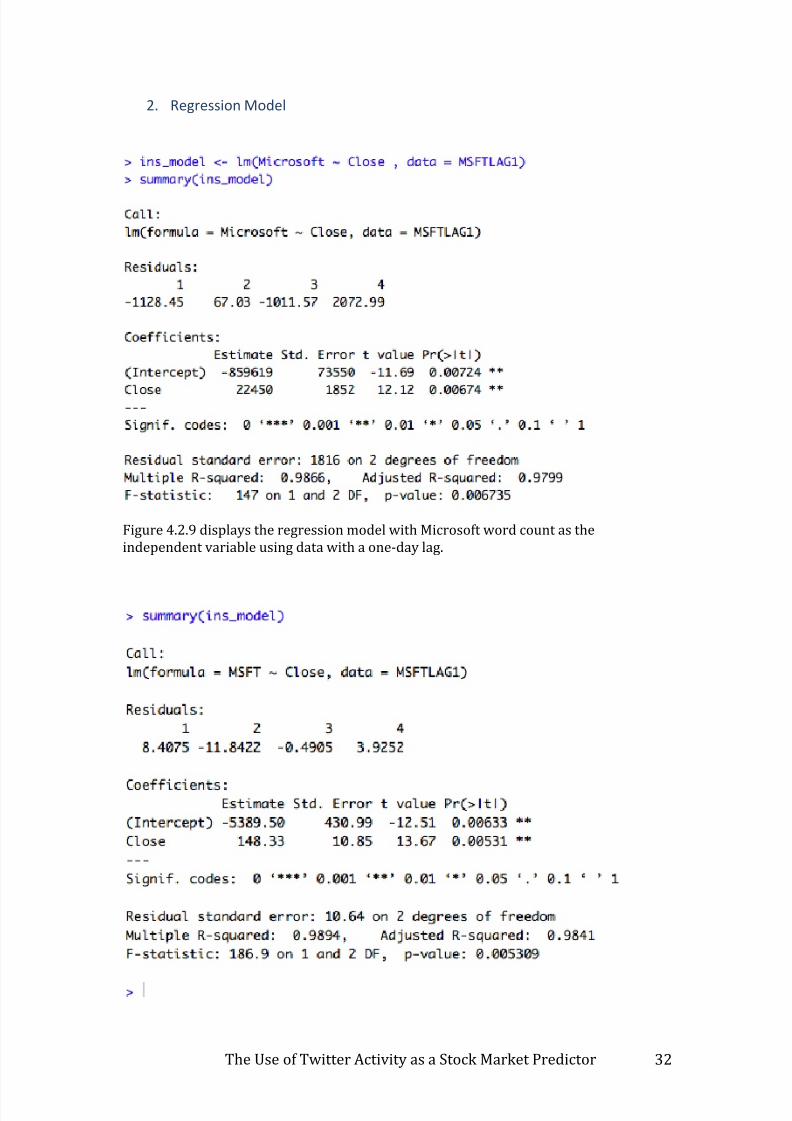
2. Regression Model
Figure 4.2.9 displays the regression model with Microsoft word count as theindependent variable using data with a one-day lag.
7/23/2019 Robert Coyle
http://slidepdf.com/reader/full/robert-coyle 33/91
The Use of Twitter Activity as a Stock Market Predictor 33
Figure 4.3.1 displays the regression model with MSFT word count as the independentvariable with data of one-day lag.
The two regression models returned a high Multiple R-squared value of98%Figure explaining Close price.
The high correlation and regression proved that there is a relation between thetweet counts and the closing stock price. The results were very high the reasonfor this occurrence would be the very small data set that was used.
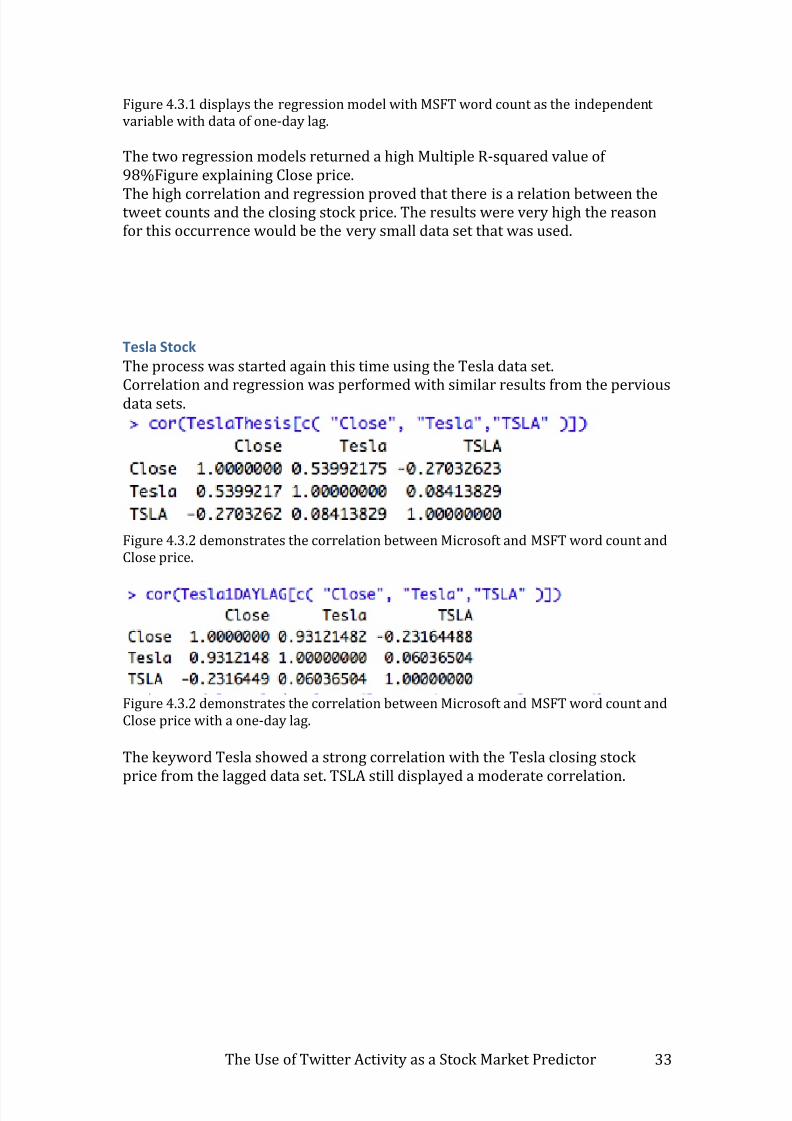
Tesla Stock
The process was started again this time using the Tesla data set.Correlation and regression was performed with similar results from the perviousdata sets.
Figure 4.3.2 demonstrates the correlation between Microsoft and MSFT word count andClose price.
Figure 4.3.2 demonstrates the correlation between Microsoft and MSFT word count andClose price with a one-day lag.
The keyword Tesla showed a strong correlation with the Tesla closing stockprice from the lagged data set. TSLA still displayed a moderate correlation.
7/23/2019 Robert Coyle
http://slidepdf.com/reader/full/robert-coyle 34/91
The Use of Twitter Activity as a Stock Market Predictor 34
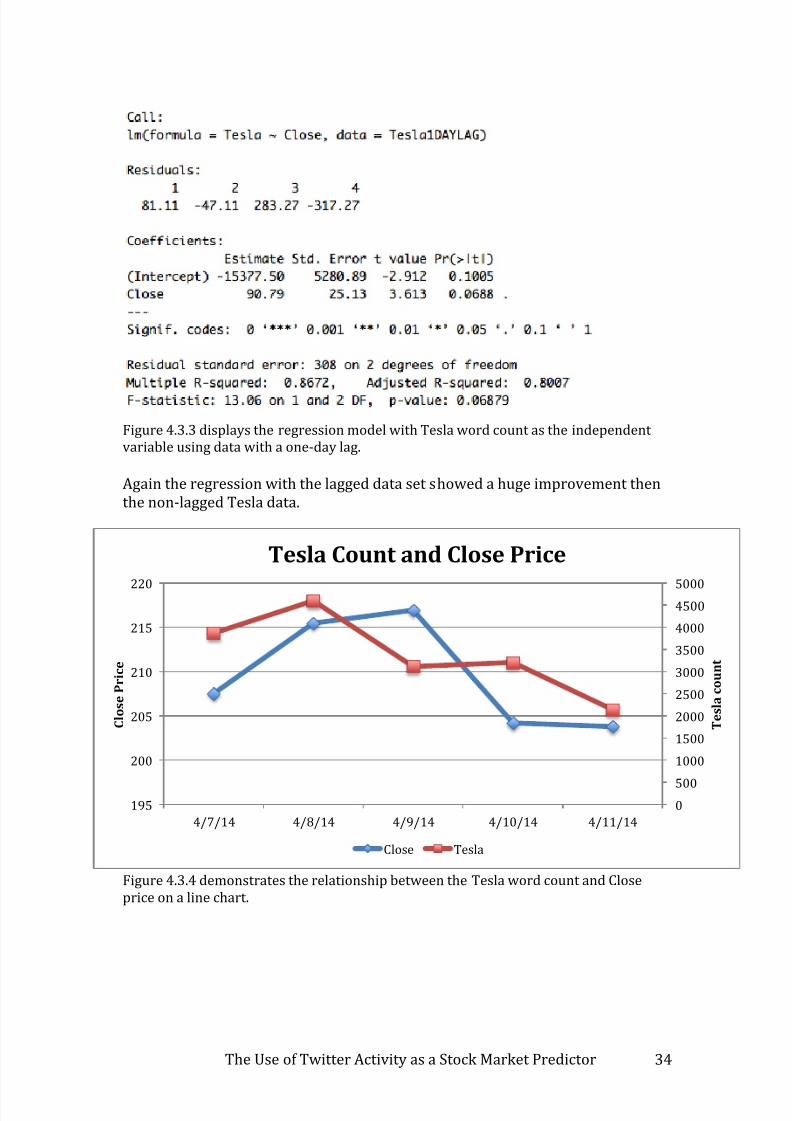
Figure 4.3.3 displays the regression model with Tesla word count as the independentvariable using data with a one-day lag.
Again the regression with the lagged data set showed a huge improvement thenthe non-lagged Tesla data.
Figure 4.3.4 demonstrates the relationship between the Tesla word count and Closeprice on a line chart.
0500
1000
1500
2000
2500
3000
3500
4000
45005000
195
200
205
210
215
220
4/7/14 4/8/14 4/9/14 4/10/14 4/11/14
T e s l a c o u n t
C l o s e P r i c e
Tesla Count and Close Price
Close Tesla
7/23/2019 Robert Coyle
http://slidepdf.com/reader/full/robert-coyle 35/91
The Use of Twitter Activity as a Stock Market Predictor 35
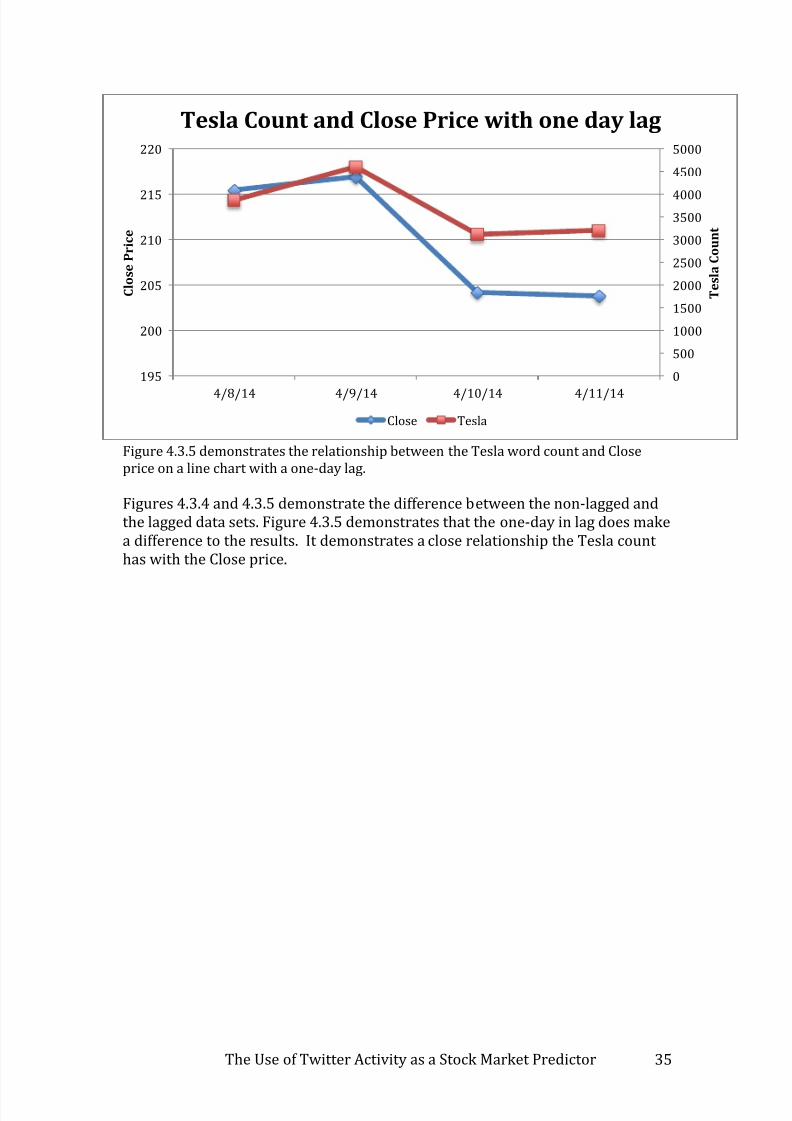
Figure 4.3.5 demonstrates the relationship between the Tesla word count and Closeprice on a line chart with a one-day lag.
Figures 4.3.4 and 4.3.5 demonstrate the difference between the non-lagged andthe lagged data sets. Figure 4.3.5 demonstrates that the one-day in lag does makea difference to the results. It demonstrates a close relationship the Tesla counthas with the Close price.
0
500
1000
1500
2000
2500
3000
35004000
4500
5000
195
200
205
210
215
220
4/8/14 4/9/14 4/10/14 4/11/14
T e s l a C o u n t
C l o s e P r i c e
Tesla Count and Close Price with one day lag
Close Tesla
7/23/2019 Robert Coyle
http://slidepdf.com/reader/full/robert-coyle 36/91
The Use of Twitter Activity as a Stock Market Predictor 36
Formula For Predicting Stock Movement
The creation of a formula for commercial use was conducted. The small data sethad an impact on this work since the use of a lag between two the three days wasdesired. From pervious research Stock Market Prediction using Twitter it wasdiscovered that the tweets would predict stock movement two to three days
after the message was tweeted.Knowing the tweet volumes of a company for two consecutive days thepercentage of movement of tweets between those two days should in turn allowus to predict the movement in the company share price within in a two or threeday lag.
Formula Used
The percentage difference between two numbers
(| V1 - V2 | / ((V1 + V2)/2)) * 100
V1 = total company tweets on day one.
V2 = total company tweets on day two.
The formula was used to find the percentage difference between the stockmovement and the tweet movement.
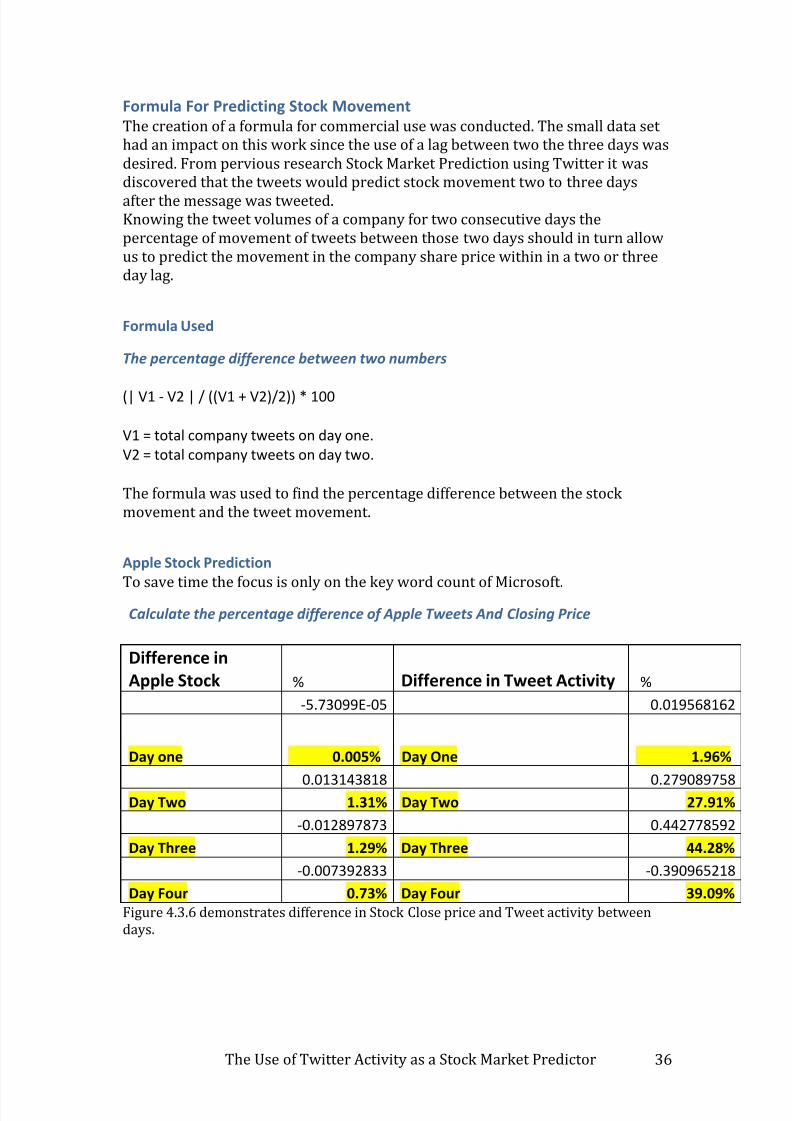
Apple Stock Prediction
To save time the focus is only on the key word count of Microsoft.Calculate the percentage difference of Apple Tweets And Closing Price
Difference in
Apple Stock % Difference in Tweet Activity %
-5.73099E-05 0.019568162
Day one 0.005% Day One 1.96%
0.013143818 0.279089758Day Two 1.31% Day Two 27.91%
-0.012897873 0.442778592
Day Three 1.29% Day Three 44.28%
-0.007392833 -0.390965218
Day Four 0.73% Day Four 39.09%
Figure 4.3.6 demonstrates difference in Stock Close price and Tweet activity betweendays.
7/23/2019 Robert Coyle
http://slidepdf.com/reader/full/robert-coyle 37/91
The Use of Twitter Activity as a Stock Market Predictor 37
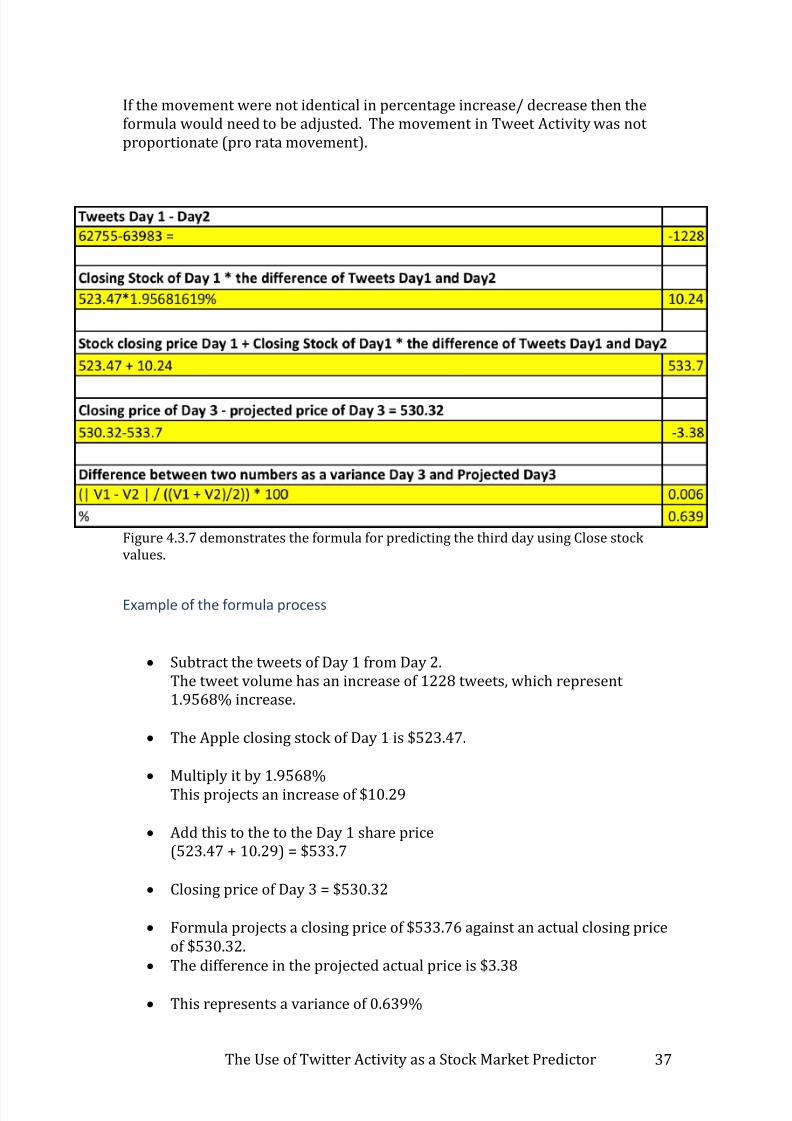
If the movement were not identical in percentage increase/ decrease then theformula would need to be adjusted. The movement in Tweet Activity was notproportionate (pro rata movement).
Figure 4.3.7 demonstrates the formula for predicting the third day using Close stockvalues.
Example of the formula process
Subtract the tweets of Day 1 from Day 2.The tweet volume has an increase of 1228 tweets, which represent1.9568% increase.
The Apple closing stock of Day 1 is $523.47.
Multiply it by 1.9568%This projects an increase of $10.29
Add this to the to the Day 1 share price(523.47 + 10.29) = $533.7
Closing price of Day 3 = $530.32
Formula projects a closing price of $533.76 against an actual closing priceof $530.32.
The difference in the projected actual price is $3.38
This represents a variance of 0.639%
7/23/2019 Robert Coyle
http://slidepdf.com/reader/full/robert-coyle 38/91
The Use of Twitter Activity as a Stock Market Predictor 38
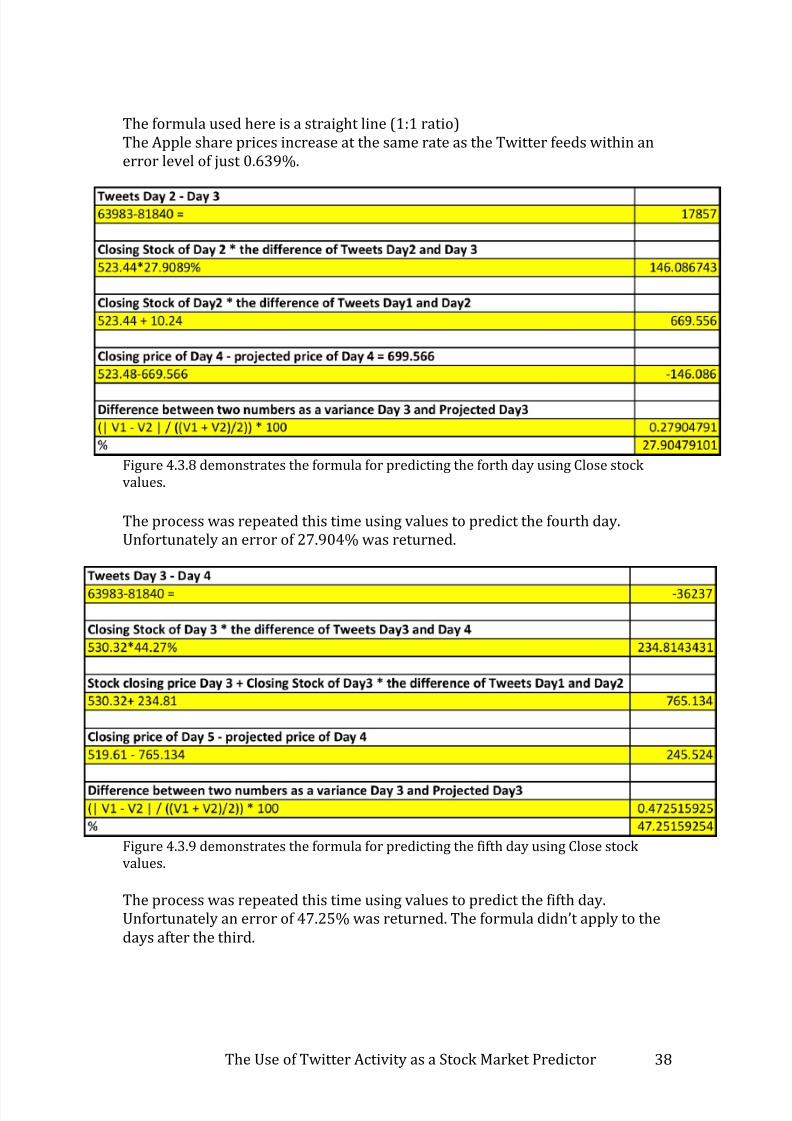
The formula used here is a straight line (1:1 ratio)The Apple share prices increase at the same rate as the Twitter feeds within anerror level of just 0.639%.
Figure 4.3.8 demonstrates the formula for predicting the forth day using Close stockvalues.
The process was repeated this time using values to predict the fourth day.Unfortunately an error of 27.904% was returned.
Figure 4.3.9 demonstrates the formula for predicting the fifth day using Close stockvalues.
The process was repeated this time using values to predict the fifth day.Unfortunately an error of 47.25% was returned. The formula didn’t apply to thedays after the third.
7/23/2019 Robert Coyle
http://slidepdf.com/reader/full/robert-coyle 39/91
The Use of Twitter Activity as a Stock Market Predictor 39
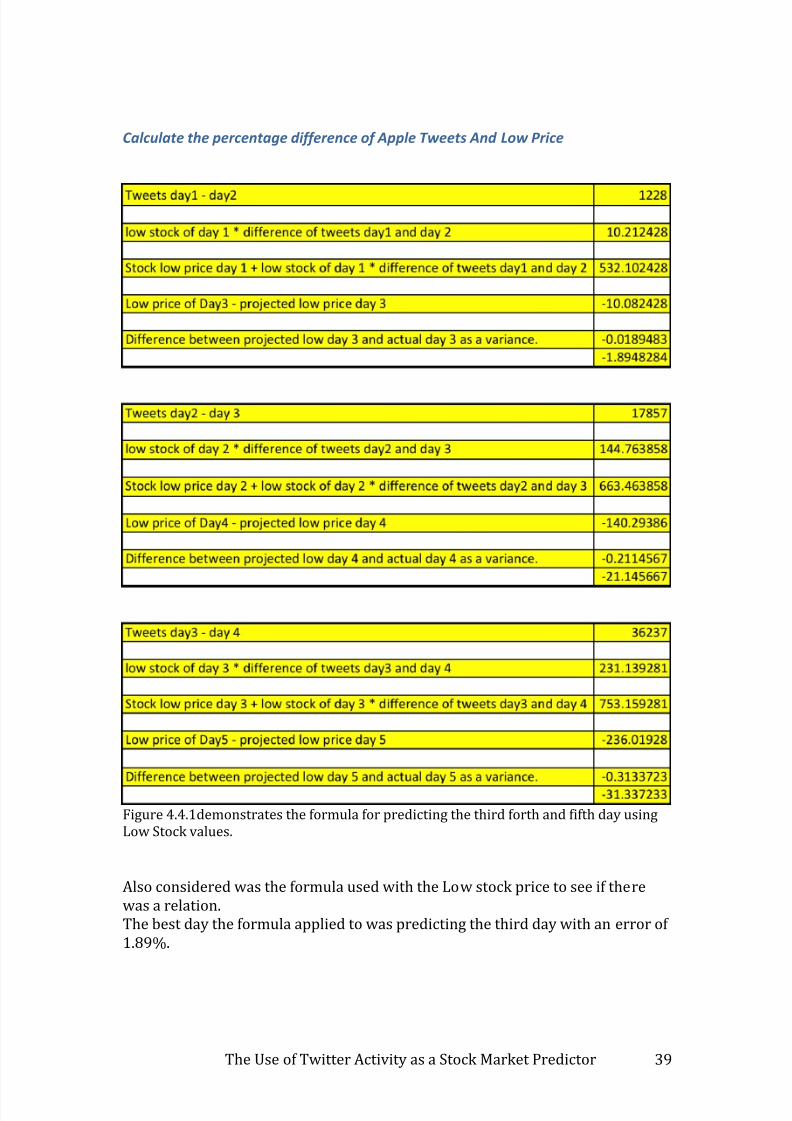
Calculate the percentage difference of Apple Tweets And Low Price
Figure 4.4.1demonstrates the formula for predicting the third forth and fifth day usingLow Stock values.
Also considered was the formula used with the Low stock price to see if therewas a relation.The best day the formula applied to was predicting the third day with an error of1.89%.
7/23/2019 Robert Coyle
http://slidepdf.com/reader/full/robert-coyle 40/91
The Use of Twitter Activity as a Stock Market Predictor 40
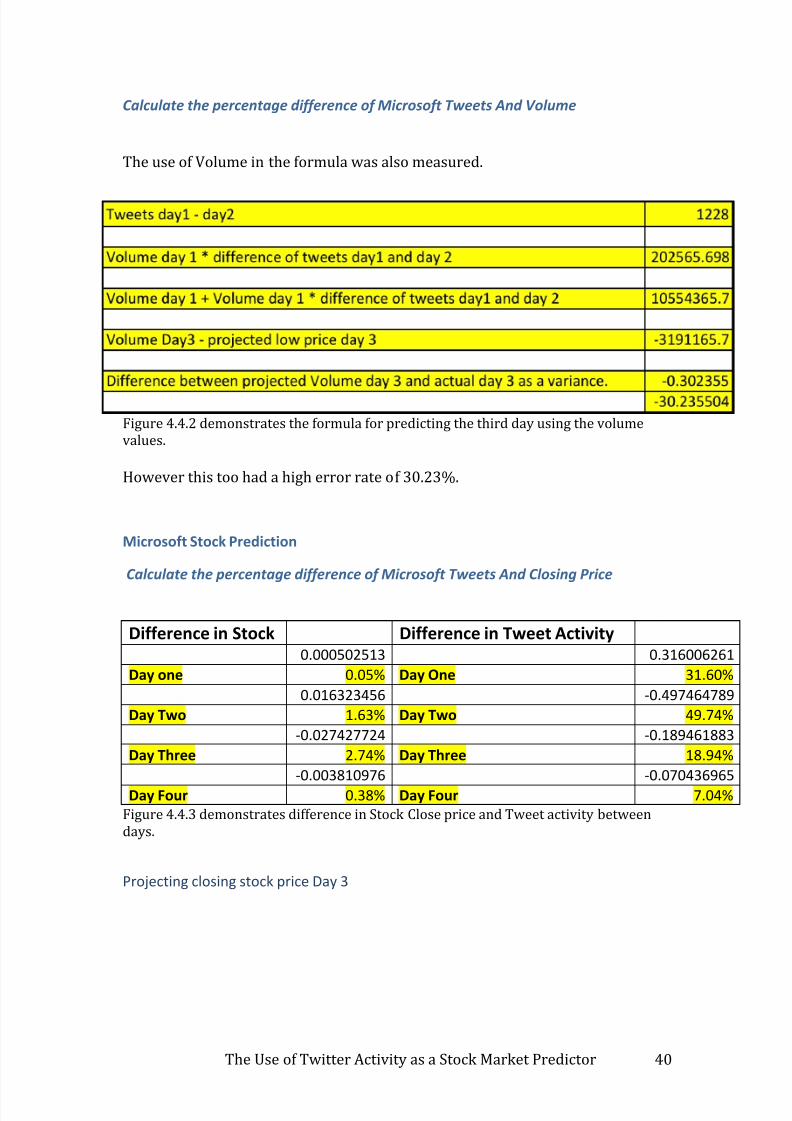
Calculate the percentage difference of Microsoft Tweets And Volume
The use of Volume in the formula was also measured.
Figure 4.4.2 demonstrates the formula for predicting the third day using the volumevalues.
However this too had a high error rate of 30.23%.
Microsoft Stock Prediction
Calculate the percentage difference of Microsoft Tweets And Closing Price
Difference in Stock Difference in Tweet Activity0.000502513 0.316006261
Day one 0.05% Day One 31.60%
0.016323456 -0.497464789
Day Two 1.63% Day Two 49.74%
-0.027427724 -0.189461883
Day Three 2.74% Day Three 18.94%
-0.003810976 -0.070436965
Day Four 0.38% Day Four 7.04%
Figure 4.4.3 demonstrates difference in Stock Close price and Tweet activity betweendays.
Projecting closing stock price Day 3
7/23/2019 Robert Coyle
http://slidepdf.com/reader/full/robert-coyle 41/91
The Use of Twitter Activity as a Stock Market Predictor 41
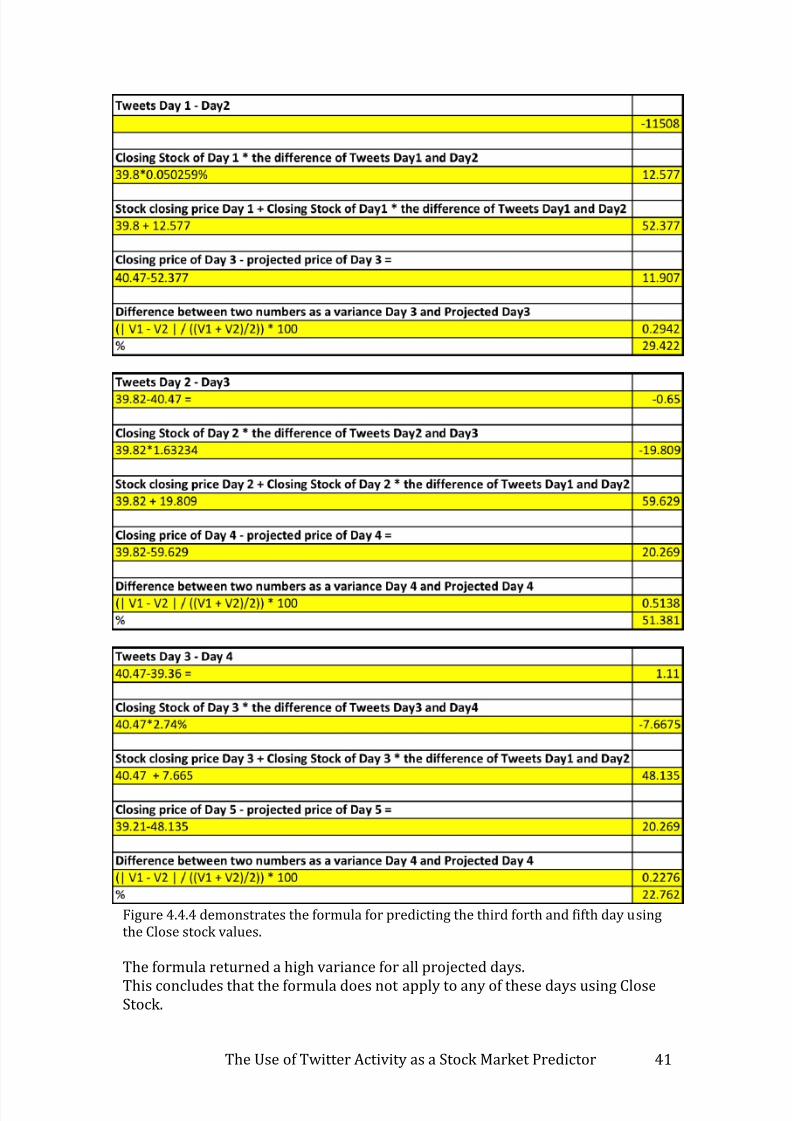
Figure 4.4.4 demonstrates the formula for predicting the third forth and fifth day usingthe Close stock values.
The formula returned a high variance for all projected days.
This concludes that the formula does not apply to any of these days using CloseStock.
7/23/2019 Robert Coyle
http://slidepdf.com/reader/full/robert-coyle 42/91
The Use of Twitter Activity as a Stock Market Predictor 42
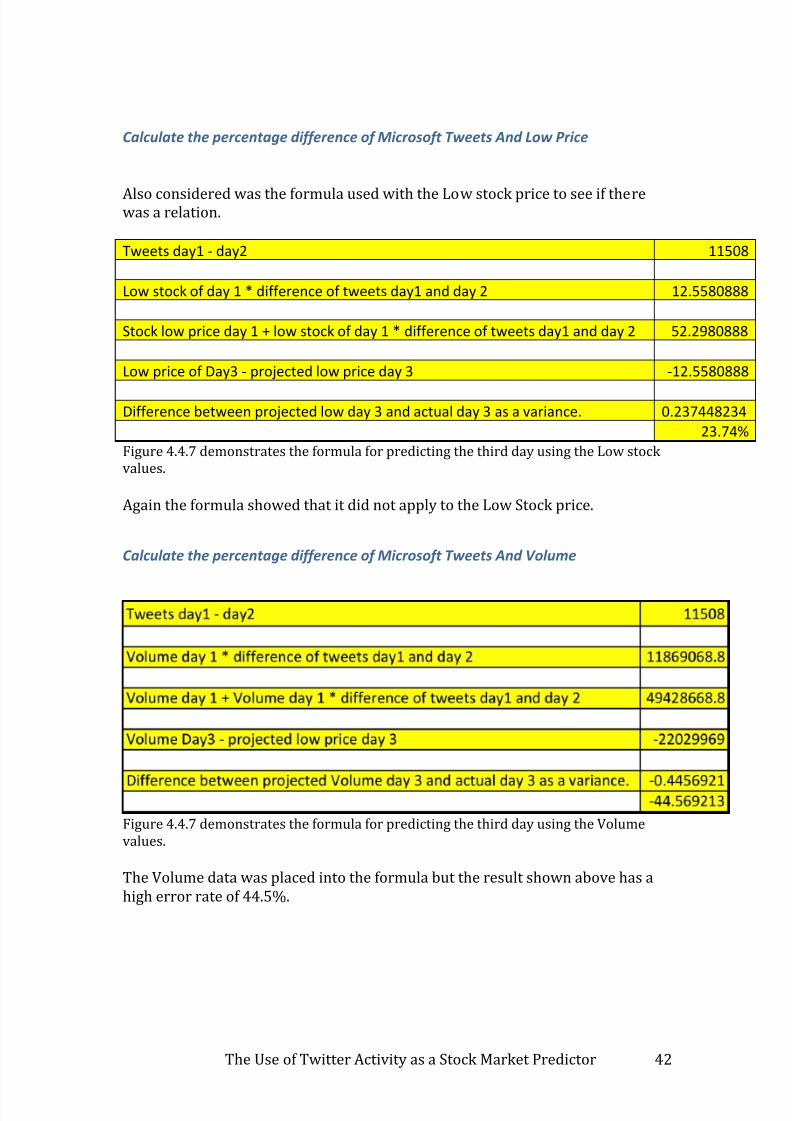
Calculate the percentage difference of Microsoft Tweets And Low Price
Also considered was the formula used with the Low stock price to see if therewas a relation.
Tweets day1 - day2 11508
Low stock of day 1 * difference of tweets day1 and day 2 12.5580888
Stock low price day 1 + low stock of day 1 * difference of tweets day1 and day 2 52.2980888
Low price of Day3 - projected low price day 3 -12.5580888
Difference between projected low day 3 and actual day 3 as a variance. 0.237448234
23.74%
Figure 4.4.7 demonstrates the formula for predicting the third day using the Low stockvalues.
Again the formula showed that it did not apply to the Low Stock price.
Calculate the percentage difference of Microsoft Tweets And Volume
Figure 4.4.7 demonstrates the formula for predicting the third day using the Volumevalues.
The Volume data was placed into the formula but the result shown above has ahigh error rate of 44.5%.
7/23/2019 Robert Coyle
http://slidepdf.com/reader/full/robert-coyle 43/91
The Use of Twitter Activity as a Stock Market Predictor 43
Tesla Stock Prediction
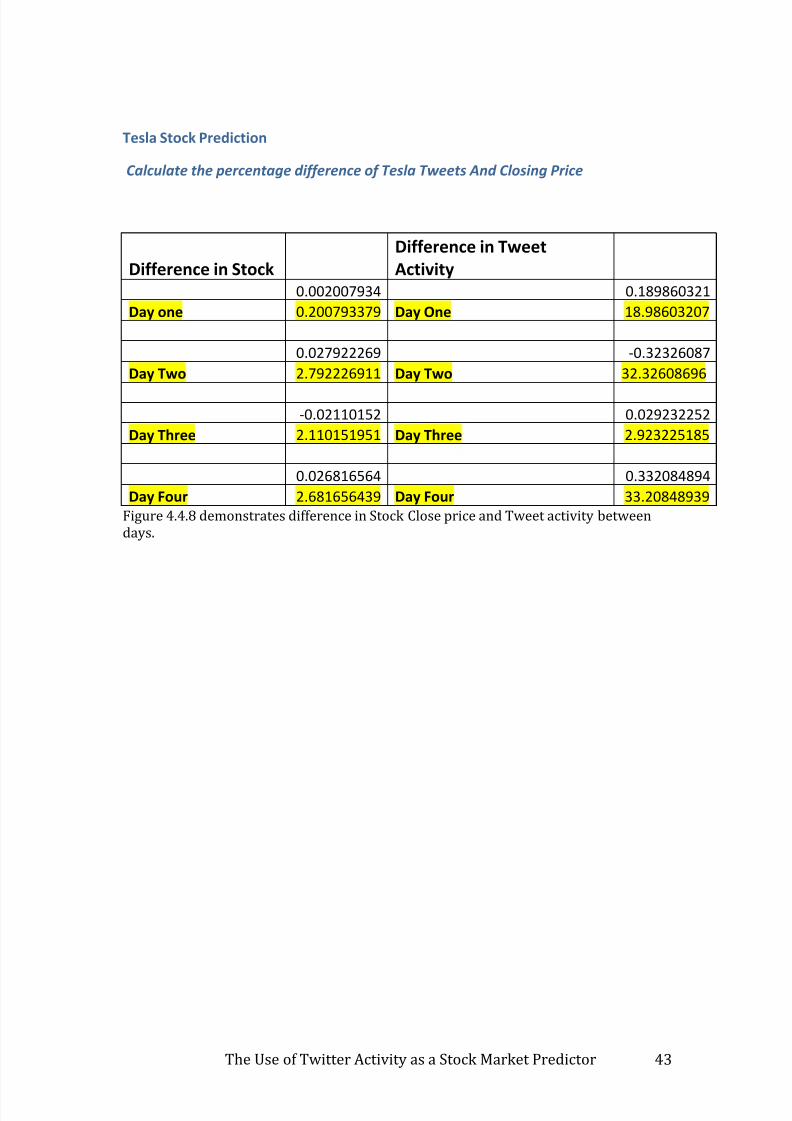
Calculate the percentage difference of Tesla Tweets And Closing Price
Difference in Stock
Difference in Tweet
Activity
0.002007934 0.189860321
Day one 0.200793379 Day One 18.98603207
0.027922269 -0.32326087
Day Two 2.792226911 Day Two 32.32608696
-0.02110152 0.029232252
Day Three 2.110151951 Day Three 2.923225185
0.026816564 0.332084894
Day Four 2.681656439 Day Four 33.20848939
Figure 4.4.8 demonstrates difference in Stock Close price and Tweet activity betweendays.
7/23/2019 Robert Coyle
http://slidepdf.com/reader/full/robert-coyle 44/91
The Use of Twitter Activity as a Stock Market Predictor 44
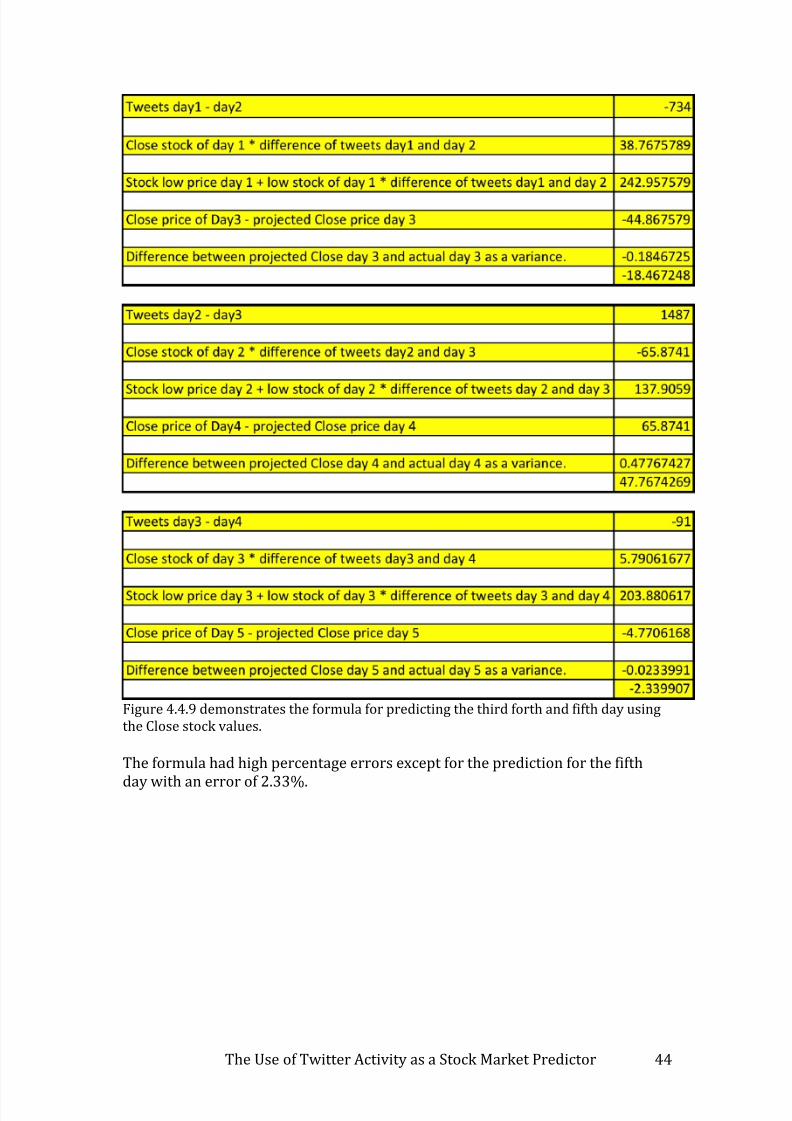
Figure 4.4.9 demonstrates the formula for predicting the third forth and fifth day usingthe Close stock values.
The formula had high percentage errors except for the prediction for the fifth
day with an error of 2.33%.
7/23/2019 Robert Coyle
http://slidepdf.com/reader/full/robert-coyle 45/91
The Use of Twitter Activity as a Stock Market Predictor 45
Tweets day1 - day2
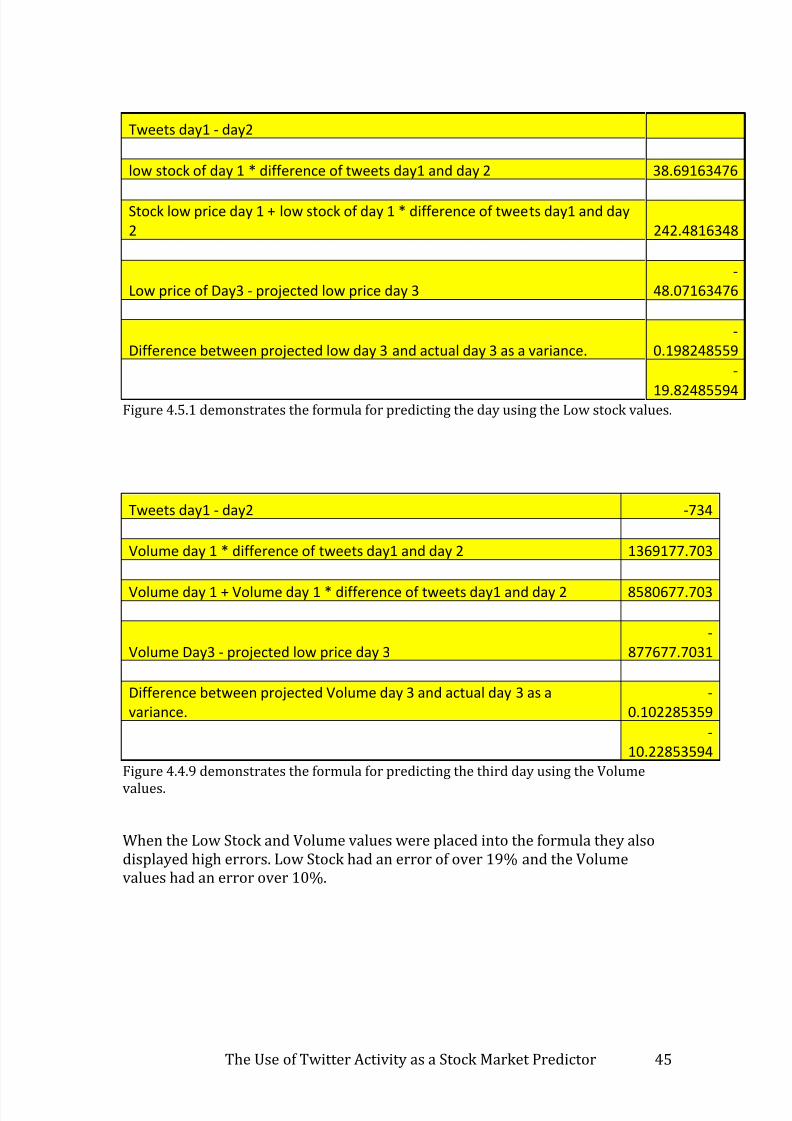
low stock of day 1 * difference of tweets day1 and day 2 38.69163476
Stock low price day 1 + low stock of day 1 * difference of tweets day1 and day
2 242.4816348
Low price of Day3 - projected low price day 3
-
48.07163476
Difference between projected low day 3 and actual day 3 as a variance.
-
0.198248559
-
19.82485594Figure 4.5.1 demonstrates the formula for predicting the day using the Low stock values.
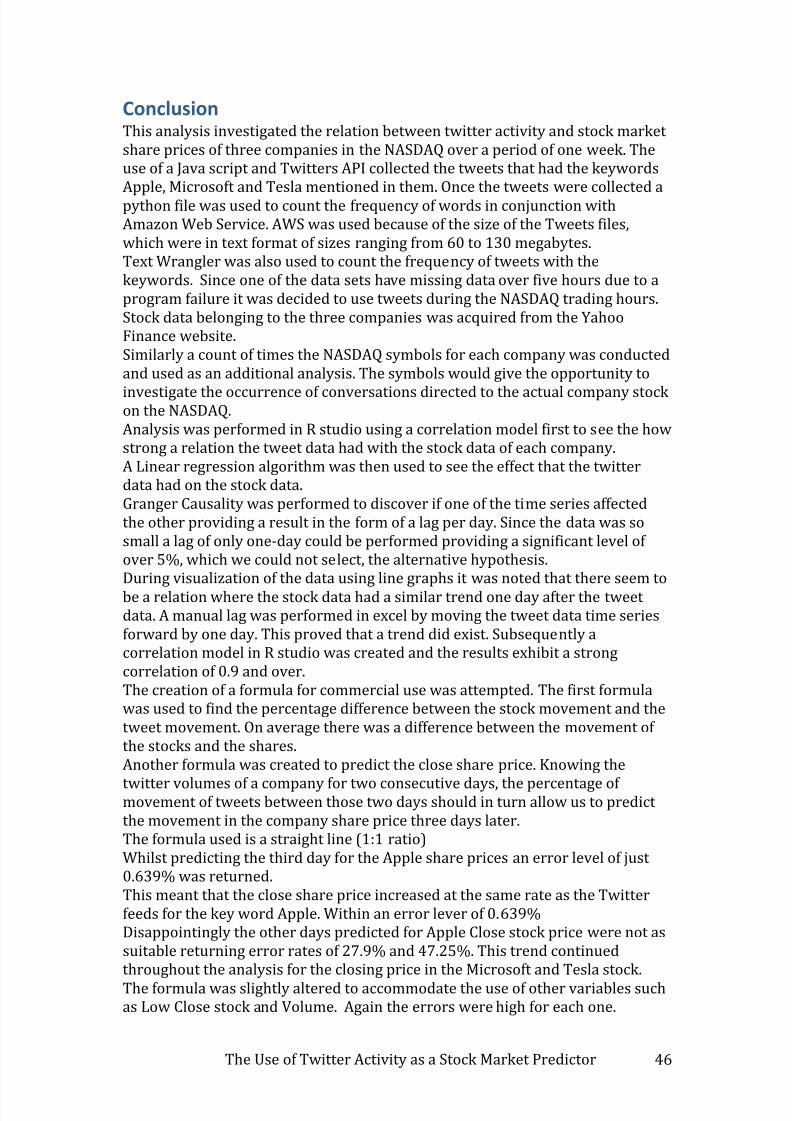
Tweets day1 - day2 -734
Volume day 1 * difference of tweets day1 and day 2 1369177.703
Volume day 1 + Volume day 1 * difference of tweets day1 and day 2 8580677.703
Volume Day3 - projected low price day 3
-
877677.7031
Difference between projected Volume day 3 and actual day 3 as a
variance.
-
0.102285359
-
10.22853594
Figure 4.4.9 demonstrates the formula for predicting the third day using the Volume
values.
When the Low Stock and Volume values were placed into the formula they alsodisplayed high errors. Low Stock had an error of over 19% and the Volumevalues had an error over 10%.
7/23/2019 Robert Coyle
http://slidepdf.com/reader/full/robert-coyle 46/91
The Use of Twitter Activity as a Stock Market Predictor 46
ConclusionThis analysis investigated the relation between twitter activity and stock marketshare prices of three companies in the NASDAQ over a period of one week. Theuse of a Java script and Twitters API collected the tweets that had the keywordsApple, Microsoft and Tesla mentioned in them. Once the tweets were collected apython file was used to count the frequency of words in conjunction withAmazon Web Service. AWS was used because of the size of the Tweets files,which were in text format of sizes ranging from 60 to 130 megabytes.Text Wrangler was also used to count the frequency of tweets with thekeywords. Since one of the data sets have missing data over five hours due to aprogram failure it was decided to use tweets during the NASDAQ trading hours.Stock data belonging to the three companies was acquired from the YahooFinance website.Similarly a count of times the NASDAQ symbols for each company was conductedand used as an additional analysis. The symbols would give the opportunity to
investigate the occurrence of conversations directed to the actual company stockon the NASDAQ.Analysis was performed in R studio using a correlation model first to see the howstrong a relation the tweet data had with the stock data of each company.A Linear regression algorithm was then used to see the effect that the twitterdata had on the stock data.Granger Causality was performed to discover if one of the time series affectedthe other providing a result in the form of a lag per day. Since the data was sosmall a lag of only one-day could be performed providing a significant level ofover 5%, which we could not select, the alternative hypothesis.During visualization of the data using line graphs it was noted that there seem tobe a relation where the stock data had a similar trend one day after the tweetdata. A manual lag was performed in excel by moving the tweet data time seriesforward by one day. This proved that a trend did exist. Subsequently acorrelation model in R studio was created and the results exhibit a strongcorrelation of 0.9 and over.The creation of a formula for commercial use was attempted. The first formulawas used to find the percentage difference between the stock movement and thetweet movement. On average there was a difference between the movement ofthe stocks and the shares.Another formula was created to predict the close share price. Knowing the
twitter volumes of a company for two consecutive days, the percentage ofmovement of tweets between those two days should in turn allow us to predictthe movement in the company share price three days later.The formula used is a straight line (1:1 ratio)Whilst predicting the third day for the Apple share prices an error level of just0.639% was returned.This meant that the close share price increased at the same rate as the Twitterfeeds for the key word Apple. Within an error lever of 0.639%Disappointingly the other days predicted for Apple Close stock price were not assuitable returning error rates of 27.9% and 47.25%. This trend continuedthroughout the analysis for the closing price in the Microsoft and Tesla stock.
The formula was slightly altered to accommodate the use of other variables suchas Low Close stock and Volume. Again the errors were high for each one.
7/23/2019 Robert Coyle
http://slidepdf.com/reader/full/robert-coyle 47/91
The Use of Twitter Activity as a Stock Market Predictor 47
The main issue here is that the data set is not developed enough to do this formof analysis. When acquiring the data specific tweets regarding the stock of thecompany should have only being collected. A company on Twitter is competingfor public interest while the stock exchange is competing for capital interest. Inthat aspect some of the Tweets gathered in this analysis are noisy data.
Further Development
Further develop in the project would include extracting tweets and stockdata over a longer period of time. This would have provided the analysiswith a superior result from the Granger Causality test.
The tweets need to be selected form a niche community, preferably the
investor community who communicate through Twitter in relation to thestocks of companies. Tweets that have the company symbols and theword “stock” mentioned in them should be gathered using thosekeywords.
Narrowing down the selection of companies and focusing on one wouldsupport in reducing the amount of discrepancies in the tweet count.
Developing a program script to count the lines that a word appears inwithout recounting the word again if it has being mentioned more thanonce in a tweet.
The potential use of developing a formula that could take account of othervariables that would cause movement in stock, such as events like the
release of company financial reports, takeover rumours, mergers or badpublicity.
The process of using a sentiment analysis on the tweets would provide amore accurate result from the data. Analysing Twitter data activity alongwill not provide the analysis with any information about behaviouralattitudes towards the investors.
Sentiment analysis would also provide a better insight into the publicattitude.
7/23/2019 Robert Coyle
http://slidepdf.com/reader/full/robert-coyle 48/91
The Use of Twitter Activity as a Stock Market Predictor 48
Bibliography
Aws.amazon.com, (2014). Word Count Example : Articles & Tutorials : Amazon
Web Services. [online] Available at: http://aws.amazon.com/articles/2273(Accessed 22 May. 2014).
Bollen, J. and Mao, H. (2011) 'Twitter mood as a stock market predictor'Computer .
Datasift.com, (2014). Power Decisions With Social Data | DataSift . [online]Available at: http://datasift.com (Accessed 24 May. 2014).
Dev.twitter.com, (2014). Twitter Developers. [online] Available at:https://dev.twitter.com (Accessed 22 May. 2014).
Finance.yahoo.com, (2014). AAPL Historical Prices | Apple Inc. Stock - Yahoo!
Finance. [online] Available at:http://finance.yahoo.com/q/hp?s=AAPL&a=03&b=01&c=2014&d=03&e=30&f=2014&g=d (Accessed 22 May. 2014).
Mac App Store, (2014). TextWrangler . [online] Available at:https://itunes.apple.com/ie/app/textwrangler/id404010395?mt=12 (Accessed22 May. 2014).
Mittal, A. and Goel, A. (2012) 'Stock prediction using Twitter sentiment analysis'Standford University, CS229(2011 http://cs229. stanford.
edu/proj2011/GoelMittal-StockMarketPredictionUsingTwitterSentimentAnalysis.
pdf).
Simsek, M. and Ozdemir, S. (2012) 'Analysis of the relation between Turkishtwitter messages and stock market index'.
Ucd.ie, (2014). CeADAR. [online] Available at: http://www.ucd.ie/ceadar/(Accessed 26 May. 2014).
Ucd.ie, (2014). Brian Mac Namee | CeADAR. [online] Available at:http://www.ucd.ie/ceadar/people/principalinvestigators/brianmacnamee/(Accessed 26 May. 2014).
Appendix
Project Materials:
https://drive.google.com/folderview?id=0B4pkBIaL1W7CQzVVakgwQ3psNFk&
usp=sharingReferences
7/23/2019 Robert Coyle
http://slidepdf.com/reader/full/robert-coyle 49/91
The Use of Twitter Activity as a Stock Market Predictor 49
Project Proposal
Introduction
The purpose of this project is to study and analyse the activities and trendsassociated to the Mobile World Congress 2014, which is being held from the 24 th to the 27th of February 2014.The Mobile World Congress is the world’s largest exhibition of the mobileindustry. Mobile operators, device manufacturers and technology providers areall represented at the exhibition.With a large amount of manufacturers attending and product launches thesubject can be quite broad.
The objective of this project is to analyse Twitter feeds for activity’s and trendsassociated with the top mobile manufacturers before, during and after the eventand to see how their stock market shares are connected and affected by theTwitter feeds.
Background
As Twitter matures, top brands have realized just how relevant Twitter can be asa marketing and engagement platform.According to Useful Social Media 98% of the top brands are on Twitter and 92%of top brands tweet daily. There are 230 million active users on Twitter; thisprovides brands with a global presence. (USM) “ 92% of top brands Tweet atleast once daily as audiences grow. Study shows Twitter’s maturity as amarketing and engagement platform. 98% of all top brands are active on Twitter.The social network has matured into a valuable and necessary channel formarketing organizations.” (Usefulsocialmedia.com, 2014)i
Releases such as the Samsung Galaxy s5 will hopefully see a surge of Twitteractivity in relation to Samsung during the event. According to Trusted Reviews
the release of the Samsung Galaxy s5 will take place during the event. (TrustedReviews) “The Samsung Galaxy S5 release date looks set to be held in a matter ofdays as the Korean manufacturer issues invites to a February 24 launch event,kicking Samsung Galaxy S5 rumours into overdrive.”(Trusted Reviews, 2014)ii
Using the data from the Twitter feeds I can then analyse them against the stockmarket shares.According to Mac Rumours, Samsung has the biggest phone market share withApple in second place. (Mac Rumours) “Apple Continues to Lose SmartphoneShare, Gain Mobile Phone Share in 4Q 2013” (Mac Rumours, 2014)iii
7/23/2019 Robert Coyle
http://slidepdf.com/reader/full/robert-coyle 50/91
The Use of Twitter Activity as a Stock Market Predictor 50
Similar research has being done in relation to Twitter feeds influencing marketshares but this project will be focusing mainly on the Mobile World Congress inrelation to the markets shares of the top five mobile device manufacturers.
Technical Approach
This objective will be achieved by:
Creating the necessary python coding to use with the Twitter API forretrieving the data.
Gathering all data created on Twitter related to the mobile device brandsbefore, during and after the event.
Gather stock market share prices before, during and after the event of themobile device brands.
Clean all data gathered for analysis
Analysis of the data gathered of Twitter activity against the stock marketshare prices.
Return the results of the analysis.
Special Resources Required
Books to be used:
Python for data analysis Mckinney, W. (2013)
Twitter API: Up and Running: Learn How to Build Applications with theTwitter API Paperback by Kevin Makice. (2009)
Writing Your Dissertation by Swetnam, D. & Swetnam, R. (2000).
Software to be used:
Python
R studio
MYSQL
Microsoft Excel
Microsoft Project
Twitter API
System storage to be used:
Twitter API
At this stage of the project I am unaware of the amount of data that I willaccumulate from Twitter.
7/23/2019 Robert Coyle
http://slidepdf.com/reader/full/robert-coyle 51/91
The Use of Twitter Activity as a Stock Market Predictor 51
Project Plan
Technical Details
The coding I will use to retrieve the data will be python.R coding and Microsoft Excel will then be used to do the analysis of the data.
Systems/Datasets
The datasets used will be all collected by myself using the online Twitter APIwith the python coding to collect specific words, hash tags from the tweets over
the duration of the events operating time per day.
Evaluation/Test and Analysis
I am unable to state how I will test the data due to the fact that we have only hadone class of Data and web mining but I can list the types of analysis that we willbe learning.
Classification
Regression (value estimation)
Similarity matching Clustering
7/23/2019 Robert Coyle
http://slidepdf.com/reader/full/robert-coyle 52/91
The Use of Twitter Activity as a Stock Market Predictor 52
Co-occurrence grouping (frequent itemset mining)
Profiling (behaviour description)
Link Prediction
Data reduction
Causal modelling
Consultation with Specialization Persons
John O’Connor CEO of Wellclever.Wellclever is a startup company that provides the media groups and contentproducers with keyword contextual online advertising solutions.Consulted with John for project ideas. John has over 20 years of experience in theadvertising industry.
(Wellclever, 2014)iv
Oisin Creaner coordinator of the project for NCISpoke to Oisin about project ideas through the use of Twitter API’s.
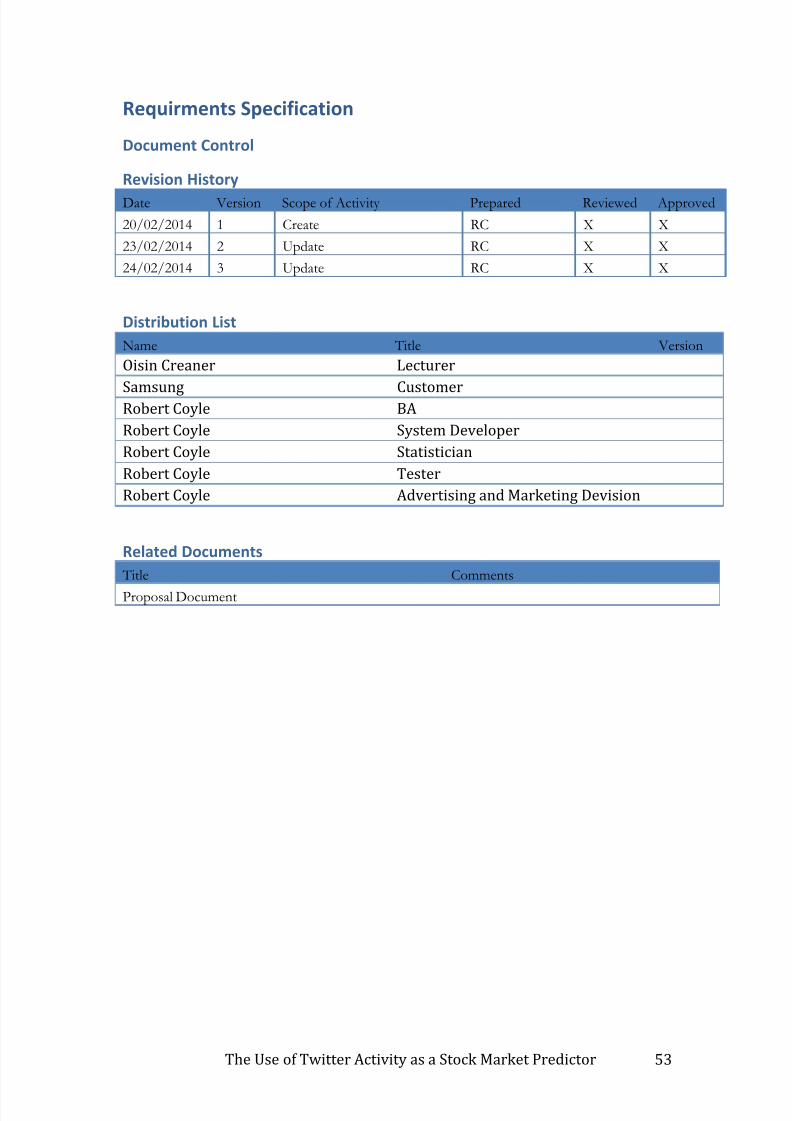
7/23/2019 Robert Coyle
http://slidepdf.com/reader/full/robert-coyle 53/91
The Use of Twitter Activity as a Stock Market Predictor 53
Requirments Specification
Document Control
Revision History
Date Version Scope of Activity Prepared Reviewed Approved
20/02/2014 1 Create RC X X
23/02/2014 2 Update RC X X
24/02/2014 3 Update RC X X
Distribution List
Name Title Version
Oisin Creaner Lecturer
Samsung CustomerRobert Coyle BA
Robert Coyle System Developer
Robert Coyle Statistician
Robert Coyle Tester
Robert Coyle Advertising and Marketing Devision
Related Documents
Title Comments
Proposal Document
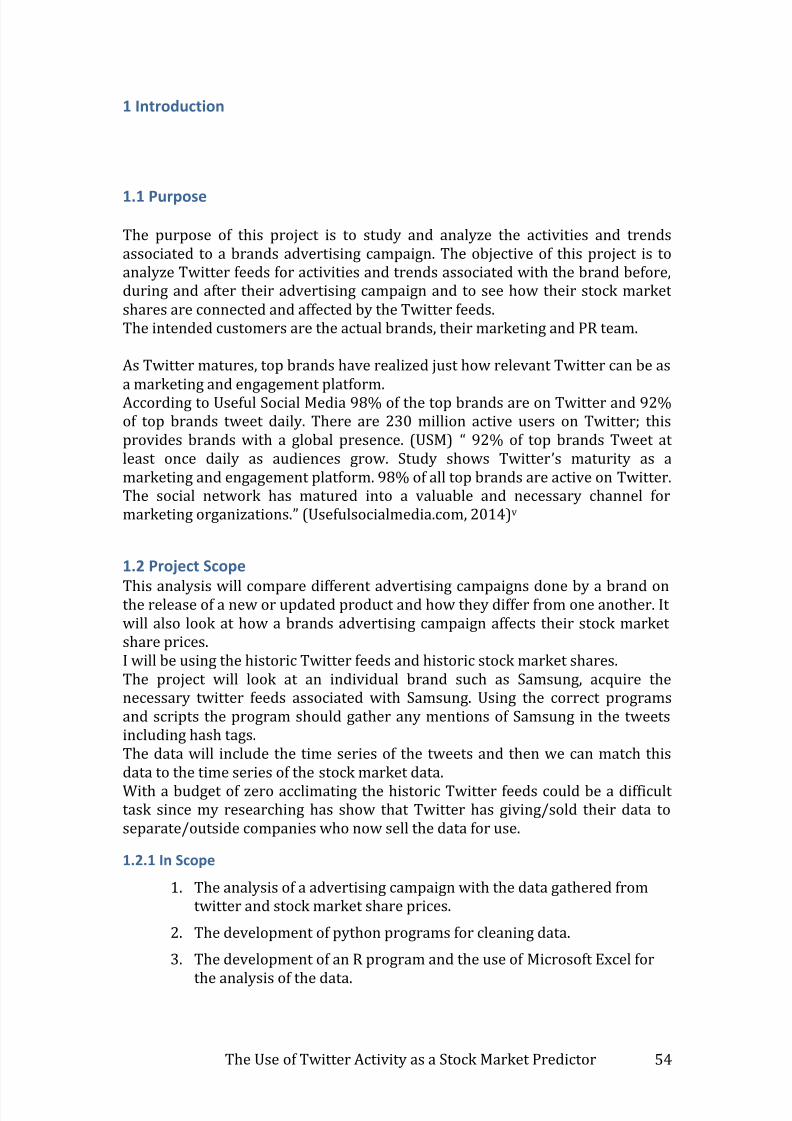
7/23/2019 Robert Coyle
http://slidepdf.com/reader/full/robert-coyle 54/91
The Use of Twitter Activity as a Stock Market Predictor 54
1 Introduction
1.1 Purpose
The purpose of this project is to study and analyze the activities and trendsassociated to a brands advertising campaign. The objective of this project is toanalyze Twitter feeds for activities and trends associated with the brand before,during and after their advertising campaign and to see how their stock marketshares are connected and affected by the Twitter feeds.The intended customers are the actual brands, their marketing and PR team.
As Twitter matures, top brands have realized just how relevant Twitter can be asa marketing and engagement platform.According to Useful Social Media 98% of the top brands are on Twitter and 92%of top brands tweet daily. There are 230 million active users on Twitter; thisprovides brands with a global presence. (USM) “ 92% of top brands Tweet atleast once daily as audiences grow. Study shows Twitter’s maturity as amarketing and engagement platform. 98% of all top brands are active on Twitter.The social network has matured into a valuable and necessary channel formarketing organizations.” (Usefulsocialmedia.com, 2014)v
1.2 Project Scope
This analysis will compare different advertising campaigns done by a brand onthe release of a new or updated product and how they differ from one another. Itwill also look at how a brands advertising campaign affects their stock marketshare prices.I will be using the historic Twitter feeds and historic stock market shares.The project will look at an individual brand such as Samsung, acquire thenecessary twitter feeds associated with Samsung. Using the correct programsand scripts the program should gather any mentions of Samsung in the tweetsincluding hash tags.The data will include the time series of the tweets and then we can match thisdata to the time series of the stock market data.
With a budget of zero acclimating the historic Twitter feeds could be a difficulttask since my researching has show that Twitter has giving/sold their data toseparate/outside companies who now sell the data for use.
1.2.1 In Scope
1. The analysis of a advertising campaign with the data gathered fromtwitter and stock market share prices.
2. The development of python programs for cleaning data.
3. The development of an R program and the use of Microsoft Excel for
the analysis of the data.
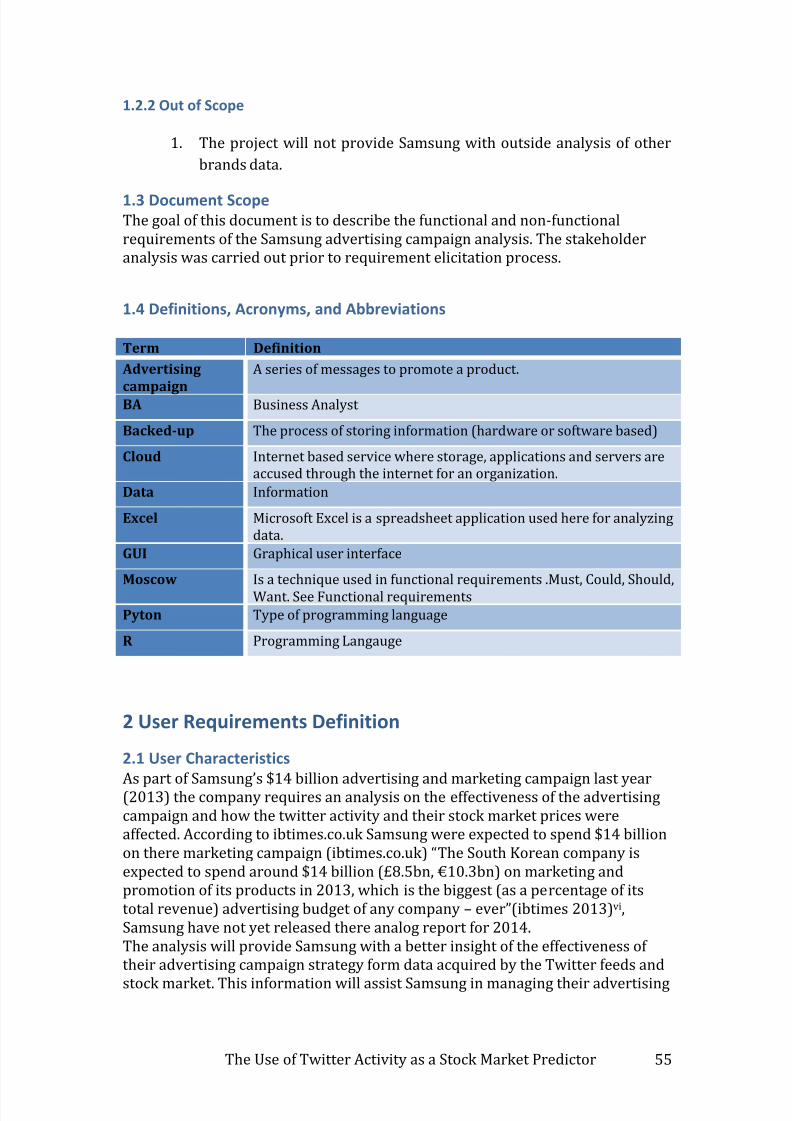
7/23/2019 Robert Coyle
http://slidepdf.com/reader/full/robert-coyle 55/91
The Use of Twitter Activity as a Stock Market Predictor 55
1.2.2 Out of Scope
1. The project will not provide Samsung with outside analysis of other
brands data.
1.3 Document ScopeThe goal of this document is to describe the functional and non-functionalrequirements of the Samsung advertising campaign analysis. The stakeholderanalysis was carried out prior to requirement elicitation process.
1.4 Definitions, Acronyms, and Abbreviations
Term Definition
Advertising
campaign
A series of messages to promote a product.
BA Business Analyst
Backed-up The process of storing information (hardware or software based)
Cloud Internet based service where storage, applications and servers areaccused through the internet for an organization.
Data Information
Excel Microsoft Excel is a spreadsheet application used here for analyzingdata.
GUI Graphical user interface
Moscow Is a technique used in functional requirements .Must, Could, Should,Want. See Functional requirements
Pyton Type of programming language
R Programming Langauge
2 User Requirements Definition
2.1 User Characteristics
As part of Samsung’s $14 billion advertising and marketing campaign last year(2013) the company requires an analysis on the effectiveness of the advertisingcampaign and how the twitter activity and their stock market prices wereaffected. According to ibtimes.co.uk Samsung were expected to spend $14 billionon there marketing campaign (ibtimes.co.uk) “The South Korean company isexpected to spend around $14 billion (£8.5bn, €10.3bn) on marketing andpromotion of its products in 2013, which is the biggest (as a percentage of itstotal revenue) advertising budget of any company – ever”(ibtimes 2013)vi,Samsung have not yet released there analog report for 2014.The analysis will provide Samsung with a better insight of the effectiveness oftheir advertising campaign strategy form data acquired by the Twitter feeds and
stock market. This information will assist Samsung in managing their advertising
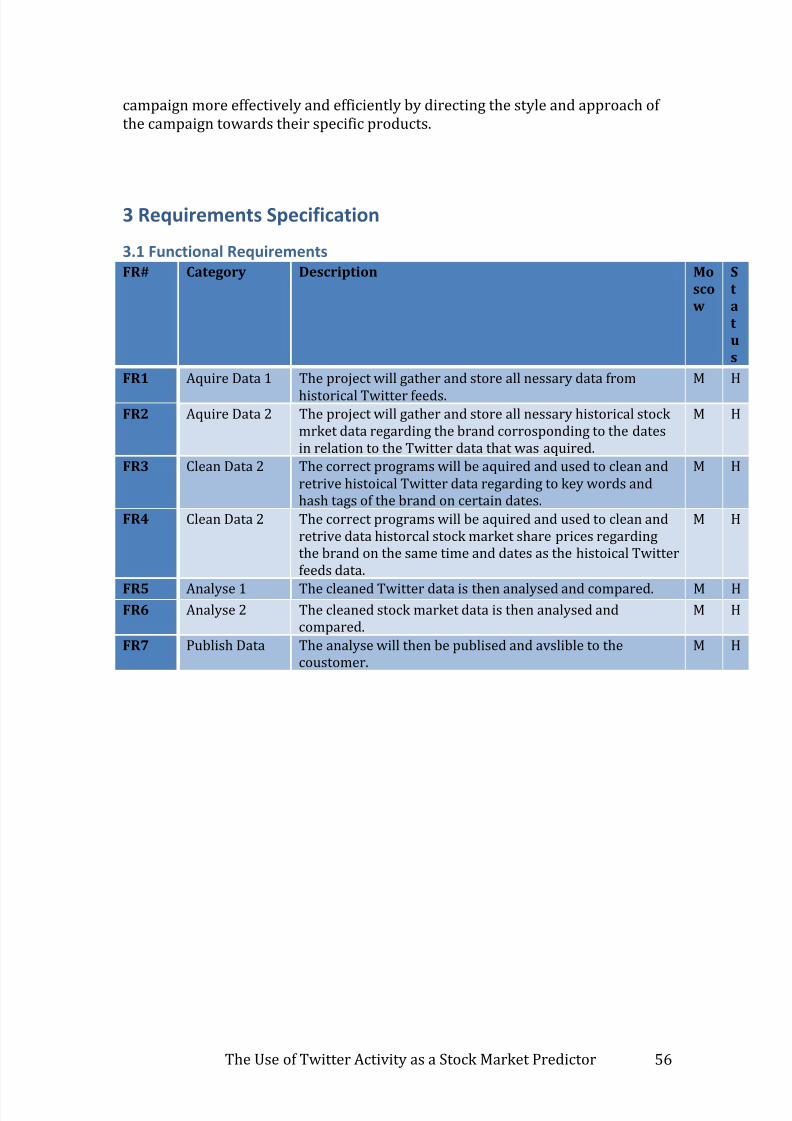
7/23/2019 Robert Coyle
http://slidepdf.com/reader/full/robert-coyle 56/91
The Use of Twitter Activity as a Stock Market Predictor 56
campaign more effectively and efficiently by directing the style and approach ofthe campaign towards their specific products.
3 Requirements Specification
3.1 Functional Requirements
FR# Category Description Mo
sco
w
S
t
a
t
u
s
FR1 Aquire Data 1 The project will gather and store all nessary data from
historical Twitter feeds.
M H
FR2 Aquire Data 2 The project will gather and store all nessary historical stockmrket data regarding the brand corrosponding to the datesin relation to the Twitter data that was aquired.
M H
FR3 Clean Data 2 The correct programs will be aquired and used to clean andretrive histoical Twitter data regarding to key words andhash tags of the brand on certain dates.
M H
FR4 Clean Data 2 The correct programs will be aquired and used to clean andretrive data historcal stock market share prices regardingthe brand on the same time and dates as the histoical Twitterfeeds data.
M H
FR5 Analyse 1 The cleaned Twitter data is then analysed and compared. M HFR6 Analyse 2 The cleaned stock market data is then analysed and
compared.M H
FR7 Publish Data The analyse will then be publised and avslible to thecoustomer.
M H
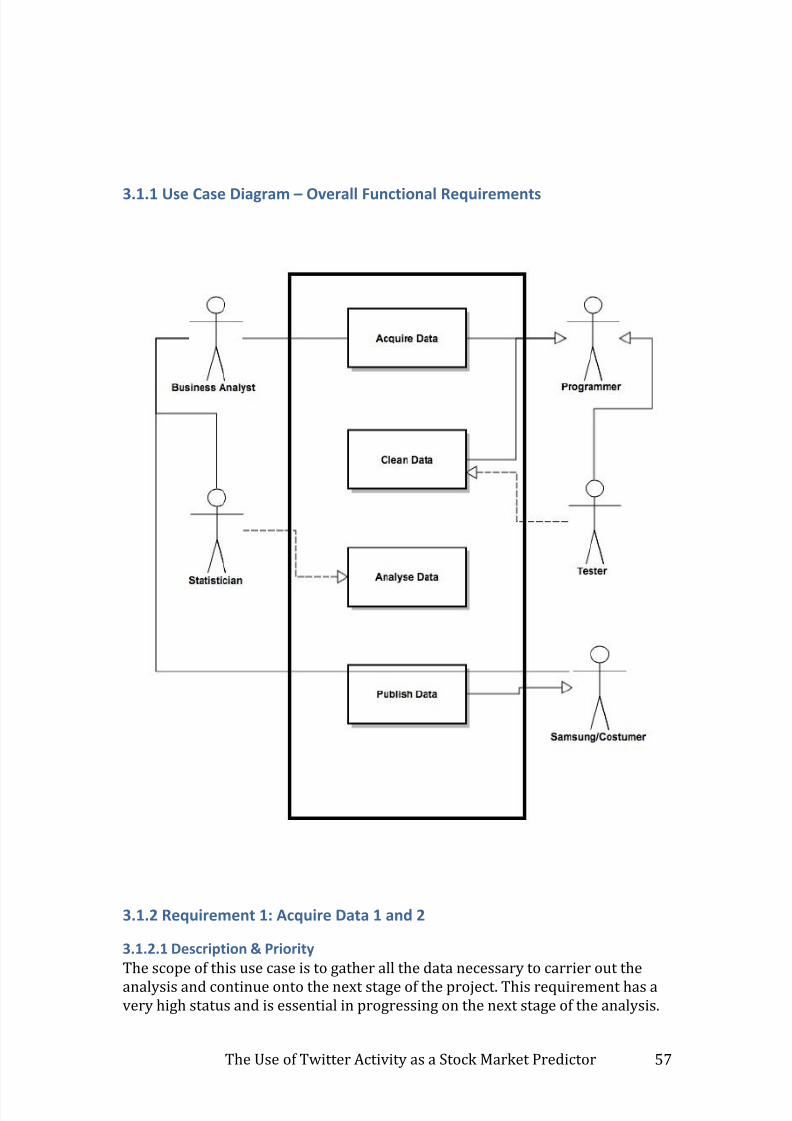
7/23/2019 Robert Coyle
http://slidepdf.com/reader/full/robert-coyle 57/91
The Use of Twitter Activity as a Stock Market Predictor 57
3.1.1 Use Case Diagram –
Overall Functional Requirements
3.1.2 Requirement 1: Acquire Data 1 and 2
3.1.2.1 Description & Priority
The scope of this use case is to gather all the data necessary to carrier out the
analysis and continue onto the next stage of the project. This requirement has avery high status and is essential in progressing on the next stage of the analysis.
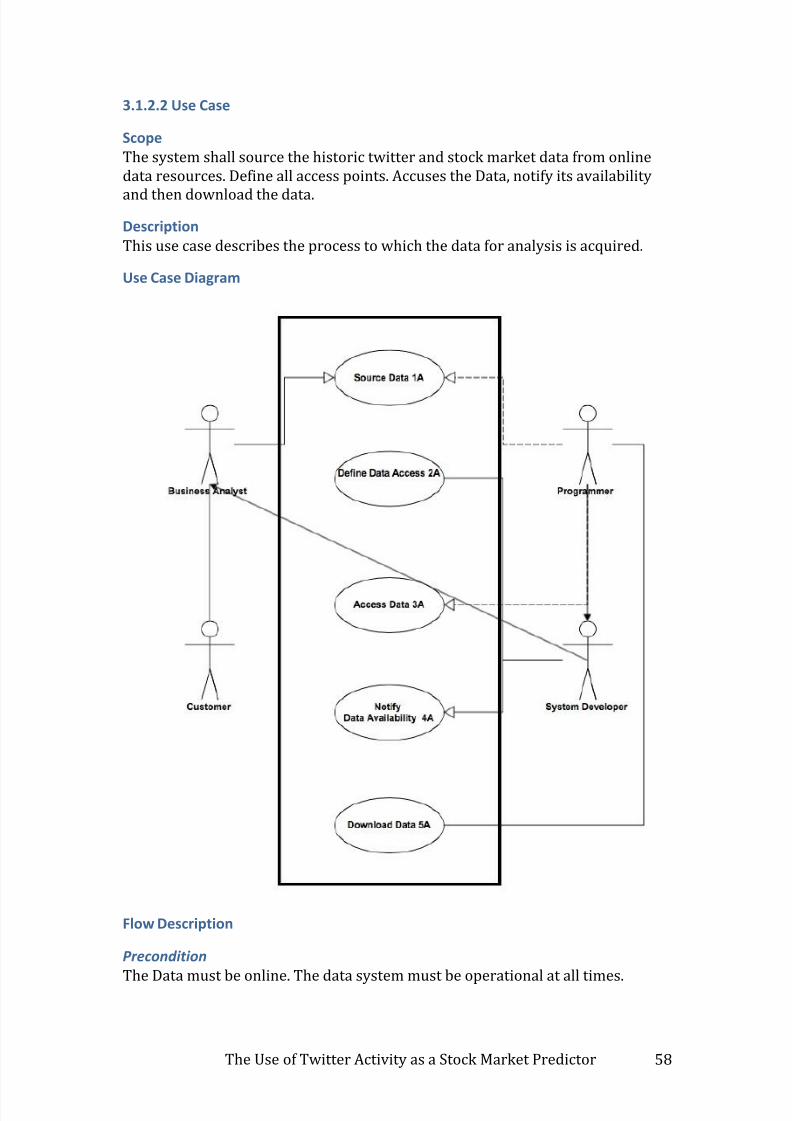
7/23/2019 Robert Coyle
http://slidepdf.com/reader/full/robert-coyle 58/91
The Use of Twitter Activity as a Stock Market Predictor 58
3.1.2.2 Use Case
Scope
The system shall source the historic twitter and stock market data from onlinedata resources. Define all access points. Accuses the Data, notify its availability
and then download the data.
Description
This use case describes the process to which the data for analysis is acquired.
Use Case Diagram
Flow Description
Precondition
The Data must be online. The data system must be operational at all times.
7/23/2019 Robert Coyle
http://slidepdf.com/reader/full/robert-coyle 59/91
The Use of Twitter Activity as a Stock Market Predictor 59
Activation
Use case is activated when the programmer connects to the system online.
Main Flow
1. Step: 1A. Programmer and System Developer source data.
2. Step: 2A. Programmer and Business Analyst validate data with theCustomer.
3. Step: 3A. Programmer accesses the data.
4. Step: 4A. Programmer notifies data availability to the System
Developer.
5. Step: 5A. Programmer downloads data for cleaning.
Alternate Flow
1. Step: 1A. Programmer and System Developer source data.2. Step: 2A. Programmer and Business Analyst validate data with the
Customer.
3. Step: 2A. Customer does not validate data. Step 1A is set to
recommence.
4. Step: 1A. Programmer and System Developer source data.
5. Step: 2A. Programmer and Business Analyst validate data with the
Customer.
6. Step: 3A. Programmer accesses the data.
7. Step: 4A. Programmer notifies data availability to the SystemDeveloper.
8. Step: 5A. Programmer downloads data for cleaning.
Exceptional Flow
1. Step: 1A. Programmer and System Developer source data.
2. Step: 2A. Programmer and Business Analyst validate data with the
Customer.
3. Step: 2A. Customer does not validate data. Data is unavailable.
4. Use case ends
Termination
The system has gathered all necessary data. The data is then exported on thecloud storage system. This process has now being terminated.
Post Condition
All Data gathered, move onto the next step.
7/23/2019 Robert Coyle
http://slidepdf.com/reader/full/robert-coyle 60/91
The Use of Twitter Activity as a Stock Market Predictor 60
3.1.3 Requirement 2: Clean Data 1 and 2
3.1.3.1 Description & Priority
The scope of this use case is to clean all the data gathered from the perviousrequirement. A programmer and tester investigate the data for any errors such
as missing data and fix the errors. This requirement has a very high status and isessential in progressing on the next stage of the analysis.
3.1.3.2 Use Case
Scope
The system shall clean all data sets gathered from the pervious requirement.Define all error points. Get recommendations for fixing the errors. Fixes theerrors and then exports the data for analysis.
Description
This use case describes the process to which the data is cleaned for analysis.
7/23/2019 Robert Coyle
http://slidepdf.com/reader/full/robert-coyle 61/91
The Use of Twitter Activity as a Stock Market Predictor 61
Use Case Diagram
Flow Description
PreconditionThe Data must be stored and available for cleaning at all times.
Activation
Use case is activated when the programmer connects to the cloud storage systemand retrieves the data.
Main Flow
1. Step: 1B. Programmer and System Developer retrieve data from the
cloud storage system.
2. Step: 2B. Programmer and Tester identify errors in the data set.
3. Step: 3B. Programmer receives recommendations from SystemDeveloper.
7/23/2019 Robert Coyle
http://slidepdf.com/reader/full/robert-coyle 62/91
The Use of Twitter Activity as a Stock Market Predictor 62
4. Step: 4B. Programmer with the help of the Tester fixes errors and
notifies the System Developer.
5. Step: 5B. Programmer exports the data for analysis.
Alternate Flow
1. Step: 1B. Programmer and System Developer retrieve data from the
cloud storage system.
2. Step: 2B. Programmer and Tester identify errors in the data set.
3. Step: 3B. Programmer receives recommendations from System
Developer.
4. Step: 4B. Programmer with the help of the Tester fixes errors and
notifies the System Developer.
5. Step: 2B. Programmer and Tester test system again and identify more
errors in the data set.
6. Step: 3B. Programmer receives recommendations from System
Developer.
7. Step: 4B. Programmer with the help of the Tester fixes errors and
notifies the System Developer.
8. Step: 5B. Programmer exports the data for analysis.
Exceptional Flow
1. Step: 1B. Programmer and System Developer retrieve data from the
cloud storage system.
2. Step: 2B. Programmer and Tester identify errors in the data set.
3. Step: 3B. Programmer receives recommendations from System
Developer.
4. Step: 4B. Programmer with the help of the Tester fixes cannot fix
errors. Data is corrupt.
5. Use case ends.
Termination
The system cleaned all acquired data. The data is then saved onto the cloudstorage system and exported for analysis. This process has now beingterminated.
Post Condition
All data cleaned, move onto the next step.

7/23/2019 Robert Coyle
http://slidepdf.com/reader/full/robert-coyle 63/91
The Use of Twitter Activity as a Stock Market Predictor 63
3.1.4 Requirement 2: Analyze Data
3.1.4.1 Description & Priority
The scope of this use case is to analyze all the data gathered and cleaned fromthe pervious requirements. A Business Analyst and Statistician examine and
study the data for Analysis. This requirement has a very high status and isessential in progressing on the next stage of the analysis.
3.1.4.2 Use Case
Scope
This process involves the skills and management of the Statistician and BusinessAnalyst to compare and analyze all data.The process shall calculate and prove/predict outcomes form the data with thehelp of graphs for visualizing. Then all proven data is backed-up and stored.
DescriptionThis use case describes the process to which the data analyzed.
7/23/2019 Robert Coyle
http://slidepdf.com/reader/full/robert-coyle 64/91
The Use of Twitter Activity as a Stock Market Predictor 64
Use Case Diagram
Flow Description
PreconditionThe Data must be available for analysis at all times.
Activation
Use case is activated when the BA and the Statistician connects to the cloudstorage system and retrieves the data.
Main Flow
1. Step: 1C. BA and Statistician retrieve data from the cloud storage
system.
7/23/2019 Robert Coyle
http://slidepdf.com/reader/full/robert-coyle 65/91
The Use of Twitter Activity as a Stock Market Predictor 65
2. Step: 2C. The Statistician and BA explore and understand the data set.
3. Step: 3C. Statistician begins the calculations.
4. Step: 4C. Statistician and BA began to visualize the data.
5. Step: 5C. Programmer backs up and stores findings with the approval
of the BA.
Alternate Flow
1. Step: 1C. BA and Statistician retrieve data from the cloud storage
system.
2. Step: 2C. The Statistician and BA explore and understand the data set.
3. Step: 3C. Statistician begins the calculations.
4. Step: 4C. Statistician and BA began to visualize the data. Ba requests
the data to be recalculated with a different approach.
5. Step: 3C. Statistician begins the new calculations.
6. Step: 4C. Statistician and BA began to visualize the data.
7. Step: 5C. Programmer backs up and stores findings with the approval
of the BA.
Exceptional Flow
1. Step: 1C. BA and Statistician retrieve data from the cloud storage
system.
2. Step: 2C. The Statistician and BA explore and understand the data set.
Statistician and BA are unable to understand the data set. Ba requests
new data set.
3. Use case ends
Termination
The analysis is completed. The data is then saved onto the cloud storage systemand exported for Publishing. This process has now being terminated.
Post ConditionAll data analyzed, move onto the next step.
3.1.5 Requirement 2: Publish Data
3.1.5.1 Description & Priority
The scope of this use case is to publish the findings from the analysis approvedby the pervious requirements. A Business Analyst consults the Customer ontopics such as the proprietor of the data, the goal from the publication, the targetaudience/data consumer (is the data confidential and for internal use only),
media to which it is published and the release date.This requirement has a very high status.
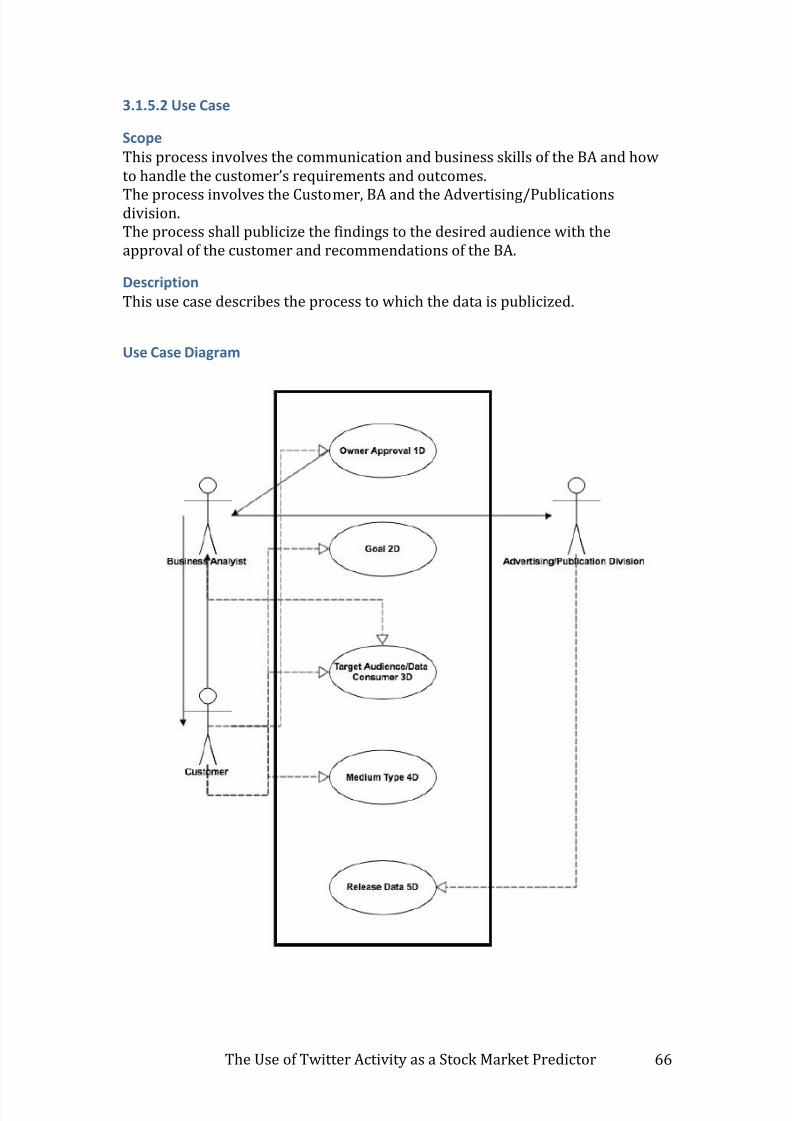
7/23/2019 Robert Coyle
http://slidepdf.com/reader/full/robert-coyle 66/91
The Use of Twitter Activity as a Stock Market Predictor 66
3.1.5.2 Use Case
Scope
This process involves the communication and business skills of the BA and howto handle the customer’s requirements and outcomes.
The process involves the Customer, BA and the Advertising/Publicationsdivision.The process shall publicize the findings to the desired audience with theapproval of the customer and recommendations of the BA.
Description
This use case describes the process to which the data is publicized.
Use Case Diagram
7/23/2019 Robert Coyle
http://slidepdf.com/reader/full/robert-coyle 67/91
The Use of Twitter Activity as a Stock Market Predictor 67
Flow Description
Precondition
The Data must be available for analysis at all times.Customer/Client must be available for analysis at all times.
Activation
Use case is activated when the findings are present to BA, Customer andAdvertising/Publication Division and all three are engaged in communication.
Main Flow
1. Step: 1D. BA, Customer and Advertising/Publication Division retrieve
analysis findings. Findings have acquired owner’s approval.
2. Step: 2D. BA and Customer discuss the objective of the findings
release.
3. Step: 3D. BA and Customer began to agree on the target audience/data
consumer.
4. Step: 4D. Customer decides the medium type/the style and method of
publicizing the data e.g. websites, newspaper, with the BA’s approval
and the assistance of the Advertising/Publication Division.
5. Step: 5D. BA notifies Advertising/Publication Division to publish the
data.
Alternate Flow
1. Step: 1D. BA, Customer and Advertising/Publication Division retrieve
analysis findings. Findings have acquired owner’s approval.
2. Step: 2D. BA and Customer discuss the objective of the findings
release.
3. Step: 3D. BA and Customer began to agree on the target audience/data
consumer.
4. Step: 4D. Customer decides the medium type/the style and method of
publicizing the data e.g. websites, newspaper, with the BA’s approvaland the assistance of the Advertising/Publication Division. Customer
decides to recommence Step: 3D. Again to change the publication
approach.
5. Step: 3D. BA and Customer began to agree on a new target
audience/data consumer
6. Step: 4D. Customer decides the medium type/the style and method of
publicizing the data e.g. websites, newspaper, with the BA’s approval
and the assistance of the Advertising/Publication Division.
7. Step: 5D. BA notifies Advertising/Publication Division to publish thedata.
7/23/2019 Robert Coyle
http://slidepdf.com/reader/full/robert-coyle 68/91
The Use of Twitter Activity as a Stock Market Predictor 68
Exceptional Flow
1. Step: 1D. BA, Customer and Advertising/Publication Division retrieve
analysis findings. Findings have not acquired owner’s approval.
Customer decides not to publicize the data findings due to the highimportance and confidentiality of the findings.
2. Use case ends
Termination
The publication of the data is completed. This process has now being terminated.
Post Condition
All data publicize, all steps completed.
3.2 Non-Functional Requirements
3.2.1 Availability: Must Have
The information must be available at all times for analysis.
3.2.2 Storage Requirements: Must Have
The data kept during and after the analysis should be stored in a secure facility.Cloud storage security protocols must be assessed. The must be enough capacity
in the cloud to hold the large amount of data.
3.2.3 Connection Reliability: Must Have
It must have a reliable connection at all times when retrieving, uploading andupdating the data. Connection lost could transpire into losing data.
3.2.4 Connection Speed: Must Have
It must have fast online connection. This is needed when retrieving, uploadingand updating the data. A large data set could take some time to upload.
3.2.5 Backup and Recovery: Must HaveThe data must be easily accessed, backed up and updated. It must have a systemrecovery in the case of a system failure.
3.2.6 Program to clean data: Must Have
The analysis must have the correct programs to clean and fix any errors in thedata.
3.2.7 Software Analysis tools: Must Have
The analysis must have the correct software analysis tools that all divisions ofthe analysis can exercise.
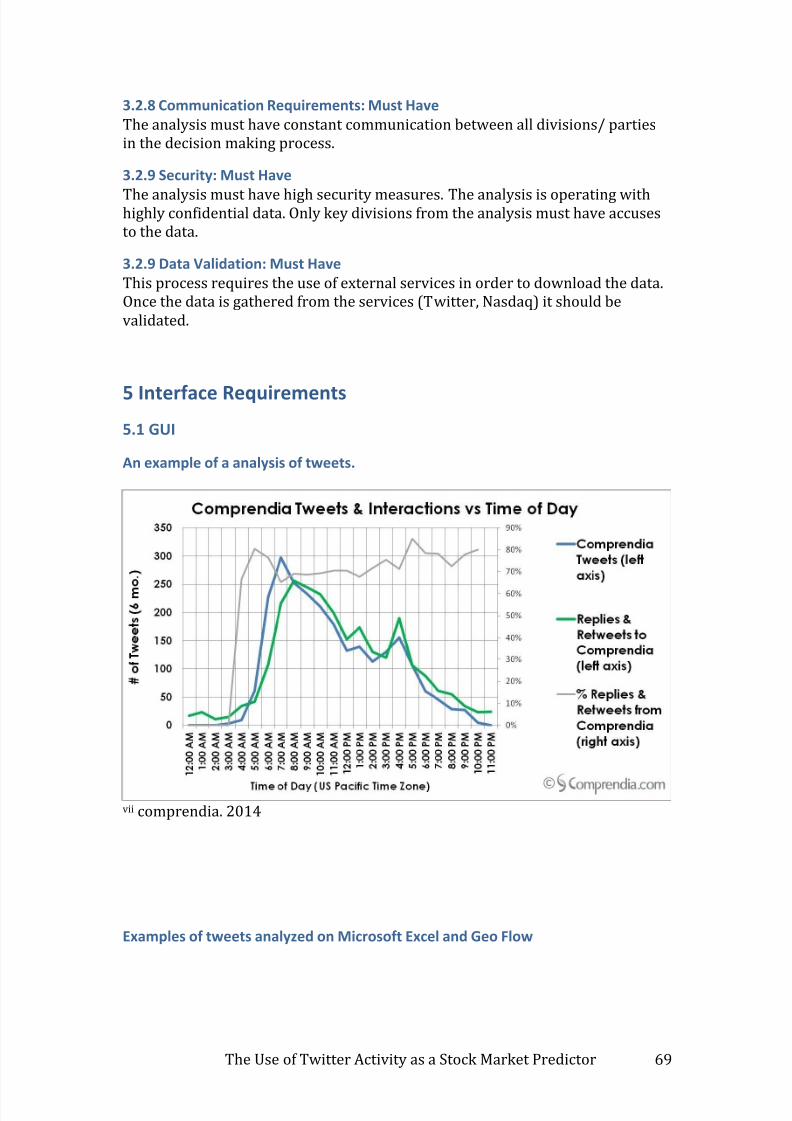
7/23/2019 Robert Coyle
http://slidepdf.com/reader/full/robert-coyle 69/91
The Use of Twitter Activity as a Stock Market Predictor 69
3.2.8 Communication Requirements: Must Have
The analysis must have constant communication between all divisions/ partiesin the decision making process.
3.2.9 Security: Must Have
The analysis must have high security measures. The analysis is operating withhighly confidential data. Only key divisions from the analysis must have accusesto the data.
3.2.9 Data Validation: Must Have
This process requires the use of external services in order to download the data.Once the data is gathered from the services (Twitter, Nasdaq) it should bevalidated.
5 Interface Requirements
5.1 GUI
An example of a analysis of tweets.
vii comprendia. 2014
Examples of tweets analyzed on Microsoft Excel and Geo Flow
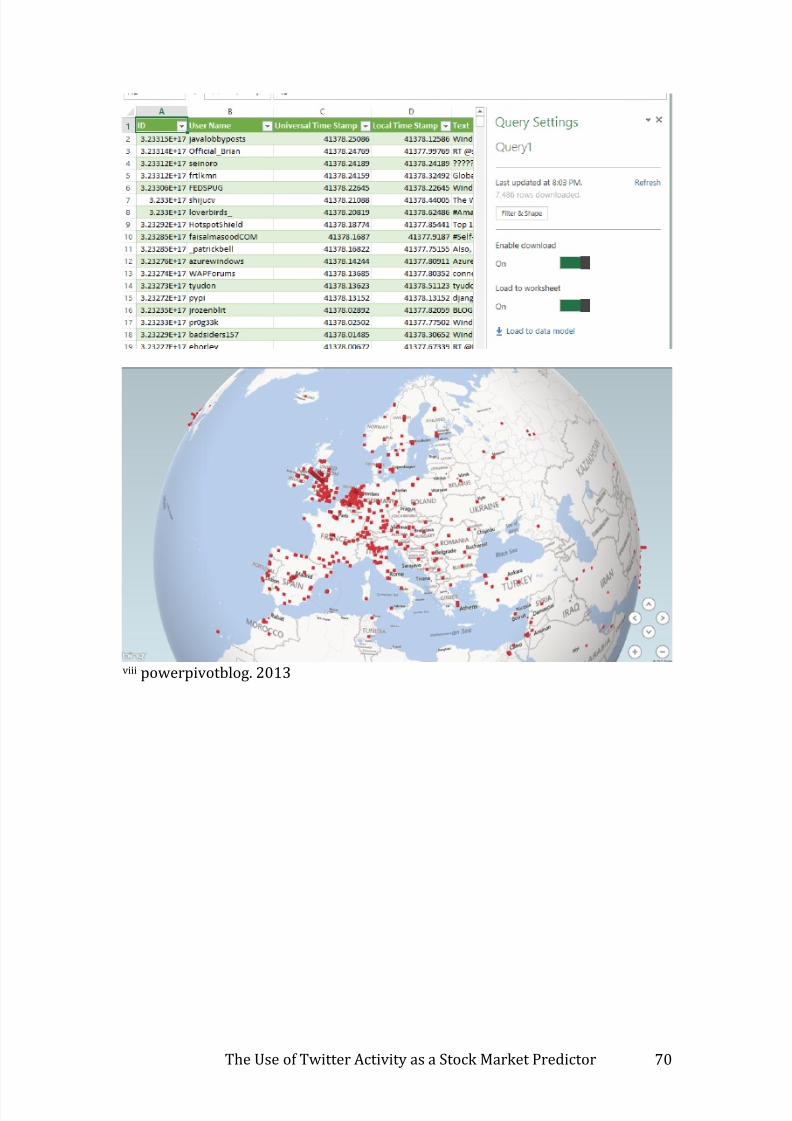
7/23/2019 Robert Coyle
http://slidepdf.com/reader/full/robert-coyle 70/91
The Use of Twitter Activity as a Stock Market Predictor 70
viii powerpivotblog. 2013
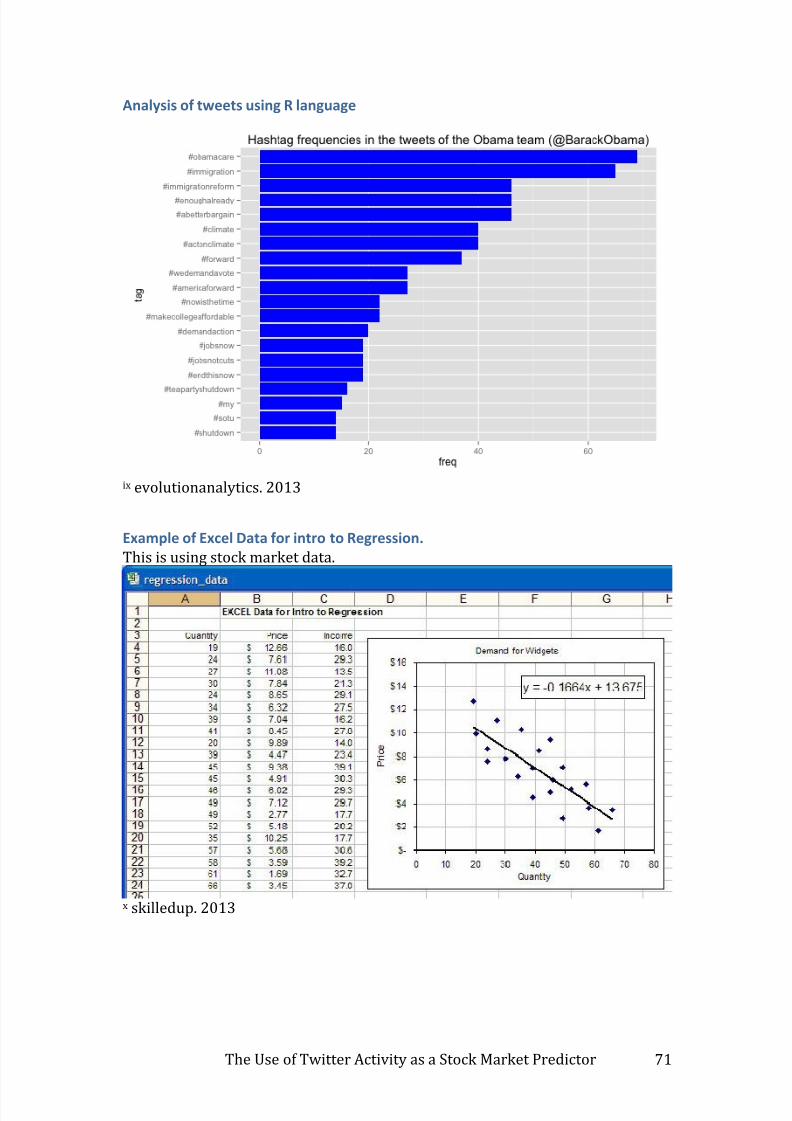
7/23/2019 Robert Coyle
http://slidepdf.com/reader/full/robert-coyle 71/91
The Use of Twitter Activity as a Stock Market Predictor 71
Analysis of tweets using R language
ix evolutionanalytics. 2013
Example of Excel Data for intro to Regression.
This is using stock market data.
x skilledup. 2013
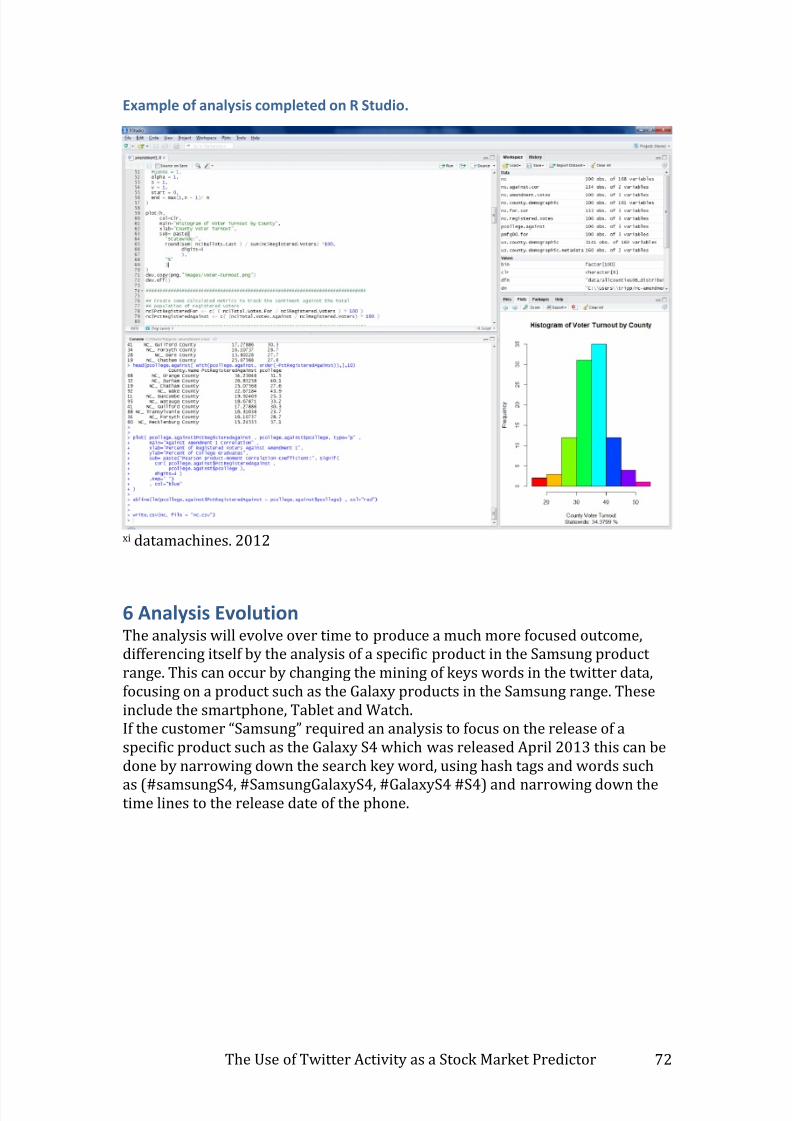
7/23/2019 Robert Coyle
http://slidepdf.com/reader/full/robert-coyle 72/91
The Use of Twitter Activity as a Stock Market Predictor 72
Example of analysis completed on R Studio.
xi datamachines. 2012
6 Analysis EvolutionThe analysis will evolve over time to produce a much more focused outcome,differencing itself by the analysis of a specific product in the Samsung productrange. This can occur by changing the mining of keys words in the twitter data,focusing on a product such as the Galaxy products in the Samsung range. Theseinclude the smartphone, Tablet and Watch.If the customer “Samsung” required an analysis to focus on the release of aspecific product such as the Galaxy S4 which was released April 2013 this can bedone by narrowing down the search key word, using hash tags and words such
as (#samsungS4, #SamsungGalaxyS4, #GalaxyS4 #S4) and narrowing down thetime lines to the release date of the phone.
7/23/2019 Robert Coyle
http://slidepdf.com/reader/full/robert-coyle 73/91
The Use of Twitter Activity as a Stock Market Predictor 73
Progress Management Report 1
Document Location
This document will be uploaded through Turnitin.
Revision History
Date of this revision: 9/03/14
Revisiondate
Previsionrevisiondate
Summary of changes Changesmarked
9/03/14 First Issue
ApprovalsThis project requires the following approvals.
Name Signature Title Date of issue Version
Robert Coyle ProjectManager
10/03/14 1
Distribution
Name Title Date of issue Version
Oisin Creaner Project Lecturer 10/03/14 1
7/23/2019 Robert Coyle
http://slidepdf.com/reader/full/robert-coyle 74/91
The Use of Twitter Activity as a Stock Market Predictor 74
Purpose of Document Is to provide Oisin Creaner the project lecturer with a summary of the status ofthe project.
Date of report
09/03/14
Period covered
10/02/14 – 9/03/14
Schedule Status
This project is still on schedule at this interval.
Updated Gantt chart
Definitions, Acronyms, and Abbreviations
Term Definition
API Application programming interface
JSON JavaScript Object Notation
NASDAQ American Stock Exchange
RSS Rich Site Summary
7
4
7
5
1
51
25
3
8
3
20
03-Feb 23-Feb 15-Mar 04-Apr 24-Apr
Project Proposal
Create Python codes
Data retrival from Twitter API and…
Data retrival from Twitter API and…
Management Progress Report 1
Management Progress Report 2
7/23/2019 Robert Coyle
http://slidepdf.com/reader/full/robert-coyle 75/91
The Use of Twitter Activity as a Stock Market Predictor 75
Products completed during this period
Project proposal The project proposal was completed on time. See(Coyle, 2014)
Requirements
specification
Requirements specification was completed ontime with changes t project scope. See (Coyle,2014)
Problems
Actual
Accessing Twitter API Twitter API has being more difficult to accessthan first anticipated due to change ofregulations and updated version of twitter. TheAPI only supports JSON.
Acquiring free historical
data.
Historical feeds are proving to be difficult, astwitter has sold their data to approved sites forresale. As this project has no budget this hasbeing a high impact on the plan. Twitter hasreleased a grant application form online foraccessing their historical data.
Potential
The quality and quantity of
the twitter data.
Not having the JSON code yet I am not sure whatmy expected returned of data will be. Using a site
called Twillert, I acquired some data but the sitewon’t gather more that the first 100 RSS feeds,this rendering the service useless.
Gathering the data in the
required time.
Once I have a response from the Twitterdevelopers grant I can determine whether thehistorical data is possible to acquire and progressto the next stage of the project.
7/23/2019 Robert Coyle
http://slidepdf.com/reader/full/robert-coyle 76/91
The Use of Twitter Activity as a Stock Market Predictor 76
Raid Log:
Risks
7/23/2019 Robert Coyle
http://slidepdf.com/reader/full/robert-coyle 77/91
The Use of Twitter Activity as a Stock Market Predictor 77
Assumptions
Issues
Dependency
Products due for completionBy the next period the following should be accomplished.
Gathering of Twitter feeds. Should have gathered all twitter data eitherhistorical or real time in relation to Samsung.
Gathering of stock market
data.
Should have gathered all Nasdaq data in relationto Samsung in the same time series as the twitterdata.
Analysis of data. Once all data has being gathered analysis can
take place.Preliminary presentation. Should have Preliminary presentation completed.
7/23/2019 Robert Coyle
http://slidepdf.com/reader/full/robert-coyle 78/91
The Use of Twitter Activity as a Stock Market Predictor 78
Projects write up. Commenced first draft.Management Progress
Report 2.
This repot will be the end of this period.
Project Issues StatuesWe currently have 2 issues on the project issue log, these haven’t being resolvedand are currant outstanding. Both are waiting upon external client response.
ConclusionThis project, even with the set backs is still capable of finishing within theoriginal set target dates. Gathering all the data in the next week is paramount forthe success of the project. Any more delays will compromise the quality of theproject.
Currently I am waiting on a response from Twitter in relation with theirDevelopers grant scheme. If this is approved all the historic data from January2013 to March 2014 will be available and can be gathered using JSON codinglanguage, See Dependences Ref: D02.All necessary information has being submitted to the Twitter Developer Grantscheme such as dates, key words and hash tags.
Alternatives:
If this grant is not approved the project can revert back to streaming the
data live form Twitter using JSON language. If the grant approval takes to long the project can revert back to
streaming the data live form Twitter using JSON language.
7/23/2019 Robert Coyle
http://slidepdf.com/reader/full/robert-coyle 79/91
The Use of Twitter Activity as a Stock Market Predictor 79
Progress Management Report 2
Document Location
This document will be uploaded through Turnitin.
Revision History
Date of this revision: 30/03/14
Revisiondate
Previsionrevisiondate
Summary of changes Changesmarked
30/03/14 First Issue
ApprovalsThis project requires the following approvals.
Name Signature Title Date of issue Version
Robert Coyle ProjectManager
30/03/14 1
Distribution
Name Title Date of issue Version
Oisin Creaner Project Lecturer 30/03/14 1
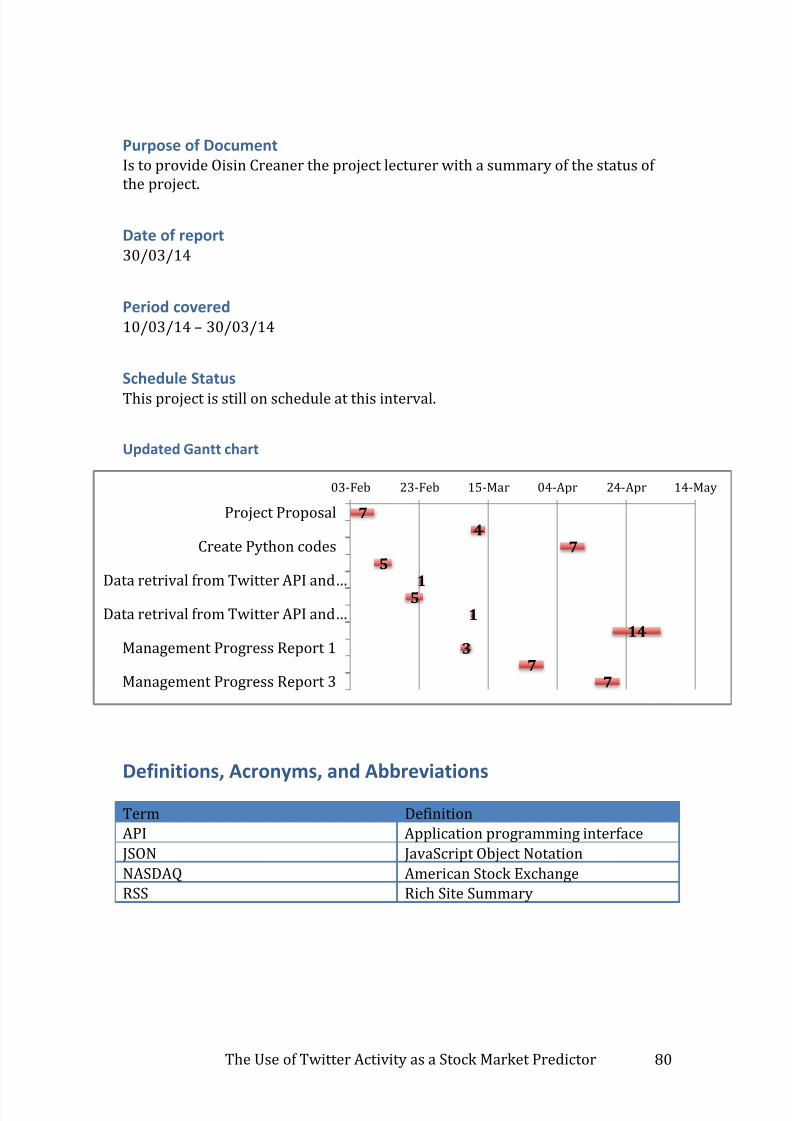
7/23/2019 Robert Coyle
http://slidepdf.com/reader/full/robert-coyle 80/91
The Use of Twitter Activity as a Stock Market Predictor 80
Purpose of Document
Is to provide Oisin Creaner the project lecturer with a summary of the status ofthe project.
Date of report
30/03/14
Period covered
10/03/14 – 30/03/14
Schedule Status
This project is still on schedule at this interval.
Updated Gantt chart
Definitions, Acronyms, and Abbreviations
Term Definition
API Application programming interface
JSON JavaScript Object Notation
NASDAQ American Stock Exchange
RSS Rich Site Summary
74
75
15
114
37
7
03-Feb 23-Feb 15-Mar 04-Apr 24-Apr 14-May
Project Proposal
Create Python codes
Data retrival from Twitter API and…
Data retrival from Twitter API and…
Management Progress Report 1
Management Progress Report 3
7/23/2019 Robert Coyle
http://slidepdf.com/reader/full/robert-coyle 81/91
The Use of Twitter Activity as a Stock Market Predictor 81
Products completed during this period
Progress Management
report 1
The Project management report 1 was completedon time. See (Coyle, 2014)
Problems
Actual
Accessing Twitter API The decision has being made under advisementfrom project lecturers to duplicate the twitterfeeds using the Twilert application.Twilert provides a free service for accessing livetwitter feeds however it only delivers 100 RSSfeeds per day.The trial run lasts for 15 days so it will providethe project over 1500 tweets. These tweets willthen be duplicated to match the historic stockmarket prices.The stock market data provide daily end of dayprices.
Potential
The quality and quantity of
the Twitter data provide
by Twilert.
The Twitter data provided by Twilert must be ofgood quality and having enough data is essential.Data will be duplicated otherwise.
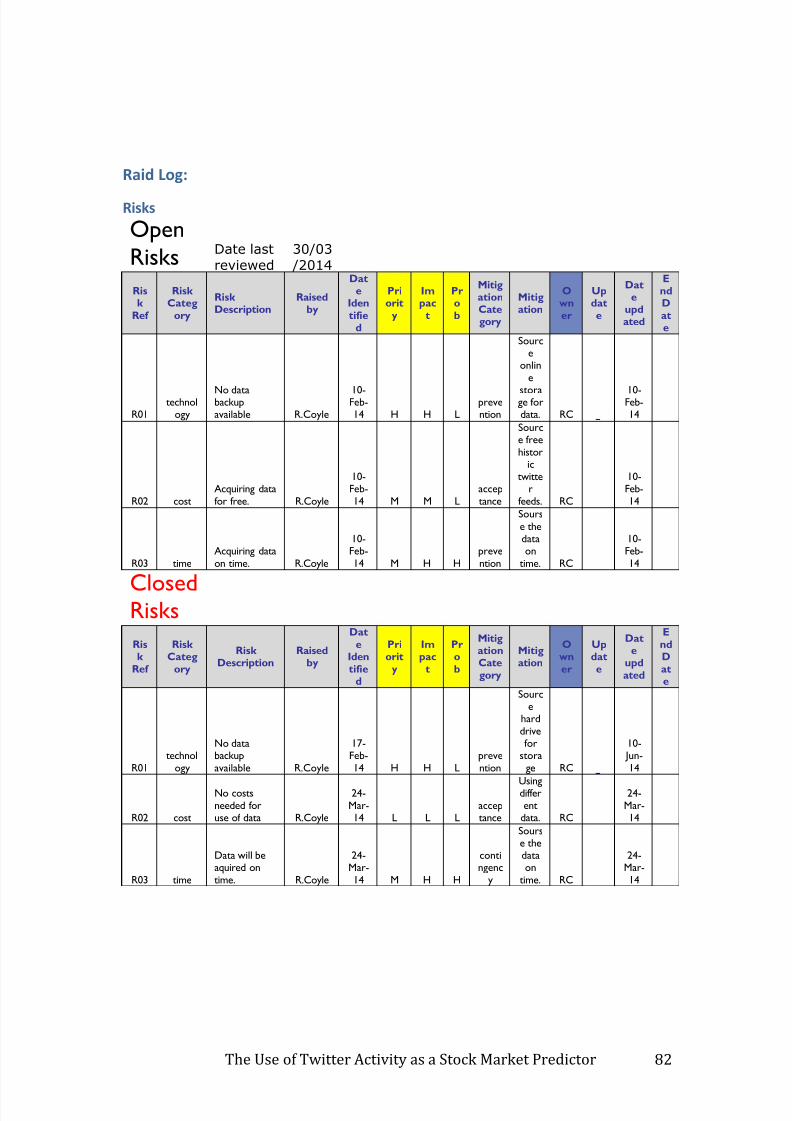
7/23/2019 Robert Coyle
http://slidepdf.com/reader/full/robert-coyle 82/91
The Use of Twitter Activity as a Stock Market Predictor 82
Raid Log:
Risks
Open
RisksDate last
reviewed
30/03
/2014
Risk
Ref
RiskCateg
ory
RiskDescription
Raisedby
Date
Identifie
d
Priorit
y
Impac
t
Pr ob
MitigationCategory
Mitigation
O wner
Update
Date
updated
EndDate
R01technol
ogy
No databackupavailable R.Coyle
10-Feb-14 H H L
prevention
Source
online
storage fordata. RC
10-Feb-14
R02 costAcquiring datafor free. R.Coyle
10-Feb-14 M M L
acceptance
Source freehistor
ictwitte
rfeeds. RC
10-Feb-14
R03 timeAcquiring dataon time. R.Coyle
10-Feb-14 M H H
prevention
Sours
e thedataon
time. RC
10-Feb-14
ClosedRisks
Risk
Ref
RiskCateg
ory
RiskDescription
Raisedby
Date
Identifie
d
Priorit
y
Impac
t
Pr ob
MitigationCategory
Mitigation
O wner
Update
Date
updated
EndDate
R01technol
ogy
No databackupavailable R.Coyle
17-Feb-14 H H L
prevention
Source
harddrivefor
storage RC
10- Jun-14
R02 cost
No costsneeded foruse of data R.Coyle
24-Mar-14 L L L
acceptance
Usingdifferent
data. RC
24-Mar-14
R03 time
Data will beaquired ontime. R.Coyle
24-Mar-14 M H H
contingenc
y
Sourse thedataon
time. RC
24-Mar-14
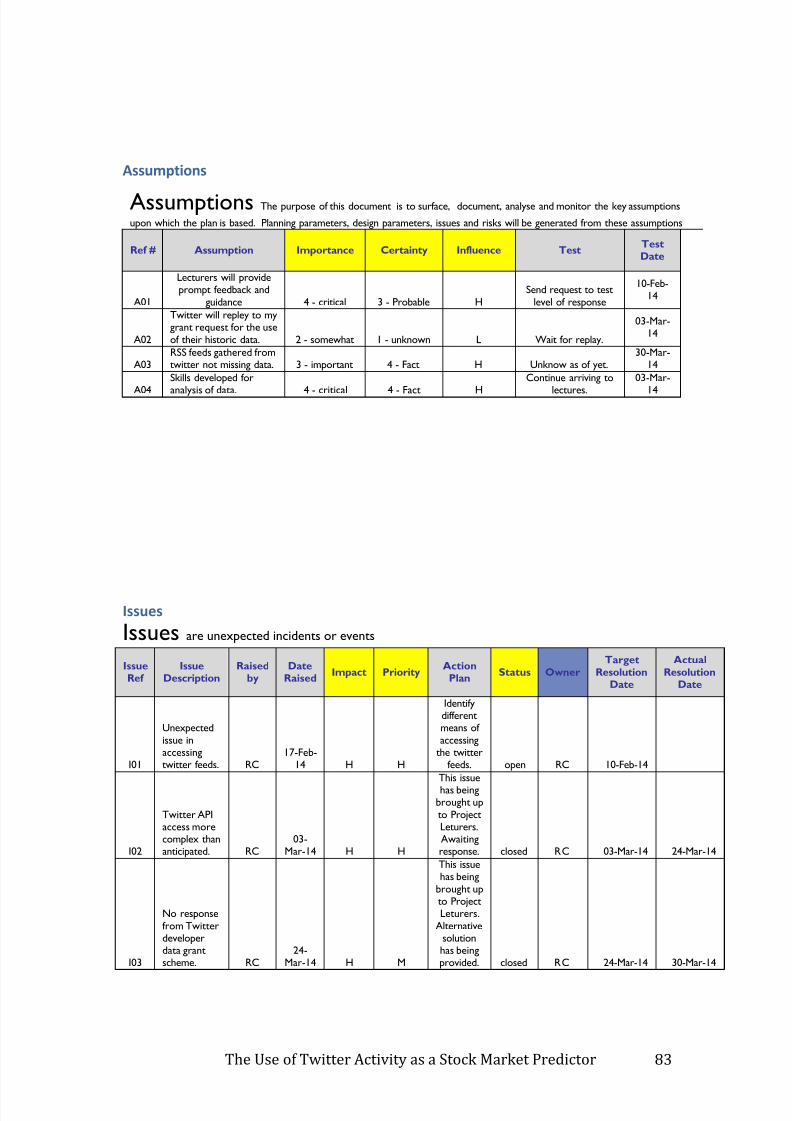
7/23/2019 Robert Coyle
http://slidepdf.com/reader/full/robert-coyle 83/91
The Use of Twitter Activity as a Stock Market Predictor 83
Assumptions
Assumptions The purpose of this document is to surface, document, analyse and monitor the key assumptions
upon which the plan is based. Planning parameters, design parameters, issues and risks will be generated from these assumptions Ref # Assumption Importance Certainty Influence Test
TestDate
A01
Lecturers will provideprompt feedback and
guidance 4 - critical 3 - Probable HSend request to test
level of response
10-Feb-14
A02
Twitter will repley to mygrant request for the useof their historic data. 2 - somewhat 1 - unknown L Wait for replay.
03-Mar-14
A03RSS feeds gathered fromtwitter not missing data. 3 - important 4 - Fact H Unknow as of yet.
30-Mar-14
A04
Skills developed for
analysis of data. 4 - critical 4 - Fact H
Continue arriving to
lectures.
03-Mar-
14
Issues
Issues are unexpected incidents or events
IssueRef
IssueDescription
Raisedby
DateRaised
Impact PriorityActionPlan
Status OwnerTarget
ResolutionDate
ActualResolution
Date
I01
Unexpectedissue inaccessingtwitter feeds. RC
17-Feb-14 H H
Identifydifferentmeans ofaccessing
the twitterfeeds. open RC 10-Feb-14
I02
Twitter APIaccess morecomplex thananticipated. RC
03-Mar-14 H H
This issue
has beingbrought upto ProjectLeturers.Awaitingresponse. closed RC 03-Mar-14 24-Mar-14
I03
No responsefrom Twitterdeveloperdata grantscheme. RC
24-Mar-14 H M
This issuehas being
brought upto ProjectLeturers.
Alternativesolutionhas beingprovided. closed RC 24-Mar-14 30-Mar-14
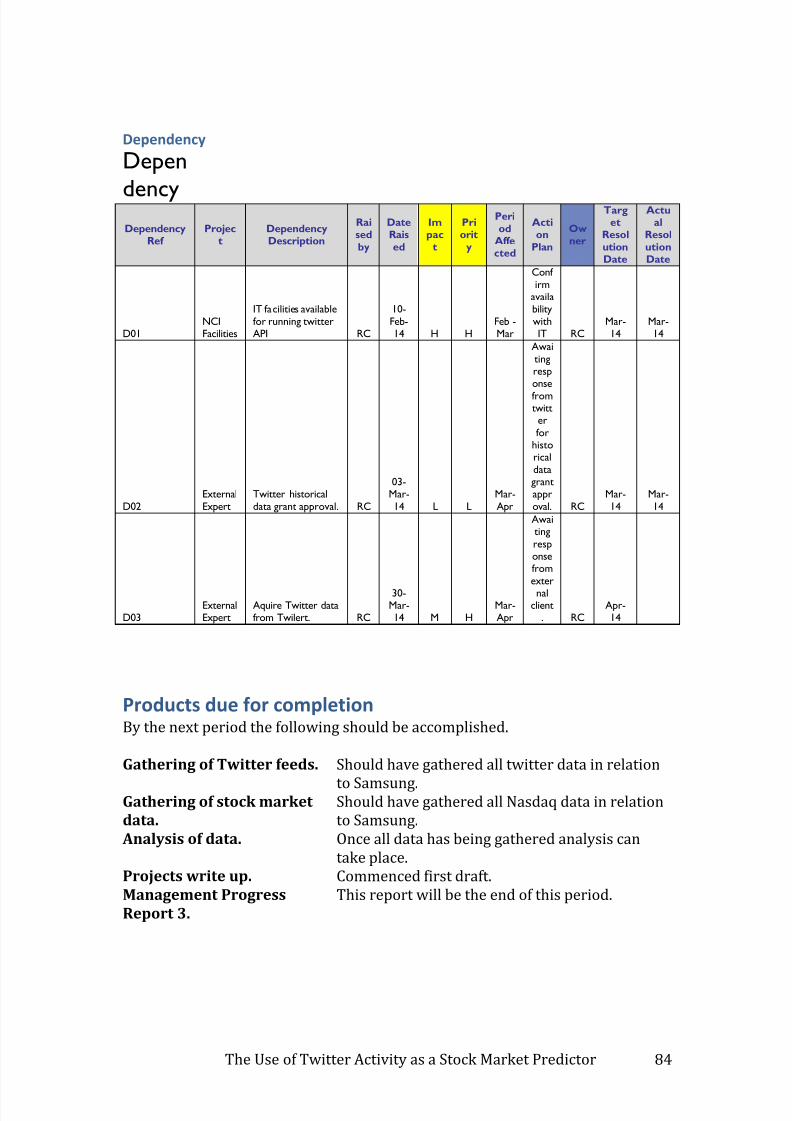
7/23/2019 Robert Coyle
http://slidepdf.com/reader/full/robert-coyle 84/91
The Use of Twitter Activity as a Stock Market Predictor 84
Dependency
Depen
dencyDependency
RefProjec
tDependencyDescription
Raisedby
DateRaised
Impac
t
Priorit
y
Period
Affected
Action
Plan
Owner
Target
ResolutionDate
Actual
ResolutionDate
D01NCIFacilities
IT facilities availablefor running twitterAPI RC
10-Feb-14 H H
Feb -Mar
Conf irm
availabilitywithIT RC
Mar-14
Mar-14
D02ExternalExpert
Twitter historicaldata grant approval. RC
03-Mar-14 L L
Mar-Apr
Awaitingresponse
fromtwitterfor
historicaldatagrantapproval. RC
Mar-14
Mar-14
D03ExternalExpert
Aquire Twitter datafrom Twilert. RC
30-Mar-14 M H
Mar-Apr
Awaitingresponsefromexter
nalclient
. RCApr-14
Products due for completionBy the next period the following should be accomplished.
Gathering of Twitter feeds. Should have gathered all twitter data in relation
to Samsung.Gathering of stock market
data.
Should have gathered all Nasdaq data in relationto Samsung.
Analysis of data. Once all data has being gathered analysis cantake place.
Projects write up. Commenced first draft.Management Progress
Report 3.
This report will be the end of this period.
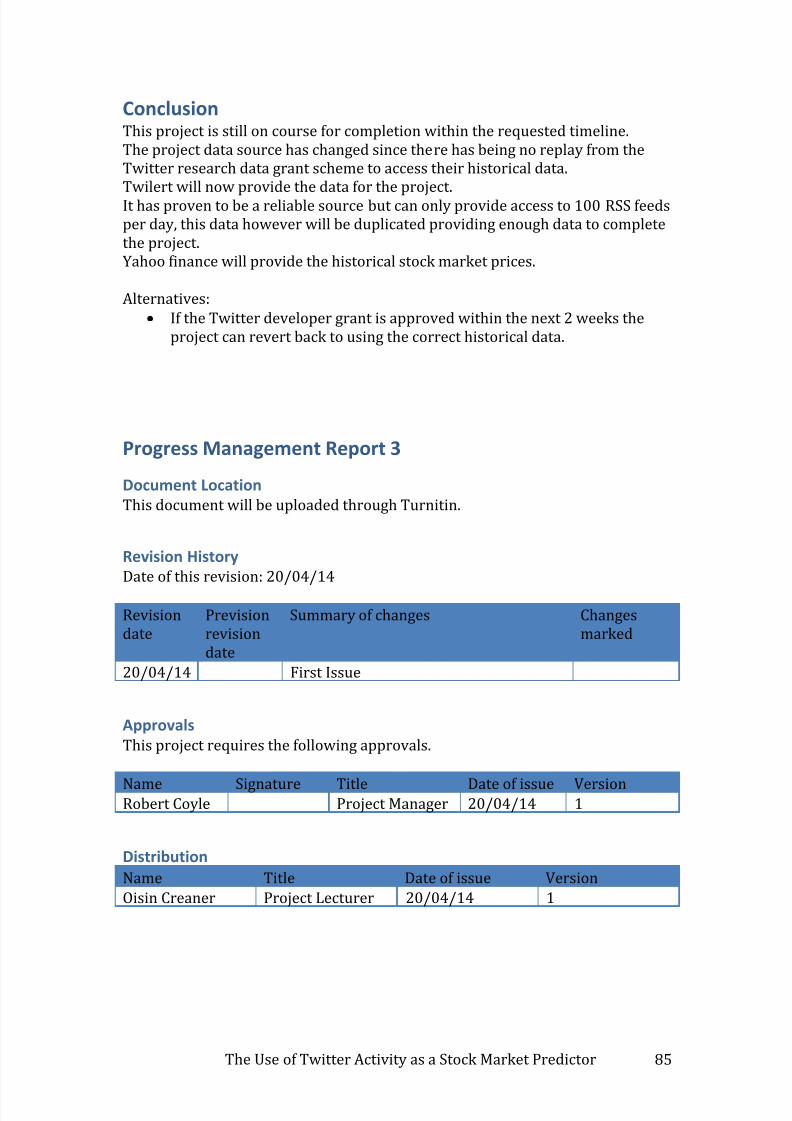
7/23/2019 Robert Coyle
http://slidepdf.com/reader/full/robert-coyle 85/91
The Use of Twitter Activity as a Stock Market Predictor 85
ConclusionThis project is still on course for completion within the requested timeline.The project data source has changed since there has being no replay from theTwitter research data grant scheme to access their historical data.Twilert will now provide the data for the project.It has proven to be a reliable source but can only provide access to 100 RSS feedsper day, this data however will be duplicated providing enough data to completethe project.Yahoo finance will provide the historical stock market prices.
Alternatives:
If the Twitter developer grant is approved within the next 2 weeks theproject can revert back to using the correct historical data.
Progress Management Report 3
Document Location
This document will be uploaded through Turnitin.
Revision History
Date of this revision: 20/04/14
Revisiondate
Previsionrevisiondate
Summary of changes Changesmarked
20/04/14 First Issue
Approvals
This project requires the following approvals.
Name Signature Title Date of issue VersionRobert Coyle Project Manager 20/04/14 1
Distribution
Name Title Date of issue Version
Oisin Creaner Project Lecturer 20/04/14 1
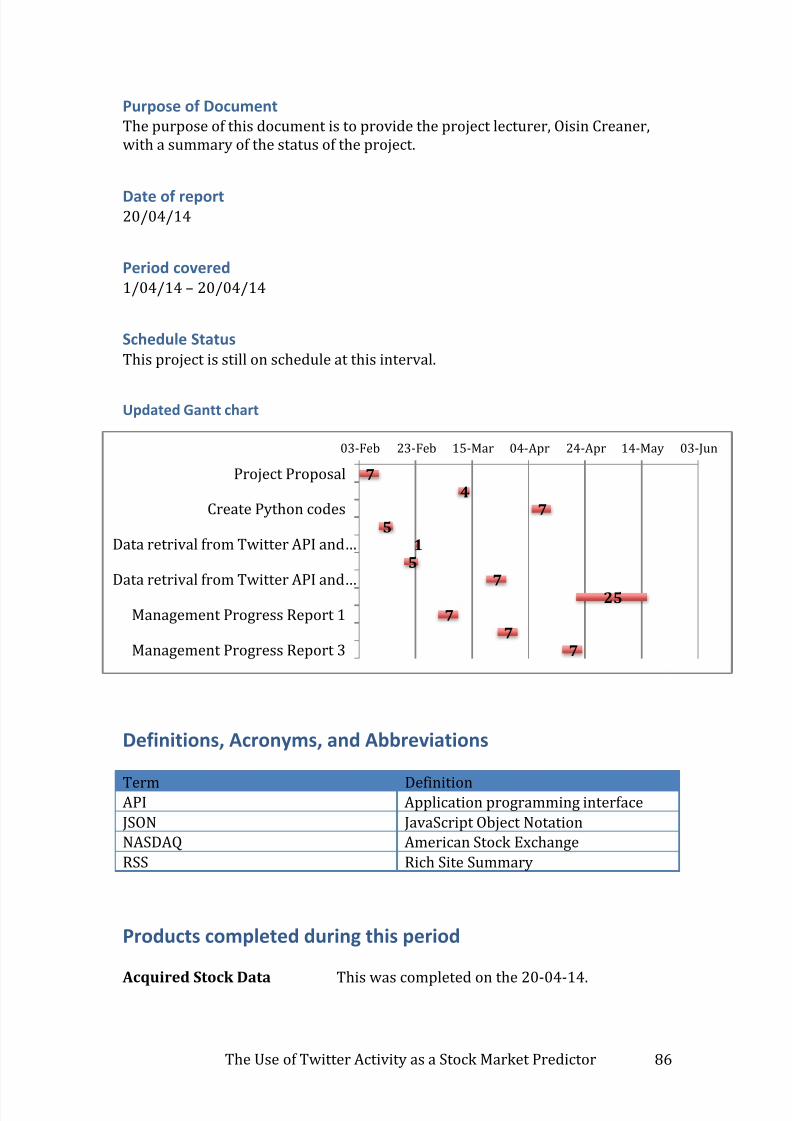
7/23/2019 Robert Coyle
http://slidepdf.com/reader/full/robert-coyle 86/91
The Use of Twitter Activity as a Stock Market Predictor 86
Purpose of Document
The purpose of this document is to provide the project lecturer, Oisin Creaner,with a summary of the status of the project.
Date of report20/04/14
Period covered
1/04/14 – 20/04/14
Schedule Status
This project is still on schedule at this interval.
Updated Gantt chart
Definitions, Acronyms, and Abbreviations
Term DefinitionAPI Application programming interface
JSON JavaScript Object Notation
NASDAQ American Stock Exchange
RSS Rich Site Summary
Products completed during this period
Acquired Stock Data This was completed on the 20-04-14.
74
75
15
725
77
7
03-Feb 23-Feb 15-Mar 04-Apr 24-Apr 14-May 03-Jun
Project Proposal
Create Python codes
Data retrival from Twitter API and…
Data retrival from Twitter API and…
Management Progress Report 1
Management Progress Report 3
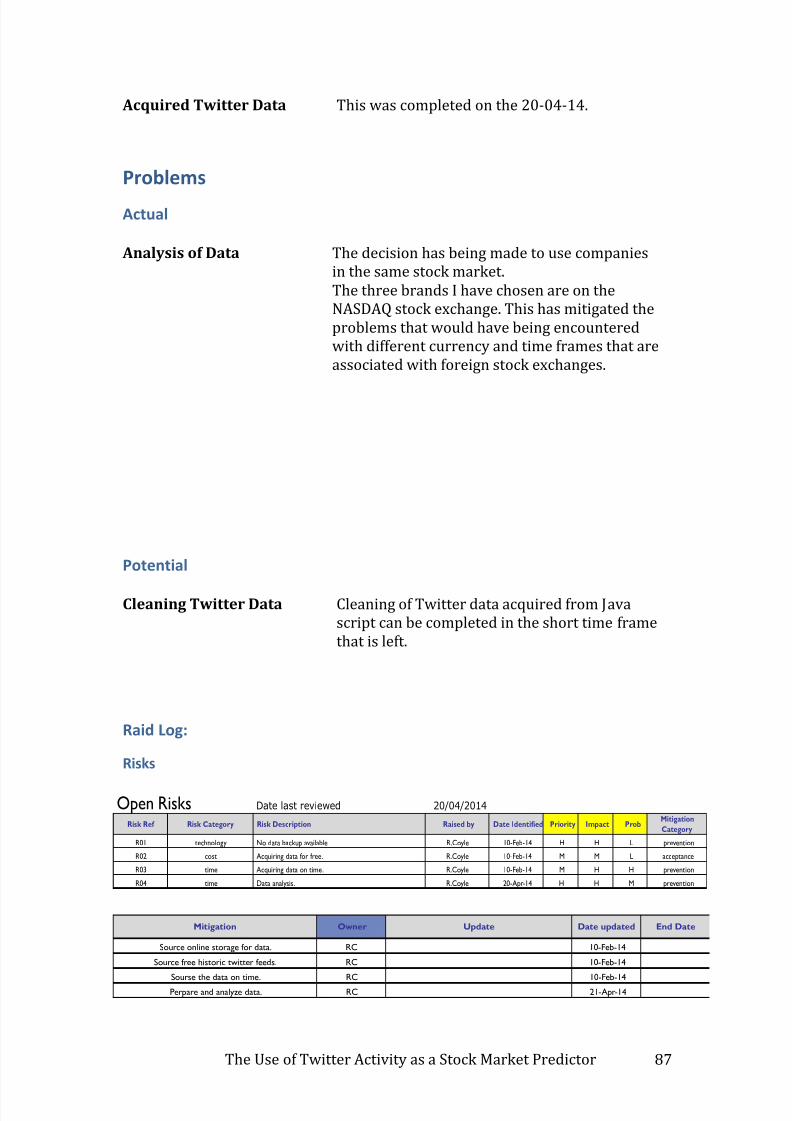
7/23/2019 Robert Coyle
http://slidepdf.com/reader/full/robert-coyle 87/91
The Use of Twitter Activity as a Stock Market Predictor 87
Acquired Twitter Data This was completed on the 20-04-14.
Problems
Actual
Analysis of Data The decision has being made to use companiesin the same stock market.The three brands I have chosen are on theNASDAQ stock exchange. This has mitigated theproblems that would have being encounteredwith different currency and time frames that areassociated with foreign stock exchanges.
Potential
Cleaning Twitter Data Cleaning of Twitter data acquired from Javascript can be completed in the short time framethat is left.
Raid Log:
Risks
Open Risks Date last reviewed 20/04/2014
Risk Ref Risk Category Risk Description Raised by Date Identified Priority Impact ProbMitigation
Category
R01 technology No data backup available R.Coyle 10-Feb-14 H H L prevention
R02 cost Acquiring data for free. R.Coyle 10-Feb-14 M M L acceptance
R03 time Acquiring data on time. R.Coyle 10-Feb-14 M H H prevention
R04 time Data analysis. R.Coyle 20-Apr-14 H H M prevention
Mitigation Owner Update Date updated End Date
Source online storage for data. RC 10-Feb-14
Source free historic twitter feeds. RC 10-Feb-14
Sourse the data on time. RC 10-Feb-14
Perpare and analyze data. RC 21-Apr-14
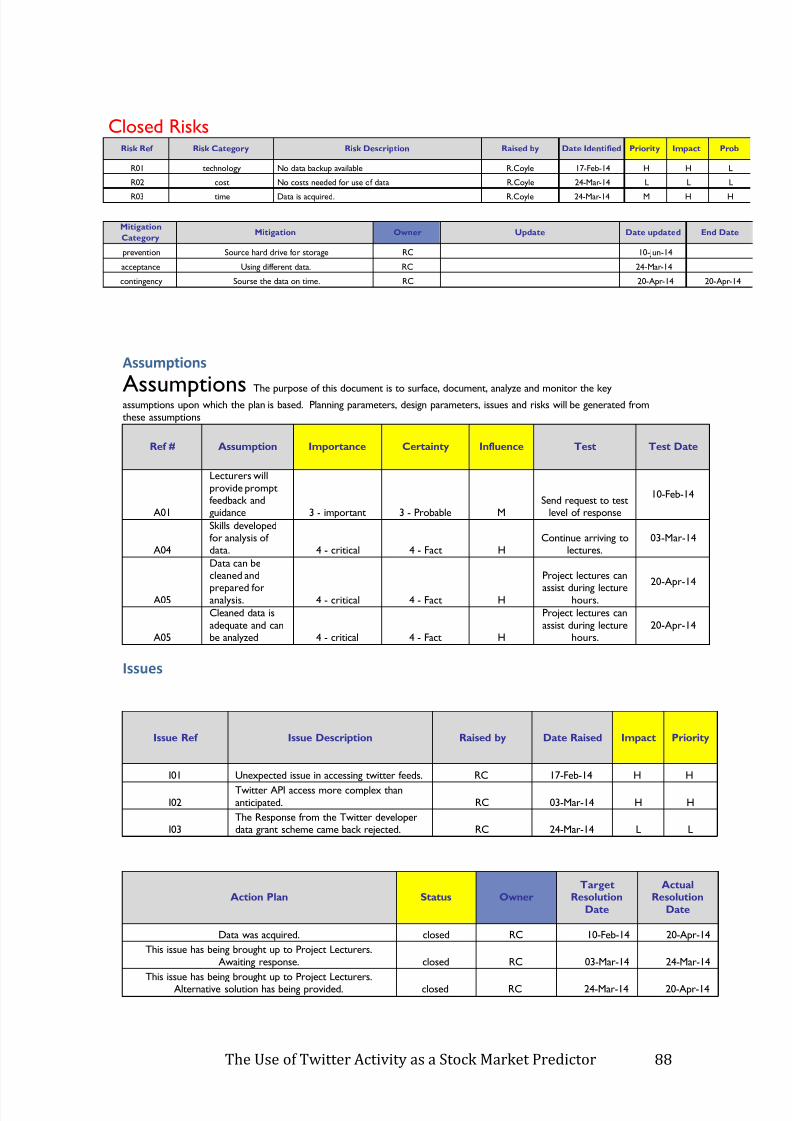
7/23/2019 Robert Coyle
http://slidepdf.com/reader/full/robert-coyle 88/91
The Use of Twitter Activity as a Stock Market Predictor 88
Assumptions
Assumptions The purpose of this document is to surface, document, analyze and monitor the keyassumptions upon which the plan is based. Planning parameters, design parameters, issues and risks will be generated fromthese assumptions
Ref # Assumption Importance Certainty Influence Test Test Date
A01
Lecturers willprovide promptfeedback andguidance 3 - important 3 - Probable M
Send request to testlevel of response
10-Feb-14
A04
Skills developedfor analysis ofdata. 4 - critical 4 - Fact H
Continue arriving tolectures.
03-Mar-14
A05
Data can becleaned and
prepared foranalysis. 4 - critical 4 - Fact H
Project lectures can
assist during lecturehours.
20-Apr-14
A05
Cleaned data isadequate and canbe analyzed 4 - critical 4 - Fact H
Project lectures canassist during lecture
hours.20-Apr-14
Issues
Issue Ref Issue Description Raised by Date Raised Impact Priority
I01 Unexpected issue in accessing twitter feeds. RC 17-Feb-14 H H
I02Twitter API access more complex thananticipated. RC 03-Mar-14 H H
I03The Response from the Twitter developerdata grant scheme came back rejected. RC 24-Mar-14 L L
Action Plan Status OwnerTarget
ResolutionDate
ActualResolution
Date
Data was acquired. closed RC 10-Feb-14 20-Apr-14
This issue has being brought up to Project Lecturers.Awaiting response. closed RC 03-Mar-14 24-Mar-14
This issue has being brought up to Project Lecturers.Alternative solution has being provided. closed RC 24-Mar-14 20-Apr-14
Closed RisksRisk Ref Risk Category Risk Description Raised by Date Identified Priority Impact Prob
R01 technology No data backup available R.Coyle 17-Feb-14 H H L
R02 cost No costs needed for use of data R.Coyle 24-Mar-14 L L L
R03 time Data is acquired. R.Coyle 24-Mar-14 M H H
Mitigation
CategoryMitigation Owner Update Date updated End Date
prevention Source hard drive for storage RC 10-Jun-14
acceptance Using different data. RC 24-Mar-14
contingency Sourse the data on time. RC 20-Apr-14 20-Apr-14
7/23/2019 Robert Coyle
http://slidepdf.com/reader/full/robert-coyle 89/91
The Use of Twitter Activity as a Stock Market Predictor 89
Dependency
Dependency Ref
Project
Dependency
Description
Raisedby
DateRaise
d
Impact
Prior ity
Period
Affected
Action
Plan
Owner
TargetResolut
ionDate
ActualResolut
ionDate
D01NCIFacilities
IT
facilitiesavailableforrunningtwitterAPI RC
10-Feb-14 H H
Feb -Mar
Confirm
availability
withIT RC Mar-14 Mar-14
Products due for completion
By the next period the following should be accomplished.
Cleaning of Twitter data. Twitter data will be cleaned and time seriesprepared for analysis.
Cleaning of stock market
data.
Stock data will be cleaned and time seriesprepared for analysis, Stock market data timeseries is per day.
Analysis of data. Once all data has being and cleaned analysis willbegin.
Projects write up. Commenced first draft.
ConclusionThis project is still on course for completion within the requested timeline.The project data source has changed since the Twitter Historical Data grant wasdenied. I now have gathered a weeks worth of Twitter data associated to threecompanies that are on the same stock exchange.I will now focus on Apple Inc., Tesla Motors, Inc. and Microsoft Corporation.
These tech companies being on the same stock exchange (NASDAQ) will create amore straightforward approach to the analysis. Samsung Electronics, which wasmy original company I had selected to base the analysis upon, is on the Koreanstock market. Not only would I have different time series but I would also have tomodify the currency difference.Yahoo finance will provide the historical stock market prices.I am hoping to find a correlation between the twitter activity and the stockmarket prices of the three brands with a lag of around three to four days.
Alternatives:
If I can gather the stock market prices in hourly format the analysis wouldbe more detailed.
7/23/2019 Robert Coyle
http://slidepdf.com/reader/full/robert-coyle 90/91
The Use of Twitter Activity as a Stock Market Predictor 90
References
Usefulsocialmedia.com. 2014. Twitter Evolves – Becoming more brand friendly |
Useful Social Media. [online] Available at:http://www.usefulsocialmedia.com/measurement/Twitter-evolves-–-becoming-more-brand-friendly [Accessed: 9 Feb 2014].
Johnson, L. 2014. Samsung Galaxy S5 release date, news, rumours, specs and price -
News - Trusted Reviews. [online] Available at:http://www.trustedreviews.com/news/Samsung-galaxy-s5-release-date-news-rumours-specs-and-price [Accessed: 9 Feb 2014].
Macrumors.com. 2014. Apple Continues to Lose Smartphone Share, Gain Mobile
Phone Share in 4Q 2013. [online] Available at:http://www.macrumors.com/2014/01/28/apple-phone-share-4q-2013/[Accessed: 9 Feb 2014].
Wellclever.com. 2014. Well Clever - Publisher Centric Platforms. [online] Availableat: http://wellclever.com [Accessed: 9 Feb 2014].
usefulsocialmedia. 2014. Twitter Evolves -Becoming more brand friendly.[ONLINE] Available at:http://www.usefulsocialmedia.com/measurement/Twitter-evolves-–-becoming-more-brand-friendly. [Accessed 23 February 14].
btimes.co.uk. 2013. Samsung's $14bn is 'Biggest Marketing Budget in History.[ONLINE] Available at: http://www.ibtimes.co.uk/samsung-14bn-marketing-budget-biggest-history-525979. [Accessed 28 February 14].
comprendia. 2014. If A Tweet Falls In The Forest? Maximizing TwitterEngagement Through Time Of Day Analysis. [ONLINE] Available at:http://comprendia.com/2012/07/17/if-a-tweet-falls-in-the-forest-maximizing-twitter-engagement-and-exposure-through-time-of-day-analysis/. [Accessed 24February 14].
powerpivotblog. 2013. Analyze a Twitter feed with Excel 2013, DataExplorer andGeoFlow. [ONLINE] Available at: http://www.powerpivotblog.nl/analyze-a-twitter-feed-with-excel-2013-dataexplorer-and-geoflow/. [Accessed 24February 14].
evolutionanalytics. 2013. What does Barack Obama tweet about most?. [ONLINE]Available at: http://blog.revolutionanalytics.com/2013/11/what-does-barack-obama-tweet-about-most.html. [Accessed 24 February 14].
skilledup. 2013. 50+ (Mostly) Free Excel Add-Ins For Any Task. [ONLINE]
Available at: http://www.skilledup.com/learn/business-entrepreneurship/mostly-free-excel-add-ins/. [Accessed 24 February 14].
7/23/2019 Robert Coyle
http://slidepdf.com/reader/full/robert-coyle 91/91
datamachines. 2012. Decomposing North Carolina Amendment 1 with R andTableau (part 1). [ONLINE] Available at:http://datamachines.blogspot.ie/2012/05/decomposing-north-carolina-
amendment.html. [Accessed 24 February 14].
Twilert. 2014. Twitter search alerts. [ONLINE] Available at:http://www.twilert.com. [Accessed 10 March 14].
Twitter. 2014. Overview: Version 1.1 of the Twitter API. [ONLINE] Available at:https://dev.twitter.com/docs/api/1.1/overview. [Accessed 10 March 14].
Twitter. 2014. Data Grants. [ONLINE] Available at:https://engineering.twitter.com/research/data-grants. [Accessed 10 March 14].
Yahoo Finance, 2014. Samsung Electronics Co. Ltd. [ONLINE] Available at:http://finance.yahoo.com/q/hp?s=005930.KS+Historical+Prices. [Accessed 30March 14].
Twilert, 2014. Twitter search alerts. [ONLINE] Available at:http://www.twilert.com. [Accessed 10 March 14].
Yahoo Finance - Business Finance, Stock Market, Quotes, News (2014) YahooFinance. Available at: http://finance.yahoo.com (Accessed: 20 April 2014).