Embed Size (px)
Citation preview
The
Sust
aina
bilit
y Ye
arbo
ok 2
019
MODERN PORTFOLIO
MANAGEMENT
SOCIALCAPITAL
CORPORATE TAX
STRATEGIES
GENDEREQUALITY
The Sustainability Yearbook 2019
FAIR WAGES
SUSTAINABLE: TRADITIONAL:
SUSTAINABLE: TRADITIONAL:
RobecoSAM AGJosefstrasse 2188005 Zurich, SwitzerlandT +41 44 653 10 10, F +41 44 653 10 80
www.robecosam.com
The Sustainability Yearbook 2019
02/2019RobecoSAM AG
yearbook.robecosam.com
The Sustainability Yearbook 2019 • SAM • 3
2018 Annual Corporate Sustainability Assessment: 60 industries.2,686 companies assessed*166,222 documents uploaded2,435,268 data points collected
This is The Sustainability Yearbook 2019.
* as of November 30th 2018
4 • SAM • The Sustainability Yearbook 2019
Dear Reader,
Welcome to the 2019 Sustainability Yearbook.
This year, the 20th anniversary of the Corporate
Sustainability Assessment (CSA), we make history and
at the same time we bring back a little bit of history, by
re-introducing the “SAM” brand. Going forward, SAM is
our brand for activities connected to companies, and is
distinct from the asset management business. A familiar
friend of ours, and of those companies that have known
the CSA since the beginning, SAM has been with us for
many years. On page 6, we share our rationale for this
move.
Over the past 20 years, the CSA has continued to evolve,
identifying and adapting to changes at the intersection
of business and society. With this in mind, we have
chosen to focus the 2019 Sustainability Yearbook on
social capital issues — the “S” in ESG.
Sandwiched between Environmental and Governance —
“S”, which measures sustainability’s social dimension, is
sometimes overshadowed by the attention afforded to
its sustainability siblings. This is perhaps understandable
given the devastating impact of environmental pollution
and the climate crisis on a global scale (measured
by E), combined with a preference of the investment
community for metrics that focus on company
leadership, board oversight and executive compensation
(measured by G). But the significance of the social
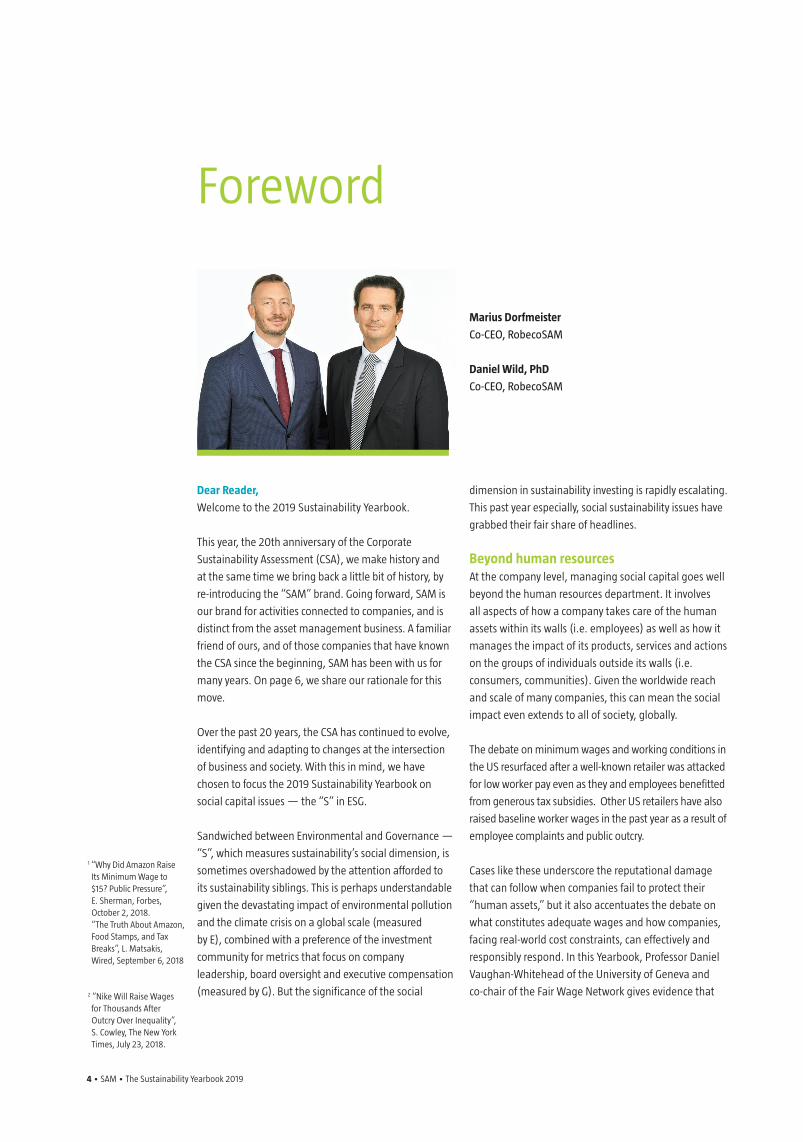
Foreword
dimension in sustainability investing is rapidly escalating.
This past year especially, social sustainability issues have
grabbed their fair share of headlines.
Beyond human resources
At the company level, managing social capital goes well
beyond the human resources department. It involves
all aspects of how a company takes care of the human
assets within its walls (i.e. employees) as well as how it
manages the impact of its products, services and actions
on the groups of individuals outside its walls (i.e.
consumers, communities). Given the worldwide reach
and scale of many companies, this can mean the social
impact even extends to all of society, globally.
The debate on minimum wages and working conditions in
the US resurfaced after a well-known retailer was attacked
for low worker pay even as they and employees benefitted
from generous tax subsidies. Other US retailers have also
raised baseline worker wages in the past year as a result of
employee complaints and public outcry.
Cases like these underscore the reputational damage
that can follow when companies fail to protect their
“human assets,” but it also accentuates the debate on
what constitutes adequate wages and how companies,
facing real-world cost constraints, can effectively and
responsibly respond. In this Yearbook, Professor Daniel
Vaughan-Whitehead of the University of Geneva and
co-chair of the Fair Wage Network gives evidence that
Marius Dorfmeister
Co-CEO, RobecoSAM
Daniel Wild, PhD
Co-CEO, RobecoSAM
1 “Why Did Amazon Raise Its Minimum Wage to $15? Public Pressure”, E. Sherman, Forbes, October 2, 2018. “The Truth About Amazon, Food Stamps, and Tax Breaks”, L. Matsakis, Wired, September 6, 2018
2 “Nike Will Raise Wages for Thousands After Outcry Over Inequality”, S. Cowley, The New York Times, July 23, 2018.
The Sustainability Yearbook 2019 • SAM • 5
shows why a fair wage framework promotes not only
employee well-being but also corporate profitability.
Extreme symptoms of an unseen bias
Social capital issues were also brought to the forefront
as a result of the #MeToo movement that swelled
to a peak in 2018. Although the movement was not
primarily centered on corporate behavior, significant
business leaders were forced to resign, highlighting
the prevalence of sexual harassment and abuse still
present within all levels of business and society. Despite
the negative circumstances, it helped bring renewed
attention and focus on gender bias and equality in the
workplace.
A contributing article from our SI Research team
takes a fresh look at data from the 2018 Corporate
Sustainability Assessment (CSA) and offers its own
revelations on gender issues in the workforce. Reducing
gender bias is an important corporate issue as more
and more studies reveal the positive value of gender
diversity for company leadership and stock performance.
Mapping investment portfolios to the future
The importance of intangible assets like gender diversity
and fair/living wages are prominently positioned in
our SI Research article, “No Firm is an Island,” which
argues that net present value (NPV) calculations in
modern portfolio management are flawed because of
insufficient inclusion of ESG variables. Incomplete data
and analyses will ultimately lead to inaccurate portfolio
valuations, poor environmental and social capital
management, and possibly irrevocable natural and
social resource crisis for future generations. Conversely,
incorporating ESG variables into investment portfolios
now will improve their robustness in the future.
Fiscal revenue and social infrastructure
Though corporate tax is typically treated as a
governance issue within ESG measurement, it too has
important social implications. Its interconnectedness
with social capital through its impact on community
infrastructure is undeniable. Fiscal revenue from
corporate taxes gives countries and communities the
resources to build physical, social, and educational
infrastructure — infrastructure that is needed to
support present and future growth and development.
Yet many companies are incentivized by short-term
profits to minimize tax bills via loopholes and even tax
havens.
We were among the first to recognize the importance of
a transparent tax strategy to an evaluation of corporate
sustainability performance and introduced our tax
criterion as early as in the 2014 CSA campaign.
In the article, “Five Years of Pushing for Change,” we
revisit the “tax question” for insights into how company
tax disclosures have changed as well as whether these
disclosures are meaningful indicators for predicting
companies’ ability to successfully withstand increasing
regulatory scrutiny and future policy actions.
Compound social interest yields larger payoffs for all From equal and adequate worker pay, to equal
recognition and access to professional opportunities,
extending all the way to the quality of public
infrastructure and services, how corporations treat their
human assets and “social” obligations via taxes, has
significant and long-term ramifications for individuals,
communities and greater society. These intangible
assets too can yield a “social interest” which can
compound into the future.
Companies don’t operate in isolation. They are part
of a larger interconnected system where their actions
across all ESG dimensions have deep and long-lasting
effects for future generations. Firms that recognize
the potential of all their assets, and which invest now
in protecting and enhancing them, will be able to
realize the compounding effects of these tangible and
intangible investments in the years to come – effects
that accrue not just to the firm but to greater society.
“We hope you enjoy reading our articles and the results of our CSA in this 16th edition of the Yearbook, presented to you under the SAM brand.”
6 • SAM • The Sustainability Yearbook 2019
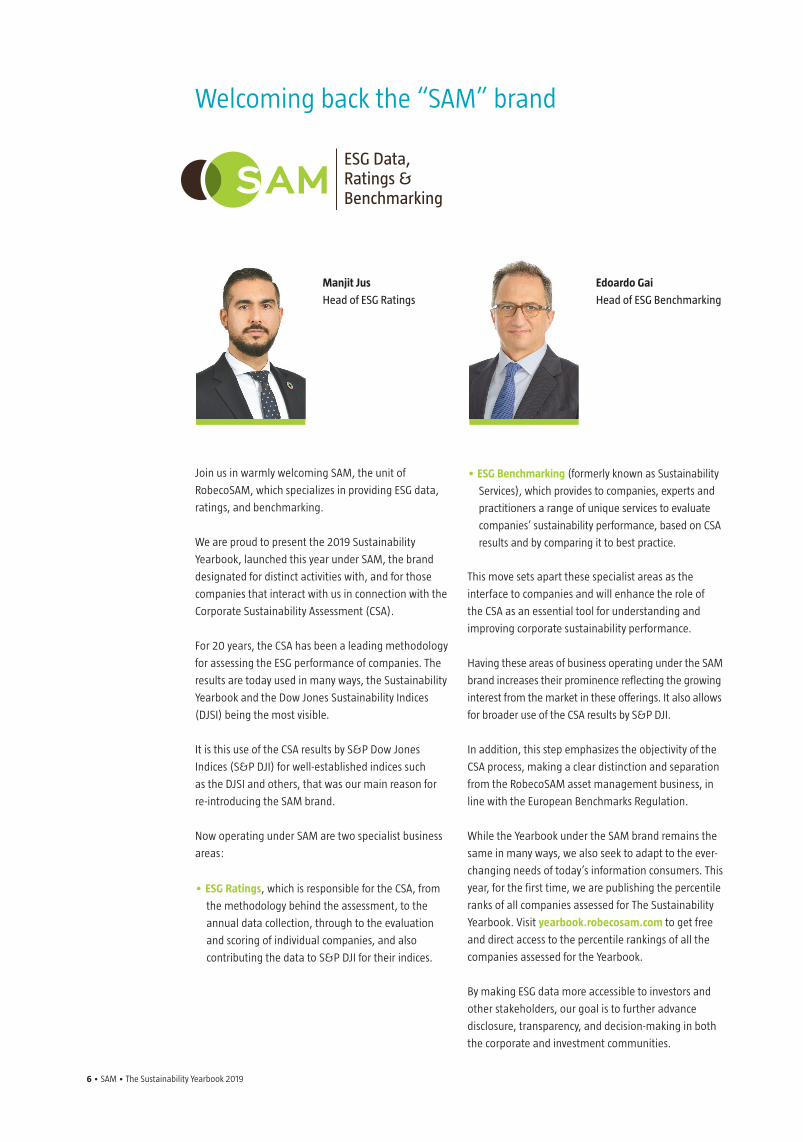
Welcoming back the “SAM” brand
Edoardo Gai
Head of ESG Benchmarking
Manjit Jus
Head of ESG Ratings
ESG Data, Ratings &Benchmarking
Join us in warmly welcoming SAM, the unit of
RobecoSAM, which specializes in providing ESG data,
ratings, and benchmarking.
We are proud to present the 2019 Sustainability
Yearbook, launched this year under SAM, the brand
designated for distinct activities with, and for those
companies that interact with us in connection with the
Corporate Sustainability Assessment (CSA).
For 20 years, the CSA has been a leading methodology
for assessing the ESG performance of companies. The
results are today used in many ways, the Sustainability
Yearbook and the Dow Jones Sustainability Indices
(DJSI) being the most visible.
It is this use of the CSA results by S&P Dow Jones
Indices (S&P DJI) for well-established indices such
as the DJSI and others, that was our main reason for
re-introducing the SAM brand.
Now operating under SAM are two specialist business
areas:
• ESG Ratings, which is responsible for the CSA, from
the methodology behind the assessment, to the
annual data collection, through to the evaluation
and scoring of individual companies, and also
contributing the data to S&P DJI for their indices.
• ESG Benchmarking (formerly known as Sustainability
Services), which provides to companies, experts and
practitioners a range of unique services to evaluate
companies’ sustainability performance, based on CSA
results and by comparing it to best practice.
This move sets apart these specialist areas as the
interface to companies and will enhance the role of
the CSA as an essential tool for understanding and
improving corporate sustainability performance.
Having these areas of business operating under the SAM
brand increases their prominence reflecting the growing
interest from the market in these offerings. It also allows
for broader use of the CSA results by S&P DJI.
In addition, this step emphasizes the objectivity of the
CSA process, making a clear distinction and separation
from the RobecoSAM asset management business, in
line with the European Benchmarks Regulation.
While the Yearbook under the SAM brand remains the
same in many ways, we also seek to adapt to the ever-
changing needs of today’s information consumers. This
year, for the first time, we are publishing the percentile
ranks of all companies assessed for The Sustainability
Yearbook. Visit yearbook.robecosam.com to get free
and direct access to the percentile rankings of all the
companies assessed for the Yearbook.
By making ESG data more accessible to investors and
other stakeholders, our goal is to further advance
disclosure, transparency, and decision-making in both
the corporate and investment communities.
The Sustainability Yearbook 2019 • SAM • 7
Table of contents
FOREWORD 4
WELCOMING BACK THE “SAM” BRAND 6
1. FAIR WAGES – A KEY TO EFFECTIVE SOCIAL CAPITAL MANAGEMENT 8 Professor Daniel Vaughan-Whitehead, founder and co-chair of the Fair Wage Network
2. SLOWLY BUT SURELY: GRADUAL PROGRESS TOWARDS GENDER EQUALITY 21 Jacob Messina, CFA, Head of SI Research, RobecoSAM
Markéta Pokornà, SI Research Associate, RobecoSAM
3. NO FIRM IS AN ISLAND: USING THE SDGS TO BRIDGE MODERN PORTFOLIO
MANAGEMENT TO THE FUTURE 32 Michael van der Meer, CFA, Senior SI Analyst, Emerging Markets, RobecoSAM
4. FIVE YEARS OF PUSHING FOR CHANGE –
ASSESSING CORPORATE TAX STRATEGIES 42
Eleanor Willi, Sustainability Specialist, ESG Ratings
5. SUSTAINABILITY LEADERS 2019 53
• INDUSTRY PROFILES: 60 INDUSTRIES AT A GLANCE 60
COMPANY OVERVIEW 121
8 • SAM • The Sustainability Yearbook 2019
Fair Wages – a key to effective social capital management
The Sustainability Yearbook 2019 • SAM • 9
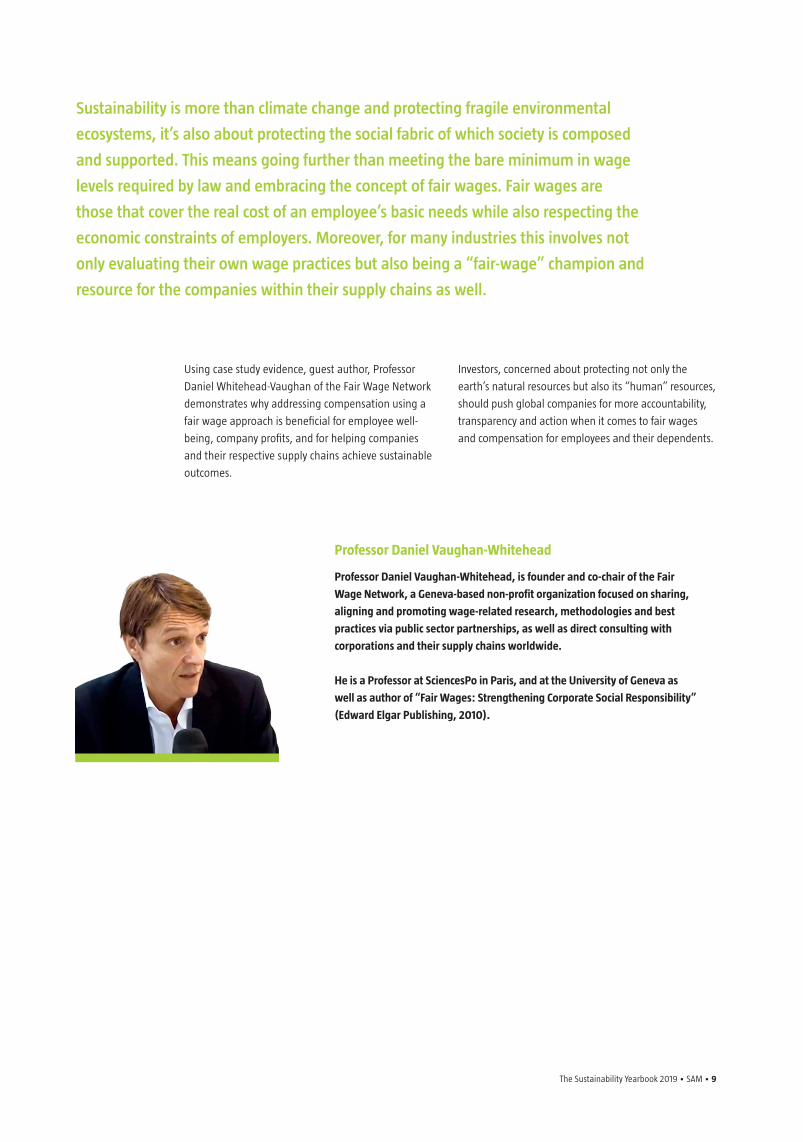
Professor Daniel Vaughan-Whitehead
Professor Daniel Vaughan-Whitehead, is founder and co-chair of the Fair
Wage Network, a Geneva-based non-profit organization focused on sharing,
aligning and promoting wage-related research, methodologies and best
practices via public sector partnerships, as well as direct consulting with
corporations and their supply chains worldwide.
He is a Professor at SciencesPo in Paris, and at the University of Geneva as
well as author of “Fair Wages: Strengthening Corporate Social Responsibility”
(Edward Elgar Publishing, 2010).
Sustainability is more than climate change and protecting fragile environmental
ecosystems, it’s also about protecting the social fabric of which society is composed
and supported. This means going further than meeting the bare minimum in wage
levels required by law and embracing the concept of fair wages. Fair wages are
those that cover the real cost of an employee’s basic needs while also respecting the
economic constraints of employers. Moreover, for many industries this involves not
only evaluating their own wage practices but also being a “fair-wage” champion and
resource for the companies within their supply chains as well.
Using case study evidence, guest author, Professor
Daniel Whitehead-Vaughan of the Fair Wage Network
demonstrates why addressing compensation using a
fair wage approach is beneficial for employee well-
being, company profits, and for helping companies
and their respective supply chains achieve sustainable
outcomes.
Investors, concerned about protecting not only the
earth’s natural resources but also its “human” resources,
should push global companies for more accountability,
transparency and action when it comes to fair wages
and compensation for employees and their dependents.

10 • SAM • The Sustainability Yearbook 2019
A Growing Social ConscienceOver the past two decades environmental issues
have tended to define and dominate discussions
of sustainability, driven in large part by heightened
awareness of climate change. More recently, however,
public awareness and concern are also increasing
in relation to the social dimension of sustainability.
Workforce diversity, gender pay and sexual harassment
at the workplace are all indicative of a society
concerned with addressing injustices and inequalities
of the social kind.
These are just the most recent examples of a wave of
concern that started to swell as far back as the 1990s.
Unfortunately, it started not so much as a well-planned
strategy but rather as a reaction to high-profile cases
such as Nike’s “child sweatshops” and the collapse of
the Rana Plaza garment factory in Dhaka, Bangladesh,
which killed over 1,100 workers in April 2013.
Cases like these cast a long shadow over the social
sustainability of the global supply chains that dominate
present-day business.
Similarly, the debate on the living wage that is
gaining attention in Europe and around the globe is
a continuation of this wave of concern for workers’
well-being. What started as a grassroots campaign
from civil society now ranks as an item on national and
international agendas (most recently at the G20 and G7
meetings).1 And it comes at a critical time.
“Decent work” involves job opportunities that are
productive, deliver a fair income, consider workplace
health and safety, provide social protection for families
and ensure equal opportunity, among other principles.2
However, International organizations have highlighted
a current “decent work deficit” among global supply
chains.3
The lack of decent work as defined above is troublesome
in light of recent workforce statistics that show the
percentage of people in vulnerable employment world-
wide is steadily increasing (see insert entitled “Startling
Statistics”). More effort is needed from corporate players
and their global supply chains to improve both the
quality of employment and wage levels.
Public awareness and concern are increasing in relation to the social dimension of sustainability.
The percentage of people in vulnerable employment worldwide is steadily increasing.
1 See G20 Leaders declaration, Hamburg, 8 July 2017. http://www.g20. utoronto.ca/2017/2017-G20-leaders-declaration.html
2 Decent work definition of the International Labor Organization (ILO),
https://www.ilo.org/global/topics/decent-work/lang--en/index.htm
3 Resolution concerning decent work in global supply chains, International Labour Conference, 105th Session, 2016, Geneva. https://www.ilo.org/ilc/ILCSessions/105/texts-adopted/WCMS_497555/lang--en/index.htm
The “race to the bottom” in terms of wage costs has
also reached a clear limit. Depressed wages are in-
creasing inequality, worker discontent and social unrest.
In 2017, 9 million work-days were lost due to employee
strikes or lockouts worldwide.
Wage discussions can be confusing not just because of
the complexity of labor markets but also because of the
different notions of what constitutes an adequate wage.
The “race to the bottom” in terms of wage costs has also reached a clear limit.
Startling Statistics
Vulnerable employment – defined as lacking formal work arrangements, inadequate earnings, difficult working
conditions, and inadequate social security, voice and representation by trade unions and similar organizations.
1. Vulnerable employment represents 42 percent of total global employment (1.4 billion people).
2. Vulnerable employment is expected to grow at a rate of 11 million per year.
3. The “Working poor”— defined as those earning below US $3.10 / day in terms of purchasing power
parity—stands at 700 million workers, mainly in emerging and developing countries.
Source: World Employment Social Outlook, Trends 2017, ILO, Geneva; http://www.forschungsnetzwerk.at/downloadpub/wcms_541211.pdf; and also World Employment
Social Outlook, Trends 2018, ILO: https://www.ilo.org/wcmsp5/groups/public/---dgreports/---dcomm/---publ/documents/publication/wcms_615594.pdf
The Sustainability Yearbook 2019 • SAM • 11
The main problem is that it is not fixed systematically
at the living wage threshold but is rather a threshold
borne out of political compromise between govern-
ments, trade unions and employer organizations, based
on prevailing “economic and social considerations”
(as stipulated in ILO Convention No. 131). As a result,
the minimum wage is often much lower than the
living wage.
The gap between what workers earn as a minimum
wage and what they actually require to support the
basic needs of themselves and their families is stark.
Figure 1 shows the extent of the wage deficit between
the minimum wage and the living wage across all
geographical regions. Unsurprisingly, the gap is higher
in regions with weak labor institutions; among these,
Africa, the Middle East and Russia stand out.
Minimum wages fall below living wages
Governments around the world have enacted minimum
wages (see insert, “A wage lexicon”) to ensure a
wage floor for all workers in their respective countries.
In principle, the minimum wage could be expected
to ensure workers and their families the minimum
threshold of pay required to cover basic needs. Over the
past two decades, however, minimum wage policy has
proven to be less effective than originally intended.
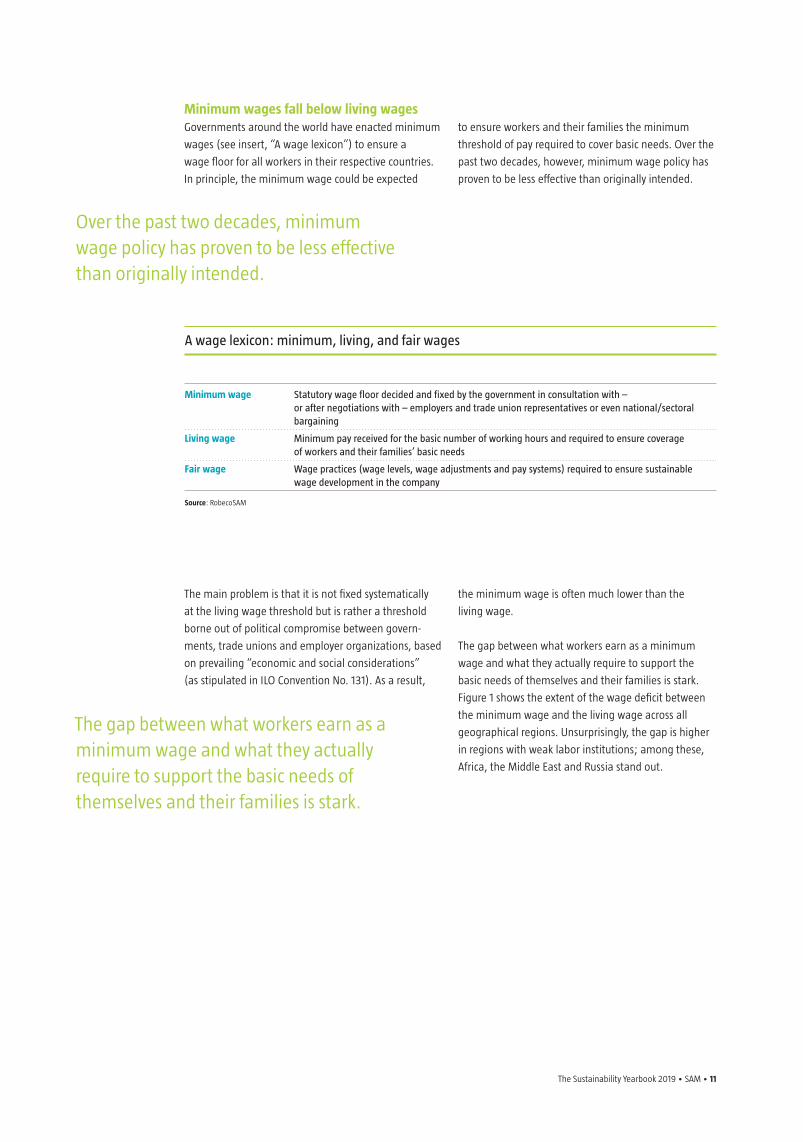
A wage lexicon: minimum, living, and fair wages
Over the past two decades, minimum wage policy has proven to be less effective than originally intended.
The gap between what workers earn as a minimum wage and what they actually require to support the basic needs of themselves and their families is stark.
Minimum wage
m
Living wage
Fair wage
Statutory wage floor decided and fixed by the government in consultation with – or after negotiations with – employers and trade union representatives or even national/sectoral bargaining
Minimum pay received for the basic number of working hours and required to ensure coverageof workers and their families’ basic needs
Wage practices (wage levels, wage adjustments and pay systems) required to ensure sustainablewage development in the company
Source: RobecoSAM
12 • SAM • The Sustainability Yearbook 2019
The extent of the deficit in places such as Africa and
many Asian economies have ignited living wage
campaigns to pressure companies to go beyond legal
compliance and towards meeting their workers’ basic
needs and improving their well-being.
The living wage as the new target The low minimum wage in the United Kingdom led,
in fact, to the living wage campaign initiated and
By contrast, the gap is much smaller in European
countries where labor institutions, minimum wage
fixing and collective bargaining mechanisms that
protect workers’ wages and rights are strong. But even
in Europe differences in wage setting policies persist
between countries.
coordinated by the UK Living Wage Foundation. The
campaign called for a much higher threshold than the
minimum wage to better protect workers and their
families. Since then, more brands have committed
to pay a living wage, with trade unions, too, working
towards a framework within which this can happen.4
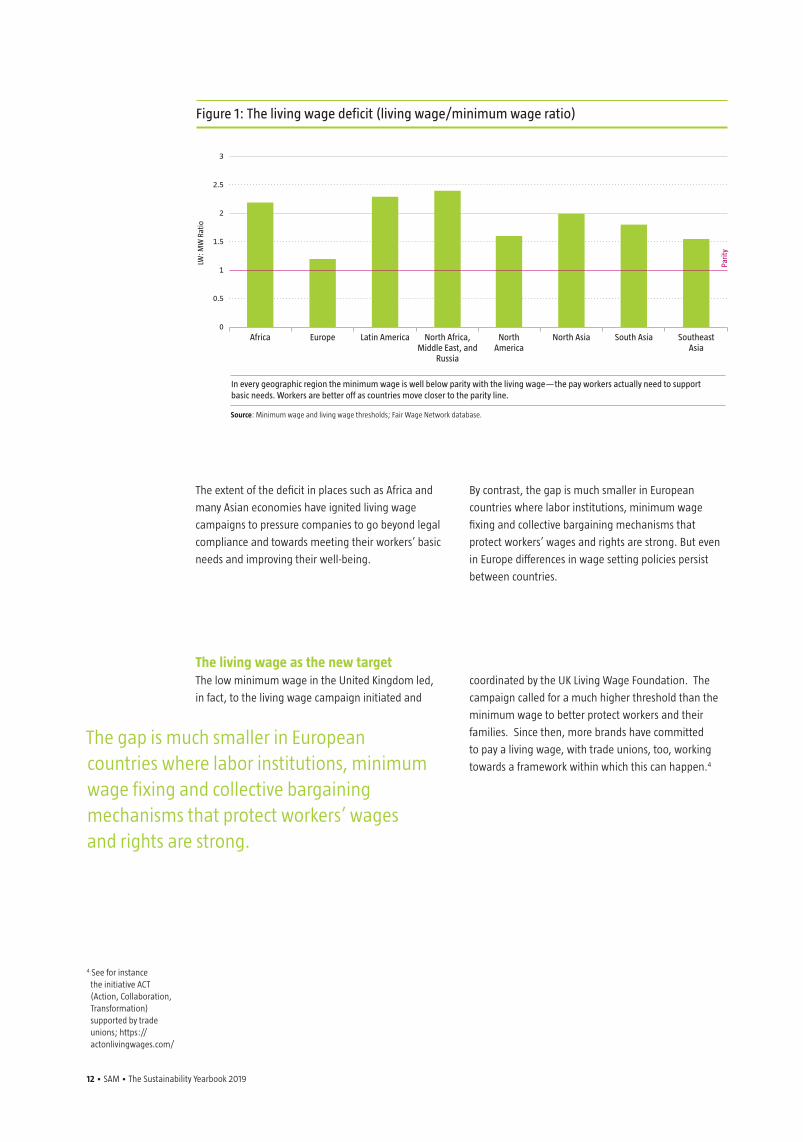
Figure 1: The living wage deficit (living wage/minimum wage ratio)
The gap is much smaller in Europeancountries where labor institutions, minimum wage fixing and collective bargaining mechanisms that protect workers’ wages and rights are strong.
4 See for instance the initiative ACT (Action, Collaboration, Transformation) supported by trade unions; https://actonlivingwages.com/
LW: M
W R
atio
3
2.5
2
1.5
1
0.5
0Africa
Source: Minimum wage and living wage thresholds; Fair Wage Network database.
In every geographic region the minimum wage is well below parity with the living wage—the pay workers actually need to support basic needs. Workers are better off as countries move closer to the parity line.
Europe Latin America North Africa, Middle East, and
Russia
North America
North Asia South Asia Southeast Asia
Pari
ty
The Sustainability Yearbook 2019 • SAM • 13
Variations on a Calculation Living wages can be calculated either by governments,
research institutes or national and international NGOs.
They aim to define the prices of items contained in a
basket of basic goods that cover basic needs
These thresholds can differ substantially, depending on
the organization involved. For instance, they are fixed
at rather low levels when calculated by governments
– because the relevant government would have to
fix the minimum wage accordingly; but fixed at very
high levels when calculated by NGOs or the research
institutes of trade unions.5 Thresholds can also differ
considerably due to differences in reference years
(e.g. one threshold may have been calculated in 2015
and another in 2018), or because they use a different
standard size of households (e.g. one threshold may
take the needs of one adult as the family unit, while
others may use two adults plus two children).
For this reason, the Fair Wage Network established
a methodology to collect all existing living wage
thresholds and harmonize them to the same standard
year and the same household size. Transparent
thresholds and standardized benchmarks can be
established which can be used to compare wages
of companies, for instance, along a supply chain.
The importance of common standards, unified
methodologies and analyses tools have also been
recognized by other groups seeking progress and
equality within worldwide wages.6
Nevertheless, more work and tools are needed to help
companies and governments develop protocols and
policies to transition to more worker-centric models
that are both realistic and effective.
Living wages thresholds can differ substant-ially, depending on the organization involved.
More work and tools are needed to help companies develop protocols to transition to more worker-centric models that are realistic and effective.
The fair wage approach is aimed at providing global
companies with a more comprehensive methodology
for examining wage issues. First, it takes into account
all elements in the wage-fixing structure and process.
Once these have been identified, it assesses the root
causes behind reported issues, making it possible to
remedy them.
5 This is the case for instance of the AsiaFloorWage calculated by an NGO originally set up by trade unions in India.
6 “Living Wages Around the World: Manual for Measurement,” R. Anker and M. Anker, (Edward Elgar Publishing, 2017).
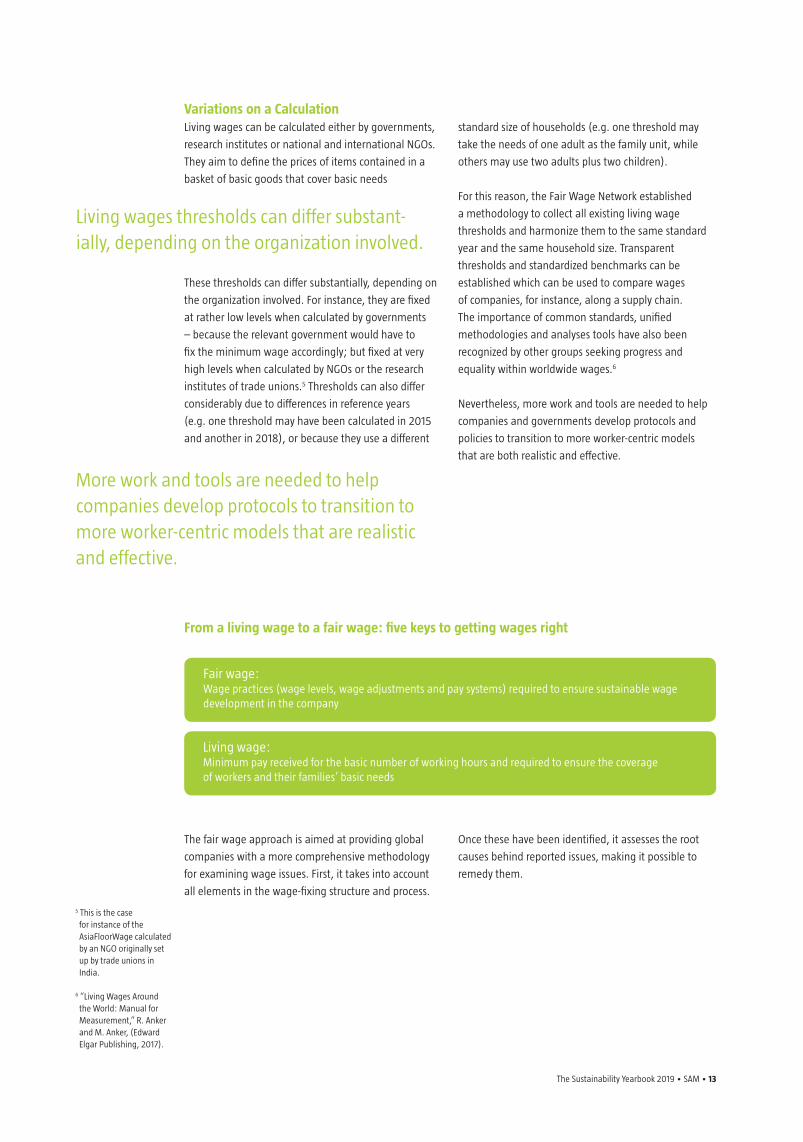
From a living wage to a fair wage: five keys to getting wages right
Fair wage: Wage practices (wage levels, wage adjustments and pay systems) required to ensure sustainable wage development in the company
Living wage: Minimum pay received for the basic number of working hours and required to ensure the coverage of workers and their families’ basic needs
14 • SAM • The Sustainability Yearbook 2019
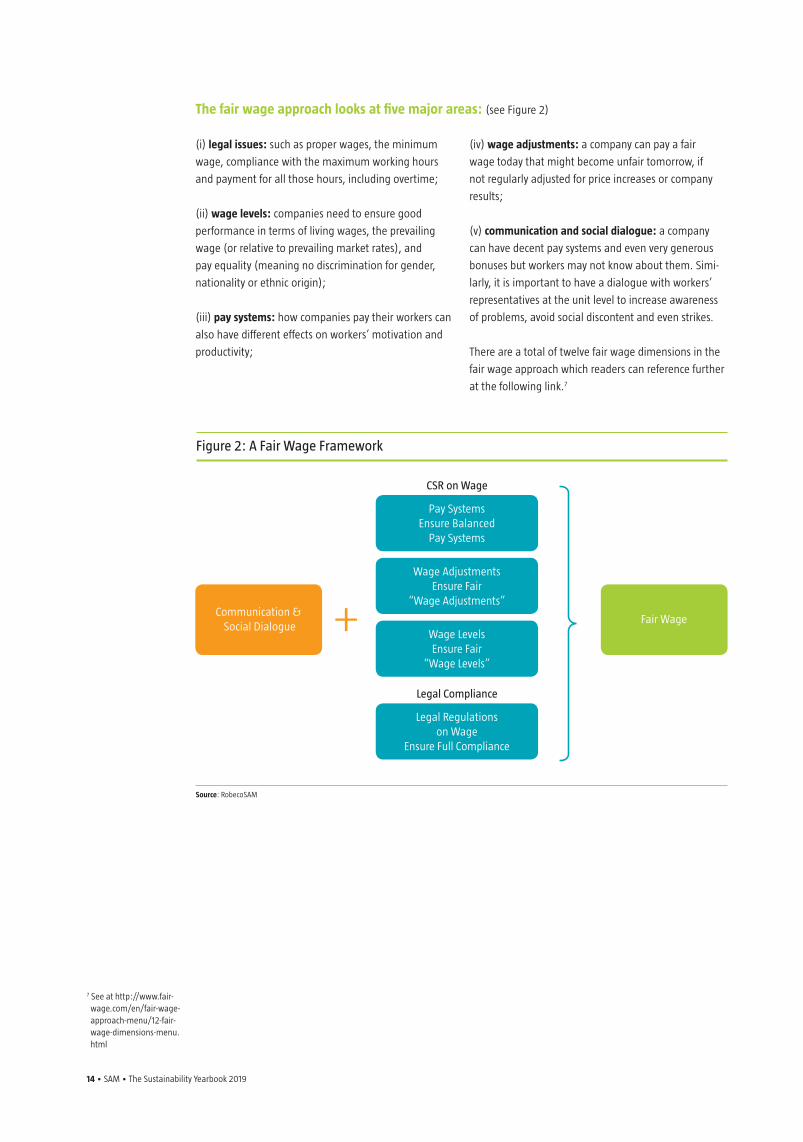
(i) legal issues: such as proper wages, the minimum
wage, compliance with the maximum working hours
and payment for all those hours, including overtime;
(ii) wage levels: companies need to ensure good
performance in terms of living wages, the prevailing
wage (or relative to prevailing market rates), and
pay equality (meaning no discrimination for gender,
nationality or ethnic origin);
(iii) pay systems: how companies pay their workers can
also have different effects on workers’ motivation and
productivity;
(iv) wage adjustments: a company can pay a fair
wage today that might become unfair tomorrow, if
not regularly adjusted for price increases or company
results;
(v) communication and social dialogue: a company
can have decent pay systems and even very generous
bonuses but workers may not know about them. Simi-
larly, it is important to have a dialogue with workers’
representatives at the unit level to increase awareness
of problems, avoid social discontent and even strikes.
There are a total of twelve fair wage dimensions in the
fair wage approach which readers can reference further
at the following link.7
Figure 2: A Fair Wage Framework
The fair wage approach looks at five major areas: (see Figure 2)
7 See at http://www.fair- wage.com/en/fair-wage-approach-menu/12-fair-wage-dimensions-menu.html
Source: RobecoSAM
Communication & Social Dialogue
Fair Wage
Pay SystemsEnsure Balanced
Pay Systems
Wage AdjustmentsEnsure Fair
“Wage Adjustments”
Wage LevelsEnsure Fair
“Wage Levels”
Legal Regulations on Wage
Ensure Full Compliance
CSR on Wage
Legal Compliance
The Sustainability Yearbook 2019 • SAM • 15
The [Fair Wage approach] tries to consider not only the social side but also the economic side of wage trends.
1. It’s not about one fixed number but rather a series
of benchmarks across a number of indicators and
dimensions.
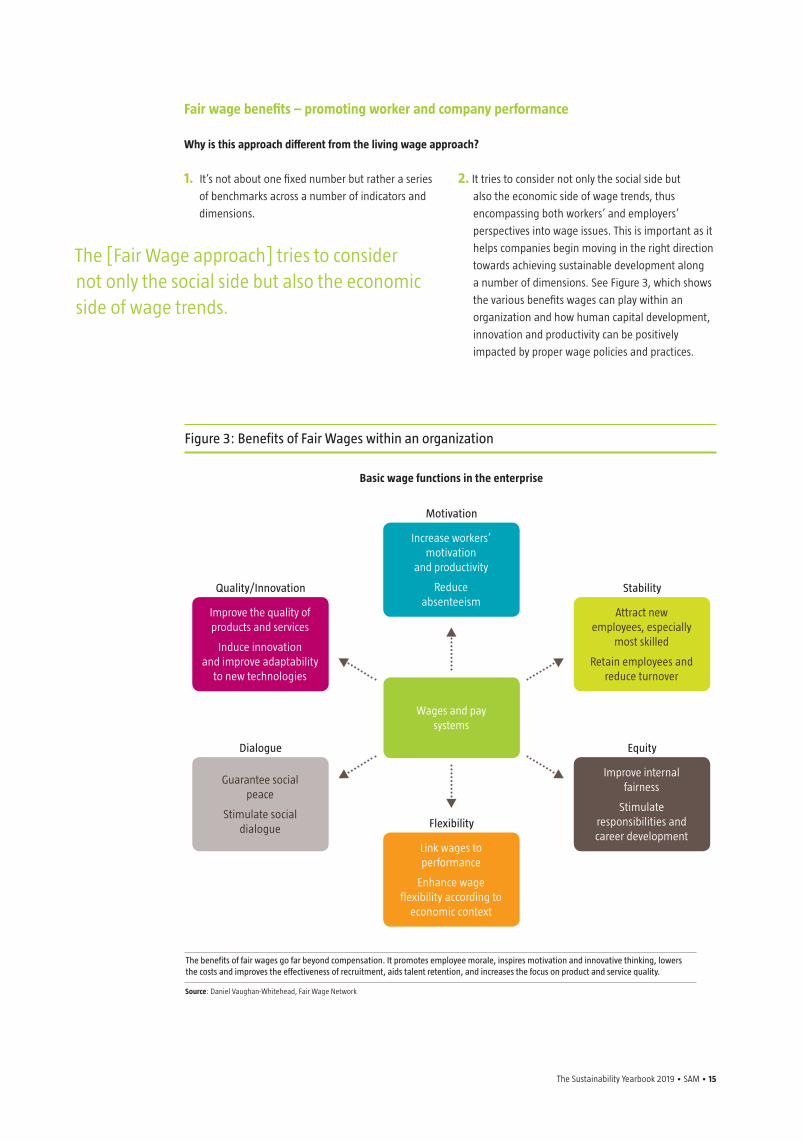
2. It tries to consider not only the social side but
also the economic side of wage trends, thus
encompassing both workers’ and employers’
perspectives into wage issues. This is important as it
helps companies begin moving in the right direction
towards achieving sustainable development along
a number of dimensions. See Figure 3, which shows
the various benefits wages can play within an
organization and how human capital development,
innovation and productivity can be positively
impacted by proper wage policies and practices.
Figure 3: Benefits of Fair Wages within an organization
Why is this approach different from the living wage approach?
Fair wage benefits – promoting worker and company performance
Source: Daniel Vaughan-Whitehead, Fair Wage Network
The benefits of fair wages go far beyond compensation. It promotes employee morale, inspires motivation and innovative thinking, lowers the costs and improves the effectiveness of recruitment, aids talent retention, and increases the focus on product and service quality.
Wages and paysystems
Increase workers’ motivation
and productivity
Reduce absenteeism
Motivation
Link wages to performance
Enhance wage flexibility according to
economic context
Flexibility
Improve the quality of products and services
Induce innovation and improve adaptability
to new technologies
Quality/Innovation
Attract new employees, especially
most skilled
Retain employees and reduce turnover
Stability
Guarantee social peace
Stimulate social dialogue
Dialogue
Improve internal fairness
Stimulate responsibilities and career development
Equity
Basic wage functions in the enterprise
16 • SAM • The Sustainability Yearbook 2019
Short-term Thinking vs Long-term Results To lower costs and increase profitability, a company could
give all workers the same minimum rate (either in the
form of a living wage or a minimum wage). However,
this is not an effective, sustainable, long-term strategy as
it does not reward workers for skill and performance.
Profitability may increase in the short term, but
ultimately, companies will lose out on key benefits
that give a company its competitive edge. Profitability
over the long run will suffer as worker motivation and
productivity decline.
Improving wage practices can help employers optimize
financial capital (compensation and personnel budgets)
and social capital (human resource development)
in a sustainable and cost-efficient way. Aligning pay
with skills, as well as rewarding good performance
Fair wages in practice – steps to successful implementation An essential prerequisite for creating an effective fair
wage policy is acceptance and support from top mana-
gement. Second, decision-making should be open, tran-
sparent and inter-departmental, with input from key
internal departments such as human resources, compen-
sation & benefits, sustainability and procurement, as
well as external managers in the global supply chain.
The involvement of all departments and also of all
companies and suppliers can best be assured if there
is a new and clear wage policy enshrined in the
with bonuses can improve employee satisfaction and
motivation without affecting company profitability.
In the end, a virtuous loop is created – as companies
address wage practices in a sustainable way, the greater
their chances of increasing profitability which provides
the economic resources for further wage improvements.
Our experience with several Chinese companies that
have implemented fair wage systems confirms its
effectiveness in contributing to higher value-added
products, even as wage levels and wage costs increased.
Similarly, and in a context in which it can be difficult
and risky for the company to increase wage costs,
improving non-monetary benefits can be a less
expensive way to relieve employees’ and their families’
daily difficulties. For instance, companies can provide
free meals or subsidized accommodation, transport
facilities and even medical services in regions where
medical expenditures often represent the main source
of families’ unexpected outlays.
company’s sustainability strategy—a wage policy that
identifies goals and targets, scope and methodology, as
well as addresses potential risks that could arise in the
framing and implementation process.
Having an effective fair wage policy as a fixture within
a company’s corporate sustainability program is an
effective way of involving all departments and winning
the confidence and cooperation of external supply
chain partners.
Improving wage practices can help employers optimize financial capital and social capital in a sustainable and cost-efficient way.
Examples of Fair Wage Policy Deployment Strategies:
Unilever – looked inward first, improving its internal wage practices prior to approaching suppliers on wage policies.
H&M – looked outward first, examining the wage policies mainly of its suppliers.
IKEA – moved on both fronts right from the start, both in its own stores as well as with its suppliers.
Source: Daniel Vaughan-Whitehead, Fair Wage Network
The Sustainability Yearbook 2019 • SAM • 17
Fair wage benefits: a strategic opportunity in sustainable development Although often viewed purely as a cost, the advantages
of a fair wage policy are becoming clearer as more re-
search on fair wage remediation is conducted including:
• significant fall in turnover rate
• declines in absenteeism
• greater employee satisfaction
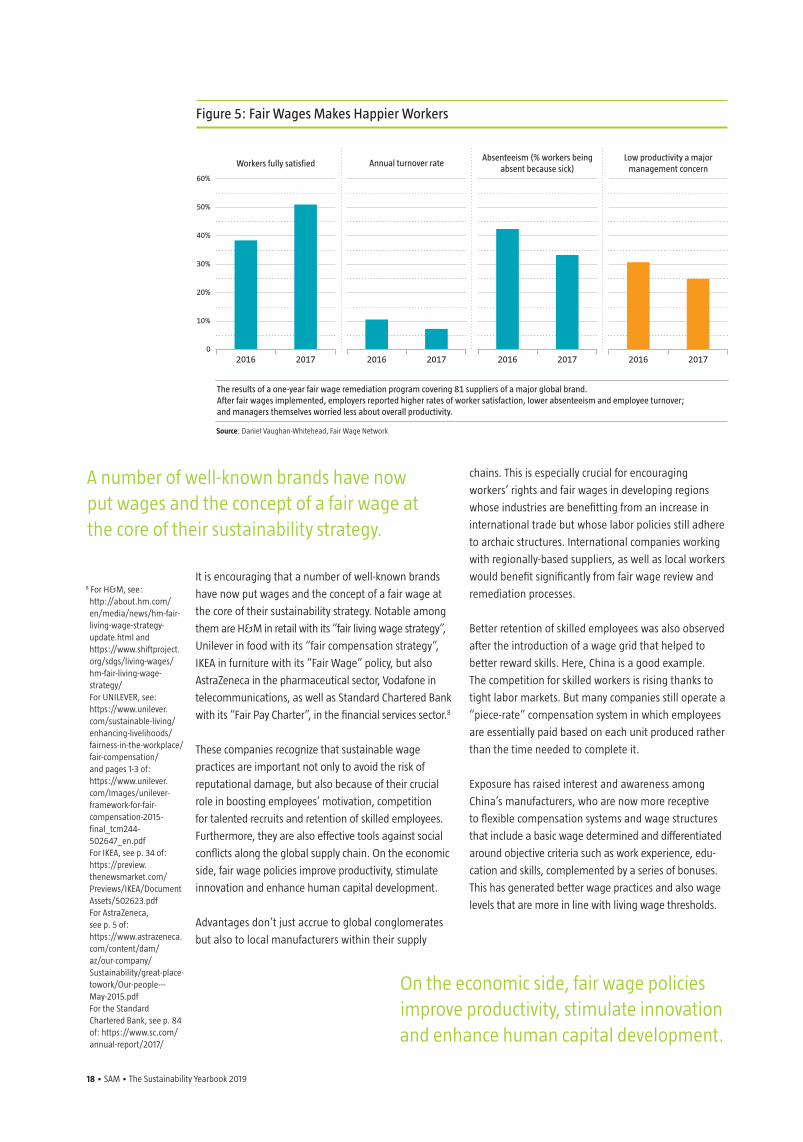
Figure 5 shows the results of fair wage assessment and
remediation exercises carried out among 81 suppliers of
a major brand.
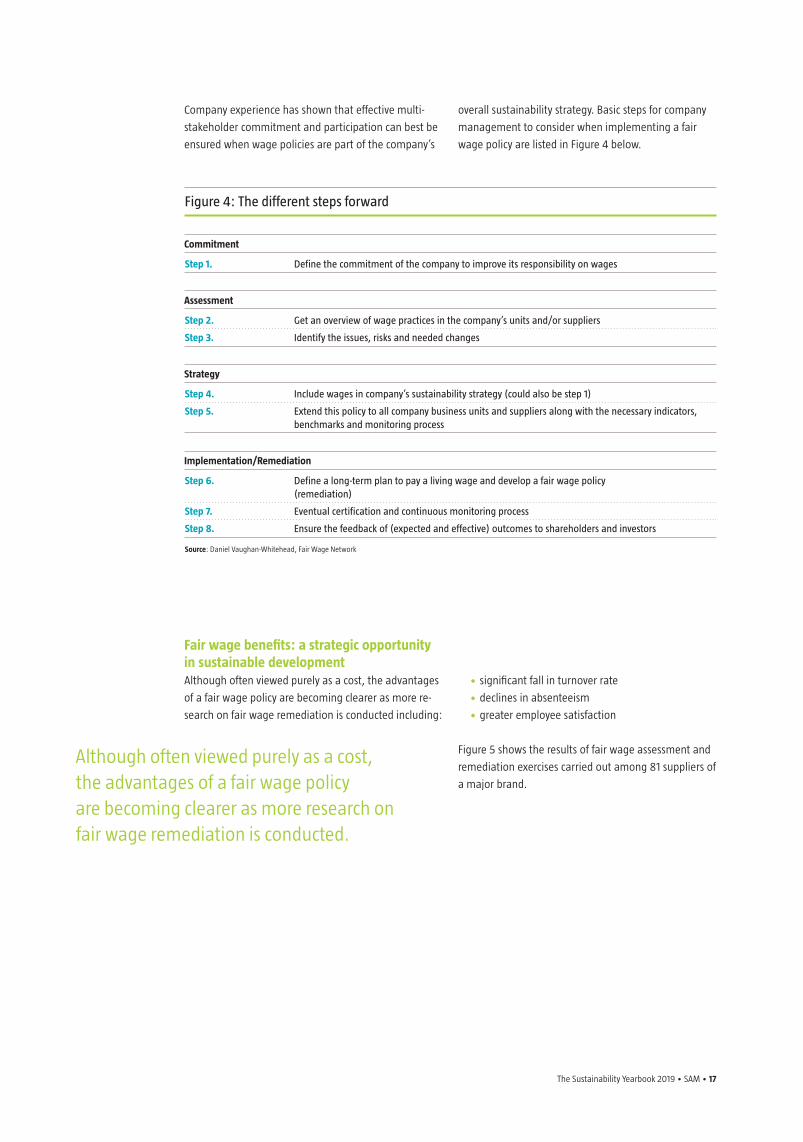
Company experience has shown that effective multi-
stakeholder commitment and participation can best be
ensured when wage policies are part of the company’s
overall sustainability strategy. Basic steps for company
management to consider when implementing a fair
wage policy are listed in Figure 4 below.
Figure 4: The different steps forward
Although often viewed purely as a cost, the advantages of a fair wage policy are becoming clearer as more research on fair wage remediation is conducted.
Source: Daniel Vaughan-Whitehead, Fair Wage Network
Step 1. Define the commitment of the company to improve its responsibility on wages
Commitment
Step 2.
Step 3.
Get an overview of wage practices in the company’s units and/or suppliers
Identify the issues, risks and needed changes
Assessment
Step 4.
Step 5. m
Include wages in company’s sustainability strategy (could also be step 1)
Extend this policy to all company business units and suppliers along with the necessary indicators, benchmarks and monitoring process
Strategy
Step 6. m
Step 7.
Step 8.
Define a long-term plan to pay a living wage and develop a fair wage policy (remediation)
Eventual certification and continuous monitoring process
Ensure the feedback of (expected and effective) outcomes to shareholders and investors
Implementation/Remediation
18 • SAM • The Sustainability Yearbook 2019
It is encouraging that a number of well-known brands
have now put wages and the concept of a fair wage at
the core of their sustainability strategy. Notable among
them are H&M in retail with its “fair living wage strategy”,
Unilever in food with its “fair compensation strategy”,
IKEA in furniture with its “Fair Wage” policy, but also
AstraZeneca in the pharmaceutical sector, Vodafone in
telecommunications, as well as Standard Chartered Bank
with its “Fair Pay Charter”, in the financial services sector.8
These companies recognize that sustainable wage
practices are important not only to avoid the risk of
reputational damage, but also because of their crucial
role in boosting employees’ motivation, competition
for talented recruits and retention of skilled employees.
Furthermore, they are also effective tools against social
conflicts along the global supply chain. On the economic
side, fair wage policies improve productivity, stimulate
innovation and enhance human capital development.
Advantages don’t just accrue to global conglomerates
but also to local manufacturers within their supply
chains. This is especially crucial for encouraging
workers’ rights and fair wages in developing regions
whose industries are benefitting from an increase in
international trade but whose labor policies still adhere
to archaic structures. International companies working
with regionally-based suppliers, as well as local workers
would benefit significantly from fair wage review and
remediation processes.
Better retention of skilled employees was also observed
after the introduction of a wage grid that helped to
better reward skills. Here, China is a good example.
The competition for skilled workers is rising thanks to
tight labor markets. But many companies still operate a
“piece-rate” compensation system in which employees
are essentially paid based on each unit produced rather
than the time needed to complete it.
Exposure has raised interest and awareness among
China’s manufacturers, who are now more receptive
to flexible compensation systems and wage structures
that include a basic wage determined and differentiated
around objective criteria such as work experience, edu-
cation and skills, complemented by a series of bonuses.
This has generated better wage practices and also wage
levels that are more in line with living wage thresholds.
A number of well-known brands have now put wages and the concept of a fair wage at the core of their sustainability strategy.
On the economic side, fair wage policies improve productivity, stimulate innovation and enhance human capital development.
Figure 5: Fair Wages Makes Happier Workers
60%
50%
40%
30%
20%
10%
02016 2017 2016 2017 2016 2017 2016 2017
Source: Daniel Vaughan-Whitehead, Fair Wage Network
The results of a one-year fair wage remediation program covering 81 suppliers of a major global brand. After fair wages implemented, employers reported higher rates of worker satisfaction, lower absenteeism and employee turnover; and managers themselves worried less about overall productivity.
Workers fully satisfied Annual turnover rateAbsenteeism (% workers being
absent because sick)Low productivity a major
management concern
8 For H&M, see: http://about.hm.com/en/media/news/hm-fair-living-wage-strategy-update.html and https://www.shiftproject.org/sdgs/living-wages/hm-fair-living-wage-strategy/ For UNILEVER, see: https://www.unilever.com/sustainable-living/enhancing-livelihoods/fairness-in-the-workplace/fair-compensation/ and pages 1-3 of: https://www.unilever.com/Images/unilever-framework-for-fair-compensation-2015-final_tcm244- 502647_en.pdf For IKEA, see p. 34 of: https://preview.thenewsmarket.com/Previews/IKEA/Document Assets/502623.pdf For AstraZeneca, see p. 5 of: https://www.astrazeneca.com/content/dam/az/our-company/Sustainability/great-place-towork/Our-people---May-2015.pdf For the Standard Chartered Bank, see p. 84 of: https://www.sc.com/annual-report/2017/
The Sustainability Yearbook 2019 • SAM • 19
The introduction of wage remediation processes has led to:
Better compensation systems – through implementing wage grids that align worker skills with rewards and pay
Retention of skilled workers – through improved worker motivation and satisfaction
Reduction of excessive wage costs – through reduced overtime costs
Improved worker well-being – through decreased overtime, improved health and safety
Better human resource management – through efficiency gains via workforce re-organization and
resource planning
Fairwage certification
These positive effects, together with growing demand
from business leaders (first from the garment sector,
but increasingly from other sectors, including furniture,
pharmaceuticals and banking) and investors led the
Fair Wage Network to develop a fair wage remediation
structure, fair wage indicators and dimensions into a
formal certification process. Upon successful completion,
companies receive the fair wage label as a sign of
their commitment to worker well-being, efficient wage
structures and internationally accepted wage standards.
The Fairwage trade mark is legally protected and
retained by the International Trade Center (ITC) for its
sustainability map project.9
The responsibility of the investment community Wages are moving in the right direction but not fast
enough. This may be, in part, due to a bias that sees
wages as a cost rather than a tool to engage employees,
reduce turnover, stimulate innovation and improve
overall efficiency. Company management and investors
alike need to understand the short- and long-term
benefits of including wages as part of a comprehensive
sustainability strategy.
Investor pressure can help to push the pace of progress
forward. Access to investor capital via global markets
gives corporate leaders the incentives needed to make
sustainability issues such as worker well-being and
compensation a priority in their own companies, as well
as in their global supply chains. And it brings visibility
and action on a global scale.
Company management and investors alike need to understand the short- and long-term benefits of including wages as part of a comprehensive sustainability strategy.
9 The International Trade Center (ITC) works to connect with international value chains in order to support developing countries design trade strategies that enable them to be more competitive internationally and facilitate local growth and employment. See Fair Wage standard in ITC Sustainability Map: https://sustainabilitymap.org/standard-details/539
20 • SAM • The Sustainability Yearbook 2019
Prominent investors are already forming alliances in
favor of living wage/fair wage strategies. Under the
umbrella Platform Living Wage Financial (PLWF), a group
of global institutional investors (which includes Robeco)
with combined assets of €725 billion, are using their
influence to engage companies to develop fairer
wages.10 No doubt more initiatives of this type will
emerge, especially as the importance of the UN’s
Sustainable Development Goals (SDGs) grows within
the investment community.
Investor demand for better wage indicators and wage-
related benchmarks for sustainability indexes would
also be an effective way of signaling companies to
take wage policies and practices seriously or run the
risk of negative publicity, lower stock valuations and
investor censure. Wage cost competitiveness can go
hand-in-hand with a more coherent, transparent and
fair framework on wage practices and pay systems.
Long-term strategies on wages and sustainability would
help to highlight their potential leverage effect on key
aspects of competitiveness.
As companies reconcile employees’ needs and well-
being with other competitive aspects such as human
resources, innovation, reputation and investment,
wages will increasingly be at the heart of companies’
future sustainability strategy.
Questions or comments for the author can be sent to:
Prominent investors are already forming alliances in favor of living wage/fair wage strategies.
10 https://apparelinsider.com/investors-call-for-living-wages-for-garment-workers/
The Sustainability Yearbook 2019 • SAM • 21
Slowly but surely: gradual progress towards gender equality

22 • SAM • The Sustainability Yearbook 2019
Gender diversity enhances corporate governance, talent attraction and human capital
development which fosters superior value creation not only within companies, but
also for stakeholders and society. Corporate policies promoting gender diversity are a
reflection of a well-managed company that realizes the value of multiple perspectives
in minimizing risk and driving long-term competitiveness. Token female appointments
are not the goal, but rather effective leadership.
Gender diversity can only be achieved by promoting gender equality, not in terms of
quotas or inaccurate measures of outcomes, but by addressing the social and cultural
stereotypes that have limited women’s ability to maximize professional opportunities.
Markéta Pokornà
SI Research Associate
RobecoSAM
Jacob Messina
CFA, Head of SI Research
RobecoSAM
The Sustainability Yearbook 2019 • SAM • 23
Why gender equality and diversity matter For RobecoSAM gender equality means not only equal
pay for equal work and equal gender ratios but also
equal access and equal treatment for career-advancing
opportunities. And that goes for senior management
and company boards as well as for the men and women
in the rank and file across the entire organization.
Corporate gender equality has important implications
– not just for female employees but also their male
colleagues, employers, currents shareholders, future
investors, and society. According to the IMF, gender
inequality is linked to sub-optimal economic growth.
Differences in the amount that men and women are
paid don’t just lead to income inequality, they also
result in unequal access to education, health services
and financial markets.1
Meanwhile, McKinsey suggests that achieving full
gender equality in the workforce could boost global
annual GDP by $28 trillion by 2025.2 Unfortunately,
according to the World Economic Forum, it will take 217
years to eliminate gender-based economic and health
disparities.3
How does this affect companies? Firms with high
gender diversity deliver better risk-adjusted stock returns
than those with low gender diversity.4 The presence of
women in the C-suite also correlates with profitability
and diverse leadership teams boost innovation and
improve financial performance.5
RobecoSAM asks companies a number of questions
about their gender equality policies and practices in our
Corporate Sustainability Assessment (CSA).
Gender inequality is linked to sub-optimal economic growth.
1 “Women, Work, and Economic Growth”, International Monetary
Fund, February 2017 2 “The Power of Parity: How Advancing Women’s Equality Can Add $12
Trillion to Global Growth”, McKinsey Global Institute, September 2015
3 “Global Gender Gap Report 2017”, World Economic Forum,
November 2017 4 “Putting Gender Diversity to Work: Better Funda- mentals, Less Volatility”, Morgan Stanley, 2016
5 “Is Gender Diversity Profitable? Evidence from a Global Survey”, Peterson Institute for International Economics, February 2016
How the CSA measures gender diversity
Every year we collect data about companies’ gender practices, covering four main topics:
1. Gender diversity on a company’s board of directors – women are currently underrepresented on boards
globally, despite evidence that shows diversity adds to effective governance and better performance.
We measure the number of women on board as well as whether gender diversity is part of the nomination
policy and process.
2. Gender diversity in the workforce – a balanced mix of men and women throughout a company boosts
its performance potential. We also look at the percentage of women in management and companies’ ability
to retain and attract women to senior positions.
3. Pay ratios – Fair compensation is not only ethical, it is essential for maintaining morale and creating a
thriving atmosphere where all employees feel valued. We capture pay data to determine whether
remuneration is equal between the female and male workforce at different levels (non-management,
management, executive).
4. Employees and family care – although parental responsibilities still fall disproportionately on women,
childcare issues can affect both sexes and require a balanced approach. We evaluate whether employers
offer benefits like on-site childcare facilities, help with care costs, parental leave and return to work policies,
and flexible working possibilities.
24 • SAM • The Sustainability Yearbook 2019
Commitment to board diversity is growing Albeit slowly, the needle is moving in the right direc-
tion. The proportion of firms in our survey that consider
gender in their public board diversity policy has increased
materially over the past year, to nearly 48% (2017) from
40% in 2016. Unsurprisingly, most of the improvement
stems from Europe and North America. Here again, Latin
American companies are lagging significantly behind
with only 5% of companies explicitly mentioning gender
in corporate diversity policies.
Huge disparities also exist at the sector level. Telecom-
munications leads the way with 63% of all firms ex-
plicitly considering gender in their board diversity policy.
And while the IT sector is helping advance technological
innovation, it is significantly trailing on gender diversity
with just 39% of firms with defined board diversity
policies.
Sector differences in board gender diversity are also
notable. Firms in financials and healthcare do best at
22%, whereas the IT, industrials and materials sectors
lag at 18%. However, results at the overall sector level
often mask noteworthy differences within underlying
sub-sectors (i.e. industries). For instance, the IT sector’s
poor performance overall is dragged down by a low
share of women (13%) in the hardware industry while
another IT sub-sector, software & services, performs
relatively better (23%). Other lagging industries include
automobiles & components, transportation, and
semiconductors (all below 17%).
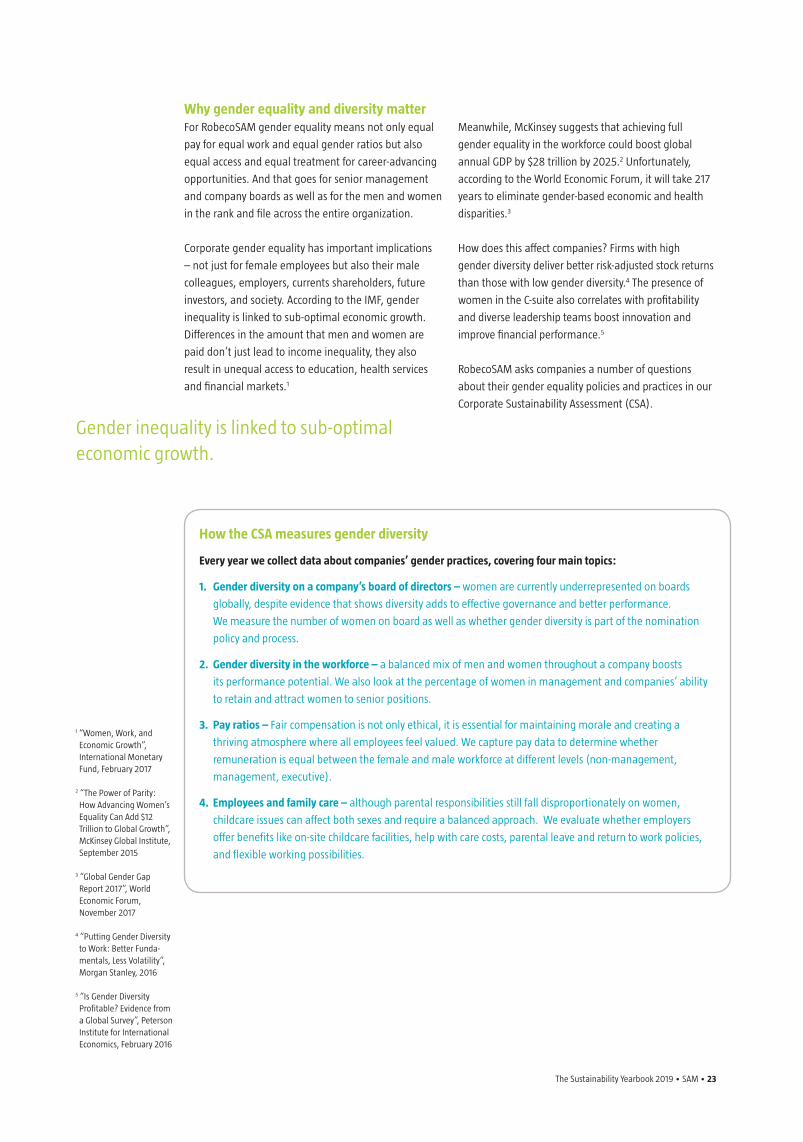
Gender diversity on corporate boards Although the pace has slowed over the past year,
gender diversity on corporate boards has been
increasing in most of the world over the past five years
ending in 2017 (See Figure 1).
With 29% of female board members, Europe is the
best-performing region – although its rate of progress
has recently slipped. At the other end of the spectrum
is Latin America where less than 7% of board members
are women. While countries in the Asia Pacific perform
better with 13% female board members, they still lag
significantly behind other regions. On the country level,
the worst-performing in our sample are Japan, Mexico,
Chile, and South Korea where boards are overwhelming
dominated by males – a male to female ratio of 93% to
less than 7%. That’s equal to more than 9 males with
one lone female participant.
Figure 1: Gender diversity on corporate boards has been increasing in most of the world (2013 – 2017)
Aver
age
shar
e of
wom
en o
n bo
ards
30%
25%
20%
15%
10%
5%
0
Source: RobecoSAM
2013 2014 2015 2016 2017
Europe Africa North America Asia Pacific Latin America
The Sustainability Yearbook 2019 • SAM • 25
Workforce participation The proportion of women in the workforce globally
fell slightly from 35.3% to 35.0% from 2016 to 2017,
reversing an increasing trend that we’ve seen in recent
years. Curiously, over the same time period, there was
an increase in the proportion of women in management
positions from 26.0% to 26.3%.
Regional disparities For the female share of the total workforce at the
regional level, North America is leading the way at
nearly 39%. Japan and South Korea both score poorly
at close to 25%, but India is the laggard in our sample
at 13%. North America also leads in terms of women in
management positions at just over 33%, demonstrating
the typical decline we see when promotions to
leadership positions are evaluated (e.g. there is almost
always a lower percentage of women in management
positions than in the total workforce).
While we would rather see no differences in female
representation percentages between management and
the overall workforce, North America’s 6% difference
(39% vs 33%) is small compared to lagging countries.
In Japan, a developed country with a strong economy
and long history of female workforce participation, the
difference is 15% (24% vs 9%) – or 2.5 times greater. This
is a significant loss of talent as companies fail to promote
female leaders that could bring fresh perspectives,
discover new opportunities, and create value for the
company and shareholders.
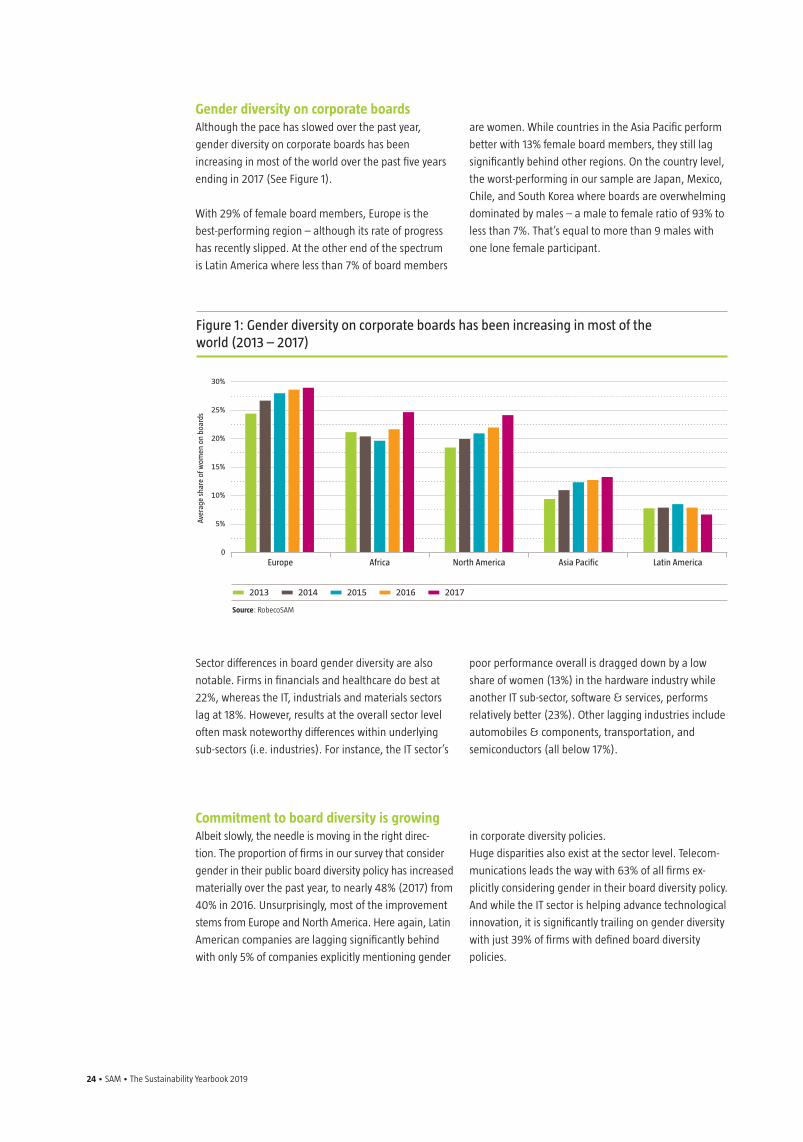
Sector level data
At the sector level, the proportion of women in the
workforce in IT has remained unchanged over the past
three years despite a number of initiatives to promote
tech as an attractive option for female workers. And
while women make up over half of the total workforce
in financial services sector, they account for less than
a quarter of its senior managers. Looking deeper,
interesting differences appear. For instance, insurance
companies and banks have slightly more female
workers than male, while diversified financials, which
includes asset managers and investment banks, has
slightly less (under 44%). Energy, utilities and materials
sectors all have lower average proportions of women
in their overall workforce with 25%, 23%, and 18%,
respectively, with no major improvements since 2013
(See Figure 2).
Figure 2: Energy, utilities and materials sectors all have lower average proportions of women
Fem
ale
shar
e as
% o
f to
tal w
orkf
orce
and
man
agem
ent p
ositi
ons
60%
50%
40%
30%
20%
10%
0
Source: RobecoSAM, Data as of 2017
Total workforce Junior management Senior management
Health Care
Financia
ls
Consum
er
Discretio
nary
Real Esta
te
Teleco
mm
unicatio
n
Service
s
Consum
er Sta
ples
Industrials
Informatio
n
Tech
nologyEn
ergy
Materials
Utilitie
s
26 • SAM • The Sustainability Yearbook 2019
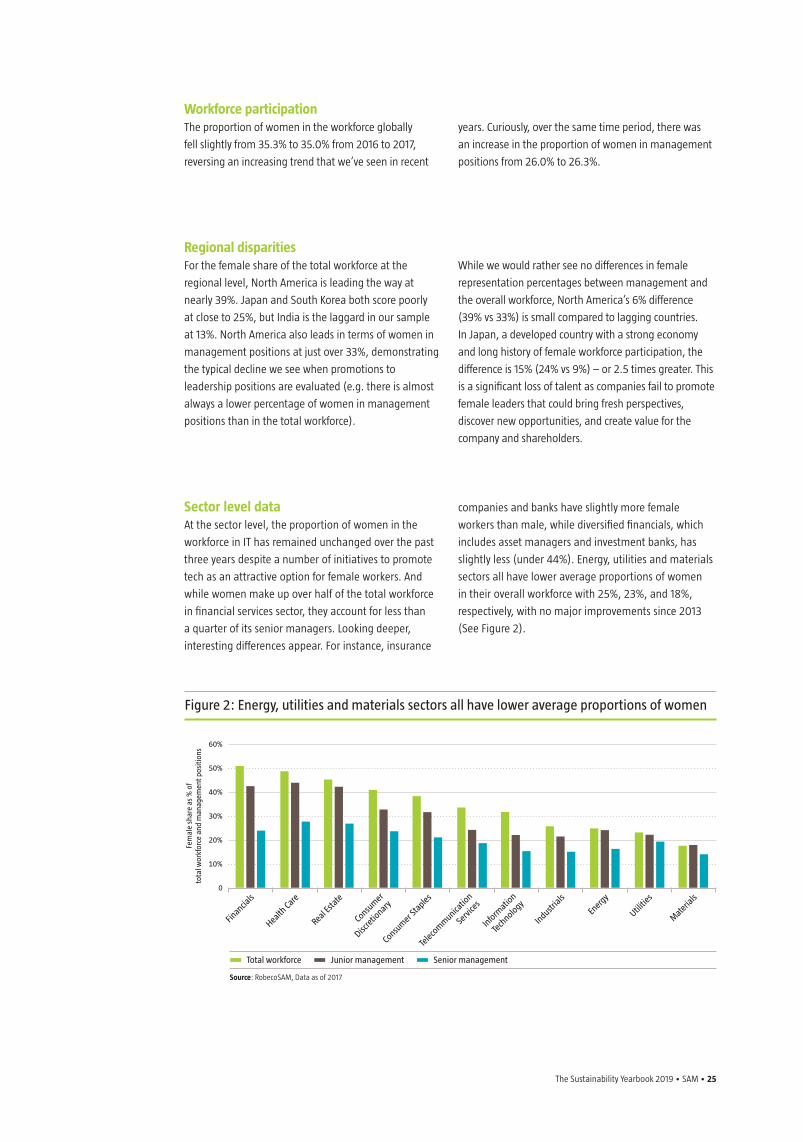
Rattling Ratios During 2013 to 2016, North American firms were
consistently better than their European counterparts
at retaining female managers. North American firm
retention rates fell in 2017, not because firms lost
women at senior levels but because they were more
successful at recruiting females for junior posts.
The proportion of females in junior roles increased 2
p.p. from 34% to 36% while the proportion in senior
positions increased only slightly (from 24.0% to 24.6%).
This had the ultimate effect of lowering retention ratios
in North America overall (See, Figure 3).
Among the worst performing countries is South Korea,
with just 11% median retention, meaning female talent
is largely lost at management levels. Given South Korea’s
economic power on the world stage, this represents
an appreciable loss of female potential that could
further boost Korean business overall and improve the
opportunity set for women across Korean society.
Among sectors, the data suggest that financials is the
poorest performing sector with only 55% of its junior
female share retained at senior roles.
Figure 3: Lower retention ratios in North America because of more successful recruiting of females for junior posts
Retaining Female Talent We assess a company’s ability to attract and retain
experienced women by looking at the retention of the
female share from junior to senior management levels.
The desirable rate is 100%, or a 1-to-1 ratio between
junior management females and senior management
females. Corporate reality is otherwise. On average only
19.9% of senior managers are women, meaning many
women are leaving the corporate ranks far too soon.
This underscores the importance of tracking female
attrition within companies to find out why and create
the right incentive structures to keep talent moving up
the ladder rather than dropping off it.
Although far from optimal, the median retention rate
overall is improving with time. There was a 5 percentage
point (p.p.) rise between 2013 and 2017 from 58 to
63%. Rises like these suggest companies are beginning
to recognize, reward and retain female talent as
they professionally develop and ascend through the
organizational ranks.6
On average only 19.9% of senior managers are women, meaning many women are leaving the corporate ranks far too soon.
6 Due to a significant number of outliers, we use a median rather than an average to summarize retention rate data.
Med
ian
Fem
ale
rete
ntio
n ra
te b
y re
gion
75%
70%
65%
60%
55%
50%
45%
40%
Source: RobecoSAM
North America Europe Asia Pacific
2013 2014 2015 2016 2017
The Sustainability Yearbook 2019 • SAM • 27
7 A 99% pay ratio means that a female earns 99% of (or 1% less than) what male colleagues earn.
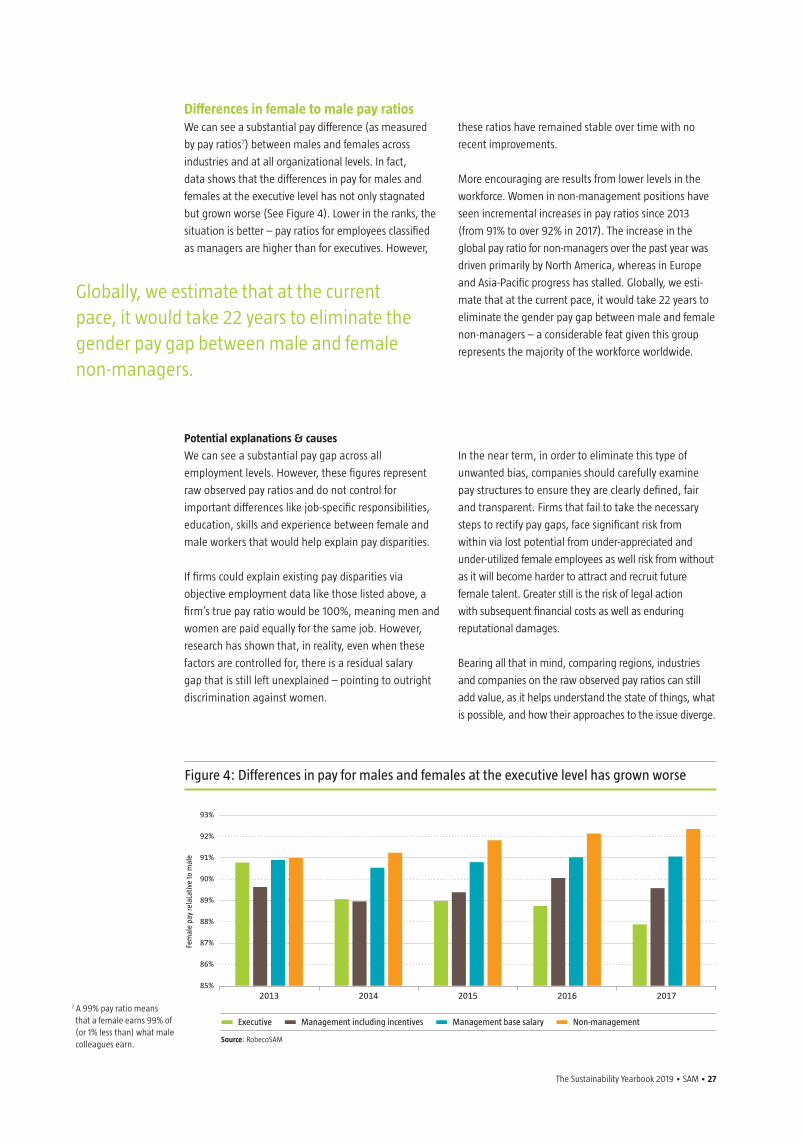
Differences in female to male pay ratios We can see a substantial pay difference (as measured
by pay ratios7) between males and females across
industries and at all organizational levels. In fact,
data shows that the differences in pay for males and
females at the executive level has not only stagnated
but grown worse (See Figure 4). Lower in the ranks, the
situation is better – pay ratios for employees classified
as managers are higher than for executives. However,
these ratios have remained stable over time with no
recent improvements.
More encouraging are results from lower levels in the
workforce. Women in non-management positions have
seen incremental increases in pay ratios since 2013
(from 91% to over 92% in 2017). The increase in the
global pay ratio for non-managers over the past year was
driven primarily by North America, whereas in Europe
and Asia-Pacific progress has stalled. Globally, we esti-
mate that at the current pace, it would take 22 years to
eliminate the gender pay gap between male and female
non-managers – a considerable feat given this group
represents the majority of the workforce worldwide.
Globally, we estimate that at the current pace, it would take 22 years to eliminate the gender pay gap between male and female non-managers.
Potential explanations & causes
We can see a substantial pay gap across all
employment levels. However, these figures represent
raw observed pay ratios and do not control for
important differences like job-specific responsibilities,
education, skills and experience between female and
male workers that would help explain pay disparities.
If firms could explain existing pay disparities via
objective employment data like those listed above, a
firm’s true pay ratio would be 100%, meaning men and
women are paid equally for the same job. However,
research has shown that, in reality, even when these
factors are controlled for, there is a residual salary
gap that is still left unexplained – pointing to outright
discrimination against women.
In the near term, in order to eliminate this type of
unwanted bias, companies should carefully examine
pay structures to ensure they are clearly defined, fair
and transparent. Firms that fail to take the necessary
steps to rectify pay gaps, face significant risk from
within via lost potential from under-appreciated and
under-utilized female employees as well risk from without
as it will become harder to attract and recruit future
female talent. Greater still is the risk of legal action
with subsequent financial costs as well as enduring
reputational damages.
Bearing all that in mind, comparing regions, industries
and companies on the raw observed pay ratios can still
add value, as it helps understand the state of things, what
is possible, and how their approaches to the issue diverge.
Figure 4: Differences in pay for males and females at the executive level has grown worse
Fem
ale
pay
rela
Lativ
e to
mal
e
93%
92%
91%
90%
89%
88%
87%
86%
85%
Source: RobecoSAM
Executive Management including incentives Management base salary Non-management
2013 2014 2015 2016 2017
28 • SAM • The Sustainability Yearbook 2019
Flexible work and family care
Flexible work hours, flexible work locations
(i.e. home office), paid time-off for new births, and
other childcare options help relieve stress on working
parents and should be standard features of any
company’s personnel policy.
The CSA measures a number of working conditions and
benefits offered by companies to support parents – not
just working mothers but working fathers as well – in
their child care responsibilities. Moreover, measures
should not favour one gender over another but should
support both with flexible work arrangements that
extend beyond maternity leaves to include options like
paternity leaves for fathers, home-office possibilities
and flexible working arrangements.
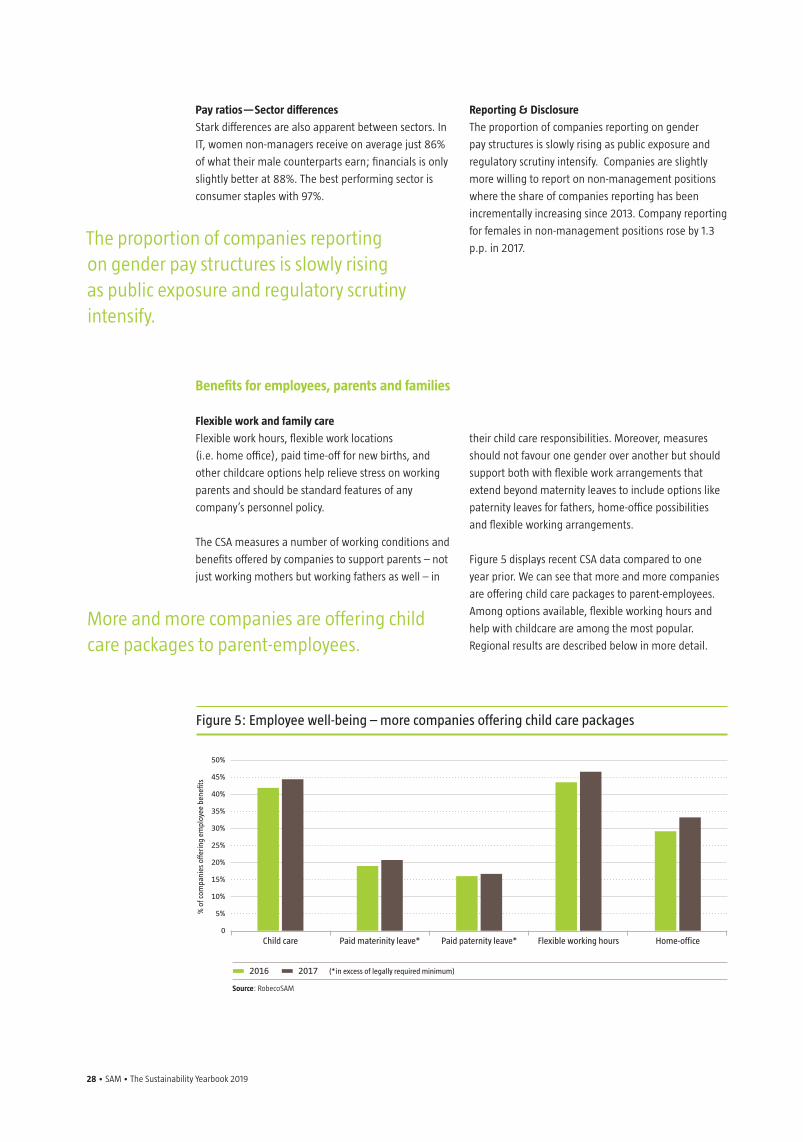
Figure 5 displays recent CSA data compared to one
year prior. We can see that more and more companies
are offering child care packages to parent-employees.
Among options available, flexible working hours and
help with childcare are among the most popular.
Regional results are described below in more detail.
More and more companies are offering child care packages to parent-employees.
Benefits for employees, parents and families
Figure 5: Employee well-being – more companies offering child care packages
Pay ratios—Sector differences
Stark differences are also apparent between sectors. In
IT, women non-managers receive on average just 86%
of what their male counterparts earn; financials is only
slightly better at 88%. The best performing sector is
consumer staples with 97%.
Reporting & Disclosure
The proportion of companies reporting on gender
pay structures is slowly rising as public exposure and
regulatory scrutiny intensify. Companies are slightly
more willing to report on non-management positions
where the share of companies reporting has been
incrementally increasing since 2013. Company reporting
for females in non-management positions rose by 1.3
p.p. in 2017.The proportion of companies reporting on gender pay structures is slowly rising as public exposure and regulatory scrutiny intensify.
% o
f com
pani
es o
fferi
ng e
mpl
oyee
ben
efits
50%
45%
40%
35%
30%
25%
20%
15%
10%
5%
0
Source: RobecoSAM
2016 2017 (*in excess of legally required minimum)
Child care Paid materinity leave* Paid paternity leave* Flexible working hours Home-office
The Sustainability Yearbook 2019 • SAM • 29
Paid maternity and paternity leave
European companies are most likely to provide paid
maternity leave in excess of the legally required
minimum (29% of companies), followed by firms in
Asia Pacific and Latin America (both with 21%). Just 15%
of North American firms do so.
From a sustainability perspective, we believe it is
important for firms to go beyond legally-binding
requirements for parental leaves. Legal mandates are
intentionally designed to provide minimum
baselines across the entire economy; yet the workforce
Flexible working hours
European companies are in the lead in terms of
providing their employees with flexible working hours:
61% of European firms did so in 2017, compared with
just 37% in North America. Germany led the way at
the country level, with 92% of firms allowing flexible
Home office
With 51% of firms in our survey providing their
employees with home-working opportunities, Europe
is again the leader of the pack. Companies in other
characteristics of each sector are unique and parental
leave policies should be customized in order to optimize
the benefits for both employees and employers.
The proportion of firms paying paternity leave in excess
of the legally required minimum is growing overall –
North America gained 5 p.p. while Europe and Africa
etched up another 2 p.p.
Interesting anomalies exist that run against intuition.
Sweden, for example, has very few firms that exceed
the legal limit for paternity leave. A likely explanation
may be because the legal minimum in Scandinavian
countries is already so generous that companies feel
additional benefits are unnecessary.
working hours compared to just 3% of Chinese
companies within the CSA.
Sector data reveals the banking industry is most willing
to provide flexible working hours to staff, with 62% of
companies allowing such arrangements.
regions are lagging behind: in Asia Pacific only 30% of
companies offer this flexibility and in North America the
share is only 26%.
Child care
European companies are out in front when it comes
to providing child care to their employees – 55% offer
either in-house childcare, or help with the cost of
external care providers. At the country level, Australia
and the US are the notable low performers with only
35% and 36% of companies offering childcare benefits,
respectively, whereas in Japan childcare benefits are
widespread (71% of companies).
The proportion of firms paying paternity leave in excess of legal requirements is growing worldwide.
Europe and Japan are top performers in offering childcare benefits while the US and Australia perform relatively poorly.
European companies are in the lead in terms of providing their employees with flexible working hours.
30 • SAM • The Sustainability Yearbook 2019
Legislation could drive further gender equality improvements
The data from our 2018 CSA show that there is still a
sizeable gender gap in the workplace in all industries
and in all regions of the world. In general, European
companies are leading the way in terms of employee
gender equality, although there is considerable variation
between European countries. Countries in emerging
markets – which have the most to gain from increasing
gender equality in terms of economy-boosting potential
– lag far behind.
While gender inequality within companies is
persistent, there is cause for optimism. It’s clear from
our findings that equality is slowly increasing overall
(notwithstanding issues such as executive pay, which
seems to be moving in reverse of general trends).
What’s more, gender equality’s increased public
attention and momentum, could help push law-
makers in legislating more transparency from firms
on gender statistics. Moreover, lawmakers could also
use regulations to incentivize companies to design and
implement processes that eliminate gender imbalances.
In fact, this is already happening. For example, in
January 2018 a law came into effect in Germany that
gave women and men the right to know what co-
workers performing the same function are earning.8
The same month, companies in Iceland were required
by law to pay women the same as men.9
In the UK, a government-backed review in November
2018 urged FTSE 350 companies to do more to meet the
target of a third of women in senior leadership positions
by 2020; this on top of legislation in May that required
companies with 250 employees or more to disclose
information on pay gaps in their organization.
Across the Atlantic, the Canadian government is
launching national pay equity legislation and a new
Department for Women and Gender Equality,10 while
California recently became the first state in the US
to pass a law requiring the presence of women on
corporate boards.11
Countries in emerging markets – which have the most to gain from increasing gender equality in terms of economy-boosting potential – lag far behind.
8 https://www.ft.com/content/e9f618c0-f210-11e7-ac08-07c3086a2625
9 https://www.businessinsider.de/iceland-has-made-it-illegal-to-pay-women-less-than-men-2018-1?r=UK&IR=T
10 https://www.theglobeandmail.com/politics/article-budget-bill-includes-pay-equity-law-creates-new-department-for-women/
11 https://www.theguardian.com/us-news/2018/oct/01/max-benwell-maxbenwellguardiancouk-california-women-board-directors-companies-law-jerry-brown-
The Sustainability Yearbook 2019 • SAM • 31
ConclusionGender inequality is still present in every industry,
even despite significant efforts to promote greater
diversity and close the pay gap. Gender equality is
vital for companies for many reasons. A positive re-
putation for fair play and equal pay across employees
helps maximize access to a bigger talent pool of
skilled workers; increases the ability to retain top
talent once hired; contributes to positive morale and
keeps employees motivated. RobecoSAM’s Gender
measurement framework supports this view and sug-
gests that companies with a more diverse and equal
workforce are indeed better positioned to outperform.
At RobecoSAM, we’re proud to be playing a role
in promoting gender equality in the workplace.
Over the 15 years we’ve been assessing companies’
sustainability characteristics, our process of compe-
titive benchmarking provides an incentive for many
companies to improve their performance on factors that
long-term investors consider important. By levelling
the playing field for men and women in the workplace,
firms can also help promote gender equality in wider
society as well as enhance their performance. Similarly,
investors who take these factors into account can play
a role in driving social change in addition to enhancing
their returns.
But there’s still much work to be done.
Companies in poorly performing sectors where women
are underrepresented, must take action and provide
the necessary incentives – just offering the same
opportunities as men isn’t enough to ensure balanced
gender representation and fair remuneration. Possible
options include increasing the female share of job
applicants by encouraging women to apply for positions
as well as providing them with additional training in
sectors such as IT, utilities and materials. To ensure
that women have a higher chance of being hired, the
focus should turn to making sure their skillsets are
competitive. More women should be encouraged to
pursue careers in science, technology, engineering and
math (STEM) and persistent barriers within academic
and research institutions that have traditionally
thwarted female advancement should be removed.
Not all decisions leading to gender imbalances
are intentional. With this in mind, we would urge
companies to check hiring processes and pay scales
and consider possible biases that could result in
under-representation and unfair remuneration in
their organization. Not only salary but all forms of
remuneration, including bonuses, should be based on
clear metrics and fully transparent.
A balanced workforce overall is not enough. Firms
should ensure that women are well represented in
revenue-generating and core business functions, not
just in support and administrative roles.
Finally, gender diversity is only one piece of the equality
puzzle. Diversity and equality in hiring practices and
employee treatment should extend not just to gender
but to race, ethnicity, nationality, and other aspects
of background and culture. As supply chains globalize,
geopolitics polarize, and social media channels
demonize, companies should by now realize the
strategic advantages of building an employee base that
is not only talented but also diverse.
Talent and diversity taken together can build into a
powerful force that help companies promote collective
thinking, improve decision-making, enhance end-
customer focus and satisfaction as well as reduce risk-
taking. As the saying goes, what’s good for the goose
is good for the gander… and, in fact, for all of us in the
global pond.
By levelling the playing field for men and women in the workplace, firms can also help promote gender equality in wider society as well as enhance their performance.
A balanced workforce overall is not enough. Firms should ensure that women are well represented in revenue-generating and core business functions.
32 • SAM • The Sustainability Yearbook 2019
No Firm is an Island: using the SDGs to bridge modern portfolio management to the future
The Sustainability Yearbook 2019 • SAM • 33
Companies don’t operate in seclusion; they are part of a larger inter-related system
made up of variables that interact in unpredictable ways. Yet, traditional models used
in portfolio construction do not sufficiently account for companies’ interaction with,
and impact on, other firms, actors and variables within the system.
These impacts can have serious and far-reaching consequences for both the business
ecosystem and society. When viewed in the long-term, many un-sustainable companies
are, at present, over-valued and many sustainable companies under-valued.
The SDGs provide a useful framework to help companies and investment managers
implement a systems-thinking approach that considers the impact of decisions on
future resources. Company performance assessed holistically in this way safeguards
portfolio returns by better synchronizing the short-term assets with the long-term
liabilities of universal asset owners.
Michael van der Meer
CFA, Senior SI Analyst,
Emerging Markets,
RobecoSAM
34 • SAM • The Sustainability Yearbook 2019
1 “Capitalism coming of age: using the SDGs to bridge business strategy and social responsibility”, Hengerer (2017) https://yearbook.robecosam.com/articles/capitalism-coming-of-age-using-the-sdgs-to-bridge-business-strategy-and-social-responsibility/
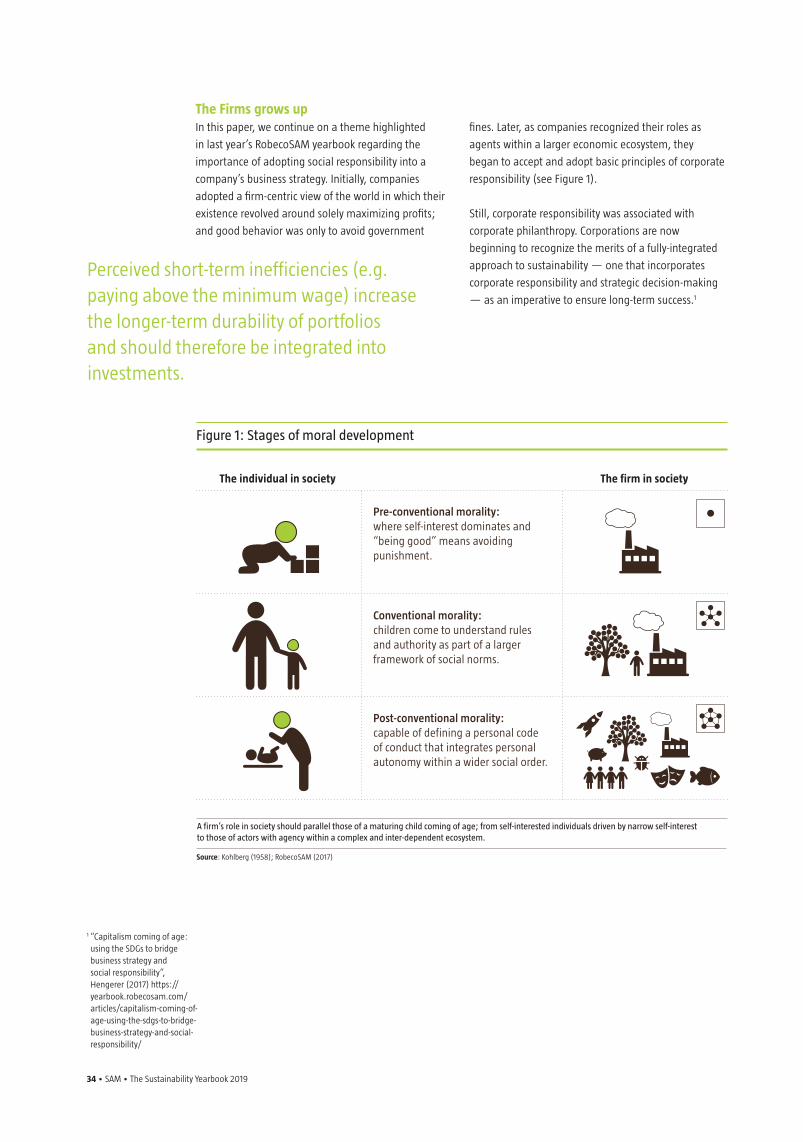
Figure 1: Stages of moral development
The individual in society
Source: Kohlberg (1958); RobecoSAM (2017)
A firm’s role in society should parallel those of a maturing child coming of age; from self-interested individuals driven by narrow self-interest to those of actors with agency within a complex and inter-dependent ecosystem.
The firm in society
Pre-conventional morality: where self-interest dominates and “being good” means avoiding punishment.
Conventional morality: children come to understand rules and authority as part of a larger framework of social norms.
Post-conventional morality: capable of defining a personal code of conduct that integrates personal autonomy within a wider social order.
The Firms grows up In this paper, we continue on a theme highlighted
in last year’s RobecoSAM yearbook regarding the
importance of adopting social responsibility into a
company’s business strategy. Initially, companies
adopted a firm-centric view of the world in which their
existence revolved around solely maximizing profits;
and good behavior was only to avoid government
fines. Later, as companies recognized their roles as
agents within a larger economic ecosystem, they
began to accept and adopt basic principles of corporate
responsibility (see Figure 1).
Still, corporate responsibility was associated with
corporate philanthropy. Corporations are now
beginning to recognize the merits of a fully-integrated
approach to sustainability — one that incorporates
corporate responsibility and strategic decision-making
— as an imperative to ensure long-term success.1
Perceived short-term inefficiencies (e.g. paying above the minimum wage) increase the longer-term durability of portfolios and should therefore be integrated into investments.

The Sustainability Yearbook 2019 • SAM • 35
We expand on this view here by arguing that, to meet
their return requirements in the long-run, investors
also need to be aware of the inter-dependencies of
the environment in which companies operate. In this
context, the UN’s Sustainable Development Goals
(SDGs) are a useful framework for helping evaluate
whether companies are producing products and
services that have long-term value for society. Only
these companies will have the potential to adapt
and thrive in the long run, making them sustainable
investment choices.
We further argue that perceived short-term
inefficiencies (for example, paying above the minimum
wage which contributes to a number of SDGs including
no poverty, decent work, as well as good health and
well-being) increase the longer-term durability of
portfolios and should therefore be integrated into
investments.
2 “The 169 Command-ments”, The Economist, (March 26, 2015)
3 See also Cartesian rationalism and Laplace’s demon, the concept in which if someone (the Demon) knows the precise location and momentum of every atom in the universe, their past and future values for any given time are entailed; they can be calculated from the laws of classical mechanics.
4 Example borrowed from a presentation by Dr. Uttam Kumar Sarkar “Financial Markets and Complex Systems” (undated)
To meet their return requirements in the long-run, investors also need to be aware of the inter-dependencies of the environment in which companies operate.
Reductionism vs complexityFair criticism has been leveled at the SDGs for being
too broad and complex for effectively setting priorities,
especially for governments.2 Yet, the SDGs’ evolution
from the simpler Millennium Development Goals
(MDGs) provides more complete coverage of the
world’s challenges and their interdependencies.
From this perspective the SDGs are a useful investment
framework for long-term portfolio construction as
it moves us beyond the traditional “reductionist”
world view that prevails in finance. This reductionist
worldview, which is based on a determinism
exemplified by Newtonian physics, in which all things
can be known given enough information.3 Problems
scale linearly - like adding grains of sand to a bucket,
and the total mass of a bucket of sand is simply the
sum of the mass of the individual grains.
It is a simple process – additive, linear, and completely
predictable.4 This concept is caricatured in Figure 2,
where, if true, a duck’s nature (its actions and behavior)
are reduced to the sum of its parts (a hose and series of
mechanical gears) and therefore should be completely
explainable and predictable. Reality, however, proves
otherwise.
Figure 2: Reductionist model of a duck
Source: Descartes (1662)
A duck’s nature and actions reduced to the sum of its parts-a hose and series of gears. Until recently prevailing models have largely described the world in linear and mechanistic ways. Current theories based on mounting evidence from across life, environmental and economic sciences, have added non-linearity and complexity to this simplistic view of the world.
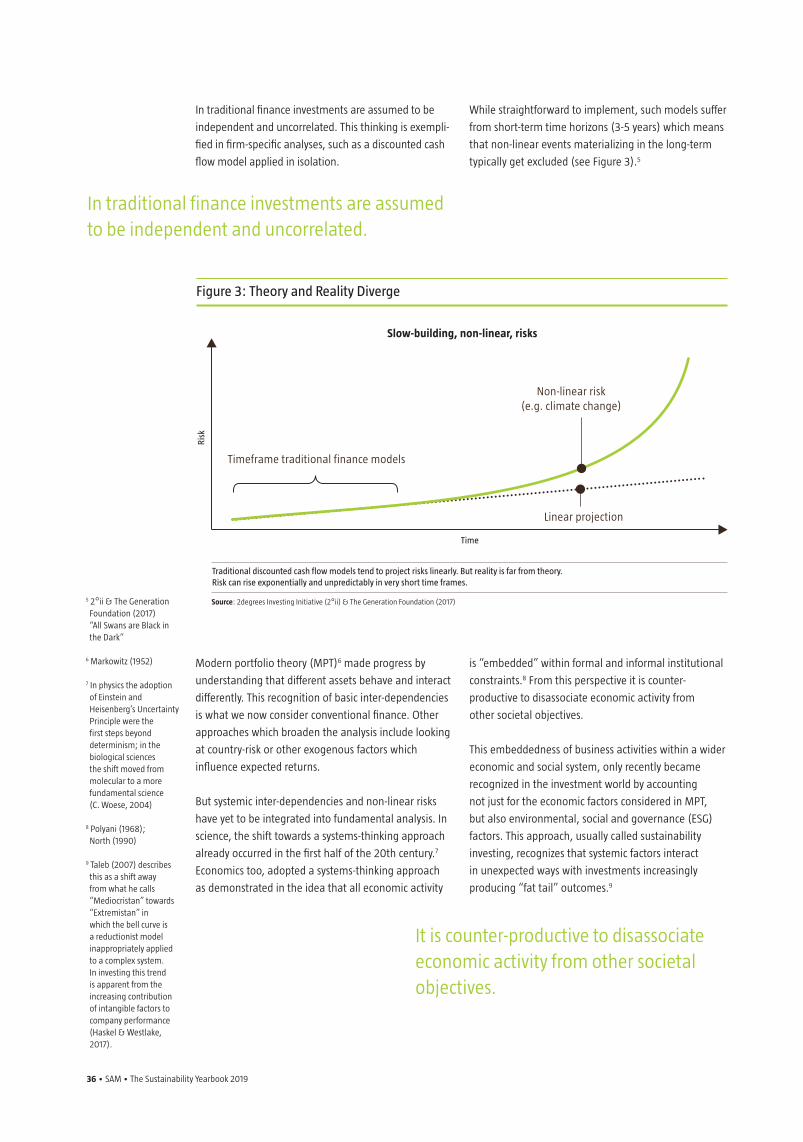
36 • SAM • The Sustainability Yearbook 2019
In traditional finance investments are assumed to be
independent and uncorrelated. This thinking is exempli-
fied in firm-specific analyses, such as a discounted cash
flow model applied in isolation.
While straightforward to implement, such models suffer
from short-term time horizons (3-5 years) which means
that non-linear events materializing in the long-term
typically get excluded (see Figure 3).5
In traditional finance investments are assumed to be independent and uncorrelated.
5 2°ii & The Generation Foundation (2017) “All Swans are Black in the Dark”
6 Markowitz (1952)
7 In physics the adoption of Einstein and Heisenberg’s Uncertainty Principle were the first steps beyond determinism; in the biological sciences the shift moved from molecular to a more fundamental science (C. Woese, 2004)
8 Polyani (1968); North (1990)
9 Taleb (2007) describes this as a shift away from what he calls “Mediocristan” towards “Extremistan” in which the bell curve is a reductionist model inappropriately applied to a complex system. In investing this trend is apparent from the increasing contribution of intangible factors to company performance (Haskel & Westlake, 2017).
Figure 3: Theory and Reality Diverge
Slow-building, non-linear, risks
Risk
Time
Source: 2degrees Investing Initiative (2°ii) & The Generation Foundation (2017)
Traditional discounted cash flow models tend to project risks linearly. But reality is far from theory. Risk can rise exponentially and unpredictably in very short time frames.
Non-linear risk(e.g. climate change)
Timeframe traditional finance models
Linear projection
Modern portfolio theory (MPT)6 made progress by
understanding that different assets behave and interact
differently. This recognition of basic inter-dependencies
is what we now consider conventional finance. Other
approaches which broaden the analysis include looking
at country-risk or other exogenous factors which
influence expected returns.
But systemic inter-dependencies and non-linear risks
have yet to be integrated into fundamental analysis. In
science, the shift towards a systems-thinking approach
already occurred in the first half of the 20th century.7
Economics too, adopted a systems-thinking approach
as demonstrated in the idea that all economic activity
is “embedded” within formal and informal institutional
constraints.8 From this perspective it is counter-
productive to disassociate economic activity from
other societal objectives.
This embeddedness of business activities within a wider
economic and social system, only recently became
recognized in the investment world by accounting
not just for the economic factors considered in MPT,
but also environmental, social and governance (ESG)
factors. This approach, usually called sustainability
investing, recognizes that systemic factors interact
in unexpected ways with investments increasingly
producing “fat tail” outcomes.9
It is counter-productive to disassociate economic activity from other societalobjectives.
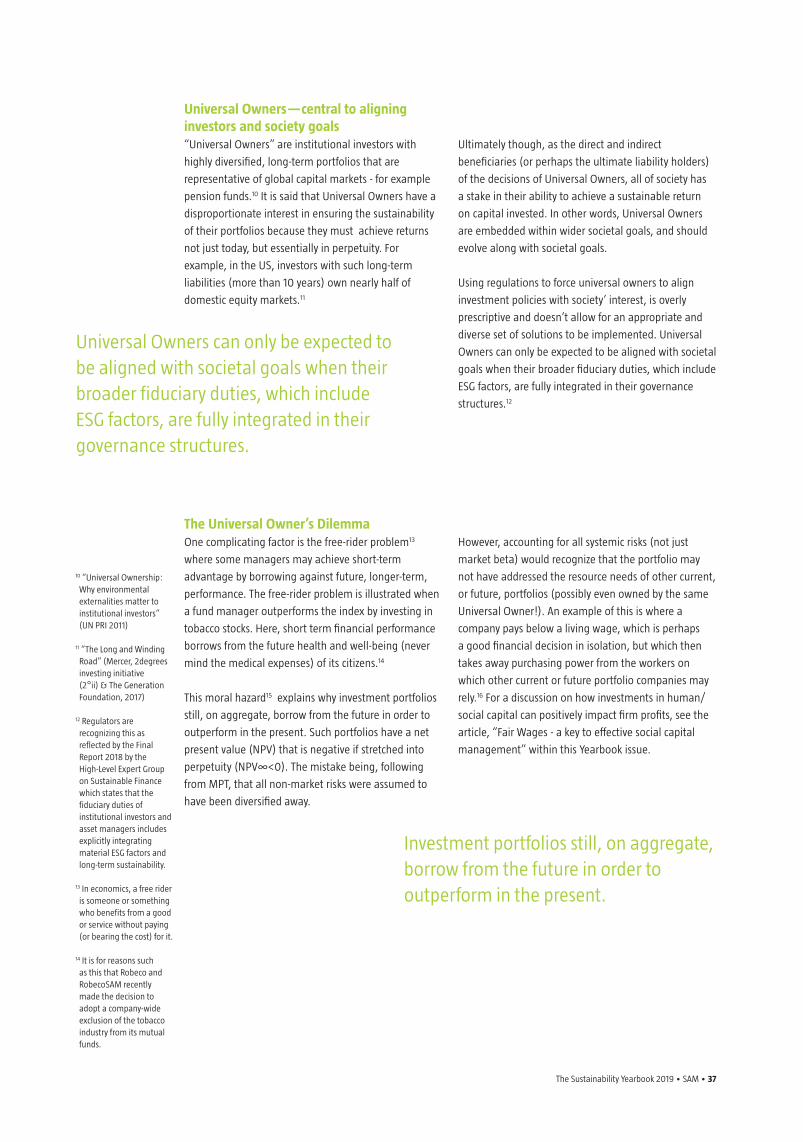
The Sustainability Yearbook 2019 • SAM • 37
Universal Owners—central to aligning investors and society goals“Universal Owners” are institutional investors with
highly diversified, long-term portfolios that are
representative of global capital markets - for example
pension funds.10 It is said that Universal Owners have a
disproportionate interest in ensuring the sustainability
of their portfolios because they must achieve returns
not just today, but essentially in perpetuity. For
example, in the US, investors with such long-term
liabilities (more than 10 years) own nearly half of
domestic equity markets.11
Ultimately though, as the direct and indirect
beneficiaries (or perhaps the ultimate liability holders)
of the decisions of Universal Owners, all of society has
a stake in their ability to achieve a sustainable return
on capital invested. In other words, Universal Owners
are embedded within wider societal goals, and should
evolve along with societal goals.
Using regulations to force universal owners to align
investment policies with society’ interest, is overly
prescriptive and doesn’t allow for an appropriate and
diverse set of solutions to be implemented. Universal
Owners can only be expected to be aligned with societal
goals when their broader fiduciary duties, which include
ESG factors, are fully integrated in their governance
structures.12
10 “Universal Ownership: Why environmental externalities matter to institutional investors” (UN PRI 2011)
11 “The Long and Winding Road” (Mercer, 2degrees investing initiative (2°ii) & The Generation Foundation, 2017)
12 Regulators are recognizing this as reflected by the Final Report 2018 by the High-Level Expert Group on Sustainable Finance which states that the fiduciary duties of institutional investors and asset managers includes explicitly integrating material ESG factors and long-term sustainability.
13 In economics, a free rider is someone or something who benefits from a good or service without paying (or bearing the cost) for it.
14 It is for reasons such as this that Robeco and RobecoSAM recently made the decision to adopt a company-wide exclusion of the tobacco industry from its mutual funds.
Universal Owners can only be expected to be aligned with societal goals when their broader fiduciary duties, which include ESG factors, are fully integrated in their governance structures.
The Universal Owner’s Dilemma One complicating factor is the free-rider problem13
where some managers may achieve short-term
advantage by borrowing against future, longer-term,
performance. The free-rider problem is illustrated when
a fund manager outperforms the index by investing in
tobacco stocks. Here, short term financial performance
borrows from the future health and well-being (never
mind the medical expenses) of its citizens.14
This moral hazard15 explains why investment portfolios
still, on aggregate, borrow from the future in order to
outperform in the present. Such portfolios have a net
present value (NPV) that is negative if stretched into
perpetuity (NPV∞<0). The mistake being, following
from MPT, that all non-market risks were assumed to
have been diversified away.
However, accounting for all systemic risks (not just
market beta) would recognize that the portfolio may
not have addressed the resource needs of other current,
or future, portfolios (possibly even owned by the same
Universal Owner!). An example of this is where a
company pays below a living wage, which is perhaps
a good financial decision in isolation, but which then
takes away purchasing power from the workers on
which other current or future portfolio companies may
rely.16 For a discussion on how investments in human/
social capital can positively impact firm profits, see the
article, “Fair Wages - a key to effective social capital
management” within this Yearbook issue.
Investment portfolios still, on aggregate, borrow from the future in order to outperform in the present.
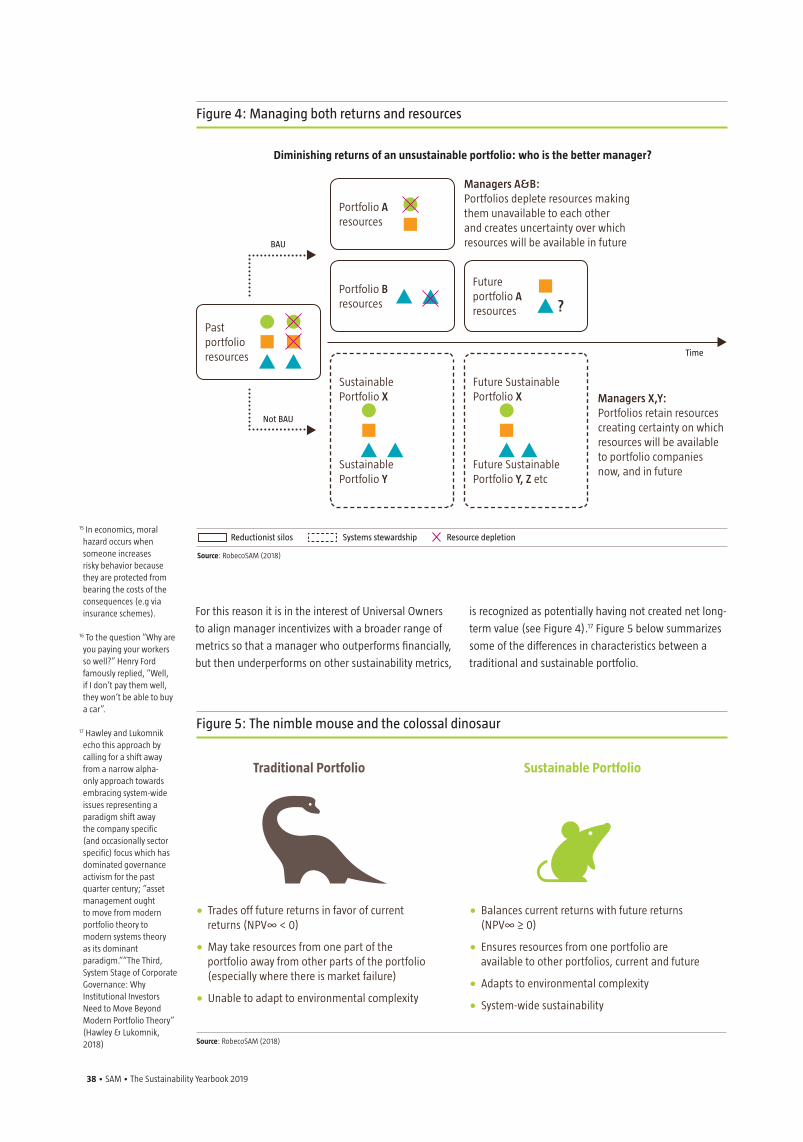
38 • SAM • The Sustainability Yearbook 2019
15 In economics, moral hazard occurs when someone increases risky behavior because they are protected from bearing the costs of the consequences (e.g via insurance schemes).
16 To the question “Why are you paying your workers so well?” Henry Ford famously replied, “Well, if I don’t pay them well, they won’t be able to buy a car”.
17 Hawley and Lukomnik echo this approach by calling for a shift away from a narrow alpha-only approach towards embracing system-wide issues representing a paradigm shift away the company specific (and occasionally sector specific) focus which has dominated governance activism for the past quarter century; “asset management ought to move from modern portfolio theory to modern systems theory as its dominant paradigm.””The Third, System Stage of Corporate Governance: Why Institutional Investors Need to Move Beyond Modern Portfolio Theory” (Hawley & Lukomnik, 2018)
Figure 4: Managing both returns and resources
Diminishing returns of an unsustainable portfolio: who is the better manager?
Managers A&B: Portfolios deplete resources making them unavailable to each other and creates uncertainty over which resources will be available in future
Time
Source: RobecoSAM (2018)
Reductionist silos Systems stewardship Resource depletion
Pastportfolioresources
Portfolio Aresources
Futureportfolio Aresources
Portfolio Bresources
Future SustainablePortfolio X
Future SustainablePortfolio Y, Z etc
SustainablePortfolio X
SustainablePortfolio Y
Managers X,Y: Portfolios retain resources creating certainty on which resources will be available to portfolio companies now, and in future
?
BAU
Not BAU
For this reason it is in the interest of Universal Owners
to align manager incentivizes with a broader range of
metrics so that a manager who outperforms financially,
but then underperforms on other sustainability metrics,
is recognized as potentially having not created net long-
term value (see Figure 4).17 Figure 5 below summarizes
some of the differences in characteristics between a
traditional and sustainable portfolio.
Figure 5: The nimble mouse and the colossal dinosaur
Traditional Portfolio
Source: RobecoSAM (2018)
Sustainable Portfolio
• Trades off future returns in favor of current returns (NPV∞ < 0)
• May take resources from one part of the portfolio away from other parts of the portfolio (especially where there is market failure)
• Unable to adapt to environmental complexity
• Balances current returns with future returns (NPV∞ ≥ 0)
• Ensures resources from one portfolio are available to other portfolios, current and future
• Adapts to environmental complexity
• System-wide sustainability
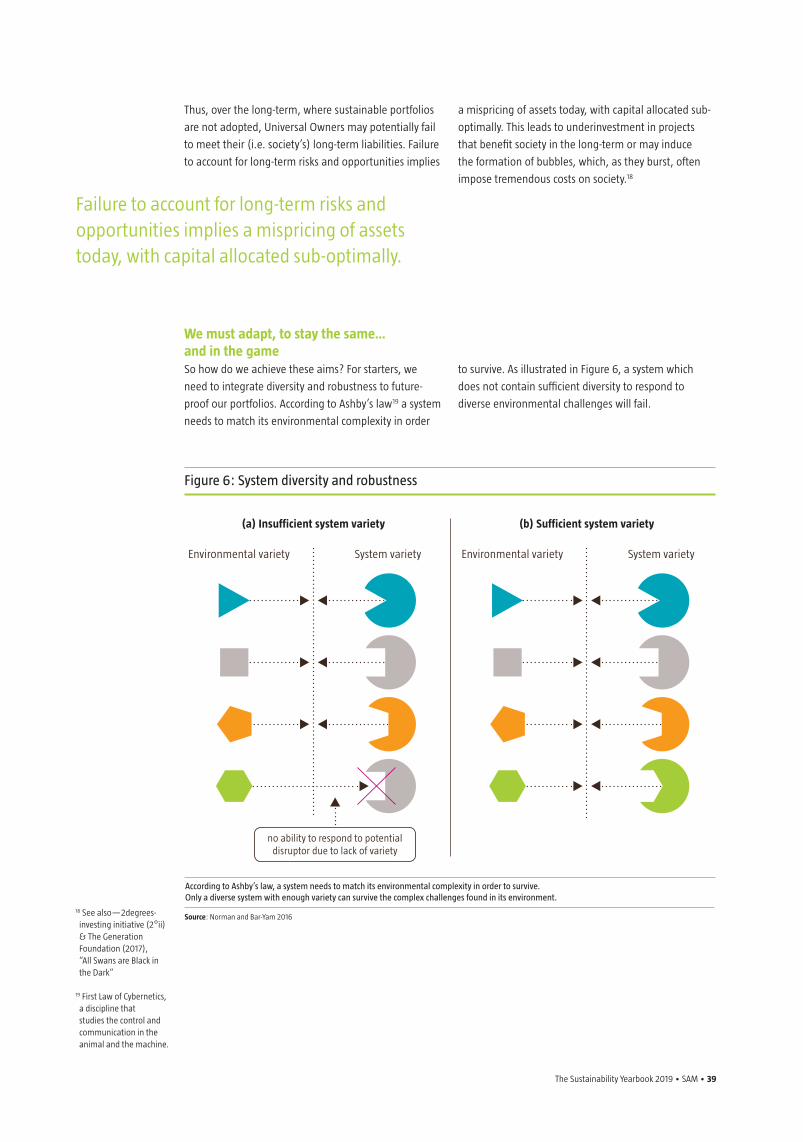
The Sustainability Yearbook 2019 • SAM • 39
Thus, over the long-term, where sustainable portfolios
are not adopted, Universal Owners may potentially fail
to meet their (i.e. society’s) long-term liabilities. Failure
to account for long-term risks and opportunities implies
a mispricing of assets today, with capital allocated sub-
optimally. This leads to underinvestment in projects
that benefit society in the long-term or may induce
the formation of bubbles, which, as they burst, often
impose tremendous costs on society.18
Failure to account for long-term risks and opportunities implies a mispricing of assets today, with capital allocated sub-optimally.
We must adapt, to stay the same… and in the gameSo how do we achieve these aims? For starters, we
need to integrate diversity and robustness to future-
proof our portfolios. According to Ashby’s law19 a system
needs to match its environmental complexity in order
to survive. As illustrated in Figure 6, a system which
does not contain sufficient diversity to respond to
diverse environmental challenges will fail.
Figure 6: System diversity and robustness
(a) Insufficient system variety
Source: Norman and Bar-Yam 2016
According to Ashby’s law, a system needs to match its environmental complexity in order to survive.Only a diverse system with enough variety can survive the complex challenges found in its environment.
(b) Sufficient system variety
Environmental variety System variety Environmental variety System variety
no ability to respond to potential disruptor due to lack of variety
18 See also—2degrees-investing initiative (2°ii) & The Generation Foundation (2017), “All Swans are Black in the Dark”
19 First Law of Cybernetics, a discipline that studies the control and communication in the animal and the machine.
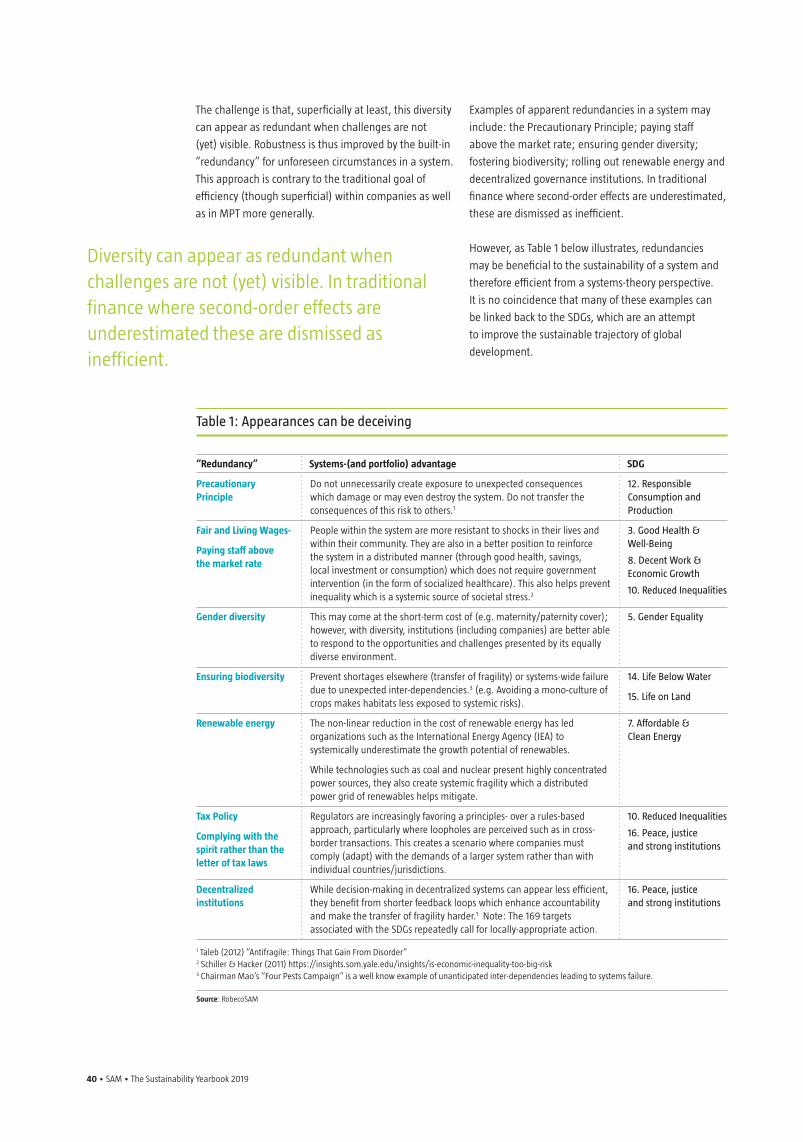
40 • SAM • The Sustainability Yearbook 2019
The challenge is that, superficially at least, this diversity
can appear as redundant when challenges are not
(yet) visible. Robustness is thus improved by the built-in
“redundancy” for unforeseen circumstances in a system.
This approach is contrary to the traditional goal of
efficiency (though superficial) within companies as well
as in MPT more generally.
Examples of apparent redundancies in a system may
include: the Precautionary Principle; paying staff
above the market rate; ensuring gender diversity;
fostering biodiversity; rolling out renewable energy and
decentralized governance institutions. In traditional
finance where second-order effects are underestimated,
these are dismissed as inefficient.
However, as Table 1 below illustrates, redundancies
may be beneficial to the sustainability of a system and
therefore efficient from a systems-theory perspective.
It is no coincidence that many of these examples can
be linked back to the SDGs, which are an attempt
to improve the sustainable trajectory of global
development.
Diversity can appear as redundant when challenges are not (yet) visible. In traditional finance where second-order effects are underestimated these are dismissed as inefficient.
Table 1: Appearances can be deceiving
“Redundancy” Systems-(and portfolio) advantage SDG
Precautionary Principle
Fair and Living Wages-
Paying staff above the market rate
Gender diversity
Ensuring biodiversity
Renewable energy
Tax Policy
Complying with the spirit rather than the letter of tax laws
Decentralized institutions
Do not unnecessarily create exposure to unexpected consequences which damage or may even destroy the system. Do not transfer the consequences of this risk to others.1
People within the system are more resistant to shocks in their lives and within their community. They are also in a better position to reinforce the system in a distributed manner (through good health, savings, local investment or consumption) which does not require government intervention (in the form of socialized healthcare). This also helps prevent inequality which is a systemic source of societal stress.2
This may come at the short-term cost of (e.g. maternity/paternity cover); however, with diversity, institutions (including companies) are better able to respond to the opportunities and challenges presented by its equally diverse environment.
Prevent shortages elsewhere (transfer of fragility) or systems-wide failure due to unexpected inter-dependencies.3 (e.g. Avoiding a mono-culture of crops makes habitats less exposed to systemic risks).
The non-linear reduction in the cost of renewable energy has led organizations such as the International Energy Agency (IEA) to systemically underestimate the growth potential of renewables.
While technologies such as coal and nuclear present highly concentrated power sources, they also create systemic fragility which a distributed power grid of renewables helps mitigate.
Regulators are increasingly favoring a principles- over a rules-based approach, particularly where loopholes are perceived such as in cross-border transactions. This creates a scenario where companies must comply (adapt) with the demands of a larger system rather than with individual countries/jurisdictions.
While decision-making in decentralized systems can appear less efficient, they benefit from shorter feedback loops which enhance accountability and make the transfer of fragility harder.1 Note: The 169 targets associated with the SDGs repeatedly call for locally-appropriate action.
12. Responsible Consumption and Production
3. Good Health & Well-Being
8. Decent Work & Economic Growth
10. Reduced Inequalities
5. Gender Equality
14. Life Below Water
15. Life on Land
7. Affordable & Clean Energy
10. Reduced Inequalities
16. Peace, justice and strong institutions
16. Peace, justice and strong institutions
1 Taleb (2012) “Antifragile: Things That Gain From Disorder”2 Schiller & Hacker (2011) https://insights.som.yale.edu/insights/is-economic-inequality-too-big-risk 3 Chairman Mao’s “Four Pests Campaign” is a well know example of unanticipated inter-dependencies leading to systems failure.
Source: RobecoSAM
The Sustainability Yearbook 2019 • SAM • 41
While the SDGs alone do not cover exposure to all systemic sustainability risks, they are a useful framework with which sustainable portfolio construction can be realized.
Conclusion We have argued that systemic factors are increasingly
being recognized and will be part of future sustainable
portfolio construction. While the SDGs alone do not
cover exposure to all systemic sustainability risks,
they are a useful framework with which sustainable
portfolio construction can be realized. In this context
it is also important to note that the SDGs do not put
a hierarchy on the goals, appreciating their complex
inter-dependencies.20
This means there is an opportunity for asset managers
to take the initiative and align their portfolios with
sustainable goals in a manner which is suitable to
their clients.
Asset managers (on behalf of their clients) can thus be
incentivized to manage their portfolios sustainably in
a manner which does not take away from economic or
societal interests elsewhere, present or future.
Moreover, company performance assessed
holistically in this way safeguards portfolio returns by
better synchronizing the short-term assets with the
long-term liabilities of universal asset owners.
Questions or comments for the author can be sent to:
20 For example, the short-term realization of “Zero Hunger” may be in conflict with longer term goals of biodiversity on land and below water.
42 • SAM • The Sustainability Yearbook 2019
Five Years of Pushing for Change: Assessing Corporate Tax Strategies

The Sustainability Yearbook 2019 • SAM • 43
Though it lacks the magnitude of climate change, the excitement of technological
innovation, and the visibility of gender equality, a company’s approach to its
tax obligations is nevertheless a critical element to consider when evaluating a
company’s sustainability profile.
Sustainability in business can be defined as the policies and practices which
companies implement not only to adapt, grow and thrive in the future but also
to avoid diminishing the resources available for present and future generations.1
Taxes are the means with which communities and countries build the physical,
social, and educational infrastructure needed to support present and future
growth and development.
1 World Commission on Environment and Development, 1987,
General Assembly of the United Nations,
http://www.un.org/en/ga/president/65/issues/sustdev.shtml
Corporations are currently incentivized to minimize
their tax burden in order to maximize profits. Yet in
the long run, tax-shirking behavior proves to be short-
sighted, as it exposes a company to policy and litigation
risk, generates reputational risk amongst stakeholders,
and promotes distrust. Companies pursuing overly
aggressive tax avoidance strategies exacerbate existing
inequalities based on company size as well as industry.
We recognized early on that a company’s tax strategies
could put it at risk in terms of reputation, regulation
and ultimately financial performance. Since 2014, we
have captured material tax-related data in our CSA.
Here, we summarize some of the findings gained over
the last five years.
Eleanor Willi
Sustainability Specialist,
ESG Ratings
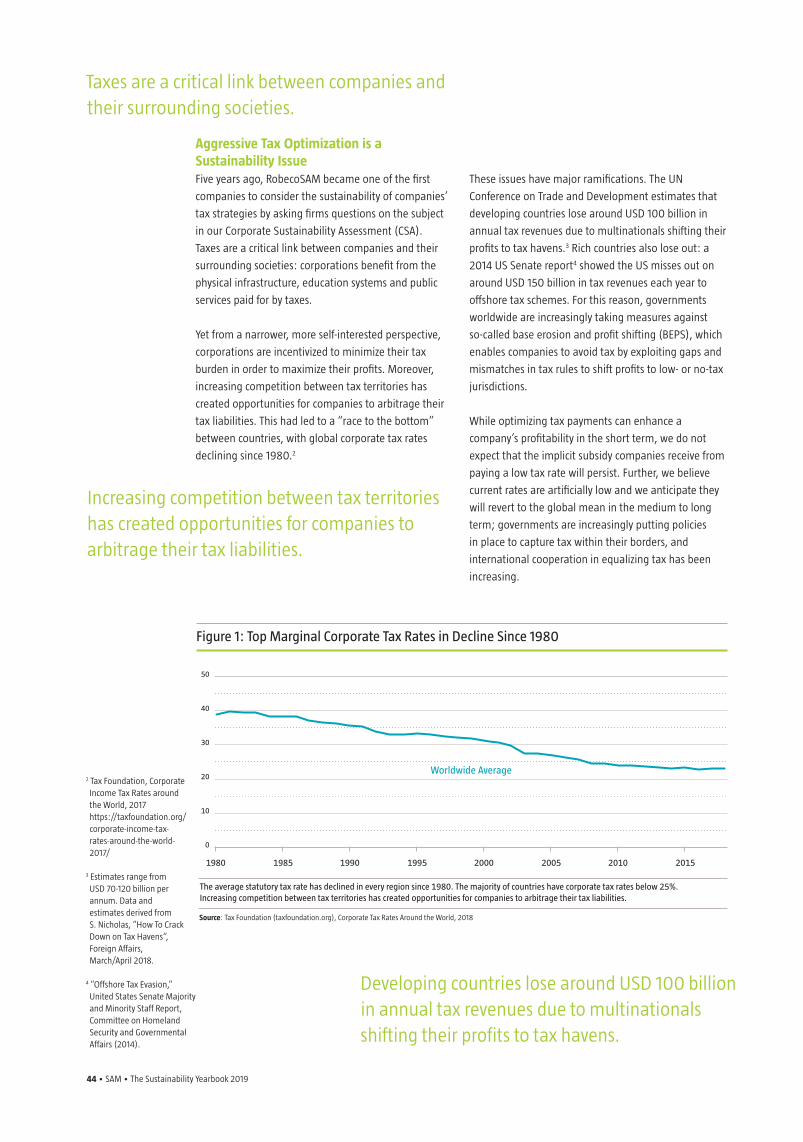
44 • SAM • The Sustainability Yearbook 2019
Developing countries lose around USD 100 billion in annual tax revenues due to multinationals shifting their profits to tax havens.
2 Tax Foundation, Corporate Income Tax Rates around the World, 2017
https://taxfoundation.org/corporate-income-tax- rates-around-the-world- 2017/
3 Estimates range from USD 70-120 billion per annum. Data and estimates derived from S. Nicholas, “How To Crack Down on Tax Havens“, Foreign Affairs, March/April 2018.
4 “Offshore Tax Evasion,” United States Senate Majority and Minority Staff Report, Committee on Homeland Security and Governmental Affairs (2014).
Figure 1: Top Marginal Corporate Tax Rates in Decline Since 1980
50
40
30
20
10
0
Source: Tax Foundation (taxfoundation.org), Corporate Tax Rates Around the World, 2018
The average statutory tax rate has declined in every region since 1980. The majority of countries have corporate tax rates below 25%. Increasing competition between tax territories has created opportunities for companies to arbitrage their tax liabilities.
1980 1985 1990 1995 2000 2005 2010 2015
Worldwide Average
Aggressive Tax Optimization is a Sustainability Issue Five years ago, RobecoSAM became one of the first
companies to consider the sustainability of companies’
tax strategies by asking firms questions on the subject
in our Corporate Sustainability Assessment (CSA).
Taxes are a critical link between companies and their
surrounding societies: corporations benefit from the
physical infrastructure, education systems and public
services paid for by taxes.
Yet from a narrower, more self-interested perspective,
corporations are incentivized to minimize their tax
burden in order to maximize their profits. Moreover,
increasing competition between tax territories has
created opportunities for companies to arbitrage their
tax liabilities. This had led to a “race to the bottom”
between countries, with global corporate tax rates
declining since 1980.2
These issues have major ramifications. The UN
Conference on Trade and Development estimates that
developing countries lose around USD 100 billion in
annual tax revenues due to multinationals shifting their
profits to tax havens.3 Rich countries also lose out: a
2014 US Senate report4 showed the US misses out on
around USD 150 billion in tax revenues each year to
offshore tax schemes. For this reason, governments
worldwide are increasingly taking measures against
so-called base erosion and profit shifting (BEPS), which
enables companies to avoid tax by exploiting gaps and
mismatches in tax rules to shift profits to low- or no-tax
jurisdictions.
While optimizing tax payments can enhance a
company’s profitability in the short term, we do not
expect that the implicit subsidy companies receive from
paying a low tax rate will persist. Further, we believe
current rates are artificially low and we anticipate they
will revert to the global mean in the medium to long
term; governments are increasingly putting policies
in place to capture tax within their borders, and
international cooperation in equalizing tax has been
increasing.
Increasing competition between tax territories has created opportunities for companies to arbitrage their tax liabilities.
Taxes are a critical link between companies and their surrounding societies.
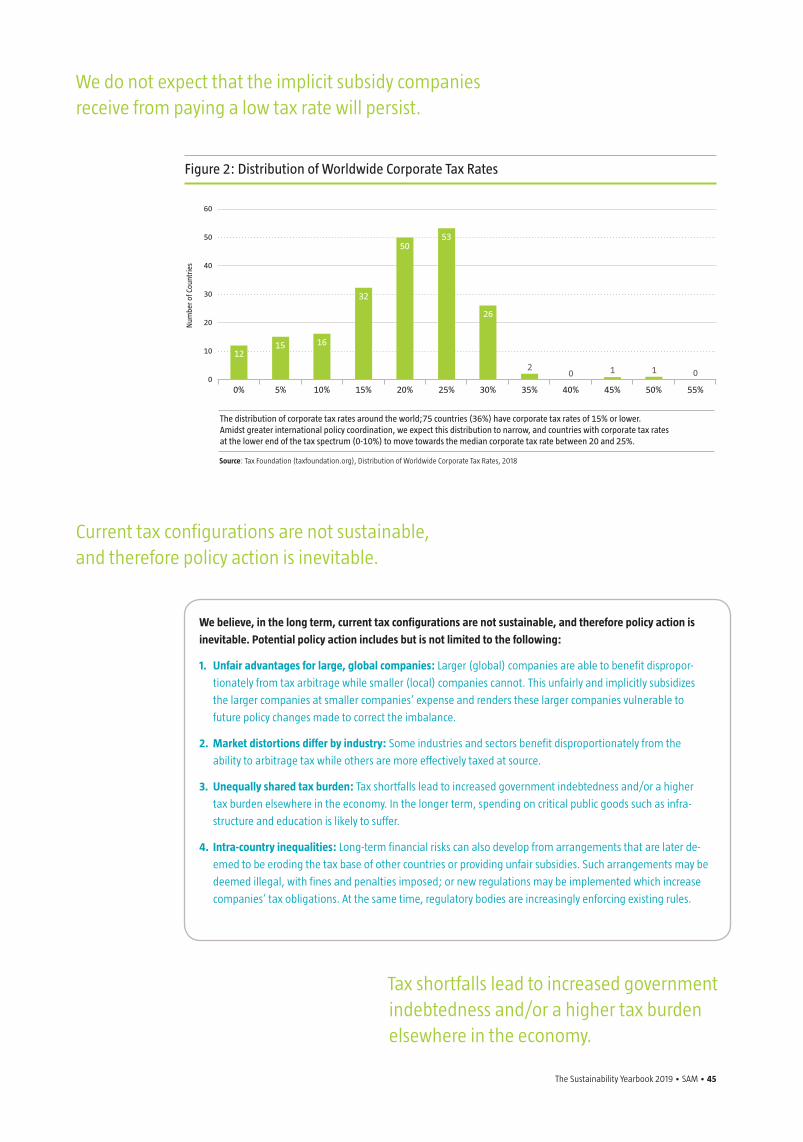
The Sustainability Yearbook 2019 • SAM • 45
Figure 2: Distribution of Worldwide Corporate Tax Rates
We believe, in the long term, current tax configurations are not sustainable, and therefore policy action is
inevitable. Potential policy action includes but is not limited to the following:
1. Unfair advantages for large, global companies: Larger (global) companies are able to benefit dispropor-
tionately from tax arbitrage while smaller (local) companies cannot. This unfairly and implicitly subsidizes
the larger companies at smaller companies’ expense and renders these larger companies vulnerable to
future policy changes made to correct the imbalance.
2. Market distortions differ by industry: Some industries and sectors benefit disproportionately from the
ability to arbitrage tax while others are more effectively taxed at source.
3. Unequally shared tax burden: Tax shortfalls lead to increased government indebtedness and/or a higher
tax burden elsewhere in the economy. In the longer term, spending on critical public goods such as infra-
structure and education is likely to suffer.
4. Intra-country inequalities: Long-term financial risks can also develop from arrangements that are later de-
emed to be eroding the tax base of other countries or providing unfair subsidies. Such arrangements may be
deemed illegal, with fines and penalties imposed; or new regulations may be implemented which increase
companies’ tax obligations. At the same time, regulatory bodies are increasingly enforcing existing rules.
We do not expect that the implicit subsidy companies receive from paying a low tax rate will persist.
Current tax configurations are not sustainable, and therefore policy action is inevitable.
Tax shortfalls lead to increased government indebtedness and/or a higher tax burden elsewhere in the economy.
Num
ber o
f Cou
ntri
es
60
50
40
30
20
10
00%
Source: Tax Foundation (taxfoundation.org), Distribution of Worldwide Corporate Tax Rates, 2018
The distribution of corporate tax rates around the world;75 countries (36%) have corporate tax rates of 15% or lower. Amidst greater international policy coordination, we expect this distribution to narrow, and countries with corporate tax rates at the lower end of the tax spectrum (0-10%) to move towards the median corporate tax rate between 20 and 25%.
5% 10% 15% 20% 25% 30% 35% 40% 45% 50% 55%
53
26
50
16
32
1512
01 102
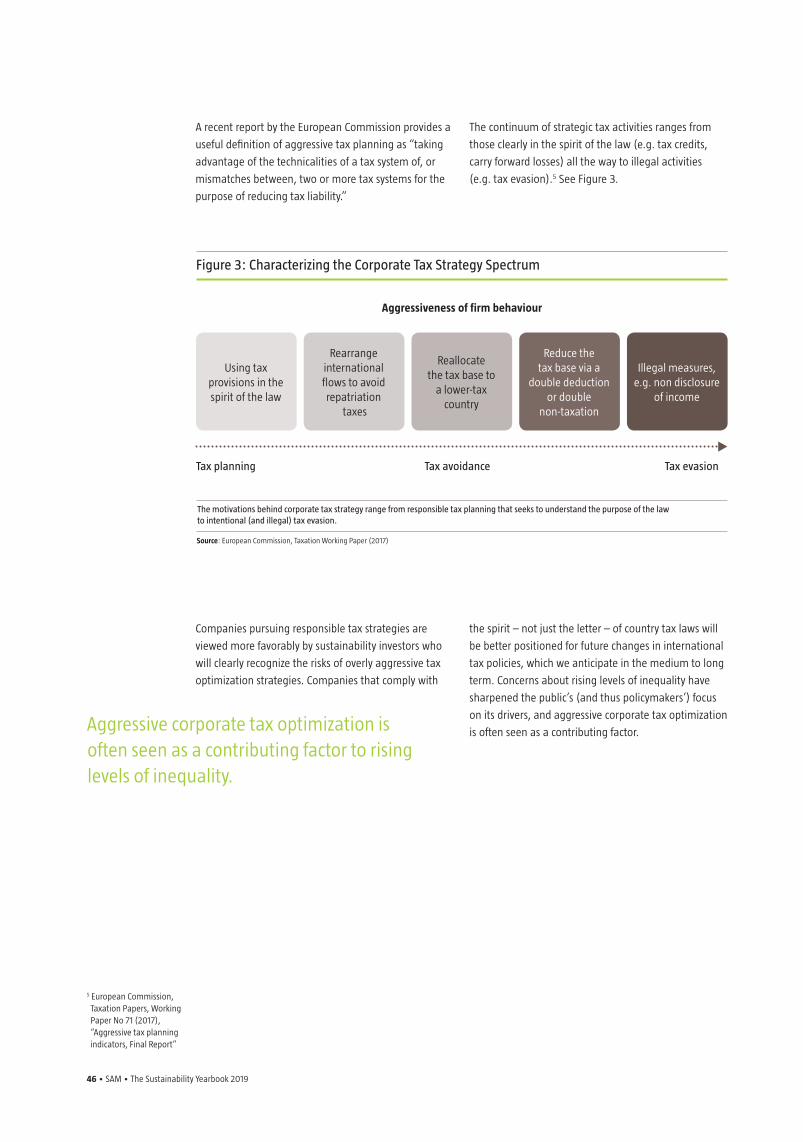
46 • SAM • The Sustainability Yearbook 2019
Companies pursuing responsible tax strategies are
viewed more favorably by sustainability investors who
will clearly recognize the risks of overly aggressive tax
optimization strategies. Companies that comply with
the spirit – not just the letter – of country tax laws will
be better positioned for future changes in international
tax policies, which we anticipate in the medium to long
term. Concerns about rising levels of inequality have
sharpened the public’s (and thus policymakers’) focus
on its drivers, and aggressive corporate tax optimization
is often seen as a contributing factor.
Figure 3: Characterizing the Corporate Tax Strategy Spectrum
A recent report by the European Commission provides a
useful definition of aggressive tax planning as “taking
advantage of the technicalities of a tax system of, or
mismatches between, two or more tax systems for the
purpose of reducing tax liability.”
The continuum of strategic tax activities ranges from
those clearly in the spirit of the law (e.g. tax credits,
carry forward losses) all the way to illegal activities
(e.g. tax evasion).5 See Figure 3.
Aggressive corporate tax optimization is often seen as a contributing factor to rising levels of inequality.
5 European Commission, Taxation Papers, Working Paper No 71 (2017), “Aggressive tax planning indicators, Final Report”
Using tax provisions in the spirit of the law
Reallocate the tax base to
a lower-tax country
Rearrange international flows to avoid repatriation
taxes
Reduce the tax base via a
double deduction or double
non-taxation
Illegal measures, e.g. non disclosure
of income
Tax planning Tax avoidance Tax evasion
Aggressiveness of firm behaviour
Source: European Commission, Taxation Working Paper (2017)
The motivations behind corporate tax strategy range from responsible tax planning that seeks to understand the purpose of the law to intentional (and illegal) tax evasion.
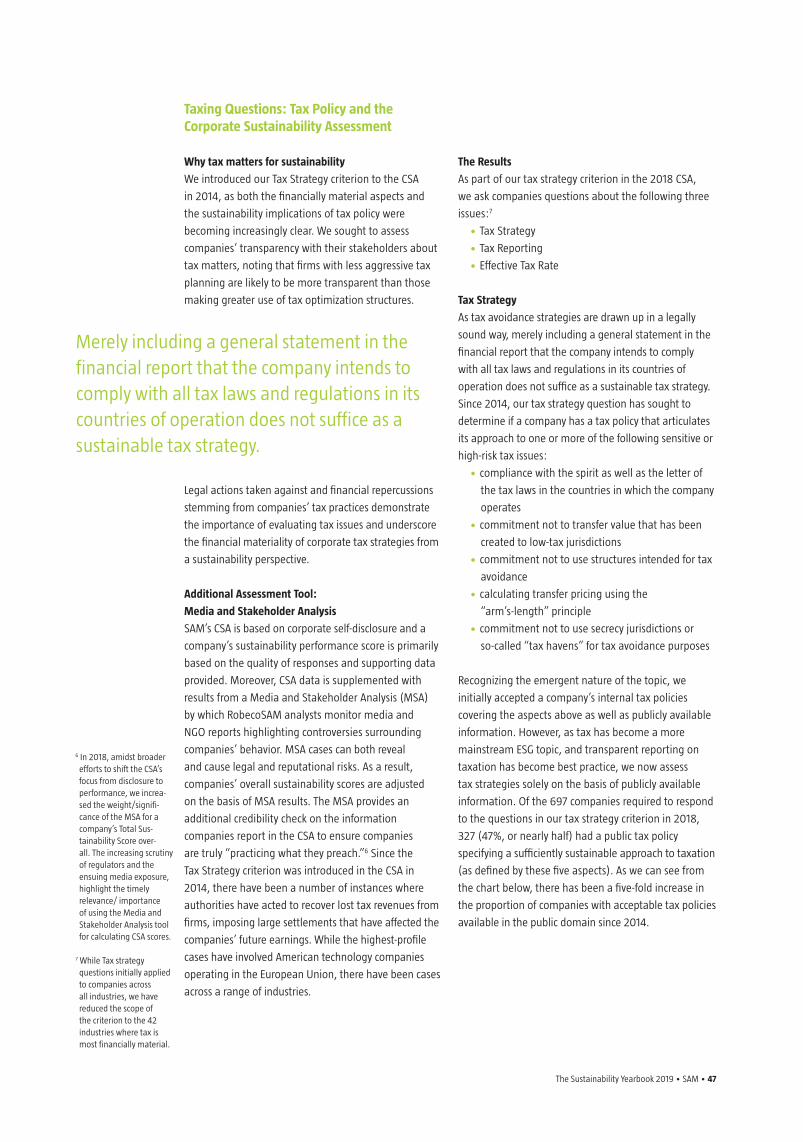
The Sustainability Yearbook 2019 • SAM • 47
Taxing Questions: Tax Policy and the Corporate Sustainability Assessment
Why tax matters for sustainability
We introduced our Tax Strategy criterion to the CSA
in 2014, as both the financially material aspects and
the sustainability implications of tax policy were
becoming increasingly clear. We sought to assess
companies’ transparency with their stakeholders about
tax matters, noting that firms with less aggressive tax
planning are likely to be more transparent than those
making greater use of tax optimization structures.
Legal actions taken against and financial repercussions
stemming from companies’ tax practices demonstrate
the importance of evaluating tax issues and underscore
the financial materiality of corporate tax strategies from
a sustainability perspective.
Additional Assessment Tool:
Media and Stakeholder Analysis
SAM’s CSA is based on corporate self-disclosure and a
company’s sustainability performance score is primarily
based on the quality of responses and supporting data
provided. Moreover, CSA data is supplemented with
results from a Media and Stakeholder Analysis (MSA)
by which RobecoSAM analysts monitor media and
NGO reports highlighting controversies surrounding
companies’ behavior. MSA cases can both reveal
and cause legal and reputational risks. As a result,
companies’ overall sustainability scores are adjusted
on the basis of MSA results. The MSA provides an
additional credibility check on the information
companies report in the CSA to ensure companies
are truly “practicing what they preach.”6 Since the
Tax Strategy criterion was introduced in the CSA in
2014, there have been a number of instances where
authorities have acted to recover lost tax revenues from
firms, imposing large settlements that have affected the
companies’ future earnings. While the highest-profile
cases have involved American technology companies
operating in the European Union, there have been cases
across a range of industries.
The Results
As part of our tax strategy criterion in the 2018 CSA,
we ask companies questions about the following three
issues:7
• Tax Strategy
• Tax Reporting
• Effective Tax Rate
Tax Strategy
As tax avoidance strategies are drawn up in a legally
sound way, merely including a general statement in the
financial report that the company intends to comply
with all tax laws and regulations in its countries of
operation does not suffice as a sustainable tax strategy.
Since 2014, our tax strategy question has sought to
determine if a company has a tax policy that articulates
its approach to one or more of the following sensitive or
high-risk tax issues:
• compliance with the spirit as well as the letter of
the tax laws in the countries in which the company
operates
• commitment not to transfer value that has been
created to low-tax jurisdictions
• commitment not to use structures intended for tax
avoidance
• calculating transfer pricing using the
“arm’s-length” principle
• commitment not to use secrecy jurisdictions or
so-called “tax havens” for tax avoidance purposes
Recognizing the emergent nature of the topic, we
initially accepted a company’s internal tax policies
covering the aspects above as well as publicly available
information. However, as tax has become a more
mainstream ESG topic, and transparent reporting on
taxation has become best practice, we now assess
tax strategies solely on the basis of publicly available
information. Of the 697 companies required to respond
to the questions in our tax strategy criterion in 2018,
327 (47%, or nearly half) had a public tax policy
specifying a sufficiently sustainable approach to taxation
(as defined by these five aspects). As we can see from
the chart below, there has been a five-fold increase in
the proportion of companies with acceptable tax policies
available in the public domain since 2014.
Merely including a general statement in the financial report that the company intends to comply with all tax laws and regulations in its countries of operation does not suffice as a sustainable tax strategy.
6 In 2018, amidst broader efforts to shift the CSA’s focus from disclosure to performance, we increa-sed the weight/signifi-
cance of the MSA for a company’s Total Sus-tainability Score over-
all. The increasing scrutiny of regulators and the ensuing media exposure, highlight the timely relevance/ importance of using the Media and Stakeholder Analysis tool for calculating CSA scores.
7 While Tax strategy questions initially applied to companies across all industries, we have reduced the scope of the criterion to the 42 industries where tax is most financially material.
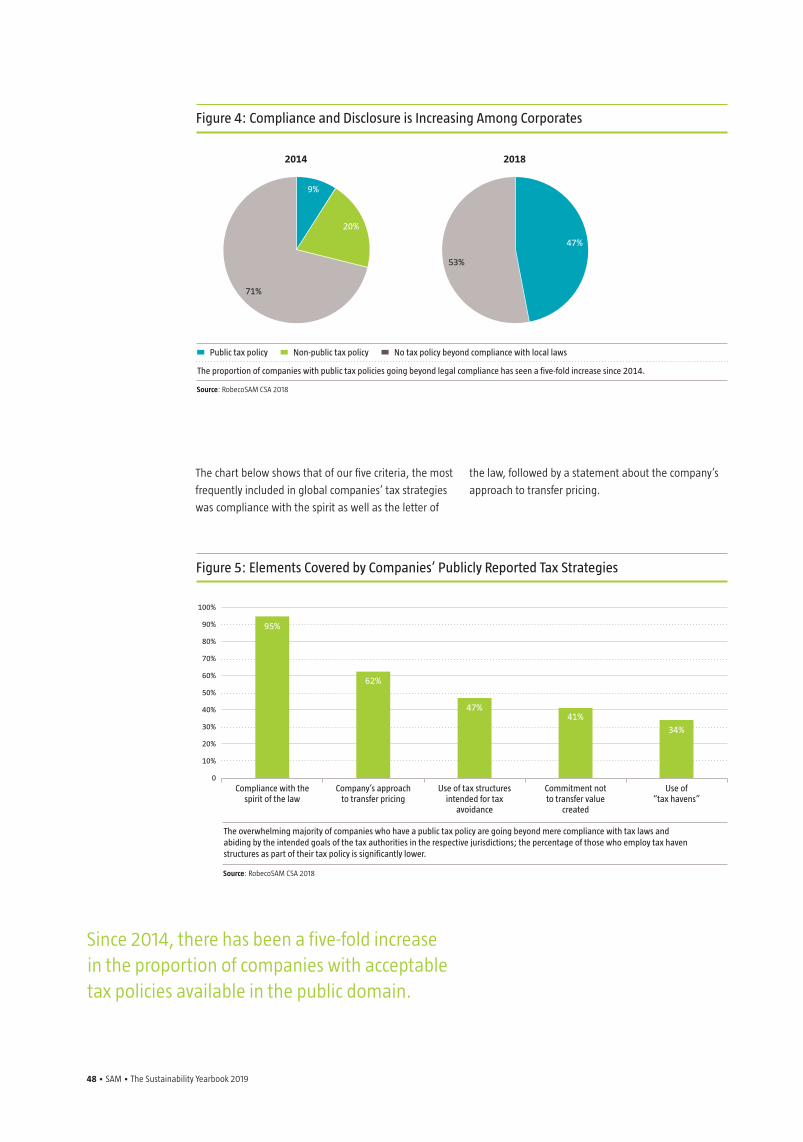
48 • SAM • The Sustainability Yearbook 2019
The chart below shows that of our five criteria, the most
frequently included in global companies’ tax strategies
was compliance with the spirit as well as the letter of
the law, followed by a statement about the company’s
approach to transfer pricing.
Figure 4: Compliance and Disclosure is Increasing Among Corporates
Figure 5: Elements Covered by Companies’ Publicly Reported Tax Strategies
Since 2014, there has been a five-fold increase in the proportion of companies with acceptable tax policies available in the public domain.
9%
20%
71%
Public tax policy Non-public tax policy No tax policy beyond compliance with local laws
Source: RobecoSAM CSA 2018
The proportion of companies with public tax policies going beyond legal compliance has seen a five-fold increase since 2014.
2014
47%
53%
2018
100%
90%
80%
70%
60%
50%
40%
30%
20%
10%
0Compliance with the
spirit of the law
Source: RobecoSAM CSA 2018
The overwhelming majority of companies who have a public tax policy are going beyond mere compliance with tax laws and abiding by the intended goals of the tax authorities in the respective jurisdictions; the percentage of those who employ tax haven structures as part of their tax policy is significantly lower.
Company’s approach to transfer pricing
Use of tax structures intended for tax
avoidance
Commitment not to transfer value
created
Use of “tax havens”
95%
62%
47%41%
34%
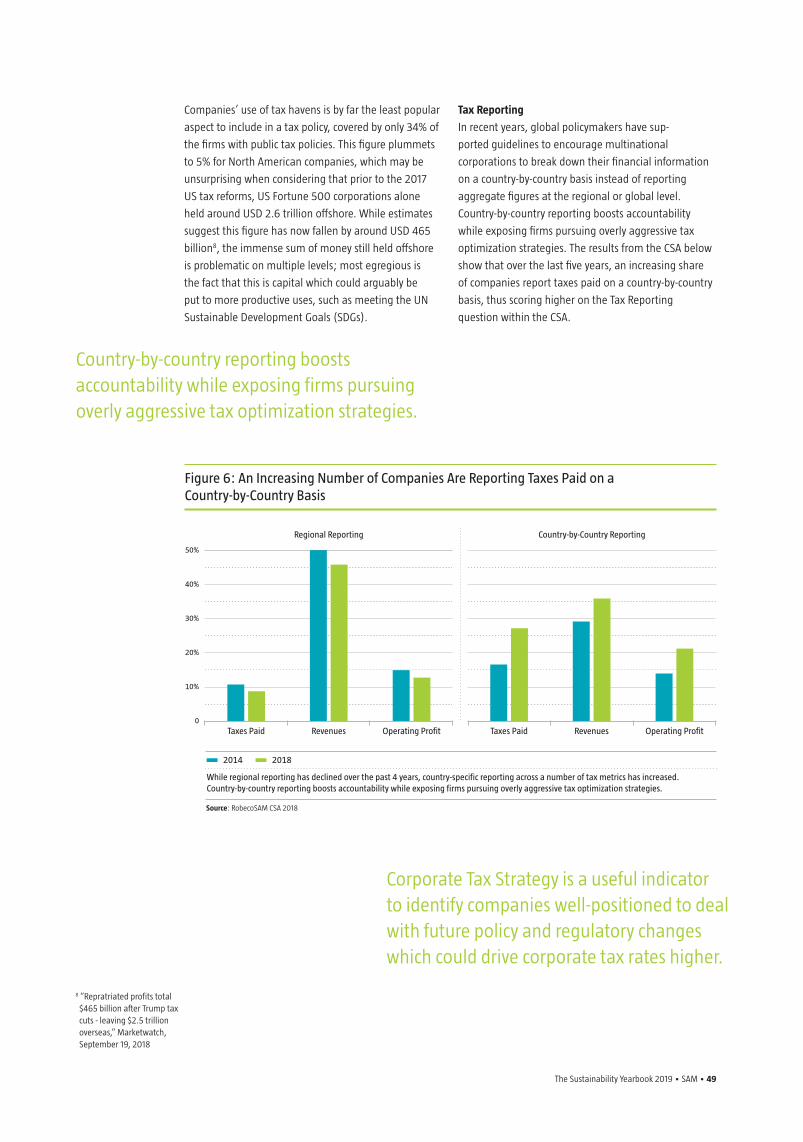
The Sustainability Yearbook 2019 • SAM • 49
Figure 6: An Increasing Number of Companies Are Reporting Taxes Paid on a Country-by-Country Basis
Corporate Tax Strategy is a useful indicator to identify companies well-positioned to deal with future policy and regulatory changes which could drive corporate tax rates higher.
Companies’ use of tax havens is by far the least popular
aspect to include in a tax policy, covered by only 34% of
the firms with public tax policies. This figure plummets
to 5% for North American companies, which may be
unsurprising when considering that prior to the 2017
US tax reforms, US Fortune 500 corporations alone
held around USD 2.6 trillion offshore. While estimates
suggest this figure has now fallen by around USD 465
billion8, the immense sum of money still held offshore
is problematic on multiple levels; most egregious is
the fact that this is capital which could arguably be
put to more productive uses, such as meeting the UN
Sustainable Development Goals (SDGs).
Tax Reporting
In recent years, global policymakers have sup-
ported guidelines to encourage multinational
corporations to break down their financial information
on a country-by-country basis instead of reporting
aggregate figures at the regional or global level.
Country-by-country reporting boosts accountability
while exposing firms pursuing overly aggressive tax
optimization strategies. The results from the CSA below
show that over the last five years, an increasing share
of companies report taxes paid on a country-by-country
basis, thus scoring higher on the Tax Reporting
question within the CSA.
Country-by-country reporting boosts accountability while exposing firms pursuing overly aggressive tax optimization strategies.
8 “Repratriated profits total $465 billion after Trump tax cuts - leaving $2.5 trillion overseas,” Marketwatch, September 19, 2018
2014 2018
50%
40%
30%
20%
10%
0
Source: RobecoSAM CSA 2018
While regional reporting has declined over the past 4 years, country-specific reporting across a number of tax metrics has increased. Country-by-country reporting boosts accountability while exposing firms pursuing overly aggressive tax optimization strategies.
Taxes Paid Revenues Operating Profit
Regional Reporting
Taxes Paid Revenues Operating Profit
Country-by-Country Reporting
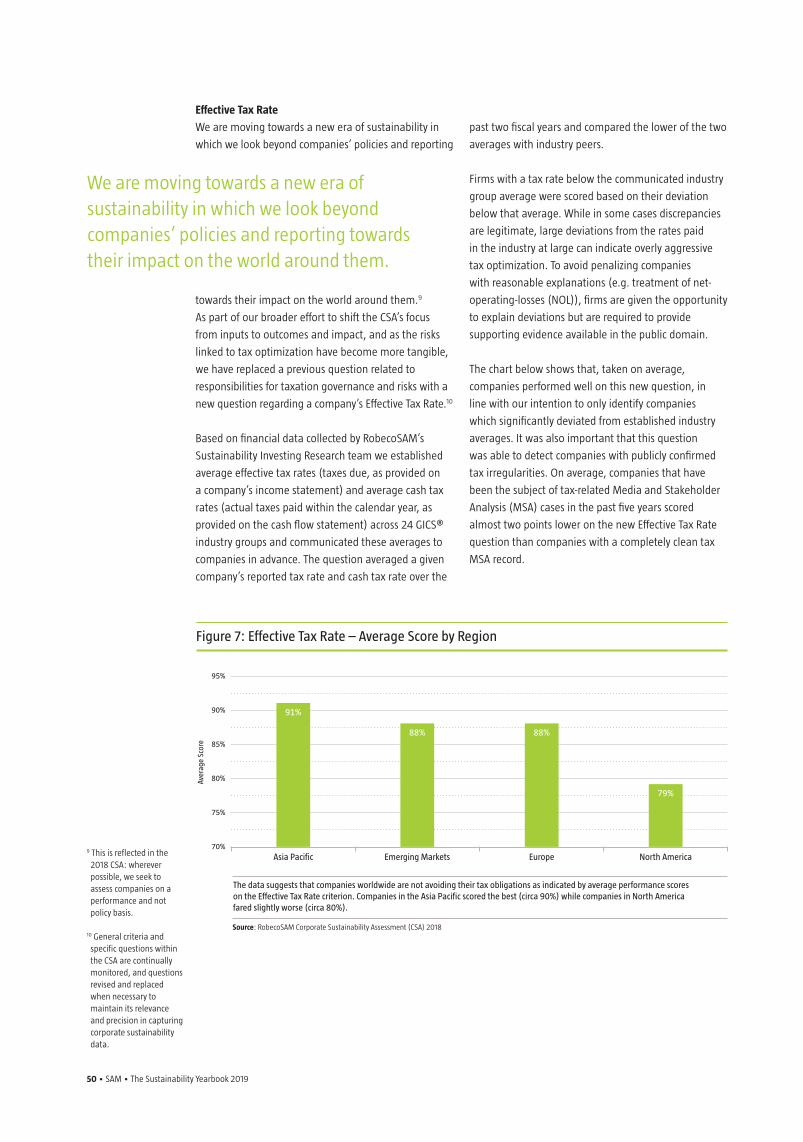
50 • SAM • The Sustainability Yearbook 2019
Figure 7: Effective Tax Rate – Average Score by Region
Effective Tax Rate
We are moving towards a new era of sustainability in
which we look beyond companies’ policies and reporting
towards their impact on the world around them.9
As part of our broader effort to shift the CSA’s focus
from inputs to outcomes and impact, and as the risks
linked to tax optimization have become more tangible,
we have replaced a previous question related to
responsibilities for taxation governance and risks with a
new question regarding a company’s Effective Tax Rate.10
Based on financial data collected by RobecoSAM’s
Sustainability Investing Research team we established
average effective tax rates (taxes due, as provided on
a company’s income statement) and average cash tax
rates (actual taxes paid within the calendar year, as
provided on the cash flow statement) across 24 GICS®
industry groups and communicated these averages to
companies in advance. The question averaged a given
company’s reported tax rate and cash tax rate over the
past two fiscal years and compared the lower of the two
averages with industry peers.
Firms with a tax rate below the communicated industry
group average were scored based on their deviation
below that average. While in some cases discrepancies
are legitimate, large deviations from the rates paid
in the industry at large can indicate overly aggressive
tax optimization. To avoid penalizing companies
with reasonable explanations (e.g. treatment of net-
operating-losses (NOL)), firms are given the opportunity
to explain deviations but are required to provide
supporting evidence available in the public domain.
The chart below shows that, taken on average,
companies performed well on this new question, in
line with our intention to only identify companies
which significantly deviated from established industry
averages. It was also important that this question
was able to detect companies with publicly confirmed
tax irregularities. On average, companies that have
been the subject of tax-related Media and Stakeholder
Analysis (MSA) cases in the past five years scored
almost two points lower on the new Effective Tax Rate
question than companies with a completely clean tax
MSA record.
We are moving towards a new era of sustainability in which we look beyond companies’ policies and reporting towards their impact on the world around them.
9 This is reflected in the 2018 CSA: wherever possible, we seek to assess companies on a performance and not policy basis.
10 General criteria and specific questions within the CSA are continually monitored, and questions revised and replaced when necessary to maintain its relevance and precision in capturing corporate sustainability data.
95%
90%
85%
80%
75%
70%
Source: RobecoSAM Corporate Sustainability Assessment (CSA) 2018
The data suggests that companies worldwide are not avoiding their tax obligations as indicated by average performance scores on the Effective Tax Rate criterion. Companies in the Asia Pacific scored the best (circa 90%) while companies in North America fared slightly worse (circa 80%).
Asia Pacific Emerging Markets Europe North America
91%
88% 88%
79%
Aver
age
Scor
e
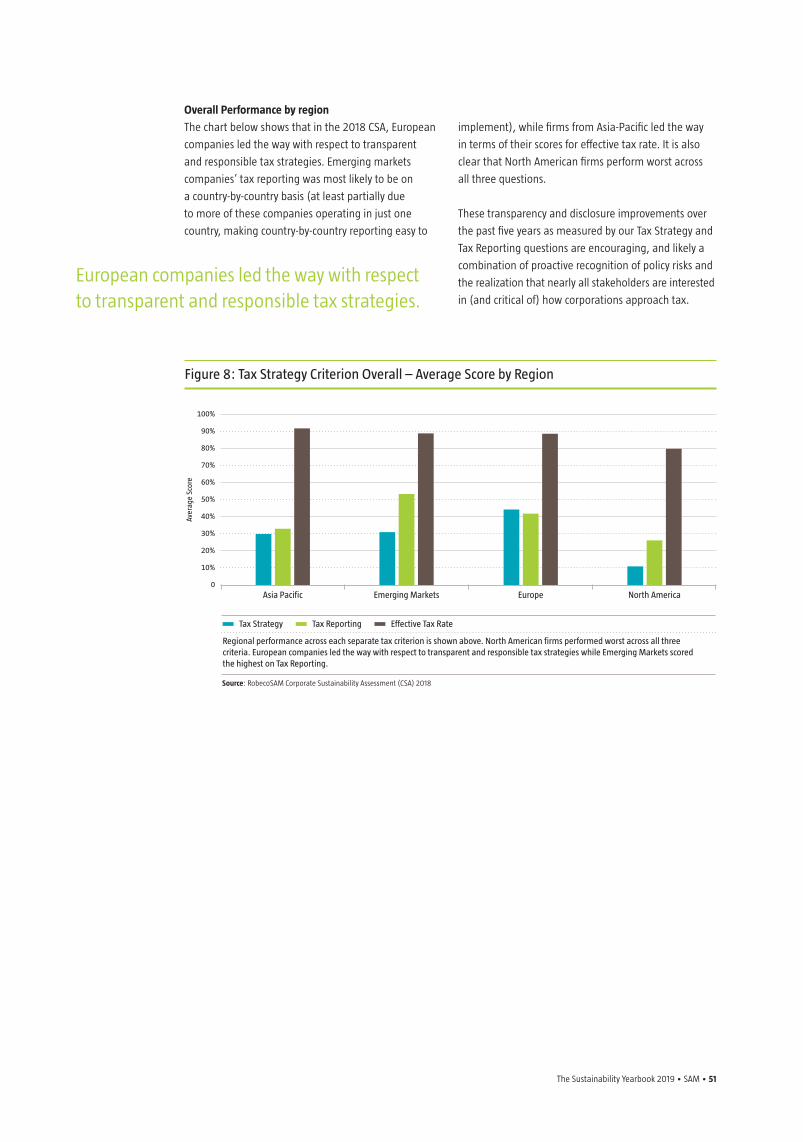
The Sustainability Yearbook 2019 • SAM • 51
Overall Performance by region
The chart below shows that in the 2018 CSA, European
companies led the way with respect to transparent
and responsible tax strategies. Emerging markets
companies’ tax reporting was most likely to be on
a country-by-country basis (at least partially due
to more of these companies operating in just one
country, making country-by-country reporting easy to
implement), while firms from Asia-Pacific led the way
in terms of their scores for effective tax rate. It is also
clear that North American firms perform worst across
all three questions.
These transparency and disclosure improvements over
the past five years as measured by our Tax Strategy and
Tax Reporting questions are encouraging, and likely a
combination of proactive recognition of policy risks and
the realization that nearly all stakeholders are interested
in (and critical of) how corporations approach tax.
European companies led the way with respect to transparent and responsible tax strategies.
Figure 8: Tax Strategy Criterion Overall – Average Score by Region
100%
90%
80%
70%
60%
50%
40%
30%
20%
10%
0
Tax Strategy Tax Reporting Effective Tax Rate
Source: RobecoSAM Corporate Sustainability Assessment (CSA) 2018
Regional performance across each separate tax criterion is shown above. North American firms performed worst across all three criteria. European companies led the way with respect to transparent and responsible tax strategies while Emerging Markets scored the highest on Tax Reporting.
Asia Pacific Emerging Markets Europe North America
Aver
age
Scor
e
52 • SAM • The Sustainability Yearbook 2019
Looking AheadFor the reasons stated above, we expect further policy
coordination with respect to tax accountability in the
medium to long term along the lines of the OECD’s
Base Erosion and Profit Shifting (BEPS) Initiative and
the European Union’s Common Consolidated Corporate
Tax Base project. While one of many causes, the rise
of populism has been at least partially fueled by
perceptions of inequality in general and an unfairly
shared tax burden in particular,11 further increasing
the likelihood of strong policy action on tax both at
national and international levels. This policy action
brings both opportunities and risks for investors.
As with other topics, our Corporate Sustainability
Assessment’s Tax Strategy criterion identifies companies
that pursue a corporate strategy that addresses taxes
proactively and responsibly. Corporate Tax Strategy is a
useful indicator to identify companies well-positioned
to deal with future policy and regulatory changes which
could drive corporate tax rates higher.
Even in the absence of harsh policy actions, we are
encouraged to see that many companies have already
begun to make strides, both in terms of transparency
and performance, and we are pleased with the CSA’s
ability to capture and measure it.
Questions or comments for the author can be sent to:
11 The Panama and Paradise Papers are simply the most prominent examples of a number of similar cases exposed over the last few years, the consequences of which are still playing out.

The Sustainability Yearbook 2019 • SAM • 53
4. Sustainability Leaders 2019
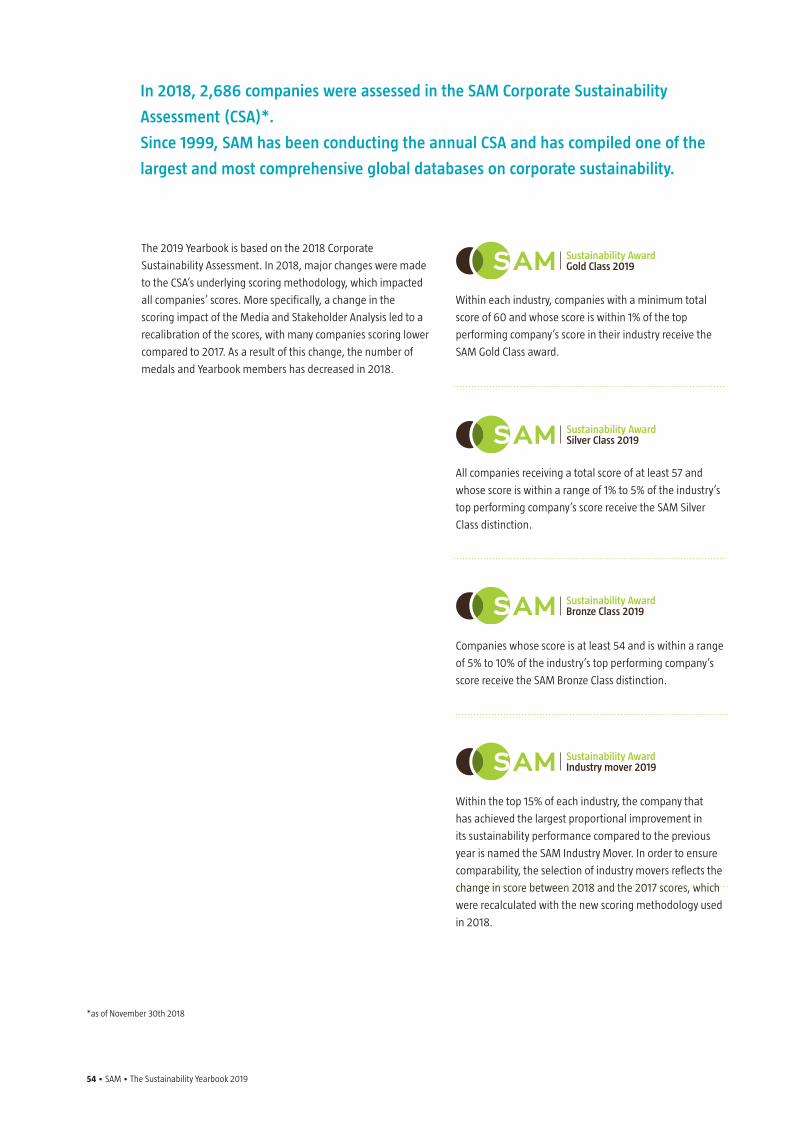
54 • SAM • The Sustainability Yearbook 2019 The Sustainability Yearbook 2019 • SAM • 55
The 2019 Yearbook is based on the 2018 Corporate
Sustainability Assessment. In 2018, major changes were made
to the CSA’s underlying scoring methodology, which impacted
all companies’ scores. More specifically, a change in the
scoring impact of the Media and Stakeholder Analysis led to a
recalibration of the scores, with many companies scoring lower
compared to 2017. As a result of this change, the number of
medals and Yearbook members has decreased in 2018.
In 2018, 2,686 companies were assessed in the SAM Corporate Sustainability
Assessment (CSA)*.
Since 1999, SAM has been conducting the annual CSA and has compiled one of the
largest and most comprehensive global databases on corporate sustainability.
Within each industry, companies with a minimum total
score of 60 and whose score is within 1% of the top
performing company’s score in their industry receive the
SAM Gold Class award.
All companies receiving a total score of at least 57 and
whose score is within a range of 1% to 5% of the industry’s
top performing company’s score receive the SAM Silver
Class distinction.
Companies whose score is at least 54 and is within a range
of 5% to 10% of the industry’s top performing company’s
score receive the SAM Bronze Class distinction.
Within the top 15% of each industry, the company that
has achieved the largest proportional improvement in
its sustainability performance compared to the previous
year is named the SAM Industry Mover. In order to ensure
comparability, the selection of industry movers reflects the
change in score between 2018 and the 2017 scores, which
were recalculated with the new scoring methodology used
in 2018.
Sustainability AwardBronze Class 2019
Sustainability AwardIndustry mover 2019
Sustainability AwardSilver Class 2019
Sustainability AwardGold Class 2019
*as of November 30th 2018
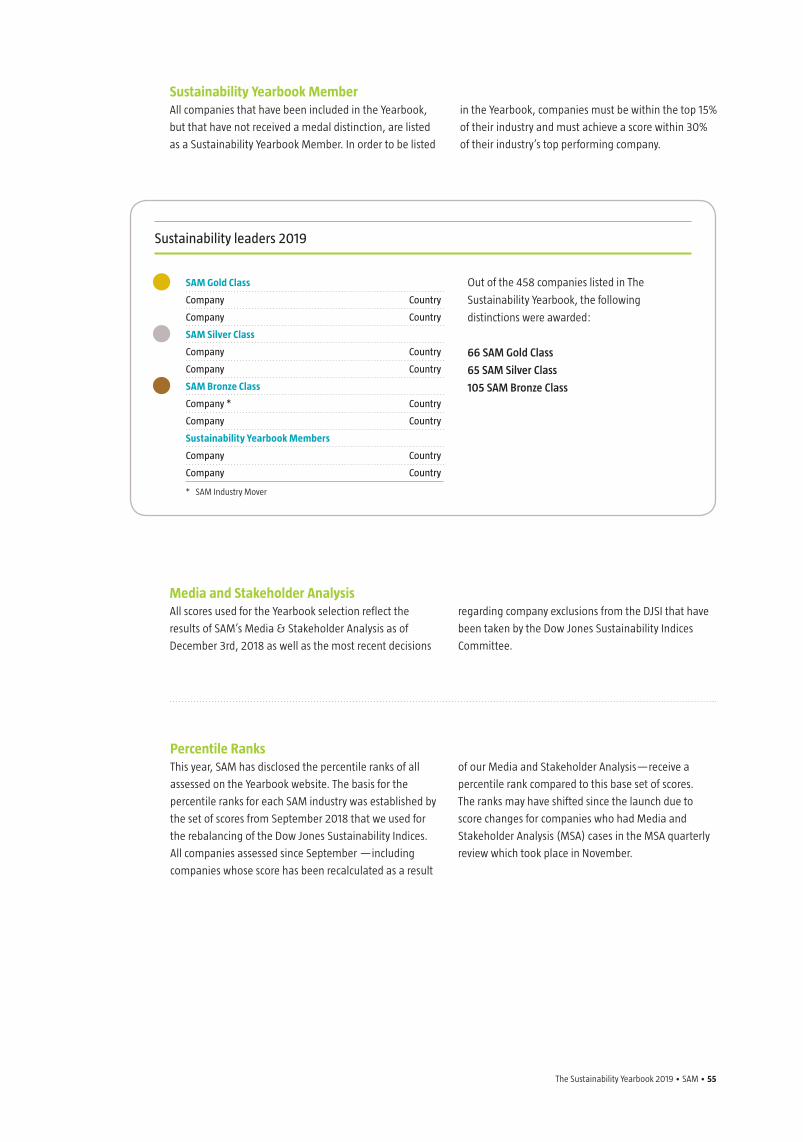
The Sustainability Yearbook 2019 • SAM • 55
Sustainability Yearbook MemberAll companies that have been included in the Yearbook,
but that have not received a medal distinction, are listed
as a Sustainability Yearbook Member. In order to be listed
Media and Stakeholder AnalysisAll scores used for the Yearbook selection reflect the
results of SAM’s Media & Stakeholder Analysis as of
December 3rd, 2018 as well as the most recent decisions
in the Yearbook, companies must be within the top 15%
of their industry and must achieve a score within 30%
of their industry’s top performing company.
regarding company exclusions from the DJSI that have
been taken by the Dow Jones Sustainability Indices
Committee.
SAM Gold Class
Company Country
Company Country
SAM Silver Class
Company Country
Company Country
SAM Bronze Class
Company * Country
Company Country
Sustainability Yearbook Members
Company Country
Company Country
* SAM Industry Mover
•••
Sustainability leaders 2019
Out of the 458 companies listed in The
Sustainability Yearbook, the following
distinctions were awarded:
66 SAM Gold Class
65 SAM Silver Class
105 SAM Bronze Class
Percentile RanksThis year, SAM has disclosed the percentile ranks of all
assessed on the Yearbook website. The basis for the
percentile ranks for each SAM industry was established by
the set of scores from September 2018 that we used for
the rebalancing of the Dow Jones Sustainability Indices.
All companies assessed since September —including
companies whose score has been recalculated as a result
of our Media and Stakeholder Analysis—receive a
percentile rank compared to this base set of scores.
The ranks may have shifted since the launch due to
score changes for companies who had Media and
Stakeholder Analysis (MSA) cases in the MSA quarterly
review which took place in November.
56 • SAM • The Sustainability Yearbook 2019 The Sustainability Yearbook 2019 • SAM • 57
Corporate ActionsSAM monitors corporate actions throughout the year. In
line with the treatment of corporate actions for the Dow
Jones Sustainability Indices, SAM will review corporate
actions on a case-by-case basis and apply a consistent
methodology. For merged companies, the surviving
entity will be considered for the Yearbook based on the
score of the company assessed which SAM deems to be
the surviving entity. If a company is delisted as a result
of a corporate action prior to the end of October, it will
no longer be eligible for inclusion in the Sustainability
Yearbook, given that the entity no longer exists.
Company names and countries are reviewed periodically
and updated to the best of SAM’s knowledge at the time
of publication. Changes occurring after this date may
not be reflected in the printed version of the Yearbook,
but may be updated on the SAM Sustainability Yearbook
website.
Read more about the Yearbook's methodology SAM is pleased to see that over the years, participation
rates in the SAM Corporate Sustainability Assessment have
continuously risen – with a record number of companies
taking part in this year’s assessment – indicating that
sustainability is increasingly rising to the top of corporate
agendas and becoming more mainstream.
On the following pages, SAM offers insights highlighting
opportunities and risks deriving from economic,
environmental and social trends and developments that
have an impact on the competitive position of companies
in each of the 60 industries analyzed. Companies
ranking in the top 15% of each industry included in The
Sustainability Yearbook, and those within the top 10%
are classified into three categories: SAM Gold Class, SAM
Silver Class and SAM Bronze Class. As the Sustainability
Yearbook aims to distinguish those companies that have
each demonstrated their strengths in the area of corporate
sustainability, we see greater value in rewarding groups
of top performing companies, rather than individual
companies. Furthermore, in order to be included in the
Yearbook, companies must achieve a score within 30%
of their industry’s top performing company.
In addition to the companies’ sustainability scores
derived from the CSA, a qualitative screen based on
SAM’s Media and Stakeholder Analysis (MSA) is applied
to determine eligibility for inclusion in The Sustainability
Yearbook. The MSA is based on an examination of
media coverage and publicly available stakeholder
information provided by RepRisk ESG Business
Intelligence and evaluates a company’s response to
critical sustainability issues that may arise during the
year. This process aligns the Yearbook’s methodology
with any decision by the Dow Jones Sustainability
Indices Committee to exclude a company from the DJSI,
which is also based on the MSA.
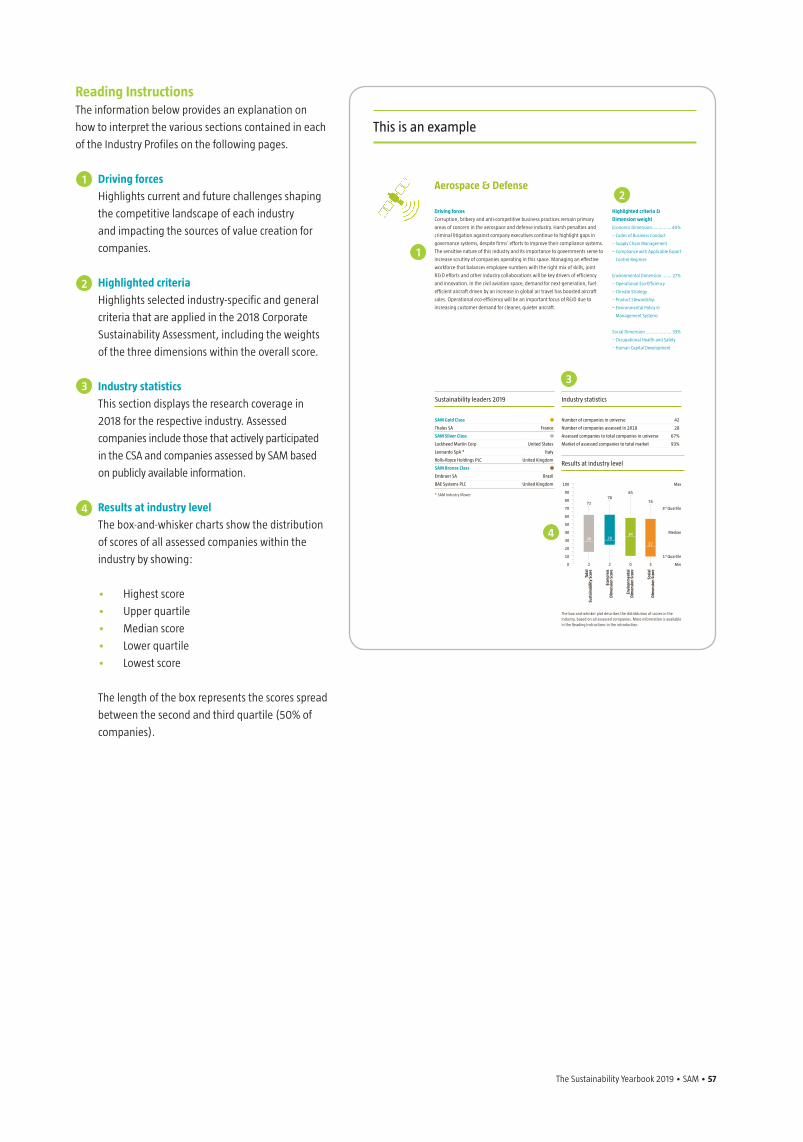
The Sustainability Yearbook 2019 • SAM • 57
Reading InstructionsThe information below provides an explanation on
how to interpret the various sections contained in each
of the Industry Profiles on the following pages.
Driving forces
Highlights current and future challenges shaping
the competitive landscape of each industry
and impacting the sources of value creation for
companies.
Highlighted criteria
Highlights selected industry-specific and general
criteria that are applied in the 2018 Corporate
Sustainability Assessment, including the weights
of the three dimensions within the overall score.
Industry statistics
This section displays the research coverage in
2018 for the respective industry. Assessed
companies include those that actively participated
in the CSA and companies assessed by SAM based
on publicly available information.
Results at industry level
The box-and-whisker charts show the distribution
of scores of all assessed companies within the
industry by showing:
• Highest score
• Upper quartile
• Median score
• Lower quartile
• Lowest score
The length of the box represents the scores spread
between the second and third quartile (50% of
companies).
This is an example
The Sustainability Yearbook 2019 • SAM • 41
Driving forces
Corruption, bribery and anti-competitive business practices remain primary
areas of concern in the aerospace and defense industry. Harsh penalties and
criminal litigation against company executives continue to highlight gaps in
governance systems, despite firms’ efforts to improve their compliance systems.
The sensitive nature of this industry and its importance to governments serve to
increase scrutiny of companies operating in this space. Managing an effective
workforce that balances employee numbers with the right mix of skills, joint
R&D efforts and other industry collaborations will be key drivers of efficiency
and innovation. In the civil aviation space, demand for next-generation, fuel-
efficient aircraft driven by an increase in global air travel has boosted aircraft
sales. Operational eco-efficiency will be an important focus of R&D due to
increasing customer demand for cleaner, quieter aircraft.
Aerospace & Defense
Highlighted criteria &
Dimension weight
Economic Dimension ............... 40%
– Codes of Business Conduct
– Supply Chain Management
– Compliance with Applicable Export
Control Regimes
Environmental Dimension ....... 27%
– Operational Eco-Efficiency
– Climate Strategy
– Product Stewardship
– Environmental Policy &
Management Systems
Social Dimension .................... 33%
– Occupational Health and Safety
– Human Capital Development
Industry statistics
Number of companies in universe 42
Number of companies assessed in 2018 28
Assessed companies to total companies in universe 67%
Market of assessed companies to total market 93%
Sustainability leaders 2019
SAM Gold Class •Thales SA France
SAM Silver Class •Lockheed Martin Corp United States
Leonardo SpA * Italy
Rolls-Royce Holdings PLC United Kingdom
SAM Bronze Class •Embraer SA Brazil
BAE Systems PLC United Kingdom
* SAM Industry Mover
Results at industry level
The box-and-whisker plot describes the distribtution of scores in the industry, based on all assessed companies. More information is available in the Reading Instructions in the introduction.
100
90
80
70
60
50
40
30
20
10
0
Max
3rd Quartile
Median
1st Quartile
Min
7278
28 2934
22
85
74
2 2 0 3
Tota
l Su
stai
nabi
lity
Scor
e
Econ
omic
D
imen
sion
Sco
re
Envi
ronm
enta
l D
imen
sion
Sco
re
Soci
al
Dim
ensi
on S
core
1
1
2
2
33
4
4
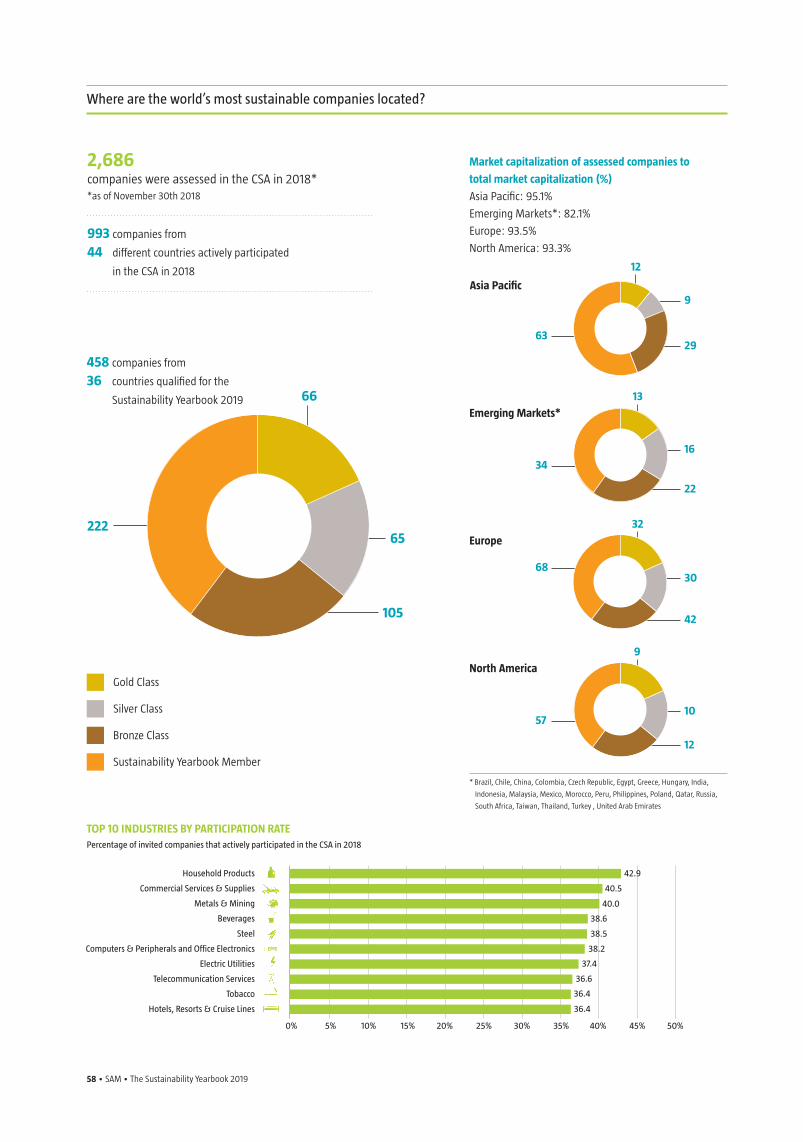
58 • SAM • The Sustainability Yearbook 2019 The Sustainability Yearbook 2019 • SAM • 59
63
34
68
57
9
32
13
12
9
16
30
10
29
22
42
12
222
66
105
65
Asia Pacific
Emerging Markets*
Europe
North America
Where are the world’s most sustainable companies located?
458 companies from
36 countries qualified for the
Sustainability Yearbook 2019
Gold Class
Silver Class
Bronze Class
Sustainability Yearbook Member
Market capitalization of assessed companies to
total market capitalization (%) Asia Pacific: 95.1%
Emerging Markets*: 82.1%
Europe: 93.5%
North America: 93.3%
* Brazil, Chile, China, Colombia, Czech Republic, Egypt, Greece, Hungary, India,
Indonesia, Malaysia, Mexico, Morocco, Peru, Philippines, Poland, Qatar, Russia,
South Africa, Taiwan, Thailand, Turkey , United Arab Emirates
2,686companies were assessed in the CSA in 2018**as of November 30th 2018
993 companies from
44 different countries actively participated
in the CSA in 2018
TOP 10 INDUSTRIES BY PARTICIPATION RATE Percentage of invited companies that actively participated in the CSA in 2018
Household Products
Commercial Services & Supplies
Metals & Mining
Beverages
Steel
Computers & Peripherals and Office Electronics
Electric Utilities
Telecommunication Services
Tobacco
Hotels, Resorts & Cruise Lines
0% 5% 10% 15% 20% 25% 30% 35% 40% 45% 50%
38.2
37.4
36.6
36.4
36.4
38.5
38.6
40.0
40.5
42.9
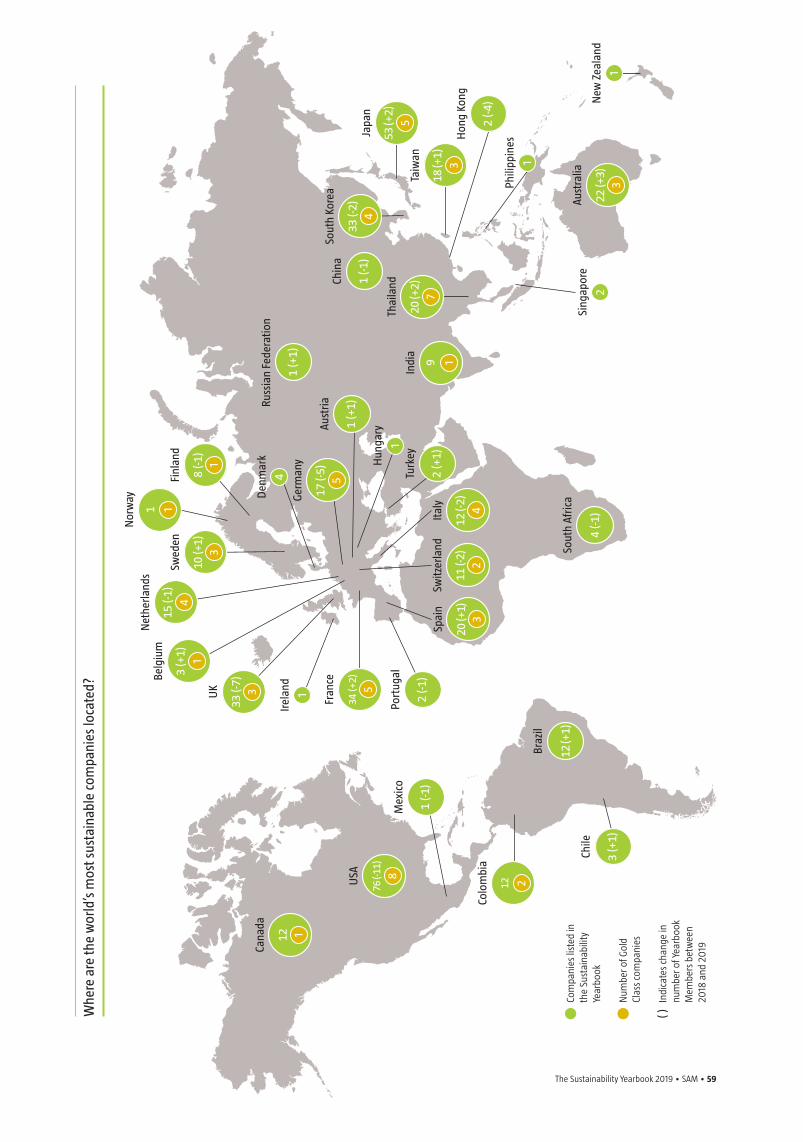
The Sustainability Yearbook 2019 • SAM • 59
Whe
re a
re th
e w
orld
’s m
ost s
usta
inab
le c
ompa
nies
loca
ted?
Com
pani
es li
sted
in
the
Sust
aina
bilit
y Ye
arbo
ok
Num
ber o
f Gol
d Cl
ass
com
pani
es
Indi
cate
s ch
ange
in
num
ber o
f Yea
rboo
k M
embe
rs b
etw
een
2018
and
201
9
( )
Sout
h Af
rica
4 (-
1)
Spai
n
320
(+1)
Italy 4
12 (-
2)
Switz
erla
nd
211
(-2)
Germ
any
517
(-5)
Fran
ce
534
(+2)
UK 3
33 (-
7)
Swed
en
310
(+1)
Finl
and
18
(-1)
Indi
a
19
Thai
land
720
(+2)
Sout
h Ko
rea
433
(-2)
Japa
n
553
(+2)
Taiw
an
318
(+1)
Aust
ralia
322
(+3)
Sing
apor
e
2N
ew Z
eala
nd
1
USA 8
76 (-
11)
Net
herla
nds
415
(-1)
Be
lgiu
m
13
(+1)
Hun
gary
1Po
rtug
al
2 (-
1)
Russ
ian
Fede
ratio
n
1 (+
1)
Mex
ico
1 (-
1)
Aust
ria
1 (+
1)
Nor
way
11
Colo
mbi
a
212
Braz
il
Phili
ppin
es
1
Den
mar
k
4Ire
land
1
12 (+
1)
Cana
da
112
Chile
3 (+
1)
Chin
a
1 (-
1)
Hon
g Ko
ng
2 (-
4)
Turk
ey
2 (+
1)
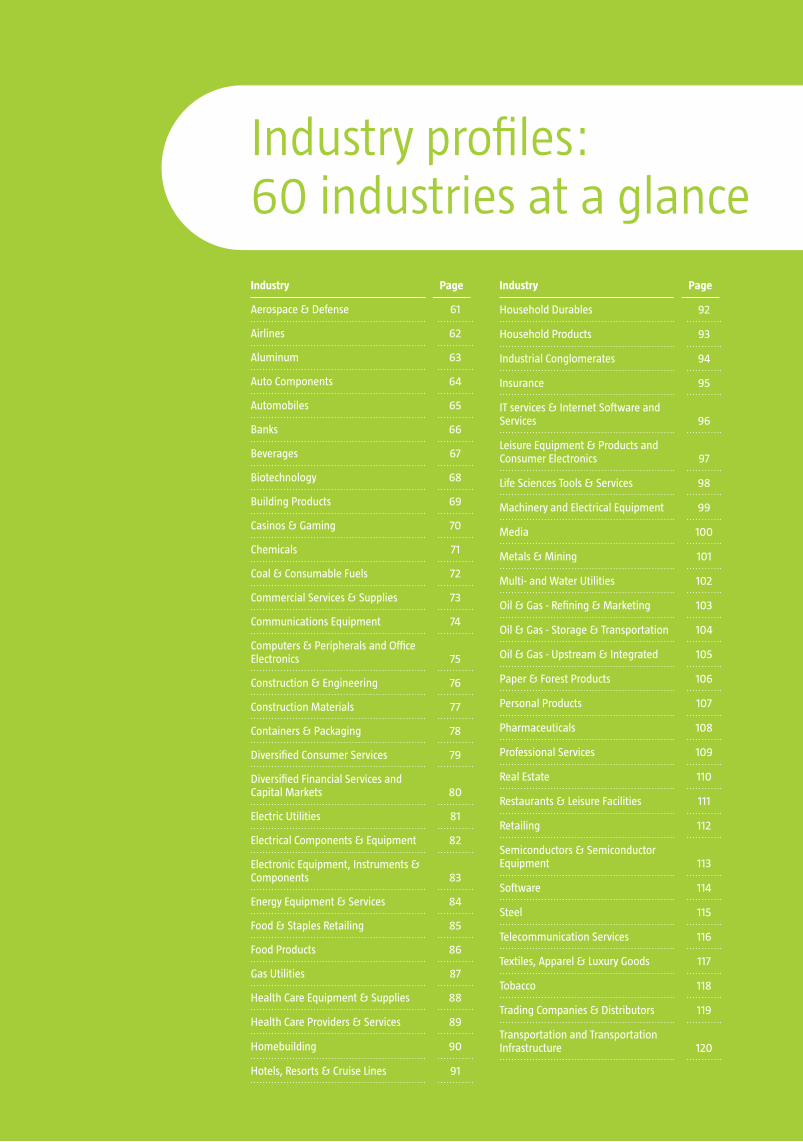
60 • SAM • The Sustainability Yearbook 2019 The Sustainability Yearbook 2019 • SAM • 61
Industry Page
Aerospace & Defense 61
Airlines 62
Aluminum 63
Auto Components 64
Automobiles 65
Banks 66
Beverages 67
Biotechnology 68
Building Products 69
Casinos & Gaming 70
Chemicals 71
Coal & Consumable Fuels 72
Commercial Services & Supplies 73
Communications Equipment 74
Computers & Peripherals and Office Electronics 75
Construction & Engineering 76
Construction Materials 77
Containers & Packaging 78
Diversified Consumer Services 79
Diversified Financial Services and Capital Markets 80
Electric Utilities 81
Electrical Components & Equipment 82
Electronic Equipment, Instruments & Components 83
Energy Equipment & Services 84
Food & Staples Retailing 85
Food Products 86
Gas Utilities 87
Health Care Equipment & Supplies 88
Health Care Providers & Services 89
Homebuilding 90
Hotels, Resorts & Cruise Lines 91
Industry Page
Household Durables 92
Household Products 93
Industrial Conglomerates 94
Insurance 95
IT services & Internet Software and Services 96
Leisure Equipment & Products and Consumer Electronics 97
Life Sciences Tools & Services 98
Machinery and Electrical Equipment 99
Media 100
Metals & Mining 101
Multi- and Water Utilities 102
Oil & Gas - Refining & Marketing 103
Oil & Gas - Storage & Transportation 104
Oil & Gas - Upstream & Integrated 105
Paper & Forest Products 106
Personal Products 107
Pharmaceuticals 108
Professional Services 109
Real Estate 110
Restaurants & Leisure Facilities 111
Retailing 112
Semiconductors & Semiconductor Equipment 113
Software 114
Steel 115
Telecommunication Services 116
Textiles, Apparel & Luxury Goods 117
Tobacco 118
Trading Companies & Distributors 119
Transportation and Transportation Infrastructure 120
Industry profiles: 60 industries at a glance
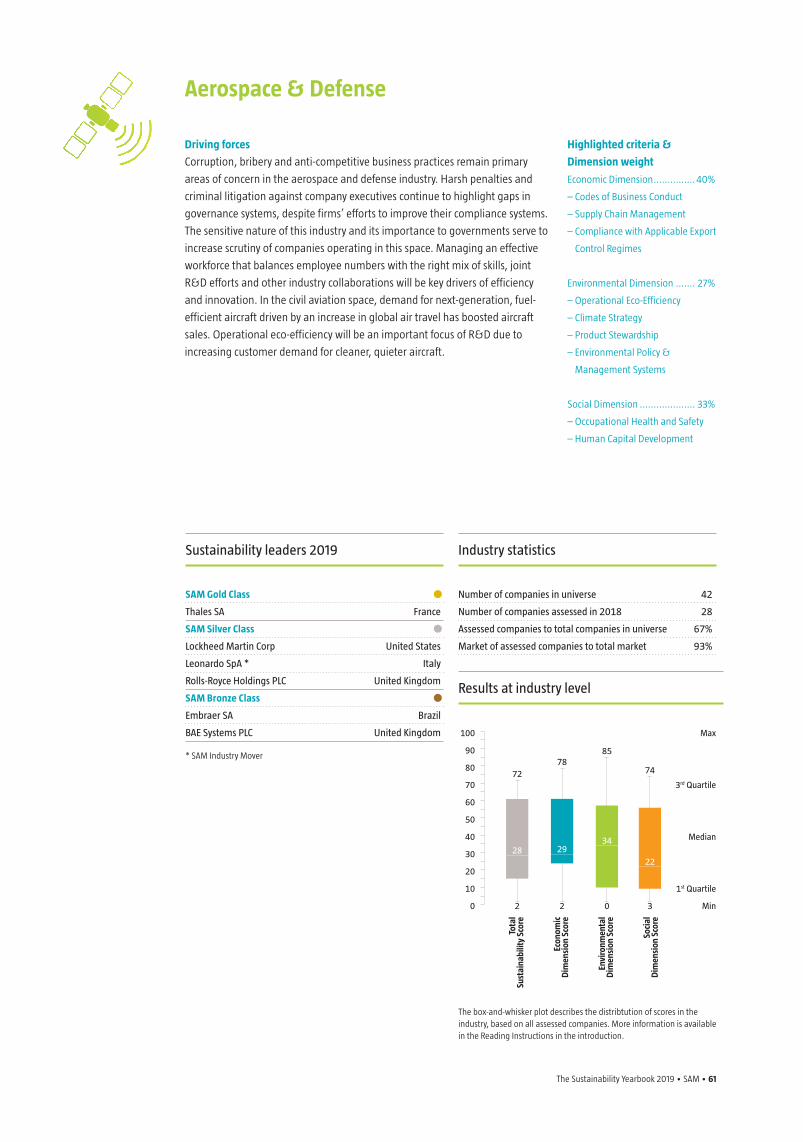
The Sustainability Yearbook 2019 • SAM • 61
Driving forces
Corruption, bribery and anti-competitive business practices remain primary
areas of concern in the aerospace and defense industry. Harsh penalties and
criminal litigation against company executives continue to highlight gaps in
governance systems, despite firms’ efforts to improve their compliance systems.
The sensitive nature of this industry and its importance to governments serve to
increase scrutiny of companies operating in this space. Managing an effective
workforce that balances employee numbers with the right mix of skills, joint
R&D efforts and other industry collaborations will be key drivers of efficiency
and innovation. In the civil aviation space, demand for next-generation, fuel-
efficient aircraft driven by an increase in global air travel has boosted aircraft
sales. Operational eco-efficiency will be an important focus of R&D due to
increasing customer demand for cleaner, quieter aircraft.
Aerospace & Defense
Highlighted criteria &
Dimension weight
Economic Dimension ............... 40%
– Codes of Business Conduct
– Supply Chain Management
– Compliance with Applicable Export
Control Regimes
Environmental Dimension ....... 27%
– Operational Eco-Efficiency
– Climate Strategy
– Product Stewardship
– Environmental Policy &
Management Systems
Social Dimension .................... 33%
– Occupational Health and Safety
– Human Capital Development
Industry statistics
Number of companies in universe 42
Number of companies assessed in 2018 28
Assessed companies to total companies in universe 67%
Market of assessed companies to total market 93%
Sustainability leaders 2019
SAM Gold Class •Thales SA France
SAM Silver Class •Lockheed Martin Corp United States
Leonardo SpA * Italy
Rolls-Royce Holdings PLC United Kingdom
SAM Bronze Class •Embraer SA Brazil
BAE Systems PLC United Kingdom
* SAM Industry Mover
Results at industry level
The box-and-whisker plot describes the distribtution of scores in the industry, based on all assessed companies. More information is available in the Reading Instructions in the introduction.
100
90
80
70
60
50
40
30
20
10
0
Max
3rd Quartile
Median
1st Quartile
Min
7278
28 2934
22
85
74
2 2 0 3
Tota
l Su
stai
nabi
lity
Scor
e
Econ
omic
D
imen
sion
Sco
re
Envi
ronm
enta
l D
imen
sion
Sco
re
Soci
al
Dim
ensi
on S
core
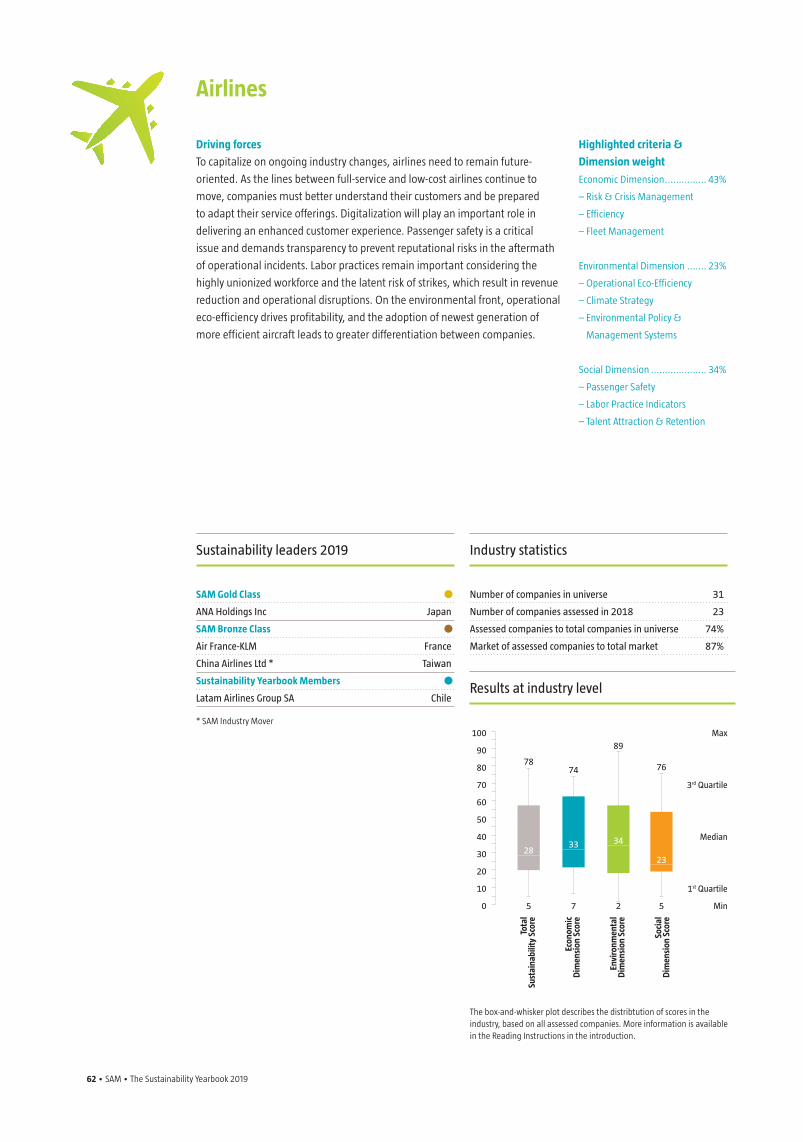
62 • SAM • The Sustainability Yearbook 2019 The Sustainability Yearbook 2019 • SAM • 63
Airlines
Driving forces
To capitalize on ongoing industry changes, airlines need to remain future-
oriented. As the lines between full-service and low-cost airlines continue to
move, companies must better understand their customers and be prepared
to adapt their service offerings. Digitalization will play an important role in
delivering an enhanced customer experience. Passenger safety is a critical
issue and demands transparency to prevent reputational risks in the aftermath
of operational incidents. Labor practices remain important considering the
highly unionized workforce and the latent risk of strikes, which result in revenue
reduction and operational disruptions. On the environmental front, operational
eco-efficiency drives profitability, and the adoption of newest generation of
more efficient aircraft leads to greater differentiation between companies.
Highlighted criteria &
Dimension weight
Economic Dimension ............... 43%
– Risk & Crisis Management
– Efficiency
– Fleet Management
Environmental Dimension ....... 23%
– Operational Eco-Efficiency
– Climate Strategy
– Environmental Policy &
Management Systems
Social Dimension .................... 34%
– Passenger Safety
– Labor Practice Indicators
– Talent Attraction & Retention
Industry statistics
Number of companies in universe 31
Number of companies assessed in 2018 23
Assessed companies to total companies in universe 74%
Market of assessed companies to total market 87%
Sustainability leaders 2019
SAM Gold Class •ANA Holdings Inc Japan
SAM Bronze Class •Air France-KLM France
China Airlines Ltd * Taiwan
Sustainability Yearbook Members •Latam Airlines Group SA Chile
* SAM Industry Mover
The box-and-whisker plot describes the distribtution of scores in the industry, based on all assessed companies. More information is available in the Reading Instructions in the introduction.
Max
3rd Quartile
Median
1st Quartile
Min
7874
2833 34
23
89
76
5 7 2 5
Tota
l Su
stai
nabi
lity
Scor
e
Econ
omic
D
imen
sion
Sco
re
Envi
ronm
enta
l D
imen
sion
Sco
re
Soci
al
Dim
ensi
on S
core
100
90
80
70
60
50
40
30
20
10
0
Results at industry level
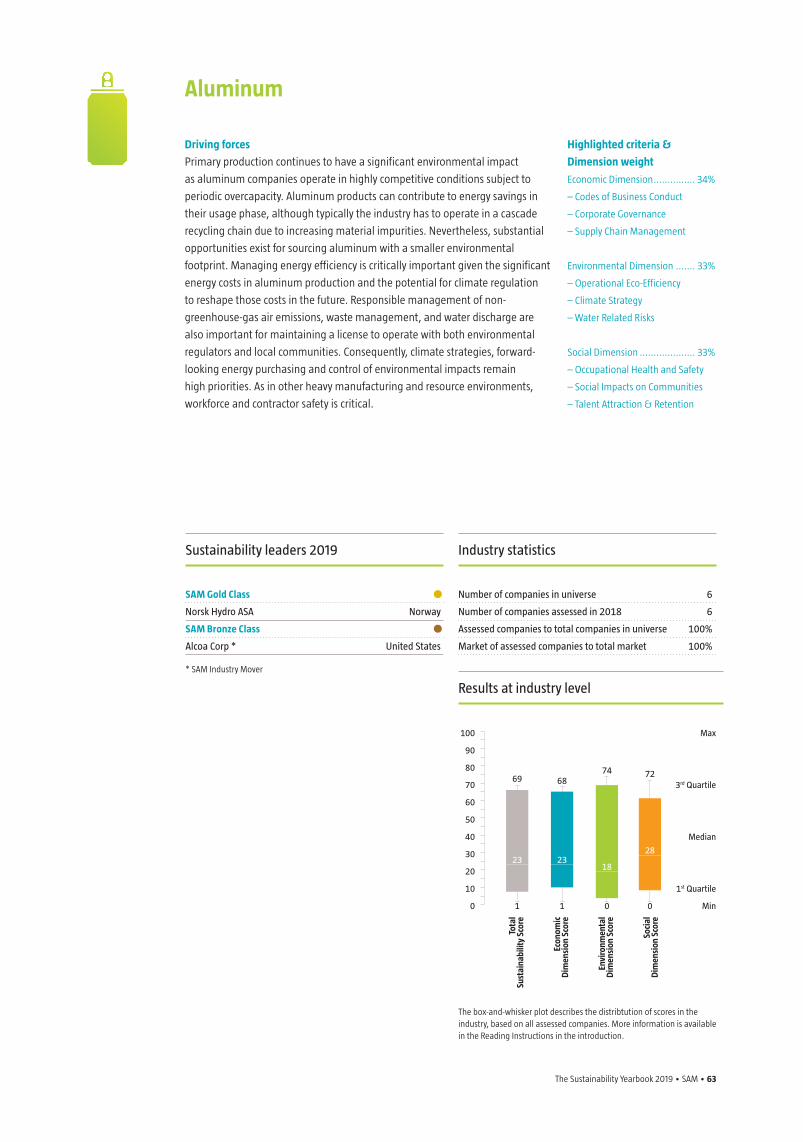
The Sustainability Yearbook 2019 • SAM • 63
Driving forces
Primary production continues to have a significant environmental impact
as aluminum companies operate in highly competitive conditions subject to
periodic overcapacity. Aluminum products can contribute to energy savings in
their usage phase, although typically the industry has to operate in a cascade
recycling chain due to increasing material impurities. Nevertheless, substantial
opportunities exist for sourcing aluminum with a smaller environmental
footprint. Managing energy efficiency is critically important given the significant
energy costs in aluminum production and the potential for climate regulation
to reshape those costs in the future. Responsible management of non-
greenhouse-gas air emissions, waste management, and water discharge are
also important for maintaining a license to operate with both environmental
regulators and local communities. Consequently, climate strategies, forward-
looking energy purchasing and control of environmental impacts remain
high priorities. As in other heavy manufacturing and resource environments,
workforce and contractor safety is critical.
Aluminum
Highlighted criteria &
Dimension weight
Economic Dimension ............... 34%
– Codes of Business Conduct
– Corporate Governance
– Supply Chain Management
Environmental Dimension ....... 33%
– Operational Eco-Efficiency
– Climate Strategy
– Water Related Risks
Social Dimension .................... 33%
– Occupational Health and Safety
– Social Impacts on Communities
– Talent Attraction & Retention
Industry statistics
Number of companies in universe 6
Number of companies assessed in 2018 6
Assessed companies to total companies in universe 100%
Market of assessed companies to total market 100%
Sustainability leaders 2019
SAM Gold Class •Norsk Hydro ASA Norway
SAM Bronze Class •Alcoa Corp * United States
* SAM Industry Mover
The box-and-whisker plot describes the distribtution of scores in the industry, based on all assessed companies. More information is available in the Reading Instructions in the introduction.
100
90
80
70
60
50
40
30
20
10
0
Max
3rd Quartile
Median
1st Quartile
Min
69 68
23 2318
28
74 72
1 1 0 0
Tota
l Su
stai
nabi
lity
Scor
e
Econ
omic
D
imen
sion
Sco
re
Envi
ronm
enta
l D
imen
sion
Sco
re
Soci
al
Dim
ensi
on S
core
Results at industry level
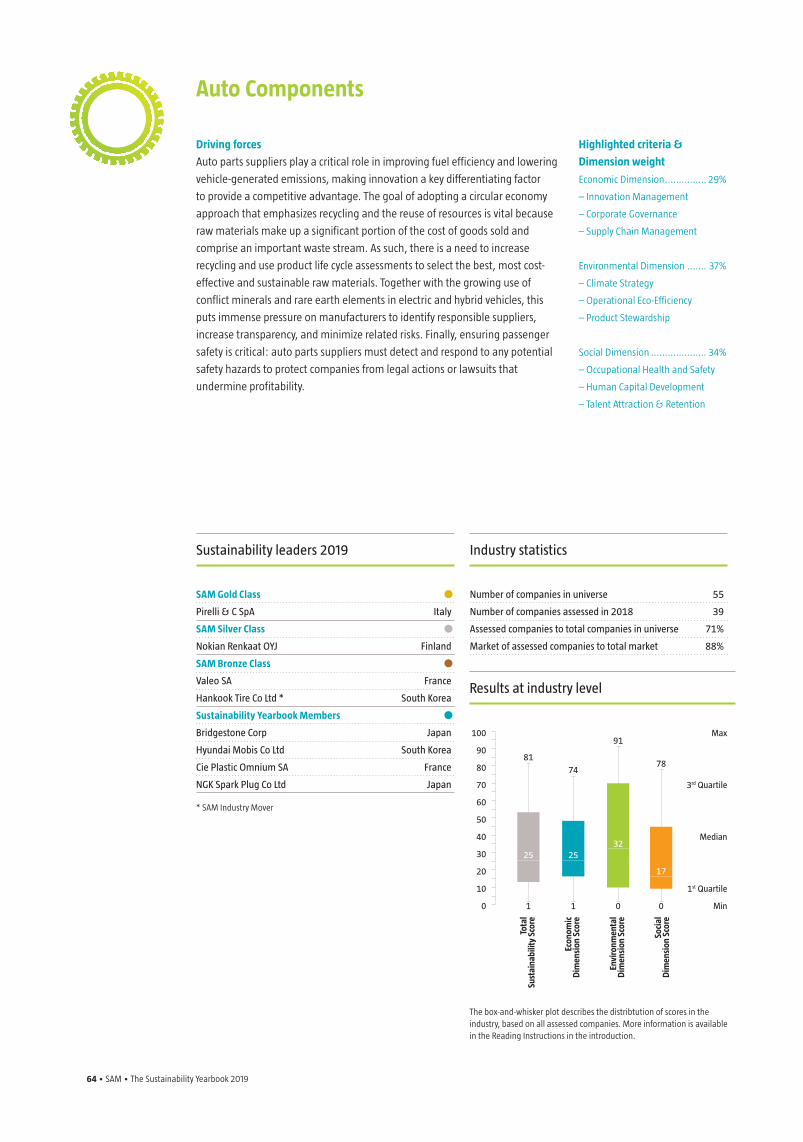
64 • SAM • The Sustainability Yearbook 2019 The Sustainability Yearbook 2019 • SAM • 65
Auto Components
Driving forces
Auto parts suppliers play a critical role in improving fuel efficiency and lowering
vehicle-generated emissions, making innovation a key differentiating factor
to provide a competitive advantage. The goal of adopting a circular economy
approach that emphasizes recycling and the reuse of resources is vital because
raw materials make up a significant portion of the cost of goods sold and
comprise an important waste stream. As such, there is a need to increase
recycling and use product life cycle assessments to select the best, most cost-
effective and sustainable raw materials. Together with the growing use of
conflict minerals and rare earth elements in electric and hybrid vehicles, this
puts immense pressure on manufacturers to identify responsible suppliers,
increase transparency, and minimize related risks. Finally, ensuring passenger
safety is critical: auto parts suppliers must detect and respond to any potential
safety hazards to protect companies from legal actions or lawsuits that
undermine profitability.
Highlighted criteria &
Dimension weight
Economic Dimension ............... 29%
– Innovation Management
– Corporate Governance
– Supply Chain Management
Environmental Dimension ....... 37%
– Climate Strategy
– Operational Eco-Efficiency
– Product Stewardship
Social Dimension .................... 34%
– Occupational Health and Safety
– Human Capital Development
– Talent Attraction & Retention
Industry statistics
Number of companies in universe 55
Number of companies assessed in 2018 39
Assessed companies to total companies in universe 71%
Market of assessed companies to total market 88%
Sustainability leaders 2019
SAM Gold Class •Pirelli & C SpA Italy
SAM Silver Class •Nokian Renkaat OYJ Finland
SAM Bronze Class •Valeo SA France
Hankook Tire Co Ltd * South Korea
Sustainability Yearbook Members •Bridgestone Corp Japan
Hyundai Mobis Co Ltd South Korea
Cie Plastic Omnium SA France
NGK Spark Plug Co Ltd Japan
* SAM Industry Mover
The box-and-whisker plot describes the distribtution of scores in the industry, based on all assessed companies. More information is available in the Reading Instructions in the introduction.
100
90
80
70
60
50
40
30
20
10
0
Max
3rd Quartile
Median
1st Quartile
Min
8174
25 2532
17
91
78
1 1 0 0
Tota
l Su
stai
nabi
lity
Scor
e
Econ
omic
D
imen
sion
Sco
re
Envi
ronm
enta
l D
imen
sion
Sco
re
Soci
al
Dim
ensi
on S
core
Results at industry level
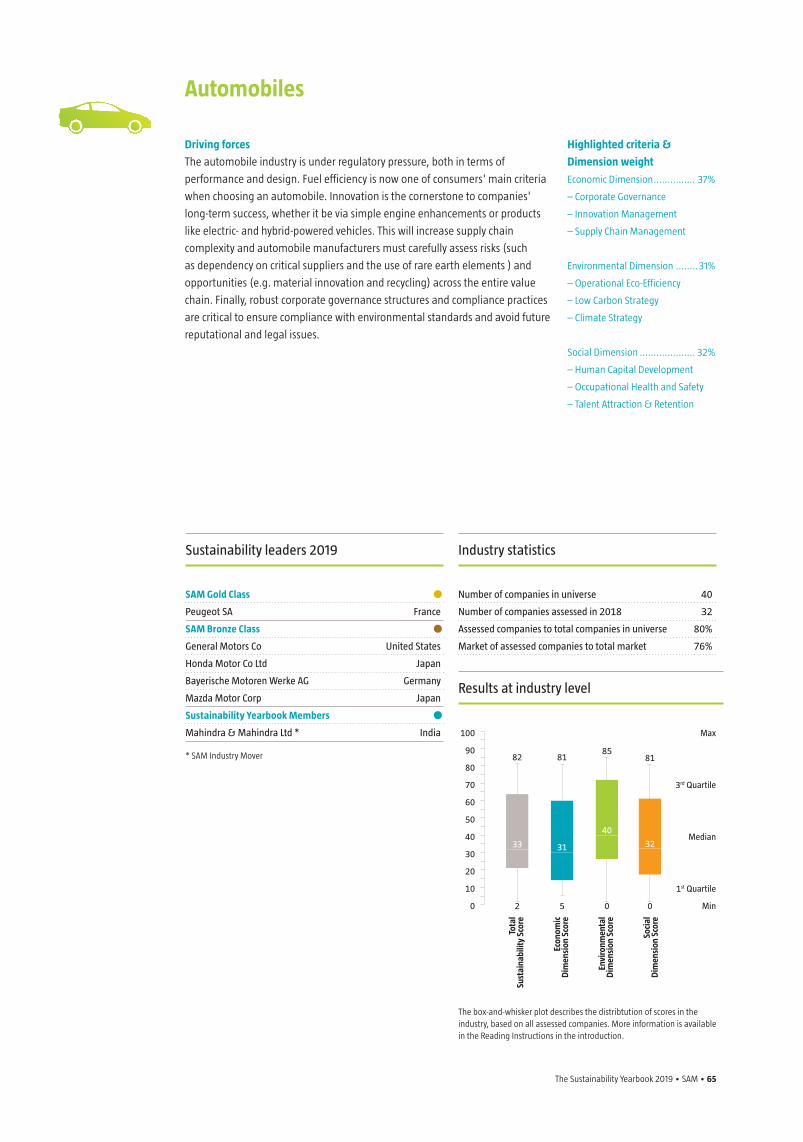
The Sustainability Yearbook 2019 • SAM • 65
Driving forces
The automobile industry is under regulatory pressure, both in terms of
performance and design. Fuel efficiency is now one of consumers' main criteria
when choosing an automobile. Innovation is the cornerstone to companies'
long-term success, whether it be via simple engine enhancements or products
like electric- and hybrid-powered vehicles. This will increase supply chain
complexity and automobile manufacturers must carefully assess risks (such
as dependency on critical suppliers and the use of rare earth elements ) and
opportunities (e.g. material innovation and recycling) across the entire value
chain. Finally, robust corporate governance structures and compliance practices
are critical to ensure compliance with environmental standards and avoid future
reputational and legal issues.
Automobiles
Highlighted criteria &
Dimension weight
Economic Dimension ............... 37%
– Corporate Governance
– Innovation Management
– Supply Chain Management
Environmental Dimension ........31%
– Operational Eco-Efficiency
– Low Carbon Strategy
– Climate Strategy
Social Dimension .................... 32%
– Human Capital Development
– Occupational Health and Safety
– Talent Attraction & Retention
Industry statistics
Number of companies in universe 40
Number of companies assessed in 2018 32
Assessed companies to total companies in universe 80%
Market of assessed companies to total market 76%
Sustainability leaders 2019
SAM Gold Class •Peugeot SA France
SAM Bronze Class •General Motors Co United States
Honda Motor Co Ltd Japan
Bayerische Motoren Werke AG Germany
Mazda Motor Corp Japan
Sustainability Yearbook Members •Mahindra & Mahindra Ltd * India
* SAM Industry Mover
The box-and-whisker plot describes the distribtution of scores in the industry, based on all assessed companies. More information is available in the Reading Instructions in the introduction.
100
90
80
70
60
50
40
30
20
10
0
Max
3rd Quartile
Median
1st Quartile
Min
82 81
33 31
40
32
8581
2 5 0 0
Tota
l Su
stai
nabi
lity
Scor
e
Econ
omic
D
imen
sion
Sco
re
Envi
ronm
enta
l D
imen
sion
Sco
re
Soci
al
Dim
ensi
on S
core
Results at industry level
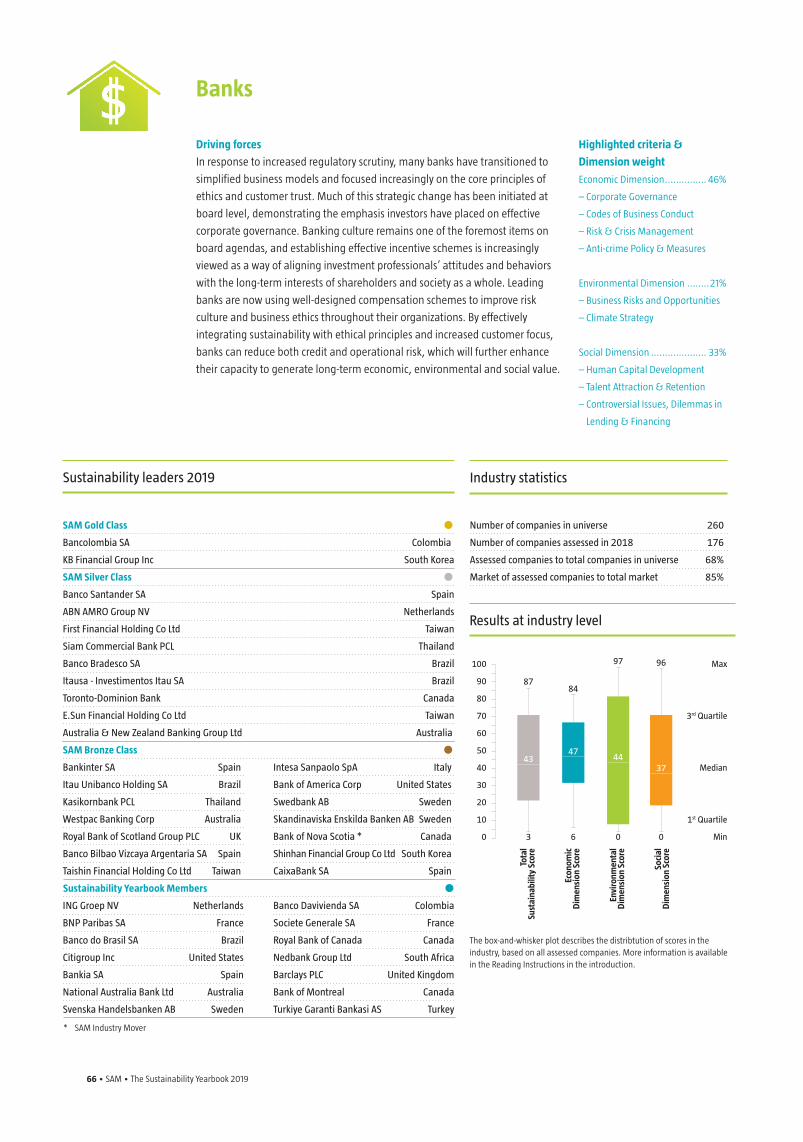
66 • SAM • The Sustainability Yearbook 2019 The Sustainability Yearbook 2019 • SAM • 67
Driving forces
In response to increased regulatory scrutiny, many banks have transitioned to
simplified business models and focused increasingly on the core principles of
ethics and customer trust. Much of this strategic change has been initiated at
board level, demonstrating the emphasis investors have placed on effective
corporate governance. Banking culture remains one of the foremost items on
board agendas, and establishing effective incentive schemes is increasingly
viewed as a way of aligning investment professionals’ attitudes and behaviors
with the long-term interests of shareholders and society as a whole. Leading
banks are now using well-designed compensation schemes to improve risk
culture and business ethics throughout their organizations. By effectively
integrating sustainability with ethical principles and increased customer focus,
banks can reduce both credit and operational risk, which will further enhance
their capacity to generate long-term economic, environmental and social value.
Banks
Highlighted criteria &
Dimension weight
Economic Dimension ............... 46%
– Corporate Governance
– Codes of Business Conduct
– Risk & Crisis Management
– Anti-crime Policy & Measures
Environmental Dimension ........21%
– Business Risks and Opportunities
– Climate Strategy
Social Dimension .................... 33%
– Human Capital Development
– Talent Attraction & Retention
– Controversial Issues, Dilemmas in
Lending & Financing
Industry statistics
Number of companies in universe 260
Number of companies assessed in 2018 176
Assessed companies to total companies in universe 68%
Market of assessed companies to total market 85%
Bancolombia SA Colombia
KB Financial Group Inc South Korea
SAM Silver Class •Banco Santander SA Spain
ABN AMRO Group NV Netherlands
First Financial Holding Co Ltd Taiwan
Siam Commercial Bank PCL Thailand
Banco Bradesco SA Brazil
Itausa - Investimentos Itau SA Brazil
Toronto-Dominion Bank Canada
E.Sun Financial Holding Co Ltd Taiwan
Australia & New Zealand Banking Group Ltd Australia
ING Groep NV Netherlands
BNP Paribas SA France
Banco do Brasil SA Brazil
Citigroup Inc United States
Bankia SA Spain
National Australia Bank Ltd Australia
Svenska Handelsbanken AB Sweden
Banco Davivienda SA Colombia
Societe Generale SA France
Royal Bank of Canada Canada
Nedbank Group Ltd South Africa
Barclays PLC United Kingdom
Bank of Montreal Canada
Turkiye Garanti Bankasi AS Turkey
Sustainability leaders 2019
SAM Gold Class •
Bankinter SA Spain
Itau Unibanco Holding SA Brazil
Kasikornbank PCL Thailand
Westpac Banking Corp Australia
Royal Bank of Scotland Group PLC UK
Banco Bilbao Vizcaya Argentaria SA Spain
Taishin Financial Holding Co Ltd Taiwan
Intesa Sanpaolo SpA Italy
Bank of America Corp United States
Swedbank AB Sweden
Skandinaviska Enskilda Banken AB Sweden
Bank of Nova Scotia * Canada
Shinhan Financial Group Co Ltd South Korea
CaixaBank SA Spain
Sustainability Yearbook Members •
SAM Bronze Class •
* SAM Industry Mover
The box-and-whisker plot describes the distribtution of scores in the industry, based on all assessed companies. More information is available in the Reading Instructions in the introduction.
Max
3rd Quartile
Median
1st Quartile
Min
8784
4347
4437
97 96
3 6 0 0
Tota
l Su
stai
nabi
lity
Scor
e
Econ
omic
D
imen
sion
Sco
re
Envi
ronm
enta
l D
imen
sion
Sco
re
Soci
al
Dim
ensi
on S
core
Results at industry level
100
90
80
70
60
50
40
30
20
10
0
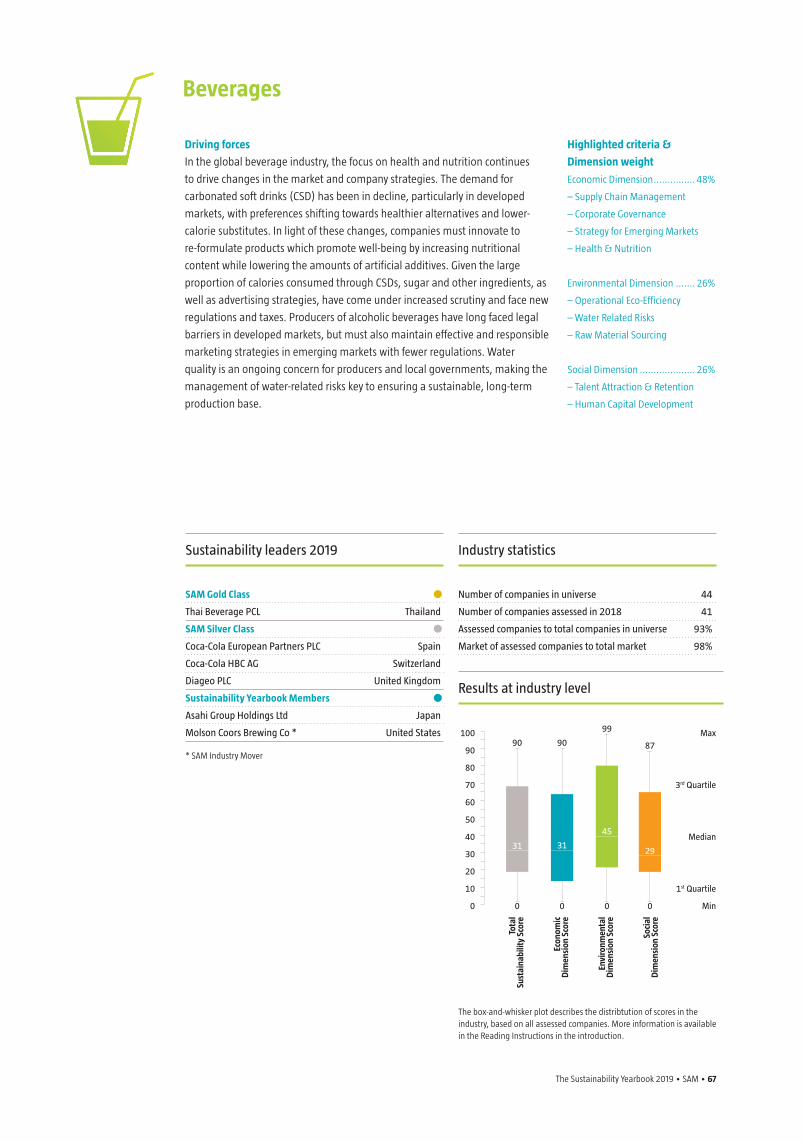
The Sustainability Yearbook 2019 • SAM • 67
Driving forces
In the global beverage industry, the focus on health and nutrition continues
to drive changes in the market and company strategies. The demand for
carbonated soft drinks (CSD) has been in decline, particularly in developed
markets, with preferences shifting towards healthier alternatives and lower-
calorie substitutes. In light of these changes, companies must innovate to
re-formulate products which promote well-being by increasing nutritional
content while lowering the amounts of artificial additives. Given the large
proportion of calories consumed through CSDs, sugar and other ingredients, as
well as advertising strategies, have come under increased scrutiny and face new
regulations and taxes. Producers of alcoholic beverages have long faced legal
barriers in developed markets, but must also maintain effective and responsible
marketing strategies in emerging markets with fewer regulations. Water
quality is an ongoing concern for producers and local governments, making the
management of water-related risks key to ensuring a sustainable, long-term
production base.
Beverages
Highlighted criteria &
Dimension weight
Economic Dimension ............... 48%
– Supply Chain Management
– Corporate Governance
– Strategy for Emerging Markets
– Health & Nutrition
Environmental Dimension ....... 26%
– Operational Eco-Efficiency
– Water Related Risks
– Raw Material Sourcing
Social Dimension .................... 26%
– Talent Attraction & Retention
– Human Capital Development
Industry statistics
Number of companies in universe 44
Number of companies assessed in 2018 41
Assessed companies to total companies in universe 93%
Market of assessed companies to total market 98%
Sustainability leaders 2019
SAM Gold Class •Thai Beverage PCL Thailand
SAM Silver Class •Coca-Cola European Partners PLC Spain
Coca-Cola HBC AG Switzerland
Diageo PLC United Kingdom
Sustainability Yearbook Members •Asahi Group Holdings Ltd Japan
Molson Coors Brewing Co * United States
* SAM Industry Mover
The box-and-whisker plot describes the distribtution of scores in the industry, based on all assessed companies. More information is available in the Reading Instructions in the introduction.
100
90
80
70
60
50
40
30
20
10
0
Max
3rd Quartile
Median
1st Quartile
Min
90 90
31 31
45
29
99
87
0 0 0 0
Tota
l Su
stai
nabi
lity
Scor
e
Econ
omic
D
imen
sion
Sco
re
Envi
ronm
enta
l D
imen
sion
Sco
re
Soci
al
Dim
ensi
on S
core
Results at industry level
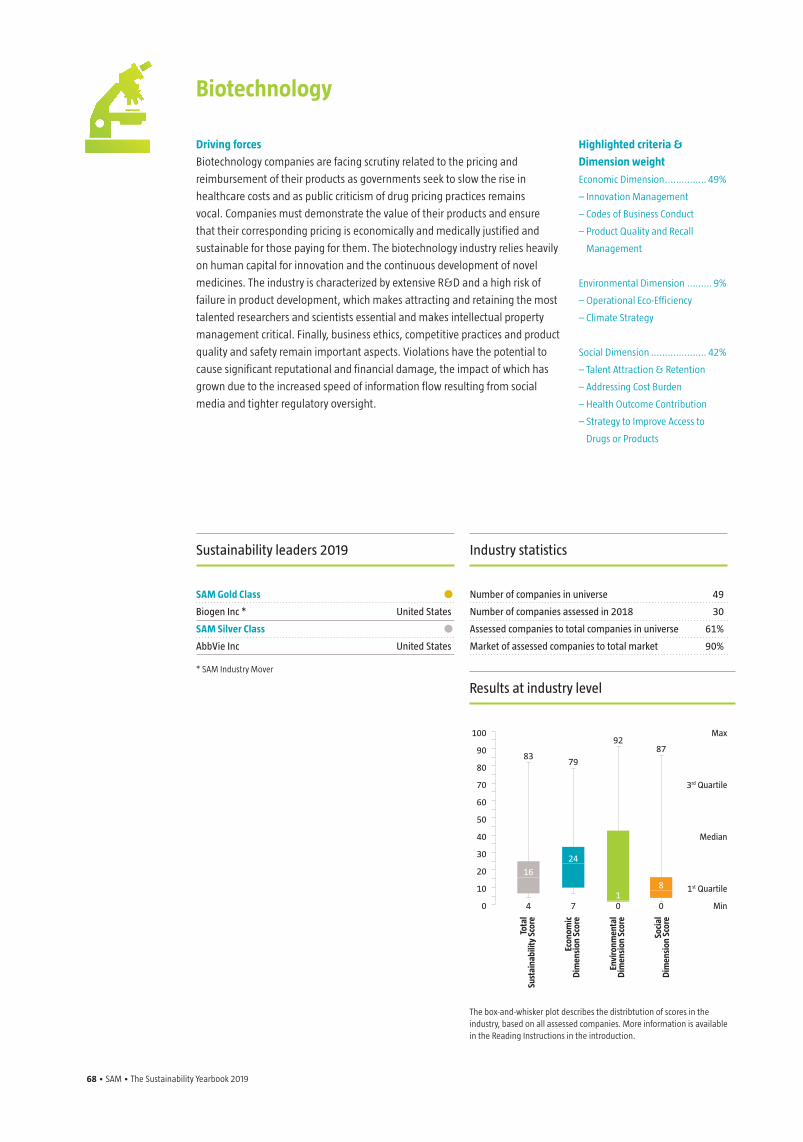
68 • SAM • The Sustainability Yearbook 2019 The Sustainability Yearbook 2019 • SAM • 69
Driving forces
Biotechnology companies are facing scrutiny related to the pricing and
reimbursement of their products as governments seek to slow the rise in
healthcare costs and as public criticism of drug pricing practices remains
vocal. Companies must demonstrate the value of their products and ensure
that their corresponding pricing is economically and medically justified and
sustainable for those paying for them. The biotechnology industry relies heavily
on human capital for innovation and the continuous development of novel
medicines. The industry is characterized by extensive R&D and a high risk of
failure in product development, which makes attracting and retaining the most
talented researchers and scientists essential and makes intellectual property
management critical. Finally, business ethics, competitive practices and product
quality and safety remain important aspects. Violations have the potential to
cause significant reputational and financial damage, the impact of which has
grown due to the increased speed of information flow resulting from social
media and tighter regulatory oversight.
Biotechnology
Highlighted criteria &
Dimension weight
Economic Dimension ............... 49%
– Innovation Management
– Codes of Business Conduct
– Product Quality and Recall
Management
Environmental Dimension ......... 9%
– Operational Eco-Efficiency
– Climate Strategy
Social Dimension .................... 42%
– Talent Attraction & Retention
– Addressing Cost Burden
– Health Outcome Contribution
– Strategy to Improve Access to
Drugs or Products
Industry statistics
Number of companies in universe 49
Number of companies assessed in 2018 30
Assessed companies to total companies in universe 61%
Market of assessed companies to total market 90%
Sustainability leaders 2019
SAM Gold Class •Biogen Inc * United States
SAM Silver Class •AbbVie Inc United States
* SAM Industry Mover
The box-and-whisker plot describes the distribtution of scores in the industry, based on all assessed companies. More information is available in the Reading Instructions in the introduction.
Max
3rd Quartile
Median
1st Quartile
Min
8379
16
24
18
9287
4 7 0 0
Tota
l Su
stai
nabi
lity
Scor
e
Econ
omic
D
imen
sion
Sco
re
Envi
ronm
enta
l D
imen
sion
Sco
re
Soci
al
Dim
ensi
on S
core
Results at industry level
100
90
80
70
60
50
40
30
20
10
0
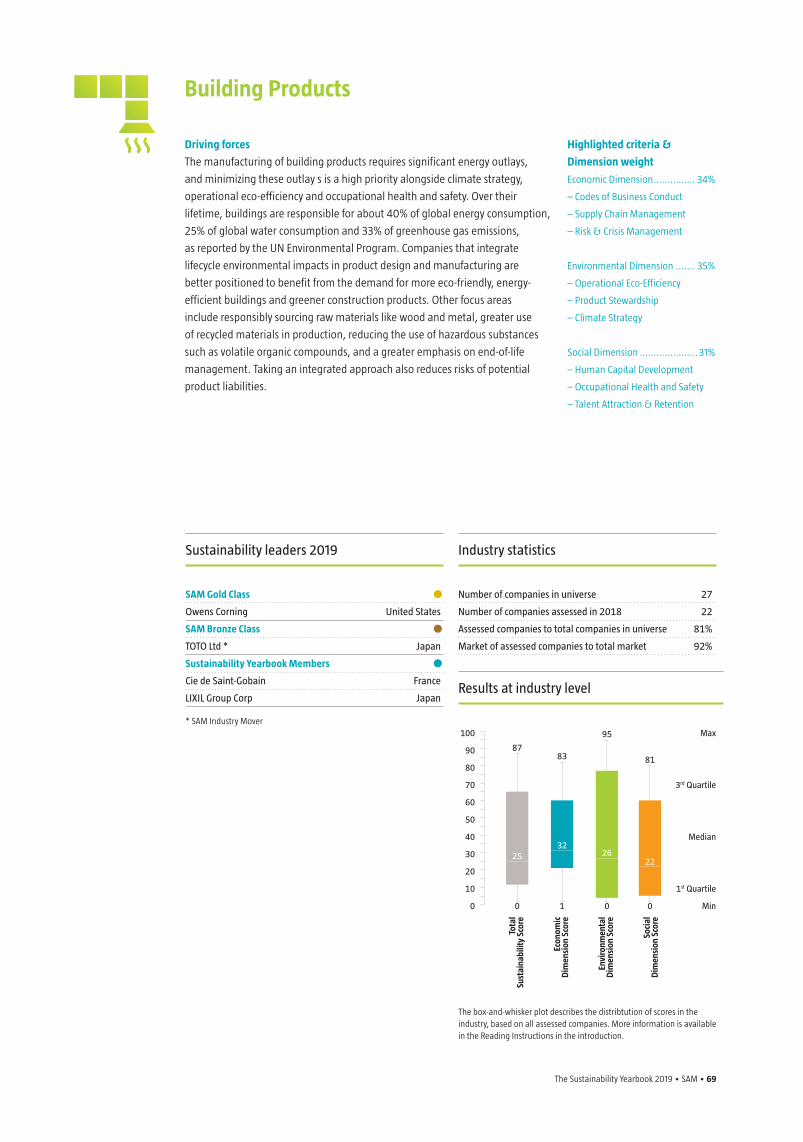
The Sustainability Yearbook 2019 • SAM • 69
Driving forces
The manufacturing of building products requires significant energy outlays,
and minimizing these outlay s is a high priority alongside climate strategy,
operational eco-efficiency and occupational health and safety. Over their
lifetime, buildings are responsible for about 40% of global energy consumption,
25% of global water consumption and 33% of greenhouse gas emissions,
as reported by the UN Environmental Program. Companies that integrate
lifecycle environmental impacts in product design and manufacturing are
better positioned to benefit from the demand for more eco-friendly, energy-
efficient buildings and greener construction products. Other focus areas
include responsibly sourcing raw materials like wood and metal, greater use
of recycled materials in production, reducing the use of hazardous substances
such as volatile organic compounds, and a greater emphasis on end-of-life
management. Taking an integrated approach also reduces risks of potential
product liabilities.
Building Products
Highlighted criteria &
Dimension weight
Economic Dimension ............... 34%
– Codes of Business Conduct
– Supply Chain Management
– Risk & Crisis Management
Environmental Dimension ....... 35%
– Operational Eco-Efficiency
– Product Stewardship
– Climate Strategy
Social Dimension .....................31%
– Human Capital Development
– Occupational Health and Safety
– Talent Attraction & Retention
Industry statistics
Number of companies in universe 27
Number of companies assessed in 2018 22
Assessed companies to total companies in universe 81%
Market of assessed companies to total market 92%
Sustainability leaders 2019
SAM Gold Class •Owens Corning United States
SAM Bronze Class •TOTO Ltd * Japan
Sustainability Yearbook Members •Cie de Saint-Gobain France
LIXIL Group Corp Japan
* SAM Industry Mover
The box-and-whisker plot describes the distribtution of scores in the industry, based on all assessed companies. More information is available in the Reading Instructions in the introduction.
100
90
80
70
60
50
40
30
20
10
0
Max
3rd Quartile
Median
1st Quartile
Min
8783
2532
2622
95
81
0 1 0 0
Tota
l Su
stai
nabi
lity
Scor
e
Econ
omic
D
imen
sion
Sco
re
Envi
ronm
enta
l D
imen
sion
Sco
re
Soci
al
Dim
ensi
on S
core
Results at industry level
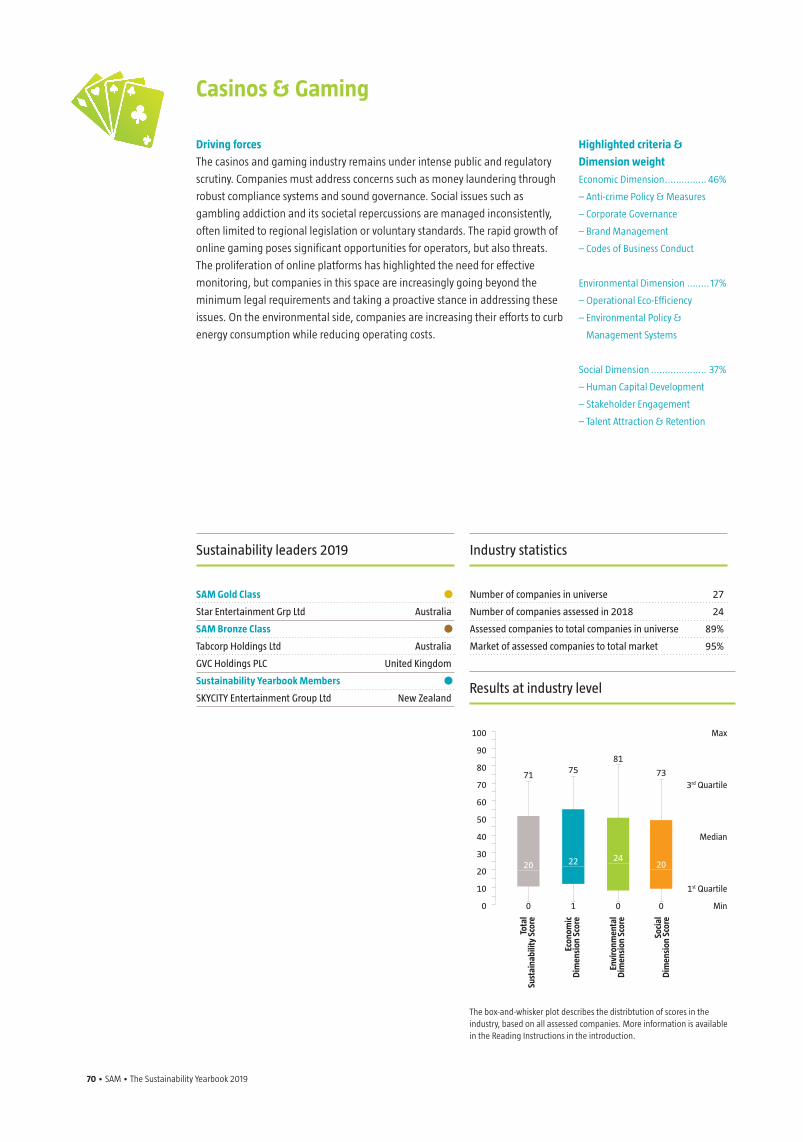
70 • SAM • The Sustainability Yearbook 2019 The Sustainability Yearbook 2019 • SAM • 71
Driving forces
The casinos and gaming industry remains under intense public and regulatory
scrutiny. Companies must address concerns such as money laundering through
robust compliance systems and sound governance. Social issues such as
gambling addiction and its societal repercussions are managed inconsistently,
often limited to regional legislation or voluntary standards. The rapid growth of
online gaming poses significant opportunities for operators, but also threats.
The proliferation of online platforms has highlighted the need for effective
monitoring, but companies in this space are increasingly going beyond the
minimum legal requirements and taking a proactive stance in addressing these
issues. On the environmental side, companies are increasing their efforts to curb
energy consumption while reducing operating costs.
Casinos & Gaming
Highlighted criteria &
Dimension weight
Economic Dimension ............... 46%
– Anti-crime Policy & Measures
– Corporate Governance
– Brand Management
– Codes of Business Conduct
Environmental Dimension ........ 17%
– Operational Eco-Efficiency
– Environmental Policy &
Management Systems
Social Dimension .................... 37%
– Human Capital Development
– Stakeholder Engagement
– Talent Attraction & Retention
Industry statistics
Number of companies in universe 27
Number of companies assessed in 2018 24
Assessed companies to total companies in universe 89%
Market of assessed companies to total market 95%
Sustainability leaders 2019
SAM Gold Class •Star Entertainment Grp Ltd Australia
SAM Bronze Class •Tabcorp Holdings Ltd Australia
GVC Holdings PLC United Kingdom
Sustainability Yearbook Members •SKYCITY Entertainment Group Ltd New Zealand
The box-and-whisker plot describes the distribtution of scores in the industry, based on all assessed companies. More information is available in the Reading Instructions in the introduction.
Max
3rd Quartile
Median
1st Quartile
Min
7175
20 22 2420
81
73
0 1 0 0
Tota
l Su
stai
nabi
lity
Scor
e
Econ
omic
D
imen
sion
Sco
re
Envi
ronm
enta
l D
imen
sion
Sco
re
Soci
al
Dim
ensi
on S
core
Results at industry level
100
90
80
70
60
50
40
30
20
10
0
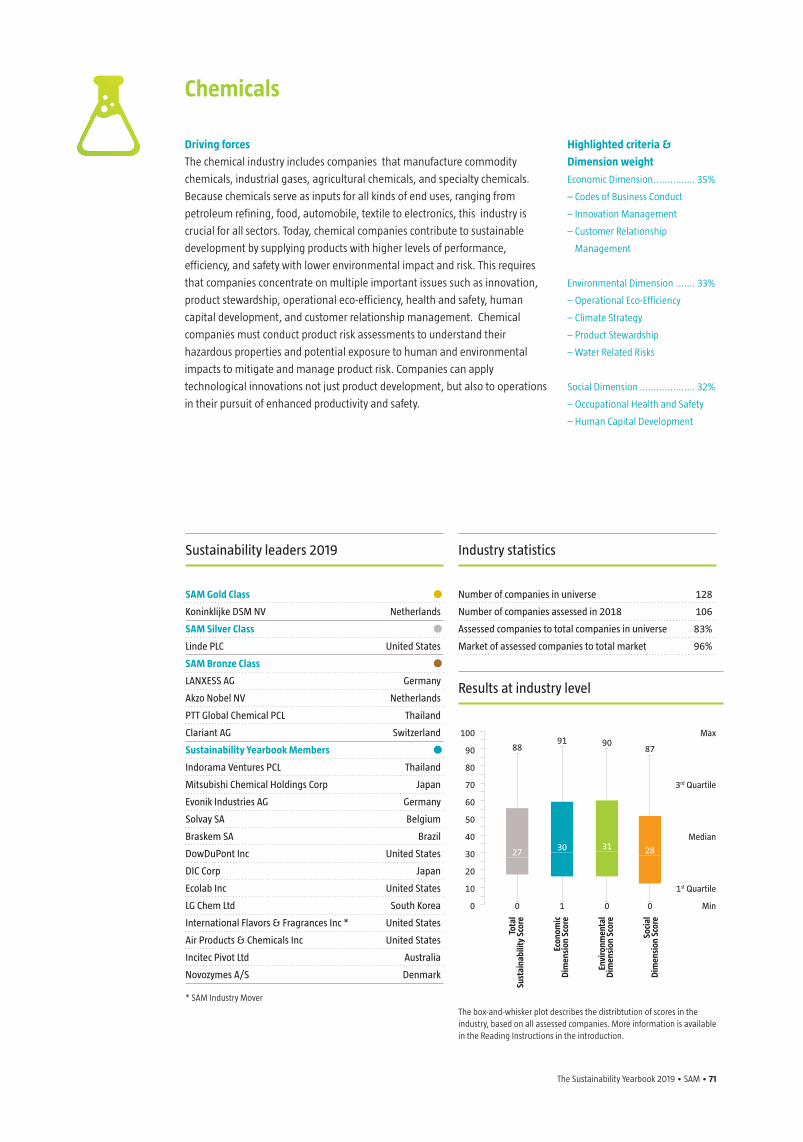
The Sustainability Yearbook 2019 • SAM • 71
Driving forces
The chemical industry includes companies that manufacture commodity
chemicals, industrial gases, agricultural chemicals, and specialty chemicals.
Because chemicals serve as inputs for all kinds of end uses, ranging from
petroleum refining, food, automobile, textile to electronics, this industry is
crucial for all sectors. Today, chemical companies contribute to sustainable
development by supplying products with higher levels of performance,
efficiency, and safety with lower environmental impact and risk. This requires
that companies concentrate on multiple important issues such as innovation,
product stewardship, operational eco-efficiency, health and safety, human
capital development, and customer relationship management. Chemical
companies must conduct product risk assessments to understand their
hazardous properties and potential exposure to human and environmental
impacts to mitigate and manage product risk. Companies can apply
technological innovations not just product development, but also to operations
in their pursuit of enhanced productivity and safety.
Chemicals
Highlighted criteria &
Dimension weight
Economic Dimension ............... 35%
– Codes of Business Conduct
– Innovation Management
– Customer Relationship
Management
Environmental Dimension ....... 33%
– Operational Eco-Efficiency
– Climate Strategy
– Product Stewardship
– Water Related Risks
Social Dimension .................... 32%
– Occupational Health and Safety
– Human Capital Development
Industry statistics
Number of companies in universe 128
Number of companies assessed in 2018 106
Assessed companies to total companies in universe 83%
Market of assessed companies to total market 96%
Sustainability leaders 2019
SAM Gold Class •Koninklijke DSM NV Netherlands
SAM Silver Class •Linde PLC United States
SAM Bronze Class •LANXESS AG Germany
Akzo Nobel NV Netherlands
PTT Global Chemical PCL Thailand
Clariant AG Switzerland
Sustainability Yearbook Members •Indorama Ventures PCL Thailand
Mitsubishi Chemical Holdings Corp Japan
Evonik Industries AG Germany
Solvay SA Belgium
Braskem SA Brazil
DowDuPont Inc United States
DIC Corp Japan
Ecolab Inc United States
LG Chem Ltd South Korea
International Flavors & Fragrances Inc * United States
Air Products & Chemicals Inc United States
Incitec Pivot Ltd Australia
Novozymes A/S Denmark
* SAM Industry Mover
The box-and-whisker plot describes the distribtution of scores in the industry, based on all assessed companies. More information is available in the Reading Instructions in the introduction.
100
90
80
70
60
50
40
30
20
10
0
Max
3rd Quartile
Median
1st Quartile
Min
8891
27 30 31 28
9087
0 1 0 0
Tota
l Su
stai
nabi
lity
Scor
e
Econ
omic
D
imen
sion
Sco
re
Envi
ronm
enta
l D
imen
sion
Sco
re
Soci
al
Dim
ensi
on S
core
Results at industry level
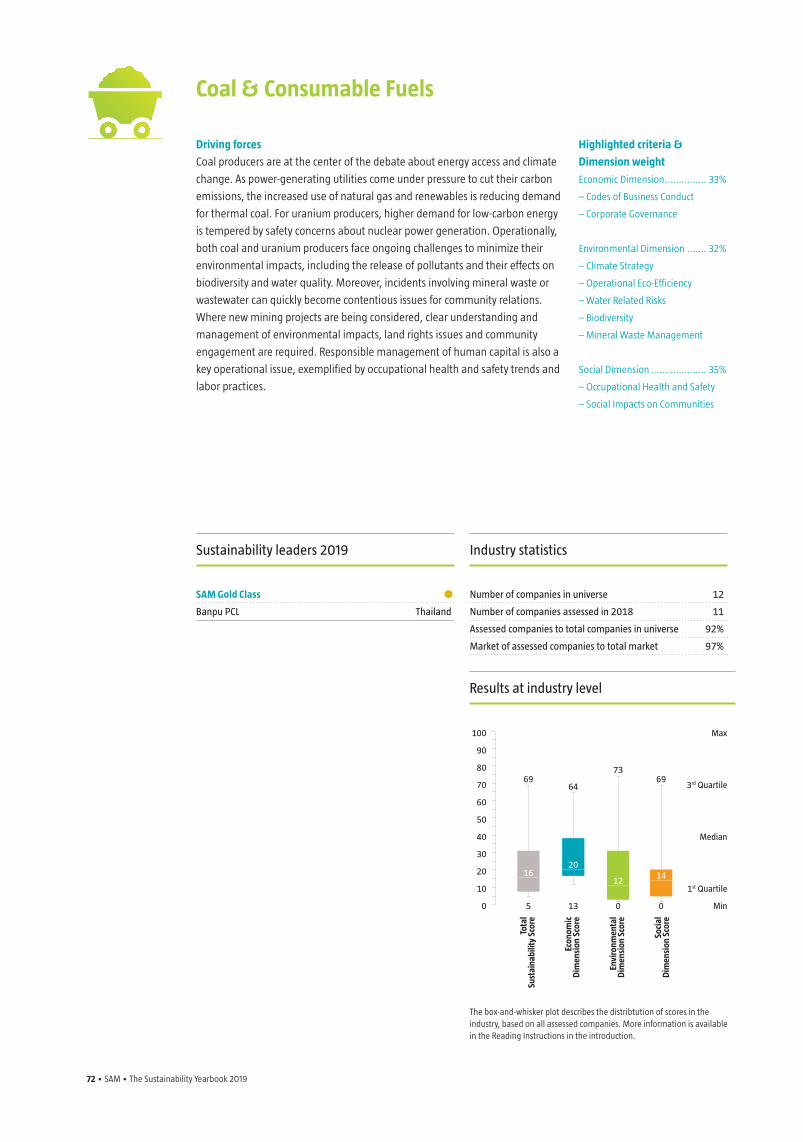
72 • SAM • The Sustainability Yearbook 2019 The Sustainability Yearbook 2019 • SAM • 73
Driving forces
Coal producers are at the center of the debate about energy access and climate
change. As power-generating utilities come under pressure to cut their carbon
emissions, the increased use of natural gas and renewables is reducing demand
for thermal coal. For uranium producers, higher demand for low-carbon energy
is tempered by safety concerns about nuclear power generation. Operationally,
both coal and uranium producers face ongoing challenges to minimize their
environmental impacts, including the release of pollutants and their effects on
biodiversity and water quality. Moreover, incidents involving mineral waste or
wastewater can quickly become contentious issues for community relations.
Where new mining projects are being considered, clear understanding and
management of environmental impacts, land rights issues and community
engagement are required. Responsible management of human capital is also a
key operational issue, exemplified by occupational health and safety trends and
labor practices.
Coal & Consumable Fuels
Highlighted criteria &
Dimension weight
Economic Dimension ............... 33%
– Codes of Business Conduct
– Corporate Governance
Environmental Dimension ....... 32%
– Climate Strategy
– Operational Eco-Efficiency
– Water Related Risks
– Biodiversity
– Mineral Waste Management
Social Dimension .................... 35%
– Occupational Health and Safety
– Social Impacts on Communities
Industry statistics
Number of companies in universe 12
Number of companies assessed in 2018 11
Assessed companies to total companies in universe 92%
Market of assessed companies to total market 97%
Sustainability leaders 2019
SAM Gold Class •Banpu PCL Thailand
The box-and-whisker plot describes the distribtution of scores in the industry, based on all assessed companies. More information is available in the Reading Instructions in the introduction.
Max
3rd Quartile
Median
1st Quartile
Min
6964
1620
1214
7369
5 13 0 0
Tota
l Su
stai
nabi
lity
Scor
e
Econ
omic
D
imen
sion
Sco
re
Envi
ronm
enta
l D
imen
sion
Sco
re
Soci
al
Dim
ensi
on S
core
Results at industry level
100
90
80
70
60
50
40
30
20
10
0
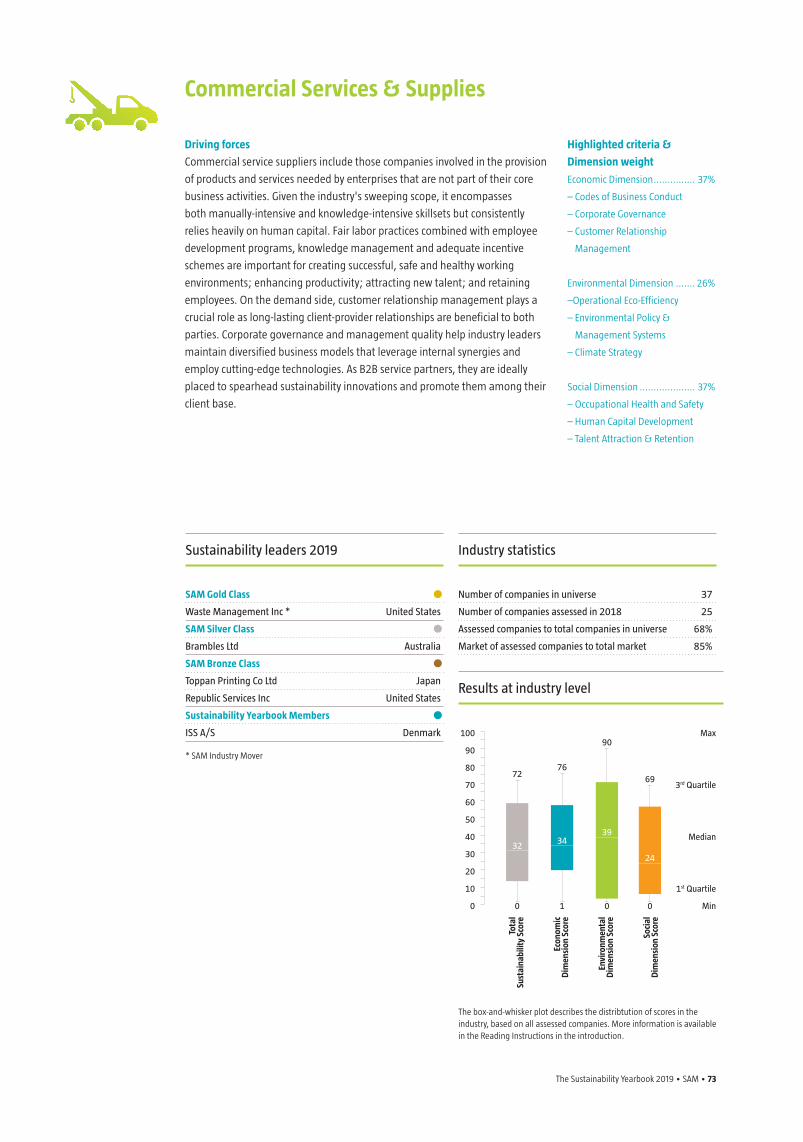
The Sustainability Yearbook 2019 • SAM • 73
Driving forces
Commercial service suppliers include those companies involved in the provision
of products and services needed by enterprises that are not part of their core
business activities. Given the industry's sweeping scope, it encompasses
both manually-intensive and knowledge-intensive skillsets but consistently
relies heavily on human capital. Fair labor practices combined with employee
development programs, knowledge management and adequate incentive
schemes are important for creating successful, safe and healthy working
environments; enhancing productivity; attracting new talent; and retaining
employees. On the demand side, customer relationship management plays a
crucial role as long-lasting client-provider relationships are beneficial to both
parties. Corporate governance and management quality help industry leaders
maintain diversified business models that leverage internal synergies and
employ cutting-edge technologies. As B2B service partners, they are ideally
placed to spearhead sustainability innovations and promote them among their
client base.
Commercial Services & Supplies
Highlighted criteria &
Dimension weight
Economic Dimension ............... 37%
– Codes of Business Conduct
– Corporate Governance
– Customer Relationship
Management
Environmental Dimension ....... 26%
–Operational Eco-Efficiency
– Environmental Policy &
Management Systems
– Climate Strategy
Social Dimension .................... 37%
– Occupational Health and Safety
– Human Capital Development
– Talent Attraction & Retention
Industry statistics
Number of companies in universe 37
Number of companies assessed in 2018 25
Assessed companies to total companies in universe 68%
Market of assessed companies to total market 85%
Sustainability leaders 2019
SAM Gold Class •Waste Management Inc * United States
SAM Silver Class •Brambles Ltd Australia
SAM Bronze Class •Toppan Printing Co Ltd Japan
Republic Services Inc United States
Sustainability Yearbook Members •ISS A/S Denmark
* SAM Industry Mover
The box-and-whisker plot describes the distribtution of scores in the industry, based on all assessed companies. More information is available in the Reading Instructions in the introduction.
100
90
80
70
60
50
40
30
20
10
0
Max
3rd Quartile
Median
1st Quartile
Min
7276
32 3439
24
90
69
0 1 0 0
Tota
l Su
stai
nabi
lity
Scor
e
Econ
omic
D
imen
sion
Sco
re
Envi
ronm
enta
l D
imen
sion
Sco
re
Soci
al
Dim
ensi
on S
core
Results at industry level
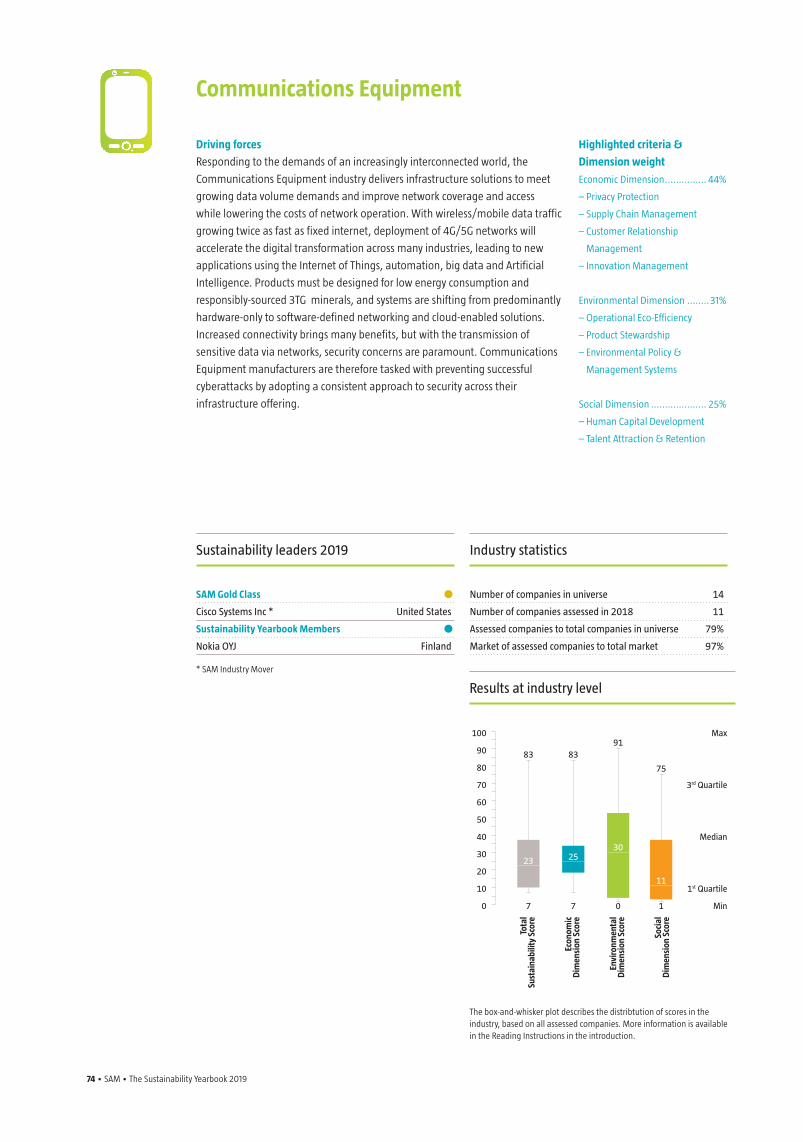
74 • SAM • The Sustainability Yearbook 2019 The Sustainability Yearbook 2019 • SAM • 75
Driving forces
Responding to the demands of an increasingly interconnected world, the
Communications Equipment industry delivers infrastructure solutions to meet
growing data volume demands and improve network coverage and access
while lowering the costs of network operation. With wireless/mobile data traffic
growing twice as fast as fixed internet, deployment of 4G/5G networks will
accelerate the digital transformation across many industries, leading to new
applications using the Internet of Things, automation, big data and Artificial
Intelligence. Products must be designed for low energy consumption and
responsibly-sourced 3TG minerals, and systems are shifting from predominantly
hardware-only to software-defined networking and cloud-enabled solutions.
Increased connectivity brings many benefits, but with the transmission of
sensitive data via networks, security concerns are paramount. Communications
Equipment manufacturers are therefore tasked with preventing successful
cyberattacks by adopting a consistent approach to security across their
infrastructure offering.
Communications Equipment
Highlighted criteria &
Dimension weight
Economic Dimension ............... 44%
– Privacy Protection
– Supply Chain Management
– Customer Relationship
Management
– Innovation Management
Environmental Dimension ........31%
– Operational Eco-Efficiency
– Product Stewardship
– Environmental Policy &
Management Systems
Social Dimension .................... 25%
– Human Capital Development
– Talent Attraction & Retention
Industry statistics
Number of companies in universe 14
Number of companies assessed in 2018 11
Assessed companies to total companies in universe 79%
Market of assessed companies to total market 97%
Sustainability leaders 2019
SAM Gold Class •Cisco Systems Inc * United States
Sustainability Yearbook Members •Nokia OYJ Finland
* SAM Industry Mover
The box-and-whisker plot describes the distribtution of scores in the industry, based on all assessed companies. More information is available in the Reading Instructions in the introduction.
Max
3rd Quartile
Median
1st Quartile
Min
83 83
23 2530
11
91
75
7 7 0 1
Tota
l Su
stai
nabi
lity
Scor
e
Econ
omic
D
imen
sion
Sco
re
Envi
ronm
enta
l D
imen
sion
Sco
re
Soci
al
Dim
ensi
on S
core
Results at industry level
100
90
80
70
60
50
40
30
20
10
0
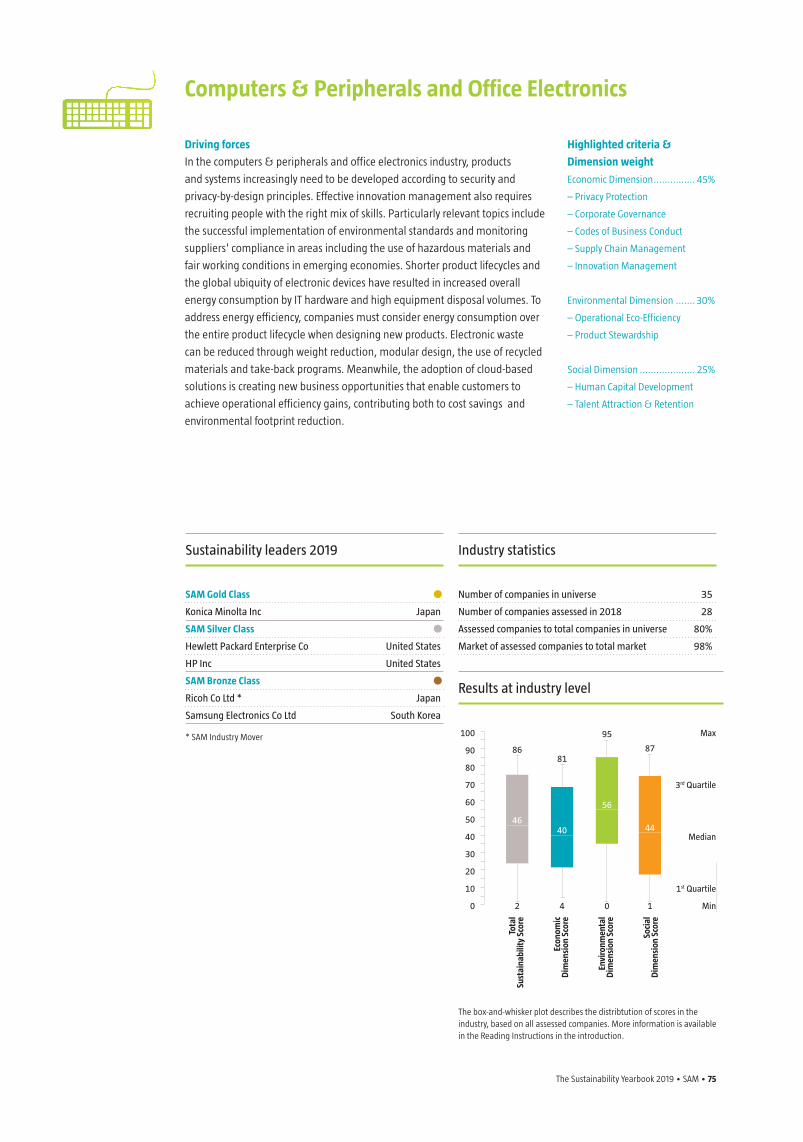
The Sustainability Yearbook 2019 • SAM • 75
Driving forces
In the computers & peripherals and office electronics industry, products
and systems increasingly need to be developed according to security and
privacy-by-design principles. Effective innovation management also requires
recruiting people with the right mix of skills. Particularly relevant topics include
the successful implementation of environmental standards and monitoring
suppliers' compliance in areas including the use of hazardous materials and
fair working conditions in emerging economies. Shorter product lifecycles and
the global ubiquity of electronic devices have resulted in increased overall
energy consumption by IT hardware and high equipment disposal volumes. To
address energy efficiency, companies must consider energy consumption over
the entire product lifecycle when designing new products. Electronic waste
can be reduced through weight reduction, modular design, the use of recycled
materials and take-back programs. Meanwhile, the adoption of cloud-based
solutions is creating new business opportunities that enable customers to
achieve operational efficiency gains, contributing both to cost savings and
environmental footprint reduction.
Computers & Peripherals and Office Electronics
Highlighted criteria &
Dimension weight
Economic Dimension ............... 45%
– Privacy Protection
– Corporate Governance
– Codes of Business Conduct
– Supply Chain Management
– Innovation Management
Environmental Dimension ....... 30%
– Operational Eco-Efficiency
– Product Stewardship
Social Dimension .................... 25%
– Human Capital Development
– Talent Attraction & Retention
Industry statistics
Number of companies in universe 35
Number of companies assessed in 2018 28
Assessed companies to total companies in universe 80%
Market of assessed companies to total market 98%
Sustainability leaders 2019
SAM Gold Class •Konica Minolta Inc Japan
SAM Silver Class •Hewlett Packard Enterprise Co United States
HP Inc United States
SAM Bronze Class •Ricoh Co Ltd * Japan
Samsung Electronics Co Ltd South Korea
* SAM Industry Mover
The box-and-whisker plot describes the distribtution of scores in the industry, based on all assessed companies. More information is available in the Reading Instructions in the introduction.
100
90
80
70
60
50
40
30
20
10
0
Max
3rd Quartile
Median
1st Quartile
Min
8681
4640
56
44
95
87
2 4 0 1
Tota
l Su
stai
nabi
lity
Scor
e
Econ
omic
D
imen
sion
Sco
re
Envi
ronm
enta
l D
imen
sion
Sco
re
Soci
al
Dim
ensi
on S
core
Results at industry level
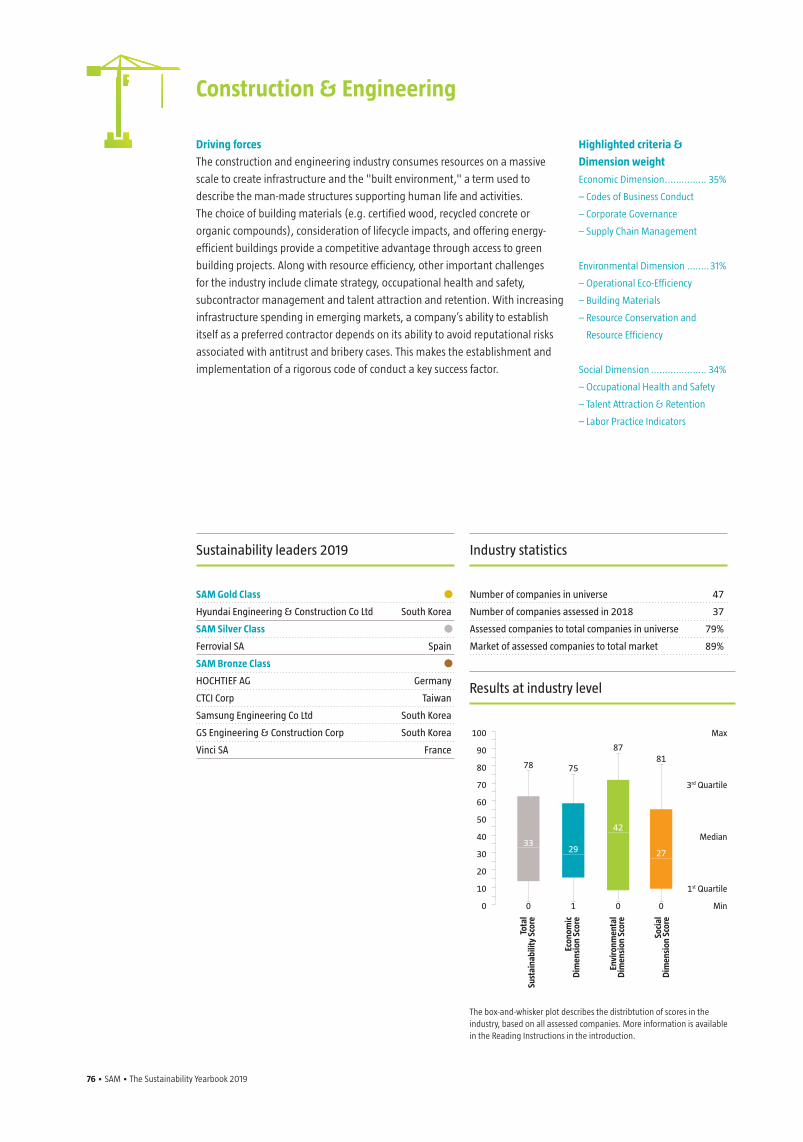
76 • SAM • The Sustainability Yearbook 2019 The Sustainability Yearbook 2019 • SAM • 77
Driving forces
The construction and engineering industry consumes resources on a massive
scale to create infrastructure and the "built environment," a term used to
describe the man-made structures supporting human life and activities.
The choice of building materials (e.g. certified wood, recycled concrete or
organic compounds), consideration of lifecycle impacts, and offering energy-
efficient buildings provide a competitive advantage through access to green
building projects. Along with resource efficiency, other important challenges
for the industry include climate strategy, occupational health and safety,
subcontractor management and talent attraction and retention. With increasing
infrastructure spending in emerging markets, a company’s ability to establish
itself as a preferred contractor depends on its ability to avoid reputational risks
associated with antitrust and bribery cases. This makes the establishment and
implementation of a rigorous code of conduct a key success factor.
Construction & Engineering
Highlighted criteria &
Dimension weight
Economic Dimension ............... 35%
– Codes of Business Conduct
– Corporate Governance
– Supply Chain Management
Environmental Dimension ........31%
– Operational Eco-Efficiency
– Building Materials
– Resource Conservation and
Resource Efficiency
Social Dimension .................... 34%
– Occupational Health and Safety
– Talent Attraction & Retention
– Labor Practice Indicators
Industry statistics
Number of companies in universe 47
Number of companies assessed in 2018 37
Assessed companies to total companies in universe 79%
Market of assessed companies to total market 89%
Sustainability leaders 2019
SAM Gold Class •Hyundai Engineering & Construction Co Ltd South Korea
SAM Silver Class •Ferrovial SA Spain
SAM Bronze Class •HOCHTIEF AG Germany
CTCI Corp Taiwan
Samsung Engineering Co Ltd South Korea
GS Engineering & Construction Corp South Korea
Vinci SA France
The box-and-whisker plot describes the distribtution of scores in the industry, based on all assessed companies. More information is available in the Reading Instructions in the introduction.
Max
3rd Quartile
Median
1st Quartile
Min
78 75
3329
42
27
8781
0 1 0 0
Tota
l Su
stai
nabi
lity
Scor
e
Econ
omic
D
imen
sion
Sco
re
Envi
ronm
enta
l D
imen
sion
Sco
re
Soci
al
Dim
ensi
on S
core
Results at industry level
100
90
80
70
60
50
40
30
20
10
0
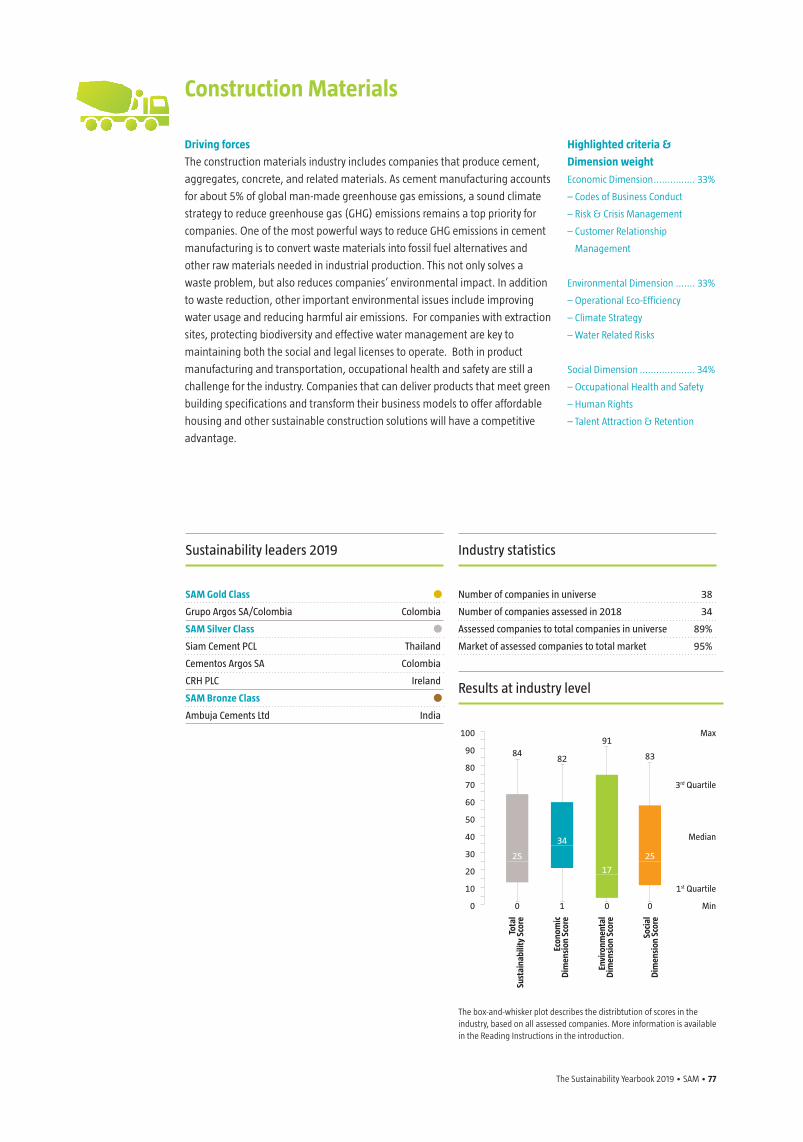
The Sustainability Yearbook 2019 • SAM • 77
Driving forces
The construction materials industry includes companies that produce cement,
aggregates, concrete, and related materials. As cement manufacturing accounts
for about 5% of global man-made greenhouse gas emissions, a sound climate
strategy to reduce greenhouse gas (GHG) emissions remains a top priority for
companies. One of the most powerful ways to reduce GHG emissions in cement
manufacturing is to convert waste materials into fossil fuel alternatives and
other raw materials needed in industrial production. This not only solves a
waste problem, but also reduces companies’ environmental impact. In addition
to waste reduction, other important environmental issues include improving
water usage and reducing harmful air emissions. For companies with extraction
sites, protecting biodiversity and effective water management are key to
maintaining both the social and legal licenses to operate. Both in product
manufacturing and transportation, occupational health and safety are still a
challenge for the industry. Companies that can deliver products that meet green
building specifications and transform their business models to offer affordable
housing and other sustainable construction solutions will have a competitive
advantage.
Construction Materials
Highlighted criteria &
Dimension weight
Economic Dimension ............... 33%
– Codes of Business Conduct
– Risk & Crisis Management
– Customer Relationship
Management
Environmental Dimension ....... 33%
– Operational Eco-Efficiency
– Climate Strategy
– Water Related Risks
Social Dimension .................... 34%
– Occupational Health and Safety
– Human Rights
– Talent Attraction & Retention
Industry statistics
Number of companies in universe 38
Number of companies assessed in 2018 34
Assessed companies to total companies in universe 89%
Market of assessed companies to total market 95%
Sustainability leaders 2019
SAM Gold Class •Grupo Argos SA/Colombia Colombia
SAM Silver Class •Siam Cement PCL Thailand
Cementos Argos SA Colombia
CRH PLC Ireland
SAM Bronze Class •Ambuja Cements Ltd India
The box-and-whisker plot describes the distribtution of scores in the industry, based on all assessed companies. More information is available in the Reading Instructions in the introduction.
100
90
80
70
60
50
40
30
20
10
0
Max
3rd Quartile
Median
1st Quartile
Min
8482
25
34
17
25
91
83
0 1 0 0
Tota
l Su
stai
nabi
lity
Scor
e
Econ
omic
D
imen
sion
Sco
re
Envi
ronm
enta
l D
imen
sion
Sco
re
Soci
al
Dim
ensi
on S
core
Results at industry level
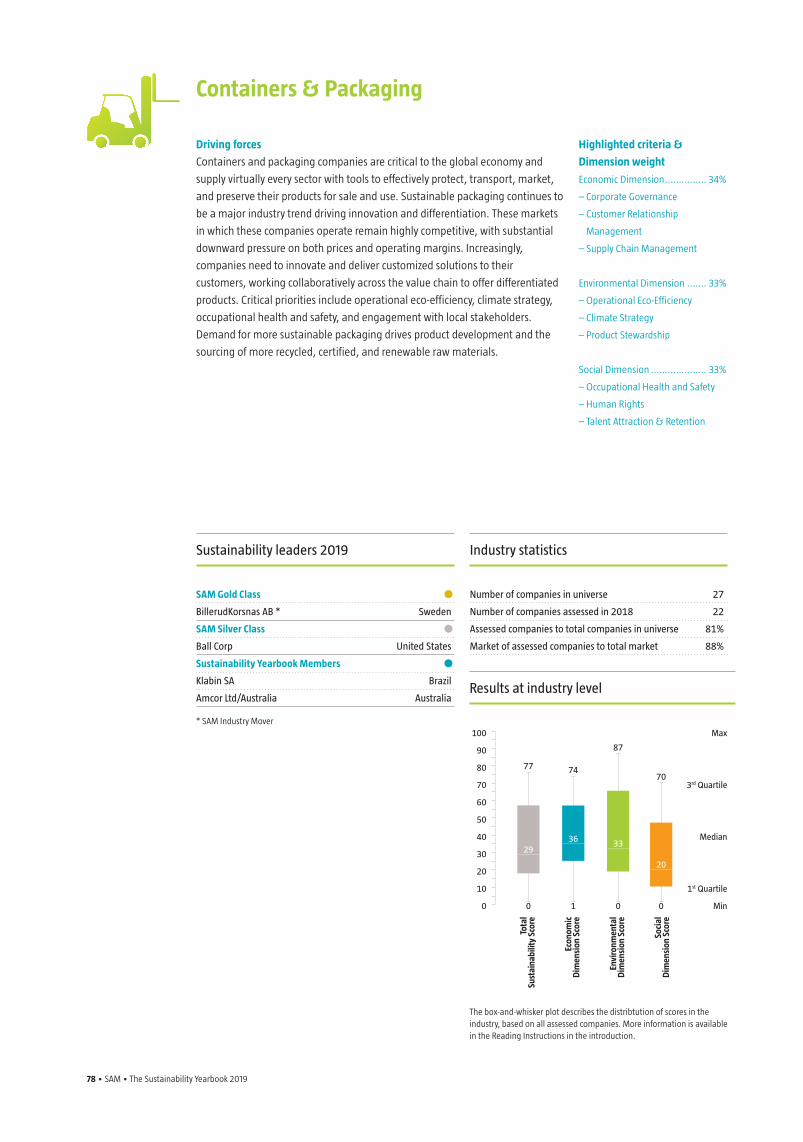
78 • SAM • The Sustainability Yearbook 2019 The Sustainability Yearbook 2019 • SAM • 79
Driving forces
Containers and packaging companies are critical to the global economy and
supply virtually every sector with tools to effectively protect, transport, market,
and preserve their products for sale and use. Sustainable packaging continues to
be a major industry trend driving innovation and differentiation. These markets
in which these companies operate remain highly competitive, with substantial
downward pressure on both prices and operating margins. Increasingly,
companies need to innovate and deliver customized solutions to their
customers, working collaboratively across the value chain to offer differentiated
products. Critical priorities include operational eco-efficiency, climate strategy,
occupational health and safety, and engagement with local stakeholders.
Demand for more sustainable packaging drives product development and the
sourcing of more recycled, certified, and renewable raw materials.
Containers & Packaging
Highlighted criteria &
Dimension weight
Economic Dimension ............... 34%
– Corporate Governance
– Customer Relationship
Management
– Supply Chain Management
Environmental Dimension ....... 33%
– Operational Eco-Efficiency
– Climate Strategy
– Product Stewardship
Social Dimension .................... 33%
– Occupational Health and Safety
– Human Rights
– Talent Attraction & Retention
Industry statistics
Number of companies in universe 27
Number of companies assessed in 2018 22
Assessed companies to total companies in universe 81%
Market of assessed companies to total market 88%
Sustainability leaders 2019
SAM Gold Class •BillerudKorsnas AB * Sweden
SAM Silver Class •Ball Corp United States
Sustainability Yearbook Members •Klabin SA Brazil
Amcor Ltd/Australia Australia
* SAM Industry Mover
The box-and-whisker plot describes the distribtution of scores in the industry, based on all assessed companies. More information is available in the Reading Instructions in the introduction.
Max
3rd Quartile
Median
1st Quartile
Min
77 74
2936 33
20
87
70
0 1 0 0
Tota
l Su
stai
nabi
lity
Scor
e
Econ
omic
D
imen
sion
Sco
re
Envi
ronm
enta
l D
imen
sion
Sco
re
Soci
al
Dim
ensi
on S
core
Results at industry level
100
90
80
70
60
50
40
30
20
10
0
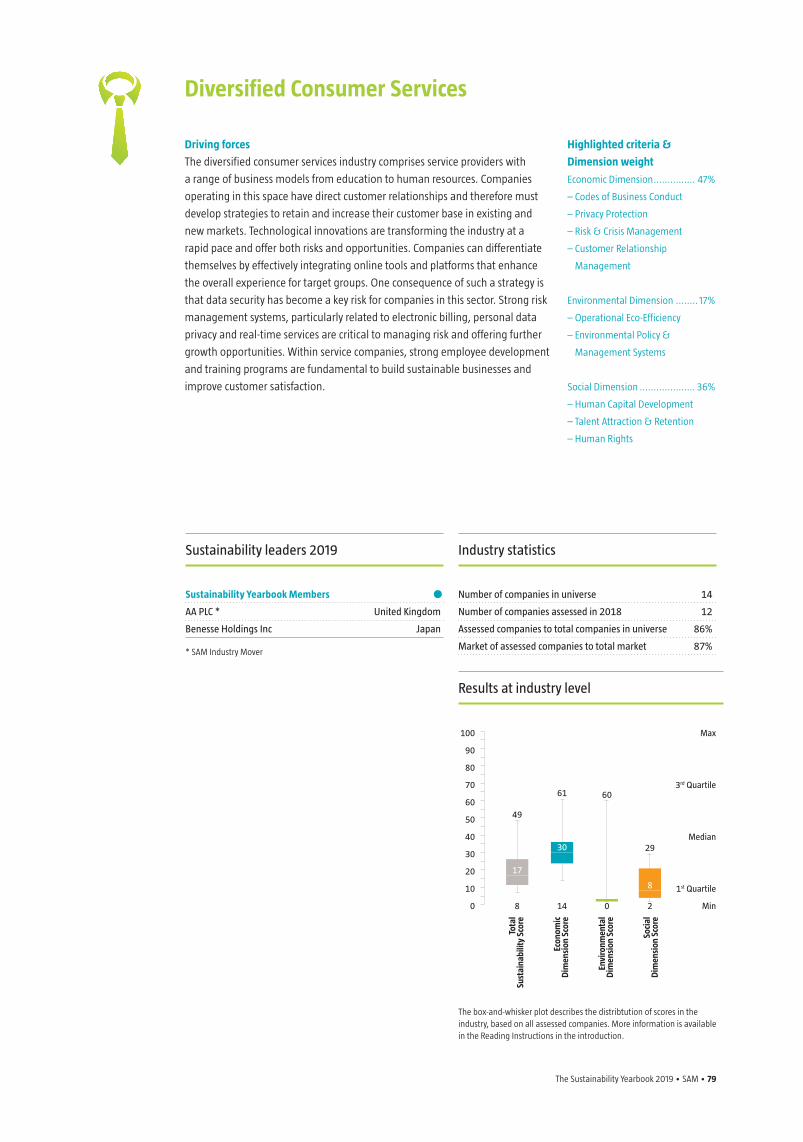
The Sustainability Yearbook 2019 • SAM • 79
Driving forces
The diversified consumer services industry comprises service providers with
a range of business models from education to human resources. Companies
operating in this space have direct customer relationships and therefore must
develop strategies to retain and increase their customer base in existing and
new markets. Technological innovations are transforming the industry at a
rapid pace and offer both risks and opportunities. Companies can differentiate
themselves by effectively integrating online tools and platforms that enhance
the overall experience for target groups. One consequence of such a strategy is
that data security has become a key risk for companies in this sector. Strong risk
management systems, particularly related to electronic billing, personal data
privacy and real-time services are critical to managing risk and offering further
growth opportunities. Within service companies, strong employee development
and training programs are fundamental to build sustainable businesses and
improve customer satisfaction.
Diversified Consumer Services
Highlighted criteria &
Dimension weight
Economic Dimension ............... 47%
– Codes of Business Conduct
– Privacy Protection
– Risk & Crisis Management
– Customer Relationship
Management
Environmental Dimension ........ 17%
– Operational Eco-Efficiency
– Environmental Policy &
Management Systems
Social Dimension .................... 36%
– Human Capital Development
– Talent Attraction & Retention
– Human Rights
Industry statistics
Number of companies in universe 14
Number of companies assessed in 2018 12
Assessed companies to total companies in universe 86%
Market of assessed companies to total market 87%
Sustainability leaders 2019
Sustainability Yearbook Members •AA PLC * United Kingdom
Benesse Holdings Inc Japan
* SAM Industry Mover
The box-and-whisker plot describes the distribtution of scores in the industry, based on all assessed companies. More information is available in the Reading Instructions in the introduction.
100
90
80
70
60
50
40
30
20
10
0
Max
3rd Quartile
Median
1st Quartile
Min
49
61
17
30
8
60
29
8 14 0 2
Tota
l Su
stai
nabi
lity
Scor
e
Econ
omic
D
imen
sion
Sco
re
Envi
ronm
enta
l D
imen
sion
Sco
re
Soci
al
Dim
ensi
on S
core
Results at industry level
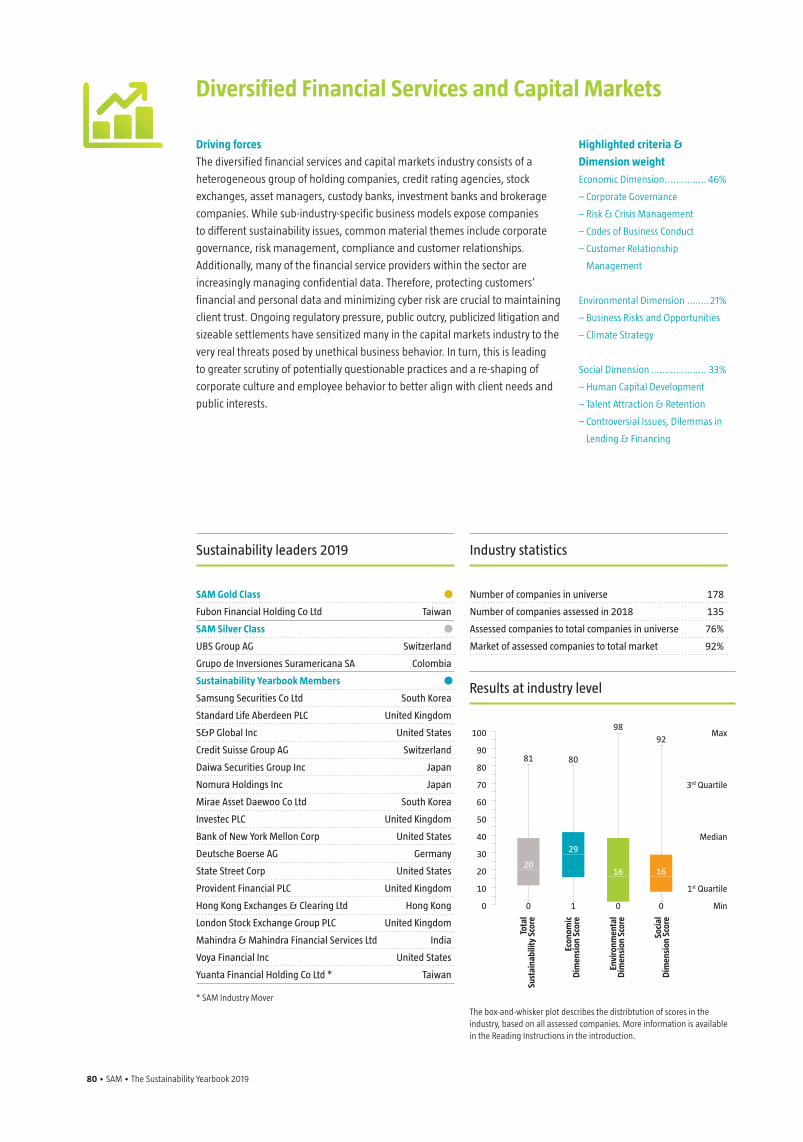
80 • SAM • The Sustainability Yearbook 2019 The Sustainability Yearbook 2019 • SAM • 81
Driving forces
The diversified financial services and capital markets industry consists of a
heterogeneous group of holding companies, credit rating agencies, stock
exchanges, asset managers, custody banks, investment banks and brokerage
companies. While sub-industry-specific business models expose companies
to different sustainability issues, common material themes include corporate
governance, risk management, compliance and customer relationships.
Additionally, many of the financial service providers within the sector are
increasingly managing confidential data. Therefore, protecting customers’
financial and personal data and minimizing cyber risk are crucial to maintaining
client trust. Ongoing regulatory pressure, public outcry, publicized litigation and
sizeable settlements have sensitized many in the capital markets industry to the
very real threats posed by unethical business behavior. In turn, this is leading
to greater scrutiny of potentially questionable practices and a re-shaping of
corporate culture and employee behavior to better align with client needs and
public interests.
Diversified Financial Services and Capital Markets
Highlighted criteria &
Dimension weight
Economic Dimension ............... 46%
– Corporate Governance
– Risk & Crisis Management
– Codes of Business Conduct
– Customer Relationship
Management
Environmental Dimension ........21%
– Business Risks and Opportunities
– Climate Strategy
Social Dimension .................... 33%
– Human Capital Development
– Talent Attraction & Retention
– Controversial Issues, Dilemmas in
Lending & Financing
Industry statistics
Number of companies in universe 178
Number of companies assessed in 2018 135
Assessed companies to total companies in universe 76%
Market of assessed companies to total market 92%
Sustainability leaders 2019
SAM Gold Class •Fubon Financial Holding Co Ltd Taiwan
SAM Silver Class •UBS Group AG Switzerland
Grupo de Inversiones Suramericana SA Colombia
Sustainability Yearbook Members •Samsung Securities Co Ltd South Korea
Standard Life Aberdeen PLC United Kingdom
S&P Global Inc United States
Credit Suisse Group AG Switzerland
Daiwa Securities Group Inc Japan
Nomura Holdings Inc Japan
Mirae Asset Daewoo Co Ltd South Korea
Investec PLC United Kingdom
Bank of New York Mellon Corp United States
Deutsche Boerse AG Germany
State Street Corp United States
Provident Financial PLC United Kingdom
Hong Kong Exchanges & Clearing Ltd Hong Kong
London Stock Exchange Group PLC United Kingdom
Mahindra & Mahindra Financial Services Ltd India
Voya Financial Inc United States
Yuanta Financial Holding Co Ltd * Taiwan
* SAM Industry Mover
The box-and-whisker plot describes the distribtution of scores in the industry, based on all assessed companies. More information is available in the Reading Instructions in the introduction.
Max
3rd Quartile
Median
1st Quartile
Min
81 80
20
29
16 16
9892
0 1 0 0
Tota
l Su
stai
nabi
lity
Scor
e
Econ
omic
D
imen
sion
Sco
re
Envi
ronm
enta
l D
imen
sion
Sco
re
Soci
al
Dim
ensi
on S
core
Results at industry level
100
90
80
70
60
50
40
30
20
10
0
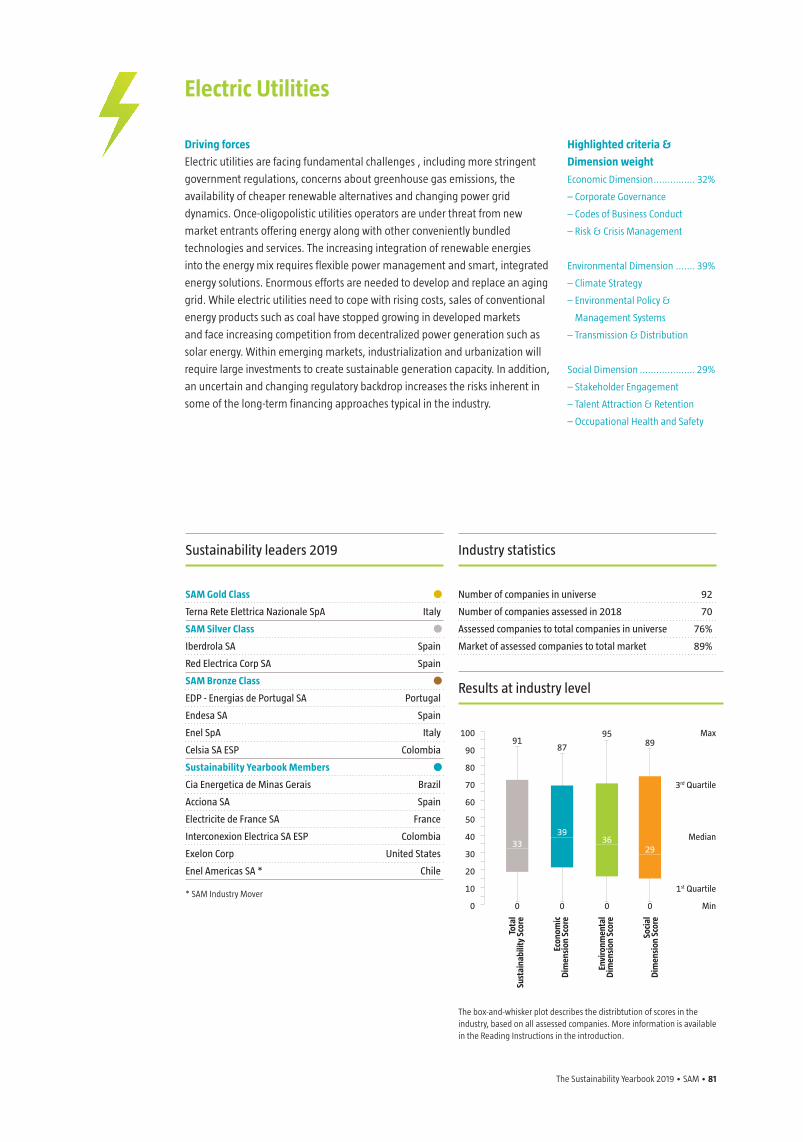
The Sustainability Yearbook 2019 • SAM • 81
Driving forces
Electric utilities are facing fundamental challenges , including more stringent
government regulations, concerns about greenhouse gas emissions, the
availability of cheaper renewable alternatives and changing power grid
dynamics. Once-oligopolistic utilities operators are under threat from new
market entrants offering energy along with other conveniently bundled
technologies and services. The increasing integration of renewable energies
into the energy mix requires flexible power management and smart, integrated
energy solutions. Enormous efforts are needed to develop and replace an aging
grid. While electric utilities need to cope with rising costs, sales of conventional
energy products such as coal have stopped growing in developed markets
and face increasing competition from decentralized power generation such as
solar energy. Within emerging markets, industrialization and urbanization will
require large investments to create sustainable generation capacity. In addition,
an uncertain and changing regulatory backdrop increases the risks inherent in
some of the long-term financing approaches typical in the industry.
Electric Utilities
Highlighted criteria &
Dimension weight
Economic Dimension ............... 32%
– Corporate Governance
– Codes of Business Conduct
– Risk & Crisis Management
Environmental Dimension ....... 39%
– Climate Strategy
– Environmental Policy &
Management Systems
– Transmission & Distribution
Social Dimension .................... 29%
– Stakeholder Engagement
– Talent Attraction & Retention
– Occupational Health and Safety
Industry statistics
Number of companies in universe 92
Number of companies assessed in 2018 70
Assessed companies to total companies in universe 76%
Market of assessed companies to total market 89%
Sustainability leaders 2019
SAM Gold Class •Terna Rete Elettrica Nazionale SpA Italy
SAM Silver Class •Iberdrola SA Spain
Red Electrica Corp SA Spain
SAM Bronze Class •EDP - Energias de Portugal SA Portugal
Endesa SA Spain
Enel SpA Italy
Celsia SA ESP Colombia
Sustainability Yearbook Members •Cia Energetica de Minas Gerais Brazil
Acciona SA Spain
Electricite de France SA France
Interconexion Electrica SA ESP Colombia
Exelon Corp United States
Enel Americas SA * Chile
* SAM Industry Mover
The box-and-whisker plot describes the distribtution of scores in the industry, based on all assessed companies. More information is available in the Reading Instructions in the introduction.
100
90
80
70
60
50
40
30
20
10
0
Max
3rd Quartile
Median
1st Quartile
Min
9187
3339
3629
9589
0 0 0 0
Tota
l Su
stai
nabi
lity
Scor
e
Econ
omic
D
imen
sion
Sco
re
Envi
ronm
enta
l D
imen
sion
Sco
re
Soci
al
Dim
ensi
on S
core
Results at industry level
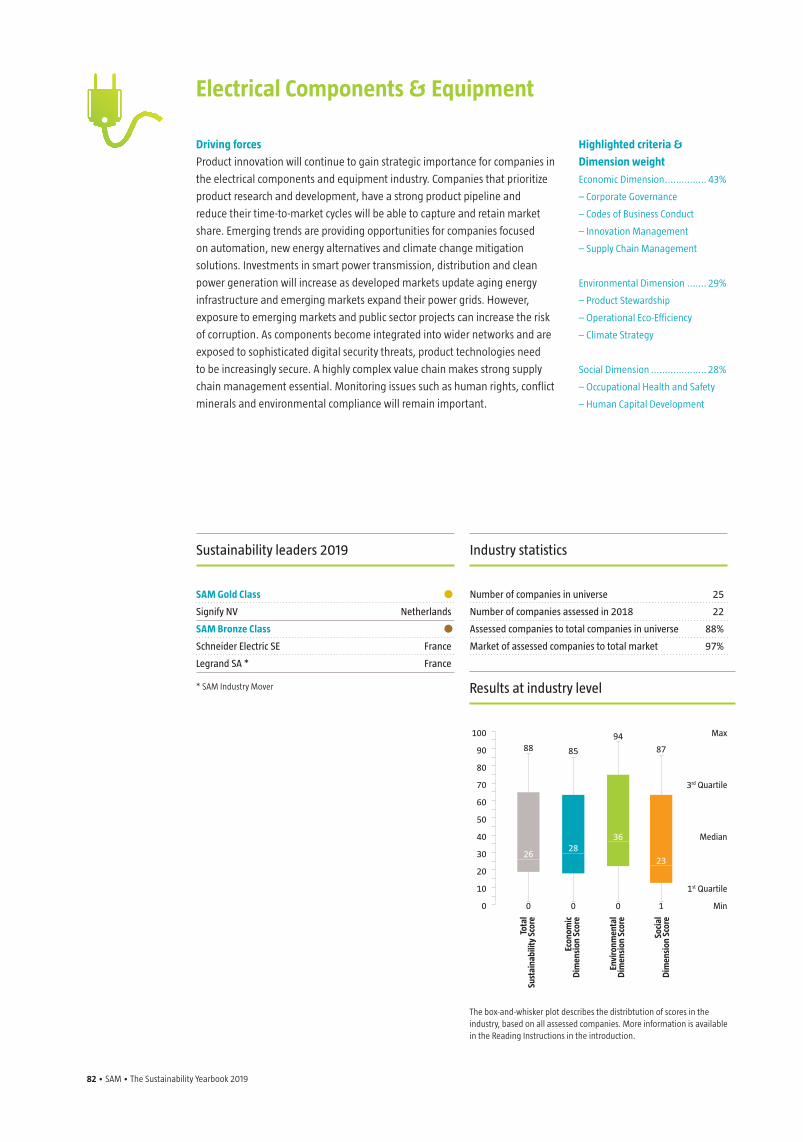
82 • SAM • The Sustainability Yearbook 2019 The Sustainability Yearbook 2019 • SAM • 83
Driving forces
Product innovation will continue to gain strategic importance for companies in
the electrical components and equipment industry. Companies that prioritize
product research and development, have a strong product pipeline and
reduce their time-to-market cycles will be able to capture and retain market
share. Emerging trends are providing opportunities for companies focused
on automation, new energy alternatives and climate change mitigation
solutions. Investments in smart power transmission, distribution and clean
power generation will increase as developed markets update aging energy
infrastructure and emerging markets expand their power grids. However,
exposure to emerging markets and public sector projects can increase the risk
of corruption. As components become integrated into wider networks and are
exposed to sophisticated digital security threats, product technologies need
to be increasingly secure. A highly complex value chain makes strong supply
chain management essential. Monitoring issues such as human rights, conflict
minerals and environmental compliance will remain important.
Electrical Components & Equipment
Highlighted criteria &
Dimension weight
Economic Dimension ............... 43%
– Corporate Governance
– Codes of Business Conduct
– Innovation Management
– Supply Chain Management
Environmental Dimension ....... 29%
– Product Stewardship
– Operational Eco-Efficiency
– Climate Strategy
Social Dimension .................... 28%
– Occupational Health and Safety
– Human Capital Development
Industry statistics
Number of companies in universe 25
Number of companies assessed in 2018 22
Assessed companies to total companies in universe 88%
Market of assessed companies to total market 97%
Sustainability leaders 2019
SAM Gold Class •Signify NV Netherlands
SAM Bronze Class •Schneider Electric SE France
Legrand SA * France
* SAM Industry Mover
The box-and-whisker plot describes the distribtution of scores in the industry, based on all assessed companies. More information is available in the Reading Instructions in the introduction.
Max
3rd Quartile
Median
1st Quartile
Min
88 85
2628
36
23
94
87
0 0 0 1
Tota
l Su
stai
nabi
lity
Scor
e
Econ
omic
D
imen
sion
Sco
re
Envi
ronm
enta
l D
imen
sion
Sco
re
Soci
al
Dim
ensi
on S
core
Results at industry level
100
90
80
70
60
50
40
30
20
10
0
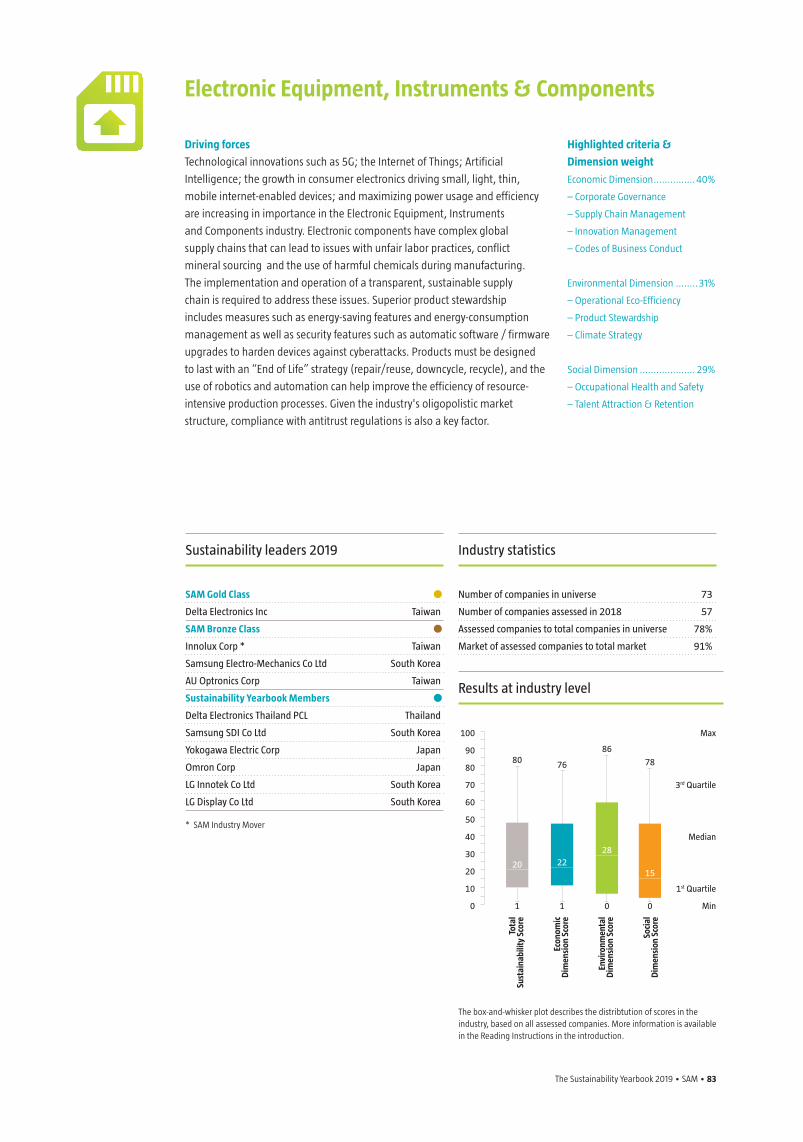
The Sustainability Yearbook 2019 • SAM • 83
Driving forces
Technological innovations such as 5G; the Internet of Things; Artificial
Intelligence; the growth in consumer electronics driving small, light, thin,
mobile internet-enabled devices; and maximizing power usage and efficiency
are increasing in importance in the Electronic Equipment, Instruments
and Components industry. Electronic components have complex global
supply chains that can lead to issues with unfair labor practices, conflict
mineral sourcing and the use of harmful chemicals during manufacturing.
The implementation and operation of a transparent, sustainable supply
chain is required to address these issues. Superior product stewardship
includes measures such as energy-saving features and energy-consumption
management as well as security features such as automatic software / firmware
upgrades to harden devices against cyberattacks. Products must be designed
to last with an “End of Life” strategy (repair/reuse, downcycle, recycle), and the
use of robotics and automation can help improve the efficiency of resource-
intensive production processes. Given the industry's oligopolistic market
structure, compliance with antitrust regulations is also a key factor.
Electronic Equipment, Instruments & Components
Highlighted criteria &
Dimension weight
Economic Dimension ............... 40%
– Corporate Governance
– Supply Chain Management
– Innovation Management
– Codes of Business Conduct
Environmental Dimension ........31%
– Operational Eco-Efficiency
– Product Stewardship
– Climate Strategy
Social Dimension .................... 29%
– Occupational Health and Safety
– Talent Attraction & Retention
Industry statistics
Number of companies in universe 73
Number of companies assessed in 2018 57
Assessed companies to total companies in universe 78%
Market of assessed companies to total market 91%
Sustainability leaders 2019
SAM Gold Class •Delta Electronics Inc Taiwan
SAM Bronze Class •Innolux Corp * Taiwan
Samsung Electro-Mechanics Co Ltd South Korea
AU Optronics Corp Taiwan
Sustainability Yearbook Members •Delta Electronics Thailand PCL Thailand
Samsung SDI Co Ltd South Korea
Yokogawa Electric Corp Japan
Omron Corp Japan
LG Innotek Co Ltd South Korea
LG Display Co Ltd South Korea
* SAM Industry Mover
The box-and-whisker plot describes the distribtution of scores in the industry, based on all assessed companies. More information is available in the Reading Instructions in the introduction.
100
90
80
70
60
50
40
30
20
10
0
Max
3rd Quartile
Median
1st Quartile
Min
80 76
20 2228
15
86
78
1 1 0 0
Tota
l Su
stai
nabi
lity
Scor
e
Econ
omic
D
imen
sion
Sco
re
Envi
ronm
enta
l D
imen
sion
Sco
re
Soci
al
Dim
ensi
on S
core
Results at industry level
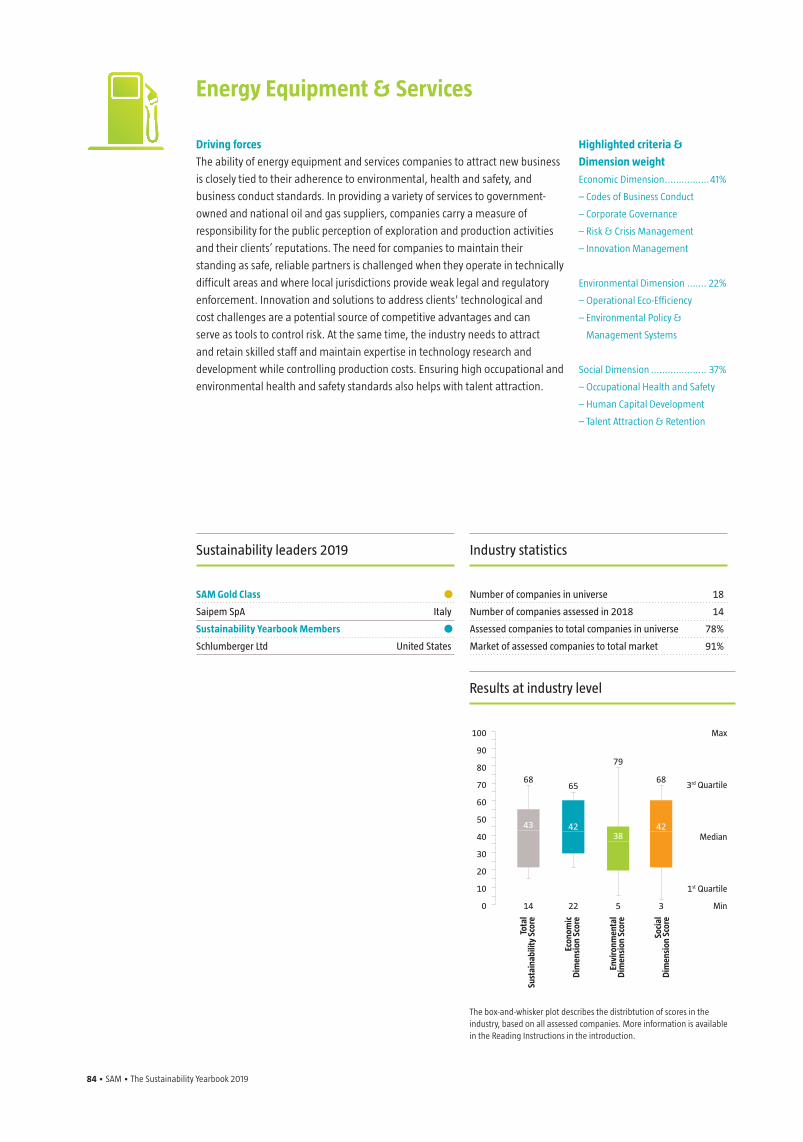
84 • SAM • The Sustainability Yearbook 2019 The Sustainability Yearbook 2019 • SAM • 85
Driving forces
The ability of energy equipment and services companies to attract new business
is closely tied to their adherence to environmental, health and safety, and
business conduct standards. In providing a variety of services to government-
owned and national oil and gas suppliers, companies carry a measure of
responsibility for the public perception of exploration and production activities
and their clients’ reputations. The need for companies to maintain their
standing as safe, reliable partners is challenged when they operate in technically
difficult areas and where local jurisdictions provide weak legal and regulatory
enforcement. Innovation and solutions to address clients' technological and
cost challenges are a potential source of competitive advantages and can
serve as tools to control risk. At the same time, the industry needs to attract
and retain skilled staff and maintain expertise in technology research and
development while controlling production costs. Ensuring high occupational and
environmental health and safety standards also helps with talent attraction.
Energy Equipment & Services
Highlighted criteria &
Dimension weight
Economic Dimension ................41%
– Codes of Business Conduct
– Corporate Governance
– Risk & Crisis Management
– Innovation Management
Environmental Dimension ....... 22%
– Operational Eco-Efficiency
– Environmental Policy &
Management Systems
Social Dimension .................... 37%
– Occupational Health and Safety
– Human Capital Development
– Talent Attraction & Retention
Industry statistics
Number of companies in universe 18
Number of companies assessed in 2018 14
Assessed companies to total companies in universe 78%
Market of assessed companies to total market 91%
Sustainability leaders 2019
SAM Gold Class •Saipem SpA Italy
Sustainability Yearbook Members •Schlumberger Ltd United States
The box-and-whisker plot describes the distribtution of scores in the industry, based on all assessed companies. More information is available in the Reading Instructions in the introduction.
Max
3rd Quartile
Median
1st Quartile
Min
6865
43 4238
42
79
68
14 22 5 3
Tota
l Su
stai
nabi
lity
Scor
e
Econ
omic
D
imen
sion
Sco
re
Envi
ronm
enta
l D
imen
sion
Sco
re
Soci
al
Dim
ensi
on S
core
Results at industry level
100
90
80
70
60
50
40
30
20
10
0
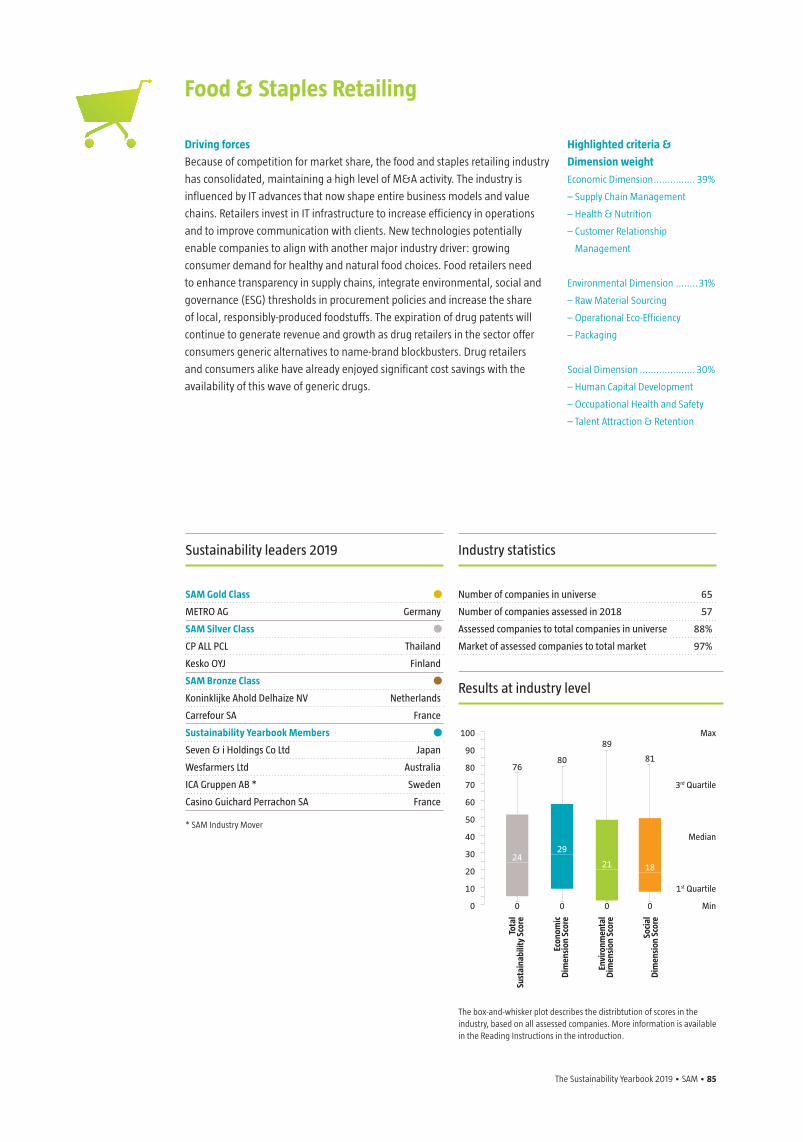
The Sustainability Yearbook 2019 • SAM • 85
Driving forces
Because of competition for market share, the food and staples retailing industry
has consolidated, maintaining a high level of M&A activity. The industry is
influenced by IT advances that now shape entire business models and value
chains. Retailers invest in IT infrastructure to increase efficiency in operations
and to improve communication with clients. New technologies potentially
enable companies to align with another major industry driver: growing
consumer demand for healthy and natural food choices. Food retailers need
to enhance transparency in supply chains, integrate environmental, social and
governance (ESG) thresholds in procurement policies and increase the share
of local, responsibly-produced foodstuffs. The expiration of drug patents will
continue to generate revenue and growth as drug retailers in the sector offer
consumers generic alternatives to name-brand blockbusters. Drug retailers
and consumers alike have already enjoyed significant cost savings with the
availability of this wave of generic drugs.
Food & Staples Retailing
Highlighted criteria &
Dimension weight
Economic Dimension ............... 39%
– Supply Chain Management
– Health & Nutrition
– Customer Relationship
Management
Environmental Dimension ........31%
– Raw Material Sourcing
– Operational Eco-Efficiency
– Packaging
Social Dimension .................... 30%
– Human Capital Development
– Occupational Health and Safety
– Talent Attraction & Retention
Industry statistics
Number of companies in universe 65
Number of companies assessed in 2018 57
Assessed companies to total companies in universe 88%
Market of assessed companies to total market 97%
Sustainability leaders 2019
SAM Gold Class •METRO AG Germany
SAM Silver Class •CP ALL PCL Thailand
Kesko OYJ Finland
SAM Bronze Class •Koninklijke Ahold Delhaize NV Netherlands
Carrefour SA France
Sustainability Yearbook Members •Seven & i Holdings Co Ltd Japan
Wesfarmers Ltd Australia
ICA Gruppen AB * Sweden
Casino Guichard Perrachon SA France
* SAM Industry Mover
The box-and-whisker plot describes the distribtution of scores in the industry, based on all assessed companies. More information is available in the Reading Instructions in the introduction.
100
90
80
70
60
50
40
30
20
10
0
Max
3rd Quartile
Median
1st Quartile
Min
7680
2429
21 18
89
81
0 0 0 0
Tota
l Su
stai
nabi
lity
Scor
e
Econ
omic
D
imen
sion
Sco
re
Envi
ronm
enta
l D
imen
sion
Sco
re
Soci
al
Dim
ensi
on S
core
Results at industry level
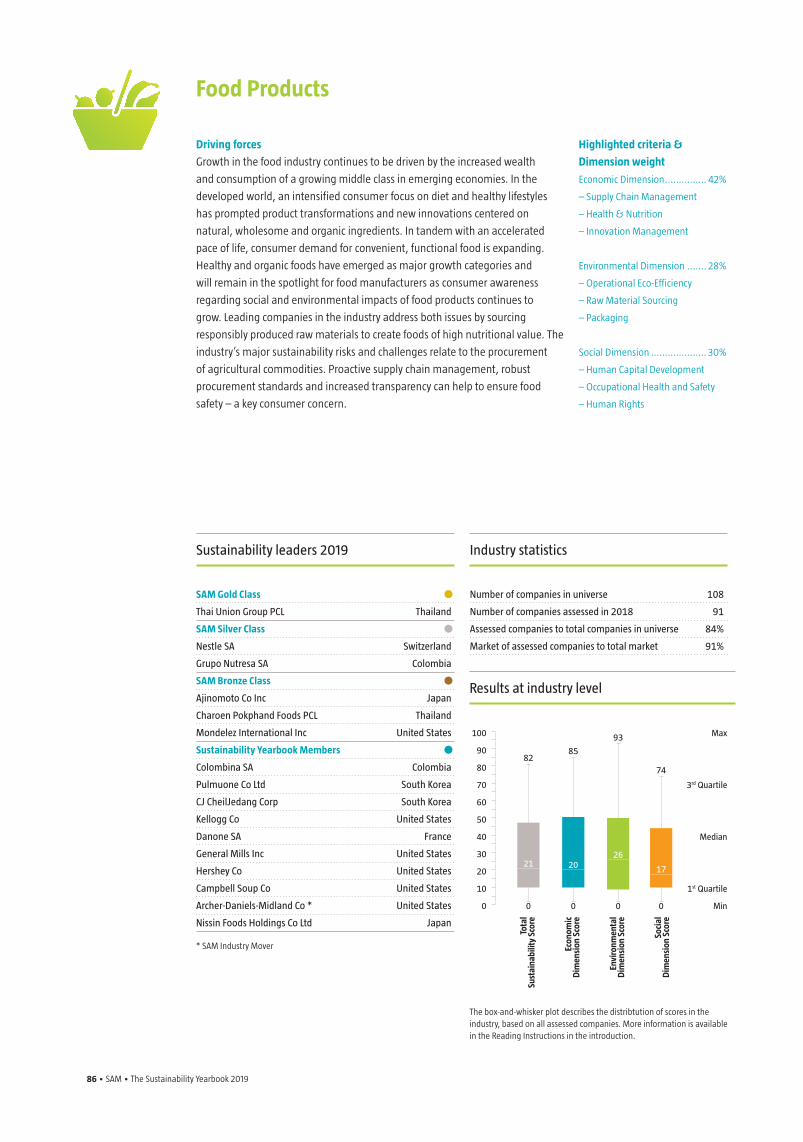
86 • SAM • The Sustainability Yearbook 2019 The Sustainability Yearbook 2019 • SAM • 87
Driving forces
Growth in the food industry continues to be driven by the increased wealth
and consumption of a growing middle class in emerging economies. In the
developed world, an intensified consumer focus on diet and healthy lifestyles
has prompted product transformations and new innovations centered on
natural, wholesome and organic ingredients. In tandem with an accelerated
pace of life, consumer demand for convenient, functional food is expanding.
Healthy and organic foods have emerged as major growth categories and
will remain in the spotlight for food manufacturers as consumer awareness
regarding social and environmental impacts of food products continues to
grow. Leading companies in the industry address both issues by sourcing
responsibly produced raw materials to create foods of high nutritional value. The
industry’s major sustainability risks and challenges relate to the procurement
of agricultural commodities. Proactive supply chain management, robust
procurement standards and increased transparency can help to ensure food
safety – a key consumer concern.
Food Products
Highlighted criteria &
Dimension weight
Economic Dimension ............... 42%
– Supply Chain Management
– Health & Nutrition
– Innovation Management
Environmental Dimension ....... 28%
– Operational Eco-Efficiency
– Raw Material Sourcing
– Packaging
Social Dimension .................... 30%
– Human Capital Development
– Occupational Health and Safety
– Human Rights
Industry statistics
Number of companies in universe 108
Number of companies assessed in 2018 91
Assessed companies to total companies in universe 84%
Market of assessed companies to total market 91%
Sustainability leaders 2019
SAM Gold Class •Thai Union Group PCL Thailand
SAM Silver Class •Nestle SA Switzerland
Grupo Nutresa SA Colombia
SAM Bronze Class •Ajinomoto Co Inc Japan
Charoen Pokphand Foods PCL Thailand
Mondelez International Inc United States
Sustainability Yearbook Members •Colombina SA Colombia
Pulmuone Co Ltd South Korea
CJ CheilJedang Corp South Korea
Kellogg Co United States
Danone SA France
General Mills Inc United States
Hershey Co United States
Campbell Soup Co United States
Archer-Daniels-Midland Co * United States
Nissin Foods Holdings Co Ltd Japan
* SAM Industry Mover
The box-and-whisker plot describes the distribtution of scores in the industry, based on all assessed companies. More information is available in the Reading Instructions in the introduction.
Max
3rd Quartile
Median
1st Quartile
Min
8285
21 2026
17
93
74
0 0 0 0
Tota
l Su
stai
nabi
lity
Scor
e
Econ
omic
D
imen
sion
Sco
re
Envi
ronm
enta
l D
imen
sion
Sco
re
Soci
al
Dim
ensi
on S
core
Results at industry level
100
90
80
70
60
50
40
30
20
10
0
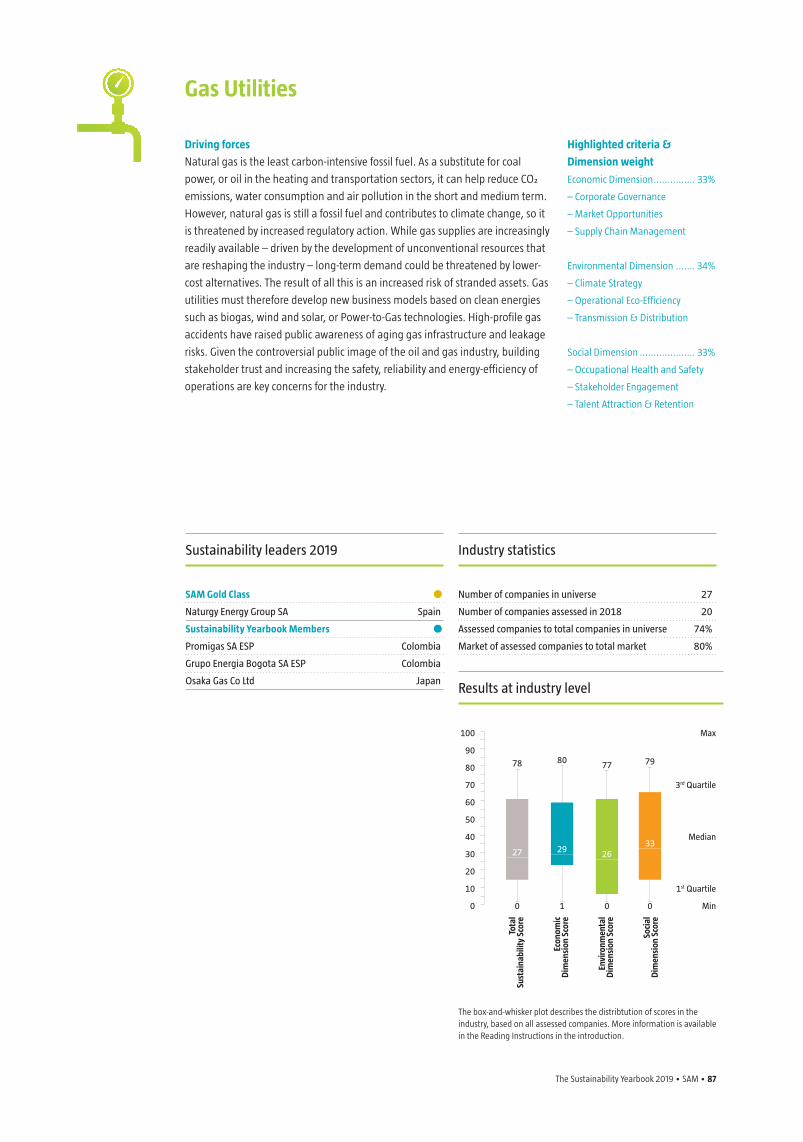
The Sustainability Yearbook 2019 • SAM • 87
Driving forces
Natural gas is the least carbon-intensive fossil fuel. As a substitute for coal
power, or oil in the heating and transportation sectors, it can help reduce CO₂
emissions, water consumption and air pollution in the short and medium term.
However, natural gas is still a fossil fuel and contributes to climate change, so it
is threatened by increased regulatory action. While gas supplies are increasingly
readily available – driven by the development of unconventional resources that
are reshaping the industry – long-term demand could be threatened by lower-
cost alternatives. The result of all this is an increased risk of stranded assets. Gas
utilities must therefore develop new business models based on clean energies
such as biogas, wind and solar, or Power-to-Gas technologies. High-profile gas
accidents have raised public awareness of aging gas infrastructure and leakage
risks. Given the controversial public image of the oil and gas industry, building
stakeholder trust and increasing the safety, reliability and energy-efficiency of
operations are key concerns for the industry.
Gas Utilities
Highlighted criteria &
Dimension weight
Economic Dimension ............... 33%
– Corporate Governance
– Market Opportunities
– Supply Chain Management
Environmental Dimension ....... 34%
– Climate Strategy
– Operational Eco-Efficiency
– Transmission & Distribution
Social Dimension .................... 33%
– Occupational Health and Safety
– Stakeholder Engagement
– Talent Attraction & Retention
Industry statistics
Number of companies in universe 27
Number of companies assessed in 2018 20
Assessed companies to total companies in universe 74%
Market of assessed companies to total market 80%
Sustainability leaders 2019
SAM Gold Class •Naturgy Energy Group SA Spain
Sustainability Yearbook Members •Promigas SA ESP Colombia
Grupo Energia Bogota SA ESP Colombia
Osaka Gas Co Ltd Japan
The box-and-whisker plot describes the distribtution of scores in the industry, based on all assessed companies. More information is available in the Reading Instructions in the introduction.
100
90
80
70
60
50
40
30
20
10
0
Max
3rd Quartile
Median
1st Quartile
Min
78 80
27 29 2633
77 79
0 1 0 0
Tota
l Su
stai
nabi
lity
Scor
e
Econ
omic
D
imen
sion
Sco
re
Envi
ronm
enta
l D
imen
sion
Sco
re
Soci
al
Dim
ensi
on S
core
Results at industry level
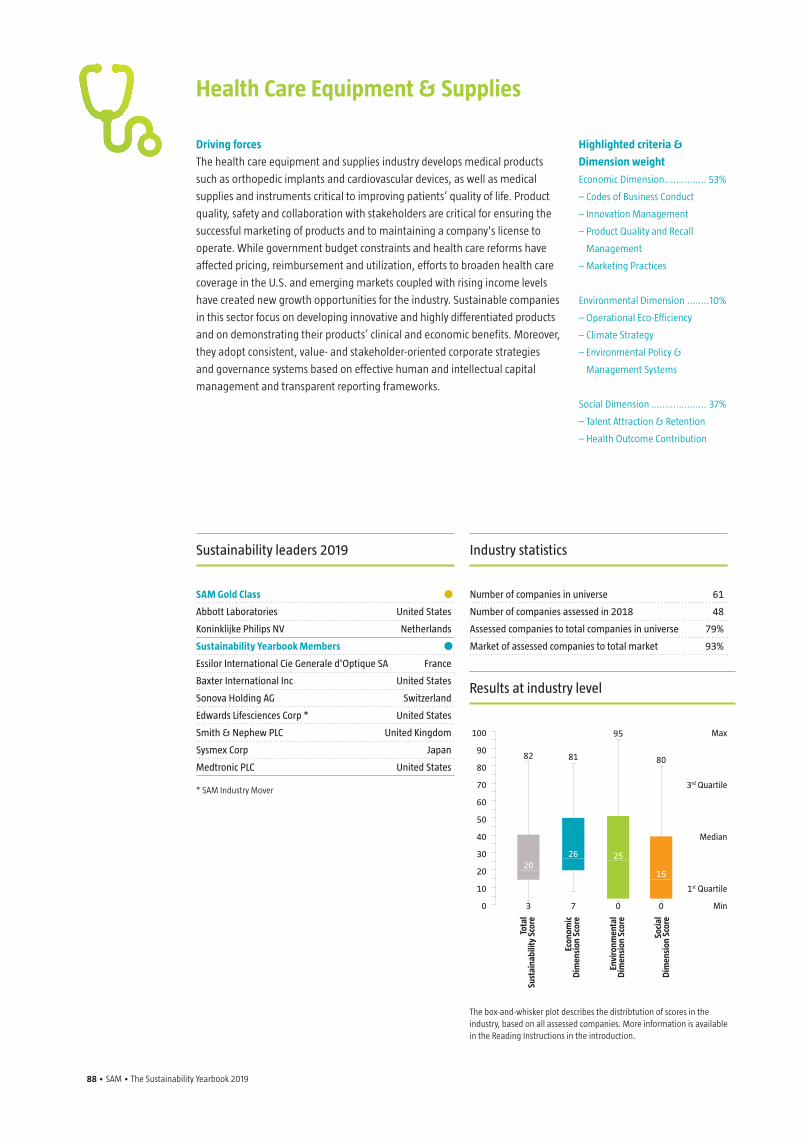
88 • SAM • The Sustainability Yearbook 2019 The Sustainability Yearbook 2019 • SAM • 89
Driving forces
The health care equipment and supplies industry develops medical products
such as orthopedic implants and cardiovascular devices, as well as medical
supplies and instruments critical to improving patients’ quality of life. Product
quality, safety and collaboration with stakeholders are critical for ensuring the
successful marketing of products and to maintaining a company's license to
operate. While government budget constraints and health care reforms have
affected pricing, reimbursement and utilization, efforts to broaden health care
coverage in the U.S. and emerging markets coupled with rising income levels
have created new growth opportunities for the industry. Sustainable companies
in this sector focus on developing innovative and highly differentiated products
and on demonstrating their products’ clinical and economic benefits. Moreover,
they adopt consistent, value- and stakeholder-oriented corporate strategies
and governance systems based on effective human and intellectual capital
management and transparent reporting frameworks.
Health Care Equipment & Supplies
Highlighted criteria &
Dimension weight
Economic Dimension ............... 53%
– Codes of Business Conduct
– Innovation Management
– Product Quality and Recall
Management
– Marketing Practices
Environmental Dimension ........10%
– Operational Eco-Efficiency
– Climate Strategy
– Environmental Policy &
Management Systems
Social Dimension .................... 37%
– Talent Attraction & Retention
– Health Outcome Contribution
Industry statistics
Number of companies in universe 61
Number of companies assessed in 2018 48
Assessed companies to total companies in universe 79%
Market of assessed companies to total market 93%
Sustainability leaders 2019
SAM Gold Class •Abbott Laboratories United States
Koninklijke Philips NV Netherlands
Sustainability Yearbook Members •Essilor International Cie Generale d'Optique SA France
Baxter International Inc United States
Sonova Holding AG Switzerland
Edwards Lifesciences Corp * United States
Smith & Nephew PLC United Kingdom
Sysmex Corp Japan
Medtronic PLC United States
* SAM Industry Mover
The box-and-whisker plot describes the distribtution of scores in the industry, based on all assessed companies. More information is available in the Reading Instructions in the introduction.
Max
3rd Quartile
Median
1st Quartile
Min
82 81
2026 25
15
95
80
3 7 0 0
Tota
l Su
stai
nabi
lity
Scor
e
Econ
omic
D
imen
sion
Sco
re
Envi
ronm
enta
l D
imen
sion
Sco
re
Soci
al
Dim
ensi
on S
core
Results at industry level
100
90
80
70
60
50
40
30
20
10
0
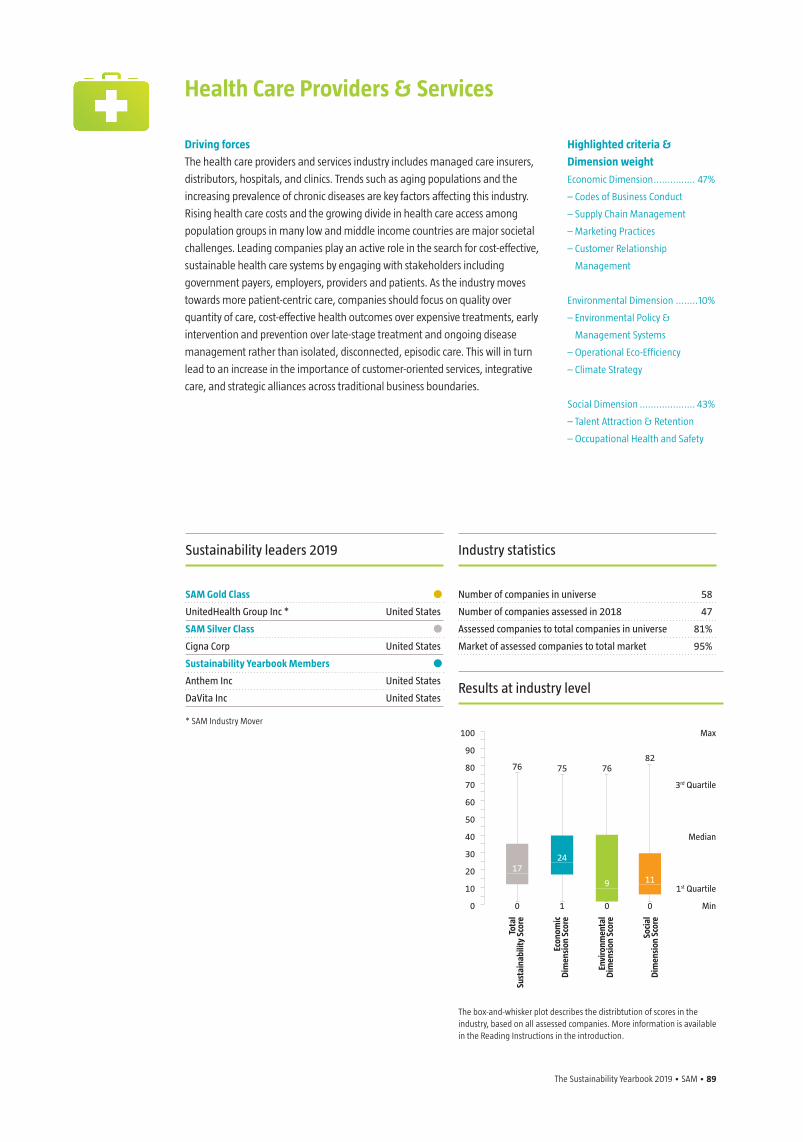
The Sustainability Yearbook 2019 • SAM • 89
Driving forces
The health care providers and services industry includes managed care insurers,
distributors, hospitals, and clinics. Trends such as aging populations and the
increasing prevalence of chronic diseases are key factors affecting this industry.
Rising health care costs and the growing divide in health care access among
population groups in many low and middle income countries are major societal
challenges. Leading companies play an active role in the search for cost-effective,
sustainable health care systems by engaging with stakeholders including
government payers, employers, providers and patients. As the industry moves
towards more patient-centric care, companies should focus on quality over
quantity of care, cost-effective health outcomes over expensive treatments, early
intervention and prevention over late-stage treatment and ongoing disease
management rather than isolated, disconnected, episodic care. This will in turn
lead to an increase in the importance of customer-oriented services, integrative
care, and strategic alliances across traditional business boundaries.
Health Care Providers & Services
Highlighted criteria &
Dimension weight
Economic Dimension ............... 47%
– Codes of Business Conduct
– Supply Chain Management
– Marketing Practices
– Customer Relationship
Management
Environmental Dimension ........10%
– Environmental Policy &
Management Systems
– Operational Eco-Efficiency
– Climate Strategy
Social Dimension .................... 43%
– Talent Attraction & Retention
– Occupational Health and Safety
Industry statistics
Number of companies in universe 58
Number of companies assessed in 2018 47
Assessed companies to total companies in universe 81%
Market of assessed companies to total market 95%
Sustainability leaders 2019
SAM Gold Class •UnitedHealth Group Inc * United States
SAM Silver Class •Cigna Corp United States
Sustainability Yearbook Members •Anthem Inc United States
DaVita Inc United States
* SAM Industry Mover
The box-and-whisker plot describes the distribtution of scores in the industry, based on all assessed companies. More information is available in the Reading Instructions in the introduction.
100
90
80
70
60
50
40
30
20
10
0
Max
3rd Quartile
Median
1st Quartile
Min
76 75
1724
9 11
7682
0 1 0 0
Tota
l Su
stai
nabi
lity
Scor
e
Econ
omic
D
imen
sion
Sco
re
Envi
ronm
enta
l D
imen
sion
Sco
re
Soci
al
Dim
ensi
on S
core
Results at industry level
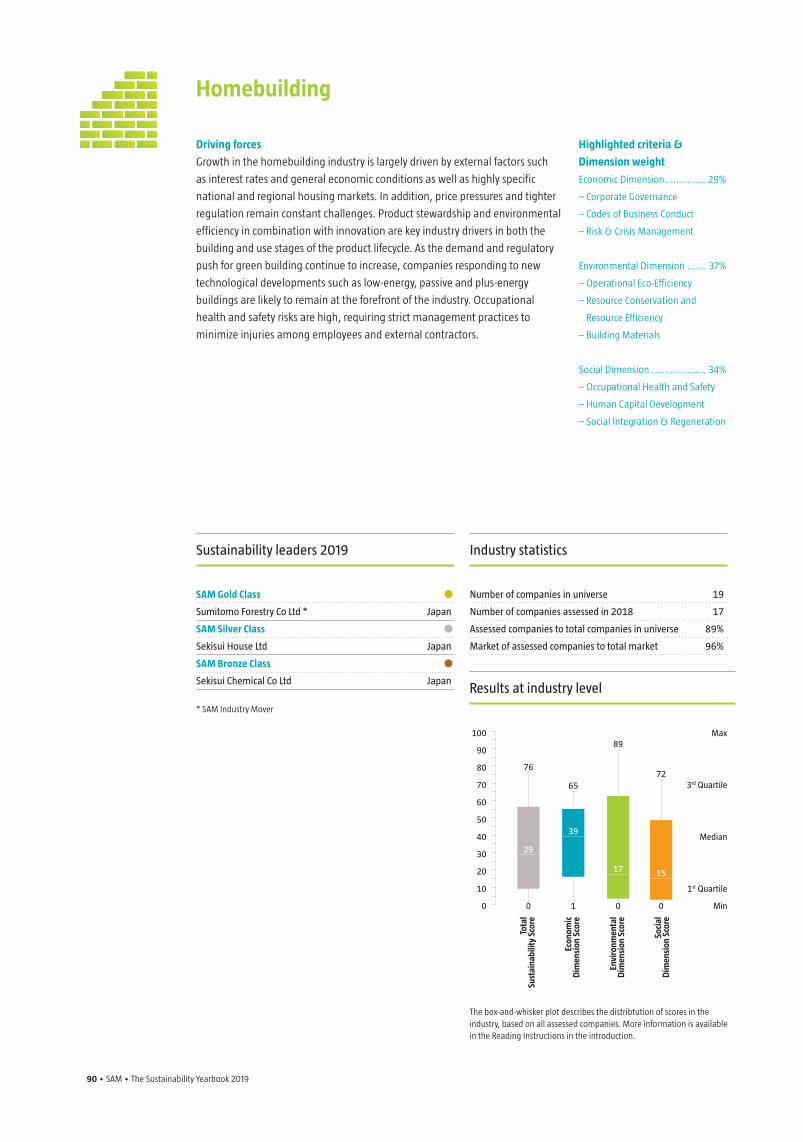
90 • SAM • The Sustainability Yearbook 2019 The Sustainability Yearbook 2019 • SAM • 91
Driving forces
Growth in the homebuilding industry is largely driven by external factors such
as interest rates and general economic conditions as well as highly specific
national and regional housing markets. In addition, price pressures and tighter
regulation remain constant challenges. Product stewardship and environmental
efficiency in combination with innovation are key industry drivers in both the
building and use stages of the product lifecycle. As the demand and regulatory
push for green building continue to increase, companies responding to new
technological developments such as low-energy, passive and plus-energy
buildings are likely to remain at the forefront of the industry. Occupational
health and safety risks are high, requiring strict management practices to
minimize injuries among employees and external contractors.
Homebuilding
Highlighted criteria &
Dimension weight
Economic Dimension ............... 29%
– Corporate Governance
– Codes of Business Conduct
– Risk & Crisis Management
Environmental Dimension ....... 37%
– Operational Eco-Efficiency
– Resource Conservation and
Resource Efficiency
– Building Materials
Social Dimension .................... 34%
– Occupational Health and Safety
– Human Capital Development
– Social Integration & Regeneration
Industry statistics
Number of companies in universe 19
Number of companies assessed in 2018 17
Assessed companies to total companies in universe 89%
Market of assessed companies to total market 96%
Sustainability leaders 2019
SAM Gold Class •Sumitomo Forestry Co Ltd * Japan
SAM Silver Class •Sekisui House Ltd Japan
SAM Bronze Class •Sekisui Chemical Co Ltd Japan
* SAM Industry Mover
The box-and-whisker plot describes the distribtution of scores in the industry, based on all assessed companies. More information is available in the Reading Instructions in the introduction.
Max
3rd Quartile
Median
1st Quartile
Min
76
65
29
39
17 15
89
72
0 1 0 0
Tota
l Su
stai
nabi
lity
Scor
e
Econ
omic
D
imen
sion
Sco
re
Envi
ronm
enta
l D
imen
sion
Sco
re
Soci
al
Dim
ensi
on S
core
Results at industry level
100
90
80
70
60
50
40
30
20
10
0
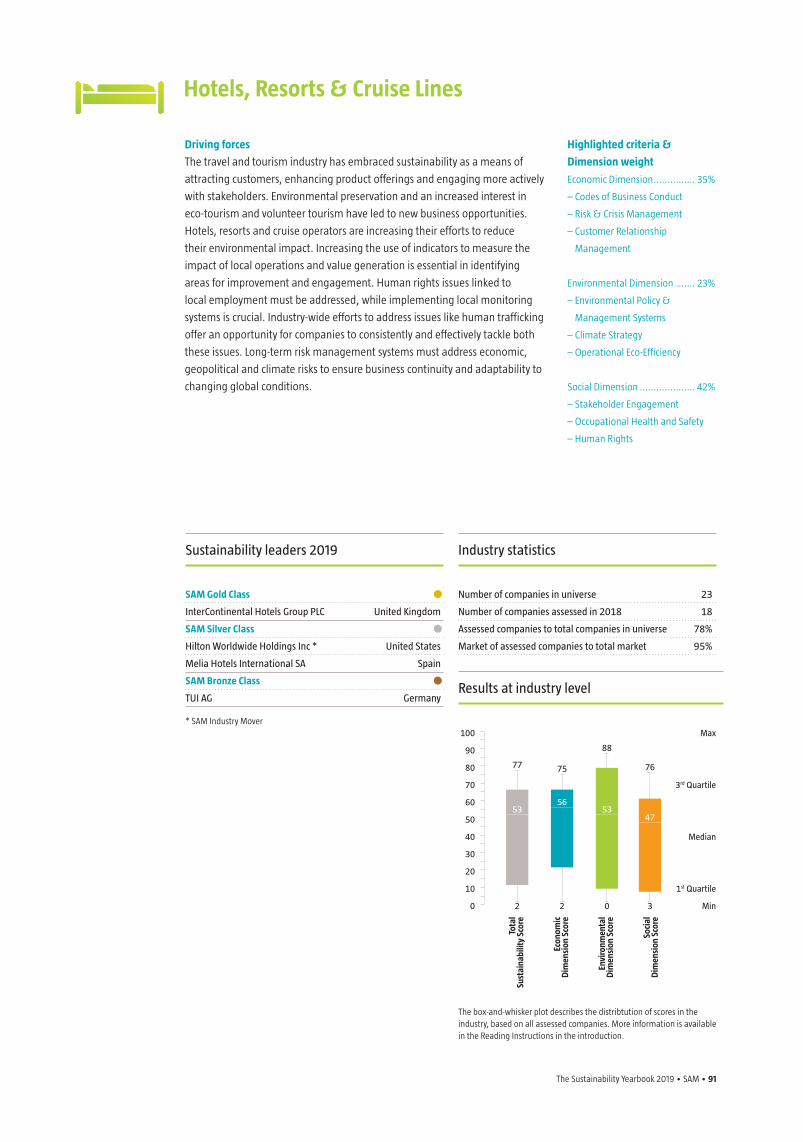
The Sustainability Yearbook 2019 • SAM • 91
Driving forces
The travel and tourism industry has embraced sustainability as a means of
attracting customers, enhancing product offerings and engaging more actively
with stakeholders. Environmental preservation and an increased interest in
eco-tourism and volunteer tourism have led to new business opportunities.
Hotels, resorts and cruise operators are increasing their efforts to reduce
their environmental impact. Increasing the use of indicators to measure the
impact of local operations and value generation is essential in identifying
areas for improvement and engagement. Human rights issues linked to
local employment must be addressed, while implementing local monitoring
systems is crucial. Industry-wide efforts to address issues like human trafficking
offer an opportunity for companies to consistently and effectively tackle both
these issues. Long-term risk management systems must address economic,
geopolitical and climate risks to ensure business continuity and adaptability to
changing global conditions.
Hotels, Resorts & Cruise Lines
Highlighted criteria &
Dimension weight
Economic Dimension ............... 35%
– Codes of Business Conduct
– Risk & Crisis Management
– Customer Relationship
Management
Environmental Dimension ....... 23%
– Environmental Policy &
Management Systems
– Climate Strategy
– Operational Eco-Efficiency
Social Dimension .................... 42%
– Stakeholder Engagement
– Occupational Health and Safety
– Human Rights
Industry statistics
Number of companies in universe 23
Number of companies assessed in 2018 18
Assessed companies to total companies in universe 78%
Market of assessed companies to total market 95%
Sustainability leaders 2019
SAM Gold Class •InterContinental Hotels Group PLC United Kingdom
SAM Silver Class •Hilton Worldwide Holdings Inc * United States
Melia Hotels International SA Spain
SAM Bronze Class •TUI AG Germany
* SAM Industry Mover
The box-and-whisker plot describes the distribtution of scores in the industry, based on all assessed companies. More information is available in the Reading Instructions in the introduction.
100
90
80
70
60
50
40
30
20
10
0
Max
3rd Quartile
Median
1st Quartile
Min
77 75
5356
5347
88
76
2 2 0 3
Tota
l Su
stai
nabi
lity
Scor
e
Econ
omic
D
imen
sion
Sco
re
Envi
ronm
enta
l D
imen
sion
Sco
re
Soci
al
Dim
ensi
on S
core
Results at industry level
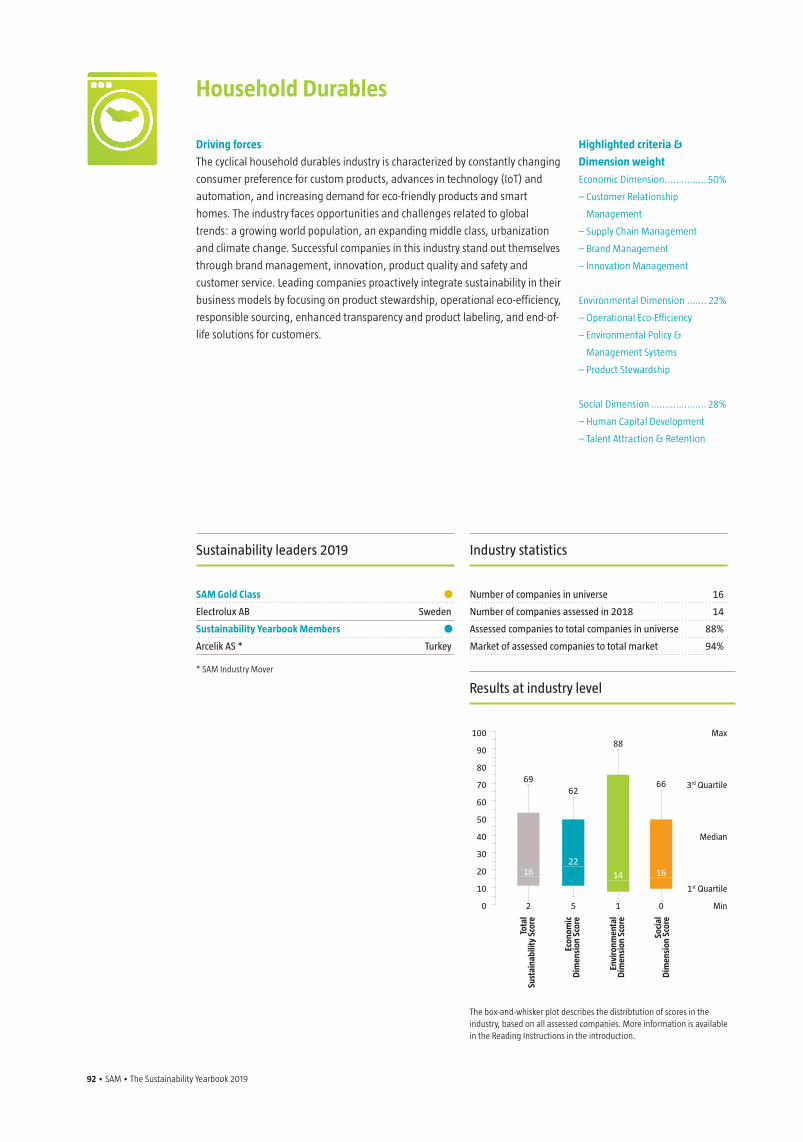
92 • SAM • The Sustainability Yearbook 2019 The Sustainability Yearbook 2019 • SAM • 93
Driving forces
The cyclical household durables industry is characterized by constantly changing
consumer preference for custom products, advances in technology (IoT) and
automation, and increasing demand for eco-friendly products and smart
homes. The industry faces opportunities and challenges related to global
trends: a growing world population, an expanding middle class, urbanization
and climate change. Successful companies in this industry stand out themselves
through brand management, innovation, product quality and safety and
customer service. Leading companies proactively integrate sustainability in their
business models by focusing on product stewardship, operational eco-efficiency,
responsible sourcing, enhanced transparency and product labeling, and end-of-
life solutions for customers.
Household Durables
Highlighted criteria &
Dimension weight
Economic Dimension ............... 50%
– Customer Relationship
Management
– Supply Chain Management
– Brand Management
– Innovation Management
Environmental Dimension ....... 22%
– Operational Eco-Efficiency
– Environmental Policy &
Management Systems
– Product Stewardship
Social Dimension .................... 28%
– Human Capital Development
– Talent Attraction & Retention
Industry statistics
Number of companies in universe 16
Number of companies assessed in 2018 14
Assessed companies to total companies in universe 88%
Market of assessed companies to total market 94%
Sustainability leaders 2019
SAM Gold Class •Electrolux AB Sweden
Sustainability Yearbook Members •Arcelik AS * Turkey
* SAM Industry Mover
The box-and-whisker plot describes the distribtution of scores in the industry, based on all assessed companies. More information is available in the Reading Instructions in the introduction.
Max
3rd Quartile
Median
1st Quartile
Min
6962
1622
14 16
88
66
2 5 1 0
Tota
l Su
stai
nabi
lity
Scor
e
Econ
omic
D
imen
sion
Sco
re
Envi
ronm
enta
l D
imen
sion
Sco
re
Soci
al
Dim
ensi
on S
core
Results at industry level
100
90
80
70
60
50
40
30
20
10
0
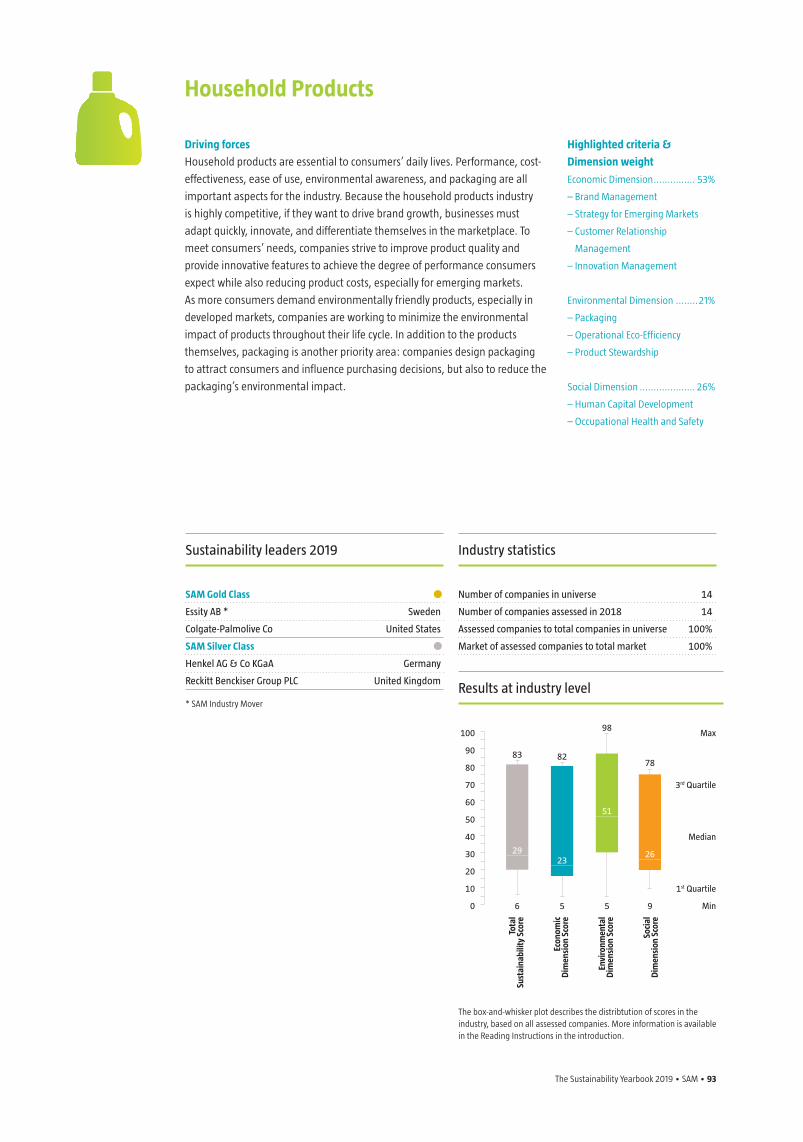
The Sustainability Yearbook 2019 • SAM • 93
Driving forces
Household products are essential to consumers’ daily lives. Performance, cost-
effectiveness, ease of use, environmental awareness, and packaging are all
important aspects for the industry. Because the household products industry
is highly competitive, if they want to drive brand growth, businesses must
adapt quickly, innovate, and differentiate themselves in the marketplace. To
meet consumers’ needs, companies strive to improve product quality and
provide innovative features to achieve the degree of performance consumers
expect while also reducing product costs, especially for emerging markets.
As more consumers demand environmentally friendly products, especially in
developed markets, companies are working to minimize the environmental
impact of products throughout their life cycle. In addition to the products
themselves, packaging is another priority area: companies design packaging
to attract consumers and influence purchasing decisions, but also to reduce the
packaging’s environmental impact.
Household Products
Highlighted criteria &
Dimension weight
Economic Dimension ............... 53%
– Brand Management
– Strategy for Emerging Markets
– Customer Relationship
Management
– Innovation Management
Environmental Dimension ........21%
– Packaging
– Operational Eco-Efficiency
– Product Stewardship
Social Dimension .................... 26%
– Human Capital Development
– Occupational Health and Safety
Industry statistics
Number of companies in universe 14
Number of companies assessed in 2018 14
Assessed companies to total companies in universe 100%
Market of assessed companies to total market 100%
Sustainability leaders 2019
SAM Gold Class •Essity AB * Sweden
Colgate-Palmolive Co United States
SAM Silver Class •Henkel AG & Co KGaA Germany
Reckitt Benckiser Group PLC United Kingdom
* SAM Industry Mover
The box-and-whisker plot describes the distribtution of scores in the industry, based on all assessed companies. More information is available in the Reading Instructions in the introduction.
100
90
80
70
60
50
40
30
20
10
0
Max
3rd Quartile
Median
1st Quartile
Min
83 82
2923
51
26
98
78
6 5 5 9
Tota
l Su
stai
nabi
lity
Scor
e
Econ
omic
D
imen
sion
Sco
re
Envi
ronm
enta
l D
imen
sion
Sco
re
Soci
al
Dim
ensi
on S
core
Results at industry level
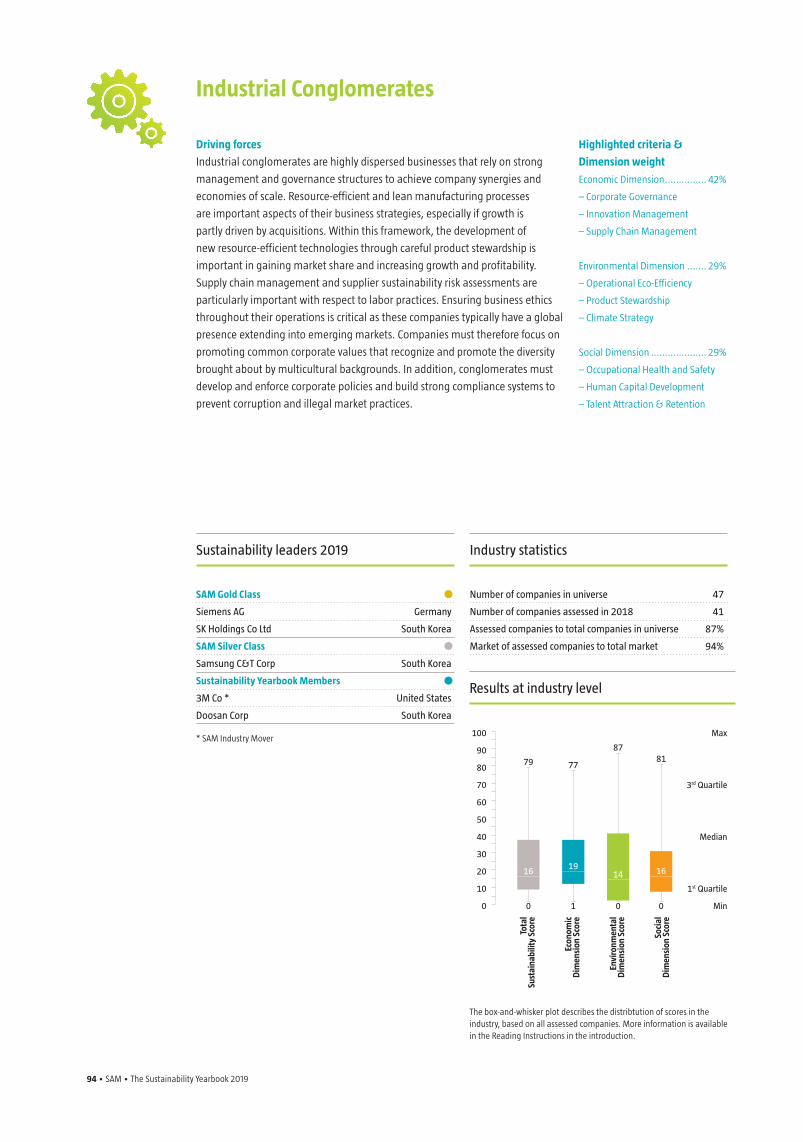
94 • SAM • The Sustainability Yearbook 2019 The Sustainability Yearbook 2019 • SAM • 95
Driving forces
Industrial conglomerates are highly dispersed businesses that rely on strong
management and governance structures to achieve company synergies and
economies of scale. Resource-efficient and lean manufacturing processes
are important aspects of their business strategies, especially if growth is
partly driven by acquisitions. Within this framework, the development of
new resource-efficient technologies through careful product stewardship is
important in gaining market share and increasing growth and profitability.
Supply chain management and supplier sustainability risk assessments are
particularly important with respect to labor practices. Ensuring business ethics
throughout their operations is critical as these companies typically have a global
presence extending into emerging markets. Companies must therefore focus on
promoting common corporate values that recognize and promote the diversity
brought about by multicultural backgrounds. In addition, conglomerates must
develop and enforce corporate policies and build strong compliance systems to
prevent corruption and illegal market practices.
Industrial Conglomerates
Highlighted criteria &
Dimension weight
Economic Dimension ............... 42%
– Corporate Governance
– Innovation Management
– Supply Chain Management
Environmental Dimension ....... 29%
– Operational Eco-Efficiency
– Product Stewardship
– Climate Strategy
Social Dimension .................... 29%
– Occupational Health and Safety
– Human Capital Development
– Talent Attraction & Retention
Industry statistics
Number of companies in universe 47
Number of companies assessed in 2018 41
Assessed companies to total companies in universe 87%
Market of assessed companies to total market 94%
Sustainability leaders 2019
SAM Gold Class •Siemens AG Germany
SK Holdings Co Ltd South Korea
SAM Silver Class •Samsung C&T Corp South Korea
Sustainability Yearbook Members •3M Co * United States
Doosan Corp South Korea
* SAM Industry Mover
The box-and-whisker plot describes the distribtution of scores in the industry, based on all assessed companies. More information is available in the Reading Instructions in the introduction.
Max
3rd Quartile
Median
1st Quartile
Min
79 77
16 1914 16
8781
0 1 0 0
Tota
l Su
stai
nabi
lity
Scor
e
Econ
omic
D
imen
sion
Sco
re
Envi
ronm
enta
l D
imen
sion
Sco
re
Soci
al
Dim
ensi
on S
core
Results at industry level
100
90
80
70
60
50
40
30
20
10
0
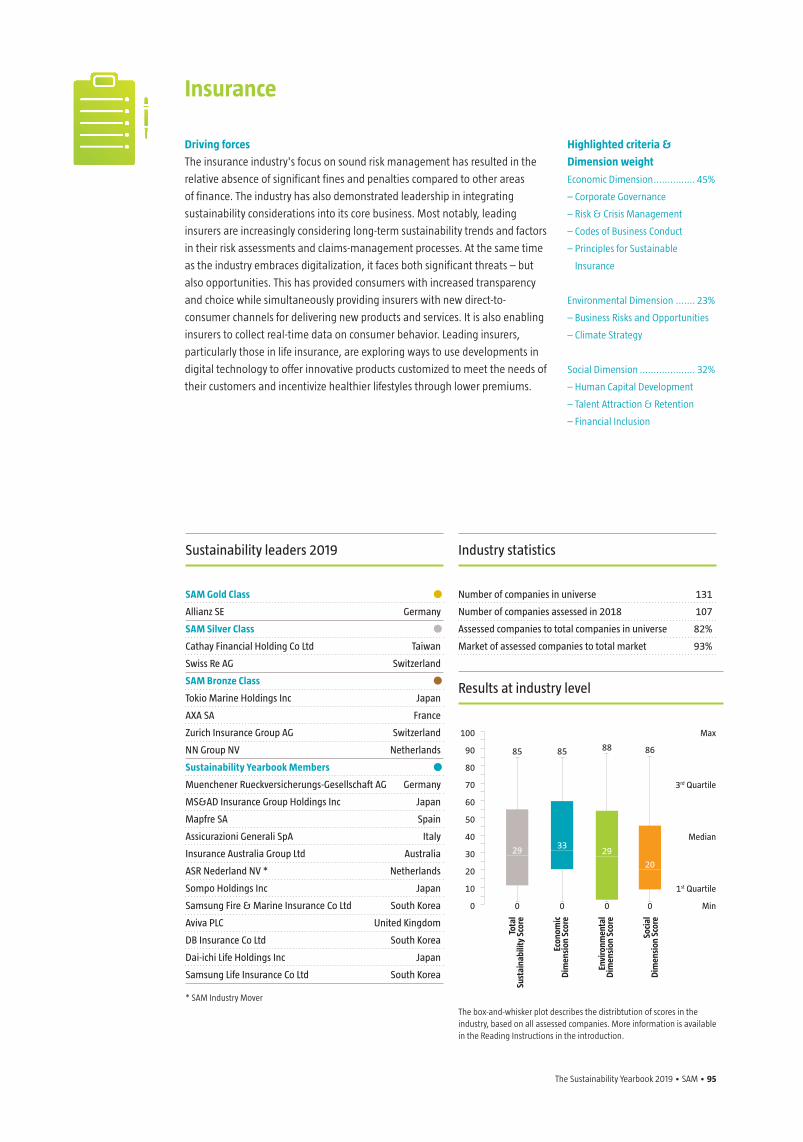
The Sustainability Yearbook 2019 • SAM • 95
Driving forces
The insurance industry's focus on sound risk management has resulted in the
relative absence of significant fines and penalties compared to other areas
of finance. The industry has also demonstrated leadership in integrating
sustainability considerations into its core business. Most notably, leading
insurers are increasingly considering long-term sustainability trends and factors
in their risk assessments and claims-management processes. At the same time
as the industry embraces digitalization, it faces both significant threats – but
also opportunities. This has provided consumers with increased transparency
and choice while simultaneously providing insurers with new direct-to-
consumer channels for delivering new products and services. It is also enabling
insurers to collect real-time data on consumer behavior. Leading insurers,
particularly those in life insurance, are exploring ways to use developments in
digital technology to offer innovative products customized to meet the needs of
their customers and incentivize healthier lifestyles through lower premiums.
Insurance
Highlighted criteria &
Dimension weight
Economic Dimension ............... 45%
– Corporate Governance
– Risk & Crisis Management
– Codes of Business Conduct
– Principles for Sustainable
Insurance
Environmental Dimension ....... 23%
– Business Risks and Opportunities
– Climate Strategy
Social Dimension .................... 32%
– Human Capital Development
– Talent Attraction & Retention
– Financial Inclusion
Industry statistics
Number of companies in universe 131
Number of companies assessed in 2018 107
Assessed companies to total companies in universe 82%
Market of assessed companies to total market 93%
Sustainability leaders 2019
SAM Gold Class •Allianz SE Germany
SAM Silver Class •Cathay Financial Holding Co Ltd Taiwan
Swiss Re AG Switzerland
SAM Bronze Class •Tokio Marine Holdings Inc Japan
AXA SA France
Zurich Insurance Group AG Switzerland
NN Group NV Netherlands
Sustainability Yearbook Members •Muenchener Rueckversicherungs-Gesellschaft AG Germany
MS&AD Insurance Group Holdings Inc Japan
Mapfre SA Spain
Assicurazioni Generali SpA Italy
Insurance Australia Group Ltd Australia
ASR Nederland NV * Netherlands
Sompo Holdings Inc Japan
Samsung Fire & Marine Insurance Co Ltd South Korea
Aviva PLC United Kingdom
DB Insurance Co Ltd South Korea
Dai-ichi Life Holdings Inc Japan
Samsung Life Insurance Co Ltd South Korea
* SAM Industry Mover
The box-and-whisker plot describes the distribtution of scores in the industry, based on all assessed companies. More information is available in the Reading Instructions in the introduction.
100
90
80
70
60
50
40
30
20
10
0
Max
3rd Quartile
Median
1st Quartile
Min
85 85
29 3329
20
88 86
0 0 0 0
Tota
l Su
stai
nabi
lity
Scor
e
Econ
omic
D
imen
sion
Sco
re
Envi
ronm
enta
l D
imen
sion
Sco
re
Soci
al
Dim
ensi
on S
core
Results at industry level
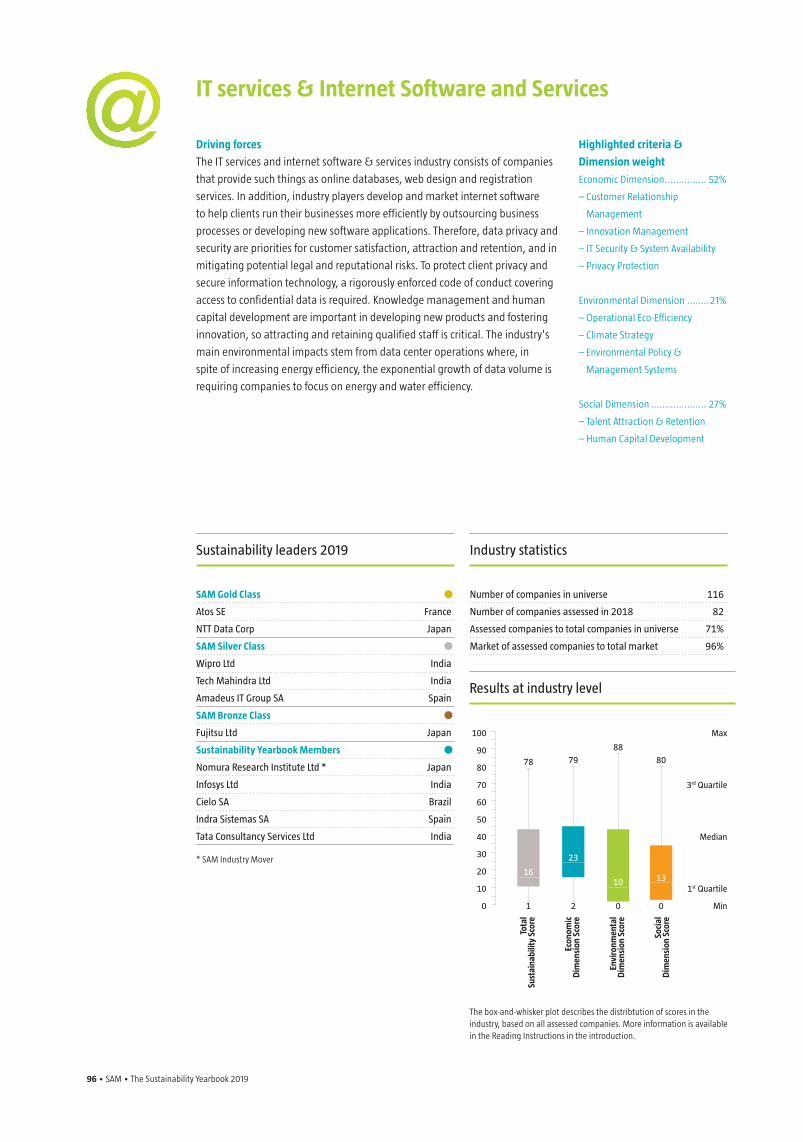
96 • SAM • The Sustainability Yearbook 2019 The Sustainability Yearbook 2019 • SAM • 97
Driving forces
The IT services and internet software & services industry consists of companies
that provide such things as online databases, web design and registration
services. In addition, industry players develop and market internet software
to help clients run their businesses more efficiently by outsourcing business
processes or developing new software applications. Therefore, data privacy and
security are priorities for customer satisfaction, attraction and retention, and in
mitigating potential legal and reputational risks. To protect client privacy and
secure information technology, a rigorously enforced code of conduct covering
access to confidential data is required. Knowledge management and human
capital development are important in developing new products and fostering
innovation, so attracting and retaining qualified staff is critical. The industry's
main environmental impacts stem from data center operations where, in
spite of increasing energy efficiency, the exponential growth of data volume is
requiring companies to focus on energy and water efficiency.
IT services & Internet Software and Services
Highlighted criteria &
Dimension weight
Economic Dimension ............... 52%
– Customer Relationship
Management
– Innovation Management
– IT Security & System Availability
– Privacy Protection
Environmental Dimension ........21%
– Operational Eco-Efficiency
– Climate Strategy
– Environmental Policy &
Management Systems
Social Dimension .................... 27%
– Talent Attraction & Retention
– Human Capital Development
Industry statistics
Number of companies in universe 116
Number of companies assessed in 2018 82
Assessed companies to total companies in universe 71%
Market of assessed companies to total market 96%
Sustainability leaders 2019
SAM Gold Class •Atos SE France
NTT Data Corp Japan
SAM Silver Class •Wipro Ltd India
Tech Mahindra Ltd India
Amadeus IT Group SA Spain
SAM Bronze Class •Fujitsu Ltd Japan
Sustainability Yearbook Members •Nomura Research Institute Ltd * Japan
Infosys Ltd India
Cielo SA Brazil
Indra Sistemas SA Spain
Tata Consultancy Services Ltd India
* SAM Industry Mover
The box-and-whisker plot describes the distribtution of scores in the industry, based on all assessed companies. More information is available in the Reading Instructions in the introduction.
Max
3rd Quartile
Median
1st Quartile
Min
78 79
16
23
10 13
88
80
1 2 0 0
Tota
l Su
stai
nabi
lity
Scor
e
Econ
omic
D
imen
sion
Sco
re
Envi
ronm
enta
l D
imen
sion
Sco
re
Soci
al
Dim
ensi
on S
core
Results at industry level
100
90
80
70
60
50
40
30
20
10
0
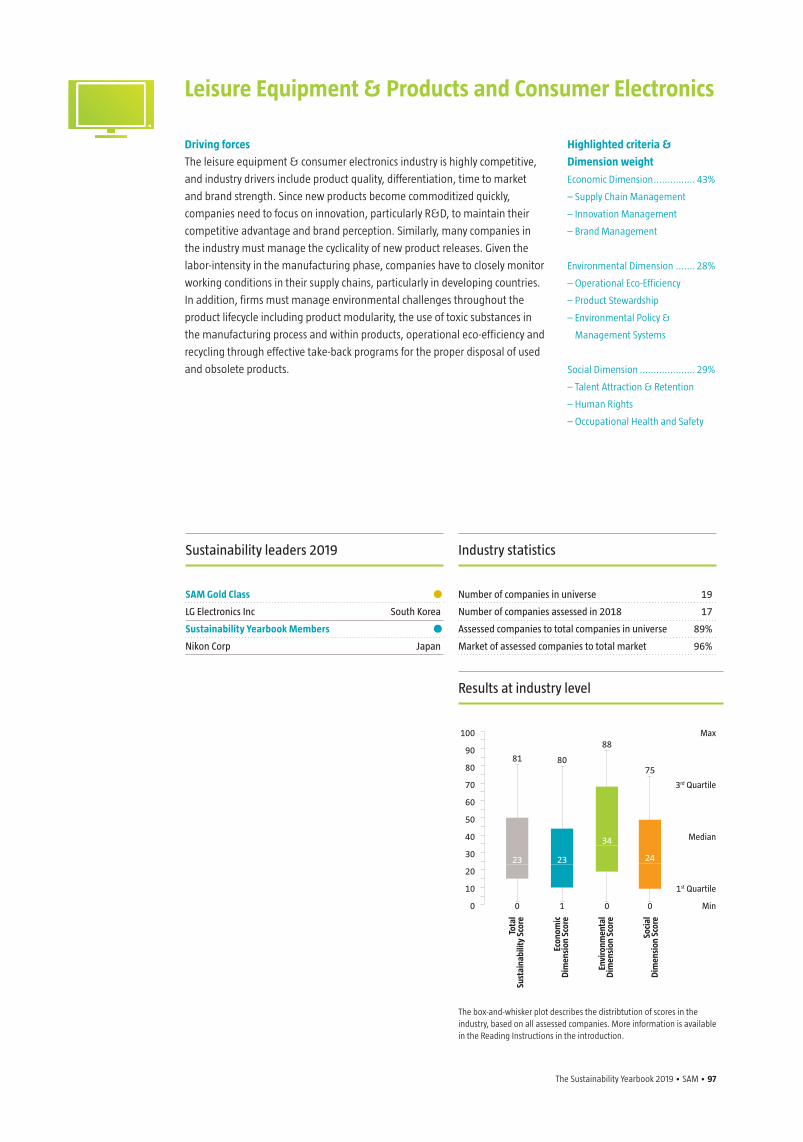
The Sustainability Yearbook 2019 • SAM • 97
Driving forces
The leisure equipment & consumer electronics industry is highly competitive,
and industry drivers include product quality, differentiation, time to market
and brand strength. Since new products become commoditized quickly,
companies need to focus on innovation, particularly R&D, to maintain their
competitive advantage and brand perception. Similarly, many companies in
the industry must manage the cyclicality of new product releases. Given the
labor-intensity in the manufacturing phase, companies have to closely monitor
working conditions in their supply chains, particularly in developing countries.
In addition, firms must manage environmental challenges throughout the
product lifecycle including product modularity, the use of toxic substances in
the manufacturing process and within products, operational eco-efficiency and
recycling through effective take-back programs for the proper disposal of used
and obsolete products.
Leisure Equipment & Products and Consumer Electronics
Highlighted criteria &
Dimension weight
Economic Dimension ............... 43%
– Supply Chain Management
– Innovation Management
– Brand Management
Environmental Dimension ....... 28%
– Operational Eco-Efficiency
– Product Stewardship
– Environmental Policy &
Management Systems
Social Dimension .................... 29%
– Talent Attraction & Retention
– Human Rights
– Occupational Health and Safety
Industry statistics
Number of companies in universe 19
Number of companies assessed in 2018 17
Assessed companies to total companies in universe 89%
Market of assessed companies to total market 96%
Sustainability leaders 2019
SAM Gold Class •LG Electronics Inc South Korea
Sustainability Yearbook Members •Nikon Corp Japan
The box-and-whisker plot describes the distribtution of scores in the industry, based on all assessed companies. More information is available in the Reading Instructions in the introduction.
100
90
80
70
60
50
40
30
20
10
0
Max
3rd Quartile
Median
1st Quartile
Min
81 80
23 23
34
24
88
75
0 1 0 0
Tota
l Su
stai
nabi
lity
Scor
e
Econ
omic
D
imen
sion
Sco
re
Envi
ronm
enta
l D
imen
sion
Sco
re
Soci
al
Dim
ensi
on S
core
Results at industry level
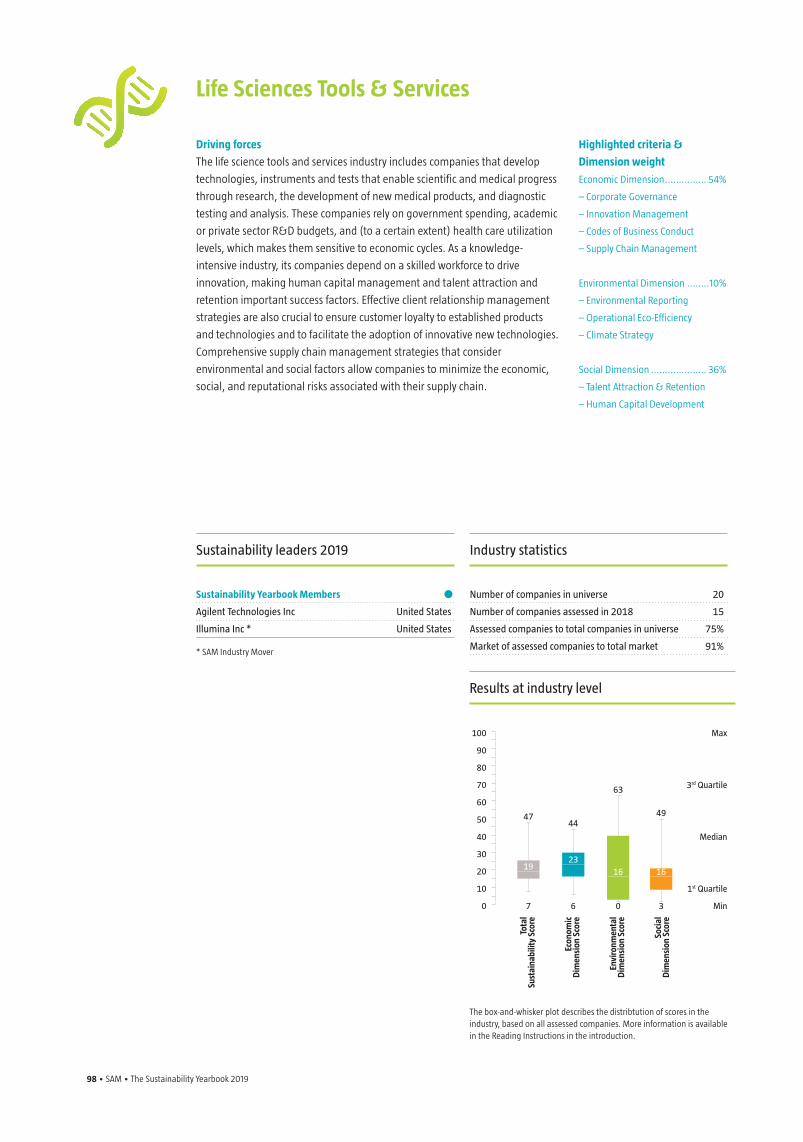
98 • SAM • The Sustainability Yearbook 2019 The Sustainability Yearbook 2019 • SAM • 99
Driving forces
The life science tools and services industry includes companies that develop
technologies, instruments and tests that enable scientific and medical progress
through research, the development of new medical products, and diagnostic
testing and analysis. These companies rely on government spending, academic
or private sector R&D budgets, and (to a certain extent) health care utilization
levels, which makes them sensitive to economic cycles. As a knowledge-
intensive industry, its companies depend on a skilled workforce to drive
innovation, making human capital management and talent attraction and
retention important success factors. Effective client relationship management
strategies are also crucial to ensure customer loyalty to established products
and technologies and to facilitate the adoption of innovative new technologies.
Comprehensive supply chain management strategies that consider
environmental and social factors allow companies to minimize the economic,
social, and reputational risks associated with their supply chain.
Life Sciences Tools & Services
Highlighted criteria &
Dimension weight
Economic Dimension ............... 54%
– Corporate Governance
– Innovation Management
– Codes of Business Conduct
– Supply Chain Management
Environmental Dimension ........10%
– Environmental Reporting
– Operational Eco-Efficiency
– Climate Strategy
Social Dimension .................... 36%
– Talent Attraction & Retention
– Human Capital Development
Industry statistics
Number of companies in universe 20
Number of companies assessed in 2018 15
Assessed companies to total companies in universe 75%
Market of assessed companies to total market 91%
Sustainability leaders 2019
Sustainability Yearbook Members •Agilent Technologies Inc United States
Illumina Inc * United States
* SAM Industry Mover
The box-and-whisker plot describes the distribtution of scores in the industry, based on all assessed companies. More information is available in the Reading Instructions in the introduction.
Max
3rd Quartile
Median
1st Quartile
Min
4744
1923
16 16
63
49
7 6 0 3
Tota
l Su
stai
nabi
lity
Scor
e
Econ
omic
D
imen
sion
Sco
re
Envi
ronm
enta
l D
imen
sion
Sco
re
Soci
al
Dim
ensi
on S
core
Results at industry level
100
90
80
70
60
50
40
30
20
10
0
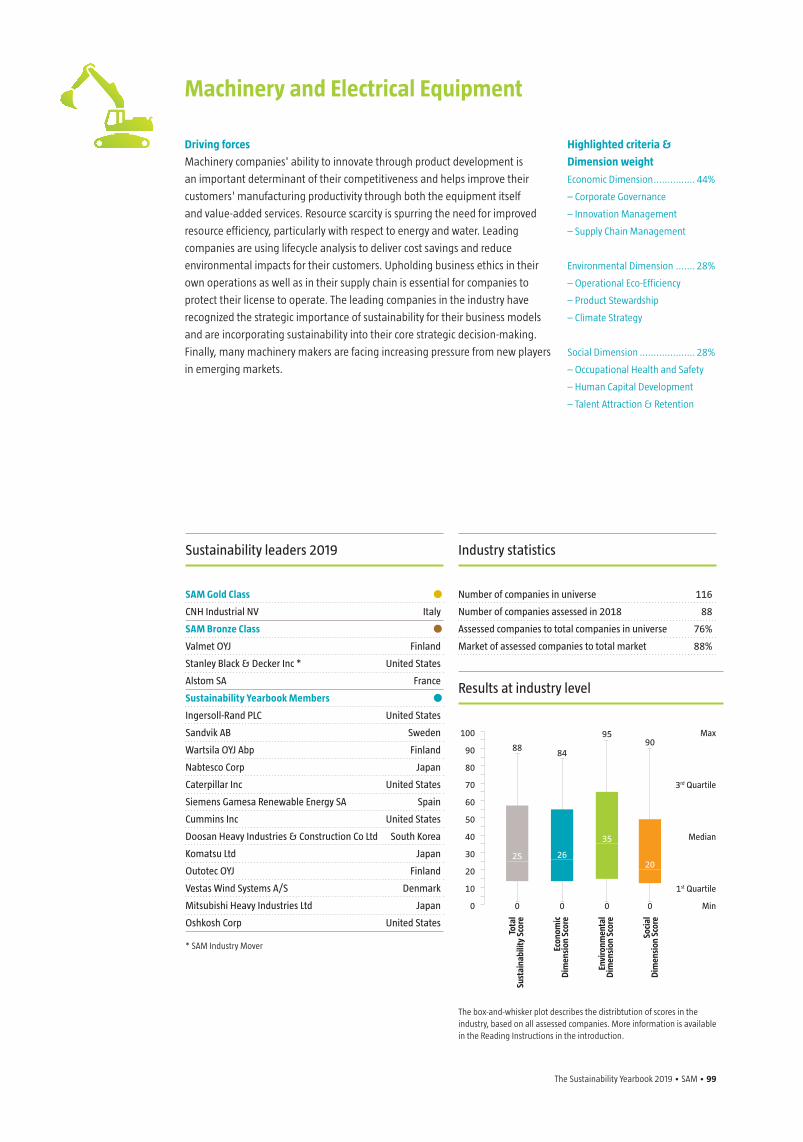
The Sustainability Yearbook 2019 • SAM • 99
Driving forces
Machinery companies' ability to innovate through product development is
an important determinant of their competitiveness and helps improve their
customers' manufacturing productivity through both the equipment itself
and value-added services. Resource scarcity is spurring the need for improved
resource efficiency, particularly with respect to energy and water. Leading
companies are using lifecycle analysis to deliver cost savings and reduce
environmental impacts for their customers. Upholding business ethics in their
own operations as well as in their supply chain is essential for companies to
protect their license to operate. The leading companies in the industry have
recognized the strategic importance of sustainability for their business models
and are incorporating sustainability into their core strategic decision-making.
Finally, many machinery makers are facing increasing pressure from new players
in emerging markets.
Machinery and Electrical Equipment
Highlighted criteria &
Dimension weight
Economic Dimension ............... 44%
– Corporate Governance
– Innovation Management
– Supply Chain Management
Environmental Dimension ....... 28%
– Operational Eco-Efficiency
– Product Stewardship
– Climate Strategy
Social Dimension .................... 28%
– Occupational Health and Safety
– Human Capital Development
– Talent Attraction & Retention
Industry statistics
Number of companies in universe 116
Number of companies assessed in 2018 88
Assessed companies to total companies in universe 76%
Market of assessed companies to total market 88%
Sustainability leaders 2019
SAM Gold Class •CNH Industrial NV Italy
SAM Bronze Class •Valmet OYJ Finland
Stanley Black & Decker Inc * United States
Alstom SA France
Sustainability Yearbook Members •Ingersoll-Rand PLC United States
Sandvik AB Sweden
Wartsila OYJ Abp Finland
Nabtesco Corp Japan
Caterpillar Inc United States
Siemens Gamesa Renewable Energy SA Spain
Cummins Inc United States
Doosan Heavy Industries & Construction Co Ltd South Korea
Komatsu Ltd Japan
Outotec OYJ Finland
Vestas Wind Systems A/S Denmark
Mitsubishi Heavy Industries Ltd Japan
Oshkosh Corp United States
* SAM Industry Mover
The box-and-whisker plot describes the distribtution of scores in the industry, based on all assessed companies. More information is available in the Reading Instructions in the introduction.
100
90
80
70
60
50
40
30
20
10
0
Max
3rd Quartile
Median
1st Quartile
Min
8884
25 26
35
20
9590
0 0 0 0
Tota
l Su
stai
nabi
lity
Scor
e
Econ
omic
D
imen
sion
Sco
re
Envi
ronm
enta
l D
imen
sion
Sco
re
Soci
al
Dim
ensi
on S
core
Results at industry level
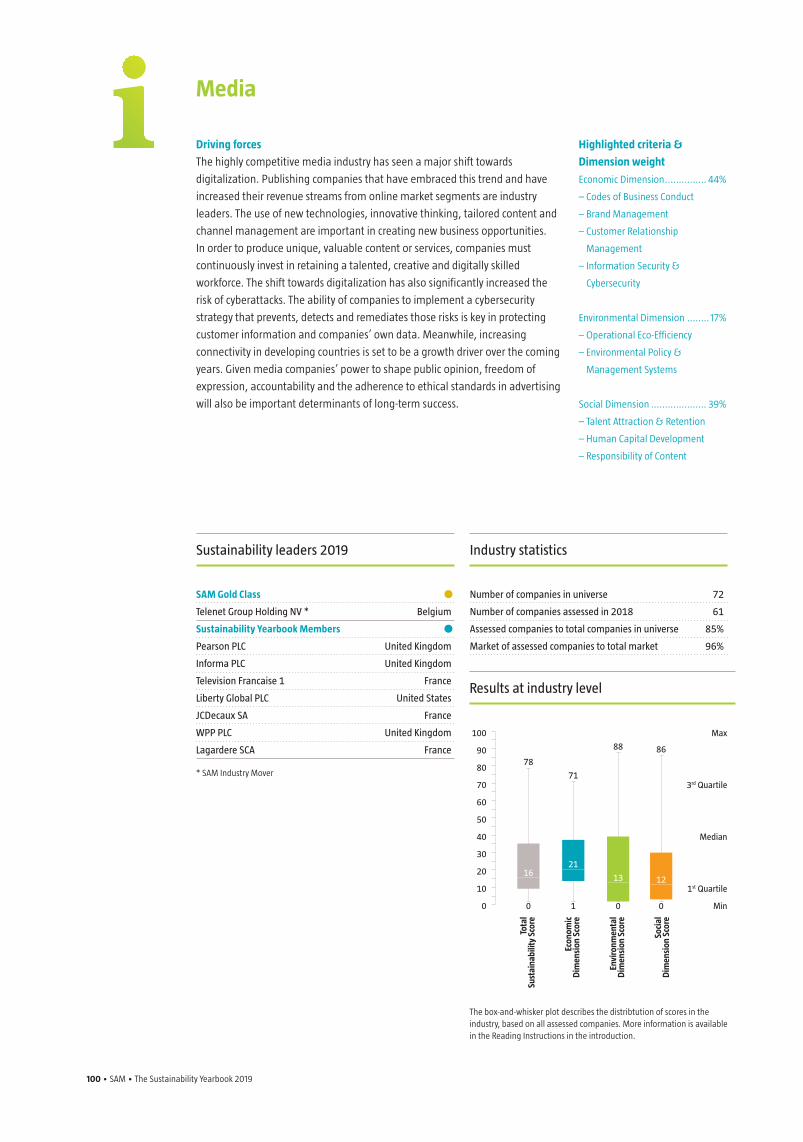
100 • SAM • The Sustainability Yearbook 2019 The Sustainability Yearbook 2019 • SAM • 101
Driving forces
The highly competitive media industry has seen a major shift towards
digitalization. Publishing companies that have embraced this trend and have
increased their revenue streams from online market segments are industry
leaders. The use of new technologies, innovative thinking, tailored content and
channel management are important in creating new business opportunities.
In order to produce unique, valuable content or services, companies must
continuously invest in retaining a talented, creative and digitally skilled
workforce. The shift towards digitalization has also significantly increased the
risk of cyberattacks. The ability of companies to implement a cybersecurity
strategy that prevents, detects and remediates those risks is key in protecting
customer information and companies’ own data. Meanwhile, increasing
connectivity in developing countries is set to be a growth driver over the coming
years. Given media companies’ power to shape public opinion, freedom of
expression, accountability and the adherence to ethical standards in advertising
will also be important determinants of long-term success.
Media
Highlighted criteria &
Dimension weight
Economic Dimension ............... 44%
– Codes of Business Conduct
– Brand Management
– Customer Relationship
Management
– Information Security &
Cybersecurity
Environmental Dimension ........ 17%
– Operational Eco-Efficiency
– Environmental Policy &
Management Systems
Social Dimension .................... 39%
– Talent Attraction & Retention
– Human Capital Development
– Responsibility of Content
Industry statistics
Number of companies in universe 72
Number of companies assessed in 2018 61
Assessed companies to total companies in universe 85%
Market of assessed companies to total market 96%
Sustainability leaders 2019
SAM Gold Class •Telenet Group Holding NV * Belgium
Sustainability Yearbook Members •Pearson PLC United Kingdom
Informa PLC United Kingdom
Television Francaise 1 France
Liberty Global PLC United States
JCDecaux SA France
WPP PLC United Kingdom
Lagardere SCA France
* SAM Industry Mover
The box-and-whisker plot describes the distribtution of scores in the industry, based on all assessed companies. More information is available in the Reading Instructions in the introduction.
Max
3rd Quartile
Median
1st Quartile
Min
78
71
1621
13 12
88 86
0 1 0 0
Tota
l Su
stai
nabi
lity
Scor
e
Econ
omic
D
imen
sion
Sco
re
Envi
ronm
enta
l D
imen
sion
Sco
re
Soci
al
Dim
ensi
on S
core
Results at industry level
100
90
80
70
60
50
40
30
20
10
0
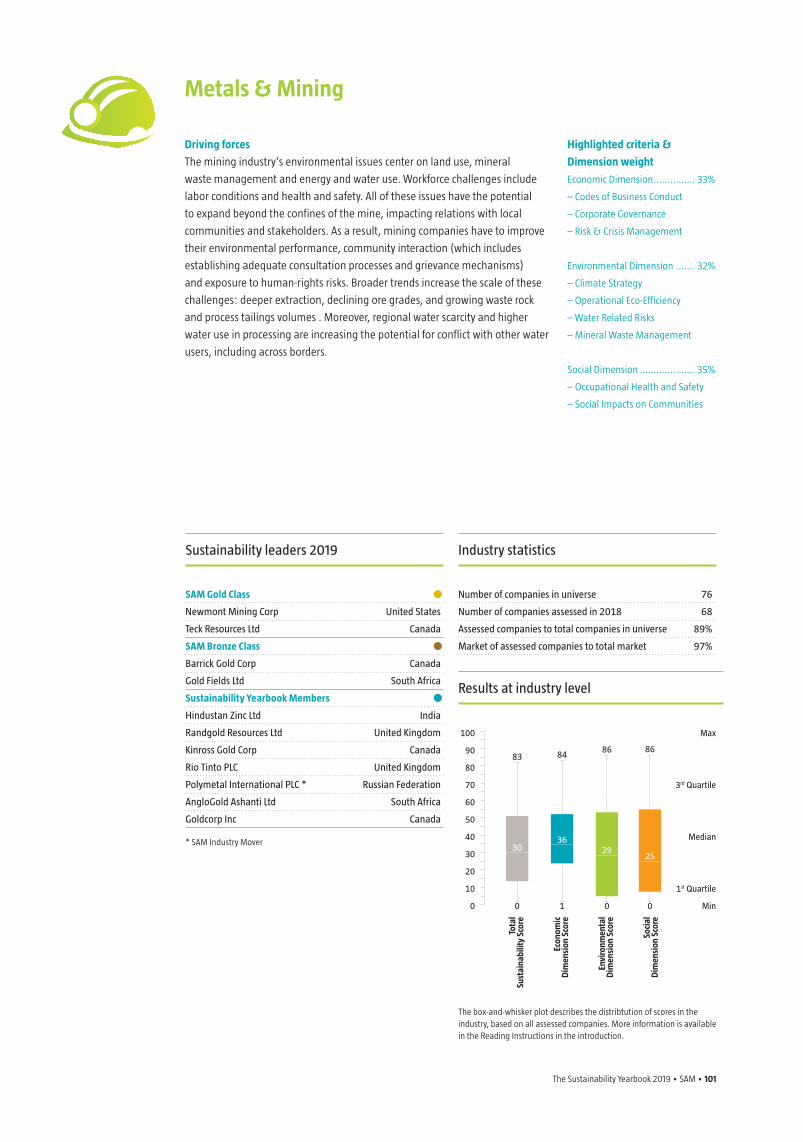
The Sustainability Yearbook 2019 • SAM • 101
Driving forces
The mining industry's environmental issues center on land use, mineral
waste management and energy and water use. Workforce challenges include
labor conditions and health and safety. All of these issues have the potential
to expand beyond the confines of the mine, impacting relations with local
communities and stakeholders. As a result, mining companies have to improve
their environmental performance, community interaction (which includes
establishing adequate consultation processes and grievance mechanisms)
and exposure to human-rights risks. Broader trends increase the scale of these
challenges: deeper extraction, declining ore grades, and growing waste rock
and process tailings volumes . Moreover, regional water scarcity and higher
water use in processing are increasing the potential for conflict with other water
users, including across borders.
Metals & Mining
Highlighted criteria &
Dimension weight
Economic Dimension ............... 33%
– Codes of Business Conduct
– Corporate Governance
– Risk & Crisis Management
Environmental Dimension ....... 32%
– Climate Strategy
– Operational Eco-Efficiency
– Water Related Risks
– Mineral Waste Management
Social Dimension .................... 35%
– Occupational Health and Safety
– Social Impacts on Communities
Industry statistics
Number of companies in universe 76
Number of companies assessed in 2018 68
Assessed companies to total companies in universe 89%
Market of assessed companies to total market 97%
Sustainability leaders 2019
SAM Gold Class •Newmont Mining Corp United States
Teck Resources Ltd Canada
SAM Bronze Class •Barrick Gold Corp Canada
Gold Fields Ltd South Africa
Sustainability Yearbook Members •Hindustan Zinc Ltd India
Randgold Resources Ltd United Kingdom
Kinross Gold Corp Canada
Rio Tinto PLC United Kingdom
Polymetal International PLC * Russian Federation
AngloGold Ashanti Ltd South Africa
Goldcorp Inc Canada
* SAM Industry Mover
The box-and-whisker plot describes the distribtution of scores in the industry, based on all assessed companies. More information is available in the Reading Instructions in the introduction.
100
90
80
70
60
50
40
30
20
10
0
Max
3rd Quartile
Median
1st Quartile
Min
83 84
3036
2925
86 86
0 1 0 0
Tota
l Su
stai
nabi
lity
Scor
e
Econ
omic
D
imen
sion
Sco
re
Envi
ronm
enta
l D
imen
sion
Sco
re
Soci
al
Dim
ensi
on S
core
Results at industry level
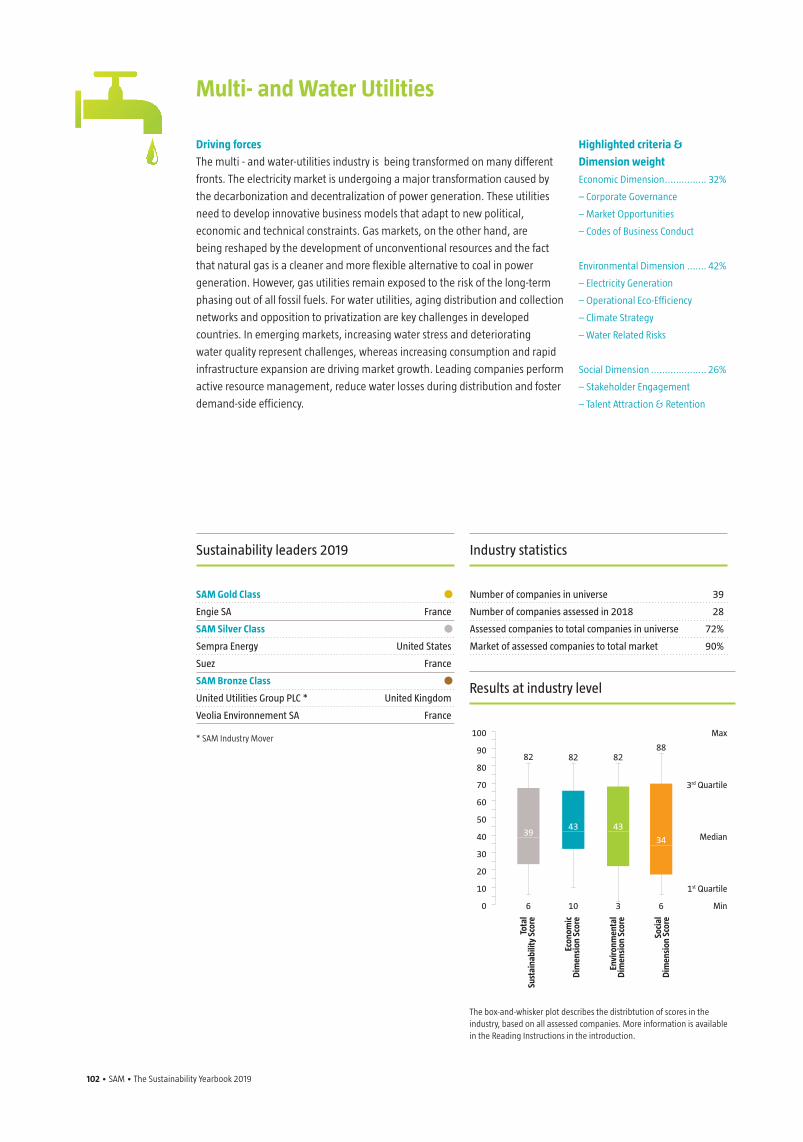
102 • SAM • The Sustainability Yearbook 2019 The Sustainability Yearbook 2019 • SAM • 103
Driving forces
The multi - and water-utilities industry is being transformed on many different
fronts. The electricity market is undergoing a major transformation caused by
the decarbonization and decentralization of power generation. These utilities
need to develop innovative business models that adapt to new political,
economic and technical constraints. Gas markets, on the other hand, are
being reshaped by the development of unconventional resources and the fact
that natural gas is a cleaner and more flexible alternative to coal in power
generation. However, gas utilities remain exposed to the risk of the long-term
phasing out of all fossil fuels. For water utilities, aging distribution and collection
networks and opposition to privatization are key challenges in developed
countries. In emerging markets, increasing water stress and deteriorating
water quality represent challenges, whereas increasing consumption and rapid
infrastructure expansion are driving market growth. Leading companies perform
active resource management, reduce water losses during distribution and foster
demand-side efficiency.
Multi- and Water Utilities
Highlighted criteria &
Dimension weight
Economic Dimension ............... 32%
– Corporate Governance
– Market Opportunities
– Codes of Business Conduct
Environmental Dimension ....... 42%
– Electricity Generation
– Operational Eco-Efficiency
– Climate Strategy
– Water Related Risks
Social Dimension .................... 26%
– Stakeholder Engagement
– Talent Attraction & Retention
Industry statistics
Number of companies in universe 39
Number of companies assessed in 2018 28
Assessed companies to total companies in universe 72%
Market of assessed companies to total market 90%
Sustainability leaders 2019
SAM Gold Class •Engie SA France
SAM Silver Class •Sempra Energy United States
Suez France
SAM Bronze Class •United Utilities Group PLC * United Kingdom
Veolia Environnement SA France
* SAM Industry Mover
The box-and-whisker plot describes the distribtution of scores in the industry, based on all assessed companies. More information is available in the Reading Instructions in the introduction.
Max
3rd Quartile
Median
1st Quartile
Min
82 82
3943 43
34
8288
6 10 3 6
Tota
l Su
stai
nabi
lity
Scor
e
Econ
omic
D
imen
sion
Sco
re
Envi
ronm
enta
l D
imen
sion
Sco
re
Soci
al
Dim
ensi
on S
core
Results at industry level
100
90
80
70
60
50
40
30
20
10
0
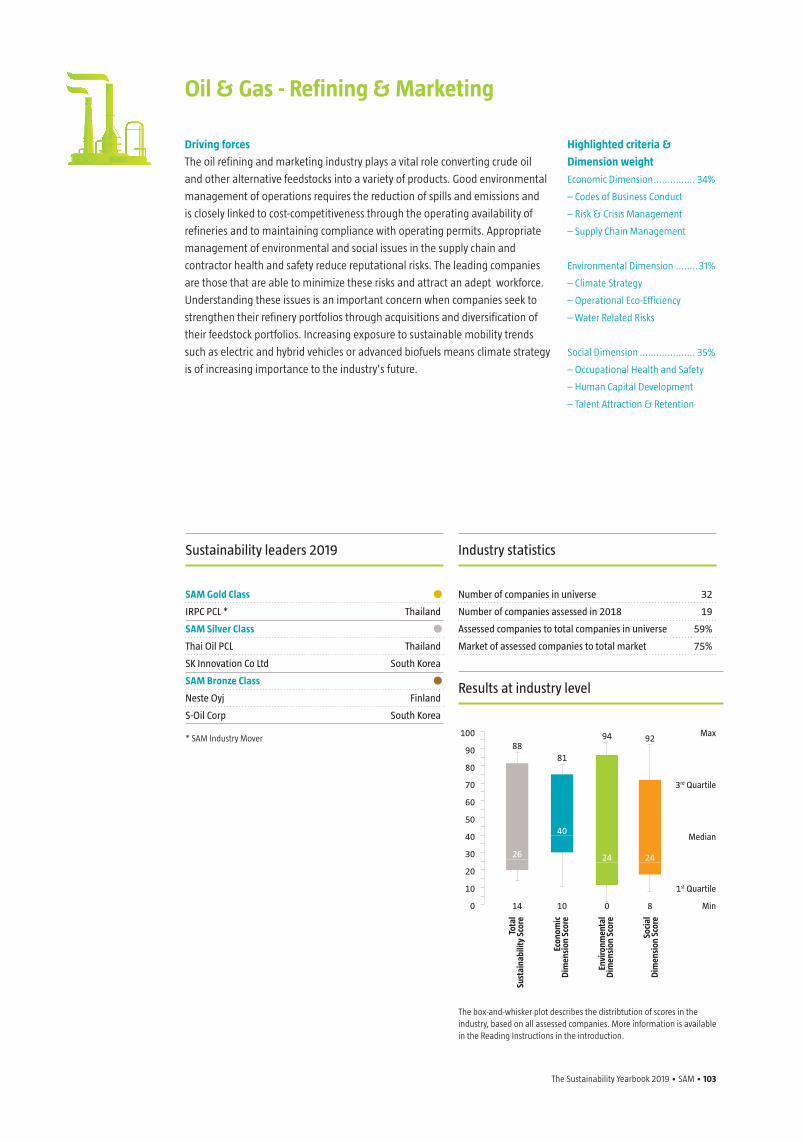
The Sustainability Yearbook 2019 • SAM • 103
Driving forces
The oil refining and marketing industry plays a vital role converting crude oil
and other alternative feedstocks into a variety of products. Good environmental
management of operations requires the reduction of spills and emissions and
is closely linked to cost-competitiveness through the operating availability of
refineries and to maintaining compliance with operating permits. Appropriate
management of environmental and social issues in the supply chain and
contractor health and safety reduce reputational risks. The leading companies
are those that are able to minimize these risks and attract an adept workforce.
Understanding these issues is an important concern when companies seek to
strengthen their refinery portfolios through acquisitions and diversification of
their feedstock portfolios. Increasing exposure to sustainable mobility trends
such as electric and hybrid vehicles or advanced biofuels means climate strategy
is of increasing importance to the industry's future.
Oil & Gas - Refining & Marketing
Highlighted criteria &
Dimension weight
Economic Dimension ............... 34%
– Codes of Business Conduct
– Risk & Crisis Management
– Supply Chain Management
Environmental Dimension ........31%
– Climate Strategy
– Operational Eco-Efficiency
– Water Related Risks
Social Dimension .................... 35%
– Occupational Health and Safety
– Human Capital Development
– Talent Attraction & Retention
Industry statistics
Number of companies in universe 32
Number of companies assessed in 2018 19
Assessed companies to total companies in universe 59%
Market of assessed companies to total market 75%
Sustainability leaders 2019
SAM Gold Class •IRPC PCL * Thailand
SAM Silver Class •Thai Oil PCL Thailand
SK Innovation Co Ltd South Korea
SAM Bronze Class •Neste Oyj Finland
S-Oil Corp South Korea
* SAM Industry Mover
The box-and-whisker plot describes the distribtution of scores in the industry, based on all assessed companies. More information is available in the Reading Instructions in the introduction.
100
90
80
70
60
50
40
30
20
10
0
Max
3rd Quartile
Median
1st Quartile
Min
8881
26
40
24 24
94 92
14 10 0 8
Tota
l Su
stai
nabi
lity
Scor
e
Econ
omic
D
imen
sion
Sco
re
Envi
ronm
enta
l D
imen
sion
Sco
re
Soci
al
Dim
ensi
on S
core
Results at industry level
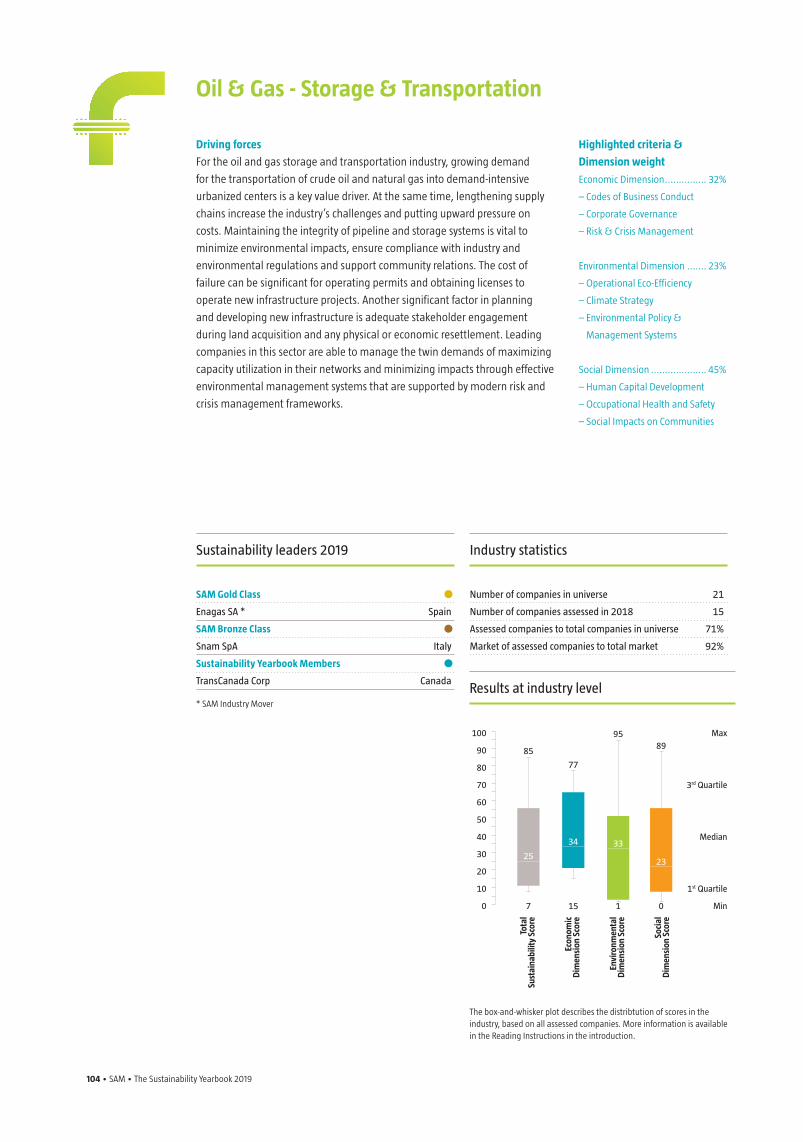
104 • SAM • The Sustainability Yearbook 2019 The Sustainability Yearbook 2019 • SAM • 105
Driving forces
For the oil and gas storage and transportation industry, growing demand
for the transportation of crude oil and natural gas into demand-intensive
urbanized centers is a key value driver. At the same time, lengthening supply
chains increase the industry’s challenges and putting upward pressure on
costs. Maintaining the integrity of pipeline and storage systems is vital to
minimize environmental impacts, ensure compliance with industry and
environmental regulations and support community relations. The cost of
failure can be significant for operating permits and obtaining licenses to
operate new infrastructure projects. Another significant factor in planning
and developing new infrastructure is adequate stakeholder engagement
during land acquisition and any physical or economic resettlement. Leading
companies in this sector are able to manage the twin demands of maximizing
capacity utilization in their networks and minimizing impacts through effective
environmental management systems that are supported by modern risk and
crisis management frameworks.
Oil & Gas - Storage & Transportation
Highlighted criteria &
Dimension weight
Economic Dimension ............... 32%
– Codes of Business Conduct
– Corporate Governance
– Risk & Crisis Management
Environmental Dimension ....... 23%
– Operational Eco-Efficiency
– Climate Strategy
– Environmental Policy &
Management Systems
Social Dimension .................... 45%
– Human Capital Development
– Occupational Health and Safety
– Social Impacts on Communities
Industry statistics
Number of companies in universe 21
Number of companies assessed in 2018 15
Assessed companies to total companies in universe 71%
Market of assessed companies to total market 92%
Sustainability leaders 2019
SAM Gold Class •Enagas SA * Spain
SAM Bronze Class •Snam SpA Italy
Sustainability Yearbook Members •TransCanada Corp Canada
* SAM Industry Mover
The box-and-whisker plot describes the distribtution of scores in the industry, based on all assessed companies. More information is available in the Reading Instructions in the introduction.
Max
3rd Quartile
Median
1st Quartile
Min
85
77
25
34 33
23
9589
7 15 1 0
Tota
l Su
stai
nabi
lity
Scor
e
Econ
omic
D
imen
sion
Sco
re
Envi
ronm
enta
l D
imen
sion
Sco
re
Soci
al
Dim
ensi
on S
core
Results at industry level
100
90
80
70
60
50
40
30
20
10
0
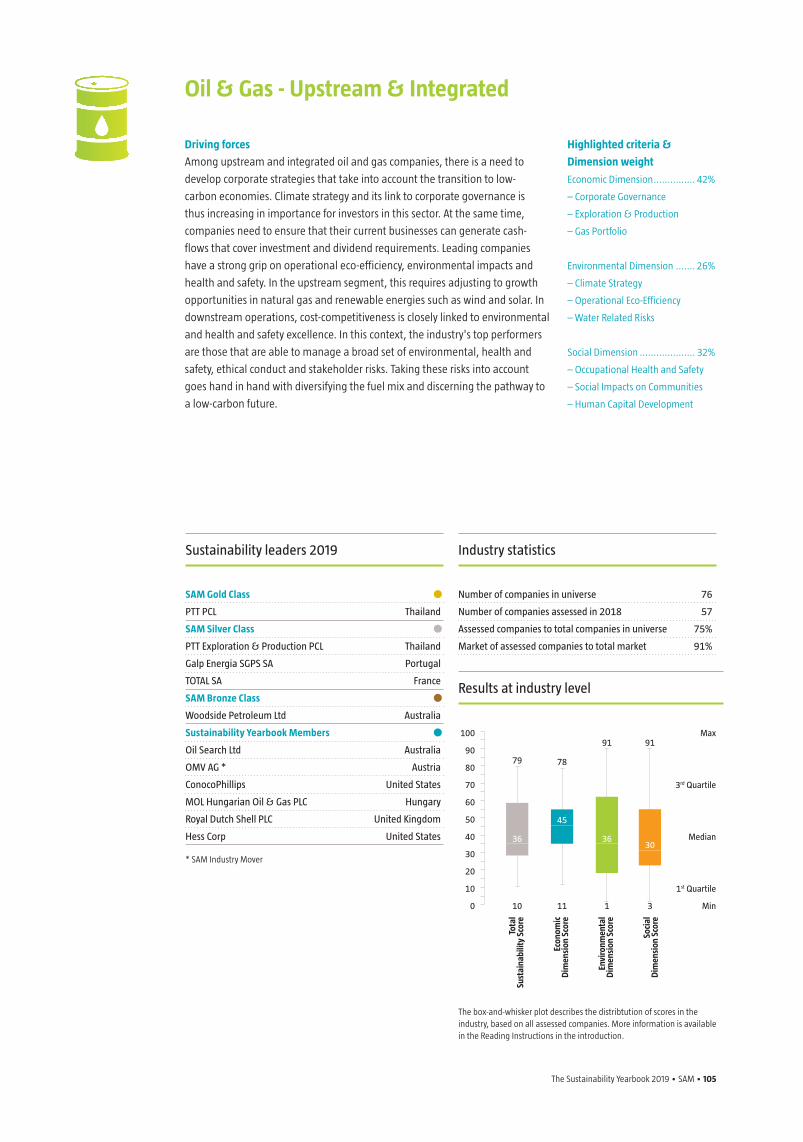
The Sustainability Yearbook 2019 • SAM • 105
Driving forces
Among upstream and integrated oil and gas companies, there is a need to
develop corporate strategies that take into account the transition to low-
carbon economies. Climate strategy and its link to corporate governance is
thus increasing in importance for investors in this sector. At the same time,
companies need to ensure that their current businesses can generate cash-
flows that cover investment and dividend requirements. Leading companies
have a strong grip on operational eco-efficiency, environmental impacts and
health and safety. In the upstream segment, this requires adjusting to growth
opportunities in natural gas and renewable energies such as wind and solar. In
downstream operations, cost-competitiveness is closely linked to environmental
and health and safety excellence. In this context, the industry's top performers
are those that are able to manage a broad set of environmental, health and
safety, ethical conduct and stakeholder risks. Taking these risks into account
goes hand in hand with diversifying the fuel mix and discerning the pathway to
a low-carbon future.
Oil & Gas - Upstream & Integrated
Highlighted criteria &
Dimension weight
Economic Dimension ............... 42%
– Corporate Governance
– Exploration & Production
– Gas Portfolio
Environmental Dimension ....... 26%
– Climate Strategy
– Operational Eco-Efficiency
– Water Related Risks
Social Dimension .................... 32%
– Occupational Health and Safety
– Social Impacts on Communities
– Human Capital Development
Industry statistics
Number of companies in universe 76
Number of companies assessed in 2018 57
Assessed companies to total companies in universe 75%
Market of assessed companies to total market 91%
Sustainability leaders 2019
SAM Gold Class •PTT PCL Thailand
SAM Silver Class •PTT Exploration & Production PCL Thailand
Galp Energia SGPS SA Portugal
TOTAL SA France
SAM Bronze Class •Woodside Petroleum Ltd Australia
Sustainability Yearbook Members •Oil Search Ltd Australia
OMV AG * Austria
ConocoPhillips United States
MOL Hungarian Oil & Gas PLC Hungary
Royal Dutch Shell PLC United Kingdom
Hess Corp United States
* SAM Industry Mover
The box-and-whisker plot describes the distribtution of scores in the industry, based on all assessed companies. More information is available in the Reading Instructions in the introduction.
100
90
80
70
60
50
40
30
20
10
0
Max
3rd Quartile
Median
1st Quartile
Min
79 78
36
45
3630
91 91
10 11 1 3
Tota
l Su
stai
nabi
lity
Scor
e
Econ
omic
D
imen
sion
Sco
re
Envi
ronm
enta
l D
imen
sion
Sco
re
Soci
al
Dim
ensi
on S
core
Results at industry level
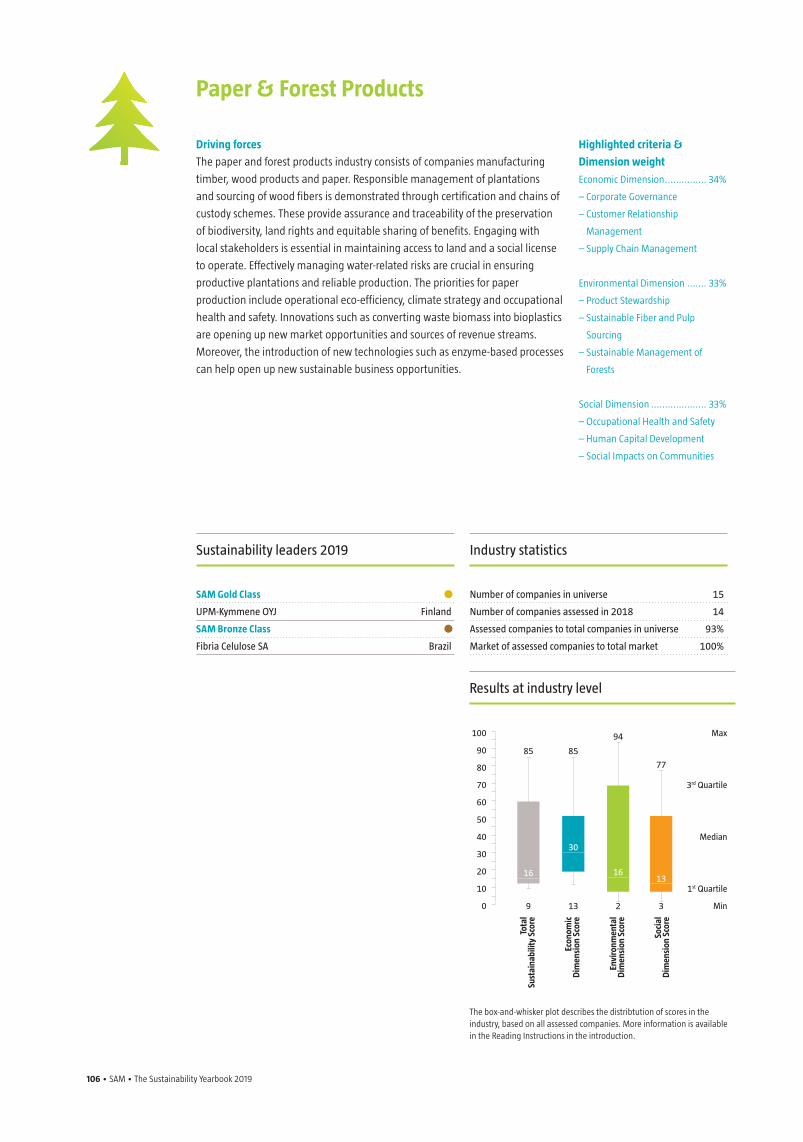
106 • SAM • The Sustainability Yearbook 2019 The Sustainability Yearbook 2019 • SAM • 107
Driving forces
The paper and forest products industry consists of companies manufacturing
timber, wood products and paper. Responsible management of plantations
and sourcing of wood fibers is demonstrated through certification and chains of
custody schemes. These provide assurance and traceability of the preservation
of biodiversity, land rights and equitable sharing of benefits. Engaging with
local stakeholders is essential in maintaining access to land and a social license
to operate. Effectively managing water-related risks are crucial in ensuring
productive plantations and reliable production. The priorities for paper
production include operational eco-efficiency, climate strategy and occupational
health and safety. Innovations such as converting waste biomass into bioplastics
are opening up new market opportunities and sources of revenue streams.
Moreover, the introduction of new technologies such as enzyme-based processes
can help open up new sustainable business opportunities.
Paper & Forest Products
Highlighted criteria &
Dimension weight
Economic Dimension ............... 34%
– Corporate Governance
– Customer Relationship
Management
– Supply Chain Management
Environmental Dimension ....... 33%
– Product Stewardship
– Sustainable Fiber and Pulp
Sourcing
– Sustainable Management of
Forests
Social Dimension .................... 33%
– Occupational Health and Safety
– Human Capital Development
– Social Impacts on Communities
Industry statistics
Number of companies in universe 15
Number of companies assessed in 2018 14
Assessed companies to total companies in universe 93%
Market of assessed companies to total market 100%
Sustainability leaders 2019
SAM Gold Class •UPM-Kymmene OYJ Finland
SAM Bronze Class •Fibria Celulose SA Brazil
The box-and-whisker plot describes the distribtution of scores in the industry, based on all assessed companies. More information is available in the Reading Instructions in the introduction.
Max
3rd Quartile
Median
1st Quartile
Min
85 85
16
30
1613
94
77
9 13 2 3
Tota
l Su
stai
nabi
lity
Scor
e
Econ
omic
D
imen
sion
Sco
re
Envi
ronm
enta
l D
imen
sion
Sco
re
Soci
al
Dim
ensi
on S
core
Results at industry level
100
90
80
70
60
50
40
30
20
10
0
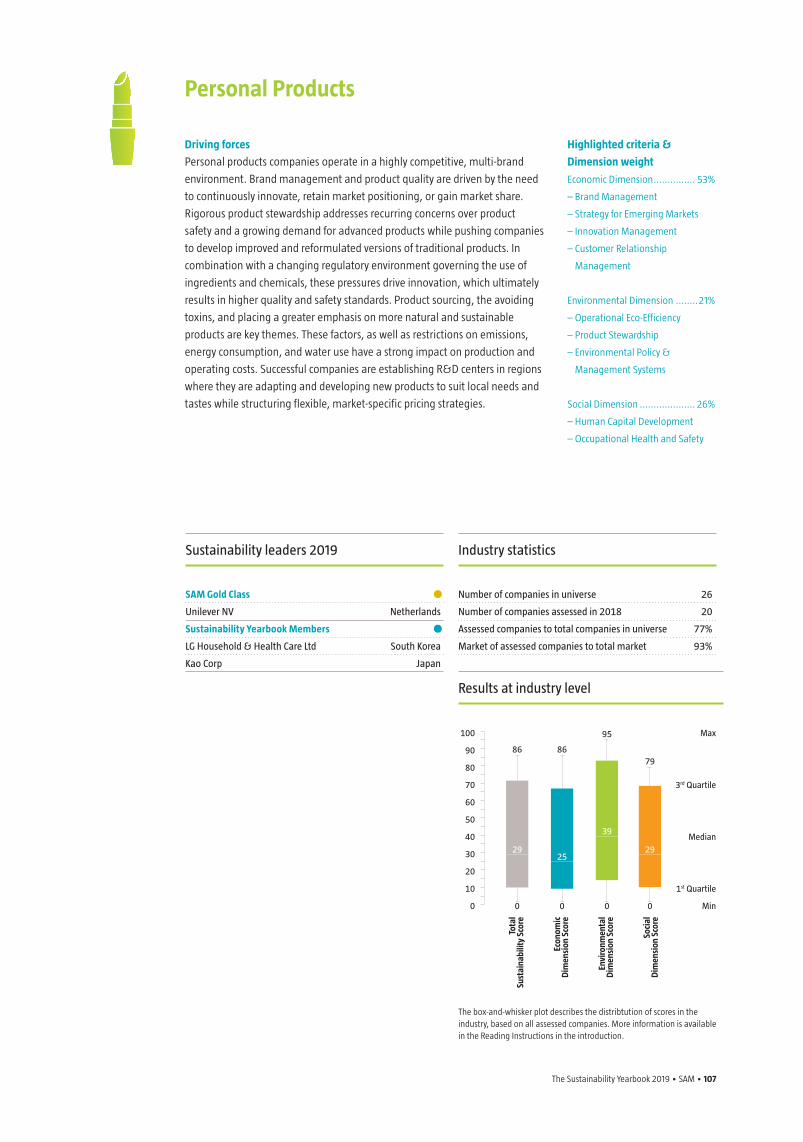
The Sustainability Yearbook 2019 • SAM • 107
Driving forces
Personal products companies operate in a highly competitive, multi-brand
environment. Brand management and product quality are driven by the need
to continuously innovate, retain market positioning, or gain market share.
Rigorous product stewardship addresses recurring concerns over product
safety and a growing demand for advanced products while pushing companies
to develop improved and reformulated versions of traditional products. In
combination with a changing regulatory environment governing the use of
ingredients and chemicals, these pressures drive innovation, which ultimately
results in higher quality and safety standards. Product sourcing, the avoiding
toxins, and placing a greater emphasis on more natural and sustainable
products are key themes. These factors, as well as restrictions on emissions,
energy consumption, and water use have a strong impact on production and
operating costs. Successful companies are establishing R&D centers in regions
where they are adapting and developing new products to suit local needs and
tastes while structuring flexible, market-specific pricing strategies.
Personal Products
Highlighted criteria &
Dimension weight
Economic Dimension ............... 53%
– Brand Management
– Strategy for Emerging Markets
– Innovation Management
– Customer Relationship
Management
Environmental Dimension ........21%
– Operational Eco-Efficiency
– Product Stewardship
– Environmental Policy &
Management Systems
Social Dimension .................... 26%
– Human Capital Development
– Occupational Health and Safety
Industry statistics
Number of companies in universe 26
Number of companies assessed in 2018 20
Assessed companies to total companies in universe 77%
Market of assessed companies to total market 93%
Sustainability leaders 2019
SAM Gold Class •Unilever NV Netherlands
Sustainability Yearbook Members •LG Household & Health Care Ltd South Korea
Kao Corp Japan
The box-and-whisker plot describes the distribtution of scores in the industry, based on all assessed companies. More information is available in the Reading Instructions in the introduction.
100
90
80
70
60
50
40
30
20
10
0
Max
3rd Quartile
Median
1st Quartile
Min
86 86
2925
39
29
95
79
0 0 0 0
Tota
l Su
stai
nabi
lity
Scor
e
Econ
omic
D
imen
sion
Sco
re
Envi
ronm
enta
l D
imen
sion
Sco
re
Soci
al
Dim
ensi
on S
core
Results at industry level
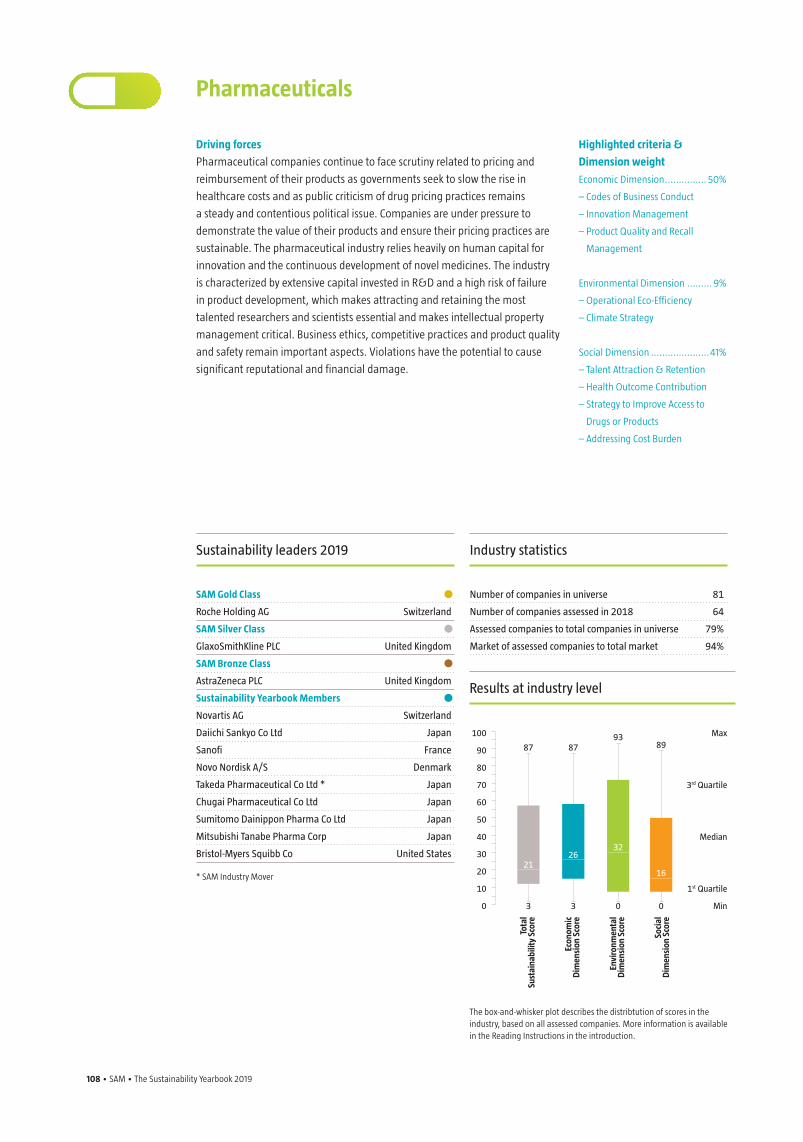
108 • SAM • The Sustainability Yearbook 2019 The Sustainability Yearbook 2019 • SAM • 109
Driving forces
Pharmaceutical companies continue to face scrutiny related to pricing and
reimbursement of their products as governments seek to slow the rise in
healthcare costs and as public criticism of drug pricing practices remains
a steady and contentious political issue. Companies are under pressure to
demonstrate the value of their products and ensure their pricing practices are
sustainable. The pharmaceutical industry relies heavily on human capital for
innovation and the continuous development of novel medicines. The industry
is characterized by extensive capital invested in R&D and a high risk of failure
in product development, which makes attracting and retaining the most
talented researchers and scientists essential and makes intellectual property
management critical. Business ethics, competitive practices and product quality
and safety remain important aspects. Violations have the potential to cause
significant reputational and financial damage.
Pharmaceuticals
Highlighted criteria &
Dimension weight
Economic Dimension ............... 50%
– Codes of Business Conduct
– Innovation Management
– Product Quality and Recall
Management
Environmental Dimension ......... 9%
– Operational Eco-Efficiency
– Climate Strategy
Social Dimension .....................41%
– Talent Attraction & Retention
– Health Outcome Contribution
– Strategy to Improve Access to
Drugs or Products
– Addressing Cost Burden
Industry statistics
Number of companies in universe 81
Number of companies assessed in 2018 64
Assessed companies to total companies in universe 79%
Market of assessed companies to total market 94%
Sustainability leaders 2019
SAM Gold Class •Roche Holding AG Switzerland
SAM Silver Class •GlaxoSmithKline PLC United Kingdom
SAM Bronze Class •AstraZeneca PLC United Kingdom
Sustainability Yearbook Members •Novartis AG Switzerland
Daiichi Sankyo Co Ltd Japan
Sanofi France
Novo Nordisk A/S Denmark
Takeda Pharmaceutical Co Ltd * Japan
Chugai Pharmaceutical Co Ltd Japan
Sumitomo Dainippon Pharma Co Ltd Japan
Mitsubishi Tanabe Pharma Corp Japan
Bristol-Myers Squibb Co United States
* SAM Industry Mover
The box-and-whisker plot describes the distribtution of scores in the industry, based on all assessed companies. More information is available in the Reading Instructions in the introduction.
Max
3rd Quartile
Median
1st Quartile
Min
87 87
2126
32
16
9389
3 3 0 0
Tota
l Su
stai
nabi
lity
Scor
e
Econ
omic
D
imen
sion
Sco
re
Envi
ronm
enta
l D
imen
sion
Sco
re
Soci
al
Dim
ensi
on S
core
Results at industry level
100
90
80
70
60
50
40
30
20
10
0
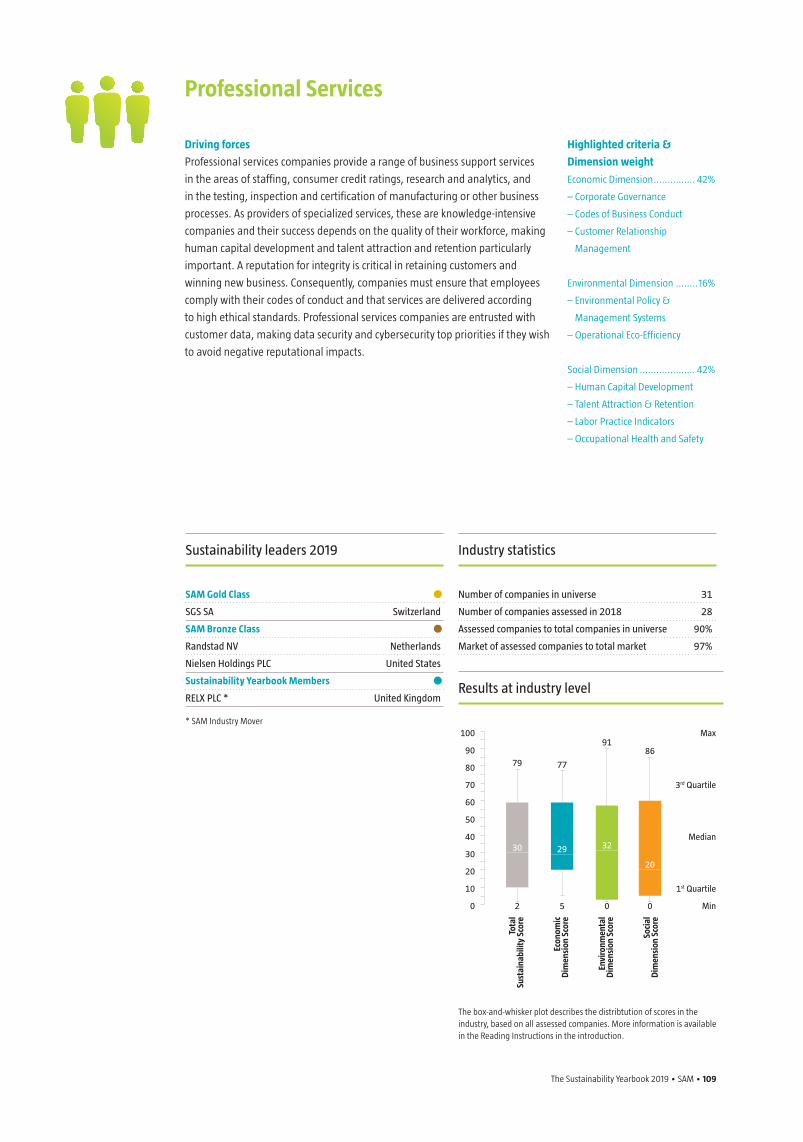
The Sustainability Yearbook 2019 • SAM • 109
Driving forces
Professional services companies provide a range of business support services
in the areas of staffing, consumer credit ratings, research and analytics, and
in the testing, inspection and certification of manufacturing or other business
processes. As providers of specialized services, these are knowledge-intensive
companies and their success depends on the quality of their workforce, making
human capital development and talent attraction and retention particularly
important. A reputation for integrity is critical in retaining customers and
winning new business. Consequently, companies must ensure that employees
comply with their codes of conduct and that services are delivered according
to high ethical standards. Professional services companies are entrusted with
customer data, making data security and cybersecurity top priorities if they wish
to avoid negative reputational impacts.
Professional Services
Highlighted criteria &
Dimension weight
Economic Dimension ............... 42%
– Corporate Governance
– Codes of Business Conduct
– Customer Relationship
Management
Environmental Dimension ........16%
– Environmental Policy &
Management Systems
– Operational Eco-Efficiency
Social Dimension .................... 42%
– Human Capital Development
– Talent Attraction & Retention
– Labor Practice Indicators
– Occupational Health and Safety
Industry statistics
Number of companies in universe 31
Number of companies assessed in 2018 28
Assessed companies to total companies in universe 90%
Market of assessed companies to total market 97%
Sustainability leaders 2019
SAM Gold Class •SGS SA Switzerland
SAM Bronze Class •Randstad NV Netherlands
Nielsen Holdings PLC United States
Sustainability Yearbook Members •RELX PLC * United Kingdom
* SAM Industry Mover
The box-and-whisker plot describes the distribtution of scores in the industry, based on all assessed companies. More information is available in the Reading Instructions in the introduction.
100
90
80
70
60
50
40
30
20
10
0
Max
3rd Quartile
Median
1st Quartile
Min
79 77
30 29 32
20
9186
2 5 0 0
Tota
l Su
stai
nabi
lity
Scor
e
Econ
omic
D
imen
sion
Sco
re
Envi
ronm
enta
l D
imen
sion
Sco
re
Soci
al
Dim
ensi
on S
core
Results at industry level
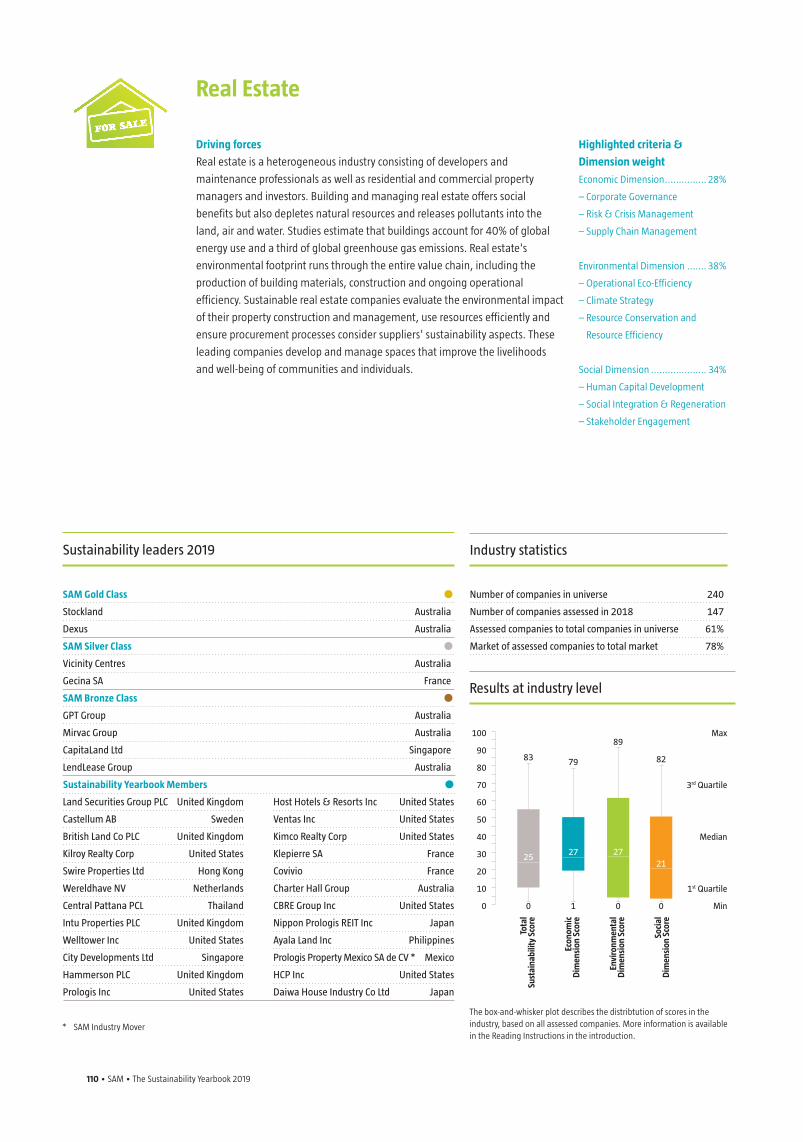
110 • SAM • The Sustainability Yearbook 2019 The Sustainability Yearbook 2019 • SAM • 111
Driving forces
Real estate is a heterogeneous industry consisting of developers and
maintenance professionals as well as residential and commercial property
managers and investors. Building and managing real estate offers social
benefits but also depletes natural resources and releases pollutants into the
land, air and water. Studies estimate that buildings account for 40% of global
energy use and a third of global greenhouse gas emissions. Real estate's
environmental footprint runs through the entire value chain, including the
production of building materials, construction and ongoing operational
efficiency. Sustainable real estate companies evaluate the environmental impact
of their property construction and management, use resources efficiently and
ensure procurement processes consider suppliers' sustainability aspects. These
leading companies develop and manage spaces that improve the livelihoods
and well-being of communities and individuals.
Real Estate
Highlighted criteria &
Dimension weight
Economic Dimension ............... 28%
– Corporate Governance
– Risk & Crisis Management
– Supply Chain Management
Environmental Dimension ....... 38%
– Operational Eco-Efficiency
– Climate Strategy
– Resource Conservation and
Resource Efficiency
Social Dimension .................... 34%
– Human Capital Development
– Social Integration & Regeneration
– Stakeholder Engagement
Industry statistics
Number of companies in universe 240
Number of companies assessed in 2018 147
Assessed companies to total companies in universe 61%
Market of assessed companies to total market 78%
Stockland Australia
Dexus Australia
SAM Silver Class •Vicinity Centres Australia
Gecina SA France
SAM Bronze Class •GPT Group Australia
Mirvac Group Australia
CapitaLand Ltd Singapore
LendLease Group Australia
Land Securities Group PLC United Kingdom
Castellum AB Sweden
British Land Co PLC United Kingdom
Kilroy Realty Corp United States
Swire Properties Ltd Hong Kong
Wereldhave NV Netherlands
Central Pattana PCL Thailand
Intu Properties PLC United Kingdom
Welltower Inc United States
City Developments Ltd Singapore
Hammerson PLC United Kingdom
Prologis Inc United States
Host Hotels & Resorts Inc United States
Ventas Inc United States
Kimco Realty Corp United States
Klepierre SA France
Covivio France
Charter Hall Group Australia
CBRE Group Inc United States
Nippon Prologis REIT Inc Japan
Ayala Land Inc Philippines
Prologis Property Mexico SA de CV * Mexico
HCP Inc United States
Daiwa House Industry Co Ltd Japan
Sustainability leaders 2019
SAM Gold Class •
Sustainability Yearbook Members •
* SAM Industry Mover
The box-and-whisker plot describes the distribtution of scores in the industry, based on all assessed companies. More information is available in the Reading Instructions in the introduction.
Max
3rd Quartile
Median
1st Quartile
Min
83 79
25 27 2721
89
82
0 1 0 0
Tota
l Su
stai
nabi
lity
Scor
e
Econ
omic
D
imen
sion
Sco
re
Envi
ronm
enta
l D
imen
sion
Sco
re
Soci
al
Dim
ensi
on S
core
Results at industry level
100
90
80
70
60
50
40
30
20
10
0
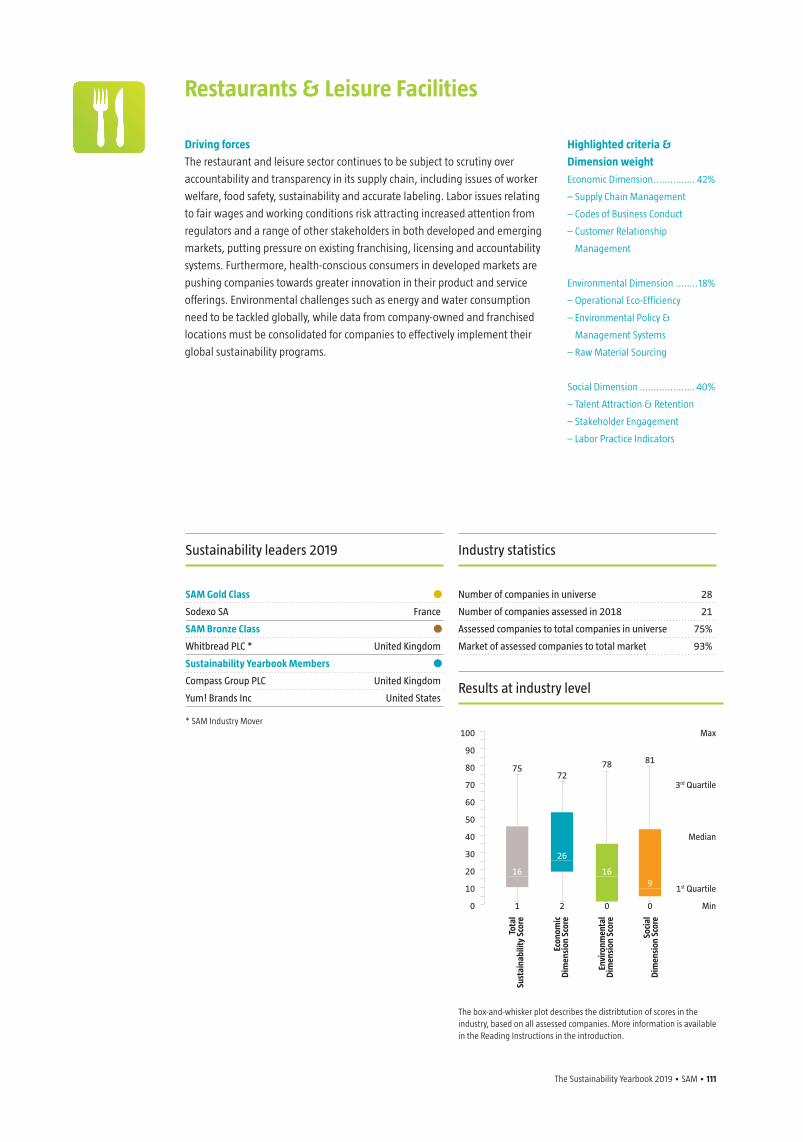
The Sustainability Yearbook 2019 • SAM • 111
Driving forces
The restaurant and leisure sector continues to be subject to scrutiny over
accountability and transparency in its supply chain, including issues of worker
welfare, food safety, sustainability and accurate labeling. Labor issues relating
to fair wages and working conditions risk attracting increased attention from
regulators and a range of other stakeholders in both developed and emerging
markets, putting pressure on existing franchising, licensing and accountability
systems. Furthermore, health-conscious consumers in developed markets are
pushing companies towards greater innovation in their product and service
offerings. Environmental challenges such as energy and water consumption
need to be tackled globally, while data from company-owned and franchised
locations must be consolidated for companies to effectively implement their
global sustainability programs.
Restaurants & Leisure Facilities
Highlighted criteria &
Dimension weight
Economic Dimension ............... 42%
– Supply Chain Management
– Codes of Business Conduct
– Customer Relationship
Management
Environmental Dimension ........18%
– Operational Eco-Efficiency
– Environmental Policy &
Management Systems
– Raw Material Sourcing
Social Dimension .................... 40%
– Talent Attraction & Retention
– Stakeholder Engagement
– Labor Practice Indicators
Industry statistics
Number of companies in universe 28
Number of companies assessed in 2018 21
Assessed companies to total companies in universe 75%
Market of assessed companies to total market 93%
Sustainability leaders 2019
SAM Gold Class •Sodexo SA France
SAM Bronze Class •Whitbread PLC * United Kingdom
Sustainability Yearbook Members •Compass Group PLC United Kingdom
Yum! Brands Inc United States
* SAM Industry Mover
The box-and-whisker plot describes the distribtution of scores in the industry, based on all assessed companies. More information is available in the Reading Instructions in the introduction.
100
90
80
70
60
50
40
30
20
10
0
Max
3rd Quartile
Median
1st Quartile
Min
7572
16
26
169
78 81
1 2 0 0
Tota
l Su
stai
nabi
lity
Scor
e
Econ
omic
D
imen
sion
Sco
re
Envi
ronm
enta
l D
imen
sion
Sco
re
Soci
al
Dim
ensi
on S
core
Results at industry level
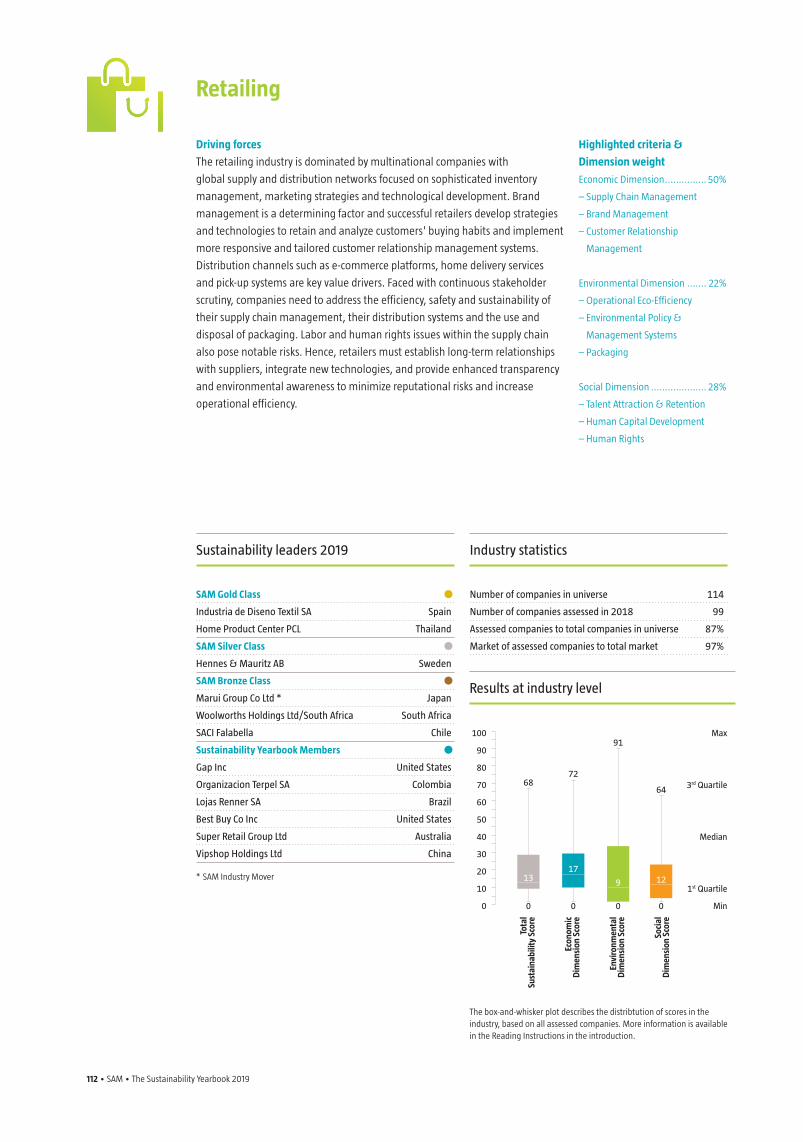
112 • SAM • The Sustainability Yearbook 2019 The Sustainability Yearbook 2019 • SAM • 113
Driving forces
The retailing industry is dominated by multinational companies with
global supply and distribution networks focused on sophisticated inventory
management, marketing strategies and technological development. Brand
management is a determining factor and successful retailers develop strategies
and technologies to retain and analyze customers' buying habits and implement
more responsive and tailored customer relationship management systems.
Distribution channels such as e-commerce platforms, home delivery services
and pick-up systems are key value drivers. Faced with continuous stakeholder
scrutiny, companies need to address the efficiency, safety and sustainability of
their supply chain management, their distribution systems and the use and
disposal of packaging. Labor and human rights issues within the supply chain
also pose notable risks. Hence, retailers must establish long-term relationships
with suppliers, integrate new technologies, and provide enhanced transparency
and environmental awareness to minimize reputational risks and increase
operational efficiency.
Retailing
Highlighted criteria &
Dimension weight
Economic Dimension ............... 50%
– Supply Chain Management
– Brand Management
– Customer Relationship
Management
Environmental Dimension ....... 22%
– Operational Eco-Efficiency
– Environmental Policy &
Management Systems
– Packaging
Social Dimension .................... 28%
– Talent Attraction & Retention
– Human Capital Development
– Human Rights
Industry statistics
Number of companies in universe 114
Number of companies assessed in 2018 99
Assessed companies to total companies in universe 87%
Market of assessed companies to total market 97%
Sustainability leaders 2019
SAM Gold Class •Industria de Diseno Textil SA Spain
Home Product Center PCL Thailand
SAM Silver Class •Hennes & Mauritz AB Sweden
SAM Bronze Class •Marui Group Co Ltd * Japan
Woolworths Holdings Ltd/South Africa South Africa
SACI Falabella Chile
Sustainability Yearbook Members •Gap Inc United States
Organizacion Terpel SA Colombia
Lojas Renner SA Brazil
Best Buy Co Inc United States
Super Retail Group Ltd Australia
Vipshop Holdings Ltd China
* SAM Industry Mover
The box-and-whisker plot describes the distribtution of scores in the industry, based on all assessed companies. More information is available in the Reading Instructions in the introduction.
Max
3rd Quartile
Median
1st Quartile
Min
6872
1317
9 12
91
64
0 0 0 0
Tota
l Su
stai
nabi
lity
Scor
e
Econ
omic
D
imen
sion
Sco
re
Envi
ronm
enta
l D
imen
sion
Sco
re
Soci
al
Dim
ensi
on S
core
Results at industry level
100
90
80
70
60
50
40
30
20
10
0
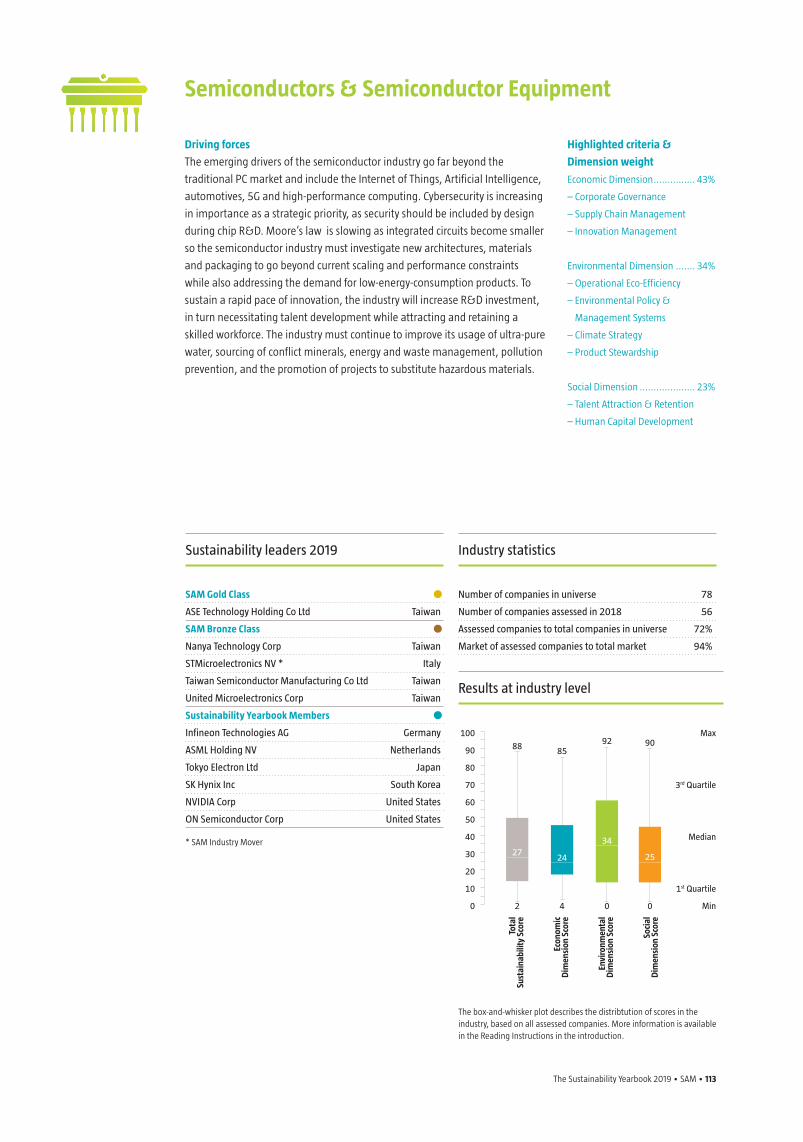
The Sustainability Yearbook 2019 • SAM • 113
Driving forces
The emerging drivers of the semiconductor industry go far beyond the
traditional PC market and include the Internet of Things, Artificial Intelligence,
automotives, 5G and high-performance computing. Cybersecurity is increasing
in importance as a strategic priority, as security should be included by design
during chip R&D. Moore’s law is slowing as integrated circuits become smaller
so the semiconductor industry must investigate new architectures, materials
and packaging to go beyond current scaling and performance constraints
while also addressing the demand for low-energy-consumption products. To
sustain a rapid pace of innovation, the industry will increase R&D investment,
in turn necessitating talent development while attracting and retaining a
skilled workforce. The industry must continue to improve its usage of ultra-pure
water, sourcing of conflict minerals, energy and waste management, pollution
prevention, and the promotion of projects to substitute hazardous materials.
Semiconductors & Semiconductor Equipment
Highlighted criteria &
Dimension weight
Economic Dimension ............... 43%
– Corporate Governance
– Supply Chain Management
– Innovation Management
Environmental Dimension ....... 34%
– Operational Eco-Efficiency
– Environmental Policy &
Management Systems
– Climate Strategy
– Product Stewardship
Social Dimension .................... 23%
– Talent Attraction & Retention
– Human Capital Development
Industry statistics
Number of companies in universe 78
Number of companies assessed in 2018 56
Assessed companies to total companies in universe 72%
Market of assessed companies to total market 94%
Sustainability leaders 2019
SAM Gold Class •ASE Technology Holding Co Ltd Taiwan
SAM Bronze Class •Nanya Technology Corp Taiwan
STMicroelectronics NV * Italy
Taiwan Semiconductor Manufacturing Co Ltd Taiwan
United Microelectronics Corp Taiwan
Sustainability Yearbook Members •Infineon Technologies AG Germany
ASML Holding NV Netherlands
Tokyo Electron Ltd Japan
SK Hynix Inc South Korea
NVIDIA Corp United States
ON Semiconductor Corp United States
* SAM Industry Mover
The box-and-whisker plot describes the distribtution of scores in the industry, based on all assessed companies. More information is available in the Reading Instructions in the introduction.
100
90
80
70
60
50
40
30
20
10
0
Max
3rd Quartile
Median
1st Quartile
Min
88 85
2724
34
25
92 90
2 4 0 0
Tota
l Su
stai
nabi
lity
Scor
e
Econ
omic
D
imen
sion
Sco
re
Envi
ronm
enta
l D
imen
sion
Sco
re
Soci
al
Dim
ensi
on S
core
Results at industry level
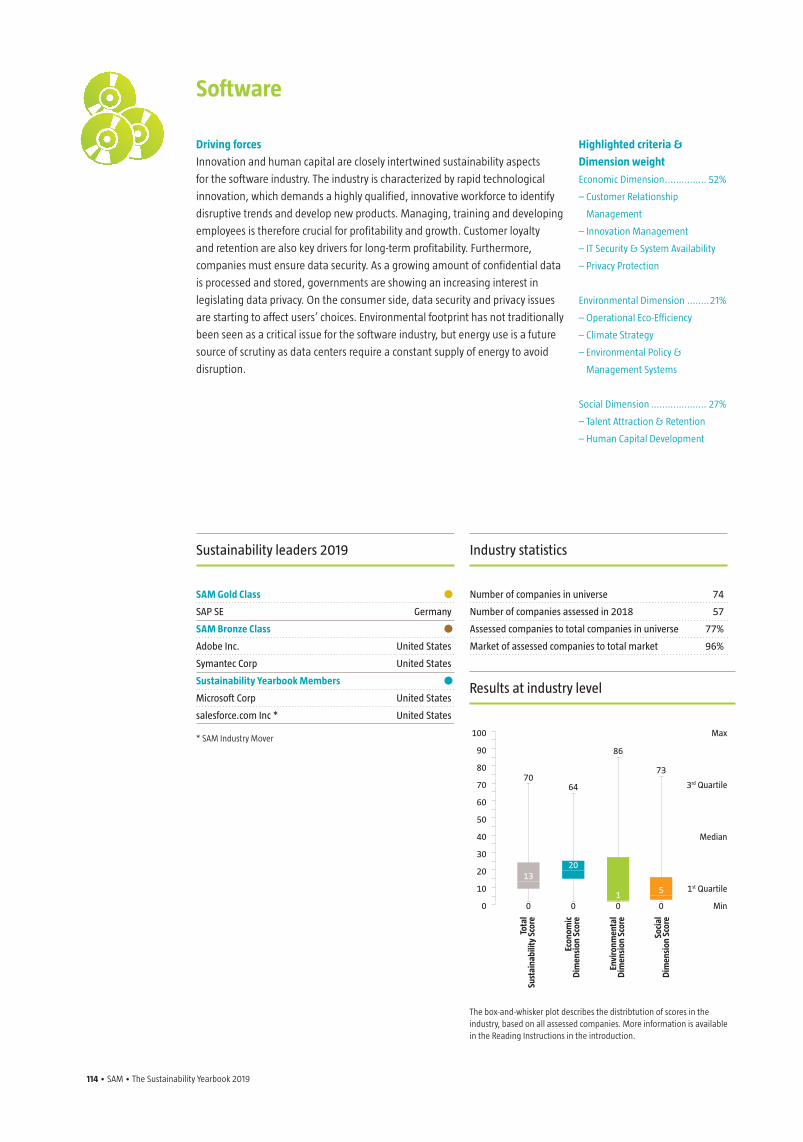
114 • SAM • The Sustainability Yearbook 2019 The Sustainability Yearbook 2019 • SAM • 115
Driving forces
Innovation and human capital are closely intertwined sustainability aspects
for the software industry. The industry is characterized by rapid technological
innovation, which demands a highly qualified, innovative workforce to identify
disruptive trends and develop new products. Managing, training and developing
employees is therefore crucial for profitability and growth. Customer loyalty
and retention are also key drivers for long-term profitability. Furthermore,
companies must ensure data security. As a growing amount of confidential data
is processed and stored, governments are showing an increasing interest in
legislating data privacy. On the consumer side, data security and privacy issues
are starting to affect users’ choices. Environmental footprint has not traditionally
been seen as a critical issue for the software industry, but energy use is a future
source of scrutiny as data centers require a constant supply of energy to avoid
disruption.
Software
Highlighted criteria &
Dimension weight
Economic Dimension ............... 52%
– Customer Relationship
Management
– Innovation Management
– IT Security & System Availability
– Privacy Protection
Environmental Dimension ........21%
– Operational Eco-Efficiency
– Climate Strategy
– Environmental Policy &
Management Systems
Social Dimension .................... 27%
– Talent Attraction & Retention
– Human Capital Development
Industry statistics
Number of companies in universe 74
Number of companies assessed in 2018 57
Assessed companies to total companies in universe 77%
Market of assessed companies to total market 96%
Sustainability leaders 2019
SAM Gold Class •SAP SE Germany
SAM Bronze Class •Adobe Inc. United States
Symantec Corp United States
Sustainability Yearbook Members •Microsoft Corp United States
salesforce.com Inc * United States
* SAM Industry Mover
The box-and-whisker plot describes the distribtution of scores in the industry, based on all assessed companies. More information is available in the Reading Instructions in the introduction.
Max
3rd Quartile
Median
1st Quartile
Min
7064
1320
1 5
86
73
0 0 0 0
Tota
l Su
stai
nabi
lity
Scor
e
Econ
omic
D
imen
sion
Sco
re
Envi
ronm
enta
l D
imen
sion
Sco
re
Soci
al
Dim
ensi
on S
core
Results at industry level
100
90
80
70
60
50
40
30
20
10
0
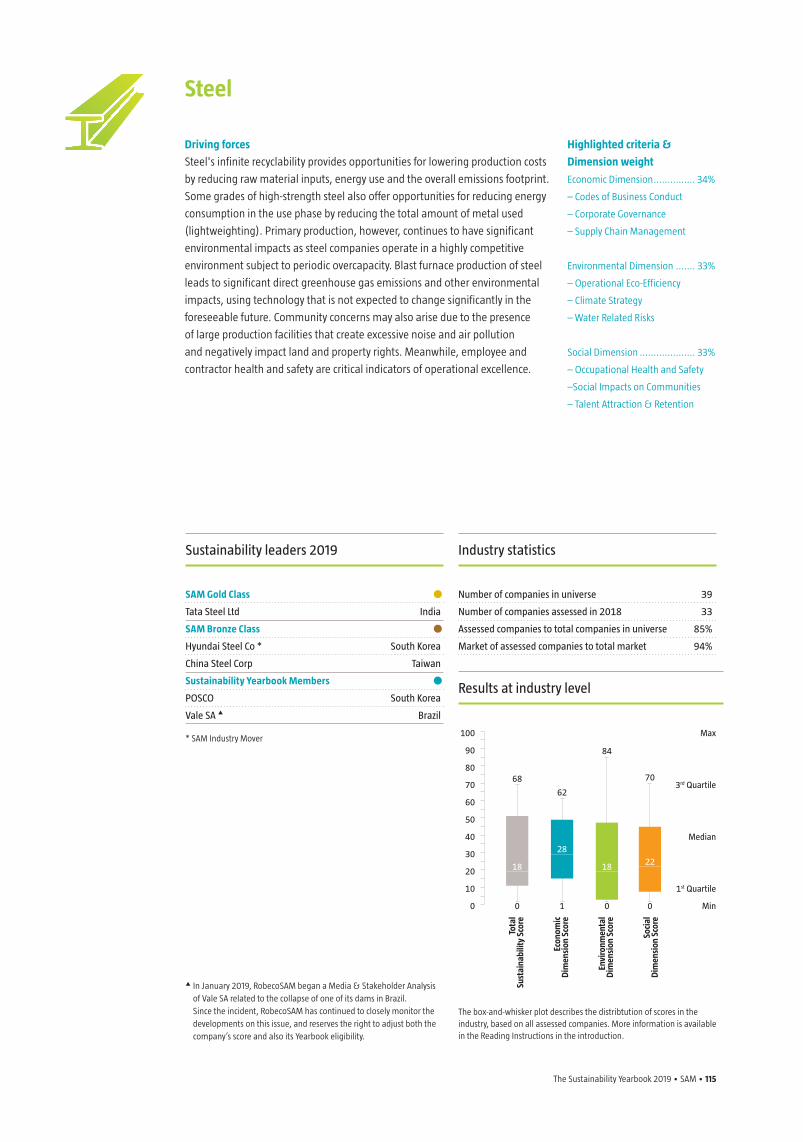
The Sustainability Yearbook 2019 • SAM • 115
Driving forces
Steel's infinite recyclability provides opportunities for lowering production costs
by reducing raw material inputs, energy use and the overall emissions footprint.
Some grades of high-strength steel also offer opportunities for reducing energy
consumption in the use phase by reducing the total amount of metal used
(lightweighting). Primary production, however, continues to have significant
environmental impacts as steel companies operate in a highly competitive
environment subject to periodic overcapacity. Blast furnace production of steel
leads to significant direct greenhouse gas emissions and other environmental
impacts, using technology that is not expected to change significantly in the
foreseeable future. Community concerns may also arise due to the presence
of large production facilities that create excessive noise and air pollution
and negatively impact land and property rights. Meanwhile, employee and
contractor health and safety are critical indicators of operational excellence.
Steel
Highlighted criteria &
Dimension weight
Economic Dimension ............... 34%
– Codes of Business Conduct
– Corporate Governance
– Supply Chain Management
Environmental Dimension ....... 33%
– Operational Eco-Efficiency
– Climate Strategy
– Water Related Risks
Social Dimension .................... 33%
– Occupational Health and Safety
–Social Impacts on Communities
– Talent Attraction & Retention
Industry statistics
Number of companies in universe 39
Number of companies assessed in 2018 33
Assessed companies to total companies in universe 85%
Market of assessed companies to total market 94%
Sustainability leaders 2019
SAM Gold Class •Tata Steel Ltd India
SAM Bronze Class •Hyundai Steel Co * South Korea
China Steel Corp Taiwan
Sustainability Yearbook Members •POSCO South Korea
Vale SA p Brazil
* SAM Industry Mover
p In January 2019, RobecoSAM began a Media & Stakeholder Analysis of Vale SA related to the collapse of one of its dams in Brazil.
Since the incident, RobecoSAM has continued to closely monitor the developments on this issue, and reserves the right to adjust both the company’s score and also its Yearbook eligibility.
The box-and-whisker plot describes the distribtution of scores in the industry, based on all assessed companies. More information is available in the Reading Instructions in the introduction.
100
90
80
70
60
50
40
30
20
10
0
Max
3rd Quartile
Median
1st Quartile
Min
68
62
18
28
18 22
84
70
0 1 0 0
Tota
l Su
stai
nabi
lity
Scor
e
Econ
omic
D
imen
sion
Sco
re
Envi
ronm
enta
l D
imen
sion
Sco
re
Soci
al
Dim
ensi
on S
core
Results at industry level
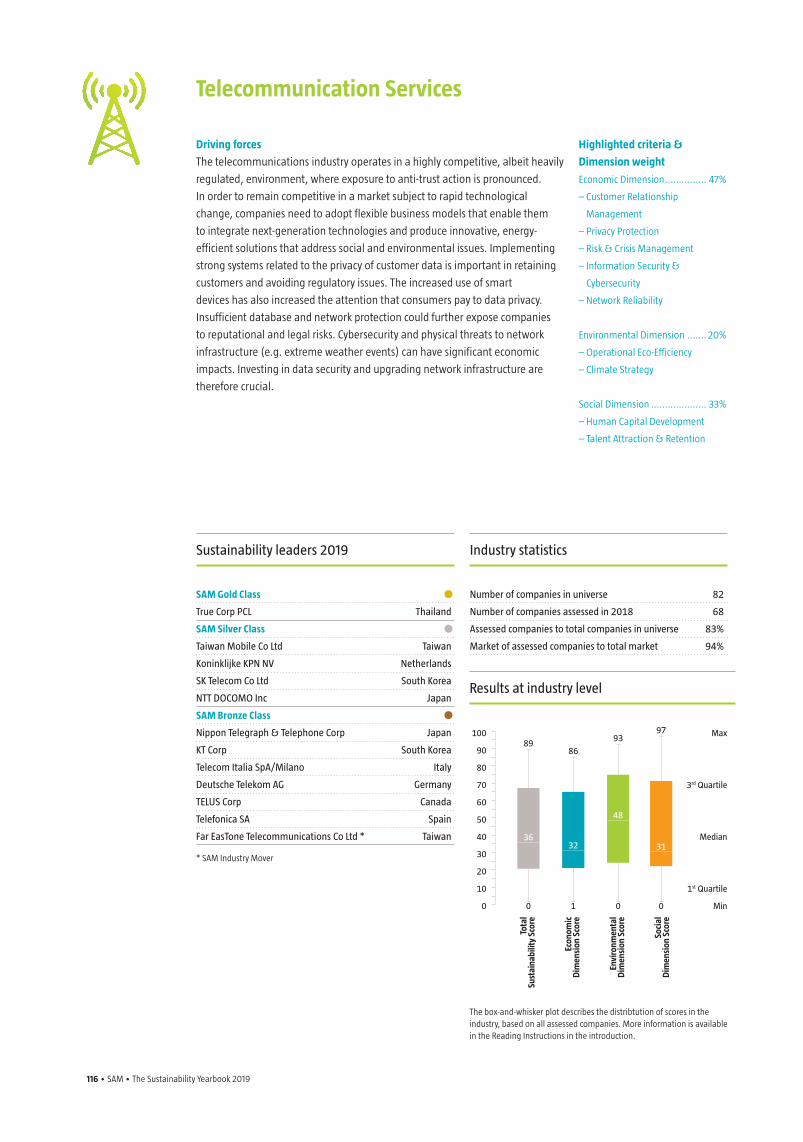
116 • SAM • The Sustainability Yearbook 2019 The Sustainability Yearbook 2019 • SAM • 117
Driving forces
The telecommunications industry operates in a highly competitive, albeit heavily
regulated, environment, where exposure to anti-trust action is pronounced.
In order to remain competitive in a market subject to rapid technological
change, companies need to adopt flexible business models that enable them
to integrate next-generation technologies and produce innovative, energy-
efficient solutions that address social and environmental issues. Implementing
strong systems related to the privacy of customer data is important in retaining
customers and avoiding regulatory issues. The increased use of smart
devices has also increased the attention that consumers pay to data privacy.
Insufficient database and network protection could further expose companies
to reputational and legal risks. Cybersecurity and physical threats to network
infrastructure (e.g. extreme weather events) can have significant economic
impacts. Investing in data security and upgrading network infrastructure are
therefore crucial.
Telecommunication Services
Highlighted criteria &
Dimension weight
Economic Dimension ............... 47%
– Customer Relationship
Management
– Privacy Protection
– Risk & Crisis Management
– Information Security &
Cybersecurity
– Network Reliability
Environmental Dimension ....... 20%
– Operational Eco-Efficiency
– Climate Strategy
Social Dimension .................... 33%
– Human Capital Development
– Talent Attraction & Retention
Industry statistics
Number of companies in universe 82
Number of companies assessed in 2018 68
Assessed companies to total companies in universe 83%
Market of assessed companies to total market 94%
Sustainability leaders 2019
SAM Gold Class •True Corp PCL Thailand
SAM Silver Class •Taiwan Mobile Co Ltd Taiwan
Koninklijke KPN NV Netherlands
SK Telecom Co Ltd South Korea
NTT DOCOMO Inc Japan
SAM Bronze Class •Nippon Telegraph & Telephone Corp Japan
KT Corp South Korea
Telecom Italia SpA/Milano Italy
Deutsche Telekom AG Germany
TELUS Corp Canada
Telefonica SA Spain
Far EasTone Telecommunications Co Ltd * Taiwan
* SAM Industry Mover
The box-and-whisker plot describes the distribtution of scores in the industry, based on all assessed companies. More information is available in the Reading Instructions in the introduction.
Max
3rd Quartile
Median
1st Quartile
Min
8986
3632
48
31
9397
0 1 0 0
Tota
l Su
stai
nabi
lity
Scor
e
Econ
omic
D
imen
sion
Sco
re
Envi
ronm
enta
l D
imen
sion
Sco
re
Soci
al
Dim
ensi
on S
core
Results at industry level
100
90
80
70
60
50
40
30
20
10
0
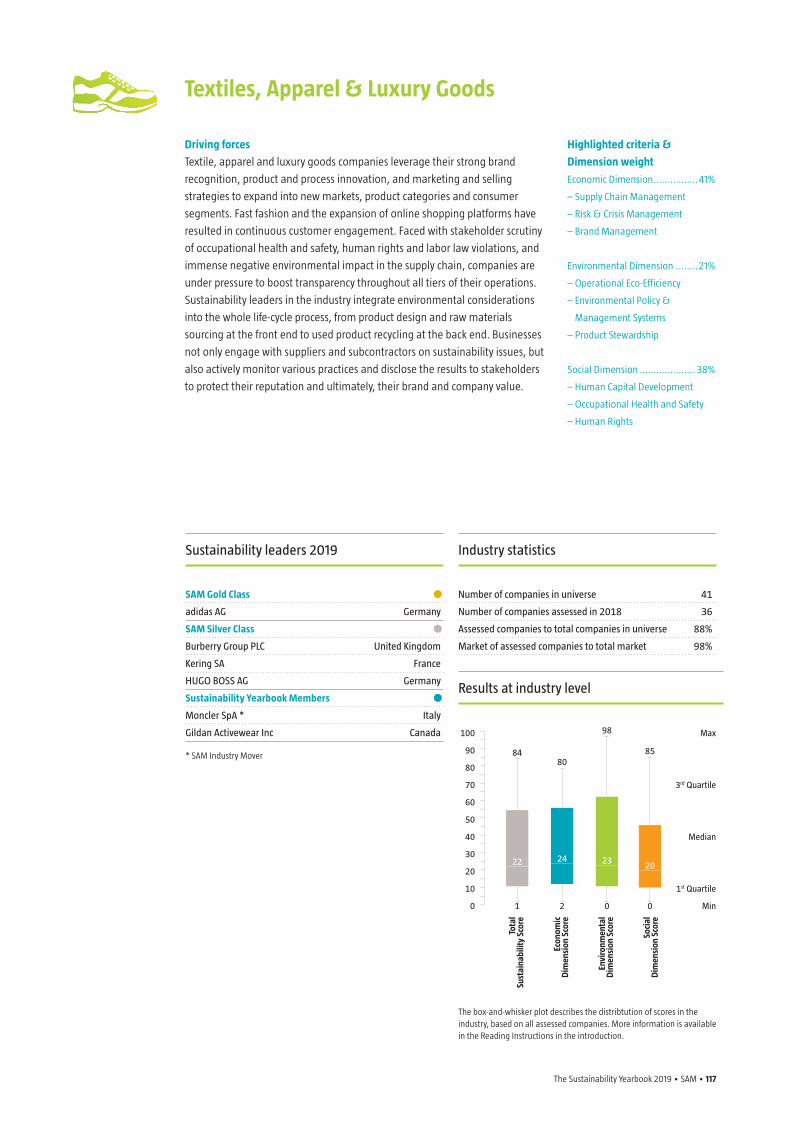
The Sustainability Yearbook 2019 • SAM • 117
Driving forces
Textile, apparel and luxury goods companies leverage their strong brand
recognition, product and process innovation, and marketing and selling
strategies to expand into new markets, product categories and consumer
segments. Fast fashion and the expansion of online shopping platforms have
resulted in continuous customer engagement. Faced with stakeholder scrutiny
of occupational health and safety, human rights and labor law violations, and
immense negative environmental impact in the supply chain, companies are
under pressure to boost transparency throughout all tiers of their operations.
Sustainability leaders in the industry integrate environmental considerations
into the whole life-cycle process, from product design and raw materials
sourcing at the front end to used product recycling at the back end. Businesses
not only engage with suppliers and subcontractors on sustainability issues, but
also actively monitor various practices and disclose the results to stakeholders
to protect their reputation and ultimately, their brand and company value.
Textiles, Apparel & Luxury Goods
Highlighted criteria &
Dimension weight
Economic Dimension ................41%
– Supply Chain Management
– Risk & Crisis Management
– Brand Management
Environmental Dimension ........21%
– Operational Eco-Efficiency
– Environmental Policy &
Management Systems
– Product Stewardship
Social Dimension .................... 38%
– Human Capital Development
– Occupational Health and Safety
– Human Rights
Industry statistics
Number of companies in universe 41
Number of companies assessed in 2018 36
Assessed companies to total companies in universe 88%
Market of assessed companies to total market 98%
Sustainability leaders 2019
SAM Gold Class •adidas AG Germany
SAM Silver Class •Burberry Group PLC United Kingdom
Kering SA France
HUGO BOSS AG Germany
Sustainability Yearbook Members •Moncler SpA * Italy
Gildan Activewear Inc Canada
* SAM Industry Mover
The box-and-whisker plot describes the distribtution of scores in the industry, based on all assessed companies. More information is available in the Reading Instructions in the introduction.
100
90
80
70
60
50
40
30
20
10
0
Max
3rd Quartile
Median
1st Quartile
Min
8480
22 24 23 20
98
85
1 2 0 0
Tota
l Su
stai
nabi
lity
Scor
e
Econ
omic
D
imen
sion
Sco
re
Envi
ronm
enta
l D
imen
sion
Sco
re
Soci
al
Dim
ensi
on S
core
Results at industry level
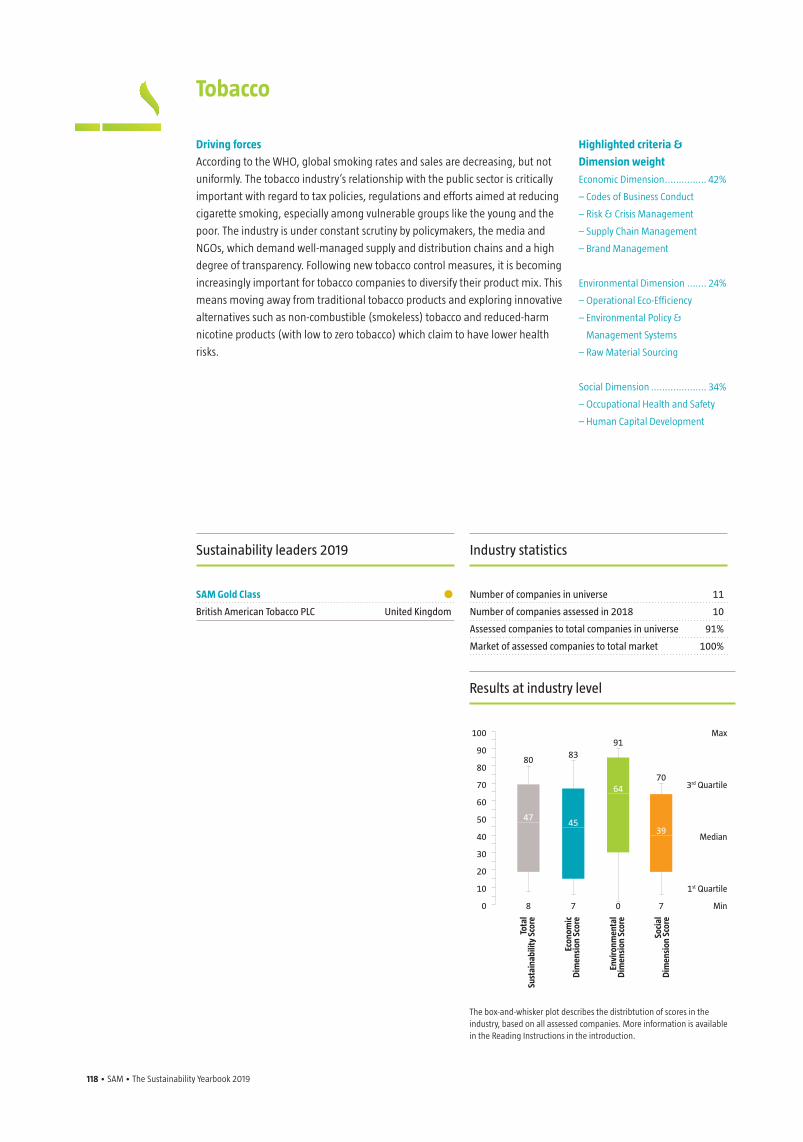
118 • SAM • The Sustainability Yearbook 2019 The Sustainability Yearbook 2019 • SAM • 119
Driving forces
According to the WHO, global smoking rates and sales are decreasing, but not
uniformly. The tobacco industry’s relationship with the public sector is critically
important with regard to tax policies, regulations and efforts aimed at reducing
cigarette smoking, especially among vulnerable groups like the young and the
poor. The industry is under constant scrutiny by policymakers, the media and
NGOs, which demand well-managed supply and distribution chains and a high
degree of transparency. Following new tobacco control measures, it is becoming
increasingly important for tobacco companies to diversify their product mix. This
means moving away from traditional tobacco products and exploring innovative
alternatives such as non-combustible (smokeless) tobacco and reduced-harm
nicotine products (with low to zero tobacco) which claim to have lower health
risks.
Tobacco
Highlighted criteria &
Dimension weight
Economic Dimension ............... 42%
– Codes of Business Conduct
– Risk & Crisis Management
– Supply Chain Management
– Brand Management
Environmental Dimension ....... 24%
– Operational Eco-Efficiency
– Environmental Policy &
Management Systems
– Raw Material Sourcing
Social Dimension .................... 34%
– Occupational Health and Safety
– Human Capital Development
Industry statistics
Number of companies in universe 11
Number of companies assessed in 2018 10
Assessed companies to total companies in universe 91%
Market of assessed companies to total market 100%
Sustainability leaders 2019
SAM Gold Class •British American Tobacco PLC United Kingdom
The box-and-whisker plot describes the distribtution of scores in the industry, based on all assessed companies. More information is available in the Reading Instructions in the introduction.
Max
3rd Quartile
Median
1st Quartile
Min
8083
4745
64
39
91
70
8 7 0 7
Tota
l Su
stai
nabi
lity
Scor
e
Econ
omic
D
imen
sion
Sco
re
Envi
ronm
enta
l D
imen
sion
Sco
re
Soci
al
Dim
ensi
on S
core
Results at industry level
100
90
80
70
60
50
40
30
20
10
0
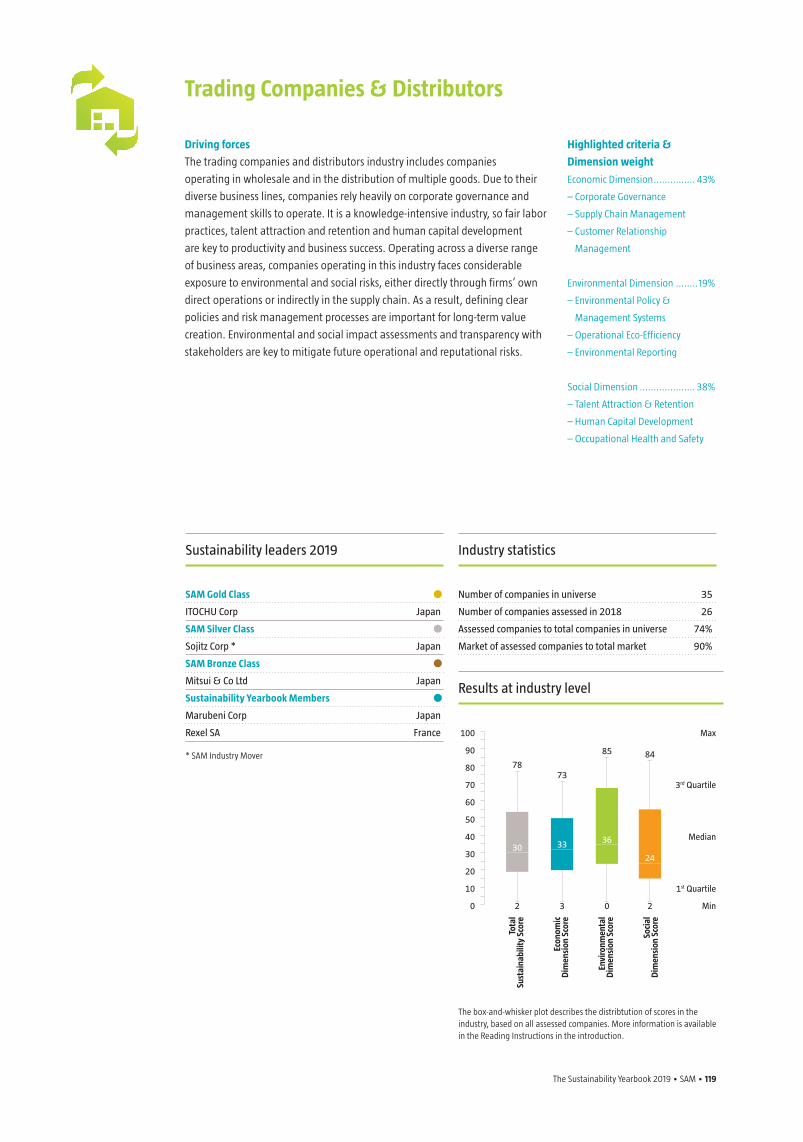
The Sustainability Yearbook 2019 • SAM • 119
Driving forces
The trading companies and distributors industry includes companies
operating in wholesale and in the distribution of multiple goods. Due to their
diverse business lines, companies rely heavily on corporate governance and
management skills to operate. It is a knowledge-intensive industry, so fair labor
practices, talent attraction and retention and human capital development
are key to productivity and business success. Operating across a diverse range
of business areas, companies operating in this industry faces considerable
exposure to environmental and social risks, either directly through firms’ own
direct operations or indirectly in the supply chain. As a result, defining clear
policies and risk management processes are important for long-term value
creation. Environmental and social impact assessments and transparency with
stakeholders are key to mitigate future operational and reputational risks.
Trading Companies & Distributors
Highlighted criteria &
Dimension weight
Economic Dimension ............... 43%
– Corporate Governance
– Supply Chain Management
– Customer Relationship
Management
Environmental Dimension ........19%
– Environmental Policy &
Management Systems
– Operational Eco-Efficiency
– Environmental Reporting
Social Dimension .................... 38%
– Talent Attraction & Retention
– Human Capital Development
– Occupational Health and Safety
Industry statistics
Number of companies in universe 35
Number of companies assessed in 2018 26
Assessed companies to total companies in universe 74%
Market of assessed companies to total market 90%
Sustainability leaders 2019
SAM Gold Class •ITOCHU Corp Japan
SAM Silver Class •Sojitz Corp * Japan
SAM Bronze Class •Mitsui & Co Ltd Japan
Sustainability Yearbook Members •Marubeni Corp Japan
Rexel SA France
* SAM Industry Mover
The box-and-whisker plot describes the distribtution of scores in the industry, based on all assessed companies. More information is available in the Reading Instructions in the introduction.
100
90
80
70
60
50
40
30
20
10
0
Max
3rd Quartile
Median
1st Quartile
Min
7873
30 33 36
24
85 84
2 3 0 2
Tota
l Su
stai
nabi
lity
Scor
e
Econ
omic
D
imen
sion
Sco
re
Envi
ronm
enta
l D
imen
sion
Sco
re
Soci
al
Dim
ensi
on S
core
Results at industry level
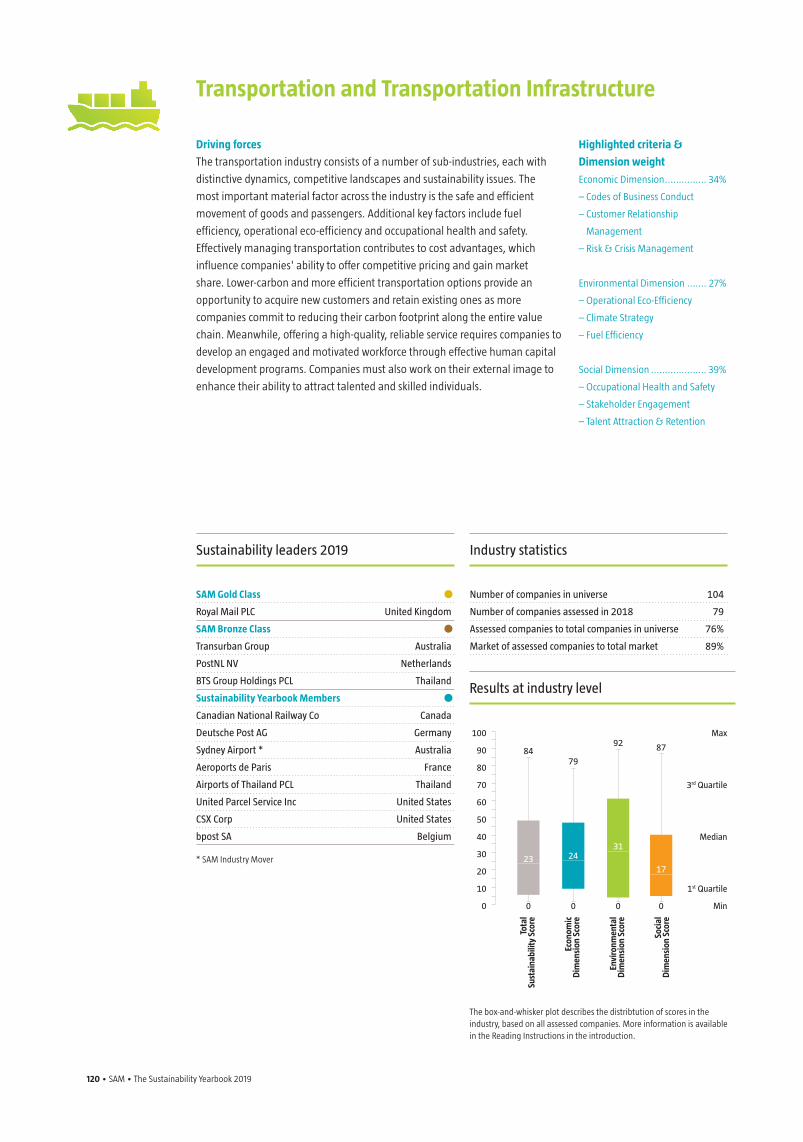
120 • SAM • The Sustainability Yearbook 2019 The Sustainability Yearbook 2019 • SAM • 121
Driving forces
The transportation industry consists of a number of sub-industries, each with
distinctive dynamics, competitive landscapes and sustainability issues. The
most important material factor across the industry is the safe and efficient
movement of goods and passengers. Additional key factors include fuel
efficiency, operational eco-efficiency and occupational health and safety.
Effectively managing transportation contributes to cost advantages, which
influence companies' ability to offer competitive pricing and gain market
share. Lower-carbon and more efficient transportation options provide an
opportunity to acquire new customers and retain existing ones as more
companies commit to reducing their carbon footprint along the entire value
chain. Meanwhile, offering a high-quality, reliable service requires companies to
develop an engaged and motivated workforce through effective human capital
development programs. Companies must also work on their external image to
enhance their ability to attract talented and skilled individuals.
Transportation and Transportation Infrastructure
Highlighted criteria &
Dimension weight
Economic Dimension ............... 34%
– Codes of Business Conduct
– Customer Relationship
Management
– Risk & Crisis Management
Environmental Dimension ....... 27%
– Operational Eco-Efficiency
– Climate Strategy
– Fuel Efficiency
Social Dimension .................... 39%
– Occupational Health and Safety
– Stakeholder Engagement
– Talent Attraction & Retention
Industry statistics
Number of companies in universe 104
Number of companies assessed in 2018 79
Assessed companies to total companies in universe 76%
Market of assessed companies to total market 89%
Sustainability leaders 2019
SAM Gold Class •Royal Mail PLC United Kingdom
SAM Bronze Class •Transurban Group Australia
PostNL NV Netherlands
BTS Group Holdings PCL Thailand
Sustainability Yearbook Members •Canadian National Railway Co Canada
Deutsche Post AG Germany
Sydney Airport * Australia
Aeroports de Paris France
Airports of Thailand PCL Thailand
United Parcel Service Inc United States
CSX Corp United States
bpost SA Belgium
* SAM Industry Mover
The box-and-whisker plot describes the distribtution of scores in the industry, based on all assessed companies. More information is available in the Reading Instructions in the introduction.
Max
3rd Quartile
Median
1st Quartile
Min
8479
23 2431
17
92 87
0 0 0 0
Tota
l Su
stai
nabi
lity
Scor
e
Econ
omic
D
imen
sion
Sco
re
Envi
ronm
enta
l D
imen
sion
Sco
re
Soci
al
Dim
ensi
on S
core
Results at industry level
100
90
80
70
60
50
40
30
20
10
0

The Sustainability Yearbook 2019 • SAM • 121
Company overview
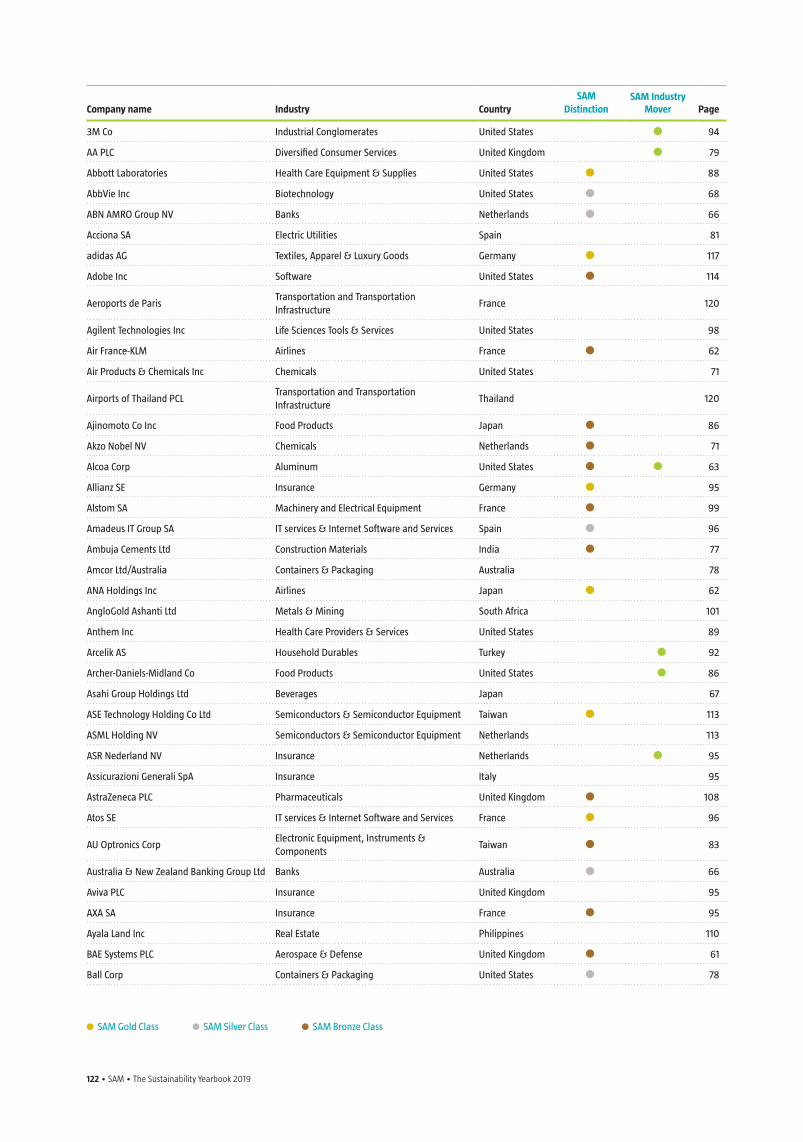
122 • SAM • The Sustainability Yearbook 2019 The Sustainability Yearbook 2019 • SAM • 123
Company name Industry CountrySAM
DistinctionSAM Industry
Mover Page
3M Co Industrial Conglomerates United States 94
AA PLC Diversified Consumer Services United Kingdom 79
Abbott Laboratories Health Care Equipment & Supplies United States 88
AbbVie Inc Biotechnology United States 68
ABN AMRO Group NV Banks Netherlands 66
Acciona SA Electric Utilities Spain 81
adidas AG Textiles, Apparel & Luxury Goods Germany 117
Adobe Inc Software United States 114
Aeroports de ParisTransportation and Transportation Infrastructure
France 120
Agilent Technologies Inc Life Sciences Tools & Services United States 98
Air France-KLM Airlines France 62
Air Products & Chemicals Inc Chemicals United States 71
Airports of Thailand PCLTransportation and Transportation Infrastructure
Thailand 120
Ajinomoto Co Inc Food Products Japan 86
Akzo Nobel NV Chemicals Netherlands 71
Alcoa Corp Aluminum United States 63
Allianz SE Insurance Germany 95
Alstom SA Machinery and Electrical Equipment France 99
Amadeus IT Group SA IT services & Internet Software and Services Spain 96
Ambuja Cements Ltd Construction Materials India 77
Amcor Ltd/Australia Containers & Packaging Australia 78
ANA Holdings Inc Airlines Japan 62
AngloGold Ashanti Ltd Metals & Mining South Africa 101
Anthem Inc Health Care Providers & Services United States 89
Arcelik AS Household Durables Turkey 92
Archer-Daniels-Midland Co Food Products United States 86
Asahi Group Holdings Ltd Beverages Japan 67
ASE Technology Holding Co Ltd Semiconductors & Semiconductor Equipment Taiwan 113
ASML Holding NV Semiconductors & Semiconductor Equipment Netherlands 113
ASR Nederland NV Insurance Netherlands 95
Assicurazioni Generali SpA Insurance Italy 95
AstraZeneca PLC Pharmaceuticals United Kingdom 108
Atos SE IT services & Internet Software and Services France 96
AU Optronics CorpElectronic Equipment, Instruments & Components
Taiwan 83
Australia & New Zealand Banking Group Ltd Banks Australia 66
Aviva PLC Insurance United Kingdom 95
AXA SA Insurance France 95
Ayala Land Inc Real Estate Philippines 110
BAE Systems PLC Aerospace & Defense United Kingdom 61
Ball Corp Containers & Packaging United States 78
SAM Gold Class SAM Silver Class SAM Bronze Class
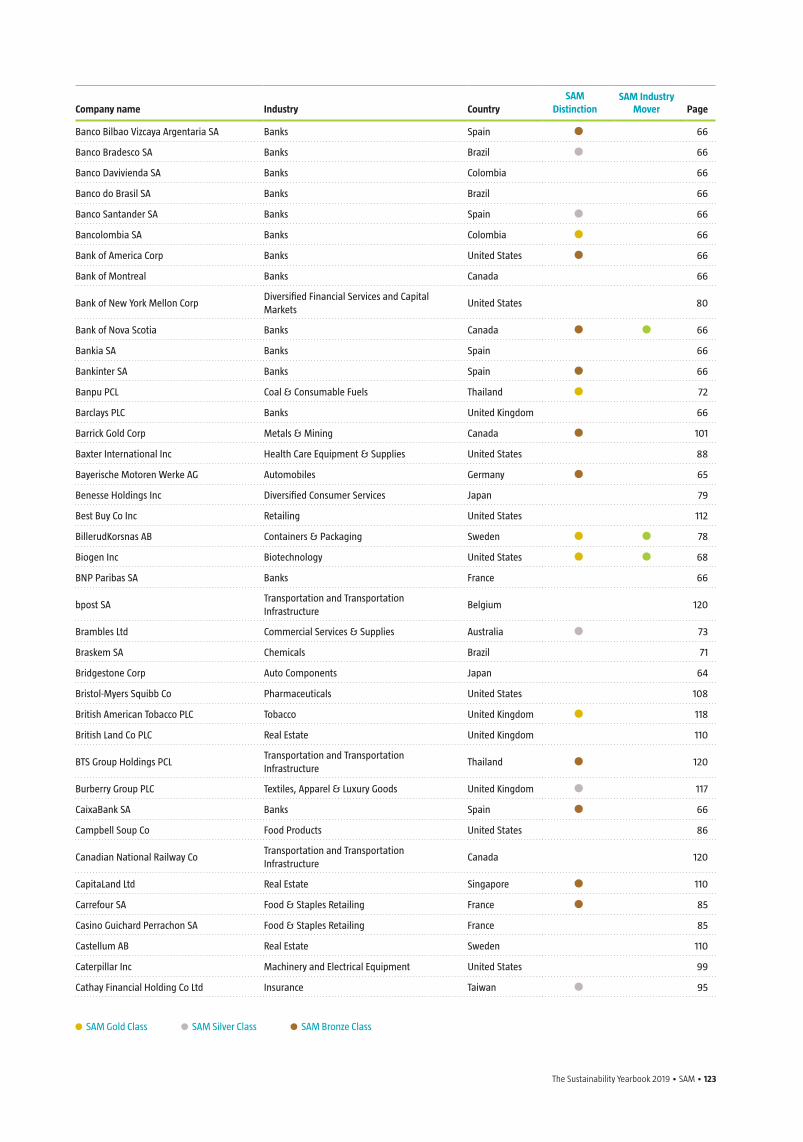
The Sustainability Yearbook 2019 • SAM • 123
Company name Industry CountrySAM
DistinctionSAM Industry
Mover Page
Banco Bilbao Vizcaya Argentaria SA Banks Spain 66
Banco Bradesco SA Banks Brazil 66
Banco Davivienda SA Banks Colombia 66
Banco do Brasil SA Banks Brazil 66
Banco Santander SA Banks Spain 66
Bancolombia SA Banks Colombia 66
Bank of America Corp Banks United States 66
Bank of Montreal Banks Canada 66
Bank of New York Mellon CorpDiversified Financial Services and Capital Markets
United States 80
Bank of Nova Scotia Banks Canada 66
Bankia SA Banks Spain 66
Bankinter SA Banks Spain 66
Banpu PCL Coal & Consumable Fuels Thailand 72
Barclays PLC Banks United Kingdom 66
Barrick Gold Corp Metals & Mining Canada 101
Baxter International Inc Health Care Equipment & Supplies United States 88
Bayerische Motoren Werke AG Automobiles Germany 65
Benesse Holdings Inc Diversified Consumer Services Japan 79
Best Buy Co Inc Retailing United States 112
BillerudKorsnas AB Containers & Packaging Sweden 78
Biogen Inc Biotechnology United States 68
BNP Paribas SA Banks France 66
bpost SATransportation and Transportation Infrastructure
Belgium 120
Brambles Ltd Commercial Services & Supplies Australia 73
Braskem SA Chemicals Brazil 71
Bridgestone Corp Auto Components Japan 64
Bristol-Myers Squibb Co Pharmaceuticals United States 108
British American Tobacco PLC Tobacco United Kingdom 118
British Land Co PLC Real Estate United Kingdom 110
BTS Group Holdings PCLTransportation and Transportation Infrastructure
Thailand 120
Burberry Group PLC Textiles, Apparel & Luxury Goods United Kingdom 117
CaixaBank SA Banks Spain 66
Campbell Soup Co Food Products United States 86
Canadian National Railway CoTransportation and Transportation Infrastructure
Canada 120
CapitaLand Ltd Real Estate Singapore 110
Carrefour SA Food & Staples Retailing France 85
Casino Guichard Perrachon SA Food & Staples Retailing France 85
Castellum AB Real Estate Sweden 110
Caterpillar Inc Machinery and Electrical Equipment United States 99
Cathay Financial Holding Co Ltd Insurance Taiwan 95
SAM Gold Class SAM Silver Class SAM Bronze Class
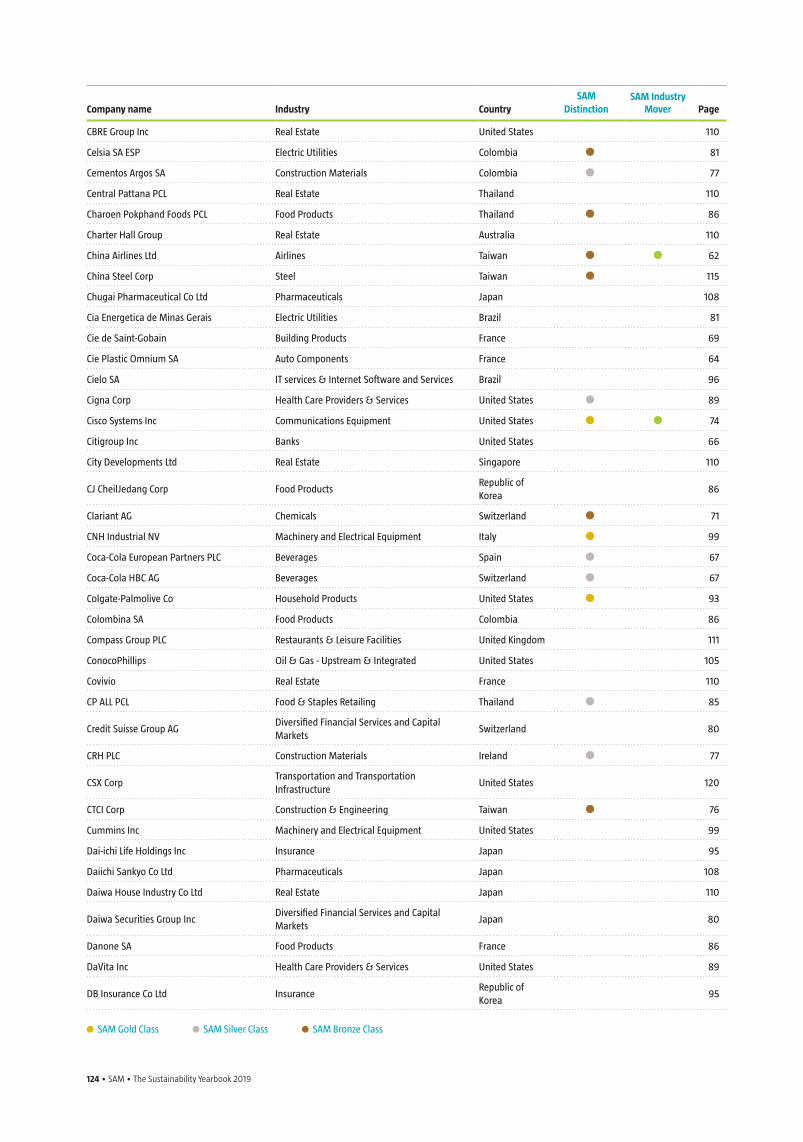
124 • SAM • The Sustainability Yearbook 2019 The Sustainability Yearbook 2019 • SAM • 125
Company name Industry CountrySAM
DistinctionSAM Industry
Mover Page
CBRE Group Inc Real Estate United States 110
Celsia SA ESP Electric Utilities Colombia 81
Cementos Argos SA Construction Materials Colombia 77
Central Pattana PCL Real Estate Thailand 110
Charoen Pokphand Foods PCL Food Products Thailand 86
Charter Hall Group Real Estate Australia 110
China Airlines Ltd Airlines Taiwan 62
China Steel Corp Steel Taiwan 115
Chugai Pharmaceutical Co Ltd Pharmaceuticals Japan 108
Cia Energetica de Minas Gerais Electric Utilities Brazil 81
Cie de Saint-Gobain Building Products France 69
Cie Plastic Omnium SA Auto Components France 64
Cielo SA IT services & Internet Software and Services Brazil 96
Cigna Corp Health Care Providers & Services United States 89
Cisco Systems Inc Communications Equipment United States 74
Citigroup Inc Banks United States 66
City Developments Ltd Real Estate Singapore 110
CJ CheilJedang Corp Food ProductsRepublic of Korea
86
Clariant AG Chemicals Switzerland 71
CNH Industrial NV Machinery and Electrical Equipment Italy 99
Coca-Cola European Partners PLC Beverages Spain 67
Coca-Cola HBC AG Beverages Switzerland 67
Colgate-Palmolive Co Household Products United States 93
Colombina SA Food Products Colombia 86
Compass Group PLC Restaurants & Leisure Facilities United Kingdom 111
ConocoPhillips Oil & Gas - Upstream & Integrated United States 105
Covivio Real Estate France 110
CP ALL PCL Food & Staples Retailing Thailand 85
Credit Suisse Group AGDiversified Financial Services and Capital Markets
Switzerland 80
CRH PLC Construction Materials Ireland 77
CSX CorpTransportation and Transportation Infrastructure
United States 120
CTCI Corp Construction & Engineering Taiwan 76
Cummins Inc Machinery and Electrical Equipment United States 99
Dai-ichi Life Holdings Inc Insurance Japan 95
Daiichi Sankyo Co Ltd Pharmaceuticals Japan 108
Daiwa House Industry Co Ltd Real Estate Japan 110
Daiwa Securities Group IncDiversified Financial Services and Capital Markets
Japan 80
Danone SA Food Products France 86
DaVita Inc Health Care Providers & Services United States 89
DB Insurance Co Ltd InsuranceRepublic of Korea
95
SAM Gold Class SAM Silver Class SAM Bronze Class
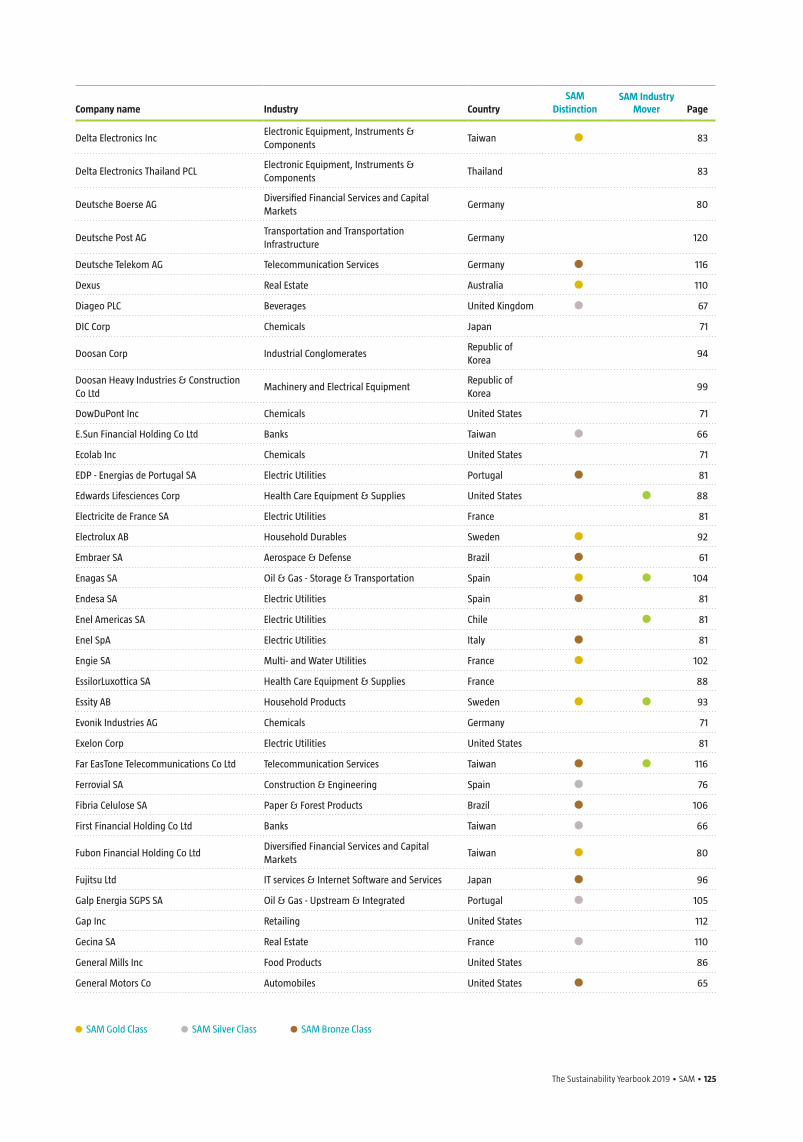
The Sustainability Yearbook 2019 • SAM • 125
Company name Industry CountrySAM
DistinctionSAM Industry
Mover Page
Delta Electronics IncElectronic Equipment, Instruments & Components
Taiwan 83
Delta Electronics Thailand PCLElectronic Equipment, Instruments & Components
Thailand 83
Deutsche Boerse AGDiversified Financial Services and Capital Markets
Germany 80
Deutsche Post AGTransportation and Transportation Infrastructure
Germany 120
Deutsche Telekom AG Telecommunication Services Germany 116
Dexus Real Estate Australia 110
Diageo PLC Beverages United Kingdom 67
DIC Corp Chemicals Japan 71
Doosan Corp Industrial ConglomeratesRepublic of Korea
94
Doosan Heavy Industries & Construction Co Ltd
Machinery and Electrical EquipmentRepublic of Korea
99
DowDuPont Inc Chemicals United States 71
E.Sun Financial Holding Co Ltd Banks Taiwan 66
Ecolab Inc Chemicals United States 71
EDP - Energias de Portugal SA Electric Utilities Portugal 81
Edwards Lifesciences Corp Health Care Equipment & Supplies United States 88
Electricite de France SA Electric Utilities France 81
Electrolux AB Household Durables Sweden 92
Embraer SA Aerospace & Defense Brazil 61
Enagas SA Oil & Gas - Storage & Transportation Spain 104
Endesa SA Electric Utilities Spain 81
Enel Americas SA Electric Utilities Chile 81
Enel SpA Electric Utilities Italy 81
Engie SA Multi- and Water Utilities France 102
EssilorLuxottica SA Health Care Equipment & Supplies France 88
Essity AB Household Products Sweden 93
Evonik Industries AG Chemicals Germany 71
Exelon Corp Electric Utilities United States 81
Far EasTone Telecommunications Co Ltd Telecommunication Services Taiwan 116
Ferrovial SA Construction & Engineering Spain 76
Fibria Celulose SA Paper & Forest Products Brazil 106
First Financial Holding Co Ltd Banks Taiwan 66
Fubon Financial Holding Co LtdDiversified Financial Services and Capital Markets
Taiwan 80
Fujitsu Ltd IT services & Internet Software and Services Japan 96
Galp Energia SGPS SA Oil & Gas - Upstream & Integrated Portugal 105
Gap Inc Retailing United States 112
Gecina SA Real Estate France 110
General Mills Inc Food Products United States 86
General Motors Co Automobiles United States 65
SAM Gold Class SAM Silver Class SAM Bronze Class
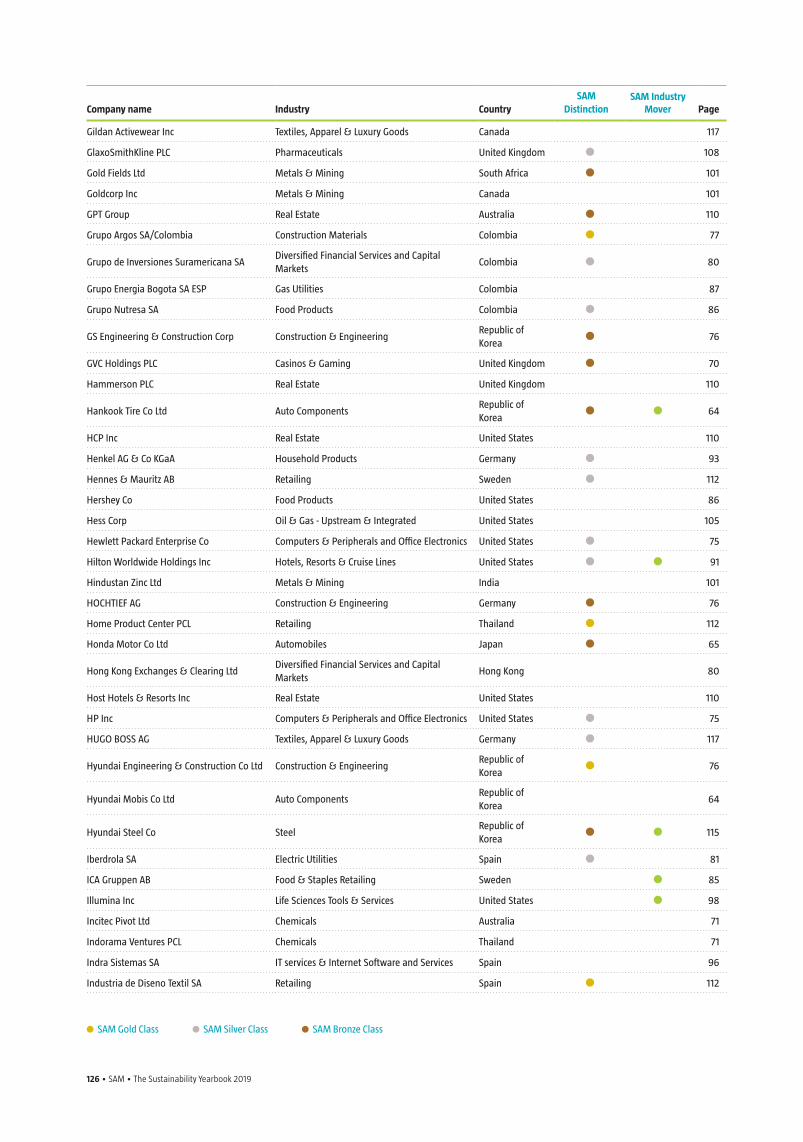
126 • SAM • The Sustainability Yearbook 2019 The Sustainability Yearbook 2019 • SAM • 127
Company name Industry CountrySAM
DistinctionSAM Industry
Mover Page
Gildan Activewear Inc Textiles, Apparel & Luxury Goods Canada 117
GlaxoSmithKline PLC Pharmaceuticals United Kingdom 108
Gold Fields Ltd Metals & Mining South Africa 101
Goldcorp Inc Metals & Mining Canada 101
GPT Group Real Estate Australia 110
Grupo Argos SA/Colombia Construction Materials Colombia 77
Grupo de Inversiones Suramericana SADiversified Financial Services and Capital Markets
Colombia 80
Grupo Energia Bogota SA ESP Gas Utilities Colombia 87
Grupo Nutresa SA Food Products Colombia 86
GS Engineering & Construction Corp Construction & EngineeringRepublic of Korea
76
GVC Holdings PLC Casinos & Gaming United Kingdom 70
Hammerson PLC Real Estate United Kingdom 110
Hankook Tire Co Ltd Auto ComponentsRepublic of Korea
64
HCP Inc Real Estate United States 110
Henkel AG & Co KGaA Household Products Germany 93
Hennes & Mauritz AB Retailing Sweden 112
Hershey Co Food Products United States 86
Hess Corp Oil & Gas - Upstream & Integrated United States 105
Hewlett Packard Enterprise Co Computers & Peripherals and Office Electronics United States 75
Hilton Worldwide Holdings Inc Hotels, Resorts & Cruise Lines United States 91
Hindustan Zinc Ltd Metals & Mining India 101
HOCHTIEF AG Construction & Engineering Germany 76
Home Product Center PCL Retailing Thailand 112
Honda Motor Co Ltd Automobiles Japan 65
Hong Kong Exchanges & Clearing LtdDiversified Financial Services and Capital Markets
Hong Kong 80
Host Hotels & Resorts Inc Real Estate United States 110
HP Inc Computers & Peripherals and Office Electronics United States 75
HUGO BOSS AG Textiles, Apparel & Luxury Goods Germany 117
Hyundai Engineering & Construction Co Ltd Construction & EngineeringRepublic of Korea
76
Hyundai Mobis Co Ltd Auto ComponentsRepublic of Korea
64
Hyundai Steel Co SteelRepublic of Korea
115
Iberdrola SA Electric Utilities Spain 81
ICA Gruppen AB Food & Staples Retailing Sweden 85
Illumina Inc Life Sciences Tools & Services United States 98
Incitec Pivot Ltd Chemicals Australia 71
Indorama Ventures PCL Chemicals Thailand 71
Indra Sistemas SA IT services & Internet Software and Services Spain 96
Industria de Diseno Textil SA Retailing Spain 112
SAM Gold Class SAM Silver Class SAM Bronze Class
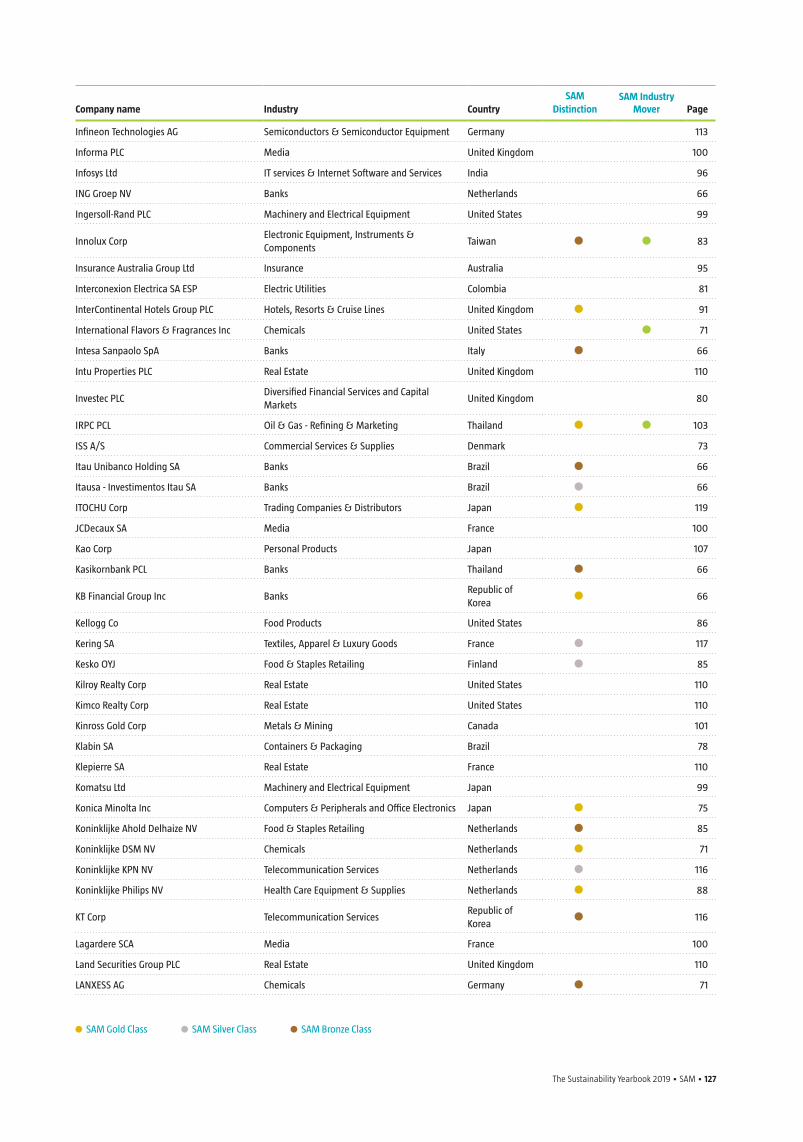
The Sustainability Yearbook 2019 • SAM • 127
Company name Industry CountrySAM
DistinctionSAM Industry
Mover Page
Infineon Technologies AG Semiconductors & Semiconductor Equipment Germany 113
Informa PLC Media United Kingdom 100
Infosys Ltd IT services & Internet Software and Services India 96
ING Groep NV Banks Netherlands 66
Ingersoll-Rand PLC Machinery and Electrical Equipment United States 99
Innolux CorpElectronic Equipment, Instruments & Components
Taiwan 83
Insurance Australia Group Ltd Insurance Australia 95
Interconexion Electrica SA ESP Electric Utilities Colombia 81
InterContinental Hotels Group PLC Hotels, Resorts & Cruise Lines United Kingdom 91
International Flavors & Fragrances Inc Chemicals United States 71
Intesa Sanpaolo SpA Banks Italy 66
Intu Properties PLC Real Estate United Kingdom 110
Investec PLCDiversified Financial Services and Capital Markets
United Kingdom 80
IRPC PCL Oil & Gas - Refining & Marketing Thailand 103
ISS A/S Commercial Services & Supplies Denmark 73
Itau Unibanco Holding SA Banks Brazil 66
Itausa - Investimentos Itau SA Banks Brazil 66
ITOCHU Corp Trading Companies & Distributors Japan 119
JCDecaux SA Media France 100
Kao Corp Personal Products Japan 107
Kasikornbank PCL Banks Thailand 66
KB Financial Group Inc BanksRepublic of Korea
66
Kellogg Co Food Products United States 86
Kering SA Textiles, Apparel & Luxury Goods France 117
Kesko OYJ Food & Staples Retailing Finland 85
Kilroy Realty Corp Real Estate United States 110
Kimco Realty Corp Real Estate United States 110
Kinross Gold Corp Metals & Mining Canada 101
Klabin SA Containers & Packaging Brazil 78
Klepierre SA Real Estate France 110
Komatsu Ltd Machinery and Electrical Equipment Japan 99
Konica Minolta Inc Computers & Peripherals and Office Electronics Japan 75
Koninklijke Ahold Delhaize NV Food & Staples Retailing Netherlands 85
Koninklijke DSM NV Chemicals Netherlands 71
Koninklijke KPN NV Telecommunication Services Netherlands 116
Koninklijke Philips NV Health Care Equipment & Supplies Netherlands 88
KT Corp Telecommunication ServicesRepublic of Korea
116
Lagardere SCA Media France 100
Land Securities Group PLC Real Estate United Kingdom 110
LANXESS AG Chemicals Germany 71
SAM Gold Class SAM Silver Class SAM Bronze Class
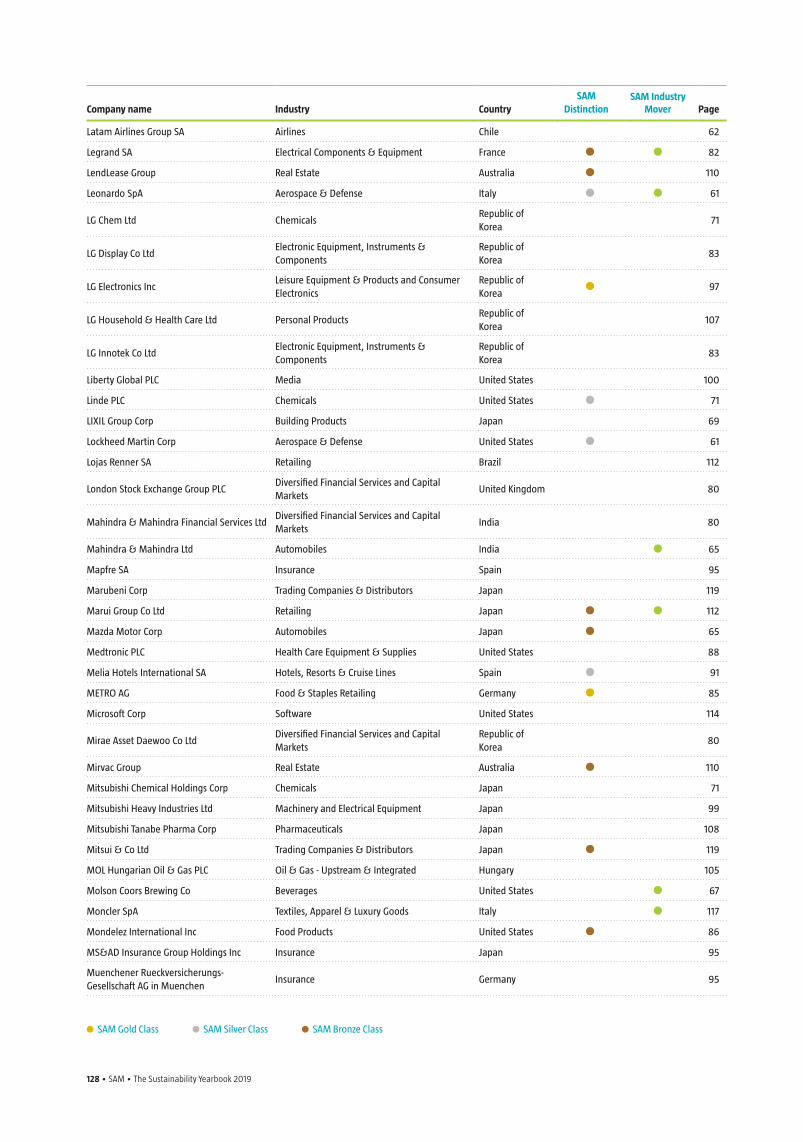
128 • SAM • The Sustainability Yearbook 2019 The Sustainability Yearbook 2019 • SAM • 129
Company name Industry CountrySAM
DistinctionSAM Industry
Mover Page
Latam Airlines Group SA Airlines Chile 62
Legrand SA Electrical Components & Equipment France 82
LendLease Group Real Estate Australia 110
Leonardo SpA Aerospace & Defense Italy 61
LG Chem Ltd ChemicalsRepublic of Korea
71
LG Display Co LtdElectronic Equipment, Instruments & Components
Republic of Korea
83
LG Electronics IncLeisure Equipment & Products and Consumer Electronics
Republic of Korea
97
LG Household & Health Care Ltd Personal ProductsRepublic of Korea
107
LG Innotek Co LtdElectronic Equipment, Instruments & Components
Republic of Korea
83
Liberty Global PLC Media United States 100
Linde PLC Chemicals United States 71
LIXIL Group Corp Building Products Japan 69
Lockheed Martin Corp Aerospace & Defense United States 61
Lojas Renner SA Retailing Brazil 112
London Stock Exchange Group PLCDiversified Financial Services and Capital Markets
United Kingdom 80
Mahindra & Mahindra Financial Services LtdDiversified Financial Services and Capital Markets
India 80
Mahindra & Mahindra Ltd Automobiles India 65
Mapfre SA Insurance Spain 95
Marubeni Corp Trading Companies & Distributors Japan 119
Marui Group Co Ltd Retailing Japan 112
Mazda Motor Corp Automobiles Japan 65
Medtronic PLC Health Care Equipment & Supplies United States 88
Melia Hotels International SA Hotels, Resorts & Cruise Lines Spain 91
METRO AG Food & Staples Retailing Germany 85
Microsoft Corp Software United States 114
Mirae Asset Daewoo Co LtdDiversified Financial Services and Capital Markets
Republic of Korea
80
Mirvac Group Real Estate Australia 110
Mitsubishi Chemical Holdings Corp Chemicals Japan 71
Mitsubishi Heavy Industries Ltd Machinery and Electrical Equipment Japan 99
Mitsubishi Tanabe Pharma Corp Pharmaceuticals Japan 108
Mitsui & Co Ltd Trading Companies & Distributors Japan 119
MOL Hungarian Oil & Gas PLC Oil & Gas - Upstream & Integrated Hungary 105
Molson Coors Brewing Co Beverages United States 67
Moncler SpA Textiles, Apparel & Luxury Goods Italy 117
Mondelez International Inc Food Products United States 86
MS&AD Insurance Group Holdings Inc Insurance Japan 95
Muenchener Rueckversicherungs-Gesellschaft AG in Muenchen
Insurance Germany 95
SAM Gold Class SAM Silver Class SAM Bronze Class
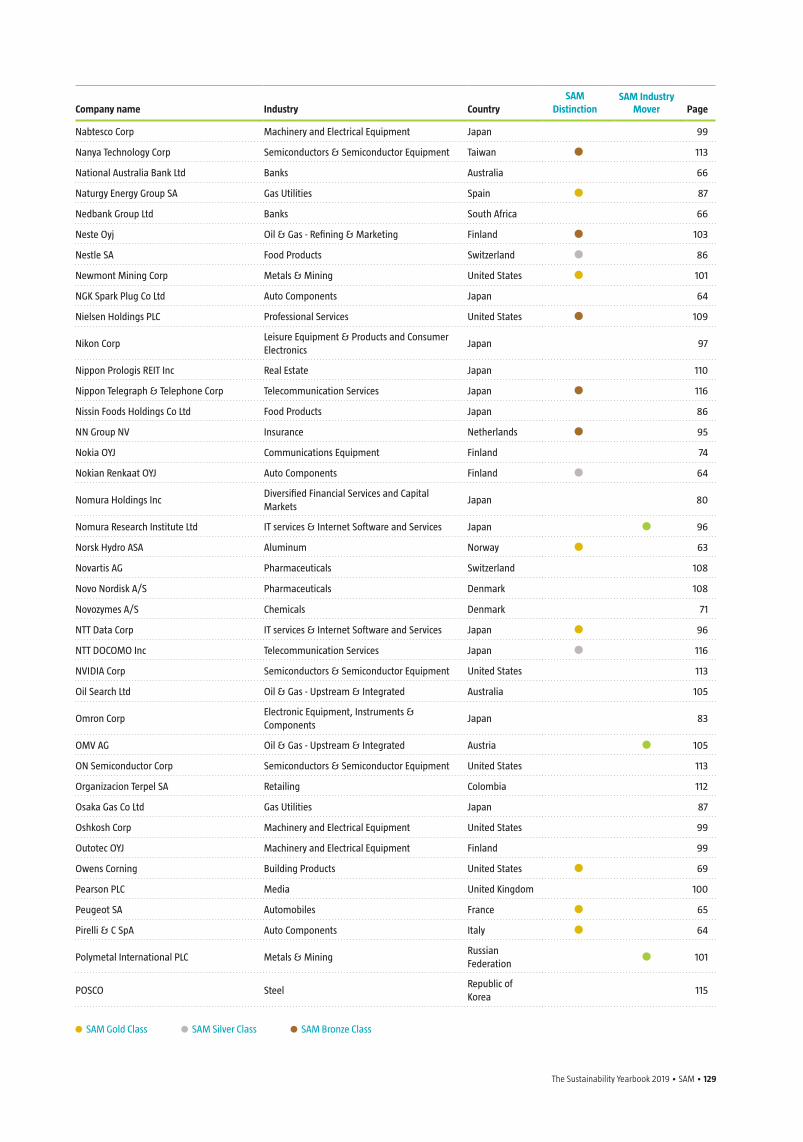
The Sustainability Yearbook 2019 • SAM • 129
Company name Industry CountrySAM
DistinctionSAM Industry
Mover Page
Nabtesco Corp Machinery and Electrical Equipment Japan 99
Nanya Technology Corp Semiconductors & Semiconductor Equipment Taiwan 113
National Australia Bank Ltd Banks Australia 66
Naturgy Energy Group SA Gas Utilities Spain 87
Nedbank Group Ltd Banks South Africa 66
Neste Oyj Oil & Gas - Refining & Marketing Finland 103
Nestle SA Food Products Switzerland 86
Newmont Mining Corp Metals & Mining United States 101
NGK Spark Plug Co Ltd Auto Components Japan 64
Nielsen Holdings PLC Professional Services United States 109
Nikon CorpLeisure Equipment & Products and Consumer Electronics
Japan 97
Nippon Prologis REIT Inc Real Estate Japan 110
Nippon Telegraph & Telephone Corp Telecommunication Services Japan 116
Nissin Foods Holdings Co Ltd Food Products Japan 86
NN Group NV Insurance Netherlands 95
Nokia OYJ Communications Equipment Finland 74
Nokian Renkaat OYJ Auto Components Finland 64
Nomura Holdings IncDiversified Financial Services and Capital Markets
Japan 80
Nomura Research Institute Ltd IT services & Internet Software and Services Japan 96
Norsk Hydro ASA Aluminum Norway 63
Novartis AG Pharmaceuticals Switzerland 108
Novo Nordisk A/S Pharmaceuticals Denmark 108
Novozymes A/S Chemicals Denmark 71
NTT Data Corp IT services & Internet Software and Services Japan 96
NTT DOCOMO Inc Telecommunication Services Japan 116
NVIDIA Corp Semiconductors & Semiconductor Equipment United States 113
Oil Search Ltd Oil & Gas - Upstream & Integrated Australia 105
Omron CorpElectronic Equipment, Instruments & Components
Japan 83
OMV AG Oil & Gas - Upstream & Integrated Austria 105
ON Semiconductor Corp Semiconductors & Semiconductor Equipment United States 113
Organizacion Terpel SA Retailing Colombia 112
Osaka Gas Co Ltd Gas Utilities Japan 87
Oshkosh Corp Machinery and Electrical Equipment United States 99
Outotec OYJ Machinery and Electrical Equipment Finland 99
Owens Corning Building Products United States 69
Pearson PLC Media United Kingdom 100
Peugeot SA Automobiles France 65
Pirelli & C SpA Auto Components Italy 64
Polymetal International PLC Metals & MiningRussian Federation
101
POSCO SteelRepublic of Korea
115
SAM Gold Class SAM Silver Class SAM Bronze Class
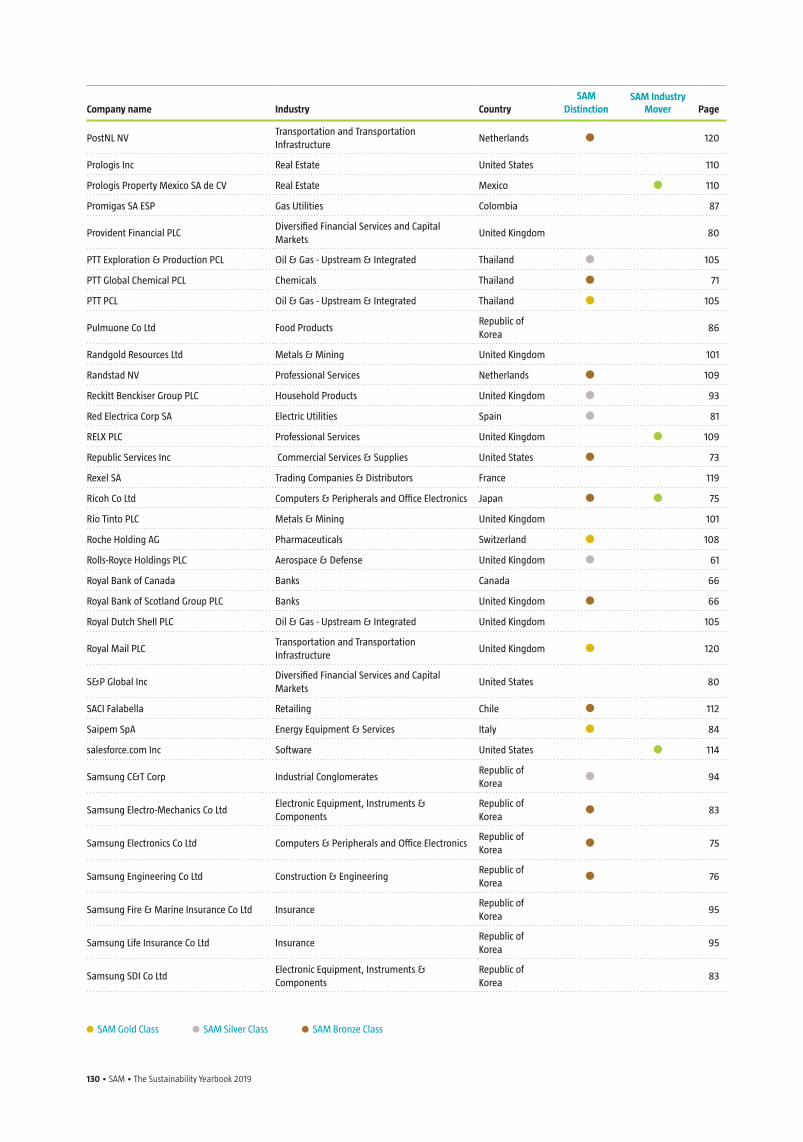
130 • SAM • The Sustainability Yearbook 2019 The Sustainability Yearbook 2019 • SAM • 131
Company name Industry CountrySAM
DistinctionSAM Industry
Mover Page
PostNL NVTransportation and Transportation Infrastructure
Netherlands 120
Prologis Inc Real Estate United States 110
Prologis Property Mexico SA de CV Real Estate Mexico 110
Promigas SA ESP Gas Utilities Colombia 87
Provident Financial PLCDiversified Financial Services and Capital Markets
United Kingdom 80
PTT Exploration & Production PCL Oil & Gas - Upstream & Integrated Thailand 105
PTT Global Chemical PCL Chemicals Thailand 71
PTT PCL Oil & Gas - Upstream & Integrated Thailand 105
Pulmuone Co Ltd Food ProductsRepublic of Korea
86
Randgold Resources Ltd Metals & Mining United Kingdom 101
Randstad NV Professional Services Netherlands 109
Reckitt Benckiser Group PLC Household Products United Kingdom 93
Red Electrica Corp SA Electric Utilities Spain 81
RELX PLC Professional Services United Kingdom 109
Republic Services Inc Commercial Services & Supplies United States 73
Rexel SA Trading Companies & Distributors France 119
Ricoh Co Ltd Computers & Peripherals and Office Electronics Japan 75
Rio Tinto PLC Metals & Mining United Kingdom 101
Roche Holding AG Pharmaceuticals Switzerland 108
Rolls-Royce Holdings PLC Aerospace & Defense United Kingdom 61
Royal Bank of Canada Banks Canada 66
Royal Bank of Scotland Group PLC Banks United Kingdom 66
Royal Dutch Shell PLC Oil & Gas - Upstream & Integrated United Kingdom 105
Royal Mail PLCTransportation and Transportation Infrastructure
United Kingdom 120
S&P Global IncDiversified Financial Services and Capital Markets
United States 80
SACI Falabella Retailing Chile 112
Saipem SpA Energy Equipment & Services Italy 84
salesforce.com Inc Software United States 114
Samsung C&T Corp Industrial ConglomeratesRepublic of Korea
94
Samsung Electro-Mechanics Co LtdElectronic Equipment, Instruments & Components
Republic of Korea
83
Samsung Electronics Co Ltd Computers & Peripherals and Office ElectronicsRepublic of Korea
75
Samsung Engineering Co Ltd Construction & EngineeringRepublic of Korea
76
Samsung Fire & Marine Insurance Co Ltd InsuranceRepublic of Korea
95
Samsung Life Insurance Co Ltd InsuranceRepublic of Korea
95
Samsung SDI Co LtdElectronic Equipment, Instruments & Components
Republic of Korea
83
SAM Gold Class SAM Silver Class SAM Bronze Class
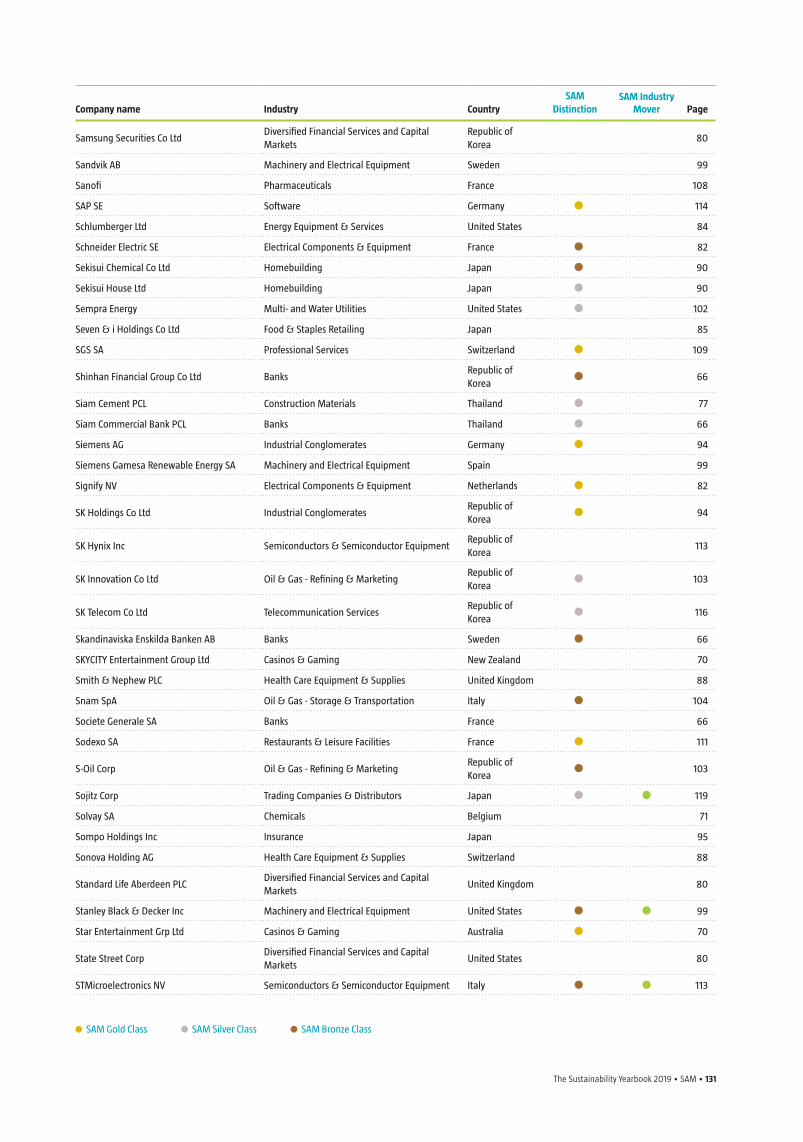
The Sustainability Yearbook 2019 • SAM • 131
Company name Industry CountrySAM
DistinctionSAM Industry
Mover Page
Samsung Securities Co LtdDiversified Financial Services and Capital Markets
Republic of Korea
80
Sandvik AB Machinery and Electrical Equipment Sweden 99
Sanofi Pharmaceuticals France 108
SAP SE Software Germany 114
Schlumberger Ltd Energy Equipment & Services United States 84
Schneider Electric SE Electrical Components & Equipment France 82
Sekisui Chemical Co Ltd Homebuilding Japan 90
Sekisui House Ltd Homebuilding Japan 90
Sempra Energy Multi- and Water Utilities United States 102
Seven & i Holdings Co Ltd Food & Staples Retailing Japan 85
SGS SA Professional Services Switzerland 109
Shinhan Financial Group Co Ltd BanksRepublic of Korea
66
Siam Cement PCL Construction Materials Thailand 77
Siam Commercial Bank PCL Banks Thailand 66
Siemens AG Industrial Conglomerates Germany 94
Siemens Gamesa Renewable Energy SA Machinery and Electrical Equipment Spain 99
Signify NV Electrical Components & Equipment Netherlands 82
SK Holdings Co Ltd Industrial ConglomeratesRepublic of Korea
94
SK Hynix Inc Semiconductors & Semiconductor EquipmentRepublic of Korea
113
SK Innovation Co Ltd Oil & Gas - Refining & MarketingRepublic of Korea
103
SK Telecom Co Ltd Telecommunication ServicesRepublic of Korea
116
Skandinaviska Enskilda Banken AB Banks Sweden 66
SKYCITY Entertainment Group Ltd Casinos & Gaming New Zealand 70
Smith & Nephew PLC Health Care Equipment & Supplies United Kingdom 88
Snam SpA Oil & Gas - Storage & Transportation Italy 104
Societe Generale SA Banks France 66
Sodexo SA Restaurants & Leisure Facilities France 111
S-Oil Corp Oil & Gas - Refining & MarketingRepublic of Korea
103
Sojitz Corp Trading Companies & Distributors Japan 119
Solvay SA Chemicals Belgium 71
Sompo Holdings Inc Insurance Japan 95
Sonova Holding AG Health Care Equipment & Supplies Switzerland 88
Standard Life Aberdeen PLCDiversified Financial Services and Capital Markets
United Kingdom 80
Stanley Black & Decker Inc Machinery and Electrical Equipment United States 99
Star Entertainment Grp Ltd Casinos & Gaming Australia 70
State Street CorpDiversified Financial Services and Capital Markets
United States 80
STMicroelectronics NV Semiconductors & Semiconductor Equipment Italy 113
SAM Gold Class SAM Silver Class SAM Bronze Class
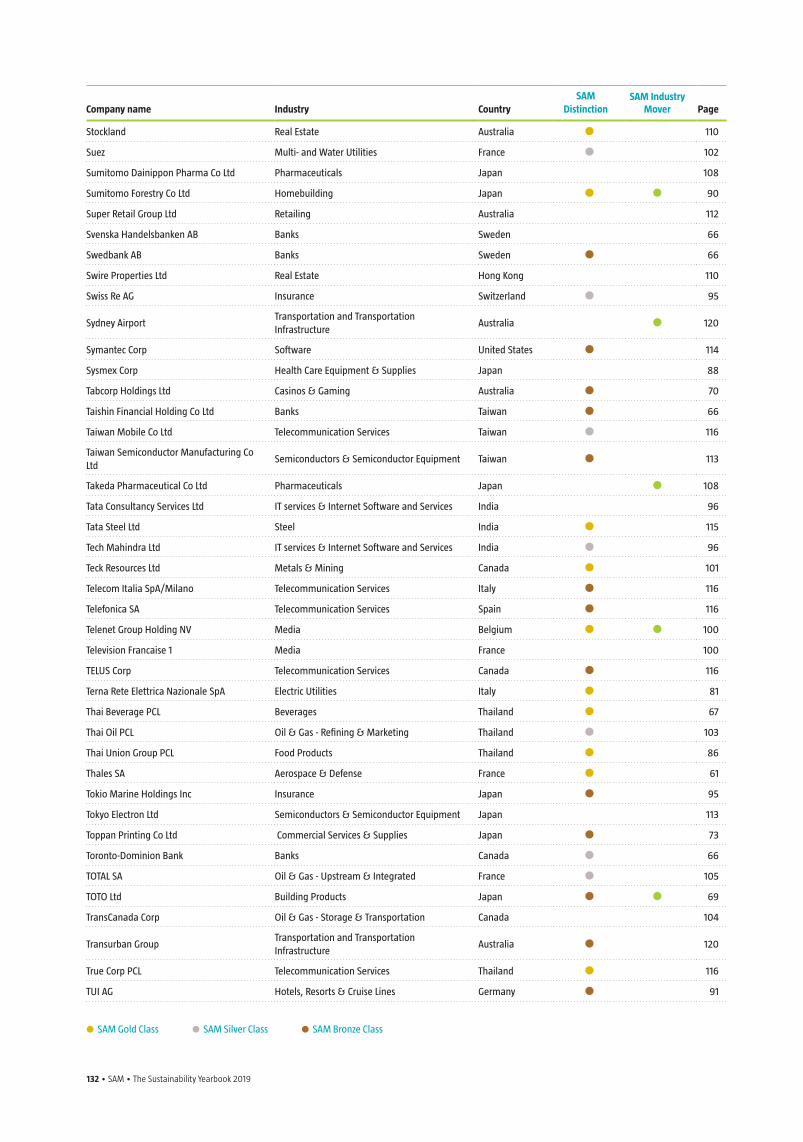
132 • SAM • The Sustainability Yearbook 2019 The Sustainability Yearbook 2019 • SAM • 133
Company name Industry CountrySAM
DistinctionSAM Industry
Mover Page
Stockland Real Estate Australia 110
Suez Multi- and Water Utilities France 102
Sumitomo Dainippon Pharma Co Ltd Pharmaceuticals Japan 108
Sumitomo Forestry Co Ltd Homebuilding Japan 90
Super Retail Group Ltd Retailing Australia 112
Svenska Handelsbanken AB Banks Sweden 66
Swedbank AB Banks Sweden 66
Swire Properties Ltd Real Estate Hong Kong 110
Swiss Re AG Insurance Switzerland 95
Sydney AirportTransportation and Transportation Infrastructure
Australia 120
Symantec Corp Software United States 114
Sysmex Corp Health Care Equipment & Supplies Japan 88
Tabcorp Holdings Ltd Casinos & Gaming Australia 70
Taishin Financial Holding Co Ltd Banks Taiwan 66
Taiwan Mobile Co Ltd Telecommunication Services Taiwan 116
Taiwan Semiconductor Manufacturing Co Ltd
Semiconductors & Semiconductor Equipment Taiwan 113
Takeda Pharmaceutical Co Ltd Pharmaceuticals Japan 108
Tata Consultancy Services Ltd IT services & Internet Software and Services India 96
Tata Steel Ltd Steel India 115
Tech Mahindra Ltd IT services & Internet Software and Services India 96
Teck Resources Ltd Metals & Mining Canada 101
Telecom Italia SpA/Milano Telecommunication Services Italy 116
Telefonica SA Telecommunication Services Spain 116
Telenet Group Holding NV Media Belgium 100
Television Francaise 1 Media France 100
TELUS Corp Telecommunication Services Canada 116
Terna Rete Elettrica Nazionale SpA Electric Utilities Italy 81
Thai Beverage PCL Beverages Thailand 67
Thai Oil PCL Oil & Gas - Refining & Marketing Thailand 103
Thai Union Group PCL Food Products Thailand 86
Thales SA Aerospace & Defense France 61
Tokio Marine Holdings Inc Insurance Japan 95
Tokyo Electron Ltd Semiconductors & Semiconductor Equipment Japan 113
Toppan Printing Co Ltd Commercial Services & Supplies Japan 73
Toronto-Dominion Bank Banks Canada 66
TOTAL SA Oil & Gas - Upstream & Integrated France 105
TOTO Ltd Building Products Japan 69
TransCanada Corp Oil & Gas - Storage & Transportation Canada 104
Transurban GroupTransportation and Transportation Infrastructure
Australia 120
True Corp PCL Telecommunication Services Thailand 116
TUI AG Hotels, Resorts & Cruise Lines Germany 91
SAM Gold Class SAM Silver Class SAM Bronze Class
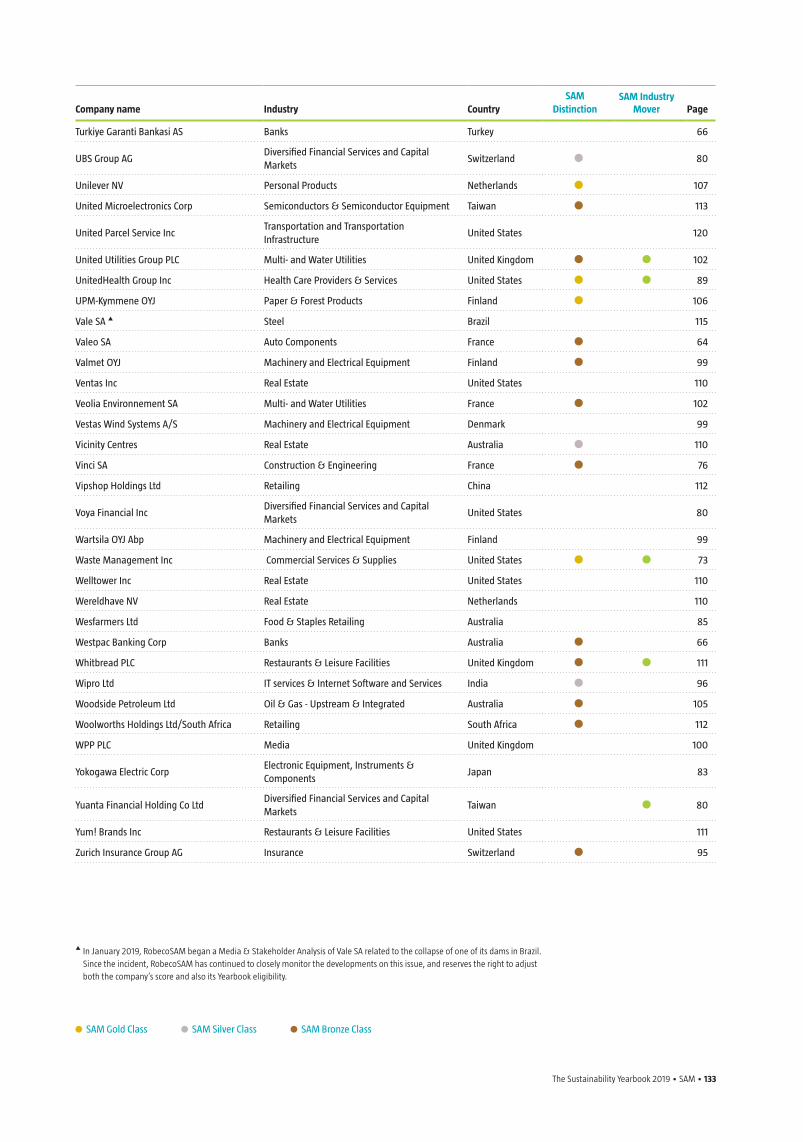
The Sustainability Yearbook 2019 • SAM • 133
Company name Industry CountrySAM
DistinctionSAM Industry
Mover Page
Turkiye Garanti Bankasi AS Banks Turkey 66
UBS Group AGDiversified Financial Services and Capital Markets
Switzerland 80
Unilever NV Personal Products Netherlands 107
United Microelectronics Corp Semiconductors & Semiconductor Equipment Taiwan 113
United Parcel Service IncTransportation and Transportation Infrastructure
United States 120
United Utilities Group PLC Multi- and Water Utilities United Kingdom 102
UnitedHealth Group Inc Health Care Providers & Services United States 89
UPM-Kymmene OYJ Paper & Forest Products Finland 106
Vale SA p Steel Brazil 115
Valeo SA Auto Components France 64
Valmet OYJ Machinery and Electrical Equipment Finland 99
Ventas Inc Real Estate United States 110
Veolia Environnement SA Multi- and Water Utilities France 102
Vestas Wind Systems A/S Machinery and Electrical Equipment Denmark 99
Vicinity Centres Real Estate Australia 110
Vinci SA Construction & Engineering France 76
Vipshop Holdings Ltd Retailing China 112
Voya Financial IncDiversified Financial Services and Capital Markets
United States 80
Wartsila OYJ Abp Machinery and Electrical Equipment Finland 99
Waste Management Inc Commercial Services & Supplies United States 73
Welltower Inc Real Estate United States 110
Wereldhave NV Real Estate Netherlands 110
Wesfarmers Ltd Food & Staples Retailing Australia 85
Westpac Banking Corp Banks Australia 66
Whitbread PLC Restaurants & Leisure Facilities United Kingdom 111
Wipro Ltd IT services & Internet Software and Services India 96
Woodside Petroleum Ltd Oil & Gas - Upstream & Integrated Australia 105
Woolworths Holdings Ltd/South Africa Retailing South Africa 112
WPP PLC Media United Kingdom 100
Yokogawa Electric CorpElectronic Equipment, Instruments & Components
Japan 83
Yuanta Financial Holding Co LtdDiversified Financial Services and Capital Markets
Taiwan 80
Yum! Brands Inc Restaurants & Leisure Facilities United States 111
Zurich Insurance Group AG Insurance Switzerland 95
SAM Gold Class SAM Silver Class SAM Bronze Class
p In January 2019, RobecoSAM began a Media & Stakeholder Analysis of Vale SA related to the collapse of one of its dams in Brazil. Since the incident, RobecoSAM has continued to closely monitor the developments on this issue, and reserves the right to adjust
both the company’s score and also its Yearbook eligibility.
134 • SAM • The Sustainability Yearbook 2019 The Sustainability Yearbook 2019 • SAM • 134
About SAM
SAM is a registered trademark of RobecoSAM AG. SAM is used to market services and products of business units
within RobecoSAM, which specialize in providing ESG data, ratings, and benchmarking. Operating under SAM
are two specialist business areas: “ESG Ratings”, which is responsible for the Corporate Sustainability Assessment
(CSA), from the methodology behind the assessment, to the annual data collection, through to the evaluation and
scoring of individual companies, and also contributing the data to S&P Dow Jones Indices for their indices. “ESG
Benchmarking” (formerly known as Sustainability Services), provides to companies, experts and practitioners a
range of unique services to evaluate companies’ sustainability performance, based on CSA results and by comparing
it to best practice. The CSA an annual ESG analysis of over 4,600 listed companies, and one of the world’s most
comprehensive databases of financially material sustainability information was established in 1999.
Important Legal Information: The details given on these pages do not constitute an offer. They are given for
information purposes only. No liability is assumed for the correctness and accuracy of the details given. The securities
identified and described may or may not be purchased, sold or recommended for advisory clients. It should not
be assumed that an investment in these securities was or will be profitable. SAM is a registered trademark of
RobecoSAM AG. SAM is used to market services and products of a business unit within RobecoSAM, which specialize
in providing ESG data, ESG rating services, and ESG benchmarking. SAM is not to be considered as a separate legal
entity. Copyright© 2019 RobecoSAM – all rights reserved.
DISCLAIMER
Important Legal Information:
No Warranty: This publication is derived from sources believed to be accurate and reliable, but neither its accuracy
nor completeness is guaranteed. The material and information in this publication are provided “as is” and without
warranties of any kind, either expressed or implied. RobecoSAM AG and its related, affiliated and subsidiary
companies disclaim all warranties, expressed or implied, including, but not limited to, implied warranties of
merchantability and fitness for a particular purpose. Any opinions and views in this publication reflect the current
judgment of the authors and may change without notice. It is each reader’s responsibility to evaluate the accuracy,
completeness and usefulness of any opinions, advice, services or other information provided in this publication.
Limitation of Liability: All information contained in this publication is distributed with the understanding that the
authors, publishers and distributors are not rendering legal, accounting or other professional advice or opinions
on specific facts or matters and accordingly assume no liability whatsoever in connection with its use. In no event
shall RobecoSAM AG and its related, affiliated and subsidiary companies be liable for any direct, indirect, special,
incidental or consequential damages arising out of the use of any opinion or information expressly or implicitly
contained in this publication.
Copyright: Unless otherwise noted, text, images and layout of this publication are the exclusive property of
RobecoSAM AG and/or its related, affiliated and subsidiary companies and may not be copied or distributed, in
whole or in part, without the express written consent of RobecoSAM AG or its related, affiliated and subsidiary
companies.
No Offer: The information and opinions contained in this publication constitutes neither a solicitation, nor a
recommendation, nor an offer to buy or sell investment instruments or other services, or to engage in any other
kind of transaction. The information described in this publication is not directed to persons in any jurisdiction
where the provision of such information would run counter to local laws and regulation.
© 2019 RobecoSAM AG

The Sustainability Yearbook 2019
01/2019RobecoSAM AG
yearbook.robecosam.com

The
Sust
aina
bilit
y Ye
arbo
ok 2
019
MODERN PORTFOLIO
MANAGEMENT
SOCIALCAPITAL
CORPORATE TAX
STRATEGIES
GENDEREQUALITY
The Sustainability Yearbook 2019
FAIR WAGES
SUSTAINABLE: TRADITIONAL:
SUSTAINABLE: TRADITIONAL:
RobecoSAM AGJosefstrasse 2188005 Zurich, SwitzerlandT +41 44 653 10 10, F +41 44 653 10 80
www.robecosam.com