Embed Size (px)
Citation preview
Roadway Vertical Alignments
Course No: C04-031
Credit: 4 PDH
Gregory J. Taylor, P.E.
Continuing Education and Development, Inc. 9 Greyridge Farm Court Stony Point, NY 10980 P: (877) 322-5800 F: (877) 322-4774
INTRODUCTION Roadway vertical alignments are a combination of various parabolic curves and connecting
tangent grades. They are one of the fundamental three-dimensional road features directly
related to safety, operations, drainage and construction requirements. Together with the
horizontal alignment (tangents and curves) and roadway cross-section (lanes, shoulders,
curbs, medians, roadside slopes, ditches and sidewalks), the vertical alignment (grades and
vertical curves) help provide a three-dimensional roadway layout.
This course focuses on the geometric design of vertical alignments for modern roads and
highways. Its contents are intended to serve as guidance and not as an absolute sta ndard or
rule.
Upon course completion, you should be familiar with the general design of vertical roadway
alignments. The course objective is to give engineers and designers an in-depth look at the
principles to be considered when designing vertical alignments.
Subjects covered include:
Sight Distance
o Stopping
o Decision
o Passing
o Intersection
Vertical Alignment
o Grades
o Climbing lanes
o Passing opportunities
o Emergency escape ramps
Vertical Curves
o Sag
o Crest
Coordination of Horizontal & Vertical Curves
A Policy on Geometric Design of Highways and Streets (also known as the “Green Book”)
published by the American Association of State Highway and Transportation Officials
(AASHTO) is considered to be the primary guidance for U.S. roadway design. For this course,
Chapter 3 (Section 3.4 Vertical Alignment) will be used exclusively for the fundamental
roadway geometric design principles.
Roadway Vertical Alignments
Copyright 2014 Gregory J. Taylor, P.E. Page 2 of 40
BACKGROUND
Roadway geometric design consists of the following fundamental three-dimensional
features:
Vertical alignment - grades and vertical curves
Horizontal alignment - tangents and curves
Cross section - lanes, shoulders, curbs, medians, roadside slopes, ditches and
sidewalks
Combined, these elements contribute to the roadway’s operational quality and safety by
providing a smooth-flowing, crash-free facility.
Engineers must understand how all of the roadway elements contribute to overall safety and
operation. Applying design standards and criteria to ‘solve’ a problem is not enough .
The fundamental objective of good geometric design will remain as it has always been – to
produce a roadway that is safe, efficient, reasonably economic and sensitive to
conflicting concerns.
Roadway Vertical Alignments
Copyright 2014 Gregory J. Taylor, P.E. Page 3 of 40
SIGHT DISTANCE
Sight distance is the length or distance of roadway visible to the driver. This is a major design
control for vertical alignments and is essential for the safe and efficient operation of vehicles.
This distance is dependent on the driver’s eye height, the specified object height, and the
height/position of sight obstructions. The three-dimensional features of the roadway should
provide a minimum sight line for safe operations.
Sight Distance Criteria
Height of Driver’s Eye: 3.50 feet above road surface (passenger vehicles)
7.60 feet above road surface (trucks)
Height of Object: 2.00 feet above road surface (stopping & decision)
3.50 feet above road surface (passing & intersection)
Due to differences in driver needs, various types of sight distance apply to geometric design
stopping,
decision,
passing,
and intersection.
STOPPING SIGHT DISTANCE (SSD)
Stopping sight distance is considered to be the most basic form of sight distance. This
distance is the length of roadway needed for a vehicle traveling at design speed to stop before
reaching a stationary object in the road. Ideally, all of the roadway should provide stopping
sight distance consistent with its design speed. However, this distance can be affected by
both horizontal and vertical geometric features.
Stopping sight distance is composed of two distances:
(1) Brake Reaction Time starts upon driver recognition of a roadway obstacle until
application of the vehicle’s brakes. Typically, the driver not only needs to see the object
but also recognize it as a potential hazard. The time required to make this dete rmination
Roadway Vertical Alignments
Copyright 2014 Gregory J. Taylor, P.E. Page 4 of 40
can widely vary based on the object’s distance, visibility, roadway conditions, vehicle
speed, type of obstacle, etc.
Perception → Braking
From various studies, it was shown that the required brake reaction time needed to be
long enough to encompass the majority of the driver reaction times under most roadway
conditions. A brake reaction time of 2.5 seconds met the capabilities of most drivers,
including older drivers.
The recommended brake reaction time of 2.5 seconds exceeds the 90th percentile of
driver reaction time and is considered adequate for typical roadway conditions, but not
for most complex driving conditions that may be encountered.
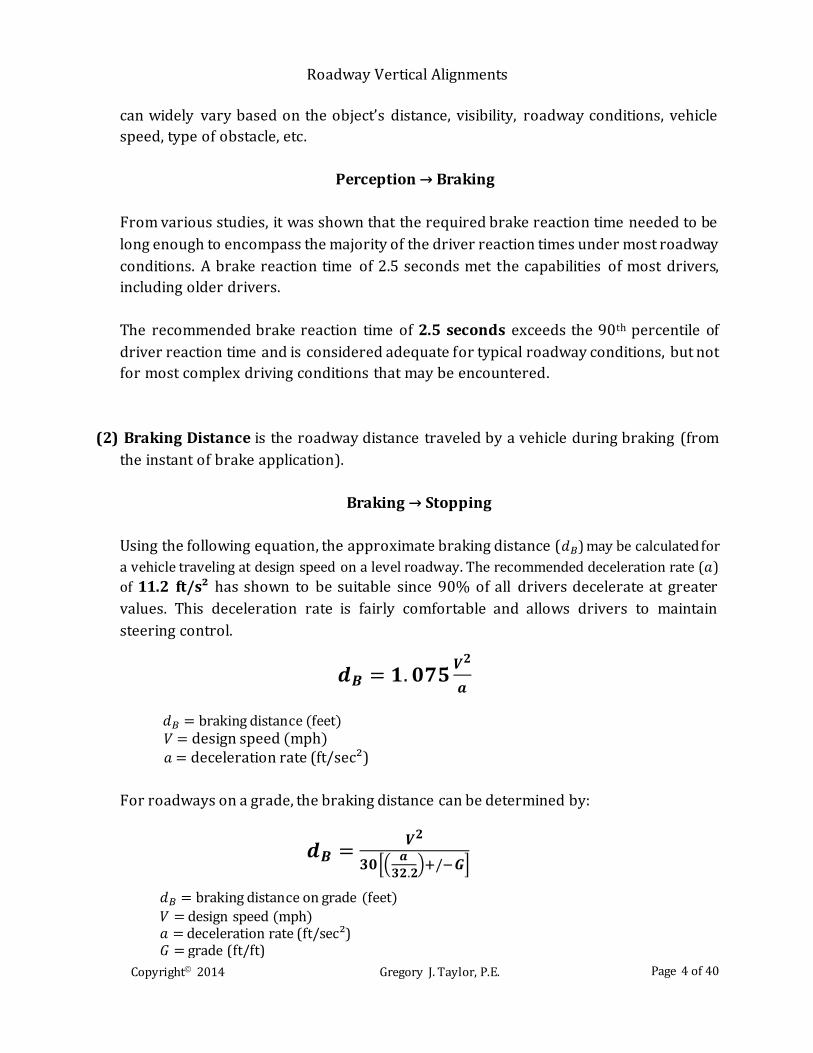
(2) Braking Distance is the roadway distance traveled by a vehicle during braking (from
the instant of brake application).
Braking → Stopping
Using the following equation, the approximate braking distance (𝑑𝐵) may be calculated for
a vehicle traveling at design speed on a level roadway. The recommended deceleration rate (𝑎)
of 11.2 ft/s² has shown to be suitable since 90% of all drivers decelerate at greater
values. This deceleration rate is fairly comfortable and allows drivers to maintain
steering control.
For roadways on a grade, the braking distance can be determined by:
𝒅𝑩 = 𝟏. 𝟎𝟕𝟓𝑽𝟐
𝒂
𝑑𝐵 = braking distance (feet) 𝑉 = design speed (mph)
𝑎 = deceleration rate (ft/sec²)
𝒅𝑩 =𝑽𝟐
𝟑𝟎[(𝒂
𝟑𝟐.𝟐)+/−𝑮]
𝑑𝐵 = braking distance on grade (feet)
𝑉 = design speed (mph) 𝑎 = deceleration rate (ft/sec²) 𝐺 = grade (ft/ft)
Roadway Vertical Alignments
Copyright 2014 Gregory J. Taylor, P.E. Page 5 of 40
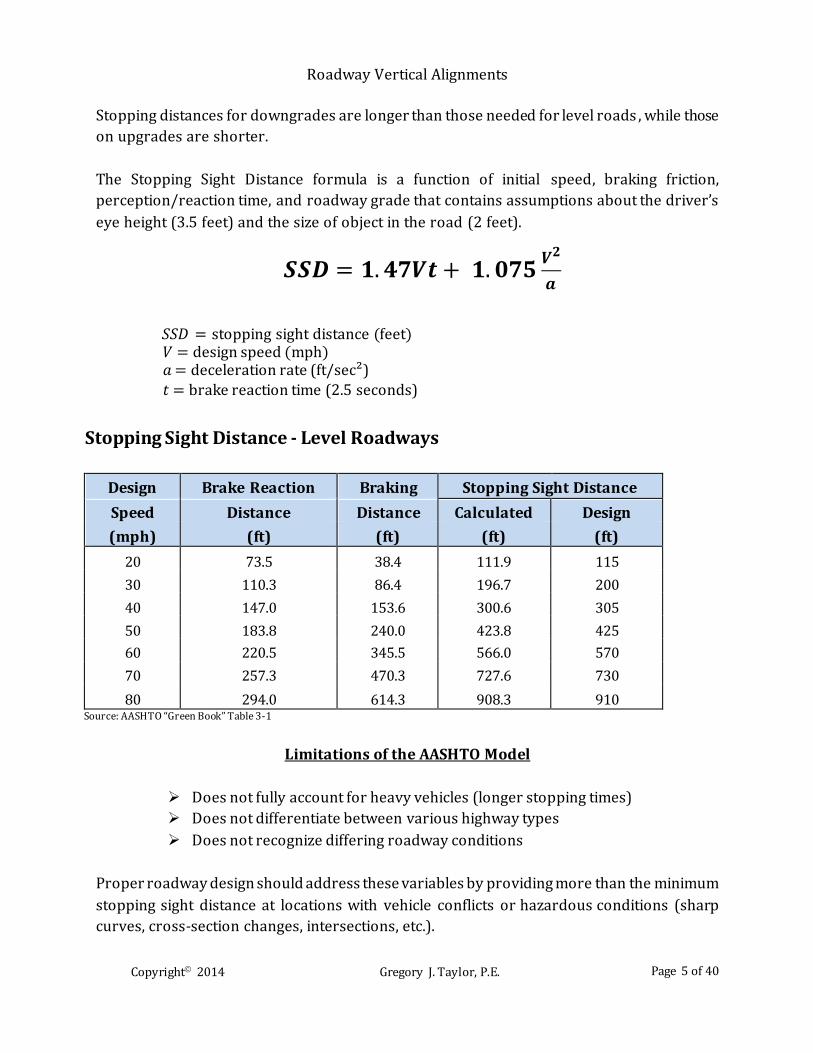
Stopping distances for downgrades are longer than those needed for level roads , while those
on upgrades are shorter.
The Stopping Sight Distance formula is a function of initial speed, braking friction,
perception/reaction time, and roadway grade that contains assumptions about the driver’s
eye height (3.5 feet) and the size of object in the road (2 feet).
Stopping Sight Distance - Level Roadways
Design Brake Reaction Braking Stopping Sight Distance
Speed Distance Distance Calculated Design
(mph) (ft) (ft) (ft) (ft)
20 73.5 38.4 111.9 115
30 110.3 86.4 196.7 200
40 147.0 153.6 300.6 305
50 183.8 240.0 423.8 425
60 220.5 345.5 566.0 570
70 257.3 470.3 727.6 730
80 294.0 614.3 908.3 910 Source: AASHTO “Green Book” Table 3-1
Limitations of the AASHTO Model
Does not fully account for heavy vehicles (longer stopping times)
Does not differentiate between various highway types
Does not recognize differing roadway conditions
Proper roadway design should address these variables by providing more than the minimum
stopping sight distance at locations with vehicle conflicts or hazardous conditions (sharp
curves, cross-section changes, intersections, etc.).
𝑺𝑺𝑫 = 𝟏. 𝟒𝟕𝑽𝒕 + 𝟏. 𝟎𝟕𝟓𝑽𝟐
𝒂
𝑆𝑆𝐷 = stopping sight distance (feet) 𝑉 = design speed (mph) 𝑎 = deceleration rate (ft/sec²)
𝑡 = brake reaction time (2.5 seconds)
Roadway Vertical Alignments
Copyright 2014 Gregory J. Taylor, P.E. Page 6 of 40
DECISION SIGHT DISTANCE (DSD)
Certain situations requiring complex decisions or maneuvers (unexpected conflicts,
navigational needs, roadway changes, etc.) can place extra demands on drivers. These
circumstances usually require longer sight distances than those for stopping.
Decision sight distance recognizes these needs and is composed of the following required
actions:
Detect unexpected/unusual conflict
Recognize potential risk
Select appropriate speed /path
Initiate and complete safe maneuver
Decision sight distance values are substantially greater than those for Stopping Sight
Distance since DSD provides an additional margin of error and sufficient maneuver length at
vehicle speeds; rather than just stopping.
Decision sight distance is needed for a variety of roadway environments, such as bridges,
alignment changes, interchanges, intersections, lane drops, congested intersections, median
crossovers, roadway cross-section changes, toll facilities and unusual geometric
configurations.
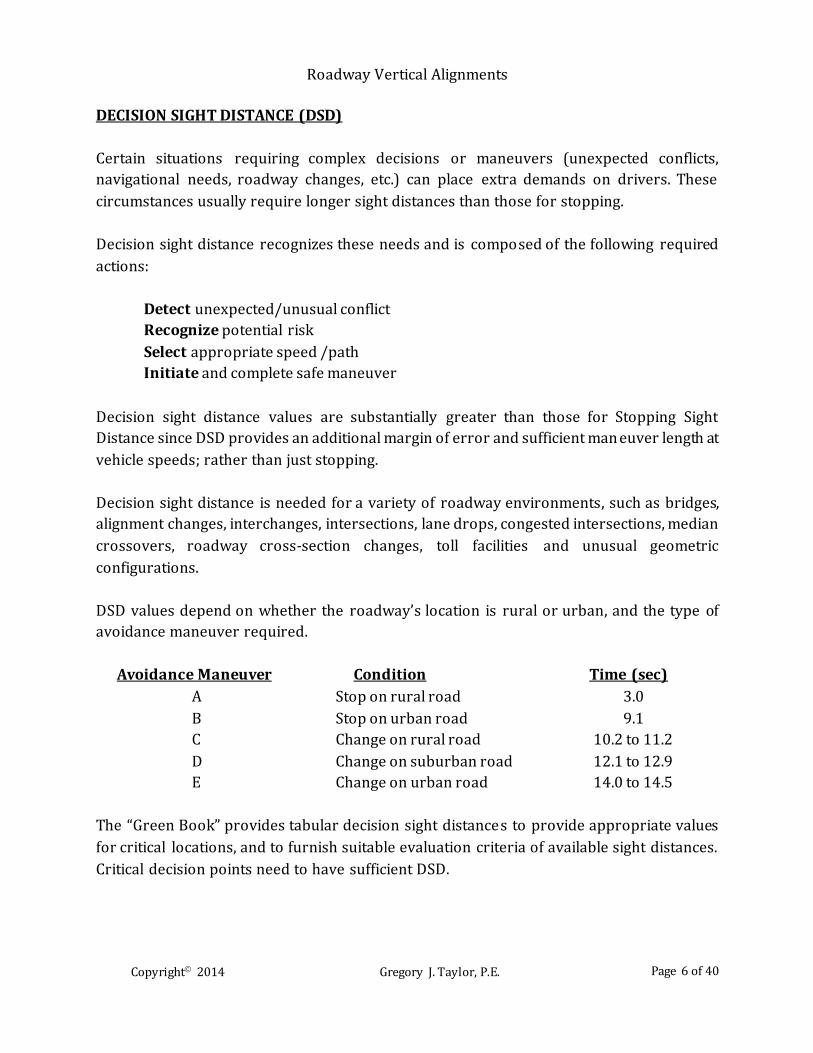
DSD values depend on whether the roadway’s location is rural or urban, and the type of
avoidance maneuver required.
Avoidance Maneuver Condition Time (sec)
A Stop on rural road 3.0
B Stop on urban road 9.1
C Change on rural road 10.2 to 11.2
D Change on suburban road 12.1 to 12.9
E Change on urban road 14.0 to 14.5
The “Green Book” provides tabular decision sight distances to provide appropriate values
for critical locations, and to furnish suitable evaluation criteria of available sight distances.
Critical decision points need to have sufficient DSD.
Roadway Vertical Alignments
Copyright 2014 Gregory J. Taylor, P.E. Page 7 of 40
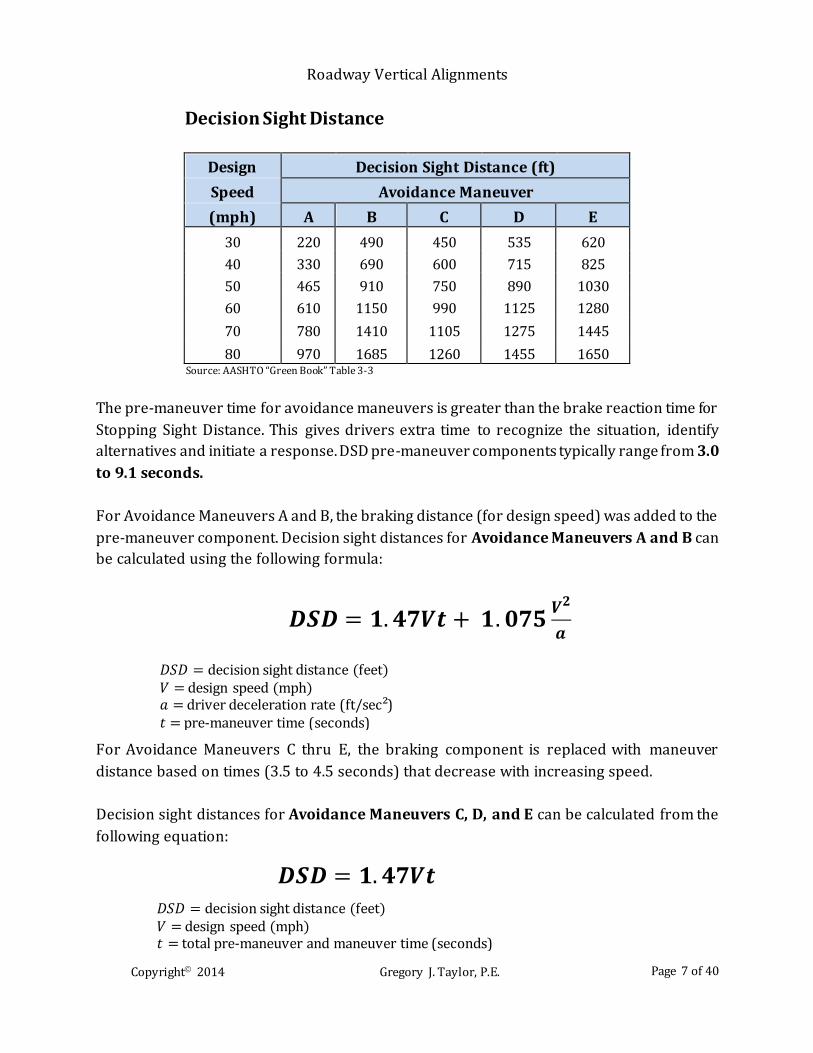
Decision Sight Distance
Design Decision Sight Distance (ft)
Speed Avoidance Maneuver
(mph) A B C D E
30 220 490 450 535 620
40 330 690 600 715 825
50 465 910 750 890 1030
60 610 1150 990 1125 1280
70 780 1410 1105 1275 1445
80 970 1685 1260 1455 1650 Source: AASHTO “Green Book” Table 3-3
The pre-maneuver time for avoidance maneuvers is greater than the brake reaction time for
Stopping Sight Distance. This gives drivers extra time to recognize the situation, identify
alternatives and initiate a response. DSD pre-maneuver components typically range from 3.0
to 9.1 seconds.
For Avoidance Maneuvers A and B, the braking distance (for design speed) was added to the
pre-maneuver component. Decision sight distances for Avoidance Maneuvers A and B can
be calculated using the following formula:
For Avoidance Maneuvers C thru E, the braking component is replaced with maneuver
distance based on times (3.5 to 4.5 seconds) that decrease with increasing speed.
Decision sight distances for Avoidance Maneuvers C, D, and E can be calculated from the
following equation:
𝑫𝑺𝑫 = 𝟏. 𝟒𝟕𝑽𝒕 + 𝟏. 𝟎𝟕𝟓𝑽𝟐
𝒂
𝐷𝑆𝐷 = decision sight distance (feet) 𝑉 = design speed (mph) 𝑎 = driver deceleration rate (ft/sec²) 𝑡 = pre-maneuver time (seconds)
𝑫𝑺𝑫 = 𝟏. 𝟒𝟕𝑽𝒕
𝐷𝑆𝐷 = decision sight distance (feet) 𝑉 = design speed (mph) 𝑡 = total pre-maneuver and maneuver time (seconds)
Roadway Vertical Alignments
Copyright 2014 Gregory J. Taylor, P.E. Page 8 of 40
PASSING SIGHT DISTANCE (PSD)
Passing sight distance is the length of roadway needed for drivers on two-lane two-way
highways to pass slower vehicles without meeting opposing traffic.
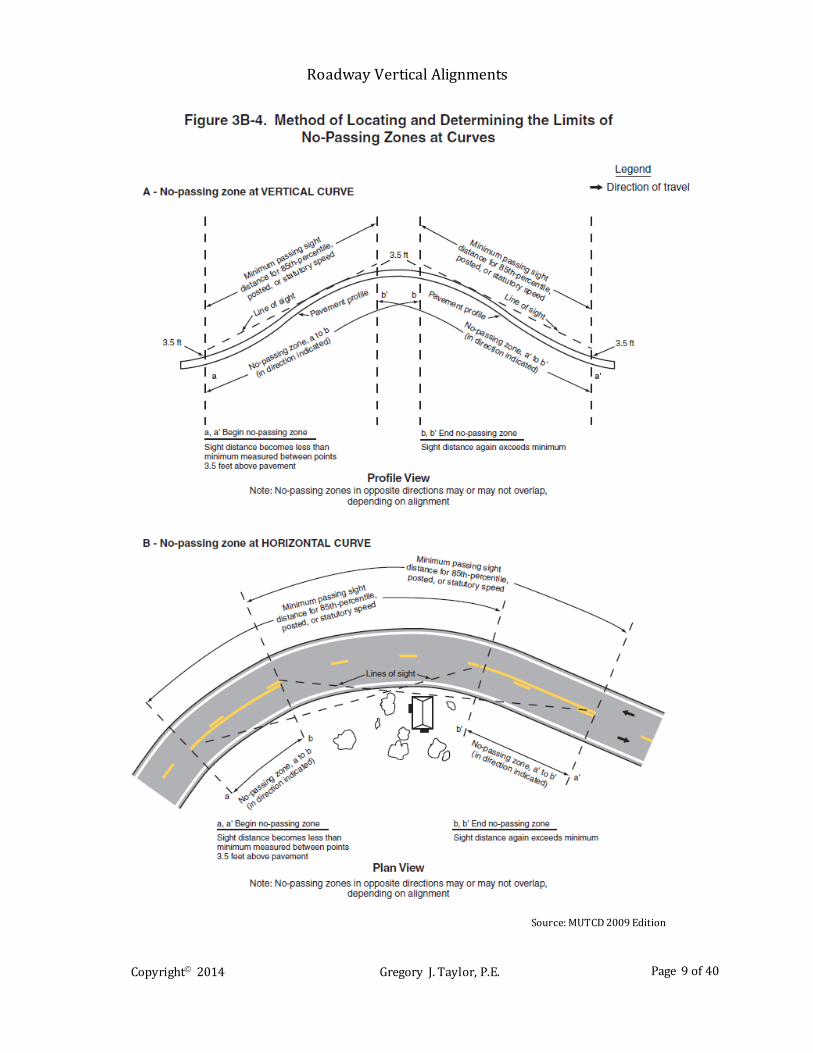
Passing Sight Distance Definitions
Vertical Curve Distance where an object (3.5 ft above roadway surface) can be seen
from a point 3.5 ft above the roadway.
Horizontal Curve Distance measured (along the center line or right-hand lane line for 3-
lane roadway) between two points 3.5 ft above the roadway on a
tangent line.
Roadway Vertical Alignments
Copyright 2014 Gregory J. Taylor, P.E. Page 9 of 40
Source: MUTCD 2009 Edition
Roadway Vertical Alignments
Copyright 2014 Gregory J. Taylor, P.E. Page 10 of 40
Potential passing conflicts are ultimately determined by driver responses to:
View of roadway ahead
Passing and no-passing zone markings
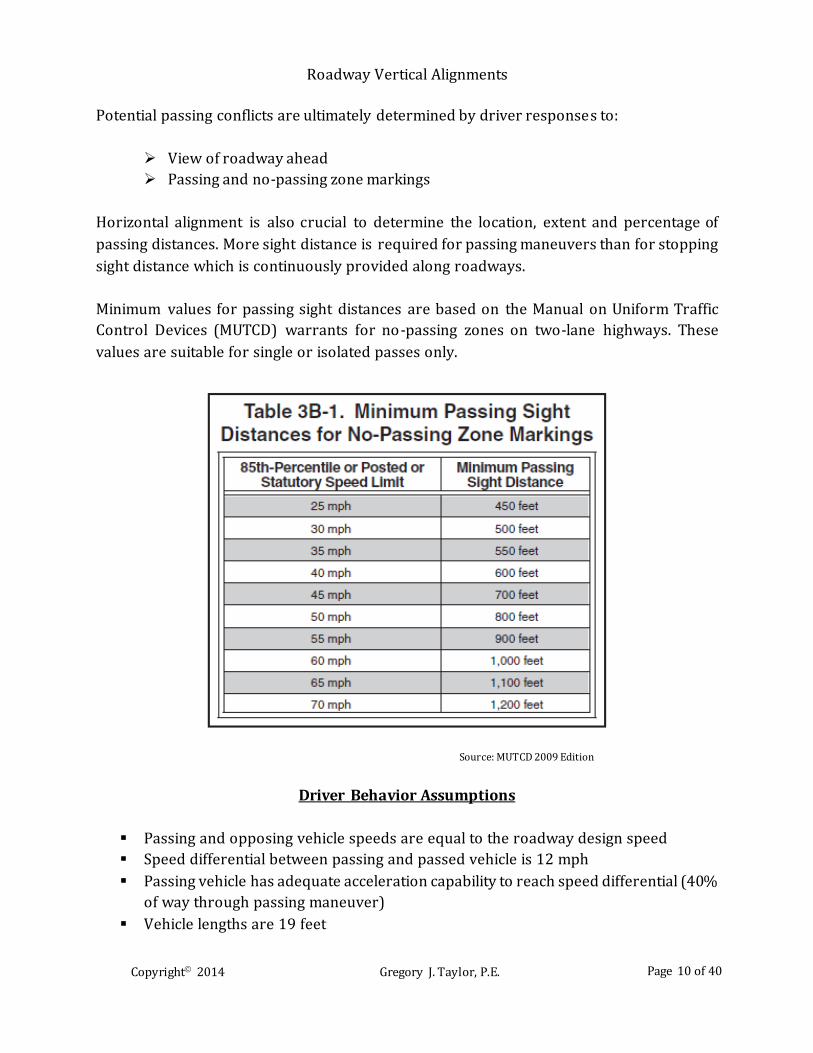
Horizontal alignment is also crucial to determine the location, extent and percentage of
passing distances. More sight distance is required for passing maneuvers than for stopping
sight distance which is continuously provided along roadways.
Minimum values for passing sight distances are based on the Manual on Uniform Traffic
Control Devices (MUTCD) warrants for no-passing zones on two-lane highways. These
values are suitable for single or isolated passes only.
Source: MUTCD 2009 Edition
Driver Behavior Assumptions
Passing and opposing vehicle speeds are equal to the roadway design speed
Speed differential between passing and passed vehicle is 12 mph
Passing vehicle has adequate acceleration capability to reach speed differential (40%
of way through passing maneuver)
Vehicle lengths are 19 feet
Roadway Vertical Alignments
Copyright 2014 Gregory J. Taylor, P.E. Page 11 of 40
Passing driver’s perception-reaction time to abort passing maneuver is 1 second
Deceleration rate of 11.2 ft/s² for passing vehicle when passing maneuver is aborted
Space headway between passing and passed vehicles is 1 second
Minimum clearance between passing and opposed vehicles upon return to normal
lane is 1 second
Design passing sight values should also be based on a single passenger vehicle passing
another single passenger vehicle.
Passing sight distances should be as long and frequent as possible, and equal or greater than
the minimum values, depending on:
topography
design speed
cost
intersection spacing
While passing sections are used on most highways and selected streets, othe rs can usually
be provided at little or no additional cost.
INTERSECTION SIGHT DISTANCE (ISD)
The potential for vehicular conflicts at intersections can be greatly reduced with proper sight
distances and traffic control. Intersection efficiency depends on driver behavior: judgment,
capability and response. Approaching drivers need an unobstructed view of the intersection
and approaching roadways to safely maneuver through the facility.
Intersection sight distance is the length of roadway along the intersecting road that the
approaching vehicle should have to perceive and react to potential conflicts. Both roadway
horizontal and vertical geometry can have a great effect on ISD.
Sight distance is needed to allow stopped vehicles a sufficient view of the intersecting
roadway in order to enter or cross it. Intersection sight distances that exceed stopping sight
distances along major roads are considered sufficient to anticipate and avoid conflicts.
Intersection sight distance determination is based on many of the same principles as
stopping sight distance.
Roadway Vertical Alignments
Copyright 2014 Gregory J. Taylor, P.E. Page 12 of 40
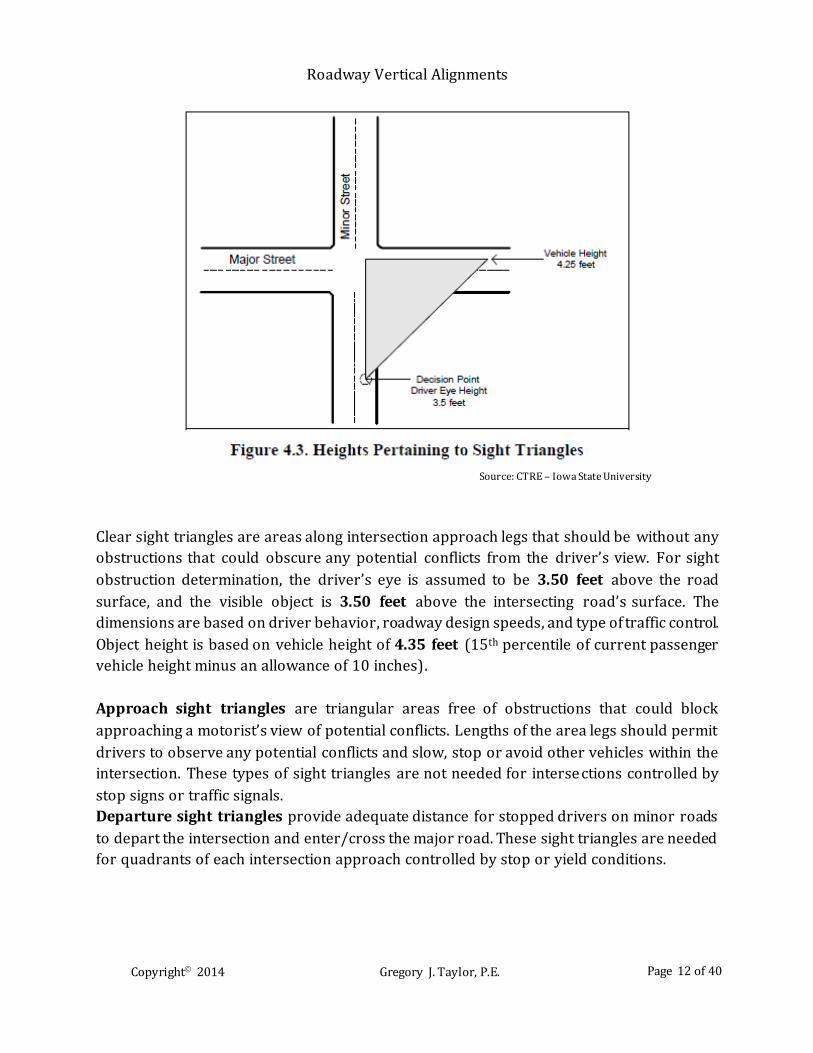
Source: CTRE – Iowa State University
Clear sight triangles are areas along intersection approach legs that should be without any
obstructions that could obscure any potential conflicts from the driver’s view. For sight
obstruction determination, the driver’s eye is assumed to be 3.50 feet above the road
surface, and the visible object is 3.50 feet above the intersecting road’s surface. The
dimensions are based on driver behavior, roadway design speeds, and type of traffic control.
Object height is based on vehicle height of 4.35 feet (15th percentile of current passenger
vehicle height minus an allowance of 10 inches).
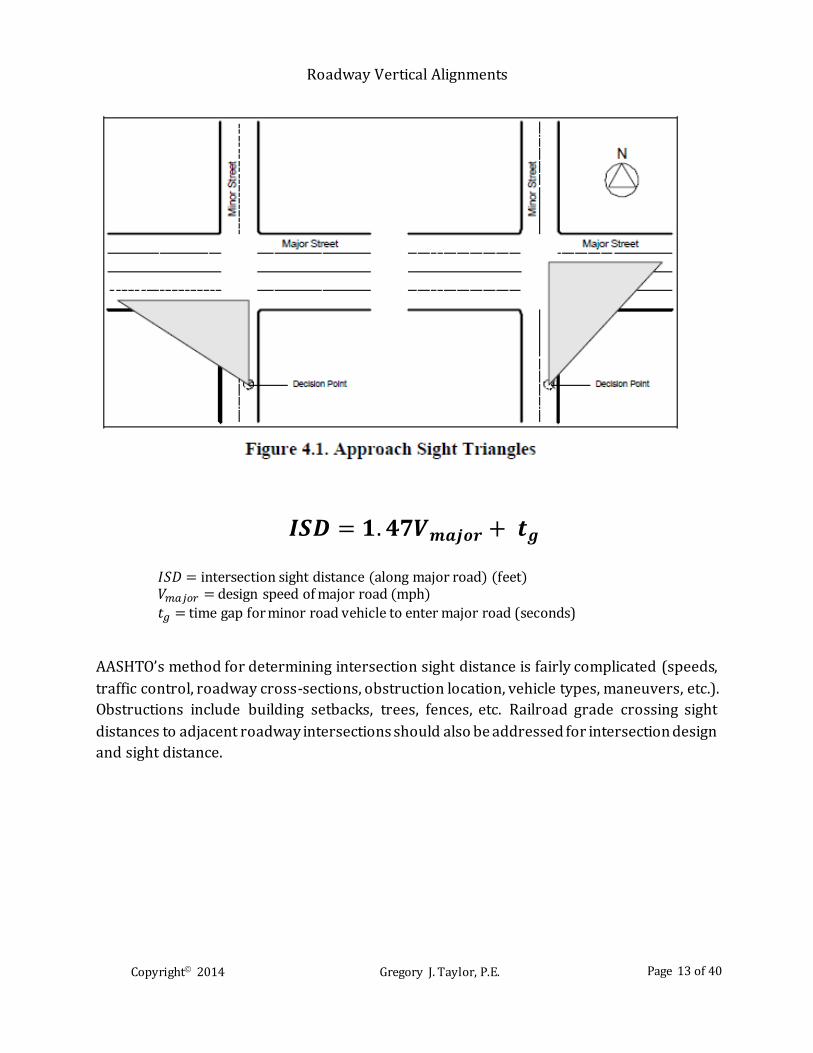
Approach sight triangles are triangular areas free of obstructions that could block
approaching a motorist’s view of potential conflicts. Lengths of the area legs should permit
drivers to observe any potential conflicts and slow, stop or avoid other vehicles within the
intersection. These types of sight triangles are not needed for interse ctions controlled by
stop signs or traffic signals.
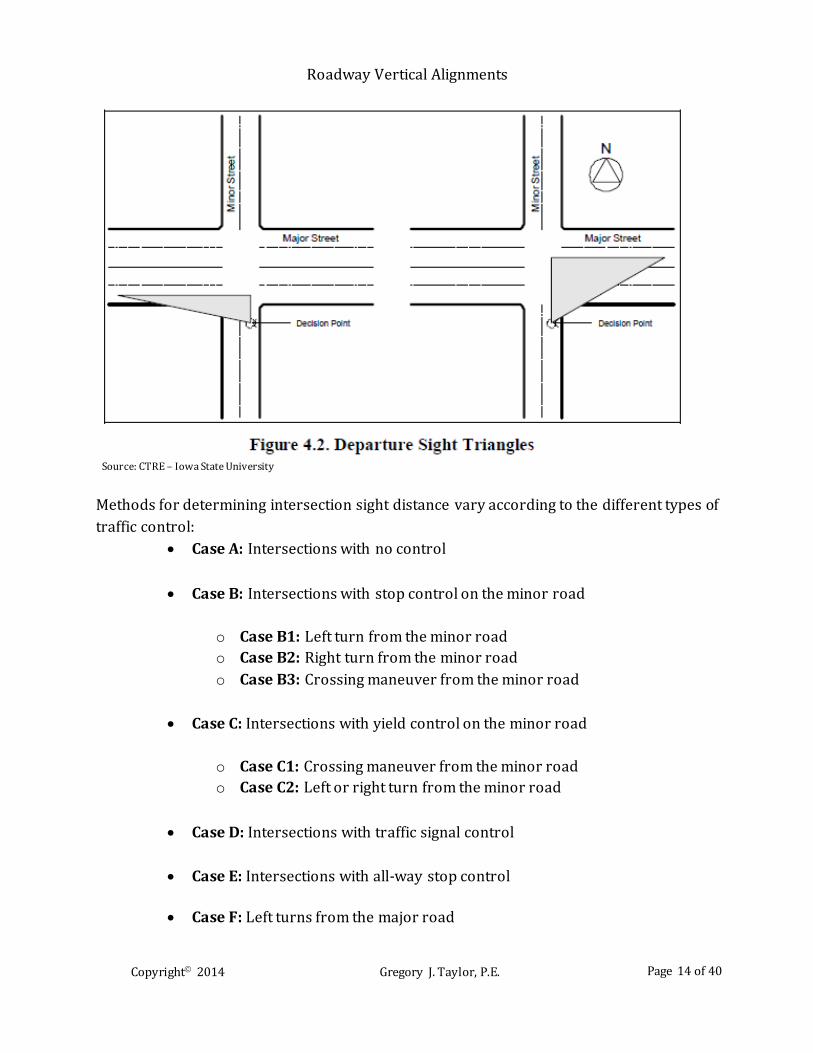
Departure sight triangles provide adequate distance for stopped drivers on minor roads
to depart the intersection and enter/cross the major road. These sight triangles are needed
for quadrants of each intersection approach controlled by stop or yield conditions.
Roadway Vertical Alignments
Copyright 2014 Gregory J. Taylor, P.E. Page 13 of 40
AASHTO’s method for determining intersection sight distance is fairly complicated (speeds,
traffic control, roadway cross-sections, obstruction location, vehicle types, maneuvers, etc.).
Obstructions include building setbacks, trees, fences, etc. Railroad grade crossing sight
distances to adjacent roadway intersections should also be addressed for intersection design
and sight distance.
𝑰𝑺𝑫 = 𝟏. 𝟒𝟕𝑽𝒎𝒂𝒋𝒐𝒓 + 𝒕𝒈
𝐼𝑆𝐷 = intersection sight distance (along major road) (feet) 𝑉𝑚𝑎𝑗𝑜𝑟 = design speed of major road (mph)
𝑡𝑔 = time gap for minor road vehicle to enter major road (seconds)
Roadway Vertical Alignments
Copyright 2014 Gregory J. Taylor, P.E. Page 14 of 40
Source: CTRE – Iowa State University
Methods for determining intersection sight distance vary according to the different types of
traffic control:
Case A: Intersections with no control
Case B: Intersections with stop control on the minor road
o Case B1: Left turn from the minor road
o Case B2: Right turn from the minor road
o Case B3: Crossing maneuver from the minor road
Case C: Intersections with yield control on the minor road
o Case C1: Crossing maneuver from the minor road
o Case C2: Left or right turn from the minor road
Case D: Intersections with traffic signal control
Case E: Intersections with all-way stop control
Case F: Left turns from the major road
Roadway Vertical Alignments
Copyright 2014 Gregory J. Taylor, P.E. Page 15 of 40
VERTICAL ALIGNMENT
A proposed roadway must consider the existing constraints and balance safety/economic
factors to produce roads that are neither flat nor straight with vertical and horizontal curves
to accommodate existing conditions (topography, property owners, land usage, natural
resources, cost, environment, etc.).
Roadway vertical alignments consist of crest and sag curves with straight grades connecting
them. The vertical profile is typically displayed as a graph with elevation on the vertical axis,
and horizontal alignment distance on the horizontal axis. Geometric design of the proposed
profile is governed by safety, vehicle operations, drainage and construction issues.
Topography of the land to be traversed plays a major role in the alignment of roadways;
particularly the vertical profile. The terrain can be classified by its variations into the
following categories:
Level: Sight distances are generally lengthy or accomplished without difficulty or
expense.
Rolling: Natural slopes rise or fall below the road grade with occasional steep slopes
and some alignment restriction. Typically a rolling terrain generates steeper grades
than level terrain which causes significant reduction in truck speeds.
Mountainous: They are characterized by abrupt changes in ground elevation with
respect to the roadway. Benching and excavation are typically used for sight distance.
Truck speed reduction is more drastic.
A rolling terrain typically requires steeper grades than level topography, which produce
truck speeds below those of passenger cars. A mountainous terrain may cause trucks to
operate at much slower (crawl) speeds.
More complex construction methods for an increasingly challenging terrain must be used to
integrate proposed alignments with the existing ground. The roadway vertical alignment
should be coordinated with existing topography, available right-of-way, utilities,
developments and drainage patterns.
Roadway Vertical Alignments
Copyright 2014 Gregory J. Taylor, P.E. Page 16 of 40
TANGENT GRADES
Vertical grades should encourage consistent operation throughout the proposed roadways.
AASHTO guidelines for grades are a function of highway type, design speed and terrain. Most
passenger cars can readily negotiate grades as steep as 4 to 5 percent without a significant
loss in normal roadway speeds. However, vehicle speeds decrease progressively with grade
increases particularly for cars with high weight/power ratios.
Research has shown that passenger car operation on 3 percent upgrades has only a minimal
effect on vehicle speeds compared to those on level terrain.
Steep upgrades - speed decreases progressively with grade increases
Downgrades - speed is generally higher than level sections
Truck speeds are much more impacted by vertical grades than passenger cars. Heavy
vehicles often control traffic speeds on uphill grades due to restrictive sight distances. Long
grades (greater than 3%) influence passenger vehicle speeds while shorter, steeper grades
affect truck speeds. This can reduce roadway capacity and create rear-end conflicts.
Although both car and truck average speeds are similar for level sections, trucks usually
increase downgrade speeds up to 5% and decrease upgrade speeds by 7%. Maximum speeds
are dependent on the grade (length and/or steepness) and the truck’s weight/power ratio
(gross vehicle weight divided by the net engine power).
Truck travel times and speeds are byproducts of their weight/power ratio; present
acceptable highway values is approximately 200 lb/hp. Vehicles with similar weight/power
ratios produce similar operational results which are useful in anticipating truck
performance. Over the years, these values have steadily decreased to produce greater power
and better climbing ability on roadway upgrades.
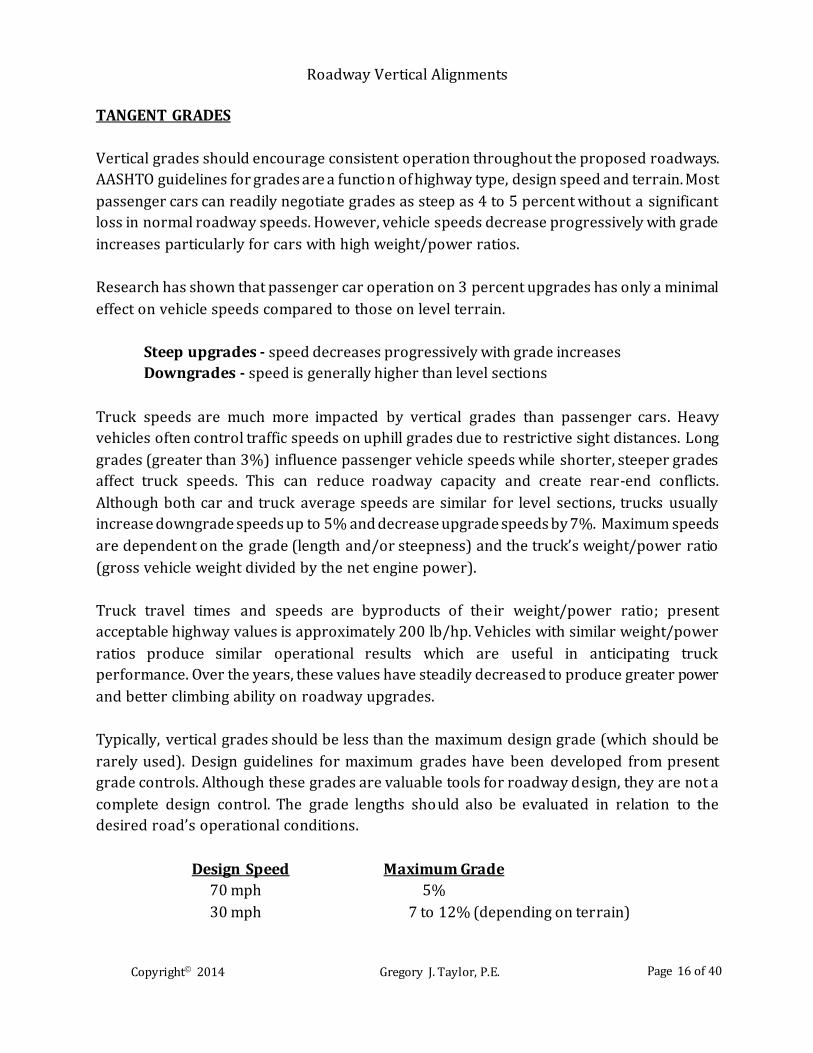
Typically, vertical grades should be less than the maximum design grade (which should be
rarely used). Design guidelines for maximum grades have been developed from present
grade controls. Although these grades are valuable tools for roadway design, they are not a
complete design control. The grade lengths should also be evaluated in relation to the
desired road’s operational conditions.
Design Speed Maximum Grade
70 mph 5%
30 mph 7 to 12% (depending on terrain)
Roadway Vertical Alignments
Copyright 2014 Gregory J. Taylor, P.E. Page 17 of 40
Maximum grades of 7 to 8 percent are typical for 30 mph design speed for major routes. For
one-way downgrades (less than 500 ft in length), the maximum grade value needs to be
approximately 1% steeper than other locations. Maximum grades may be 2% steeper for
low-volume rural highways.
Retaining adequate minimum grades can be a critical concern at many roadway locations.
These grades are provided for drainage purposes and depend on rainfall, soil type and site
conditions. A typical minimum grade value of 0.5 percent is adequate for roadway surface
drainage. For locations with flat grades, stormwater drainage systems (pipes, inlets, swales,
channels, etc.) should be considered to keep the spread of water within acceptable limits.
Roadway vertical alignments (profile) can affect road drainage by creating steep roads with
high velocity flows or flat roads/sag curves with poor drainage.
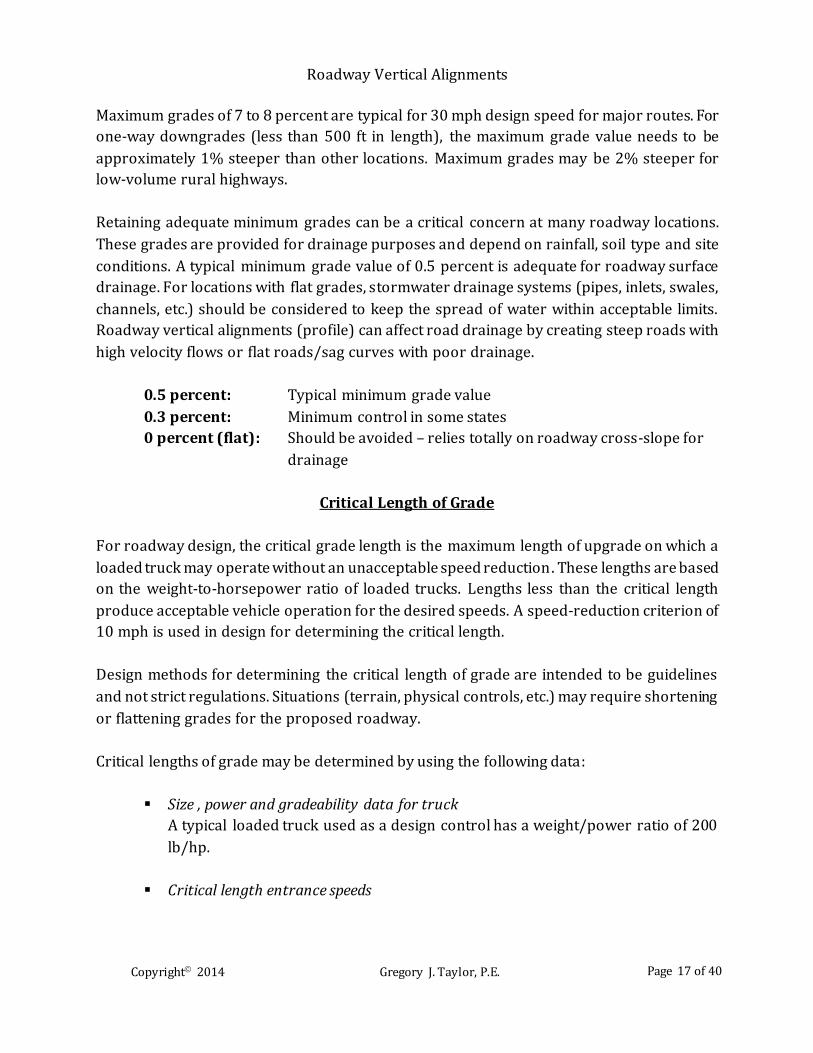
0.5 percent: Typical minimum grade value
0.3 percent: Minimum control in some states
0 percent (flat): Should be avoided – relies totally on roadway cross-slope for
drainage
Critical Length of Grade
For roadway design, the critical grade length is the maximum length of upgrade on which a
loaded truck may operate without an unacceptable speed reduction. These lengths are based
on the weight-to-horsepower ratio of loaded trucks. Lengths less than the critical length
produce acceptable vehicle operation for the desired speeds. A speed-reduction criterion of
10 mph is used in design for determining the critical length.
Design methods for determining the critical length of grade are intended to be guidelines
and not strict regulations. Situations (terrain, physical controls, etc.) may require shortening
or flattening grades for the proposed roadway.
Critical lengths of grade may be determined by using the following data:
Size , power and gradeability data for truck
A typical loaded truck used as a design control has a weight/power ratio of 200
lb/hp.
Critical length entrance speeds
Roadway Vertical Alignments
Copyright 2014 Gregory J. Taylor, P.E. Page 18 of 40
The average running speed can be used for vehicle speeds at the beginning of an
uphill approach.
Minimum tolerable speeds of trucks on upgrades
Roadways designs should strive to prevent intolerable truck speed reductions for
following drivers.
Typical methods for identifying the critical length of grade have been to use a reduction of
15 mph below the average running speed of all traffic. While it would be ideal for all traffic
to operate at average speed, this is not practical. Crash involvement rates increase
significantly for truck speed reductions over 10 mph; the rate is 2.4 times greater for 15 mph
reduction. History has shown that the greater the deviation from the average roadway speed,
the greater the chance of crashing.
CLIMBING LANES
Climbing lanes are additional lanes used exclusively for slow-moving vehicles (uphill) in
order to permit other vehicles on normal roadway lanes to pass. Locations for climbing lanes
are suitable for locations where truck speed or level of service is significantly less on
upgrades than on the upgrade’s approach. Truck climbing lanes are typically recommended
on arterials for grades that exceed the critical length of grade.
A two-lane highway with a climbing lane is not considered to be a three-lane roadway, but a
highway with an added lane so vehicles using normal lanes are not delayed. Separate
climbing lanes for slower vehicles are preferable to adding extra mixed traffic lanes.
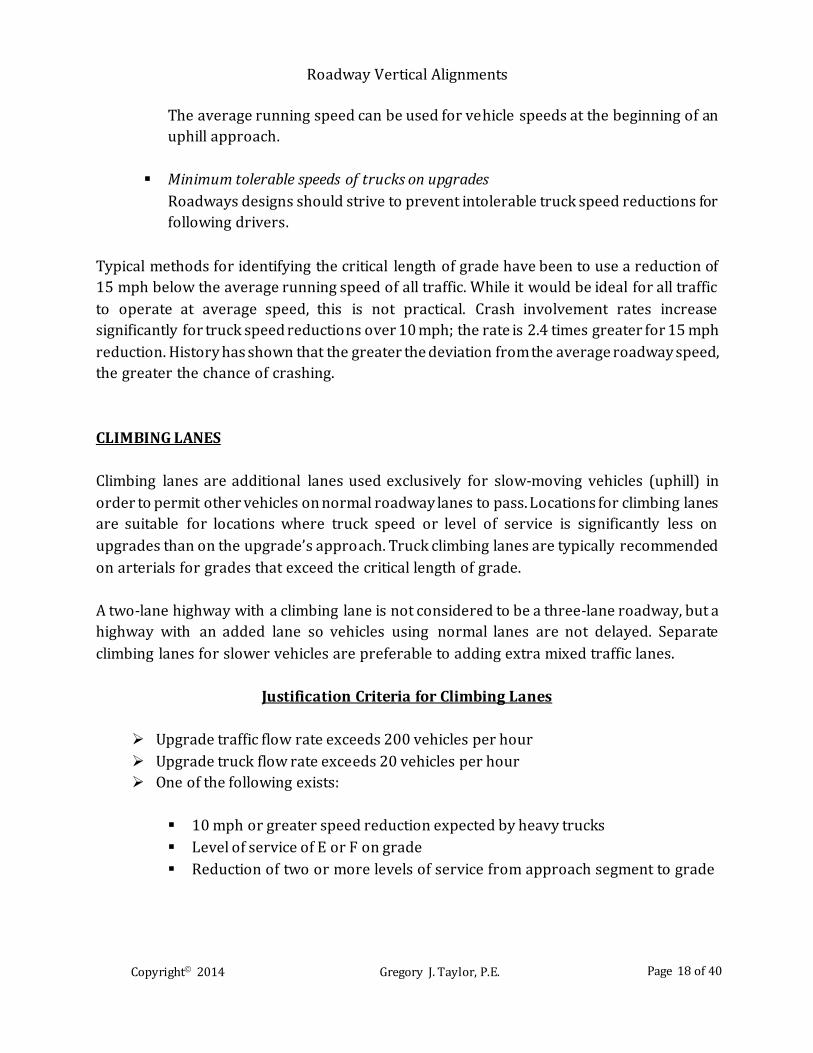
Justification Criteria for Climbing Lanes
Upgrade traffic flow rate exceeds 200 vehicles per hour
Upgrade truck flow rate exceeds 20 vehicles per hour
One of the following exists:
10 mph or greater speed reduction expected by heavy trucks
Level of service of E or F on grade
Reduction of two or more levels of service from approach segment to grade
Roadway Vertical Alignments
Copyright 2014 Gregory J. Taylor, P.E. Page 19 of 40
Climbing lanes may prevent reconstructing existing roads by providing an inexpensive way
to reduce crashes, overcome capacity reductions, and improve operation in truck congestion
areas. Climbing lanes on new projects can increase operational efficiency without creating a
multilane roadway.
Methods for Increasing Passing Opportunities (2-Lane Roads)
Passing lanes
Turnouts
Shoulder driving
Shoulder use sections
A passing lane is an added lane for improving traffic in low capacity sections to the level of
their adjacent sections. Passing lanes are frequently provided systematically at regular
intervals. Optimal lane lengths are typically 0.5 to 2 miles (longer lane lengths for higher
traffic volumes).
Appropriate locations for passing lanes should appear logical to the user and should consider
the location of intersections, high-volume driveways, physical constraints and sight distance.
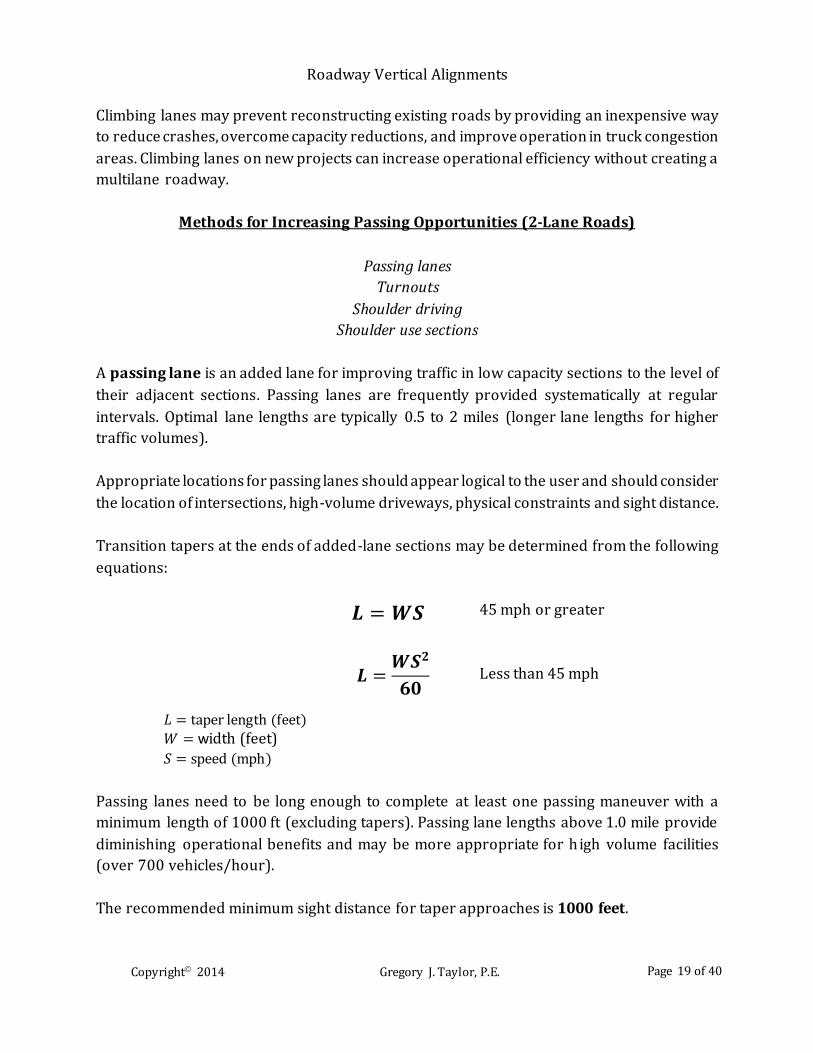
Transition tapers at the ends of added-lane sections may be determined from the following
equations:
45 mph or greater
Less than 45 mph
Passing lanes need to be long enough to complete at least one passing maneuver with a
minimum length of 1000 ft (excluding tapers). Passing lane lengths above 1.0 mile provide
diminishing operational benefits and may be more appropriate for high volume facilities
(over 700 vehicles/hour).
The recommended minimum sight distance for taper approaches is 1000 feet.
𝑳 = 𝑾𝑺
𝑳 =𝑾𝑺𝟐
𝟔𝟎
𝐿 = taper length (feet)
𝑊 = width (feet)
𝑆 = speed (mph)
Roadway Vertical Alignments
Copyright 2014 Gregory J. Taylor, P.E. Page 20 of 40
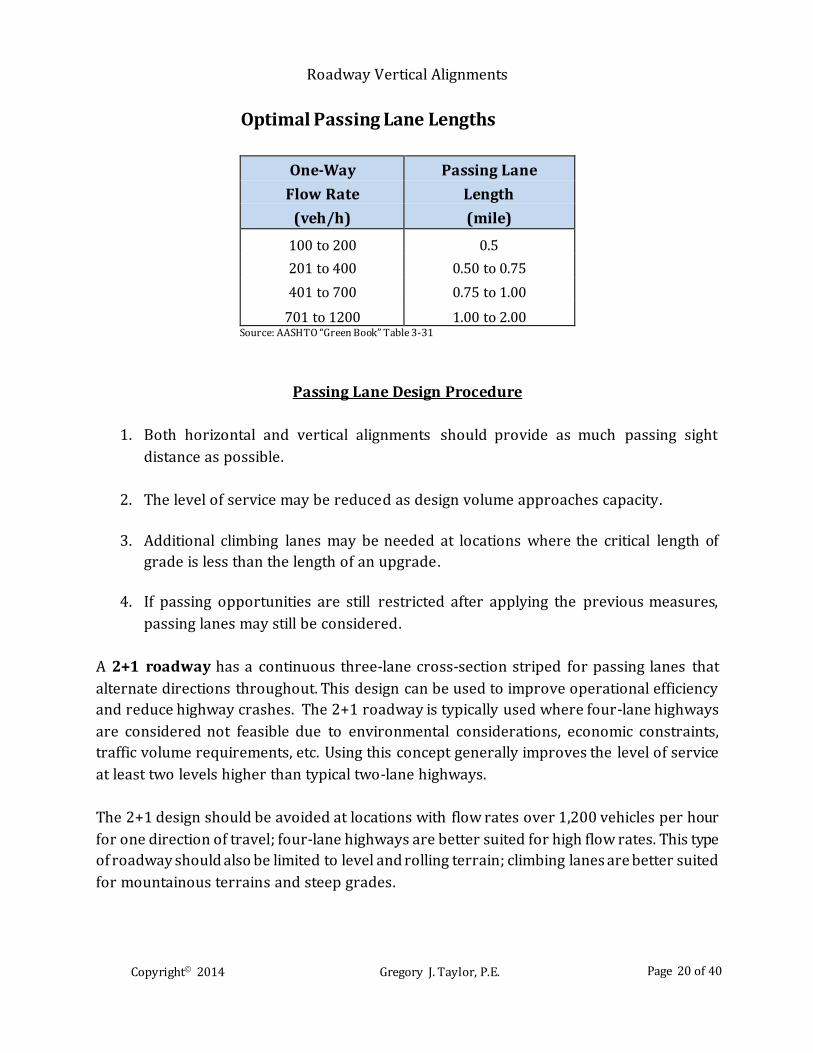
Optimal Passing Lane Lengths
One-Way Passing Lane
Flow Rate Length
(veh/h) (mile)
100 to 200 0.5
201 to 400 0.50 to 0.75
401 to 700 0.75 to 1.00
701 to 1200 1.00 to 2.00 Source: AASHTO “Green Book” Table 3-31
Passing Lane Design Procedure
1. Both horizontal and vertical alignments should provide as much passing sight
distance as possible.
2. The level of service may be reduced as design volume approaches capacity.
3. Additional climbing lanes may be needed at locations where the critical length of
grade is less than the length of an upgrade.
4. If passing opportunities are still restricted after applying the previous measures,
passing lanes may still be considered.
A 2+1 roadway has a continuous three-lane cross-section striped for passing lanes that
alternate directions throughout. This design can be used to improve operational efficiency
and reduce highway crashes. The 2+1 roadway is typically used where four-lane highways
are considered not feasible due to environmental considerations, economic constraints,
traffic volume requirements, etc. Using this concept generally improves the level of service
at least two levels higher than typical two-lane highways.
The 2+1 design should be avoided at locations with flow rates over 1,200 vehicles per hour
for one direction of travel; four-lane highways are better suited for high flow rates. This type
of roadway should also be limited to level and rolling terrain; climbing lanes are better suited
for mountainous terrains and steep grades.
Roadway Vertical Alignments
Copyright 2014 Gregory J. Taylor, P.E. Page 21 of 40
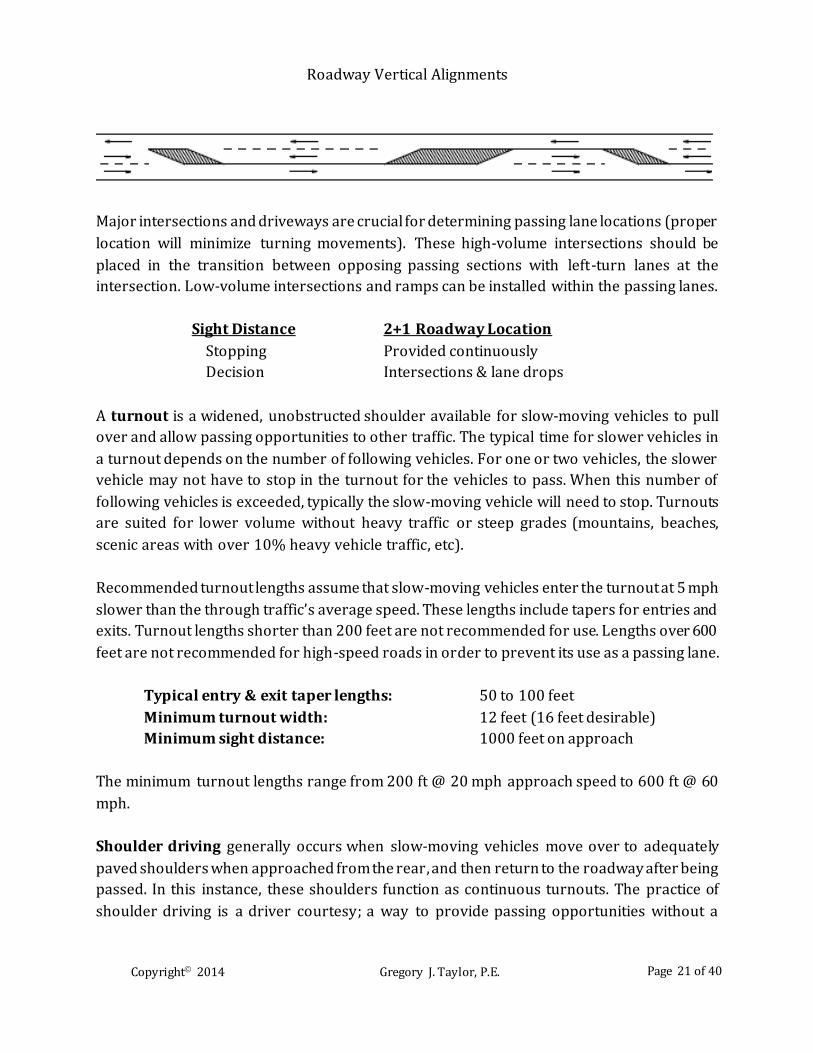
Major intersections and driveways are crucial for determining passing lane locations (proper
location will minimize turning movements). These high-volume intersections should be
placed in the transition between opposing passing sections with left-turn lanes at the
intersection. Low-volume intersections and ramps can be installed within the passing lanes.
Sight Distance 2+1 Roadway Location
Stopping Provided continuously
Decision Intersections & lane drops
A turnout is a widened, unobstructed shoulder available for slow-moving vehicles to pull
over and allow passing opportunities to other traffic. The typical time for slower vehicles in
a turnout depends on the number of following vehicles. For one or two vehicles, the slower
vehicle may not have to stop in the turnout for the vehicles to pass. When this number of
following vehicles is exceeded, typically the slow-moving vehicle will need to stop. Turnouts
are suited for lower volume without heavy traffic or steep grades (mountains, beaches,
scenic areas with over 10% heavy vehicle traffic, etc).
Recommended turnout lengths assume that slow-moving vehicles enter the turnout at 5 mph
slower than the through traffic’s average speed. These lengths include tapers for entries and
exits. Turnout lengths shorter than 200 feet are not recommended for use. Lengths over 600
feet are not recommended for high-speed roads in order to prevent its use as a passing lane.
Typical entry & exit taper lengths: 50 to 100 feet
Minimum turnout width: 12 feet (16 feet desirable)
Minimum sight distance: 1000 feet on approach
The minimum turnout lengths range from 200 ft @ 20 mph approach speed to 600 ft @ 60
mph.
Shoulder driving generally occurs when slow-moving vehicles move over to adequately
paved shoulders when approached from the rear, and then return to the roadway after being
passed. In this instance, these shoulders function as continuous turnouts. The practice of
shoulder driving is a driver courtesy; a way to provide passing opportunities without a
Roadway Vertical Alignments
Copyright 2014 Gregory J. Taylor, P.E. Page 22 of 40
capital investment. However, shoulder driving is currently prohibited by law in many states.
Legislation plus public education may be needed to enact any changes permitting this
practice.
The amount and structural quality of two-lane roadways should be evaluated before use as
a passing opportunity. Shoulder driving may not be limited to selected areas with paved
shoulders but anywhere in the roadway system.
A shoulder should have a minimum of 10 feet (12 feet desired). The possible effects that
shoulder driving may have on bicycles needs to be considered. No special signage to promote
shoulder driving has been created.
Shoulder use sections provide passing opportunities for slow-moving vehicles at
designated paved shoulder locations with specific signs. These sections differ from shoulder
driving as their application is limited to acting as extended turnouts. Slow-moving vehicles
move over to the shoulder long enough for faster vehicles to pass, and then return to through
traffic.
Shoulder-Use Section Dimensions
Lengths 0.2 to 3 miles
Width 10 feet (12 feet desired)
Special signs should be installed at the beginning and end of shoulder-use sections. The
existing shoulder condition needs to be evaluated for structural strength to support
anticipated traffic loads. Good surface conditions (free of debris without rough or broken
sections) are needed to encourage driver use.
EMERGENCY ESCAPE RAMPS
An emergency escape ramp should be used where roadway grades (due to their steepness
and length) create an opportunity for potential out-of-control vehicles. Emergency escape
ramps need to be provided as soon as a need is established. Contributing factors for runaway
vehicles include roadway grades, alignment, length and descending speed.
Typical Causes of Out-of-Control Vehicles
Brakes: overheating or mechanical failure
Transmission: failure to downshift properly, etc.
Roadway Vertical Alignments
Copyright 2014 Gregory J. Taylor, P.E. Page 23 of 40
Effective escape ramps help save lives and reduce property damage by providing proper
deceleration rates and good driver control. These ramps should be designed for the worst
case scenario, where the speeding vehicle is out of gear with brake system failure. Crash
histories and potential community impacts combined with engineering judgment are
typically used to evaluate if an escape ramp is warranted.
Each emergency escape ramp presents a variety of factors unique to its specific location, such
as:
Topography
Percentage and length of grade
Potential speed
Economics
Environmental impact
Crash history
Emergency escape ramps are usually built tangent to main roads and in advance of any
horizontal curves that cannot be safely negotiated. Theses ramps should also exit to the right
of the highway.
The maximum speed for an out-of-control vehicle should be used as the design speed for the
escape ramp. A recommended entering design speed of 80 to 90 mph represents an extreme
situation that should not be the determinant for choosing potential ramp locations.
The need for an emergency escape ramp should be based on safety, including the safety of
other roadway traffic; the safety of the runaway vehicle driver; and the safety of residents
along the roadway.
The minimum entering speed for emergency escape ramps is 80 mph (90 mph preferred).
Emergency Escape Ramps Categories
Gravity (least desirable)
- Stops forward motion but does not prevent rollback
- Paved or densely compacted aggregate surface
- Usually long, steep and constrained by topography and costs
Roadway Vertical Alignments
Copyright 2014 Gregory J. Taylor, P.E. Page 24 of 40
Sandpile (less desirable)
- Loose, dry sand
- Maximum length of 400 feet
- Suitable for areas with compact dimensions
- Severe deceleration characteristics and weather effects
Arrester bed
o Descending grade
Parallel and adjacent to through lanes
Loose aggregate to slow vehicle
Lengthy ramps may require return paths
o Horizontal grade
Flat grade to slow or stop vehicles
Minimal effect
Lengthier ramps required
o Ascending grade
Most common
Aggregate increases rolling resistance and holds vehicles in
place
Reduces ramp length
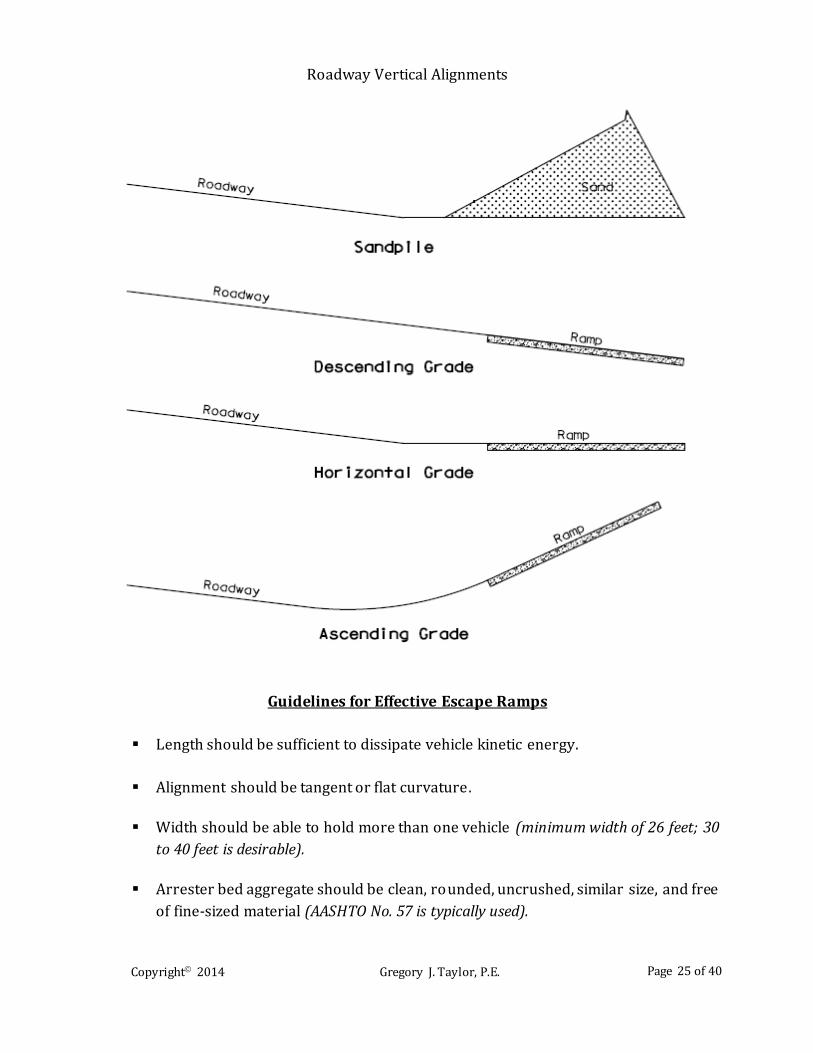
Within these categories, there are four basic ramp designs: sandpile, descending grade,
horizontal grade and ascending grade (most common).
Roadway Vertical Alignments
Copyright 2014 Gregory J. Taylor, P.E. Page 25 of 40
Guidelines for Effective Escape Ramps
Length should be sufficient to dissipate vehicle kinetic energy.
Alignment should be tangent or flat curvature.
Width should be able to hold more than one vehicle (minimum width of 26 feet; 30
to 40 feet is desirable).
Arrester bed aggregate should be clean, rounded, uncrushed, similar size, and free
of fine-sized material (AASHTO No. 57 is typically used).
Roadway Vertical Alignments
Copyright 2014 Gregory J. Taylor, P.E. Page 26 of 40
Arrester beds should have a minimum aggregate depth of 3 feet with a
recommended depth of 42 inches (3.5 feet).
Arrester bed grading should have sufficient drainage to prevent freezing or
contamination.
Ramp entrances should be designed for vehicles operating at high speeds . (Provide
as much sight distance as possible.)
Exit signage should clearly indicate ramp access and allow adequate driver reaction
time.
A service road (10 ft minimum width) should be located adjacent to the arrester bed
for tow truck/maintenance vehicle access.
Anchors should be located at 150 to 300 foot intervals adjacent to the arrester bed
for tow truck operations. (One anchor shall be installed 100 feet in advance of the
bed.)
Roadway Vertical Alignments
Copyright 2014 Gregory J. Taylor, P.E. Page 27 of 40
VERTICAL CURVES
Roadway vertical alignments consist of tangent grades connected with either crest (convex)
or sag (concave) parabolic curves. These curves provide a gradual grade change for vehicles
to smoothly navigate from one grade to another.
Parabolic Curve Advantages
Straightforward computations
Good riding comfort
Easy field implementation
Design guidelines for vertical curve lengths are based on sufficient sight distance and driver
comfort. The resulting vertical curves should be of simple design with proper sight distance,
enhanced vehicle control, pleasing appearance, and adequate roadway drainage.
Sight Distance
Sufficient sight distance is a major design control for crest vertical curves. All curves
should be designed to provide adequate stopping sight distance at a minimum, with
longer distances where possible to ease any shock from grade changes.
Driver Control
Changing roadway vertical grades need to be tolerable for driver comfort and control.
This grade rate of change is critical for sag curves where gravitational and vertical
forces act in opposite directions.
Appearance
Vertical curve designs should also be pleasing in appearance. Shorter curves may be
perceived as abrupt breaks in the vertical alignment and may not project with a
pleasing appearance as long vertical curves.
Roadway Drainage
Special attention should focus on designing sag vertical curves for proper drainage. It
is important to maintain a minimum grade of 0.5 percent (0.3% for outer roadway
edges). However, it may be necessary to use flatter grades in some instances.
Roadway Vertical Alignments
Copyright 2014 Gregory J. Taylor, P.E. Page 28 of 40
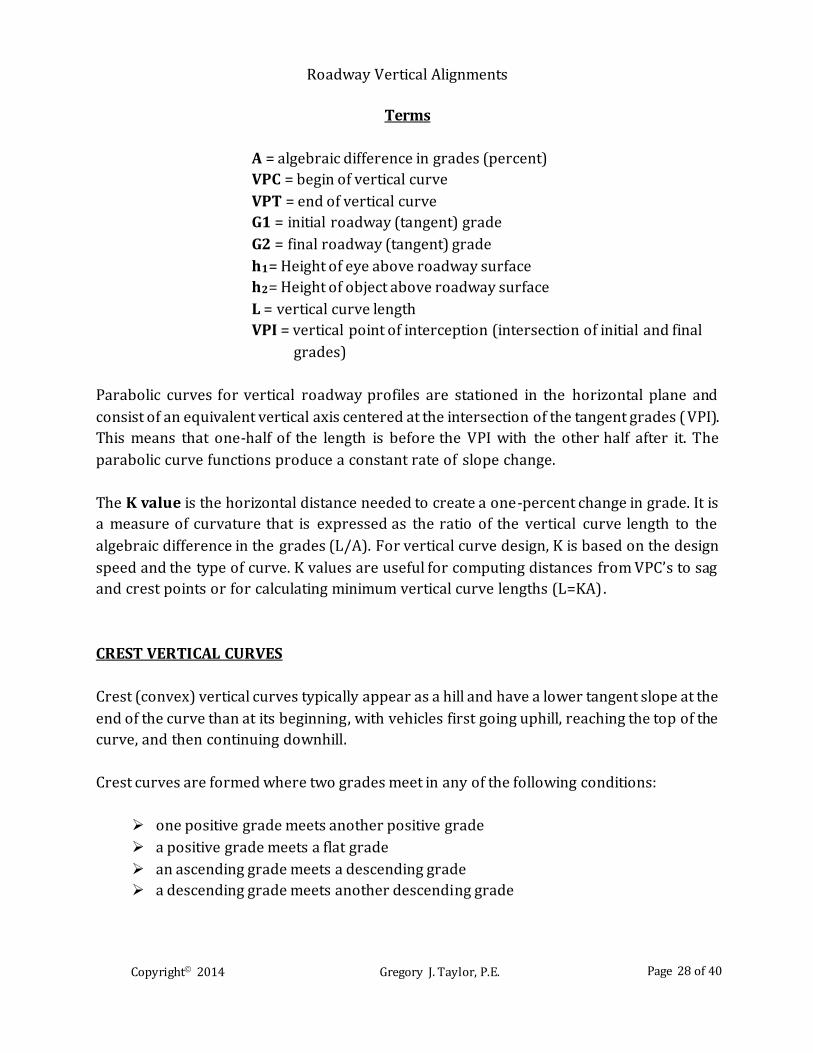
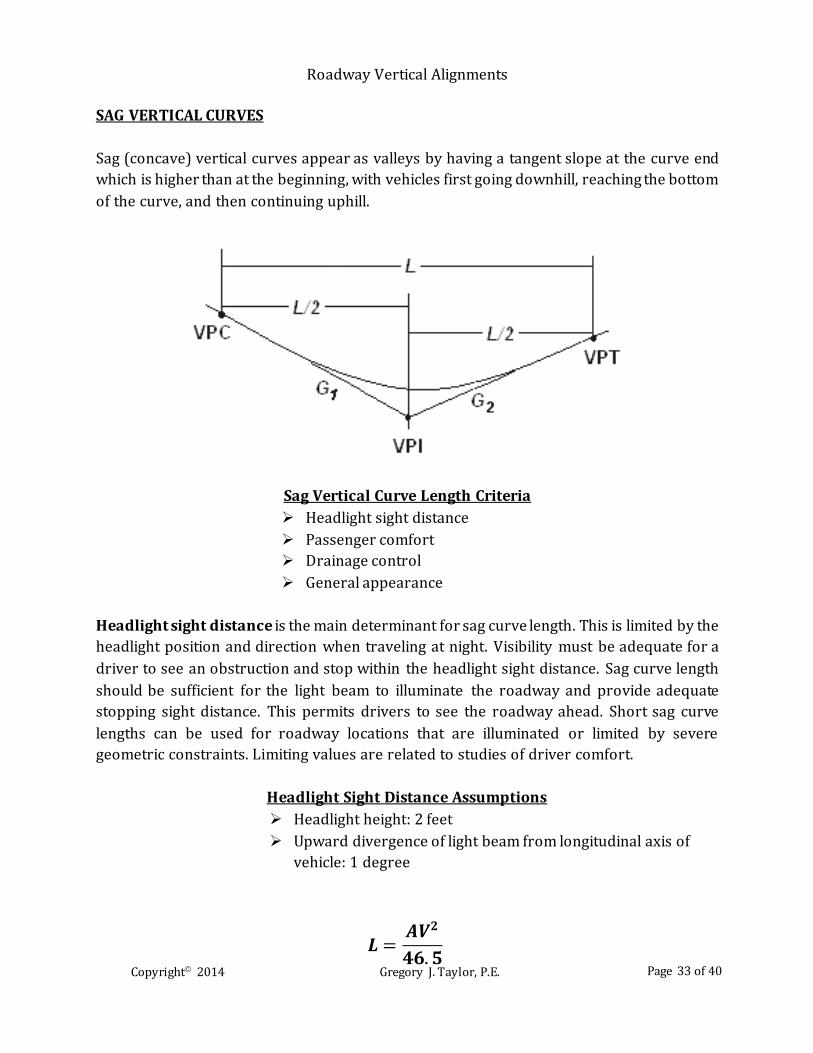
Terms
A = algebraic difference in grades (percent)
VPC = begin of vertical curve
VPT = end of vertical curve
G1 = initial roadway (tangent) grade
G2 = final roadway (tangent) grade
h1= Height of eye above roadway surface
h2= Height of object above roadway surface
L = vertical curve length
VPI = vertical point of interception (intersection of initial and final
grades)
Parabolic curves for vertical roadway profiles are stationed in the horizontal plane and
consist of an equivalent vertical axis centered at the intersection of the tangent grades ( VPI).
This means that one-half of the length is before the VPI with the other half after it. The
parabolic curve functions produce a constant rate of slope change.
The K value is the horizontal distance needed to create a one-percent change in grade. It is
a measure of curvature that is expressed as the ratio of the vertical curve length to the
algebraic difference in the grades (L/A). For vertical curve design, K is based on the design
speed and the type of curve. K values are useful for computing distances from VPC’s to sag
and crest points or for calculating minimum vertical curve lengths (L=KA).
CREST VERTICAL CURVES
Crest (convex) vertical curves typically appear as a hill and have a lower tangent slope at the
end of the curve than at its beginning, with vehicles first going uphill, reaching the top of the
curve, and then continuing downhill.
Crest curves are formed where two grades meet in any of the following conditions:
one positive grade meets another positive grade
a positive grade meets a flat grade
an ascending grade meets a descending grade
a descending grade meets another descending grade
Roadway Vertical Alignments
Copyright 2014 Gregory J. Taylor, P.E. Page 29 of 40
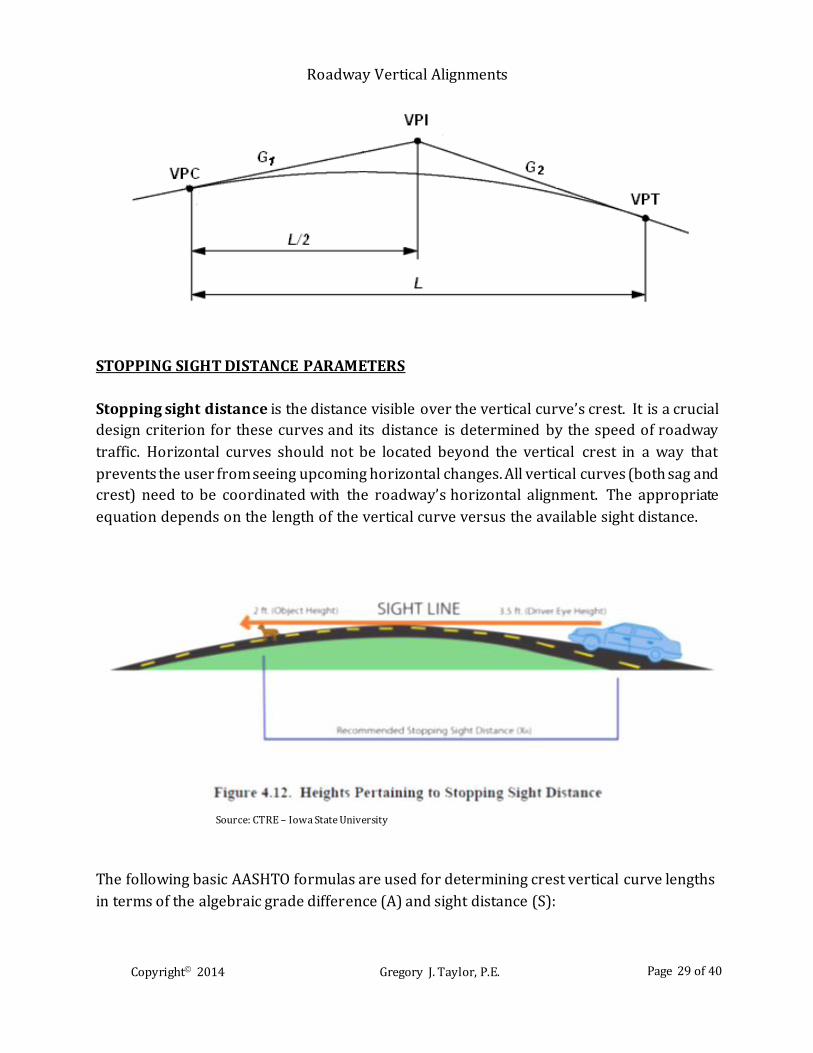
STOPPING SIGHT DISTANCE PARAMETERS
Stopping sight distance is the distance visible over the vertical curve’s crest. It is a crucial
design criterion for these curves and its distance is determined by the speed of roadway
traffic. Horizontal curves should not be located beyond the vertical crest in a way that
prevents the user from seeing upcoming horizontal changes. All vertical curves (both sag and
crest) need to be coordinated with the roadway’s horizontal alignment. The appropriate
equation depends on the length of the vertical curve versus the available sight distance.
Source: CTRE – Iowa State University
The following basic AASHTO formulas are used for determining crest vertical curve lengths
in terms of the algebraic grade difference (A) and sight distance (S):
Roadway Vertical Alignments
Copyright 2014 Gregory J. Taylor, P.E. Page 30 of 40
Stopping Sight Distance Criteria
Height of Eye: 3.50 feet
Height of Object: 2.00 feet
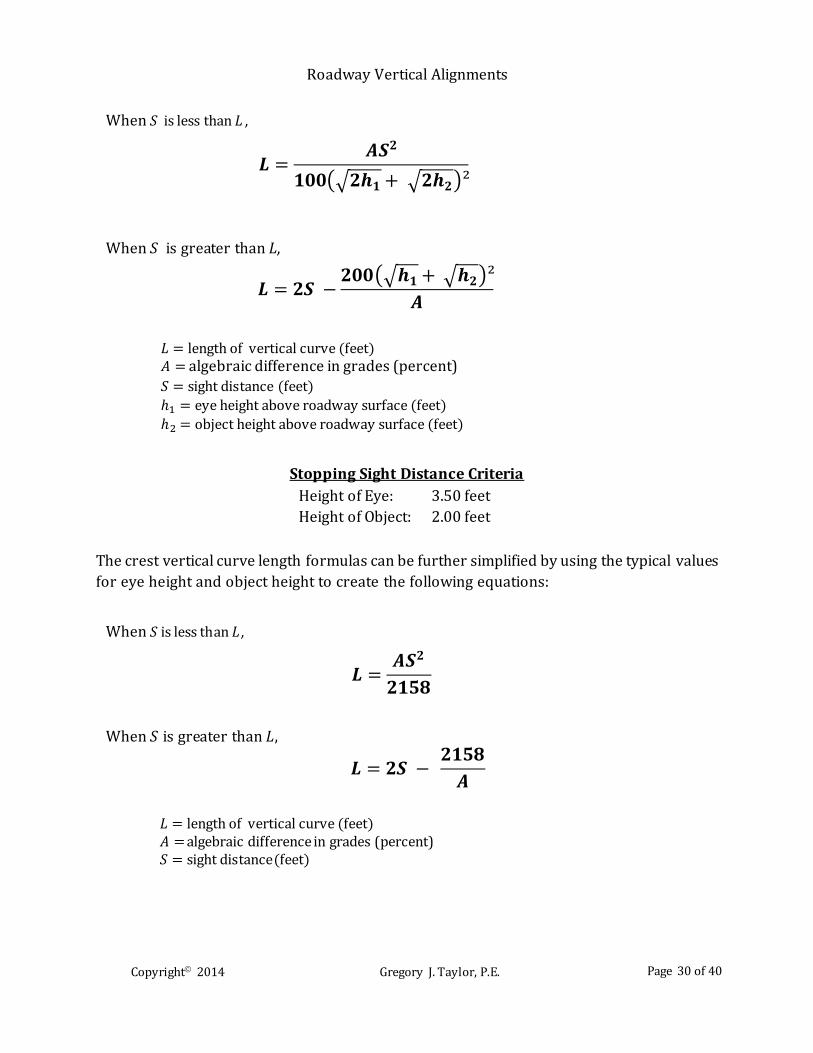
The crest vertical curve length formulas can be further simplified by using the typical values
for eye height and object height to create the following equations:
When 𝑆 is less than 𝐿 ,
𝑳 =𝑨𝑺𝟐
𝟏𝟎𝟎(√𝟐𝒉𝟏 + √𝟐𝒉𝟐)²
𝐿 = length of vertical curve (feet) 𝐴 = algebraic difference in grades (percent)
𝑆 = sight distance (feet)
ℎ1 = eye height above roadway surface (feet)
ℎ2 = object height above roadway surface (feet)
When 𝑆 is greater than 𝐿,
When 𝑆 is less than 𝐿,
𝑳 =𝑨𝑺𝟐
𝟐𝟏𝟓𝟖
When 𝑆 is greater than 𝐿,
𝑳 = 𝟐𝑺 − 𝟐𝟏𝟓𝟖
𝑨
𝐿 = length of vertical curve (feet) 𝐴 = algebraic difference in grades (percent) 𝑆 = sight distance(feet)
𝑳 = 𝟐𝑺 −𝟐𝟎𝟎(√𝒉𝟏 + √𝒉𝟐)²
𝑨
Roadway Vertical Alignments
Copyright 2014 Gregory J. Taylor, P.E. Page 31 of 40
Typical minimum vertical curve lengths range from 100 to 325 feet. Minimum lengths may
be approximated by using three times the design speed.
𝑳𝒎𝒊𝒏 = 𝟑𝑽
𝐿𝑚𝑖𝑛 = minimum length of vertical curve (feet)
𝑉 = design speed (miles per hour)
Roadway visibility at night is defined as the length of road directly illuminated by the vehicle
headlights. In some cases, minimum stopping sight distances may exceed the stretch of
visible roadway:
Low-beam headlights regardless of roadway profile
Area forward of light on roadway with shadows and indirect illumination
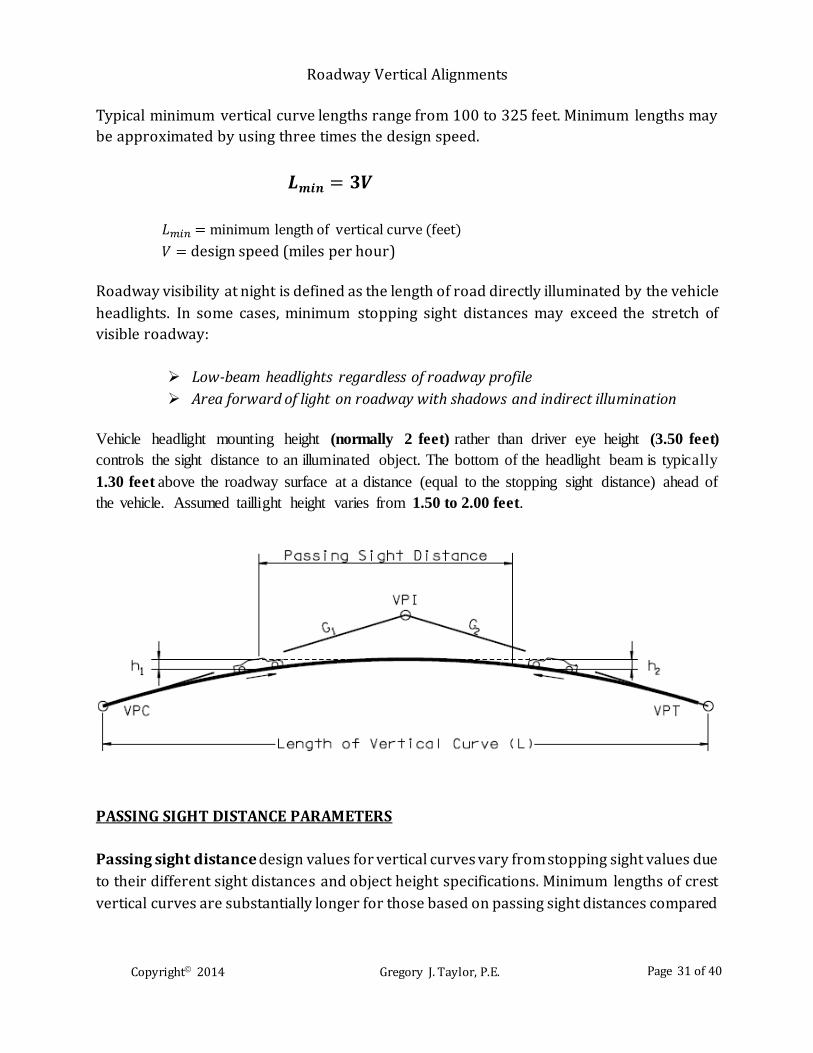
Vehicle headlight mounting height (normally 2 feet) rather than driver eye height (3.50 feet)
controls the sight distance to an illuminated object. The bottom of the headlight beam is typically
1.30 feet above the roadway surface at a distance (equal to the stopping sight distance) ahead of
the vehicle. Assumed taillight height varies from 1.50 to 2.00 feet.
PASSING SIGHT DISTANCE PARAMETERS
Passing sight distance design values for vertical curves vary from stopping sight values due
to their different sight distances and object height specifications. Minimum lengths of crest
vertical curves are substantially longer for those based on passing sight distances compared
Roadway Vertical Alignments
Copyright 2014 Gregory J. Taylor, P.E. Page 32 of 40
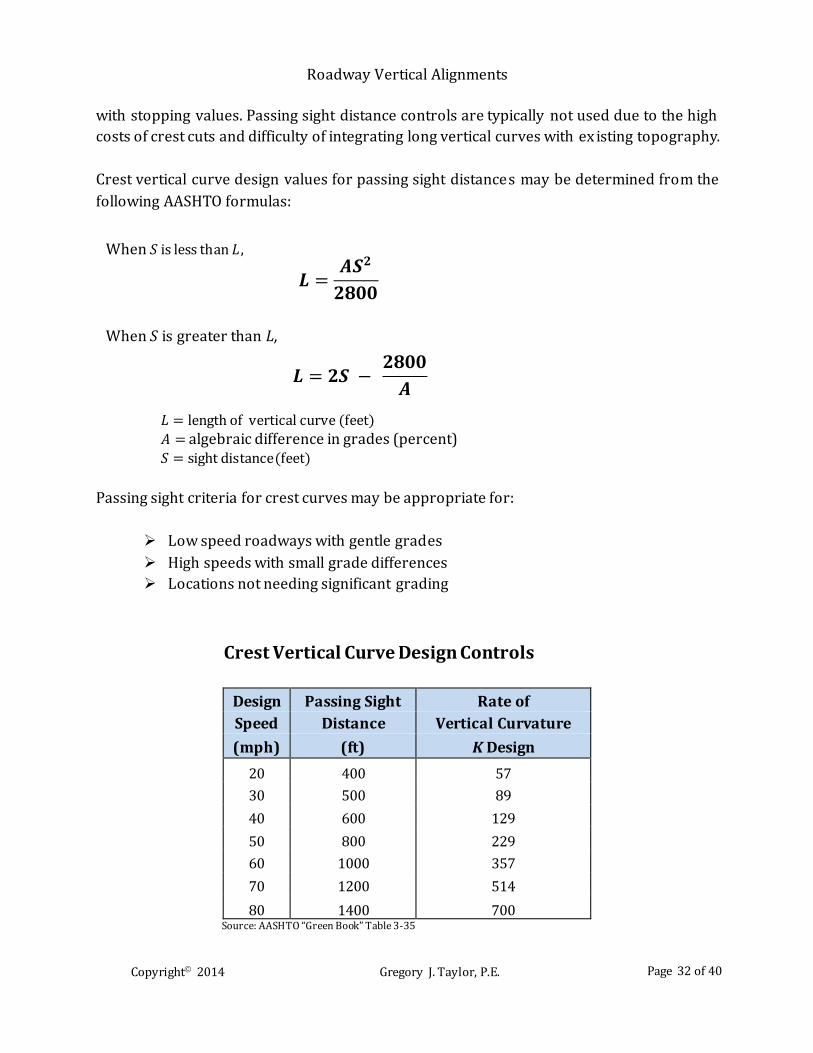
with stopping values. Passing sight distance controls are typically not used due to the high
costs of crest cuts and difficulty of integrating long vertical curves with ex isting topography.
Crest vertical curve design values for passing sight distances may be determined from the
following AASHTO formulas:
Passing sight criteria for crest curves may be appropriate for:
Low speed roadways with gentle grades
High speeds with small grade differences
Locations not needing significant grading
Crest Vertical Curve Design Controls
Design Passing Sight Rate of
Speed Distance Vertical Curvature
(mph) (ft) K Design
20 400 57
30 500 89
40 600 129
50 800 229
60 1000 357
70 1200 514
80 1400 700 Source: AASHTO “Green Book” Table 3-35
When 𝑆 is less than 𝐿,
𝑳 =𝑨𝑺𝟐
𝟐𝟖𝟎𝟎
When 𝑆 is greater than 𝐿,
𝑳 = 𝟐𝑺 − 𝟐𝟖𝟎𝟎
𝑨
𝐿 = length of vertical curve (feet)
𝐴 = algebraic difference in grades (percent)
𝑆 = sight distance(feet)
Roadway Vertical Alignments
Copyright 2014 Gregory J. Taylor, P.E. Page 33 of 40
SAG VERTICAL CURVES
Sag (concave) vertical curves appear as valleys by having a tangent slope at the curve end
which is higher than at the beginning, with vehicles first going downhill, reaching the bottom
of the curve, and then continuing uphill.
Sag Vertical Curve Length Criteria
Headlight sight distance
Passenger comfort
Drainage control
General appearance
Headlight sight distance is the main determinant for sag curve length. This is limited by the
headlight position and direction when traveling at night. Visibility must be adequate for a
driver to see an obstruction and stop within the headlight sight distance. Sag curve length
should be sufficient for the light beam to illuminate the roadway and provide adequate
stopping sight distance. This permits drivers to see the roadway ahead. Short sag curve
lengths can be used for roadway locations that are illuminated or limited by severe
geometric constraints. Limiting values are related to studies of driver comfort.
Headlight Sight Distance Assumptions
Headlight height: 2 feet
Upward divergence of light beam from longitudinal axis of
vehicle: 1 degree
𝑳 =
𝑨𝑽𝟐
𝟒𝟔. 𝟓
Roadway Vertical Alignments
Copyright 2014 Gregory J. Taylor, P.E. Page 34 of 40
The effect on user comfort due to change in vertical direction is greater for sag curves due to
gravitational and centripetal forces. These changes cannot be easily measured because of
various factors including:
Vehicle body suspension
Body weight
Tire flexibility
Historical data concludes that riding on sag curves is comfortable when the maximum
centripetal acceleration value is under 1 ft/s².
Vertical curve lengths needed to satisfy passenger comfort are typically 50% of the headlight
sight distance (under normal conditions). A good rule-of-thumb approximation for minimum
sag vertical curve length is 100A, or K = 100 feet per 1 percent change in grade.
General Controls for Vertical Alignments
Ensure smooth, gradual gradeline consistent with roadway type and terrain desired.
Specific design criteria are the maximum grade and critical length of grade. The
application and fit-in relation to the terrain determine suitability and appearance.
Avoid hidden dips or changes in the roadway profile.
These typically occur on straight horizontal alignments with rolling natural ground
lines. Dips can create difficulties for passing drivers due to obstructed sight
distances.
Evaluate any proposed profile containing substantial momentum grades with traffic
operations.
This can prevent excessive truck speeds and conflicts with other traffic.
Avoid “broken back” (consecutive vertical curves in the same direction) gradelines.
This practice produces a discordant appearance (especially for sag curves) that is
noticeable on divided highways with medians.
𝐿 = length of sag vertical curve (feet) 𝐴 = algebraic difference in grades (percent)
𝑉 = design speed (mph)
Roadway Vertical Alignments
Copyright 2014 Gregory J. Taylor, P.E. Page 35 of 40
Place steep grades at the bottom and flatter grades near the top of ascents.
This is generally used on roadways with low design speeds to break up a uniform
sustained grade.
Reduce grades through at-grade intersections with moderate to steep grades.
These profile changes help turning vehicles and reduce potential crashes.
Avoid sag curves in cut sections, where possible, unless sufficiently drained.
Minimum lengths for sag curves are based on design speed. Longer curves should be used
wherever possible. Special attention should be paid to drainage needs where K values are in
excess of 167 feet per 1 percent change in grade.
Sag vertical curves with shorter than normal lengths may be used for locations where
existing features control the vertical alignment.
Roadway Vertical Alignments
Copyright 2014 Gregory J. Taylor, P.E. Page 36 of 40
COORDINATION OF HORIZONTAL
AND VERTICAL ALIGNMENTS
Geometric roadway design influences safety performance. Historical crash data has shown
that roadway factors are the second most contributing factor to roadway accidents. Crashes
are more likely to occur at locations with sudden changes in road character (i.e. sharp curves
at the end of long tangent sections).
Design consistency compares adjacent road segments and identifies locations with changes
that might violate driver expectations. This type of analysis can be used to show operating
speed decreases at curves.
Horizontal and vertical geometrics are the most critical roadway design elements. These
alignments should be designed concurrently to enhance:
vehicle operation,
uniform speed,
and aesthetics without additional costs.
Examples include: checking for additional sight distance prior to major vertical alignment
changes; or revising design elements to eliminate potential drainage problems.
Horizontal and vertical alignment geometric designs complement each other while poor
designs can reduce the quality of both. It can be extremely difficult and costly to fix any
vertical and/or horizontal deficiencies once a roadway is built. Any initial savings can be
offset by economic losses due to crashes and delays.
Physical factors that help define roadway alignments include:
Roadway traffic
Topography
Subsurface conditions
Cultural development
Roadway limits
Roadway Vertical Alignments
Copyright 2014 Gregory J. Taylor, P.E. Page 37 of 40
Although design speed helps to determine the roadway’s location, it assumes a greater role
as the design of the horizontal and vertical alignments progress. Design speed aids in
balancing all of the design elements by limiting many design values (curves, sight distance)
and influencing others (width, clearance, maximum gradient).
General Procedure
Coordinating horizontal and vertical alignments should begin with any roadway preliminary
design. Any adjustments or corrections can be readily made at this phase.
Working drawings can be used for studying long, continuous plan and profile views to
visualize the proposed three-dimensional roadway. Computer-aided drafting and design
(CADD) systems are typically used to create optimal 3-D designs.
After development of a preliminary design, adjustments can be made for better coordination
between the alignments. Using the design speed, the following factors should be checked:
Controlling curvature
Gradients
Sight distance
Superelevation runoff lengths
Also, the design controls for vertical and horizontal alignments should be considered, as well
as all aspects of the terrain, traffic and appearance. All adjustments should be made before
the costly and time-consuming preparation of construction plans.
For local roads, the alignment is impacted by existing or future development, with
intersections and driveways being the dominant controls. Designs should contain long,
flowing alignments instead of a connected series of block-by-block sections.
AASHTO Design Guidelines for Horizontal and Vertical Alignments
Vertical and horizontal elements should be balanced to optimize safety, capacity,
operation and aesthetics within the location’s topography.
Both horizontal and vertical alignment elements should be integrated to provide a
pleasing facility for roadway traffic.
Roadway Vertical Alignments
Copyright 2014 Gregory J. Taylor, P.E. Page 38 of 40
Sharp horizontal curves near the top of a crest vertical curve or near the low point
of a sag vertical curve should be avoided. Using higher design values (well above
the minimum) for design speed can produce suitable designs and meet the driver’s
expectations.
Horizontal and vertical curves need to be as flat as possible for intersections with
sight distance concerns.
For divided roadways, it may be suitable to vary median widths for divided
roadways. Independent horizontal or vertical alignments should be used for
individual one-way roads.
Horizontal and vertical alignments should be designed to minimize impact in
residential areas. Typical applications include:
Depressed facilities (decreases facility visibility and noise)
Horizontal adjustments (increases buffer zones between traffic and
neighborhoods).
Geometric design elements should be used to enhance environmental features
(parks, rivers, terrain, etc.). Roadways should enhance outstanding views or
features instead of avoiding them, where possible.
Exception: Long tangent sections for sufficient passing sight distance may be appropriate
for two-lane roads requiring passing sections at frequent intervals.
Roadway Vertical Alignments
Copyright 2014 Gregory J. Taylor, P.E. Page 39 of 40
SUMMARY
Along with the roadway cross section (lanes, shoulders, curbs, medians, roadside slopes,
ditches and sidewalks) and horizontal alignment (tangents and curves), the vertical
alignment (grades and vertical curves) helps provide a three-dimensional roadway model.
Its ultimate goal is to provide a safe, smooth-flowing facility that is crash-free. Roadway
vertical alignments are directly related to their operational quality and safety.
In today’s environment, designers must do more than apply design standards and criteria to
‘solve’ a problem. They must understand how various roadway elements contribute to safety
and facility operation, including the vertical profile.
This course summarized the geometric design of vertical alignments for modern roads and
highways. This course is intended to serve as a guidance and not as an absolute standard or
rule. For further information, please refer to AASHTO’s A Policy on Geometric Design of
Highways and Streets (Green Book) . It is considered to be the primary guidance for U.S.
roadway design. Section 3.4 – Vertical Alignment was used exclusively in this course to
present fundamental roadway profile geometric design principles.
The fundamental objective of good geometric design will remain as it has always been: to
produce a roadway that is safe and efficient, as well as reasonably economic and
sensitive to conflicting concerns.
Roadway Vertical Alignments
Copyright 2014 Gregory J. Taylor, P.E. Page 40 of 40
REFERENCES
A Policy on Geometric Design of Highways and Streets, 6th Edition
AASHTO. Washington, D.C. 2011.
This text is the source for all equations and tables contained within this course, unless noted otherwise.
Handbook of Simplified Practice for Traffic Studies
Center for Transportation Research & Education – Iowa State University.
Ames, Iowa. 2002.
Manual on Uniform Traffic Control Devices (MUTCD)
Federal Highway Administration. Washington, D.C. 2009.
Traffic Engineering Handbook, 5th Edition
Institute of Transportation Engineers. Washington, D.C. 1999.
Traffic Engineering Handbook, 6th Edition
Institute of Transportation Engineers. Washington, D.C. 2008.