Embed Size (px)
Citation preview
Michel Ruel, PresidentMichel Ruel, President
Roadmap to OptimizeRoadmap to OptimizeRoadmap to Optimize Roadmap to Optimize Process Control PerformanceProcess Control Performance
1PresentedTo Matrikon Summit 2007
AgendaAgenda
1 I t d ti• 1-Introduction• 2-Evolution• 3-Data→Knowledge →Diagnostics• 4-Performance4 Performance• 5-Optimizing Process Control Performance
6 E pected Res lts• 6-Expected Results• 7-Conclusions
2PresentedTo Matrikon Summit 2007
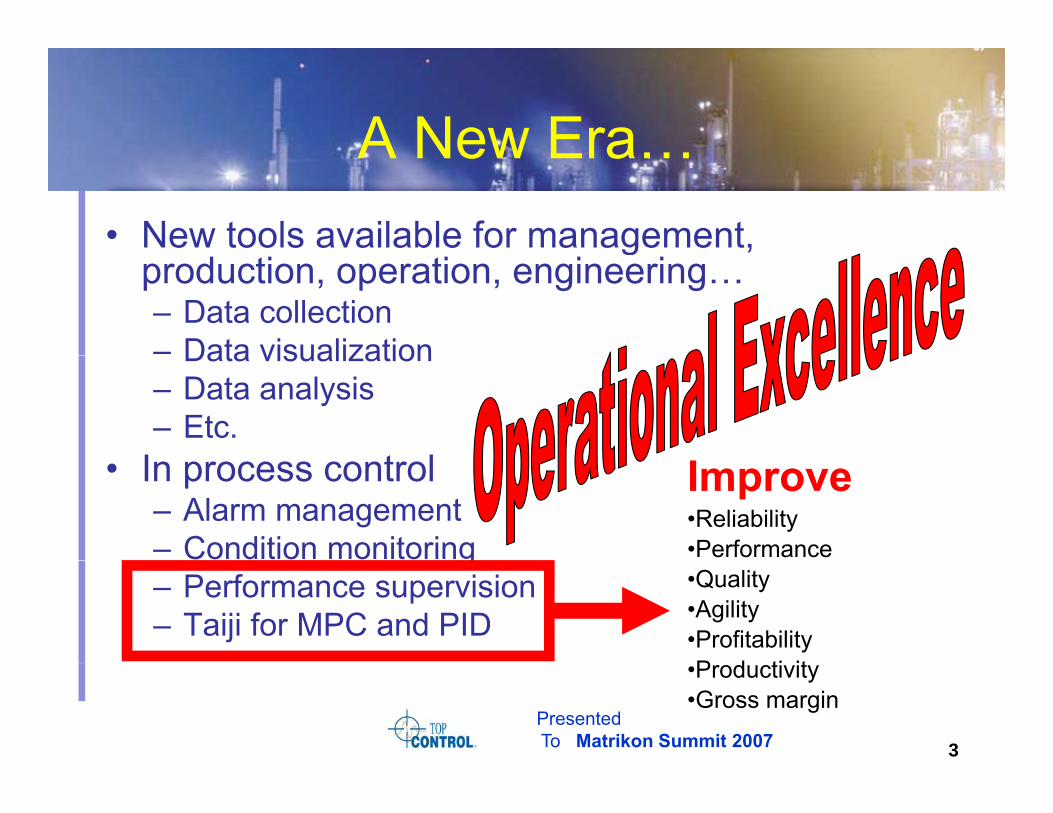
A New EraA New Era…• New tools available for management, g
production, operation, engineering…– Data collection– Data visualizationData visualization– Data analysis– Etc.
I t l• In process control– Alarm management– Condition monitoring
Improve•Reliability•Performanceg
– Performance supervision– Taiji for MPC and PID
•Quality•Agility•ProfitabilityP d ti it
3PresentedTo Matrikon Summit 2007
•Productivity •Gross margin
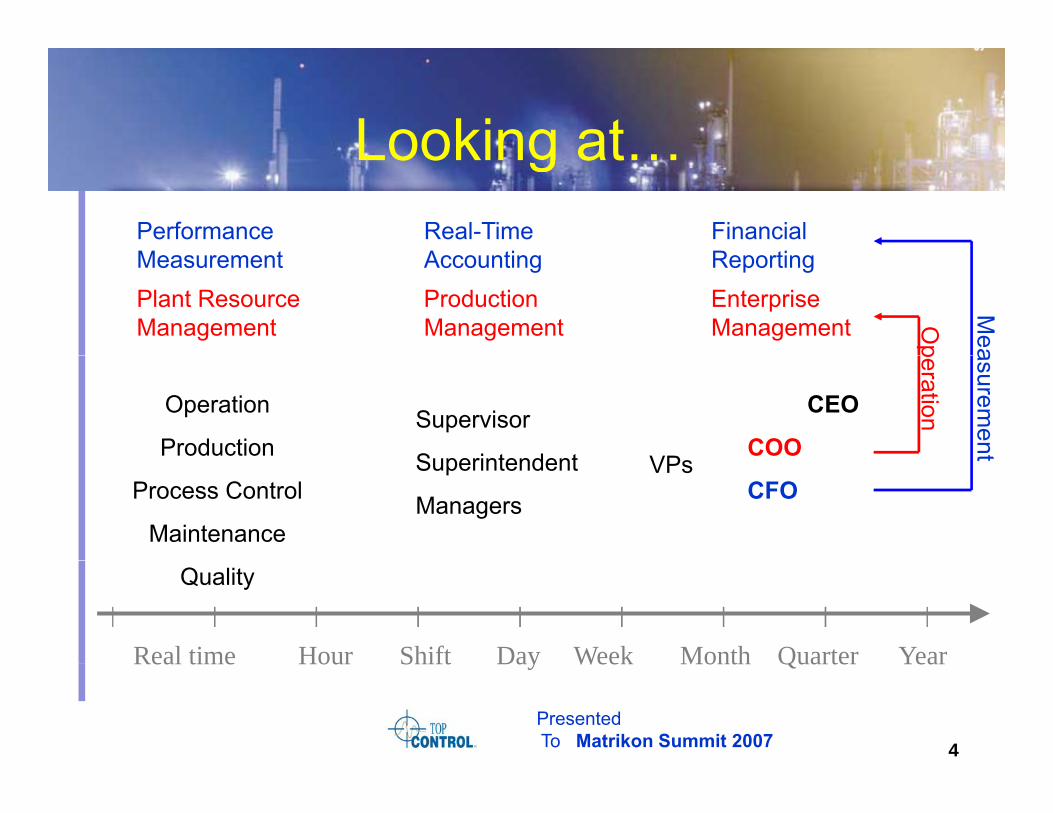
Looking atLooking at…Performance Real-Time Financial M t A ti R tiPlant Resource Production Enterprise Management Management Management O
p
Measurement Accounting Reporting
Mea
Operation
ProductionSupervisor
S perintendent VP
CEO
COO
peration
asurement
Process Control
Maintenance
Superintendent
Managers
VPsCFO
t
Real time Hour Shift Day Week Month Quarter Year
Quality
4PresentedTo Matrikon Summit 2007
Real time Hour Shift Day Week Month Quarter Year
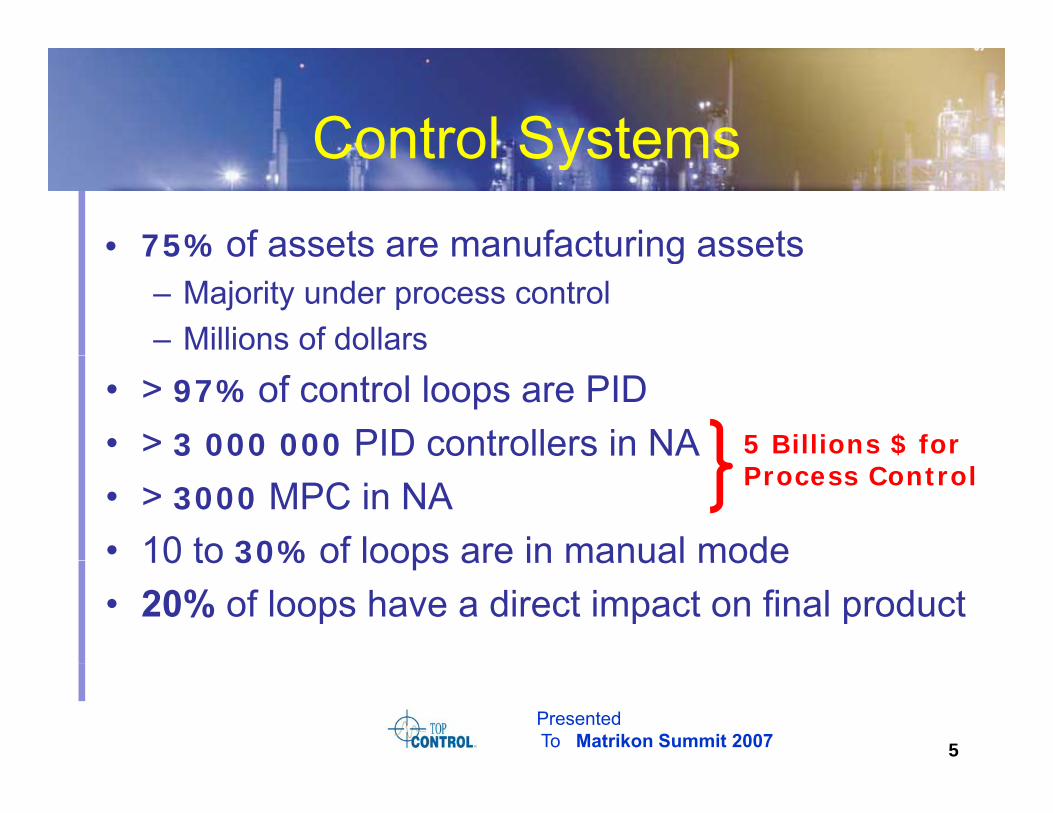
Control SystemsControl Systems
• 75% of assets are manufacturing assets75% of assets are manufacturing assets– Majority under process control– Millions of dollars
• > 97% of control loops are PID• > 3 000 000 PID controllers in NA 5 Billions $ for
• > 3000 MPC in NA • 10 to 30% of loops are in manual mode
Process Control
10 to 30% of loops are in manual mode• 20% of loops have a direct impact on final product
5PresentedTo Matrikon Summit 2007
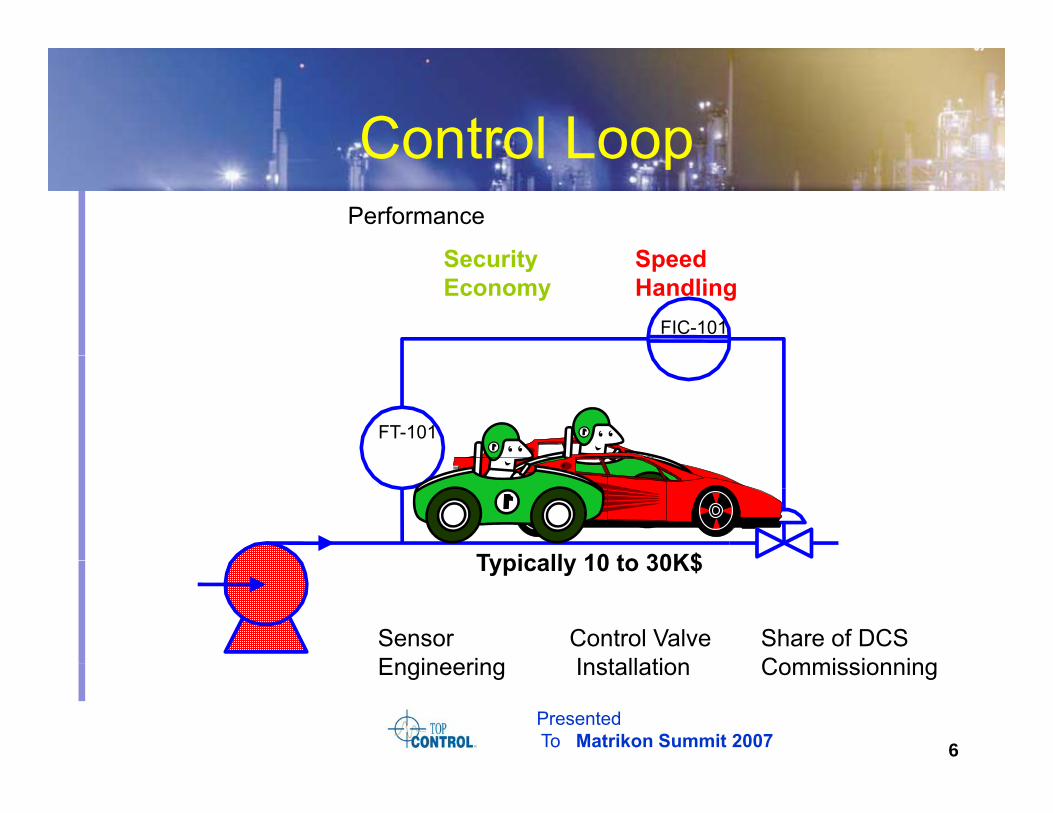
Control LoopPerformance
S it S d
Control Loop
FIC-101
Security SpeedEconomy Handling
FT-101
Typically 10 to 30K$Typically 10 to 30K$
Sensor Control Valve Share of DCSEngineering Installation Commissionning
6PresentedTo Matrikon Summit 2007
Engineering Installation Commissionning
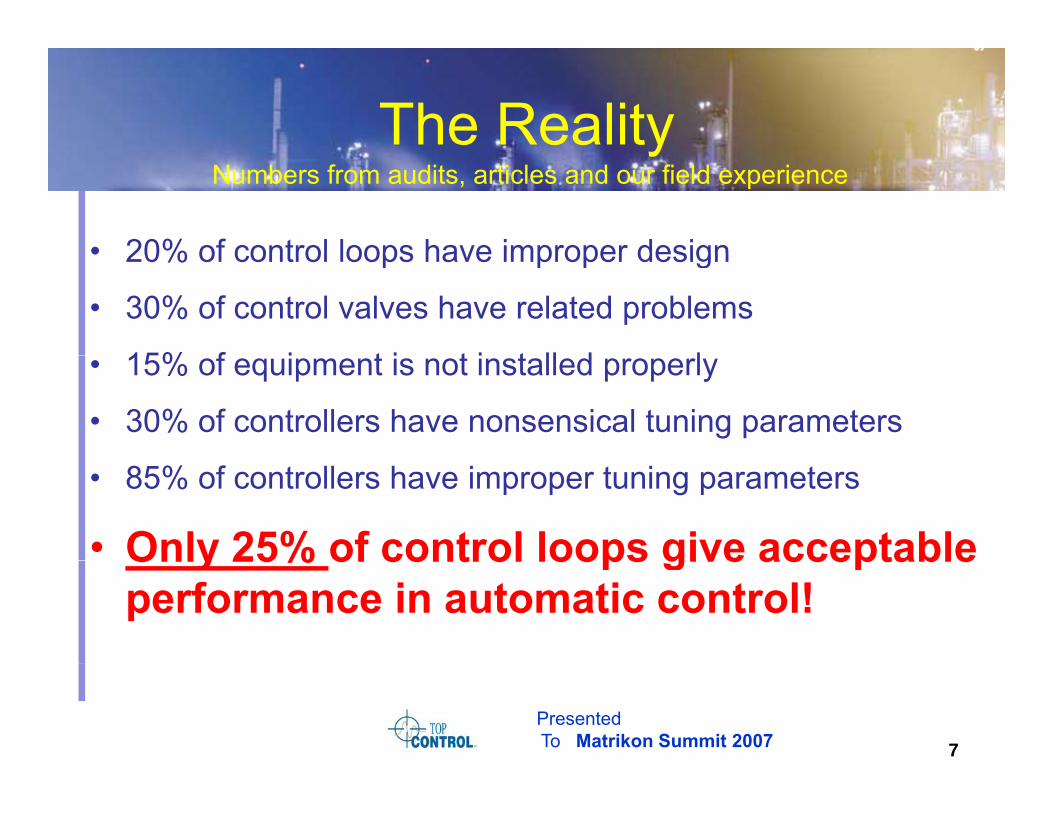
The Reality yNumbers from audits, articles and our field experience
• 20% of control loops have improper design• 20% of control loops have improper design
• 30% of control valves have related problems
15% f i t i t i t ll d l• 15% of equipment is not installed properly
• 30% of controllers have nonsensical tuning parameters
• 85% of controllers have improper tuning parameters
• Only 25% of control loops give acceptableOnly 25% of control loops give acceptable performance in automatic control!
7PresentedTo Matrikon Summit 2007

Typical NumbersTypical Numbers
• Small plant • Large plantSmall plant• 200 loops
P
Large plant• 2000 loops
P• Process control ~3MM$
• Process control ~30MM$
• Assets: ??MM$ • Assets: ???MM$
• Assets/Engineer ~ 100 to 1000• Assets/Operator ~ 100 to 1000
8PresentedTo Matrikon Summit 2007
AgendaAgenda
1 Introduction• 1-Introduction
• 2-Evolution• 3-Data→Knowledge →Diagnostics• 4 Performance• 4-Performance• 5-Optimizing Process Control Performance• 6-Expected Results• 7-Conclusions
9PresentedTo Matrikon Summit 2007
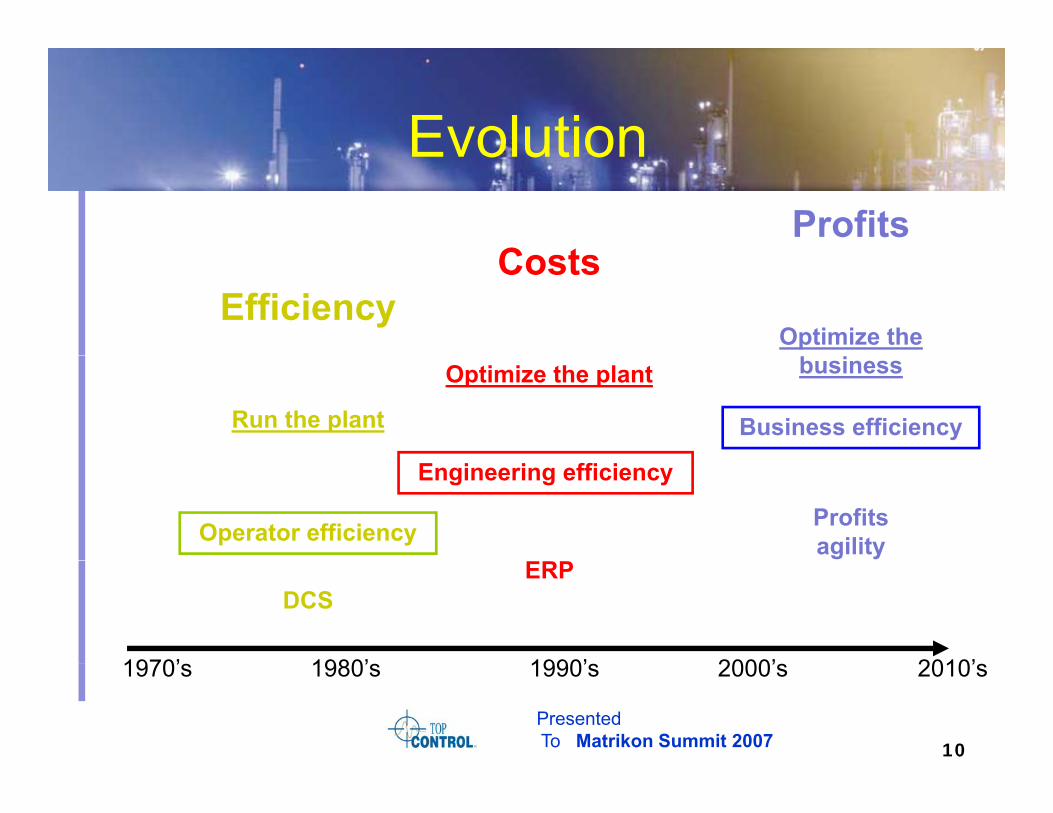
EvolutionEvolution
C tProfits
Optimize the Efficiency
Costs
Run the plant
Optimize the plant business
Business efficiency
Operator efficiency
Engineering efficiency
Profitsagility
1970’ 1980’ 1990’ 2000’ 2010’
DCSERP
10PresentedTo Matrikon Summit 2007
1970’s 1980’s 1990’s 2000’s 2010’s
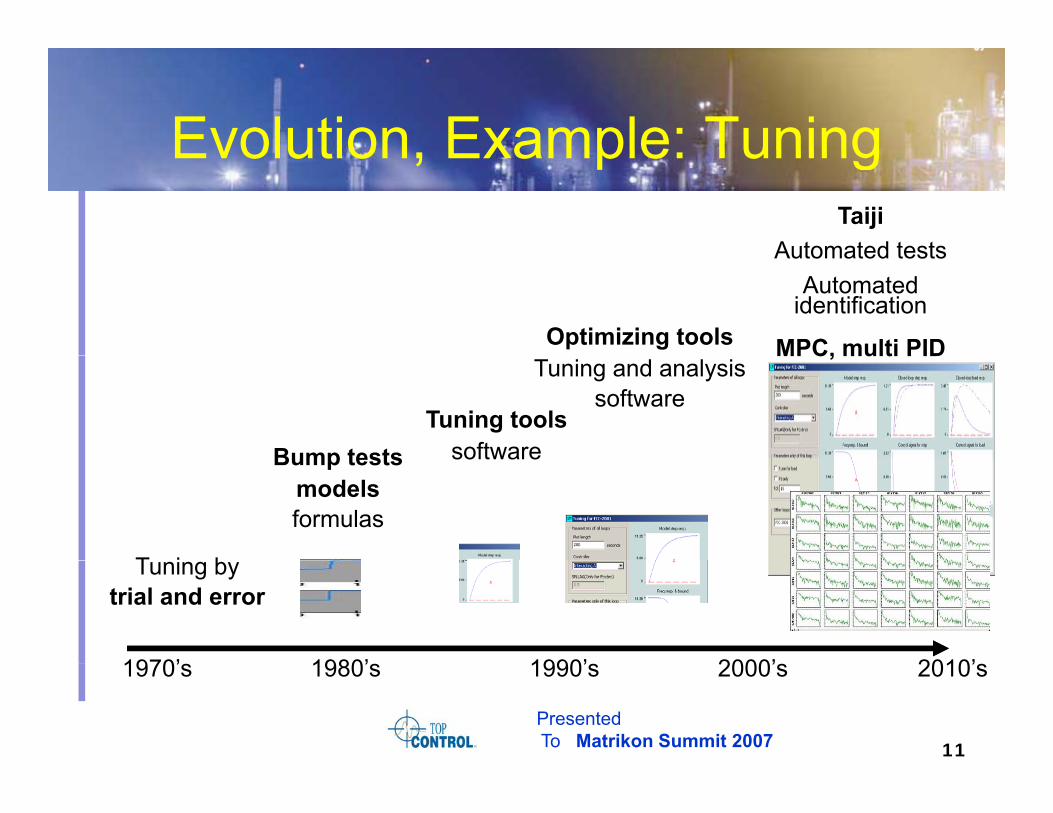
Evolution Example: TuningEvolution, Example: TuningTaiji
Automated tests
Optimizing tools
Automated testsAutomated
identification
MPC, multi PIDTuning and analysis
softwareTuning tools
softwareBump tests
MPC, multi PID
T i b
softwareBump testsmodelsformulas
Tuning by trial and error
1970’ 1980’ 1990’ 2000’ 2010’
11PresentedTo Matrikon Summit 2007
1970’s 1980’s 1990’s 2000’s 2010’s
AgendaAgenda
• 1 Introduction• 1-Introduction• 2-Evolution
3 D t K l d Di ti• 3-Data→Knowledge →Diagnostics• 4-Performance• 5-Optimizing Process Control Performance• 6-Expected Resultsp• 7-Conclusions
12PresentedTo Matrikon Summit 2007

Tools for Operational ExcellenceTools for Operational ExcellenceValue added solutions:
• Alarm management• Alarm management• Control performance monitoring• Equipment condition monitoring• Process performance monitoring
• Data connectivity• Data management• Data and process visualization• Engineering analysisg ee g a a ys s
13PresentedTo Matrikon Summit 2007
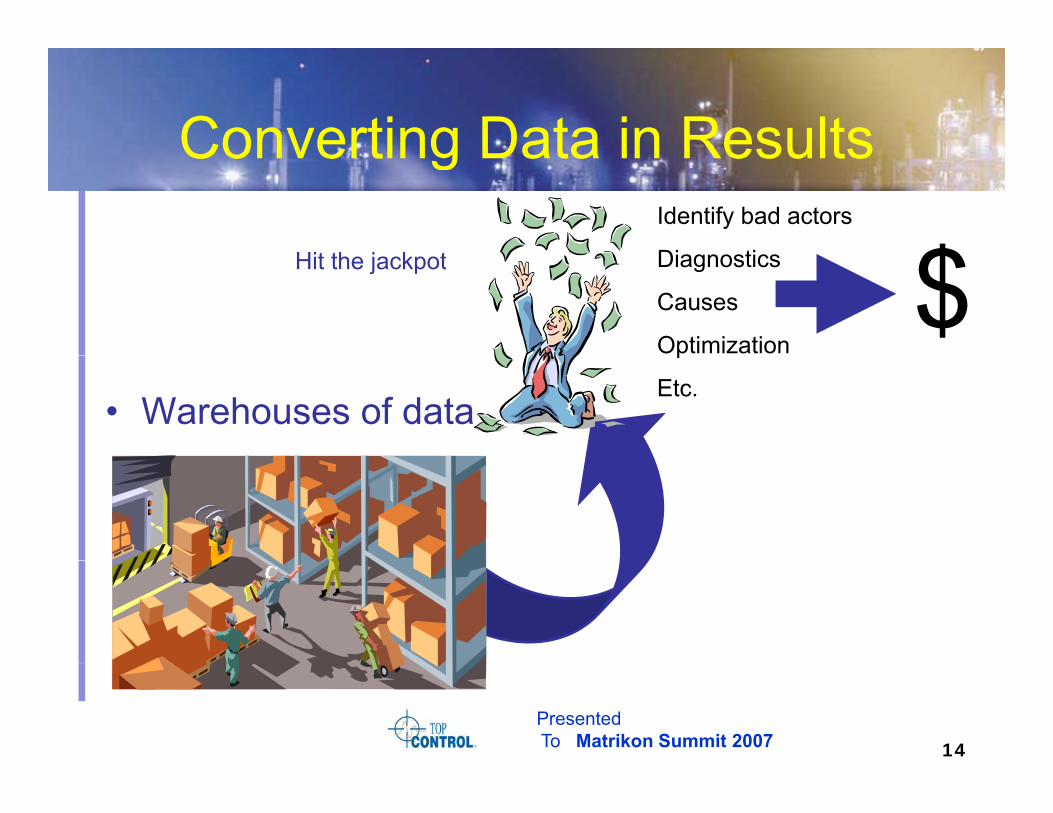
Converting Data in ResultsConverting Data in ResultsIdentify bad actors
Di ti $Hit th j k t Diagnostics
Causes
Optimization$Hit the jackpot
• Warehouses of data
p
Etc.
14PresentedTo Matrikon Summit 2007

A New EraA New Era…• New tools available for management, g
production, operation, engineering…– Data collection– Data visualisationData visualisation– Data analysis– Etc.
I t l• In process control– Alarm management– Condition monitoring
Improve•Reliability•Performanceg
– Performance supervision– Taiji for MPC and PID
•Quality•Agility•ProfitabilityP d ti it
15PresentedTo Matrikon Summit 2007
•Productivity •Gross margin
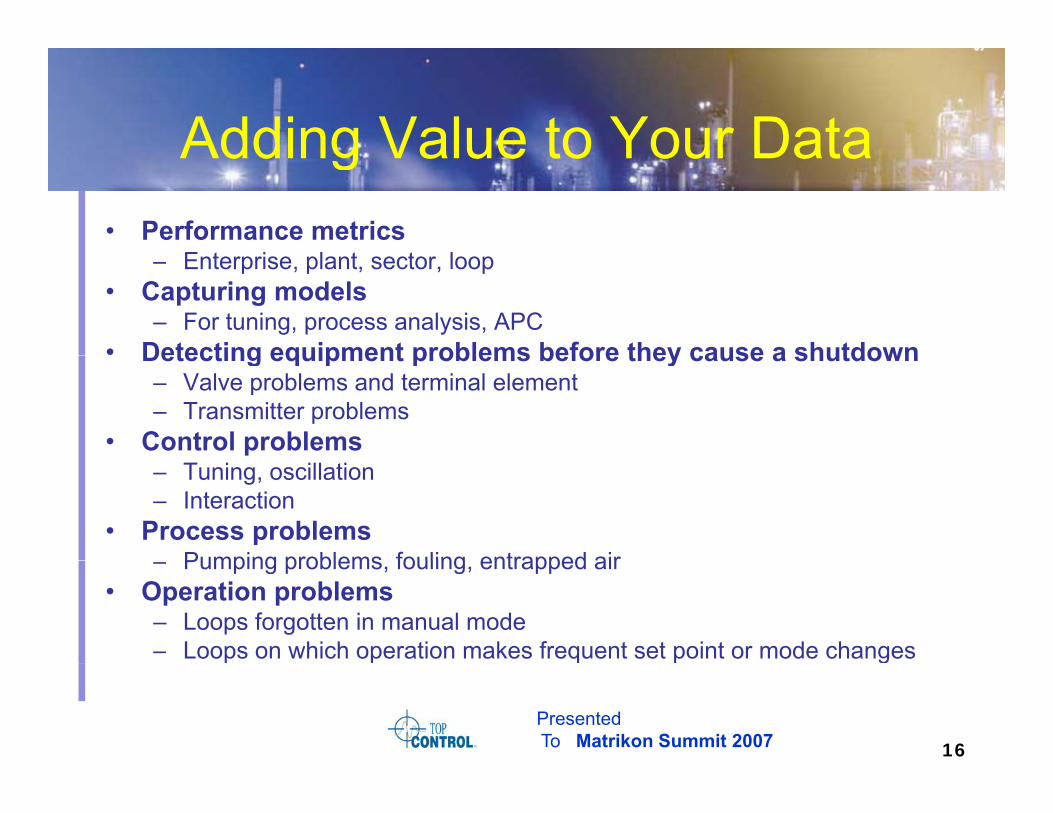
Adding Value to Your DataAdding Value to Your Data• Performance metrics
E t i l t t l– Enterprise, plant, sector, loop• Capturing models
– For tuning, process analysis, APC• Detecting equipment problems before they cause a shutdownDetecting equipment problems before they cause a shutdown
– Valve problems and terminal element– Transmitter problems
• Control problems– Tuning, oscillation– Interaction
• Process problemsPumping problems fouling entrapped air– Pumping problems, fouling, entrapped air
• Operation problems– Loops forgotten in manual mode– Loops on which operation makes frequent set point or mode changes
16PresentedTo Matrikon Summit 2007
p p q p g
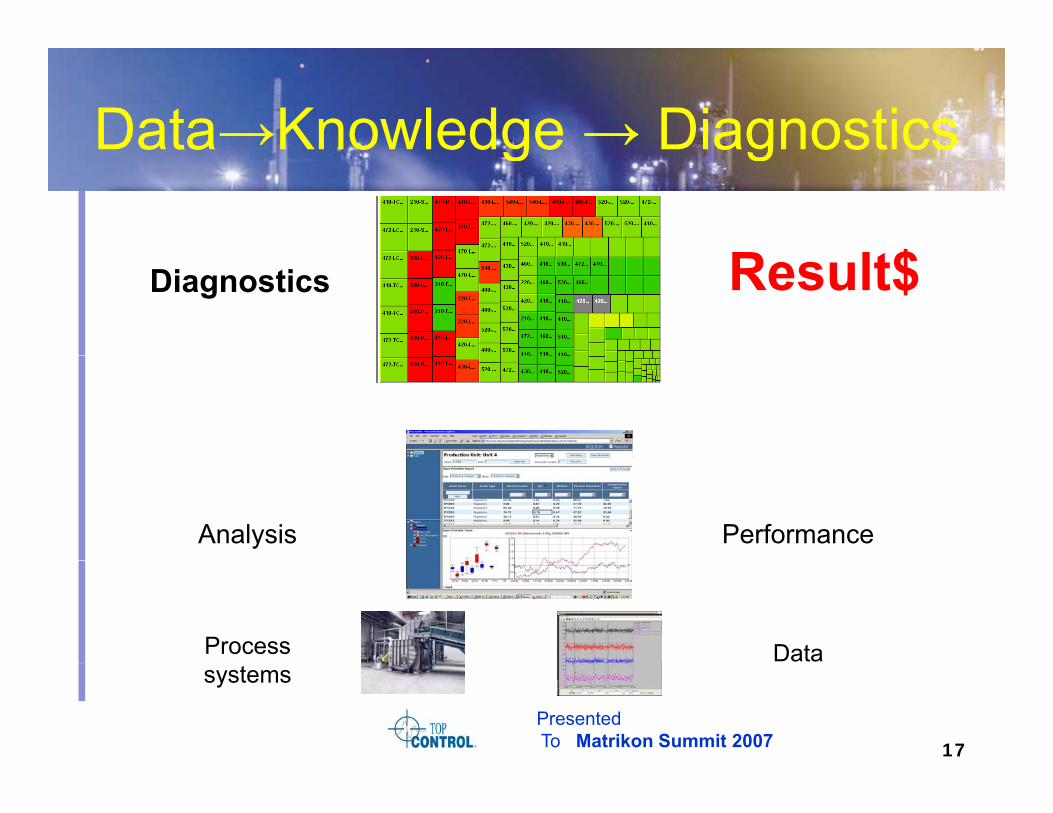
Data→Knowledge → Diagnosticsg g
R lt$Diagnostics Result$
Analysis Performance
Process Data
17PresentedTo Matrikon Summit 2007
systems
AgendaAgenda
1 Introduction• 1-Introduction• 2-Evolution• 3-Data→Knowledge →Diagnostics
• 4-Performance4-Performance• 5-Optimizing Process Control Performance• 6-Expected Results• 7-Conclusions
18PresentedTo Matrikon Summit 2007
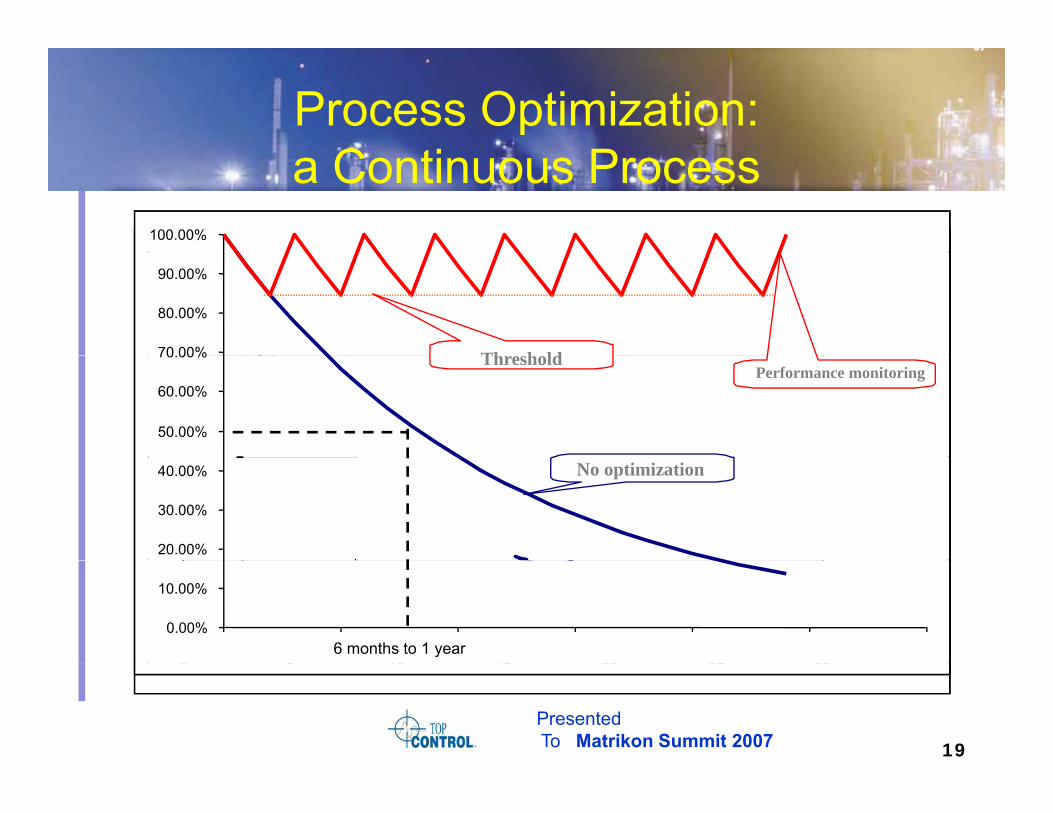
Process Optimization: C ti P
O ti dPerformance decay
a Continuous Process1
100.00%
• Operation procedures• Raw material quality
E i i
Performance decay
90%
100%
0.8
0.9
1
70 00%
80.00%
90.00%
Th h ld• Equipment wearing out• Maintenance
50%
60%
70%
80%
%
Half life is generally 6 months0.5
0.6
0.7
Series150.00%
60.00%
70.00% ThresholdPerformance monitoring
• Configuration changes• Process changes
20%
30%
40%
50%%
0.3
0.4
20.00%
30.00%
40.00% No optimization
• Etc.0%
10%
0 20 40 60 80 100 120
Time6 months0
0.1
0.2
0 5 10 15 20 25 30
0.00%
10.00%
0 5 10 15 20 25 306 months to 1 year
19PresentedTo Matrikon Summit 2007
Time0 5 10 15 20 25 30
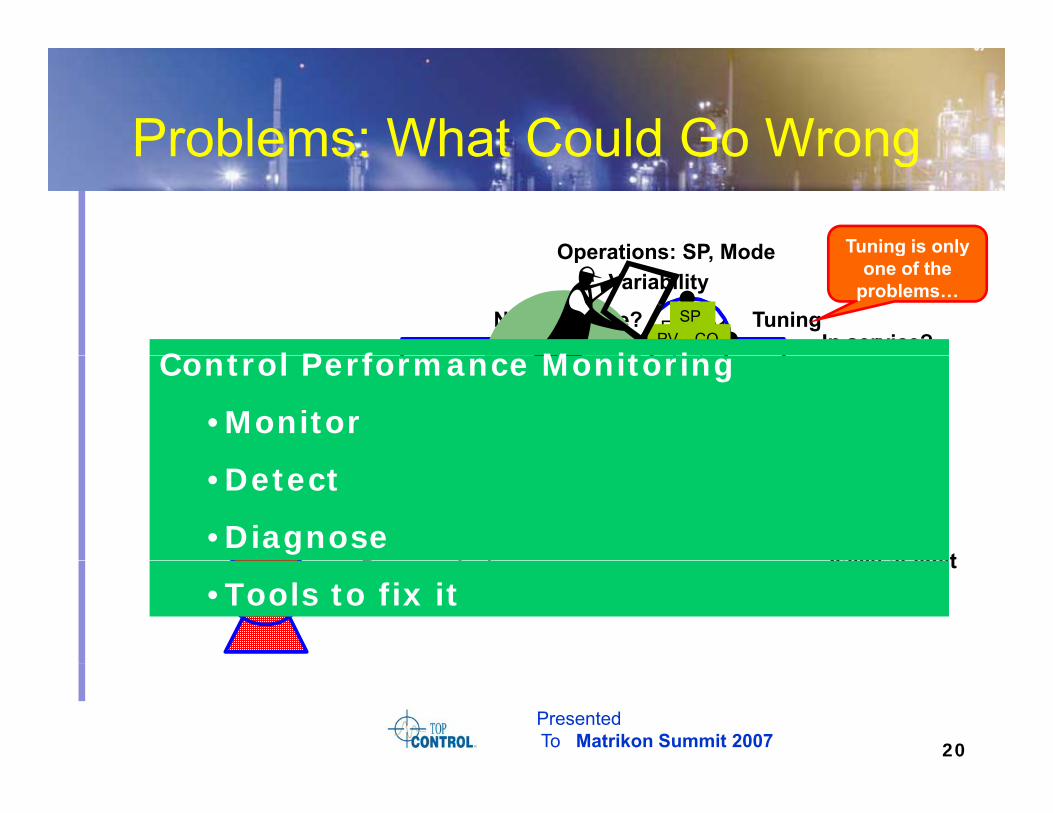
Problems: What Could Go WrongProblems: What Could Go Wrong
Operations: SP Mode Tuning is only
FIC-101
Variability
TuningNormal mode?
Operations: SP, Mode
In service?FIC-101PV CO
SP
M d
g yone of the
problems…
C t l P f M it i
FT-101
Noise
Control design
OscillationsIn control?ModeControl Performance Monitoring
•Monitor
Non-linearities
P d i
Disturbance Hysteresis
Valve at limit
Interactions with other loops
Process modelFouling
•Detect
•DiagnoseProcess design Stiction
Valve at limit
•Tools to fix it
20PresentedTo Matrikon Summit 2007
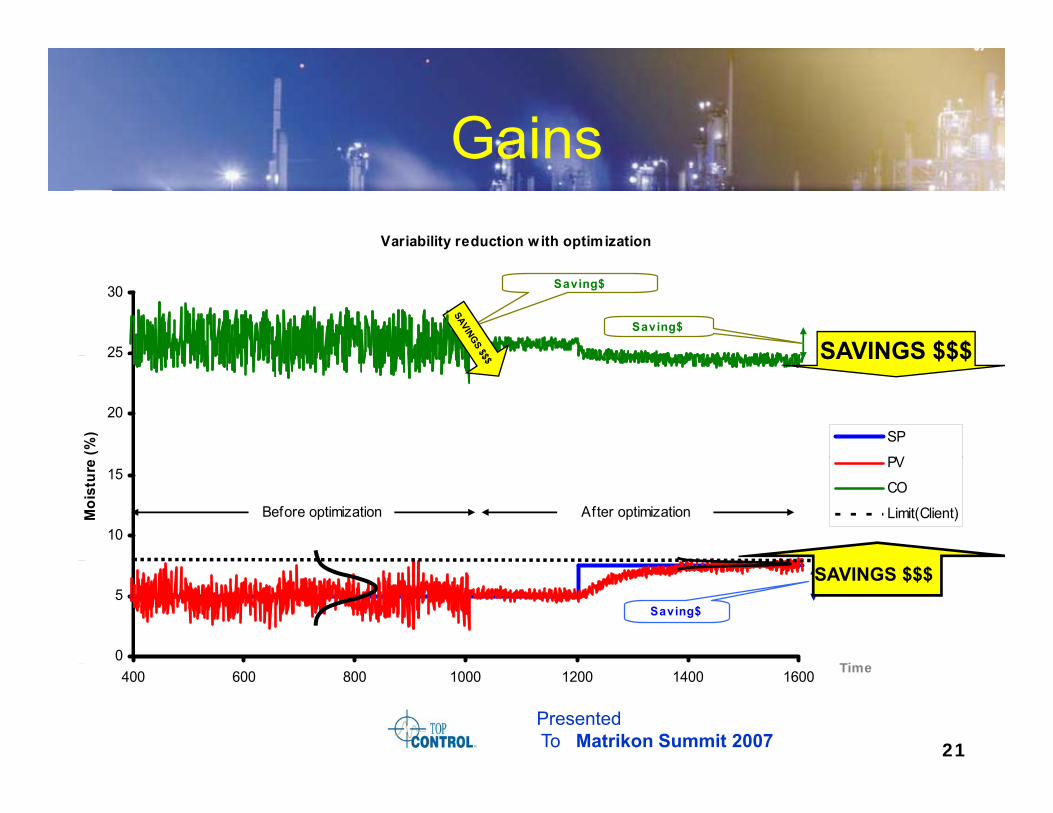
GainsGainsVariability reduction w ith optimization
25
30
Saving$
Saving$
SAVINGS $$$
20
25
(%) SP
PV
SAVINGS $$$
10
15
Moi
stur
e PV
CO
Limit(Client)Before optimization After optimization
0
5Saving$
Ti
SAVINGS $$$
21PresentedTo Matrikon Summit 2007
400 600 800 1000 1200 1400 1600 Time
AgendaAgenda
1 I t d ti• 1-Introduction• 2-Evolution• 3-Data→Knowledge →Diagnostics• 4 Performance• 4-Performance• 5-Optimizing Process Control Performance• 6-Expected Results• 7-Conclusions
22PresentedTo Matrikon Summit 2007
7 Conclusions
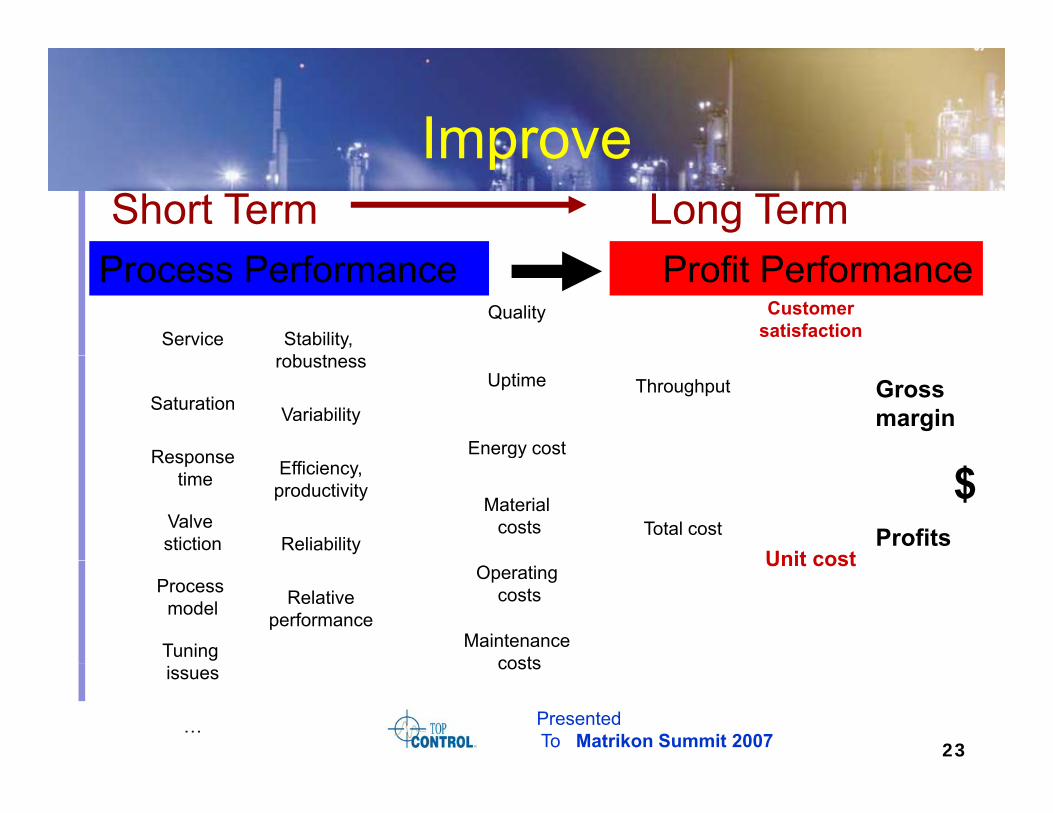
ImproveImproveShort Term Long Term
Oscillation
Service Stability, b t
Quality Customersatisfaction
Process Performance Profit Performance
Response
Saturation Variability
robustness
Energy cost
Uptime Throughput Gross margin
Responsetime
Valve stiction
Efficiency,productivity
Reliability
gy
Materialcosts
Unit costTotal cost
$Profits
Tuning
Process model Relative
performanceMaintenance
costs
Operatingcosts
Unit cost
23PresentedTo Matrikon Summit 2007
issues
…
costs
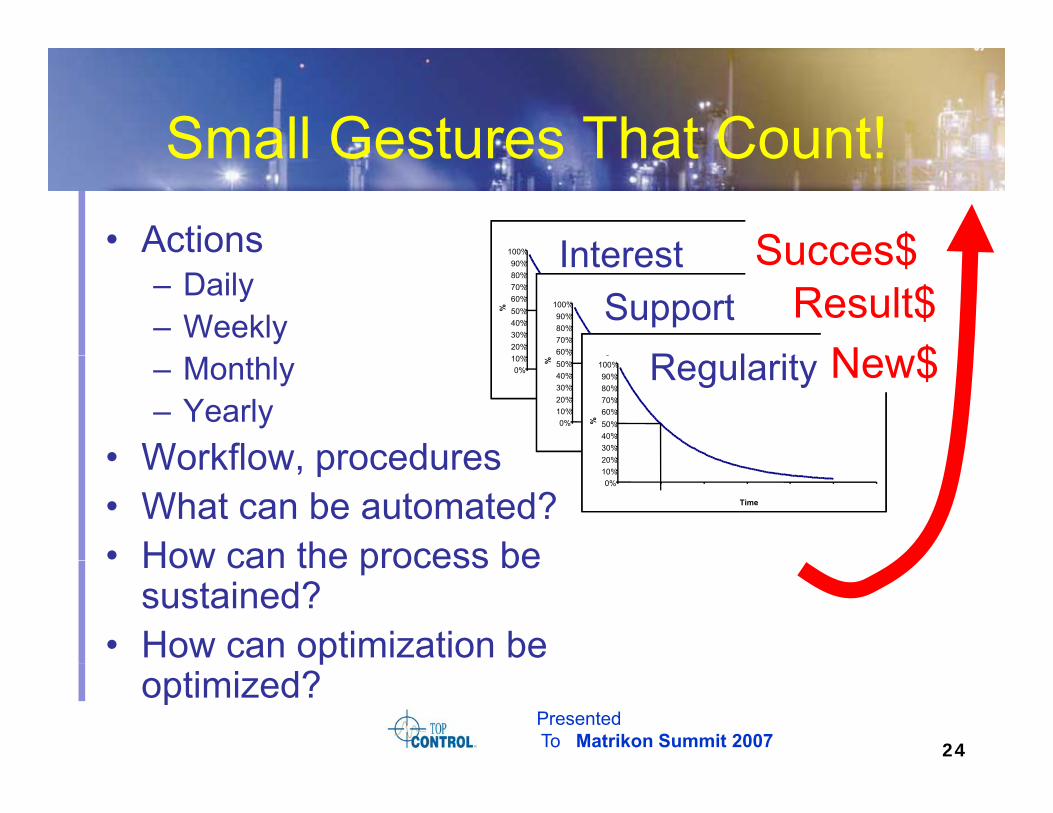
Small Gestures That Count!Small Gestures That Count!• Actions 100% Interest Succes$
– Daily– Weekly
20%30%40%50%60%70%80%90%
100%
%
Interest
60%70%80%90%
100% SupportR l it
Succes$Result$
Ne $– Monthly– Yearly
• Workflow procedures
0%10%
0 20 40 60 80 100 120Time
0%10%20%30%40%50%
0 20 40 60 80 100 120Time
%
20%30%40%50%60%70%80%90%
100%
%
Regularity New$
• Workflow, procedures• What can be automated?• How can the process be
0%10%20%
0 20 40 60 80 100 120Time
How can the process be sustained?
• How can optimization be
24PresentedTo Matrikon Summit 2007
poptimized?
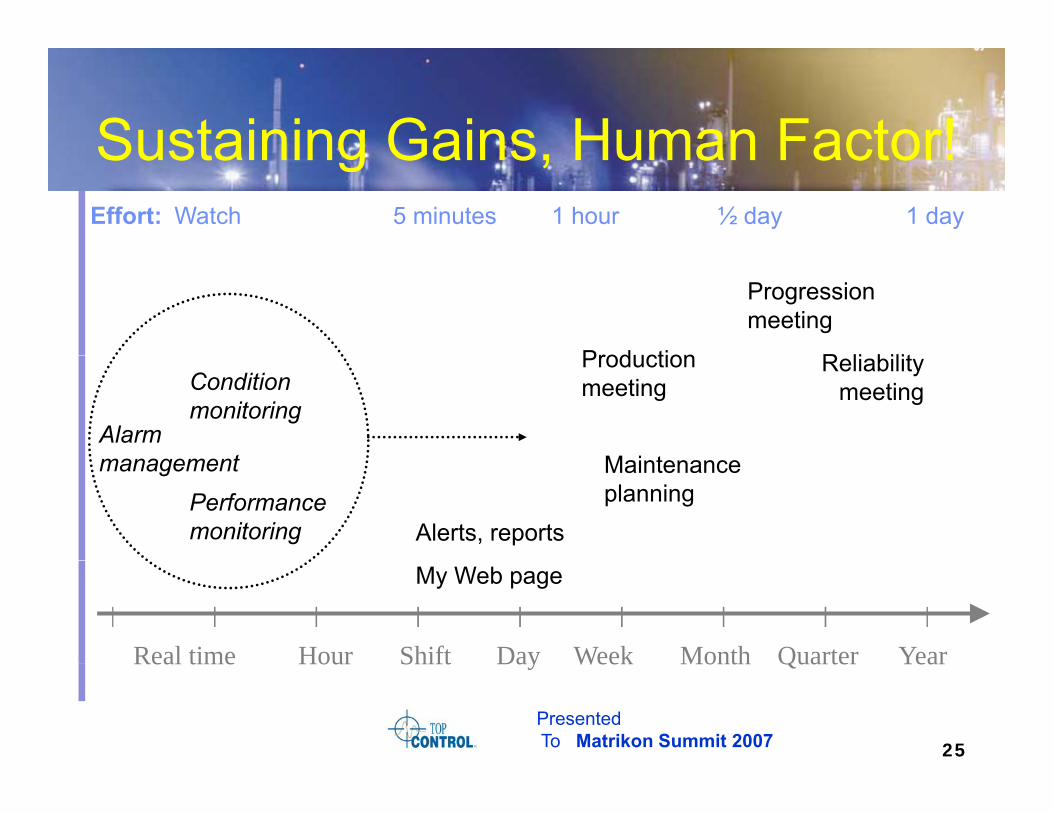
Sustaining Gains Human Factor!Sustaining Gains, Human Factor!Watch 5 minutes 1 hour ½ day 1 dayEffort:
Production
Progression meeting
R li bilit
Alarm t
Condition monitoring
Production meeting
M i t
Reliability meeting
Performance monitoring
management
Alerts, reports
Maintenance planning
Real time Hour Shift Day Week Month Quarter Year
My Web page
25PresentedTo Matrikon Summit 2007
Real time Hour Shift Day Week Month Quarter Year

Data→DiagnosticsData→Diagnostics
• Too much data?Too much data?– 1 000 loops x 10 assessments = 10 000 infos– Priorities, economic rank → 10 infosPriorities, economic rank 10 infos
• Too many things to do?– Realistic, e.g.:Realistic, e.g.:
• 25 loops/month• 5 minute daily reports• 15 minute weekly reports• 1 hour monthly meetings• 1 day yearly meetings
26PresentedTo Matrikon Summit 2007
• 1 day yearly meetings
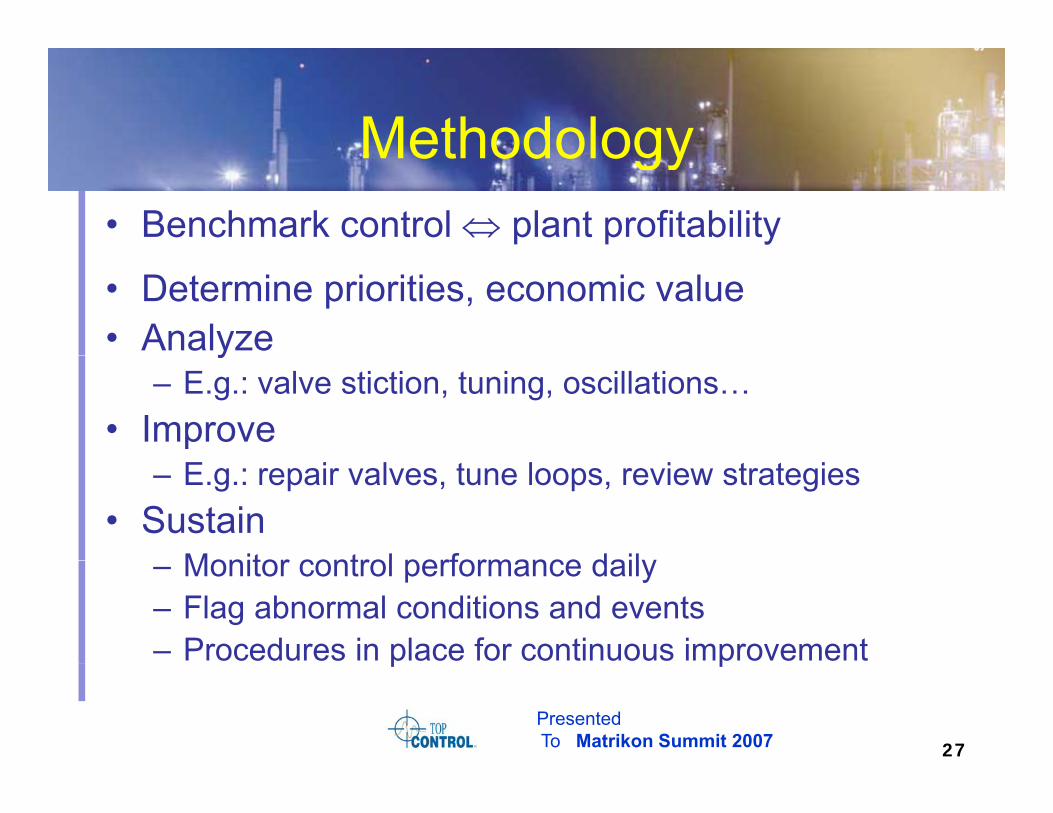
MethodologyMethodology• Benchmark control ⇔ plant profitability
• Determine priorities, economic value• Analyzey
– E.g.: valve stiction, tuning, oscillations…• Improve
– E.g.: repair valves, tune loops, review strategies• Sustain
Monitor control performance daily– Monitor control performance daily– Flag abnormal conditions and events– Procedures in place for continuous improvement
27PresentedTo Matrikon Summit 2007
p p
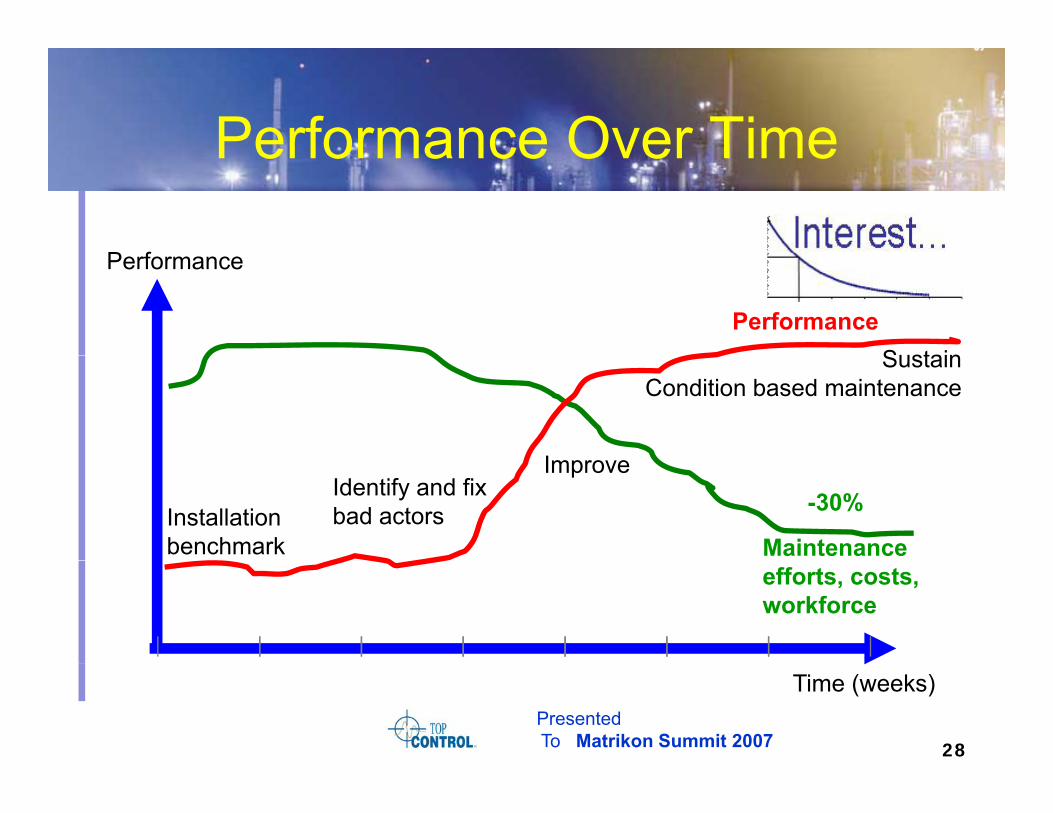
Performance Over TimePerformance Over Time
P fPerformance
PerformanceSustain
I
SustainCondition based maintenance
Maintenance
-30%Installationbenchmark
Identify and fix bad actors
Improve
efforts, costs, workforce
28PresentedTo Matrikon Summit 2007
Time (weeks)
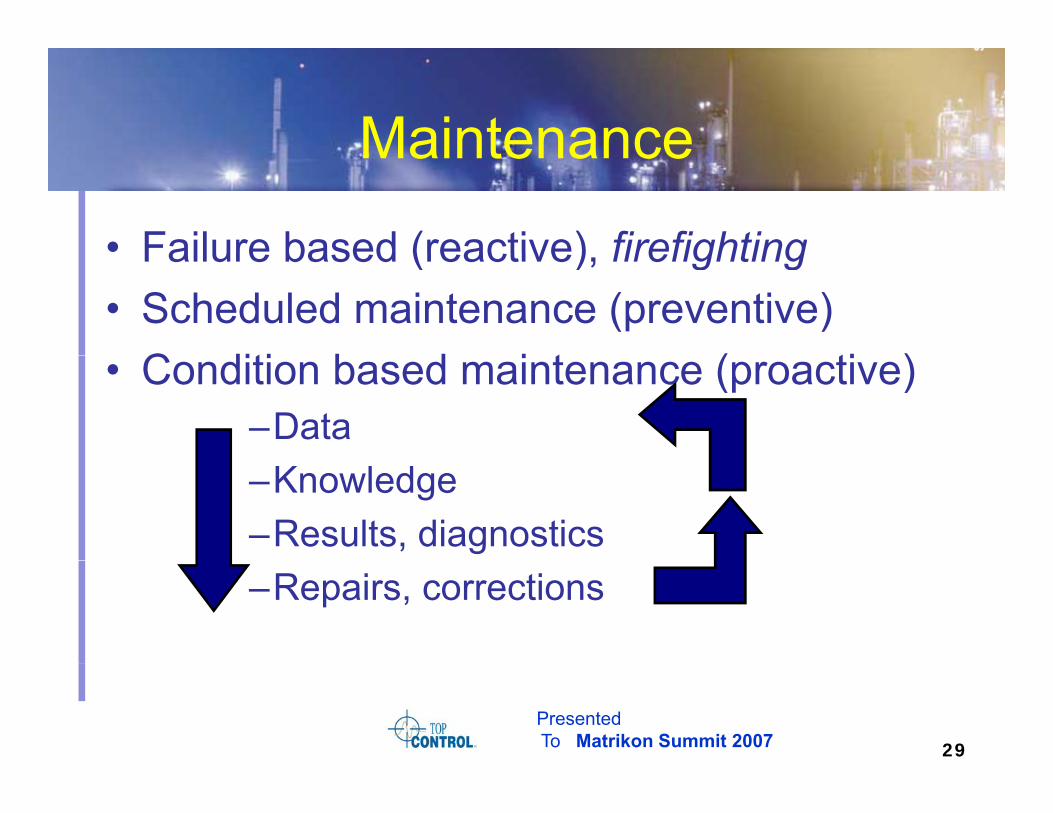
MaintenanceMaintenance
• Failure based (reactive) firefightingFailure based (reactive), firefighting• Scheduled maintenance (preventive)
C diti b d i t ( ti )• Condition based maintenance (proactive)–Data–Knowledge–Results, diagnostics–Repairs, corrections
29PresentedTo Matrikon Summit 2007
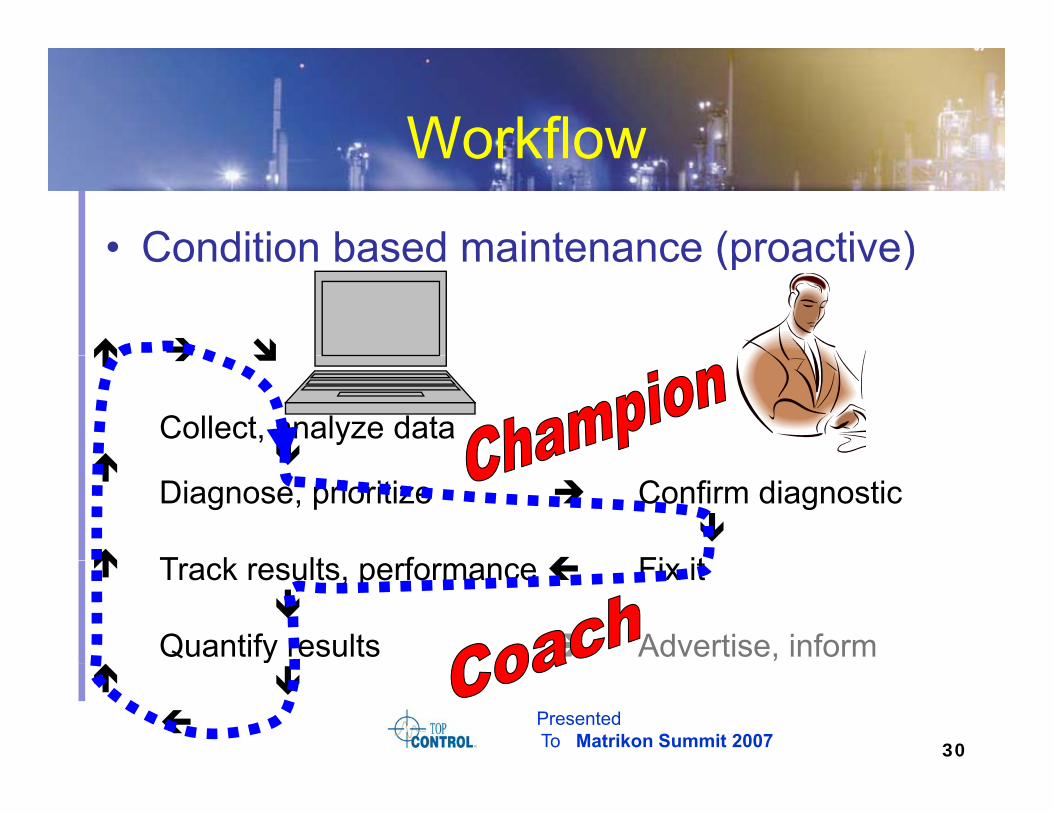
WorkflowWorkflow
• Condition based maintenance (proactive)Condition based maintenance (proactive)
Collect, analyze data
Diagnose, prioritize Confirm diagnostic
T k lt f Fi itTrack results, performance Fix it
Quantify results Advertise, inform
30PresentedTo Matrikon Summit 2007
y

SuccessesSuccesses
• Don’t be shy or humbleDon t be shy or humble– Spread the good news
Claim your success– Claim your success– Write short stories, articles
Q tif d lif lt• Quantify and qualify results– Numbers, $– Prepare presentations
31PresentedTo Matrikon Summit 2007
AgendaAgenda
• 1 Introduction• 1-Introduction• 2-Evolution
3 Data Knowledge Diagnostics• 3-Data→Knowledge →Diagnostics• 4-Performance
5 O ti i i P C t l• 5-Optimizing Process Control Performance6 E t d R lt• 6-Expected Results
• 7-Conclusions
32PresentedTo Matrikon Summit 2007
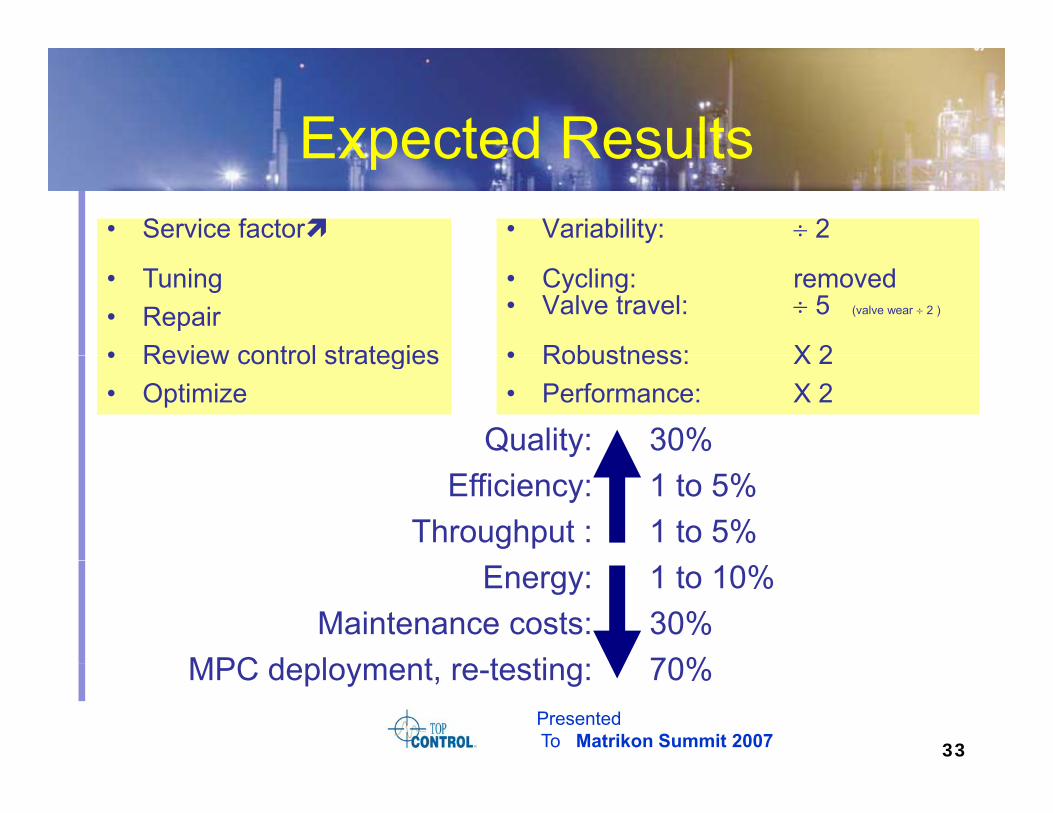
Expected ResultsExpected Results• Variability: ÷ 2• Service factor
• Cycling: removed• Valve travel: ÷ 5 (valve wear ÷ 2 )
• Robustness: X 2
• Tuning• Repair• Review control strategies • Robustness: X 2
• Performance: X 2
Quality: 30%
• Review control strategies• Optimize
Efficiency:Throughput :
1 to 5%1 to 5%
Energy:Maintenance costs:
MPC d l t t ti
1 to 10%30%70%
33PresentedTo Matrikon Summit 2007
MPC deployment, re-testing: 70%
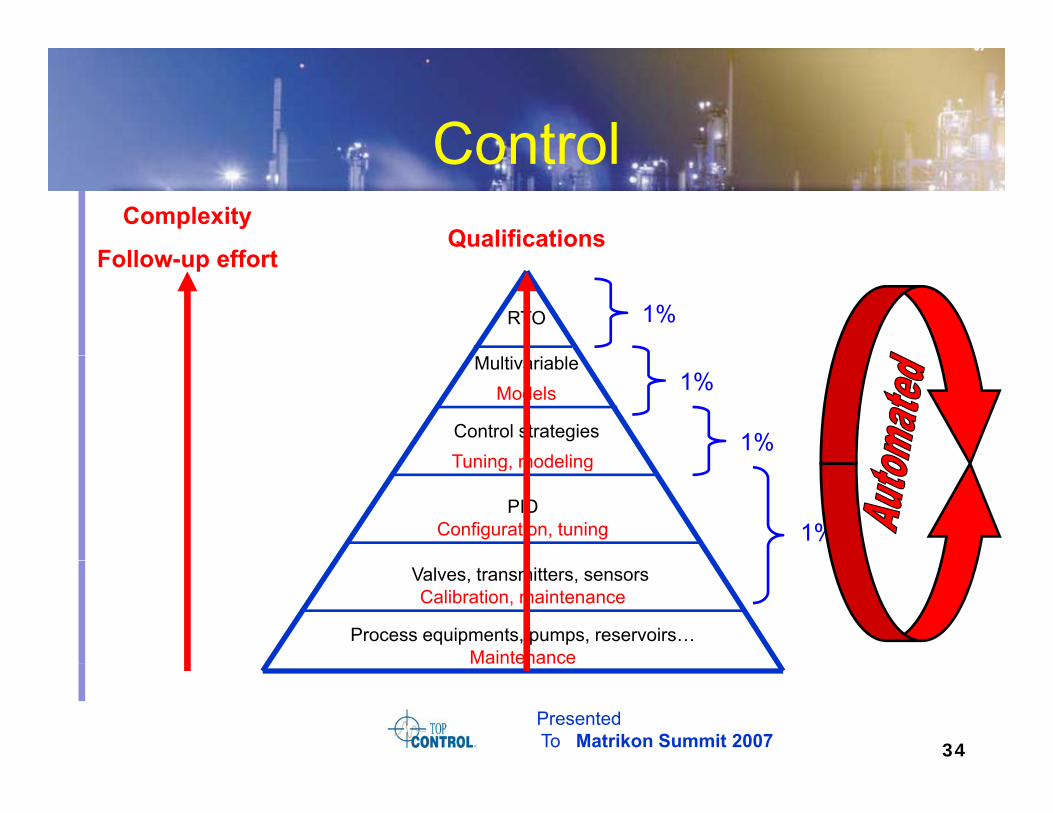
ControlControlComplexity
F ll ff tQualifications
RTO
Follow-up effort
1%
Control strategies
Multivariable
Tuning modeling
Models
1%
1%
PIDConfiguration, tuning
Tuning, modeling
1%
Valves, transmitters, sensors
Process equipments, pumps, reservoirs…Maintenance
Calibration, maintenance
34PresentedTo Matrikon Summit 2007
Maintenance
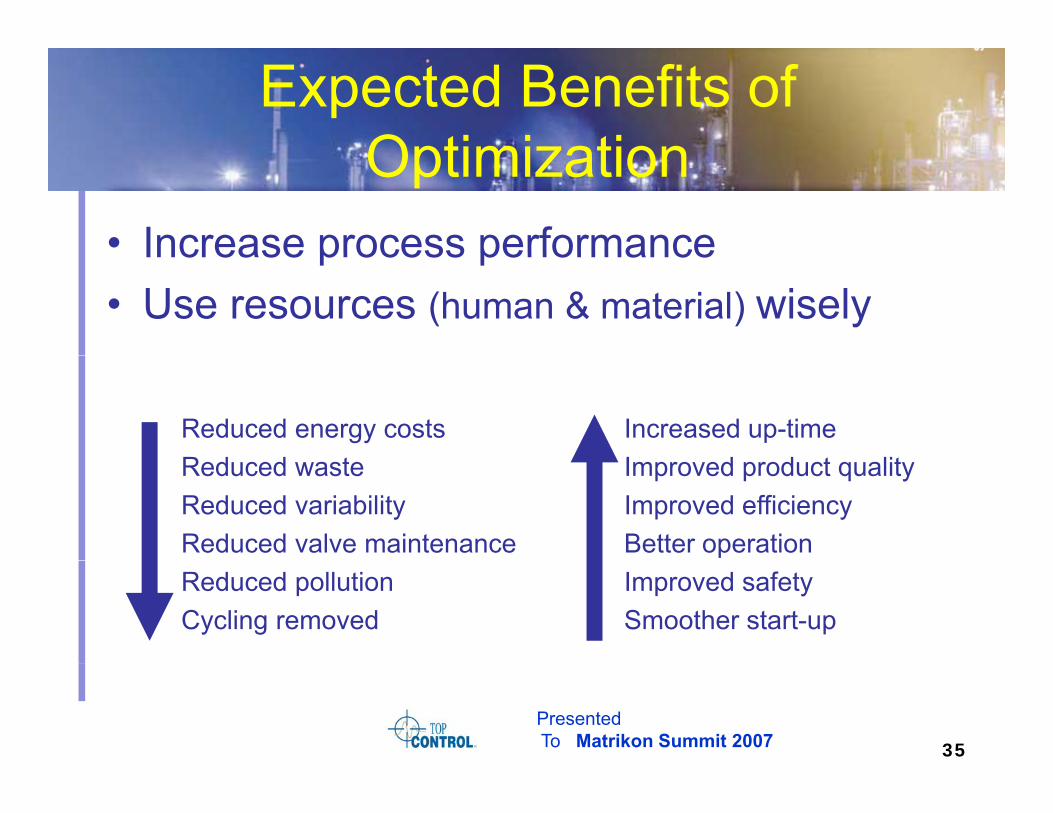
Expected Benefits of OptimizationOptimization
• Increase process performanceIncrease process performance• Use resources (human & material) wisely
• Reduced energy costsR d d t
• Increased up-time I d d t lit• Reduced waste
• Reduced variability• Reduced valve maintenance
• Improved product quality• Improved efficiency• Better operation
• Reduced pollution• Cycling removed
• Improved safety• Smoother start-up
35PresentedTo Matrikon Summit 2007

AgendaAgenda
• 1 Introduction• 1-Introduction• 2-Evolution
3 Data Knowledge Diagnostics• 3-Data→Knowledge →Diagnostics• 4-Performance
5 O ti i i P C t l• 5-Optimizing Process Control Performance6 Expected Results• 6-Expected Results
• 7-Conclusions
36PresentedTo Matrikon Summit 2007

ConclusionsConclusions
• Resources are used where they are• Resources are used where they are really needed
• Process control systems are used to their full potential
• Operation and production are optimal• Maintenance and engineering are• Maintenance and engineering are
efficiently used.
37PresentedTo Matrikon Summit 2007
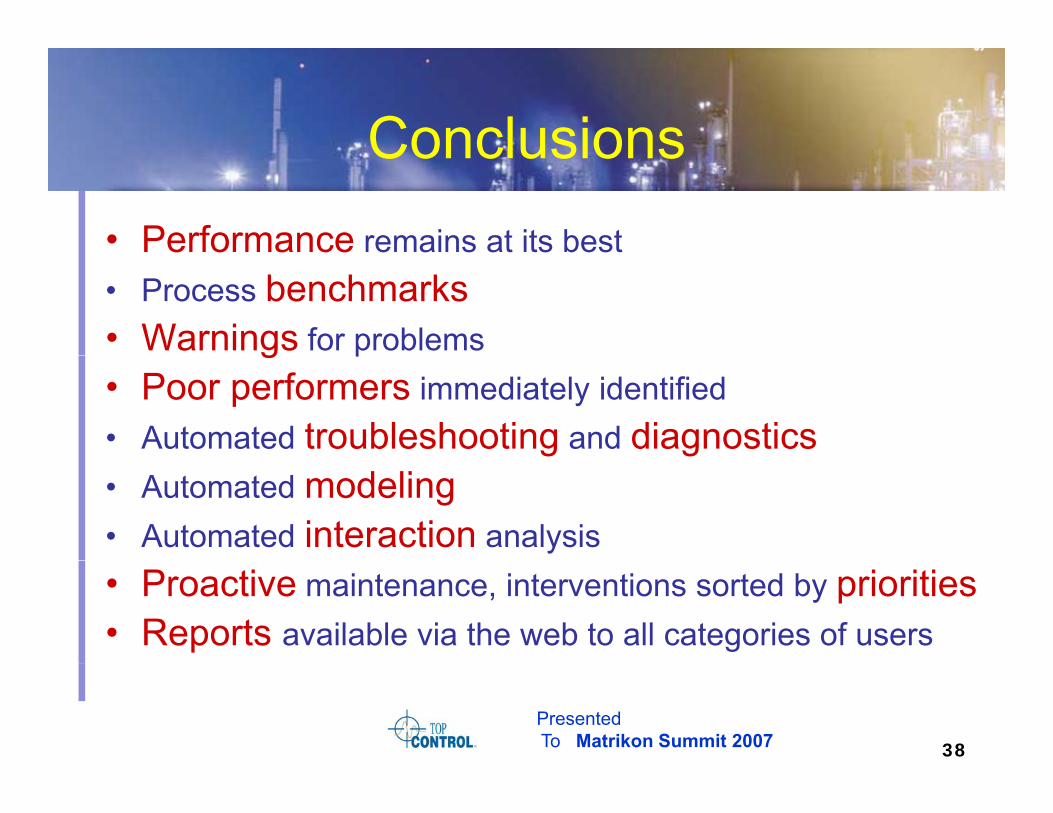
ConclusionsConclusions• Performance remains at its best• Process benchmarks• Warnings for problemsg p• Poor performers immediately identified• Automated troubleshooting and diagnostics• Automated modeling• Automated interaction analysis• Proactive maintenance, interventions sorted by priorities• Reports available via the web to all categories of users
38PresentedTo Matrikon Summit 2007
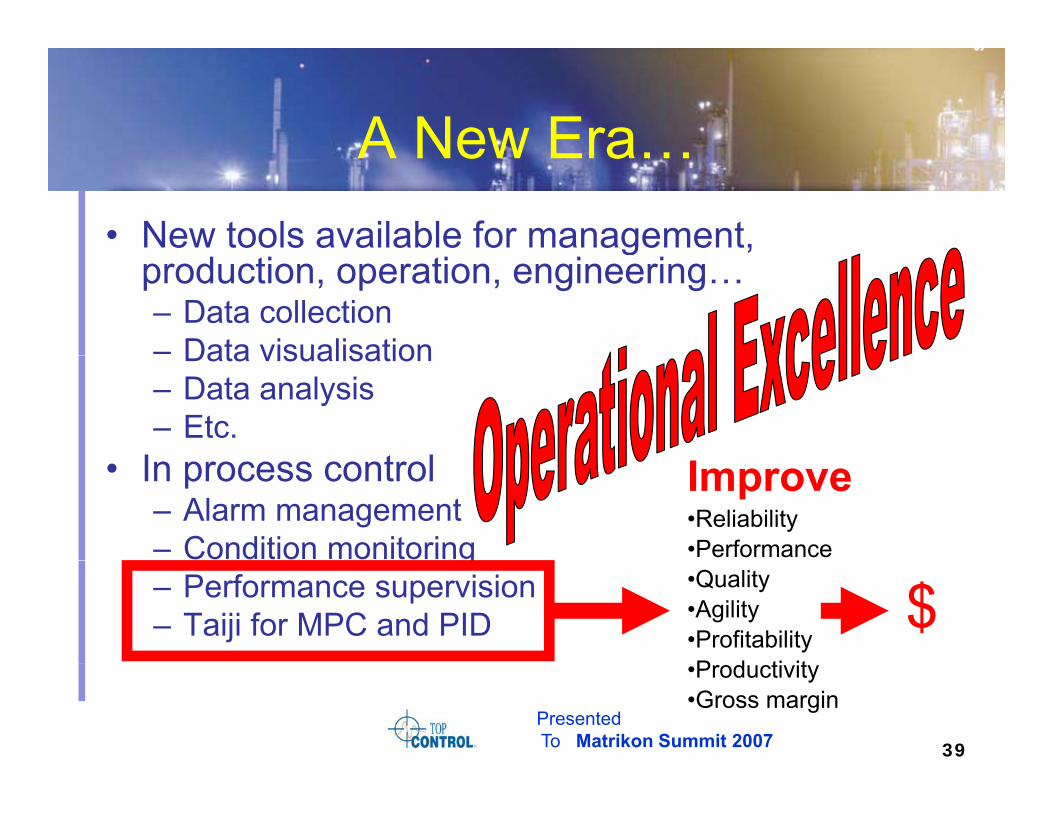
A New EraA New Era…• New tools available for management, g
production, operation, engineering…– Data collection– Data visualisationData visualisation– Data analysis– Etc.
I t l• In process control– Alarm management– Condition monitoring
Improve•Reliability•Performanceg
– Performance supervision– Taiji for MPC and PID
•Quality•Agility•ProfitabilityP d ti it
$
39PresentedTo Matrikon Summit 2007
•Productivity •Gross margin
Thank YouThank YouMichel RuelMichel Ruel
PresidentTop Control IncTop Control Inc
(877)867 6473(877)867-6473 www.topcontrol.com
40PresentedTo Matrikon Summit 2007

Control Assets→Plant PerformanceControl Assets→Plant PerformancePoor control poor plant performance poor financial performance
Quality, throughput, raw
Decreased revenues,increased costs
Pl t f
Financial performance
Yields, conversions, separations etc
Qua ty, t oug put, amaterials & utilities usagePlant performance
Process unit performance
POOP equipmentPERFORMANCE
separations, etc.
Physical equipmentReactors, compressors, heat
exchangers, etc.
POOR CONTROL
75% of your physical assets are under process control:
Process control assetsValves, sensors, regulatory control, advanced control,
analyzers, inferentials
41PresentedTo Matrikon Summit 2007
75% of your physical assets are under process control:
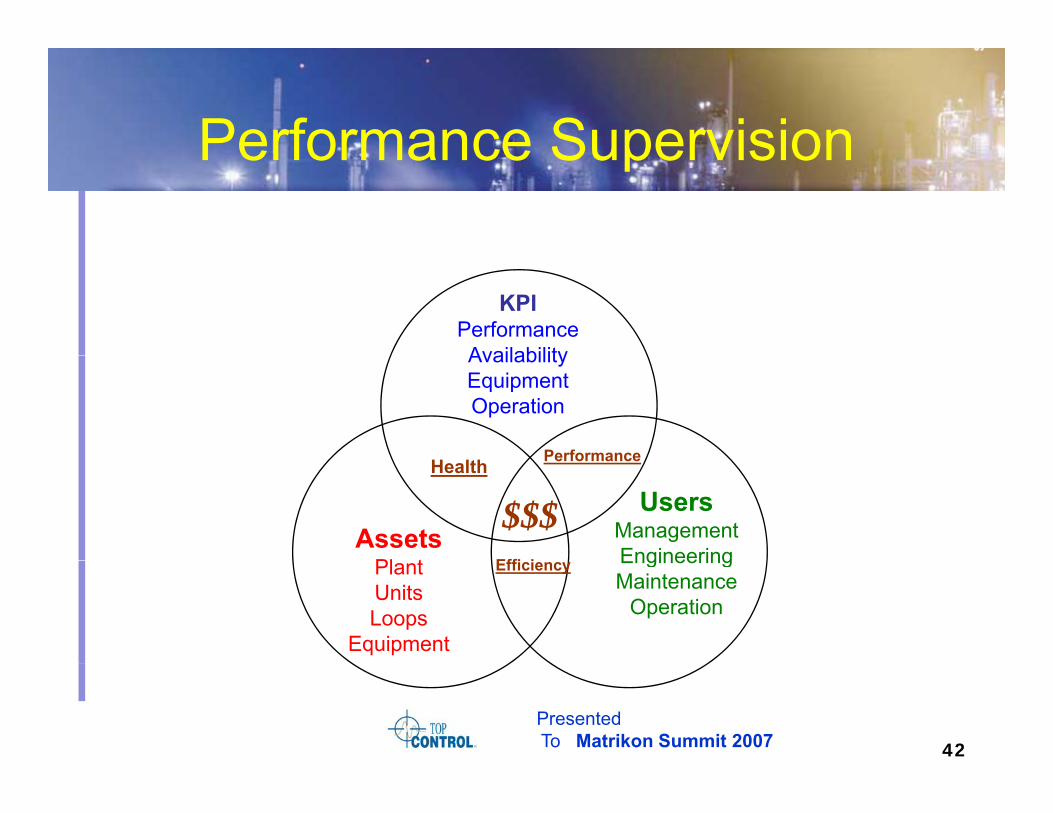
Performance SupervisionPerformance Supervision
KPIPerformanceAvailabilityAvailabilityEquipmentOperation
Performance
UsersManagementEngineering
AssetsPl t
Health
Effi i
Performance
$$$EngineeringMaintenance
Operation
PlantUnitsLoops
Equipment
Efficiency
42PresentedTo Matrikon Summit 2007