Embed Size (px)
Citation preview

1
Optimize Magnesium Dosage Process at Westside WWTP
Project Start: 11-19-10Project Champion: Jimmie JohnsonGreen Belt: Sheila HudnallBlack Belt: Sherry PettitTeam Members: Guillermo Garcia, Earl Brown, Kenneth Johnson, Homer Pruitt, Kenneth Acker, Treatment Plant Operators, Jim Yanker

What is The Purpose of Magnesium Hydroxide ?pH Stabilization Odor Control of Raw WastewaterSludge Reduction / Settling Solids in the Primaries
TCEQ Requirements for pH Levels in Effluent Flow
pH Levels between 6.0 – 9.0Monitored daily at effluent flow
Magnesium hydroxide n.
A white powder used as an antacid and a laxative. The American Heritage® Stedman's Medical Dictionary
Define Phase1. Select Output Characteristics

Odor Control
Odors occur when wastewater pH allows (H2S) hydrogen sulfide to evolve from liquid phase
Sulfate reducing bacteria operate best at pH levels 6.8 to 7.2. Above this ideal pH range, less sulfide is produced and SRB growth rate is stunted.
Since THIOGUARD® reactivity varies with wastewater chemistry, a titration is necessary to determine the optimum rate of addition. In general, it takes only 30-100 gallons of THIOGUARD® per million gallons of sewage to raise and hold the pH in a range of 8.0 to 8.5. Once determined, the feed rate is seasonally constant, despite variances in sulfide concentration.
© 2010 Premier Magnesia, LLC
Titration:
an operation, used in volumetric analysis, in which a measured amount of one solution is added to a known quantity of another solution until the reaction between the two is complete. If the concentration of one solution is known, that of the other can be calculated
Dictionary.com, LLC. Copyright © 2011
Define Phase1. Select Output Characteristics

It only takes 0.4 mg/L of caustic soda to raise a water sample to pH 9 and 4.0 mg/L to reach pH 10.
0.4 and 4.0 mg/L of Lime raises pH to 9.06 and 10.06 respectively.
It takes 100+ mg/L of THIOGUARD® to raise a water sample to pH 8.8.
This same 100 mg/L of THIOGUARD® has the same neutralizing power as 138 mg/L of caustic soda and 135 mg/L of lime and would be the equivalent of, though significantly more reactive … - - Premier Magnesia -
Define Phase1. Select Output Characteristics
Mag Information
Mag works as a buffer that can be used if alkalinity levels at influent are too low
Mag formula is 1 part mag for 2 parts hydrogen to raise pH
Mag raises pH levels slowly and can only obtain about a 9.0 pH level

Define Phase1. Select Output Characteristics
Texas Commission of Environmental Quality (TCEQ) Requirements

Time Series Plot of Effluent PH Minimum & Maximum SU Sample Test Results
The Time Series Chart indicates the variation between the pH minimum and the pH maximum sample test results.
Define Phase1. Select Output Characteristics

Summary for Effluent PH Minimum SU Sample Test Results
Mean = 6.712
StDev =0.1115
Define Phase1. Select Output Characteristics

Summary for Mag Usage 5-1/10-31, 2010 - Gallons per Day
Mean =364.97
StDev =106.17
Define Phase1. Select Output Characteristics

Define Phase2. Define Performance Standards
Project Charter
Problem Statement:
As of May 1, 2010 through October 31, 2010 the average Magnesium Hydroxide dosage usage has been sporadic. On average the dosage has been 364.97 gallon per day with a standard deviation of 106.17. The Magnesium Hydroxide added to the wastewater ranged from 100 to 700 gallons per day.
Project Objective:
Identify a standard dosage of Magnesium Hydroxide to obtain and maintain the levels conforming to the Texas Commission of Environmental Quality (TCEQ). The standard minimum being 6.0 with a
maximum being 9.0.

Define Phase2. Define Performance Standards
Summary of Cost for Magnesium Hydroxide
Financial Data
Cost of Magnesium Hydroxide per gallon
45,340 x .5387 /2000=12.2123 TN
Truck load 45,340 ibs / Density 11.99 1b/gal = 3781gal
12.2123 TN x $545.00 = $6655.70 /3781 = $1.76 gal.
Density, lb/gal varies due to wt % solids
The cost per gallon changes with each truck load received due to the % of the product.
The average per gallon is $1.85.
Average cost of Magnesium Hydroxide per gallon is $1.85.
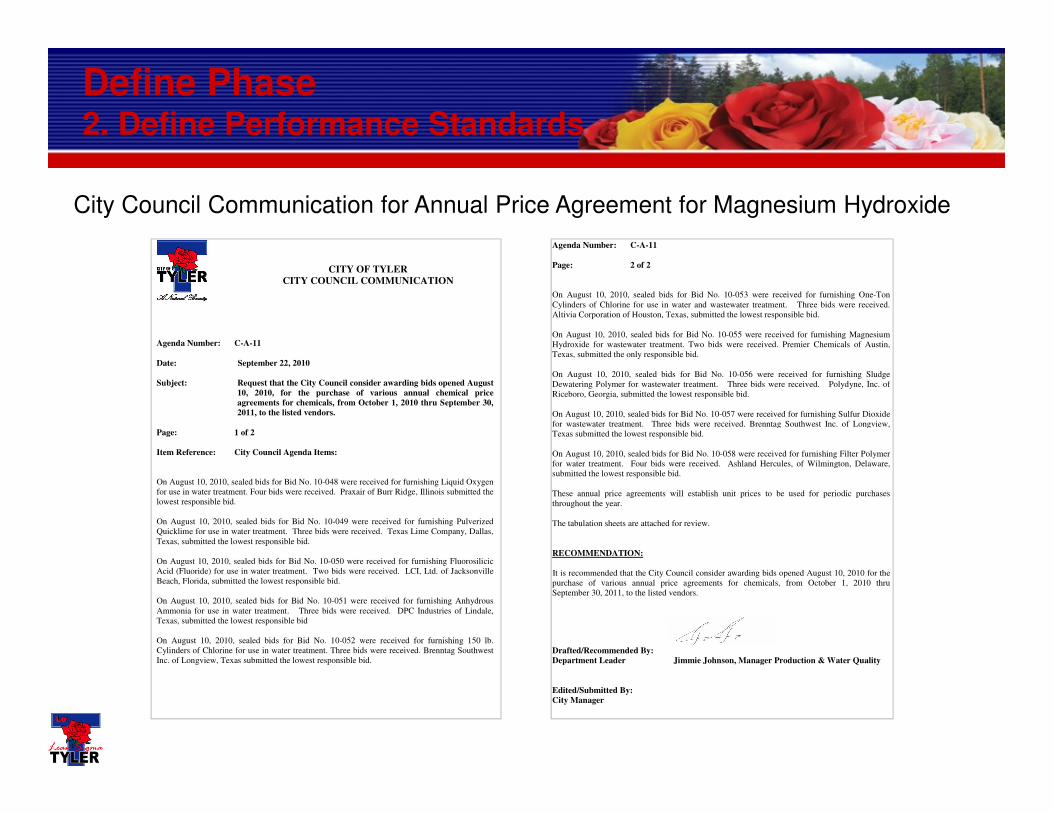
CITY OF TYLER
CITY COUNCIL COMMUNICATION
Agenda Number: C-A-11
Date: September 22, 2010
Subject: Request that the City Council consider awarding bids opened August
10, 2010, for the purchase of various annual chemical price
agreements for chemicals, from October 1, 2010 thru September 30,
2011, to the listed vendors.
Page: 1 of 2
Item Reference: City Council Agenda Items:
On August 10, 2010, sealed bids for Bid No. 10-048 were received for furnishing Liquid Oxygen
for use in water treatment. Four bids were received. Praxair of Burr Ridge, Illinois submitted the
lowest responsible bid.
On August 10, 2010, sealed bids for Bid No. 10-049 were received for furnishing Pulverized
Quicklime for use in water treatment. Three bids were received. Texas Lime Company, Dallas,
Texas, submitted the lowest responsible bid.
On August 10, 2010, sealed bids for Bid No. 10-050 were received for furnishing Fluorosilicic
Acid (Fluoride) for use in water treatment. Two bids were received. LCI, Ltd. of Jacksonville
Beach, Florida, submitted the lowest responsible bid.
On August 10, 2010, sealed bids for Bid No. 10-051 were received for furnishing Anhydrous
Ammonia for use in water treatment. Three bids were received. DPC Industries of Lindale,
Texas, submitted the lowest responsible bid
On August 10, 2010, sealed bids for Bid No. 10-052 were received for furnishing 150 lb.
Cylinders of Chlorine for use in water treatment. Three bids were received. Brenntag Southwest
Inc. of Longview, Texas submitted the lowest responsible bid.
Agenda Number: C-A-11
Page: 2 of 2
On August 10, 2010, sealed bids for Bid No. 10-053 were received for furnishing One-Ton
Cylinders of Chlorine for use in water and wastewater treatment. Three bids were received.
Altivia Corporation of Houston, Texas, submitted the lowest responsible bid.
On August 10, 2010, sealed bids for Bid No. 10-055 were received for furnishing Magnesium
Hydroxide for wastewater treatment. Two bids were received. Premier Chemicals of Austin,
Texas, submitted the only responsible bid.
On August 10, 2010, sealed bids for Bid No. 10-056 were received for furnishing Sludge
Dewatering Polymer for wastewater treatment. Three bids were received. Polydyne, Inc. of
Riceboro, Georgia, submitted the lowest responsible bid.
On August 10, 2010, sealed bids for Bid No. 10-057 were received for furnishing Sulfur Dioxide
for wastewater treatment. Three bids were received. Brenntag Southwest Inc. of Longview,
Texas submitted the lowest responsible bid.
On August 10, 2010, sealed bids for Bid No. 10-058 were received for furnishing Filter Polymer
for water treatment. Four bids were received. Ashland Hercules, of Wilmington, Delaware,
submitted the lowest responsible bid.
These annual price agreements will establish unit prices to be used for periodic purchases
throughout the year.
The tabulation sheets are attached for review.
RECOMMENDATION:
It is recommended that the City Council consider awarding bids opened August 10, 2010 for the
purchase of various annual price agreements for chemicals, from October 1, 2010 thru
September 30, 2011, to the listed vendors.
Drafted/Recommended By:
Department Leader Jimmie Johnson, Manager Production & Water Quality
Edited/Submitted By:
City Manager
Define Phase2. Define Performance Standards
City Council Communication for Annual Price Agreement for Magnesium Hydroxide

Define Phase2. Define Performance Standards
Annual Price Agreement Tabulation Document

Measure Phase3. Validate Measurement System
Measurement System Confirmation vs TCEQ standard

Process Map of the Westside WWTP
Measure Phase6. Identify Variation Sources

Schematics of the Westside WWTP
Measure Phase6. Identify Variation Sources

Measure Phase6. Identify Variation Sources
On August 13, 2008, C-A-6, the City Council approval the purchase of a Mag feed system for $34,895 from Premier Chemicals, which is now Premier Magnesia. Premier Chemicals proposed the feed rate to be 100-200 gallons per day. (Caustic Soda was used previously.)
Premier Chemicals Analysis

Measure Phase6. Identify Variation Sources
Mag dosages are measured by reading the amount in the tank daily, the flow is measured by a percentage. It is a 5000 gallon tank.

Analyze Phase7. Screen Potential Causes
Mag is added to the influent wastewater at an average rate of 365 gallons a day.

Mag and wastewater is mixed in the influent flume.
Measure Phase6. Identify Variation Sources

Primary Clarifier & Digesters Trickling Filter, Nite Basin & Filter Pumps
Measure Phase6. Identify Variation Sources

1st Stage Trickling Filter
Measure Phase6. Identify Variation Sources

Final Sample Area
Measure Phase6. Identify Variation Sources

Measure Phase6. Identify Variation Sources
Average effluent flow into Black Fork Creek is 8million gallons per day. It takes approximately 6 hours for the process to cycle completely.

605040302010
7.2
7.1
7.0
6.9
6.8
6.7
6.6
Gallons per 2 hour
Eff PH
S 0.102522
R-Sq 0.4%
R-Sq(adj) 0.2%
Fitted Line PlotEff PH = 6.809 + 0.000784 Gallons per 2 hour
Mag dosage and Effluent pH levels were tracked for 31 days. The graph reveals the Effluent pH level changes very little whether the dosage is12 gallons or 55 gallons per 2 hour intervals.
Analyze Phase7. Screen Potential Causes
Fitted Line Plot Mag Dosage-Effluent pH

9.08.58.07.57.06.5
60
50
40
30
20
10
Inf PH
Gallons per 2 hour
S 8.67564
R-Sq 2.0%
R-Sq(adj) 1.8%
Fitted Line PlotGallons per 2 hour = - 8.32 + 4.862 Inf PH
Analyze Phase7. Screen Potential Causes
Fitted Line Plot Mag Dosage-Influent pH
Mag dosage and Influent pH levels were tracked for the 31 days as well. The graph reveals that there is no statistical significance in the amount of Influent pH and the amount of mag put into the process.

200190180170160150140130
200
180
160
140
120
100
Raw Alkalinity
Mag - gal
S 0
R-Sq *%
R-Sq(adj) *%
Fitted Line PlotMag - gal = 150.0 + 0.000000 Raw Alkalinity
Analyze Phase7. Screen Potential Causes
Fitted Line Plot Mag Dosage-Raw Alkalinity
Additional analysis was conducted to verify if the mag dosage amount was added to the process based on the results of the Raw Alkalinity sample test results. A 5 day snapshot of mag and alkalinity data was gathered. The Regression Analysis indicates that there is statistical significance in the amount of raw alkalinity and the amount of mag put into the process.Determined: Alkalinity sample test results were the driving factor for the mag dosage.

Westside Treatment Plant Analysis
Date TimeRaw
Ammonia Final Ammonia Raw Alkalinity Final Alkalinity Raw Ph Final Ph Mag - gal
2/28/2011 10:am 10 0.1 140 58 6.8 6.6 150
2:pm 12 0.1 176 72 6.7 6.4 150
3/1/2011 10:am 12 0.1 200 80 6.82 6.53 150
2:pm 12 0.1 190 86 6.7 6.7 150
3/2/2011 10:am 8 1.5 134 100 6.7 6.7 150
2:pm 14 1 200 106 6.9 6.7 150
3/3/2011 10:am 10 2 174 116 6.8 6.9 150
2:pm 12 1 188 108 7 7 150
3/4/2011 10:am 10 0.1 156 100 6.7 6.9 150
2:pm 12 0.1 180 100 6.8 6.7 150
Analyze Phase7. Screen Potential Causes
5 Day Snapshot of Mag Dosage-Alkalinity

Improve Phase11. Improved State Process Performance
Improved Time Series Plot of Effluent PH Min SU Sample Test Results 4-12/9-30, 2011
The Time Series Chart indicates the variation of the pH minimum sample test results.

Improve Phase11. Improved State Process Performance
Improved Summary for Effluent PH Min SU Sample Test Results 4-12/9-30, 2011
Mean = 6.7774
StDev =0.2254
Previous:
Mean = 6.712
StDev =0.1115

Improve Phase11. Improved State Process Performance
Improved Summary for Mag Usage 4-12/9-30, 2011 - Gallons per Day
Mean =270.69
StDev =15.57
Previous:
Mean =364.97
StDev =106.17

Improve Phase11. Improved State Process Performance
Improve I Chart of Eff Ph by Mag 4-12/9-30, 2011 – Gallons per Day
I-Chart illustrates the improvement of the overall process during the course of the project. The chart clearly shows a reduction in Mag dosage with very little change to the Ph sample test results.
6.757 6.783 6.808 6.71

Control Phase12. Implement Process Controls
OPS Charts for Mag Dosage, Eff Alkalinity and Eff Ph Min/Max SU Measurements
OPS Charts were processed in order to view the status of the Mag usage, effluent alkalinity measurements and Ph measurements on a daily basis or as needed. Management communicates with employees concerning data which exceeds OPS Chart control limits.

Control Phase12. Implement Process Controls
Standard Operating Procedures
Standard Operating Procedures were established for the Westside Treatment Plant Magnesium Hydroxide dosage process.

Control Phase12. Implement Process Controls
Visual Board
A Visual Management Board has been created. Lean Sigma project information will be displayed for viewing.

Control Phase12. Implement Process Controls
Visual Board

Optimize Magnesium Dosage Process
at Westside WWTP
Data and Cost Calculation
October 2011/October 2012
Month
Average Mag
Usage Per Day
(Gallons)
Average Mag
Usage For The
Month
(Gallons)
Initial Average
Mag Usage Per
Day (Gallons)
Mag Savings
Per Day
(Gallons)
Mag Cost
Savings Per
Day (1.85 Per
Gallon)
Savings
May 278 8,618 365 87 160.89 4,988$
June 274 8,220 365 91 168.29 5,049$
July 267 8,277 365 98 181.24 5,619$
August 262 8,122 365 103 190.49 5,905$
September 251 7,530 365 114 210.84 6,325$
October 251 7,781 365 114 210.84 6,536$
November 251 7,530 365 114 210.84 6,325$
December 251 7,781 365 114 210.84 6,536$
January 251 7,781 365 114 210.84 6,536$
February 251 7,279 365 114 210.84 6,114$
March 251 7,781 365 114 210.84 6,536$
April 251 7,530 365 114 210.84 6,325$
May 251 7,781 365 114 210.84 6,536$
June 365
July 365
August 365
September 365
October 365
Hard Dollar CalculationsData
246,466$ Initial Cost
Total Savings 79,332$
Hard Dollar Savings 79,332$
Control Phase12. Implement Process Controls
Data and Cost Calculation
The Data and Cost Calculation captures the hard dollar savings as a result of the completed project.
The initial estimate for hard dollar savings for this project was $77,653.
The actual savings to date is 79,332.