Embed Size (px)
Citation preview
The Regulatory Assistance Project 50 State Street, Suite 3Montpelier, VT 05602
Phone: 802-223-8199web: www.raponline.org
Roadmap 2050: A practical guide to a prosperous, low-carbon Europe
A project of the European Climate Foundation
Presentation to the U.S. Department of EnergyElectricity Advisory Committee
Michael Hogan, Senior Advisor, RAP12 July 2011
Month dd, yyyy
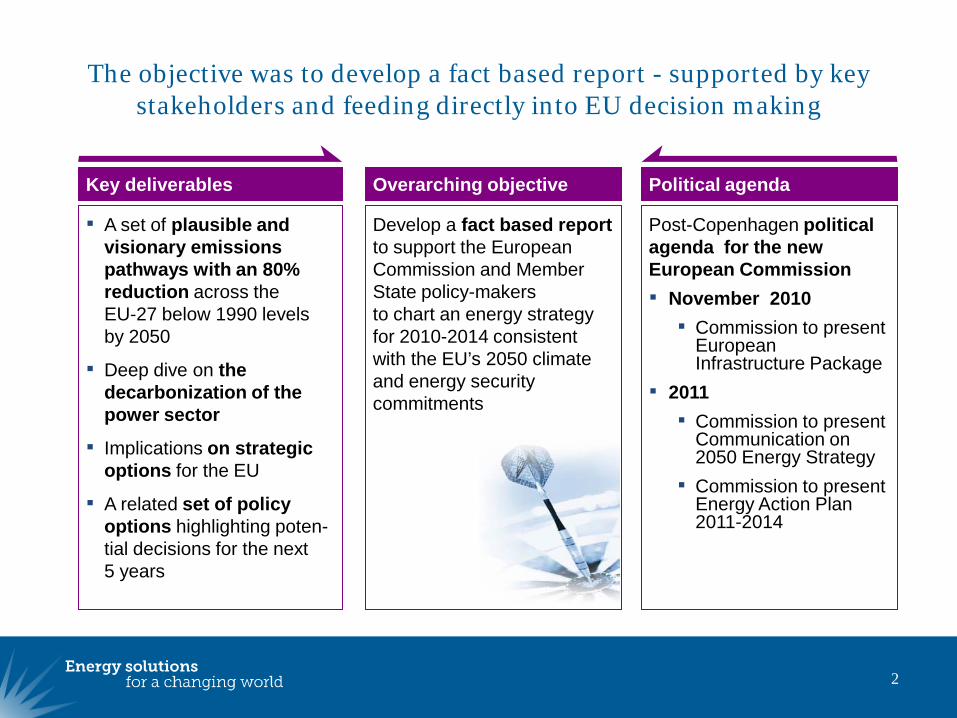
The objective was to develop a fact based report - supported by key stakeholders and feeding directly into EU decision making
2
Key deliverables
A set of plausible and visionary emissions pathways with an 80% reduction across the EU-27 below 1990 levels by 2050
Deep dive on the decarbonization of the power sector
Implications on strategic options for the EU
A related set of policy options highlighting poten-tial decisions for the next 5 years
Political agenda
Post-Copenhagen political agenda for the new European Commission November 2010
Commission to present European Infrastructure Package
2011 Commission to present
Communication on 2050 Energy Strategy
Commission to present Energy Action Plan 2011-2014
Overarching objective
Develop a fact based report to support the European Commission and Member State policy-makersto chart an energy strategy for 2010-2014 consistent with the EU’s 2050 climate and energy security commitments
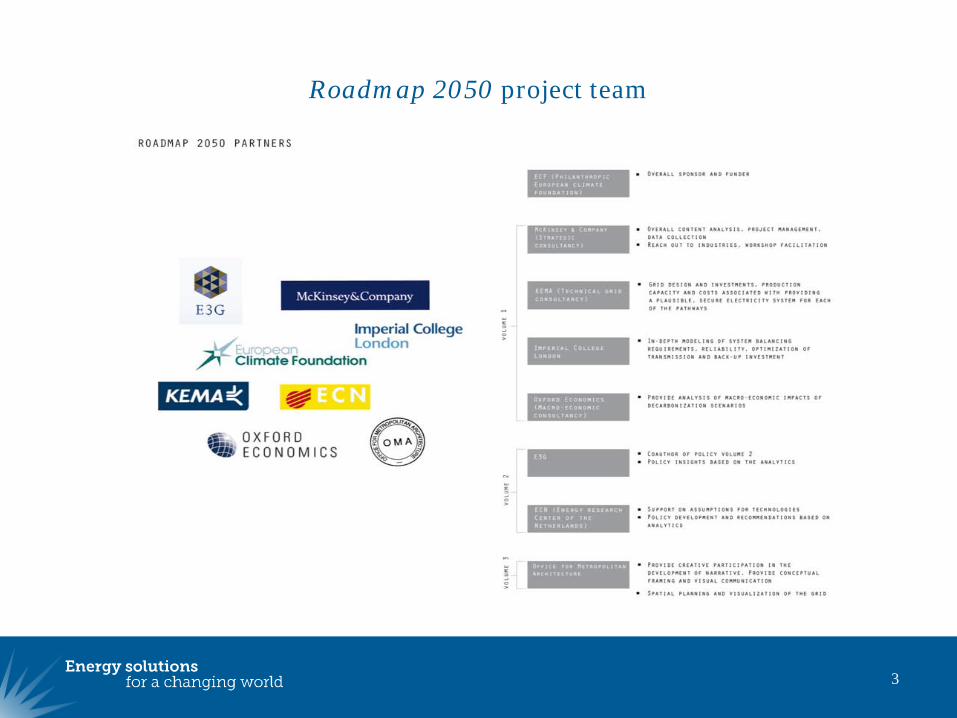
Roadmap 2050 project team
3
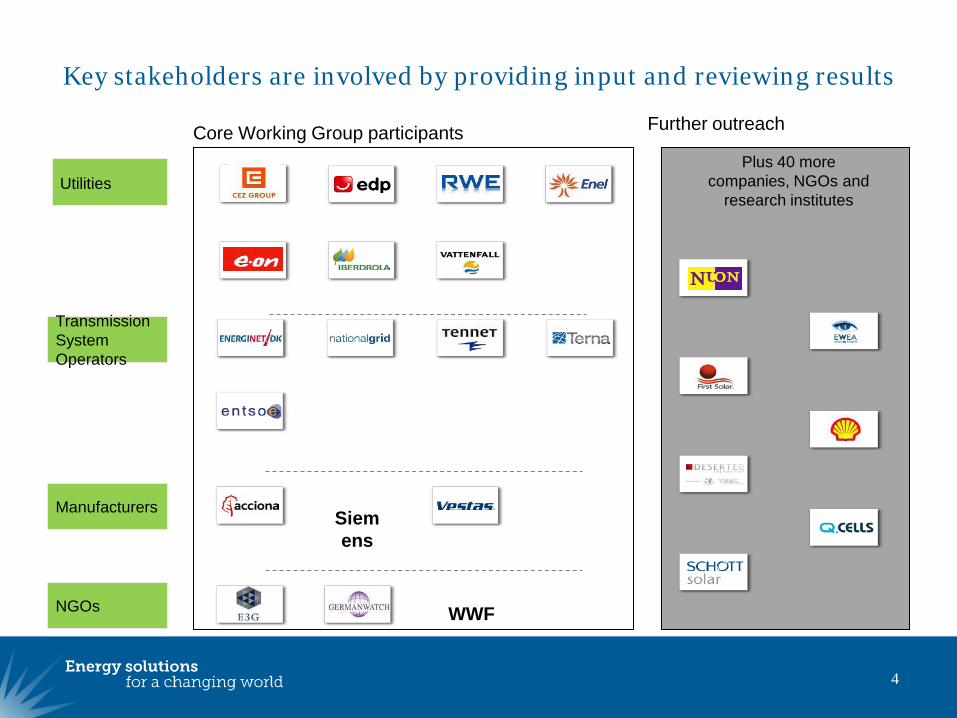
Key stakeholders are involved by providing input and reviewing results
4
4
Transmission System Operators
NGOs
Manufacturers
Plus 40 more companies, NGOs and
research institutes
Further outreach
Siemens
WWF
Utilities
Core Working Group participants
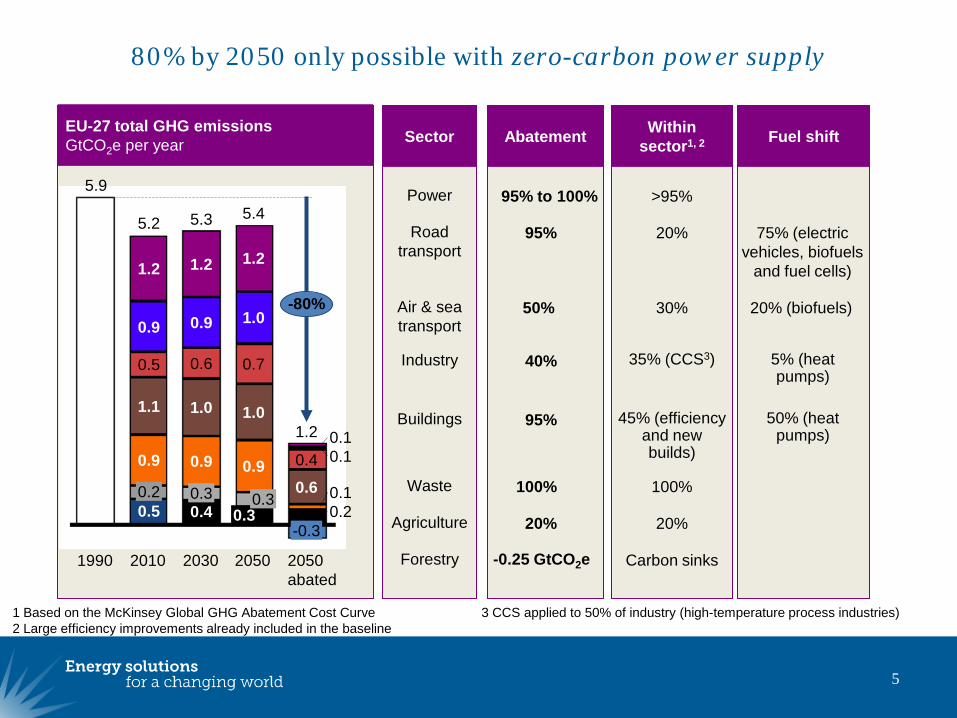
80% by 2050 only possible with zero-carbon power supply
5
EU-27 total GHG emissionsGtCO2e per year Sector
Power
Road transport
Industry
Buildings
Agriculture
Waste
Air & sea transport
Forestry
Withinsector1, 2
>95%
20%
35% (CCS3)
45% (efficiency and new builds)
20%
100%
30%
Carbon sinks
Fuel shift
75% (electric vehicles, biofuels
and fuel cells)
5% (heat pumps)
50% (heat pumps)
20% (biofuels)
Abatement
95% to 100%
95%
40%
95%
20%
100%
50%
-0.25 GtCO2e
1 Based on the McKinsey Global GHG Abatement Cost Curve 3 CCS applied to 50% of industry (high-temperature process industries)2 Large efficiency improvements already included in the baseline
1990
0.4
0.1
0.2
0.1
2050
5.4
0.30.30.2
1.0
0.9
0.6
0.9
1.0
0.7
0.9
5.2
2010
1.2
1.0
1.2
0.9
1.1
0.5
2030
5.3
0.5
0.1
1.2
0.3
0.9
2050 abated
-0.3
0.60.4
5.9
1.2
-80%
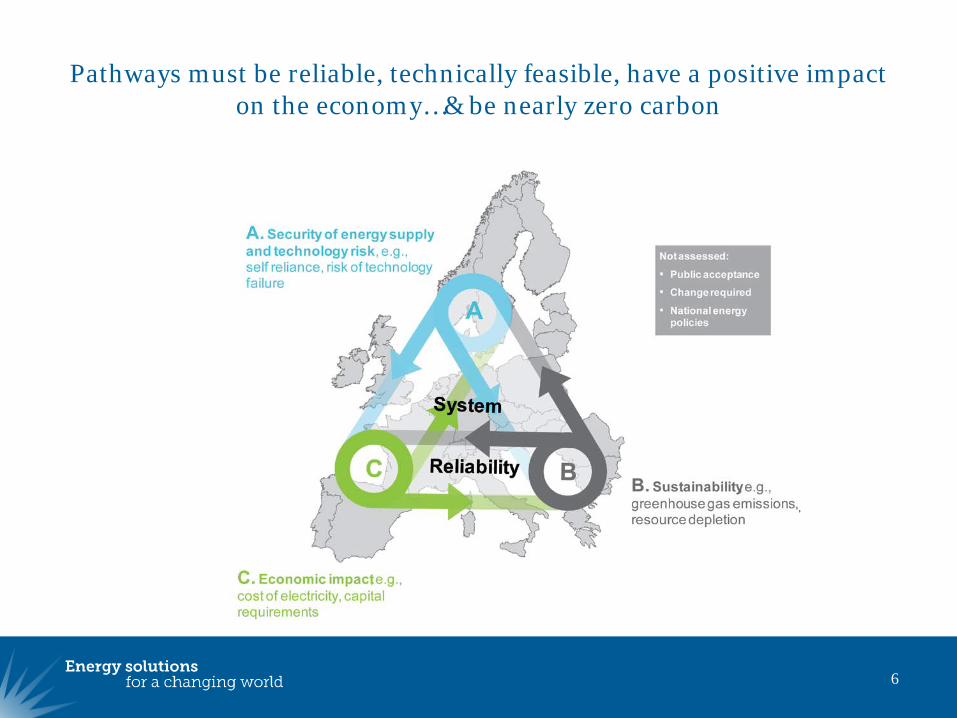
Pathways must be reliable, technically feasible, have a positive impact on the economy…& be nearly zero carbon
6
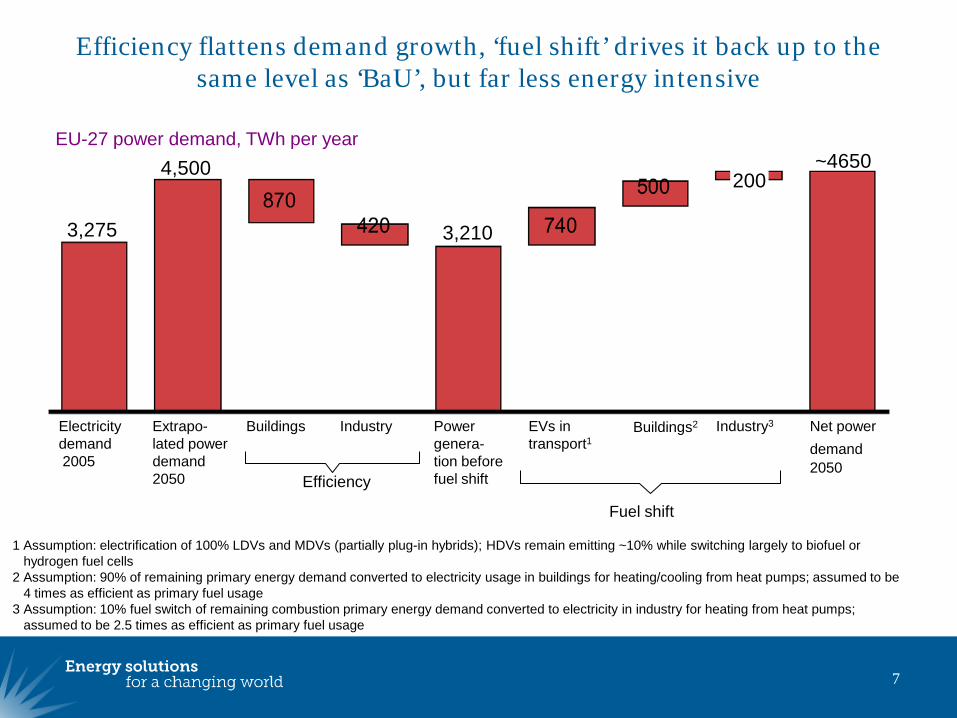
Efficiency flattens demand growth, ‘fuel shift’ drives it back up to the same level as ‘BaU’, but far less energy intensive
7
Net power demand2050
~4650
Industry3
200
Buildings2EVs in transport1
Power genera-tion before fuel shift
3,210
IndustryBuildingsExtrapo-lated power demand 2050
4,500
Electricity demand2005
3,275
1 Assumption: electrification of 100% LDVs and MDVs (partially plug-in hybrids); HDVs remain emitting ~10% while switching largely to biofuel or hydrogen fuel cells
2 Assumption: 90% of remaining primary energy demand converted to electricity usage in buildings for heating/cooling from heat pumps; assumed to be 4 times as efficient as primary fuel usage
3 Assumption: 10% fuel switch of remaining combustion primary energy demand converted to electricity in industry for heating from heat pumps; assumed to be 2.5 times as efficient as primary fuel usage
Efficiency
Fuel shift
EU-27 power demand, TWh per year
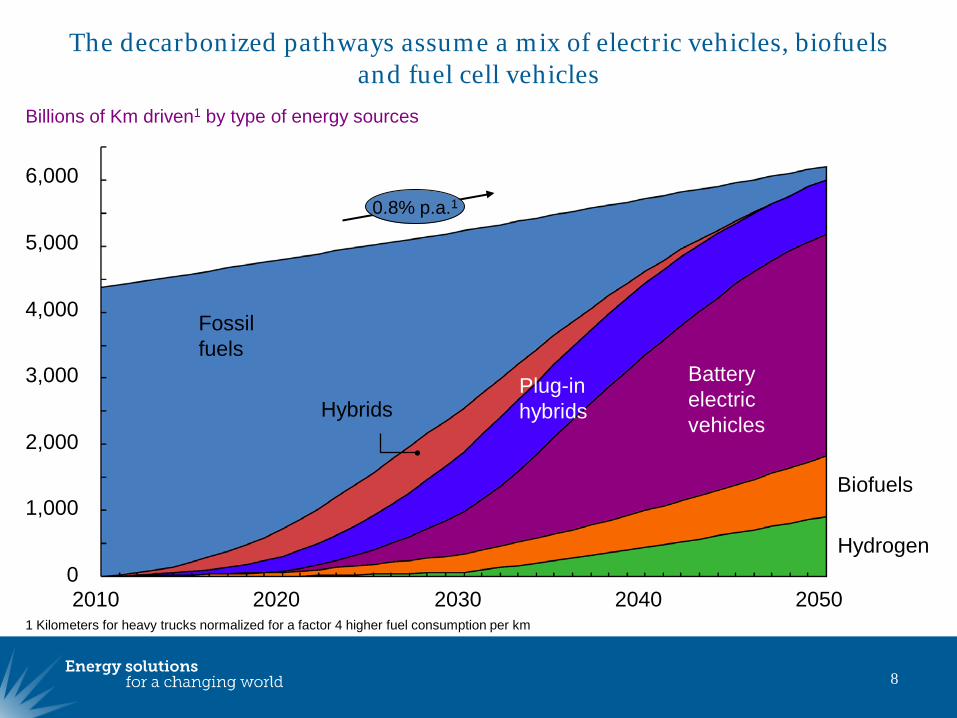
The decarbonized pathways assume a mix of electric vehicles, biofuelsand fuel cell vehicles
8
Billions of Km driven1 by type of energy sources
6,000
5,000
4,000
3,000
2,000
1,000
0Hydrogen
Biofuels
20502040203020202010
Battery electric vehicles
Fossil fuels
HybridsPlug-in hybrids
1 Kilometers for heavy trucks normalized for a factor 4 higher fuel consumption per km
0.8% p.a.1
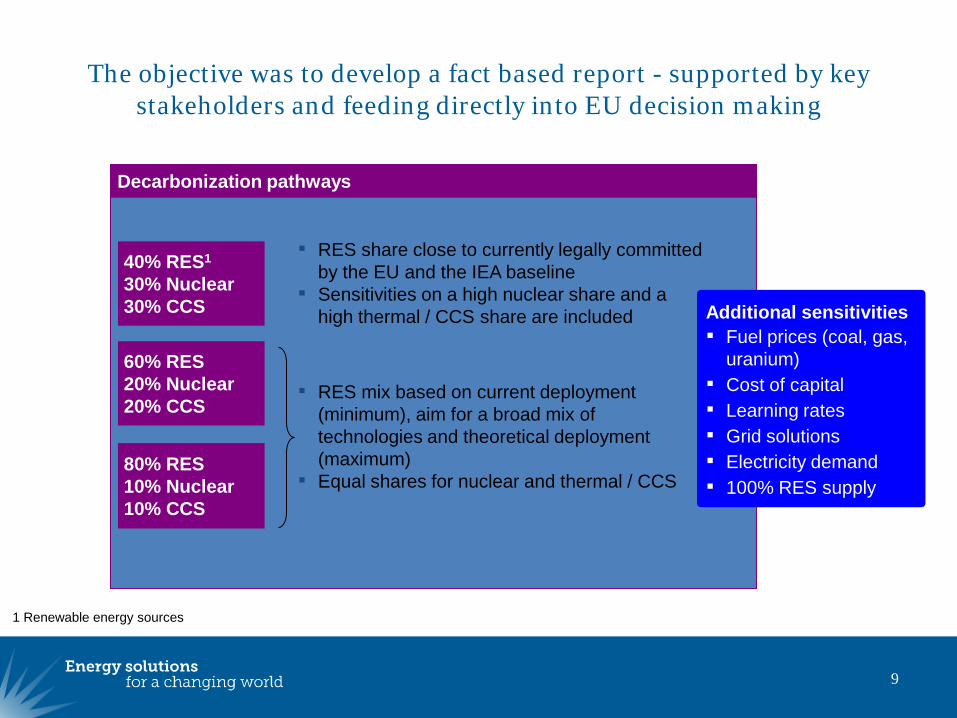
The objective was to develop a fact based report - supported by key stakeholders and feeding directly into EU decision making
9
Decarbonization pathways
60% RES20% Nuclear 20% CCS
RES mix based on current deployment (minimum), aim for a broad mix of technologies and theoretical deployment (maximum)
Equal shares for nuclear and thermal / CCS
40% RES1
30% Nuclear 30% CCS
RES share close to currently legally committed by the EU and the IEA baseline
Sensitivities on a high nuclear share and a high thermal / CCS share are included
80% RES10% Nuclear 10% CCS
Additional sensitivities Fuel prices (coal, gas,
uranium) Cost of capital Learning rates Grid solutions Electricity demand 100% RES supply
1 Renewable energy sources
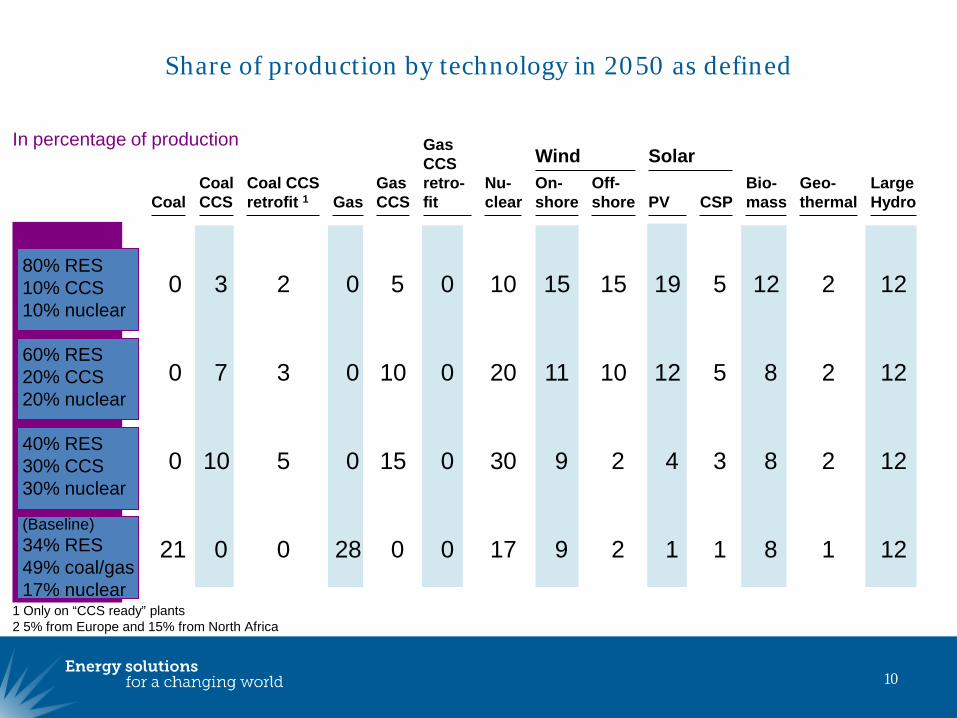
Share of production by technology in 2050 as defined
10
Wind SolarIn percentage of production
80% RES 10% CCS10% nuclear
60% RES 20% CCS20% nuclear
40% RES 30% CCS30% nuclear
(Baseline)34% RES49% coal/gas17% nuclear
1 Only on “CCS ready” plants2 5% from Europe and 15% from North Africa
LargeHydro
Geo-thermal
Bio-massCSPPV
On-shore
Off-shore
Nu-clear
Gas CCSretro-fitGas
Coal CCSretrofit 1
CoalCCSCoal
GasCCS
1221251915 151000230 5
122851211 102000370 10
1228349 230005100 15
1218119 2170280021 0
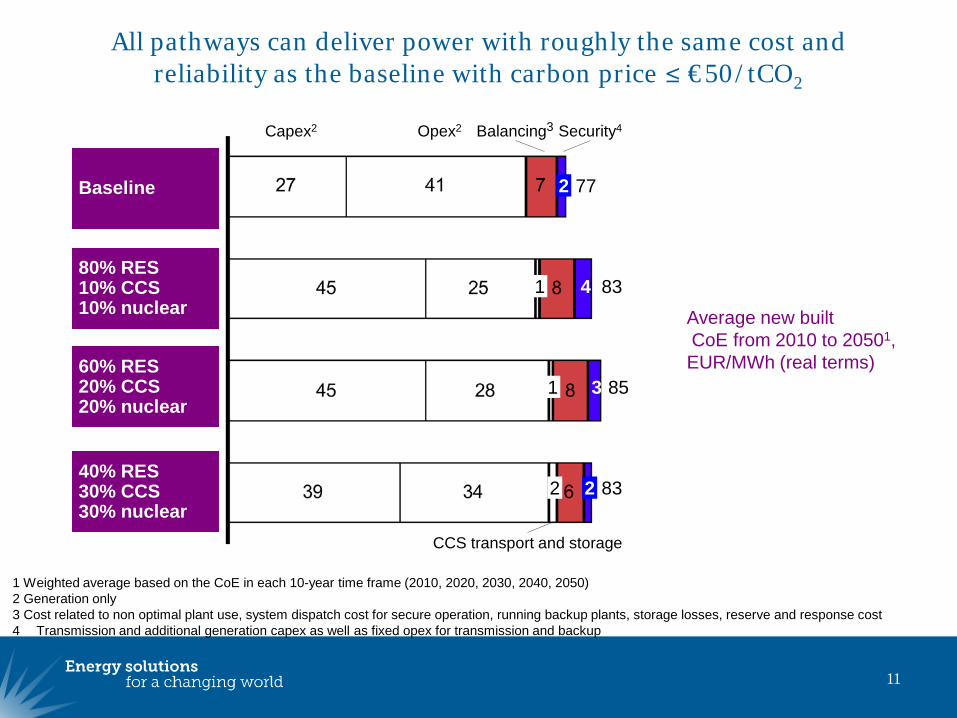
All pathways can deliver power with roughly the same cost and reliability as the baseline with carbon price ≤ €50/tCO2
11
Capex2 Opex2
CCS transport and storage
Balancing3 Security4
832 2
851 3
831 4
772
1 Weighted average based on the CoE in each 10-year time frame (2010, 2020, 2030, 2040, 2050)2 Generation only3 Cost related to non optimal plant use, system dispatch cost for secure operation, running backup plants, storage losses, reserve and response cost4 Transmission and additional generation capex as well as fixed opex for transmission and backup
Baseline
60% RES 20% CCS20% nuclear
40% RES 30% CCS30% nuclear
Average new builtCoE from 2010 to 20501,EUR/MWh (real terms)
80% RES 10% CCS10% nuclear
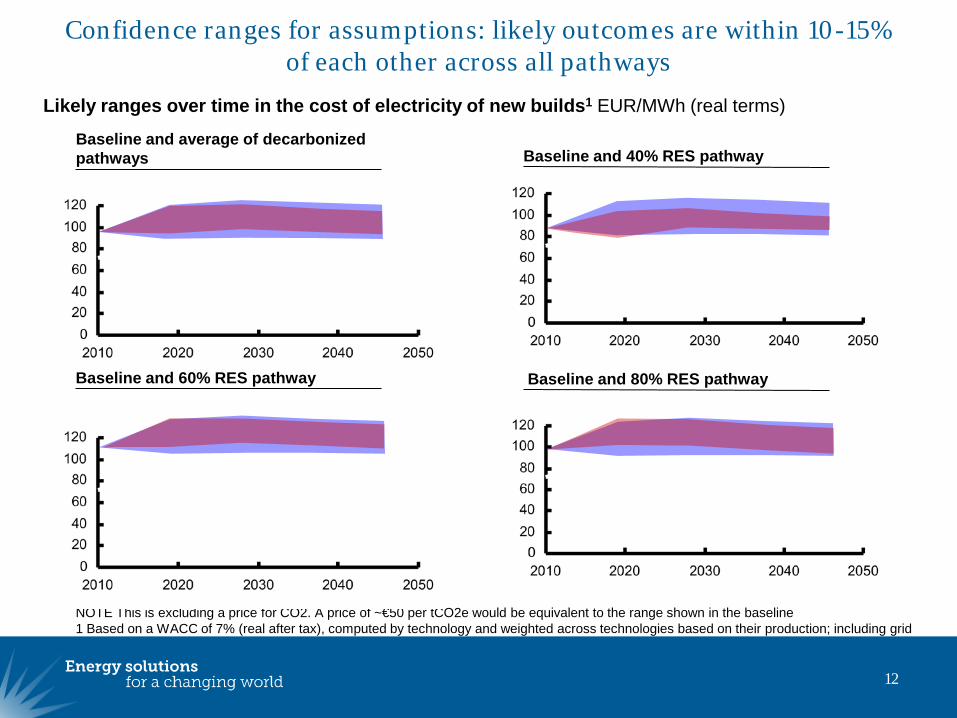
Confidence ranges for assumptions: likely outcomes are within 10-15% of each other across all pathways
12
Likely ranges over time in the cost of electricity of new builds1 EUR/MWh (real terms)
NOTE This is excluding a price for CO2. A price of ~€50 per tCO2e would be equivalent to the range shown in the baseline1 Based on a WACC of 7% (real after tax), computed by technology and weighted across technologies based on their production; including grid
Baseline and 40% RES pathway
Baseline and 80% RES pathway
Baseline and average of decarbonizedpathways
Baseline and 60% RES pathway
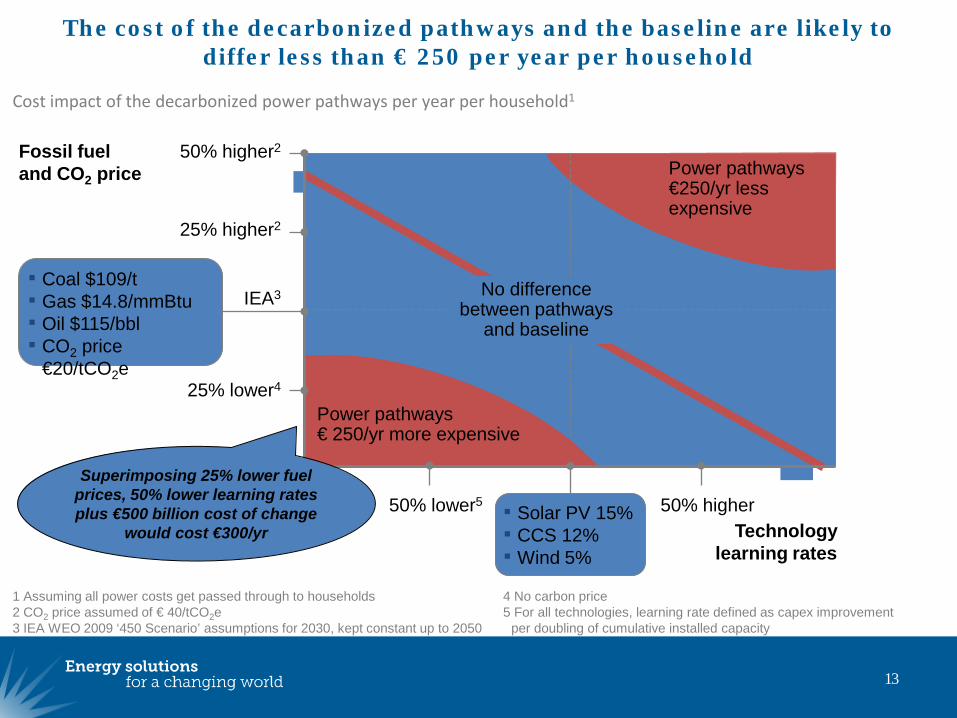
The cost of the decarbonized pathways and the baseline are likely to differ less than € 250 per year per household
13
50% higher2
25% higher2
25% lower4
IEA3
Cost impact of the decarbonized power pathways per year per household1
50% lower5 50% higherTechnology
learning rates
Power pathways€ 250/yr more expensive
Fossil fuel and CO2 price Power pathways
€250/yr less expensive
No difference between pathways
and baseline
Coal $109/t Gas $14.8/mmBtu Oil $115/bbl CO2 price
€20/tCO2e
Solar PV 15% CCS 12% Wind 5%
Superimposing 25% lower fuel prices, 50% lower learning rates plus €500 billion cost of change
would cost €300/yr
1 Assuming all power costs get passed through to households 4 No carbon price2 CO2 price assumed of € 40/tCO2e 5 For all technologies, learning rate defined as capex improvement3 IEA WEO 2009 ‘450 Scenario’ assumptions for 2030, kept constant up to 2050 per doubling of cumulative installed capacity
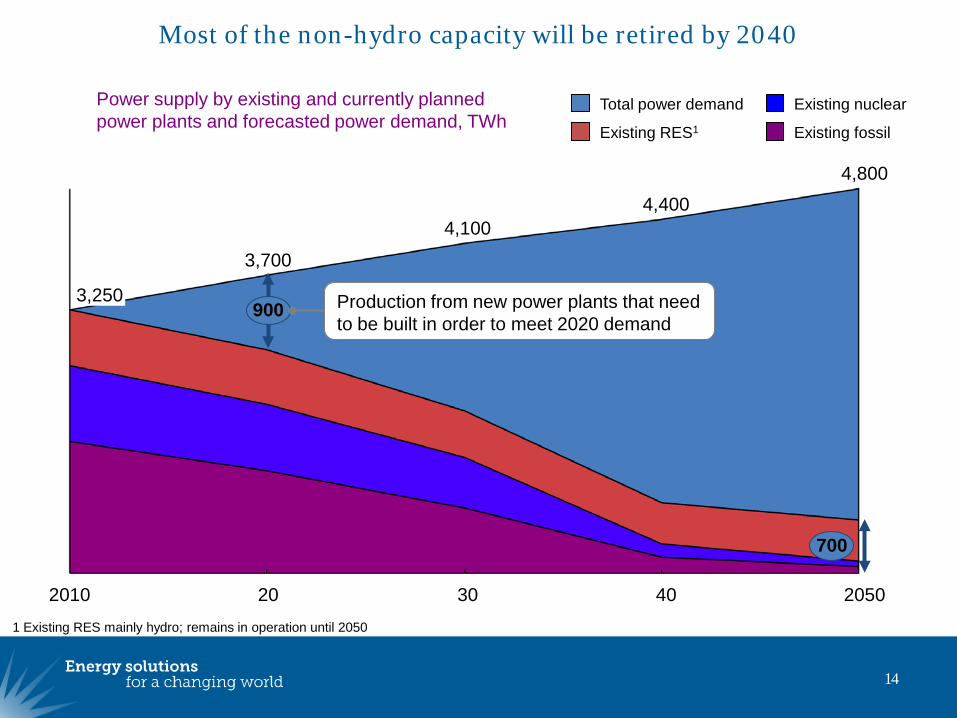
Most of the non-hydro capacity will be retired by 2040
14
Existing fossil
Existing nuclear
Existing RES1
Total power demand
4,800
3,700
205040
4,400
30
4,100
202010
3,250
700
900
Power supply by existing and currently planned power plants and forecasted power demand, TWh
Production from new power plants that need to be built in order to meet 2020 demand
1 Existing RES mainly hydro; remains in operation until 2050
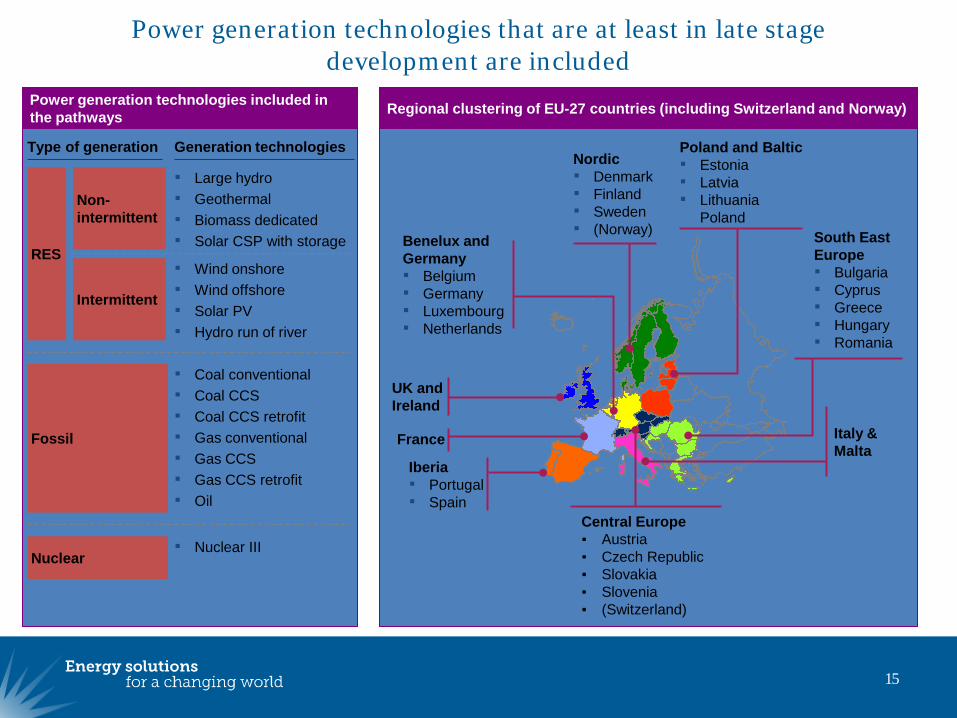
Power generation technologies that are at least in late stage development are included
15
Power generation technologies included in the pathways
Large hydro Geothermal Biomass dedicated Solar CSP with storage
Non-intermittent
RES
Intermittent
Wind onshore Wind offshore Solar PV Hydro run of river
Type of generation Generation technologies
Fossil
Coal conventional Coal CCS Coal CCS retrofit Gas conventional Gas CCS Gas CCS retrofit Oil
Nuclear Nuclear III
Regional clustering of EU-27 countries (including Switzerland and Norway)
Central Europe Austria Czech Republic Slovakia Slovenia (Switzerland)
Iberia Portugal Spain
Benelux and Germany Belgium Germany Luxembourg Netherlands
Poland and Baltic Estonia Latvia Lithuania Poland
South East Europe Bulgaria Cyprus Greece Hungary Romania
Italy &Malta
France
UK and Ireland
Nordic Denmark Finland Sweden (Norway)
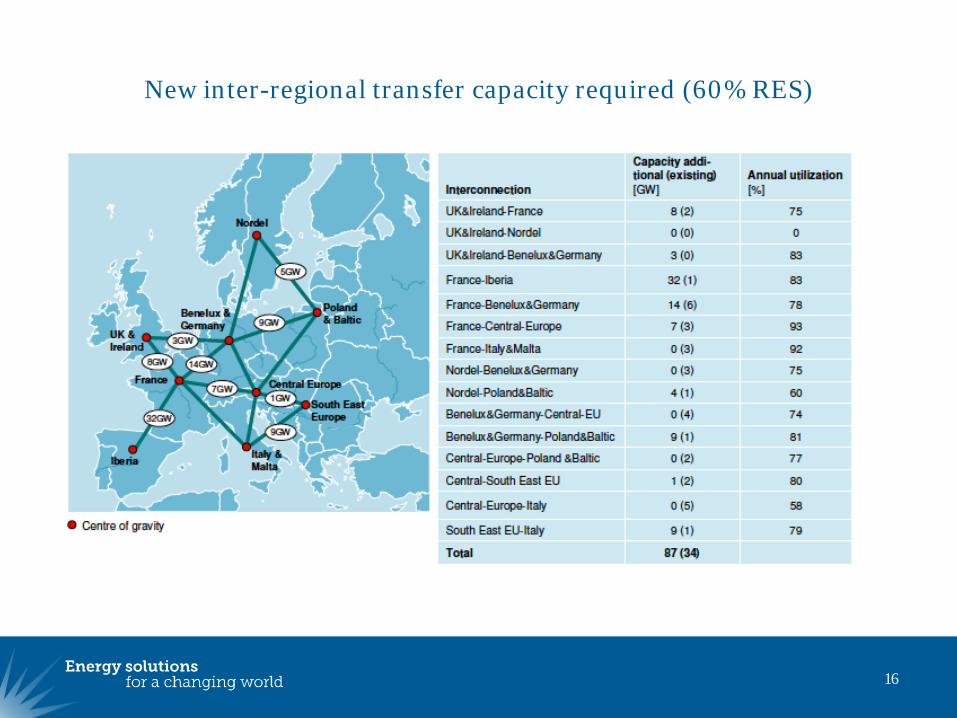
New inter-regional transfer capacity required (60% RES)
16
17
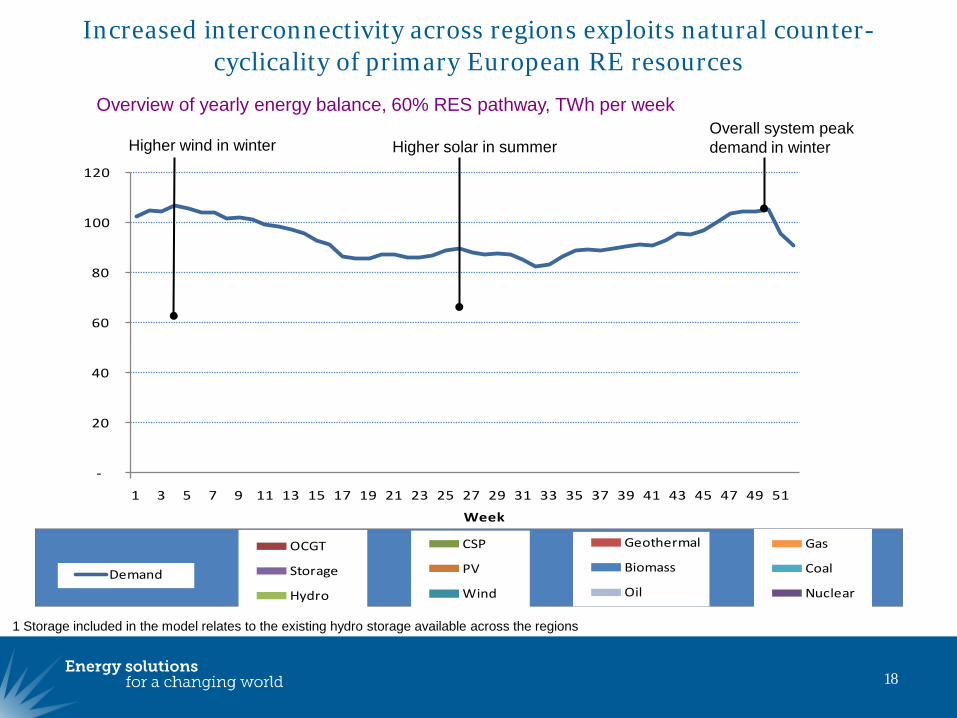
Increased interconnectivity across regions exploits natural counter-cyclicality of primary European RE resources
18
Higher solar in summer
Overview of yearly energy balance, 60% RES pathway, TWh per week
-
20
40
60
80
100
120
1 3 5 7 9 11 13 15 17 19 21 23 25 27 29 31 33 35 37 39 41 43 45 47 49 51
Week
Higher wind in winterOverall system peak demand in winterHigher solar in summer
Gas
Coal
Nuclear
Geothermal
Biomass
Oil
CSP
PV
Wind
OCGT
Storage
Hydro
Demand
1 Storage included in the model relates to the existing hydro storage available across the regions
19
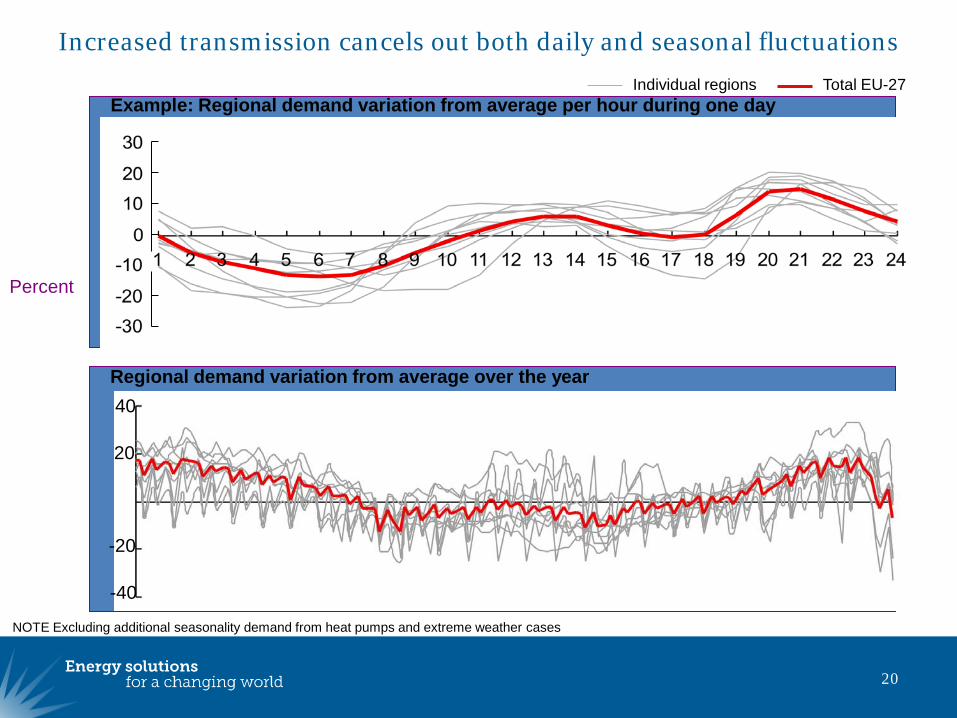
Increased transmission cancels out both daily and seasonal fluctuations
20
Example: Regional demand variation from average per hour during one day
Regional demand variation from average over the year
-40
-20
40
20
Percent
Total EU-27Individual regions
NOTE Excluding additional seasonality demand from heat pumps and extreme weather cases
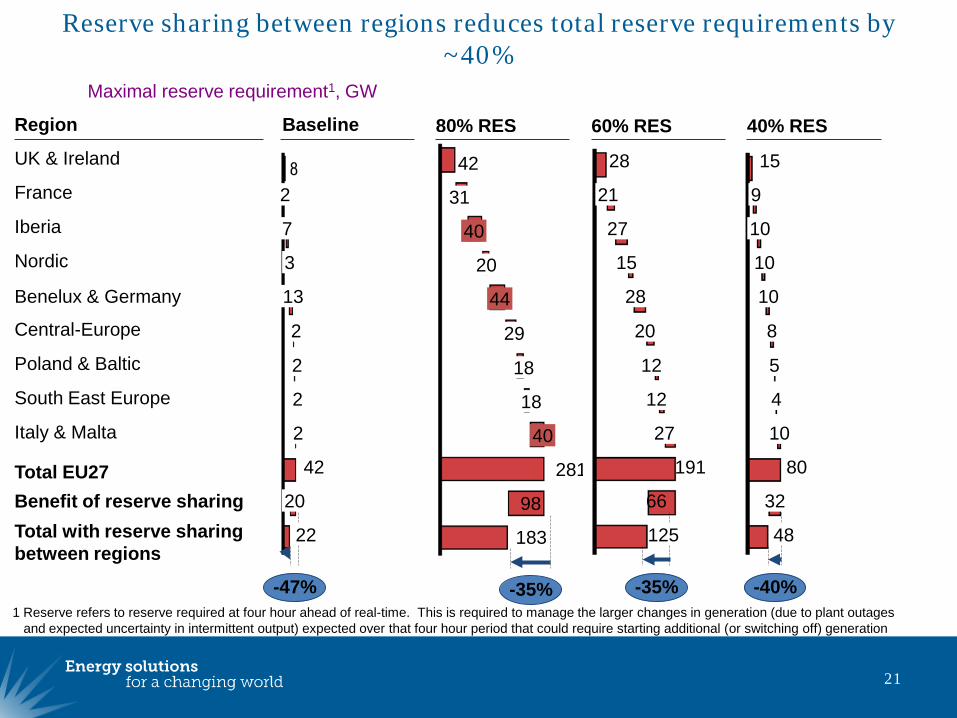
Reserve sharing between regions reduces total reserve requirements by ~40%
21
Region
UK & Ireland
France
Iberia
Nordic
Benelux & Germany
Central-Europe
Poland & Baltic
South East Europe
Italy & Malta
Total EU27
Maximal reserve requirement1, GW
Baseline 60% RES80% RES
Total with reserve sharing between regions
1 Reserve refers to reserve required at four hour ahead of real-time. This is required to manage the larger changes in generation (due to plant outages and expected uncertainty in intermittent output) expected over that four hour period that could require starting additional (or switching off) generation
183
98
281
40
18
18
29
44
20
40
31
42
-35%
125
191
27
12
12
20
28
15
27
21
28
66
-35%
42
2
20
2
7
3
13
2
2
2
22
-47%
Benefit of reserve sharing
80
5
8
32
10
10
10
10
9
15
48
4
-40%
40% RES
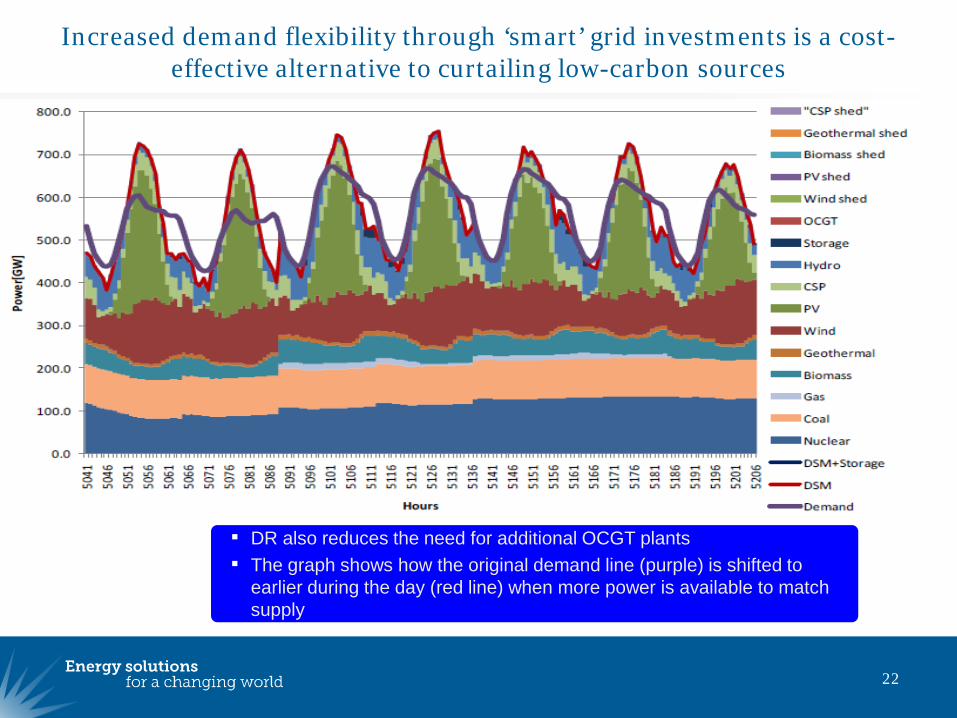
Increased demand flexibility through ‘smart’ grid investments is a cost-effective alternative to curtailing low-carbon sources
22
DR also reduces the need for additional OCGT plants The graph shows how the original demand line (purple) is shifted to
earlier during the day (red line) when more power is available to match supply
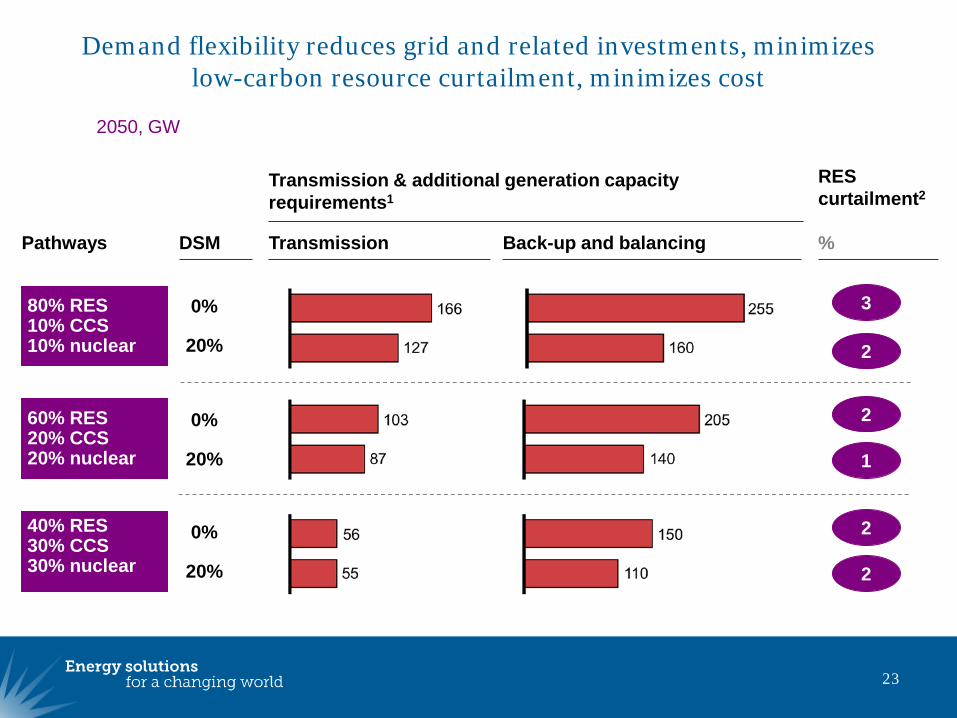
Demand flexibility reduces grid and related investments, minimizes low-carbon resource curtailment, minimizes cost
23
40% RES 30% CCS30% nuclear
80% RES 10% CCS10% nuclear
0%
20%
60% RES 20% CCS20% nuclear
0%
20%
0%
20%
Transmission & additional generation capacity requirements1
Pathways DSM Transmission Back-up and balancing
2050, GW
RES curtailment2
%
3
2
2
1
2
2
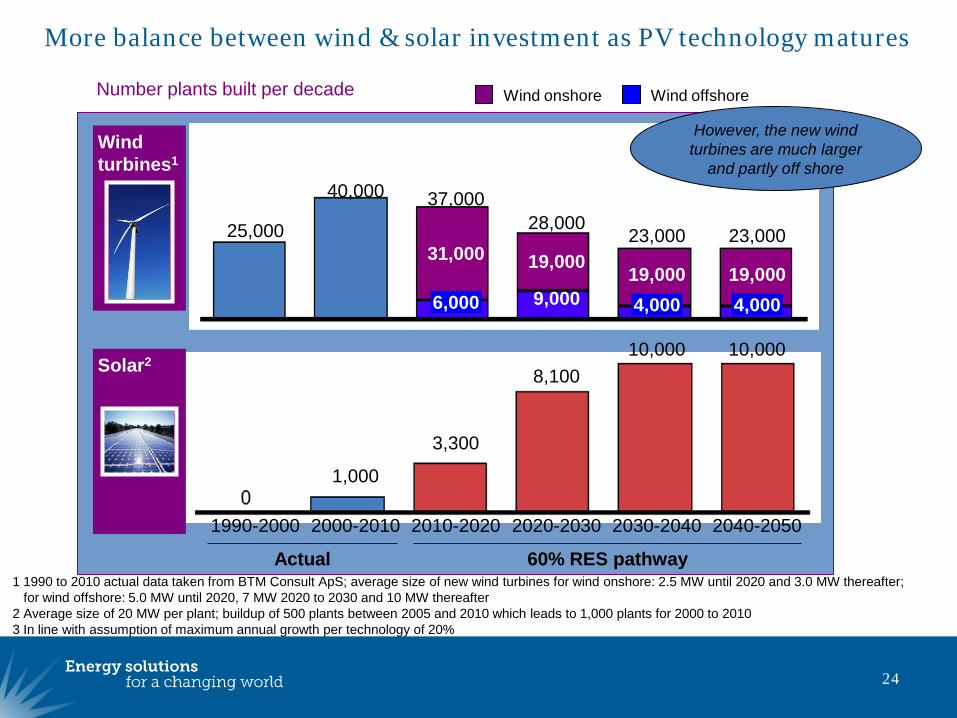
More balance between wind & solar investment as PV technology matures
24
Number plants built per decade
23,000
4,00019,000
23,000
4,00019,000
28,000
9,000
19,000
37,000
6,000
31,000
40,000
25,000
1 1990 to 2010 actual data taken from BTM Consult ApS; average size of new wind turbines for wind onshore: 2.5 MW until 2020 and 3.0 MW thereafter; for wind offshore: 5.0 MW until 2020, 7 MW 2020 to 2030 and 10 MW thereafter
2 Average size of 20 MW per plant; buildup of 500 plants between 2005 and 2010 which leads to 1,000 plants for 2000 to 20103 In line with assumption of maximum annual growth per technology of 20%
Wind offshoreWind onshore
2040-2050
10,000
2030-2040
10,000
2020-2030
8,100
2010-2020
3,300
2000-2010
1,000
1990-2000
Wind turbines1
Solar2
Actual 60% RES pathway
However, the new wind turbines are much larger
and partly off shore
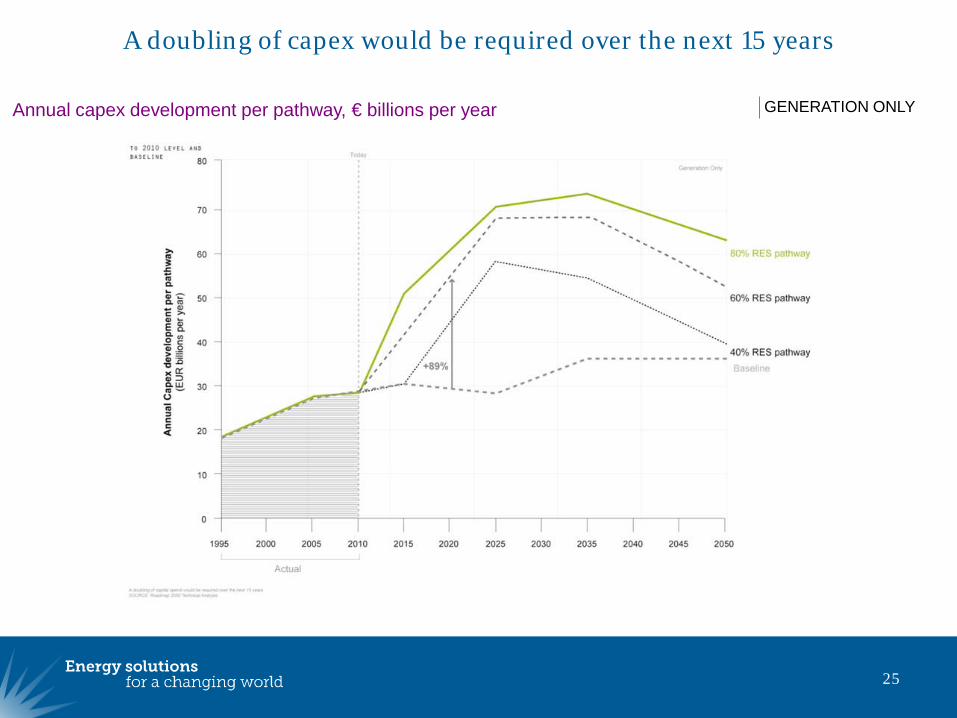
A doubling of capex would be required over the next 15 years
25
Annual capex development per pathway, € billions per year GENERATION ONLY
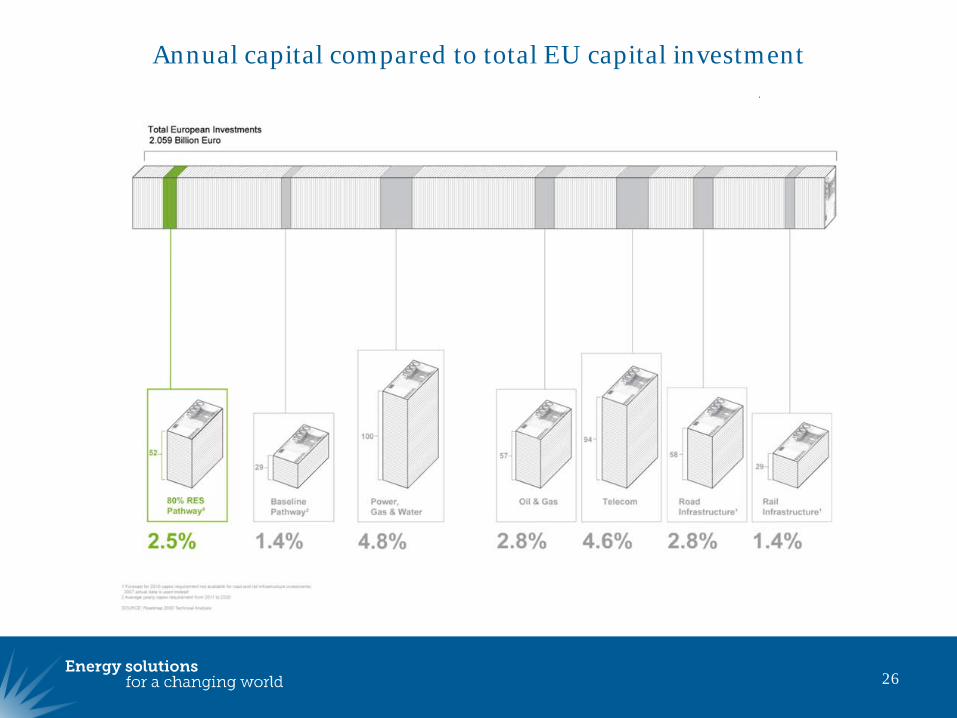
Annual capital compared to total EU capital investment
26
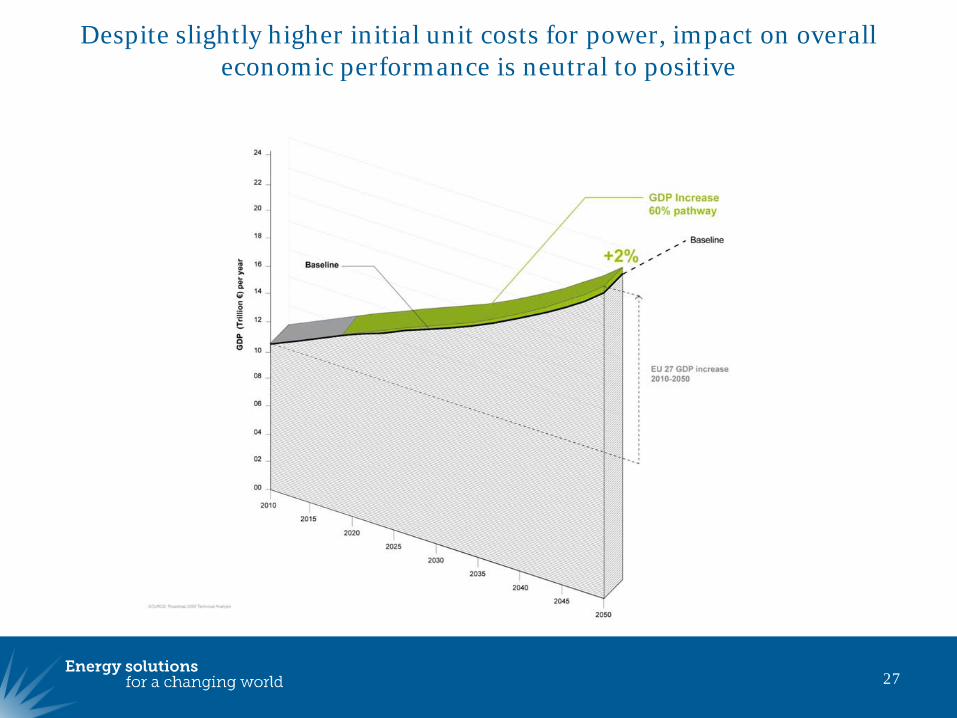
Despite slightly higher initial unit costs for power, impact on overall economic performance is neutral to positive
27
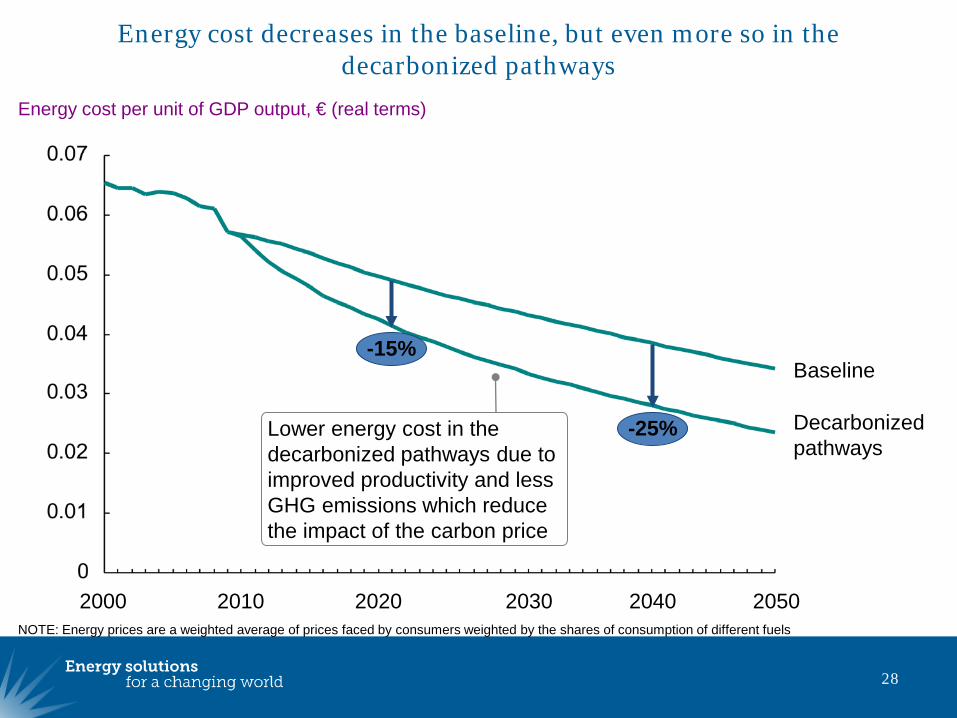
Energy cost decreases in the baseline, but even more so in the decarbonized pathways
28
NOTE: Energy prices are a weighted average of prices faced by consumers weighted by the shares of consumption of different fuels
Energy cost per unit of GDP output, € (real terms)
Decarbonizedpathways
Baseline
205020402030202020102000
-25%
-15%
Lower energy cost in the decarbonized pathways due to improved productivity and less GHG emissions which reduce the impact of the carbon price
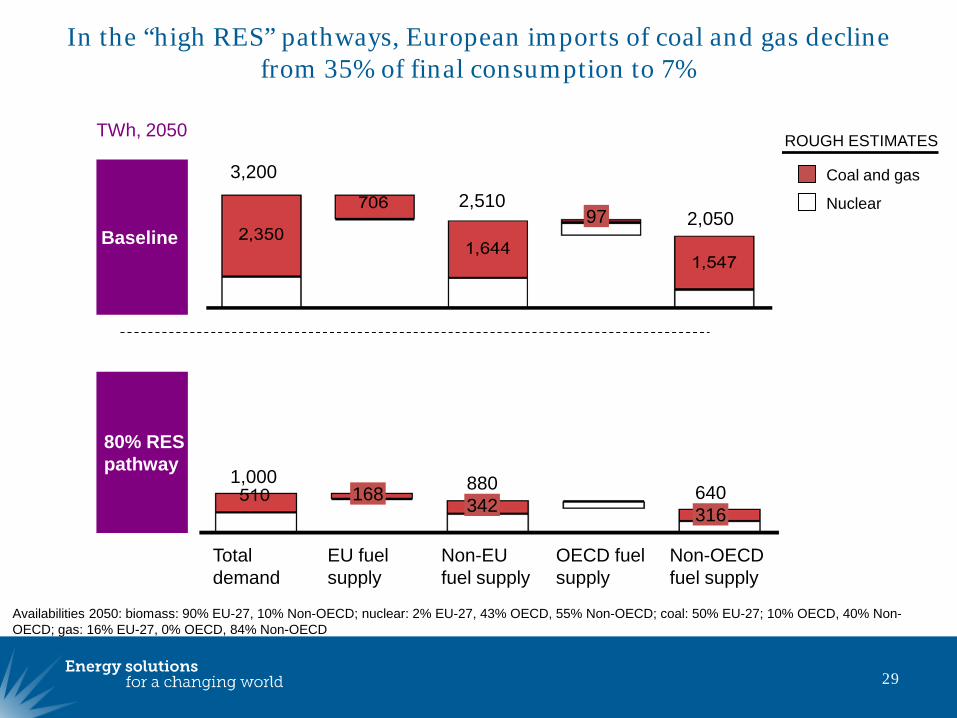
In the “high RES” pathways, European imports of coal and gas decline from 35% of final consumption to 7%
29
Availabilities 2050: biomass: 90% EU-27, 10% Non-OECD; nuclear: 2% EU-27, 43% OECD, 55% Non-OECD; coal: 50% EU-27; 10% OECD, 40% Non-OECD; gas: 16% EU-27, 0% OECD, 84% Non-OECD
TWh, 2050
80% RES pathway
Non-OECD fuel supply
640316
OECD fuel supply
Non-EU fuel supply
880342
EU fuel supply
168
Total demand
1,000
ROUGH ESTIMATES
Baseline2,05097
2,5103,200
Nuclear
Coal and gas
Key emerging challenges for the EU
30
• Step change in energy efficiency
• Technology commercialisation
• Creating strategic EU power network (wide-area integration + demand-side activation)
• The future of ETS, complementary measures and market reform
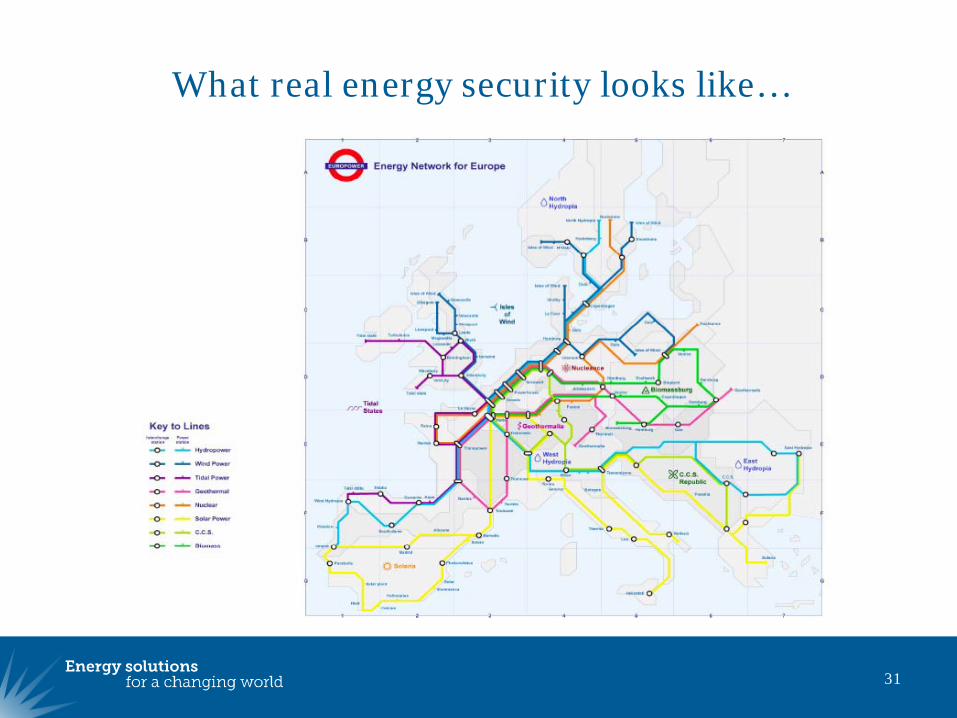
What real energy security looks like…
31
About RAP
The Regulatory Assistance Project (RAP) is a global, non-profit team of experts that focuses on the long-term economic and environmental sustainability of the power and natural gas sectors. RAP has deep expertise in regulatory and market policies that:
Promote economic efficiency Protect the environment Ensure system reliability Allocate system benefits fairly among all consumers
Learn more about RAP at www.raponline.org