Embed Size (px)
Citation preview

City of North Port, FL
Road and Drainage District
FY 2020 Non-Ad Valorem Assessment Methodology Final Report
June 26, 2019

June 26, 2019
Ms. Monica Bramble Assistant Public Works Director 1100 N. Chamberlain Blvd. North Port, FL 34286 Re: FY 2020 Non-Ad Valorem Assessment Methodology Final Report
Dear Ms. Bramble, Stantec is pleased to present the City of North Port with this Final Report of the Road and Drainage District Assessment Study that we conducted for the City. We appreciate the fine assistance provided by you and all the members of City Staff who participated in the project.
If you have any questions, please do not hesitate to contact Patrick Luce at (813) 443-5138 or me at (904) 247-0787.
Very truly yours,
Michael Burton Vice President, Financial Services
Phone: (904) 247-0787
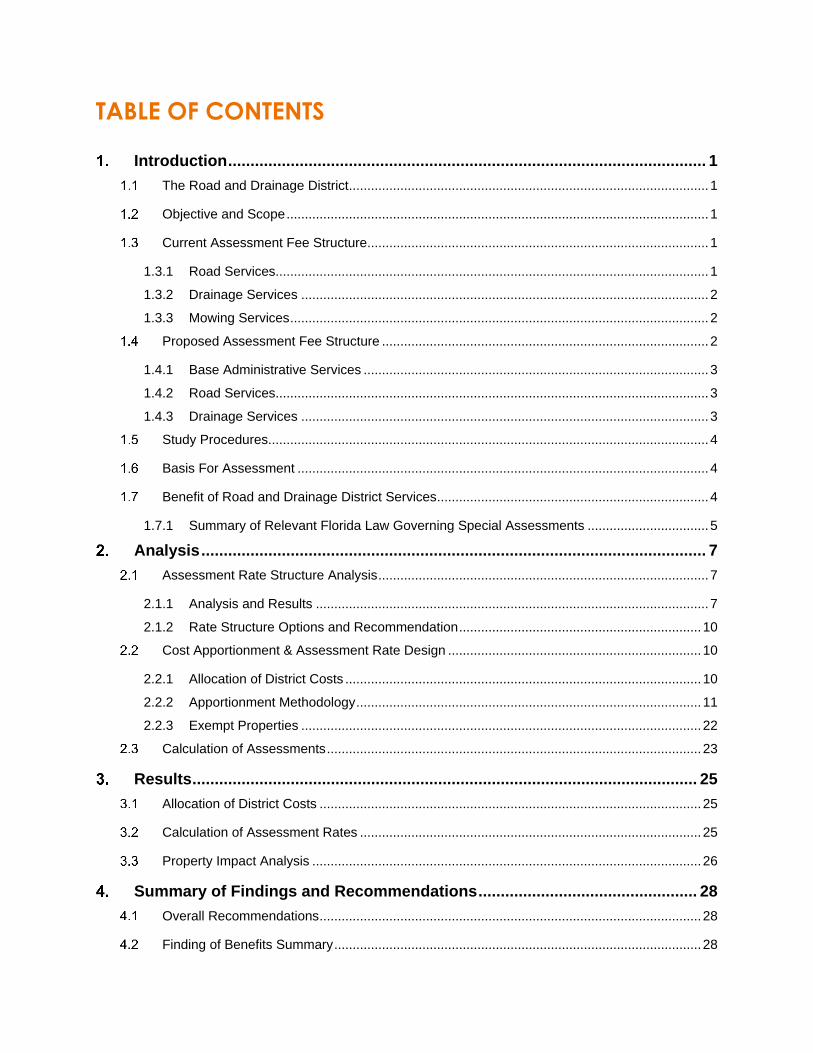
TABLE OF CONTENTS
Introduction ........................................................................................................... 1
The Road and Drainage District .................................................................................................. 1
Objective and Scope ................................................................................................................... 1
Current Assessment Fee Structure ............................................................................................. 1
1.3.1 Road Services...................................................................................................................... 1
1.3.2 Drainage Services ............................................................................................................... 2
1.3.3 Mowing Services .................................................................................................................. 2
Proposed Assessment Fee Structure ......................................................................................... 2
1.4.1 Base Administrative Services .............................................................................................. 3
1.4.2 Road Services...................................................................................................................... 3
1.4.3 Drainage Services ............................................................................................................... 3
Study Procedures........................................................................................................................ 4
Basis For Assessment ................................................................................................................ 4
Benefit of Road and Drainage District Services .......................................................................... 4
1.7.1 Summary of Relevant Florida Law Governing Special Assessments ................................. 5
Analysis ................................................................................................................. 7
Assessment Rate Structure Analysis .......................................................................................... 7
2.1.1 Analysis and Results ........................................................................................................... 7
2.1.2 Rate Structure Options and Recommendation .................................................................. 10
Cost Apportionment & Assessment Rate Design ..................................................................... 10
2.2.1 Allocation of District Costs ................................................................................................. 10
2.2.2 Apportionment Methodology .............................................................................................. 11
2.2.3 Exempt Properties ............................................................................................................. 22
Calculation of Assessments ...................................................................................................... 23
Results ................................................................................................................. 25
Allocation of District Costs ........................................................................................................ 25
Calculation of Assessment Rates ............................................................................................. 25
Property Impact Analysis .......................................................................................................... 26
Summary of Findings and Recommendations ................................................. 28
Overall Recommendations ........................................................................................................ 28
Finding of Benefits Summary .................................................................................................... 28

Rate Structure Analysis – Recommendations .......................................................................... 29
Cost Apportionment and Assessment Rate Design .................................................................. 29
Preliminary Assessment Roll .................................................................................................... 29
Appendix – Cost Allocation Analysis ........................................................................ 30

1. Introduction
City of North Port | Road and Drainage District Non-Ad Valorem Assessment Methodology Stantec | 1
INTRODUCTION
This report presents the results of an analysis to develop a recommended assessment methodology for the
North Port Road and Drainage District (District) Non-Ad Valorem Assessment Program. This study was
conducted by Stantec Consulting Services Inc. (Stantec), a firm that specializes in providing rate and
assessment consulting services to local governments.
THE ROAD AND DRAINAGE DISTRICT
The City of North Port provides road and drainage service throughout the North Port Road and Drainage
District. The primary sources of funding for the District are non-ad valorem assessments, allocated surtax
dollars that are derived from sales tax, and other miscellaneous revenues.
OBJECTIVE AND SCOPE
The objective of this study was to update the methodology for the District’s Road and Drainage
Assessments so that assessment rates recover the full cost requirement of providing road and drainage
service to properties within the District limits in proportion to the benefit received from the road and drainage
service provided by the District for Fiscal Year (FY) 2020 and subsequent years. As part of this study, we
further analyzed the assessment rates under various structure updates to find opportunities to enhance the
cost-benefit nexus under the District’s current level of service.
CURRENT ASSESSMENT FEE STRUCTURE
As of FY 2019, the current methodology defines road, drainage, and mowing services as the three primary
functions of the District and these services are translated into components for which a fee is developed and
applied to benefitting parcels. The current components of the Road and Drainage District Assessment are
described below.
1.3.1 Road Services
Road Administrative Services – Road administrative services include rights-of-way inspections,
infrastructure evaluations of roads systems, development plan review, contract administration, system
support services, and rights-of-way permit processing.
Base Road Services – Base Road services are performed on all arterial and collector roads. Services
include the repair of potholes and utility cuts, road shoulder maintenance, the rehabilitation of roads based
on priorities and criteria, maintenance of traffic control devices, bridges, landscape, and sidewalks, and
debris removal.

1. Introduction
City of North Port | Road and Drainage District Non-Ad Valorem Assessment Methodology Stantec | 2
Enhanced Road Services – Enhanced Road services are performed on all local roads. Services include
the repair of potholes and utility cuts, road shoulder and traffic control device maintenance, and the
rehabilitation of roads based on priorities and criteria. Work is performed by Department staff and through
contracted services.
1.3.2 Drainage Services
The drainage system components and services are as follows:
Drainage Administrative Services – Drainage administrative services include rights-of-way inspections,
infrastructure evaluations of drainage systems, development plan review, contract administration, system
support services, and rights-of-way permit processing.
Primary Drainage – The major waterways that receive rainwater from secondary drainage system
components and convey the rainwater out of the District to receiving waters. Services include water control
structure operations, maintenance, rehabilitation and replacement, and waterway, lake, pond, and creek
maintenance.
Secondary Drainage – The retention ditches and other drainage facilities that receive rainwater from the
tertiary drainage system components and convey the rainwater to primary drainage system components.
Services include retention ditch and outfall maintenance, rehabilitation and replacement, piping, and pipe
replacement.
Tertiary Drainage – The drainage swales and other drainage facilities that collect rainwater in developed
neighborhoods where it first falls and convey the rainwater to secondary drainage system components.
Services include swale and culvert maintenance, piping, pipe replacement, and culvert box installation and
replacement.
1.3.3 Mowing Services
Mowing Administrative Services – Mowing administrative services include landscaping contract
management and system support services.
Right-of-Way Mowing Services – This service includes mowing of rights-of-way on unimproved properties
by Department staff and service contracts within the City. The Department maintains a proactive schedule
of all rights-of-way mowing.
PROPOSED ASSESSMENT FEE STRUCTURE
The level of services provided by the District has evolved over time and during the review of its current
methodology, modifications to the fee structure were discussed and evaluated to continue aligning the
assessment fees charged to the benefit received by properties throughout the City. During this fee structure
analysis, two updates were recommended:

1. Introduction
City of North Port | Road and Drainage District Non-Ad Valorem Assessment Methodology Stantec | 3
1. Develop one overall administration charge that is applied equally per parcel.
2. Absorb mowing services into road and drainage service costs and assessments.
Currently each service has an individual administration charge. The road and drainage administrative
charges scale based upon equivalent units derived by trip generation rates and land area respectively,
while the mowing administrative charge is applied per parcel. The proposed assessment fee structure
establishes one overall administration charge that includes only costs such as billing, customer service,
property appraiser fees, and methodology studies that will be allocated equally per parcel. All other
administration costs are absorbed into road and drainage service costs and assessments.
The current benefits of mowing are clear line-of-sight for traffic safety, road signs, and hazards, and
improved stormwater drainage flow capabilities. As such, the right-of-way mowing benefits the safety of
the road network and the hydraulic function of the drainage network. This determination led to the proposed
structure absorbing the cost associated with mowing services into the road and drainage service
assessments.
With these updates, the proposed components of the Road and Drainage District Assessment are
described below.
1.4.1 Base Administrative Services
Base administrative services are classified as the core support functions spread across all services
provided by the Road and Drainage District. These include non-scalable costs such as billing, customer
service, property appraiser fees, and methodology studies that will be allocated equally per parcel.
1.4.2 Road Services
Base Road Services – Base Road services are performed on all arterial and collector roads. Services
include the repair of potholes and utility cuts, road shoulder maintenance, the rehabilitation of roads based
on priorities and criteria, maintenance of traffic control devices, bridges, landscape, and sidewalks, debris
removal, and clear line-of-sight for traffic safety, road signs, and hazards.
Enhanced Road Services – Enhanced Road services are performed on all local roads. Services include
the repair of potholes and utility cuts, road shoulder and traffic control device maintenance, the rehabilitation
of roads based on priorities and criteria, and clear line-of-sight for traffic safety, road signs, and hazards.
Work is performed by Department staff and through contracted services.
1.4.3 Drainage Services
Primary Drainage – The major waterways that receive rainwater from secondary drainage system
components and convey the rainwater out of the District to receiving waters. Services include water control
structure operations, maintenance, rehabilitation and replacement, and waterway, lake, pond, and creek
maintenance.

1. Introduction
City of North Port | Road and Drainage District Non-Ad Valorem Assessment Methodology Stantec | 4
Secondary Drainage – The retention ditches and other drainage facilities that receive rainwater from the
tertiary drainage system components and convey the rainwater to primary drainage system components.
Services include retention ditch and outfall maintenance, rehabilitation and replacement, piping, and pipe
replacement.
Tertiary Drainage – The drainage swales and other drainage facilities that collect rainwater in developed
neighborhoods where it first falls and convey the rainwater to secondary drainage system components.
Services include swale and culvert maintenance including right-of-way mowing, piping, pipe replacement,
and culvert box installation and replacement.
STUDY PROCEDURES
During this study we identified the full FY 2020 cost requirements for the provision of road and drainage
services to be provided by the District. To initiate our analysis, we obtained the Public Works Department’s
budgeted financial information, including the FY 2020 budgeted operating and capital improvement
expenditures. To determine the annual cost and corresponding revenue requirements of road and drainage
service, we evaluated each line item of cost in the Public Works Budget and determined with Public Works
staff what percentage of the cost of each line item is associated with services for the three major functions
performed by the District: administration, roads, and drainage. The costs allocated to each of the road and
drainage functions were then further apportioned to the major system elements of each service. Once the
allocations and apportionments were complete, a Road and Drainage Assessment rate structure was
developed along with specific Road and Drainage Assessment rates and a preliminary assessment roll, the
results of which are presented herein.
BASIS FOR ASSESSMENT
The development of a non-ad valorem assessment for road and drainage service requires that the service
for which properties are to be assessed confer a special benefit upon the property burdened by the special
assessment. Simply stated, there must be a logical relationship between the service provided and the
benefit to real property assessed for the service.
In addition to the special benefit requirement, the costs associated with providing the service must be
reasonably apportioned to the properties that receive a benefit from the services in proportion to the benefit
received. Therefore, the recommended Road and Drainage Assessments calculated in this study were
developed such that the costs of providing road and drainage services will be recovered through
assessments to properties in proportion to the benefit received from each of the two components of service:
roads and drainage.
BENEFIT OF ROAD AND DRAINAGE DISTRICT SERVICES
This section describes the District services and presents a discussion of relevant Florida Law regarding
Special Non-Ad Valorem Assessments, followed by an explanation of how Florida Law has been applied

1. Introduction
City of North Port | Road and Drainage District Non-Ad Valorem Assessment Methodology Stantec | 5
to the determination of benefit and the apportionment of annual revenue requirements of the Road and
Drainage Assessment to benefitting properties.
1.7.1 Summary of Relevant Florida Law Governing Special Assessments
Special non-ad valorem assessments are a revenue source available to local governments in Florida to
fund operations and maintenance expenses and capital improvements for essential services such as roads,
drainage, fire/rescue services, utilities, etc. Florida case law has established two requirements for the
imposition of a non-ad valorem special assessment. These two requirements have become known as the
two-pronged test. They are 1) the property assessed must derive a special benefit from the service
provided, and 2) the assessment must be fairly and reasonably apportioned among the properties that
receive the special benefit.
The Road and Drainage Assessments recommended in this report comply with both prongs of the two-
pronged test as follows.
1.7.1.1 Special Benefit
Special benefit, the first prong of the two-pronged test, is conferred upon properties within the District by
the provision road and drainage services, including related administrative services, and the availability and
use of facilities or improvements by owners and occupants of such property as follows:
Road – In considering special benefit, it is important to consider that the roads within the District are a
network. All parts of the network of roads are necessary for residential properties to be accessible and for
commercial properties to be accessed by residential property owners in the District. If any portion of the
road network were to be removed or otherwise made not available, 1) residential properties would have
diminished or no accessibility, and 2) accessibility to commercial properties by residents of the District
would be diminished or eliminated. Therefore, it is proper to conclude that all properties receive a special
benefit from the road network by the availability of the road network and the accessibility thus provided to
and from their property by the entire road network.
Drainage – Much like the roads within the District, it is important to consider that the drainage system within
the District is a network. Like the road network, if any portion of the drainage network were to be removed
or otherwise made not available, stormwater would not be conveyed out of the District, flooding would
occur, access to properties would be blocked, and damage would likely occur to many properties. Most
properties receive a special benefit from the drainage network by the availability of the network to safely
detain, retain, convey, or treat drainage discharged from properties within the District. Under this
description, it was noted that the new costs of mowing performed on all swales in the city will be included
in the drainage assessment as this service is necessary for the drainage system to work effectively.
1. Introduction
City of North Port | Road and Drainage District Non-Ad Valorem Assessment Methodology Stantec | 6
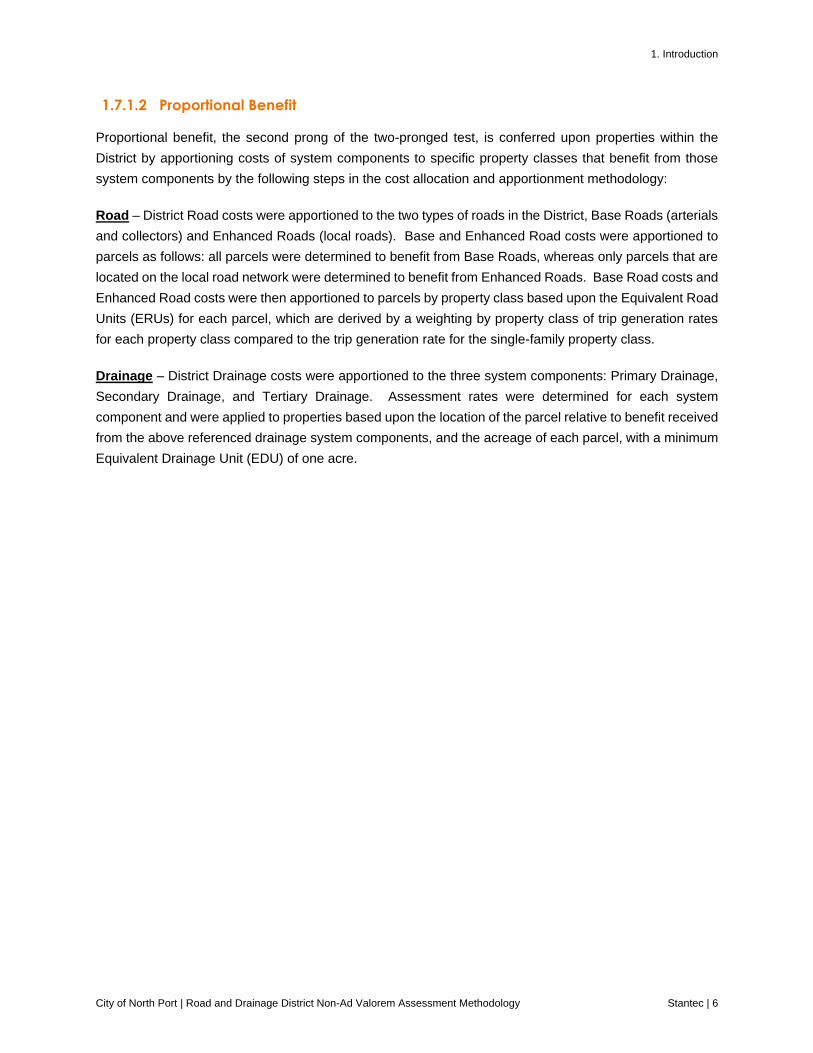
1.7.1.2 Proportional Benefit
Proportional benefit, the second prong of the two-pronged test, is conferred upon properties within the
District by apportioning costs of system components to specific property classes that benefit from those
system components by the following steps in the cost allocation and apportionment methodology:
Road – District Road costs were apportioned to the two types of roads in the District, Base Roads (arterials
and collectors) and Enhanced Roads (local roads). Base and Enhanced Road costs were apportioned to
parcels as follows: all parcels were determined to benefit from Base Roads, whereas only parcels that are
located on the local road network were determined to benefit from Enhanced Roads. Base Road costs and
Enhanced Road costs were then apportioned to parcels by property class based upon the Equivalent Road
Units (ERUs) for each parcel, which are derived by a weighting by property class of trip generation rates
for each property class compared to the trip generation rate for the single-family property class.
Drainage – District Drainage costs were apportioned to the three system components: Primary Drainage,
Secondary Drainage, and Tertiary Drainage. Assessment rates were determined for each system
component and were applied to properties based upon the location of the parcel relative to benefit received
from the above referenced drainage system components, and the acreage of each parcel, with a minimum
Equivalent Drainage Unit (EDU) of one acre.

2. Analysis
City of North Port | Road and Drainage District Non-Ad Valorem Assessment Methodology Stantec | 7
ANALYSIS
This section presents the basis, analysis, and results of 1) the assessment rate structure analysis, and 2)
the calculation of FY 2020 Road and Drainage Assessments designed to recover the full cost of providing
road and drainage services in the District. The methodology used results in assessments to individual
properties that are in proportion to the benefit received by the availability of road and drainage services to
the properties to be assessed.
The analysis was conducted in two work elements as follows:
Work Element 1 – Assessment Rate Structure Analysis
This work element consisted of the development of multiple updated assessment rate structure options and
evaluation of the relative impacts of each option compared to the FY 2019 Road and Drainage Assessment.
Work Element 2 – Cost Apportionment and Assessment Rate Design
This work element consisted of the development of a cost apportionment methodology, specific assessment
rates, and an assessment roll of all properties within the District. The assessment was developed to recover
the revenue requirement for FY 2020 so that the burden of the assessment is proportional to the benefit
received from the services provided by all property classes based upon the proposed structure from Work
Element 1. The analysis and results of each work element are presented in the following sections.
ASSESSMENT RATE STRUCTURE ANALYSIS
This section presents the results of the analysis conducted in this work element and our recommendations
based upon those results.
2.1.1 Analysis and Results
To develop the Road and Drainage Assessments, it was first necessary to determine the components of
the District to be incorporated into the assessment. Each one of the District’s services and subcomponents
were considered.
2.1.1.1 Administrative Services
Currently each service has individual administration charges. The road and drainage administrative
charges scale based upon equivalent units derived by trip generation rates and land area respectively,
while the mowing administrative charge is applied per parcel. The proposed assessment fee structure
establishes one overall administration charge that includes only costs that would be proportionately
beneficial per parcel such as billing, customer service, property appraiser fees, and methodology studies.
All other previous administration costs are absorbed into road and drainage service costs and assessments.

2. Analysis
City of North Port | Road and Drainage District Non-Ad Valorem Assessment Methodology Stantec | 8
2.1.1.2 Road Services
The road system network maintained by the District includes approximately 40 miles of arterial roads, 73
miles of collector roads, and 703 miles of local roads. An arterial road or arterial thoroughfare is a high-
capacity urban road. The primary function of an arterial road is to deliver traffic from collector roads to
freeways or expressways, and between urban centers at the highest level of service possible. A collector
road or distributor road is a low-to-moderate-capacity road which serves to move traffic from local streets
to arterial roads and to provide a link between through traffic movement and direct private property access
functions. A local road provides access to residential properties. Under the current structure, arterial and
collector roads are considered part of the base road component while local roads are considered part of
enhanced road component.
The District provides base road services such as repair of potholes and utility cuts, road shoulder
maintenance, road rehabilitation, maintenance of traffic control devices, bridges, landscape, and sidewalks,
and debris removal. This benefit is conferred upon all parcels given the access to an integrated road
network that allows each property owner the ability to travel throughout the City. The District provides
enhanced road services such as repair of potholes and utility cuts, road shoulder and traffic control device
maintenance, and road rehabilitation. There is a benefit conferred from enhanced road services only upon
parcels that are located on the local road network. For FY 2020, the proposed assessment fee structure
absorbs mowing services related to clearing the line-of-sight for traffic safety, road signs, and hazards into
the base and enhanced road services.
For road services, an apportionment methodology that uses trip generation rates by property uses and
building improvement sizes (or equivalent) to allocate benefits is typical. The current methodology utilizes
an analysis of the number of trips to be generated by each property use based on the trip generation
information contained in the Institute of Transportation Engineers (ITE) manual (9th edition).
Consideration was given to a new method of apportioning road costs. The first option discussed was the
potential for the City of North Port to pursue a comprehensive study to localize the trip generations by land
use type. This approach would follow the same methodology outlaid in the ITE Trip Generation Manual but
would localize the data. It was noted that a study of this size could potentially be costly and take a significant
amount of time but would provide a more tailored methodology for the community. The second option
reflected a departure from trip generation rates and movement towards an application of a fee to properties
based on land use type and land development code. This approach would leverage the zoning departments
efforts but would reflect a brand new methodology with potentially large customer bill impacts.
For the FY 2020 proposed rate structure, no changes were recommended for the application of the base
road and enhanced road assessment components and the ITE Trip Generation Manual is still utilized for
the determination of property trips and cost apportionment. However, it should be noted that since the last
methodology study, a new ITE manual (10th edition) has been published and is used as the basis for
apportioning road costs in this analysis.

2. Analysis
City of North Port | Road and Drainage District Non-Ad Valorem Assessment Methodology Stantec | 9
2.1.1.3 Drainage Services
The drainage system network maintained by the District includes approximately 79.1 miles of waterways
and creeks, 132 miles of retention ditches and outfalls, and 1,613 miles of swales. The major ditches,
waterways, and creeks that receive rainwater from secondary drainage system components and convey
the rainwater out of the District to receiving waters represent the primary drainage system. The secondary
system is comprised of retention ditches and other drainage facilities that receive rainwater from the tertiary
drainage system components and convey the rainwater to primary drainage system components. The
tertiary system refers to the drainage swales and other drainage facilities that collect rainwater in developed
neighborhoods where it first falls and convey the rainwater to secondary drainage system components.
The District provides repair and maintenance services to the City’s waterways, water control structures,
drainage pipes, retention ponds, and swales, as well as services to enhance the City’s drainage hydraulic
functionality and management of aquatic weed vegetation. For FY 2020, the proposed assessment fee
structure absorbs mowing services related to maintenance of swales into tertiary drainage services. The
mowing level of service will be as follows: arterials and collectors mowed eight times a year, local roads six
times a year, and swales two times a year.
The drainage system within the District operates as a network in which the primary, secondary, and tertiary
systems flow cohesively. If any portion of the drainage network were to be removed or otherwise
obstructed, stormwater would not be conveyed out of the district, flooding would occur, access to properties
would be blocked, and damage would likely occur to many properties. Most properties receive a special
benefit from the City’s drainage network for its availability to safely detain, retain, convey, or treat drainage
discharged from properties within the District. The primary methodology of apportioning drainage costs is
based on land area.
For the FY 2020 proposed rate structure, no changes were recommended for the application of the primary,
secondary, and tertiary assessment components and land area is still utilized for the determination of
property cost apportionment.
2.1.1.4 Mowing Services
The District currently provides right-of-way mowing on undeveloped parcels. It provides a level of service
in which arterials and collectors are mowed eight times a year, local roads six times a year, and swales two
times a year. Currently mowing fees are charged equally per unimproved parcel. As such, a standard lot
with 80 feet of frontage pays the same mowing assessment fee as a large lot with 1,000 feet of frontage.
For further equity enhancement, consideration was given to apportioning this fee based on a property’s
linear feet of frontage as opposed to equally for all vacant parcels.
It was determined that the current benefits of mowing services provided by the District are clear line-of-
sight for traffic safety, road signs, and hazards, and improved stormwater drainage flow capabilities. As
such, the right-of-way mowing benefits the safety of the road network and the hydraulic functionality of the
drainage network. With this understanding of benefit, a proposed update to the assessment rate structure
was to absorb mowing services into the road and drainage assessments. It should be noted that under this
approach, an additional level of service would be incurred as the District would mow all parcels, vacant and

2. Analysis
City of North Port | Road and Drainage District Non-Ad Valorem Assessment Methodology Stantec | 10
developed, to benefit the safety of the road network and the hydraulic functionality of the drainage network.
For the FY 2020 proposed assessment fee structure, mowing services were absorbed into the road and
drainage assessments.
2.1.2 Rate Structure Options and Recommendation
Following the assessment of the in-place services and service components within the District, the following
options were evaluated:
• Consolidate administrative charges in the road, drainage, and mowing assessment structure and
develop one administrative charge that encompasses only administrative expenses that apply to
all parcels, and
• Apply one of the following methodologies to the mowing services:
o Option 1 – Absorb mowing services into road and drainage assessments
o Option 2 – Retain the mowing charge of vacant parcels and assess by linear feet of
frontage
o Option 3 – Retain the mowing charge of vacant parcels and assess by parcel (current)
The FY 2020 recommended rate structure is option 1, to apply one administrative charge per parcel and
absorb mowing services into road and drainage. This approach would result in non-scalable costs such as
billing, customer service, property appraiser fees, and methodology studies to be allocated equally per
parcel. Effectively costs that do not fluctuate by trips generated or the size of the parcel would be recovered
by a flat fee charged equally to all parcels benefitting from the administrative services provided by the
District. Further, this option acknowledges that the mowing service provided by the district is for the
enhancement of the road and drainage networks and the benefits are applied to the parcels which benefit
from those networks.
COST APPORTIONMENT & ASSESSMENT RATE DESIGN
This section presents the analysis and the results conducted in this work element and our recommendations
based upon those results.
2.2.1 Allocation of District Costs
This section presents the methodology used to allocate District costs in the development of the Road and
Drainage Assessments.
2.2.1.1 Allocation to Primary Functions
The FY 2020 Road and Drainage District Budget was used as the basis for allocating District costs to road
and drainage. This allocation resulted in a FY 2020 Road and Drainage Assessment Revenue Requirement
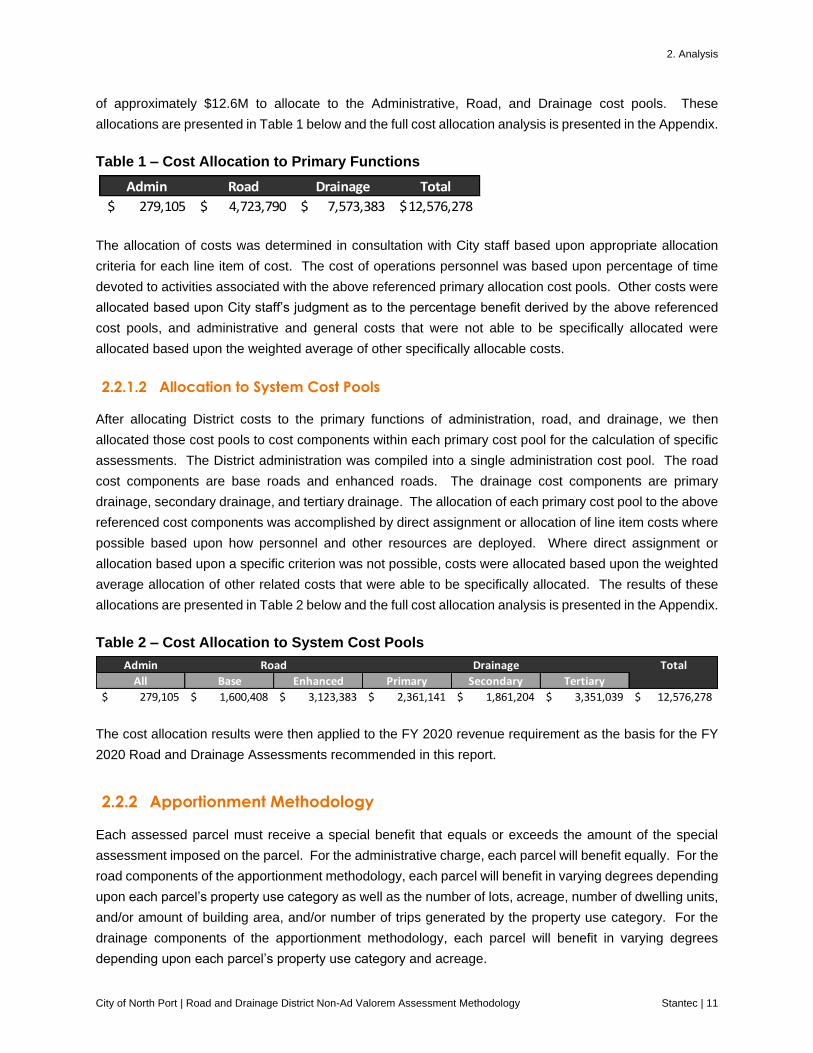
2. Analysis
City of North Port | Road and Drainage District Non-Ad Valorem Assessment Methodology Stantec | 11
of approximately $12.6M to allocate to the Administrative, Road, and Drainage cost pools. These
allocations are presented in Table 1 below and the full cost allocation analysis is presented in the Appendix.
Table 1 – Cost Allocation to Primary Functions
The allocation of costs was determined in consultation with City staff based upon appropriate allocation
criteria for each line item of cost. The cost of operations personnel was based upon percentage of time
devoted to activities associated with the above referenced primary allocation cost pools. Other costs were
allocated based upon City staff’s judgment as to the percentage benefit derived by the above referenced
cost pools, and administrative and general costs that were not able to be specifically allocated were
allocated based upon the weighted average of other specifically allocable costs.
2.2.1.2 Allocation to System Cost Pools
After allocating District costs to the primary functions of administration, road, and drainage, we then
allocated those cost pools to cost components within each primary cost pool for the calculation of specific
assessments. The District administration was compiled into a single administration cost pool. The road
cost components are base roads and enhanced roads. The drainage cost components are primary
drainage, secondary drainage, and tertiary drainage. The allocation of each primary cost pool to the above
referenced cost components was accomplished by direct assignment or allocation of line item costs where
possible based upon how personnel and other resources are deployed. Where direct assignment or
allocation based upon a specific criterion was not possible, costs were allocated based upon the weighted
average allocation of other related costs that were able to be specifically allocated. The results of these
allocations are presented in Table 2 below and the full cost allocation analysis is presented in the Appendix.
Table 2 – Cost Allocation to System Cost Pools
The cost allocation results were then applied to the FY 2020 revenue requirement as the basis for the FY
2020 Road and Drainage Assessments recommended in this report.
2.2.2 Apportionment Methodology
Each assessed parcel must receive a special benefit that equals or exceeds the amount of the special
assessment imposed on the parcel. For the administrative charge, each parcel will benefit equally. For the
road components of the apportionment methodology, each parcel will benefit in varying degrees depending
upon each parcel’s property use category as well as the number of lots, acreage, number of dwelling units,
and/or amount of building area, and/or number of trips generated by the property use category. For the
drainage components of the apportionment methodology, each parcel will benefit in varying degrees
depending upon each parcel’s property use category and acreage.
Admin Road Drainage Total
279,105$ 4,723,790$ 7,573,383$ 12,576,278$
Admin Total
All Base Enhanced Primary Secondary Tertiary
279,105$ 1,600,408$ 3,123,383$ 2,361,141$ 1,861,204$ 3,351,039$ 12,576,278$
Road Drainage

2. Analysis
City of North Port | Road and Drainage District Non-Ad Valorem Assessment Methodology Stantec | 12
2.2.2.1 Road Apportionment Methodology
For road maintenance services, an apportionment methodology that uses trip generation rates by property
uses and building improvement sizes (or equivalent) to allocate benefits is typical. An analysis of the
number of trips to be generated by each property use is based on the trip generation information contained
in the Institute of Transportation Engineers (ITE) manual (10th edition).
Calculation of Equivalent Road Units (ERUs) – The average weekday trip generation per day for single
family residential uses is 9.44 trips per day per dwelling unit. The Road Apportionment Methodology
apportions the road maintenance service costs using an equivalent road unit (ERU) based on the average
number of trips generated by each property class each day compared to the average number of trips
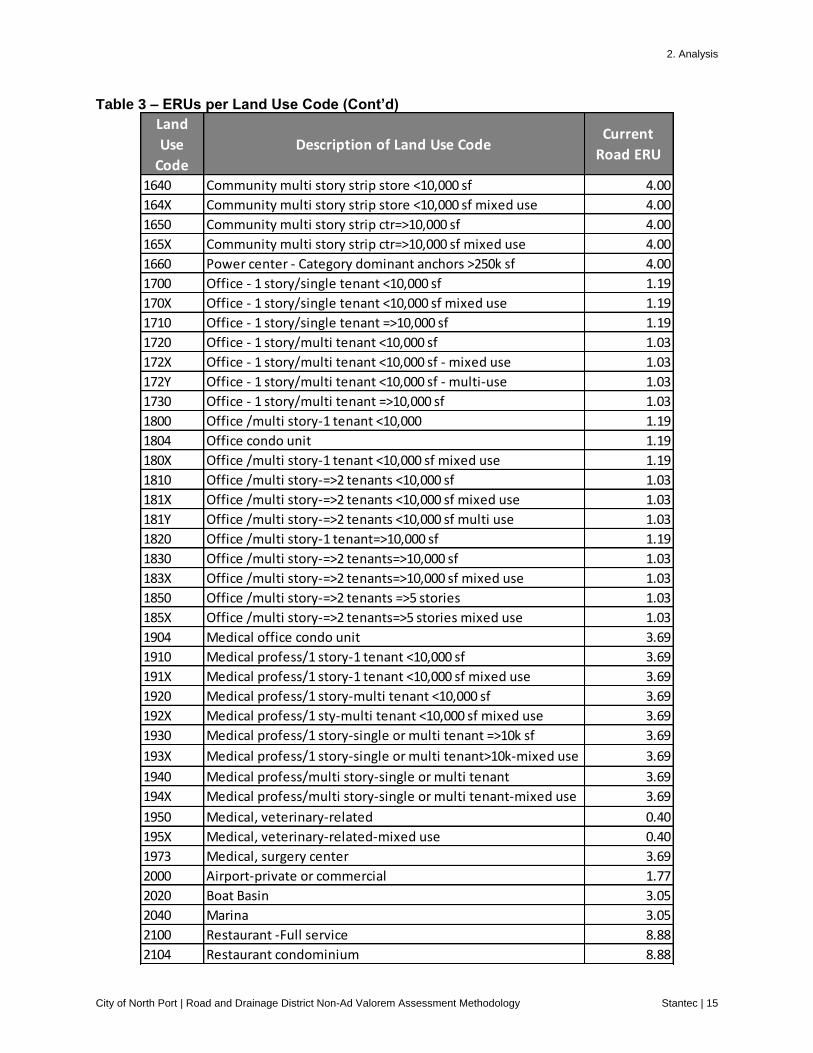
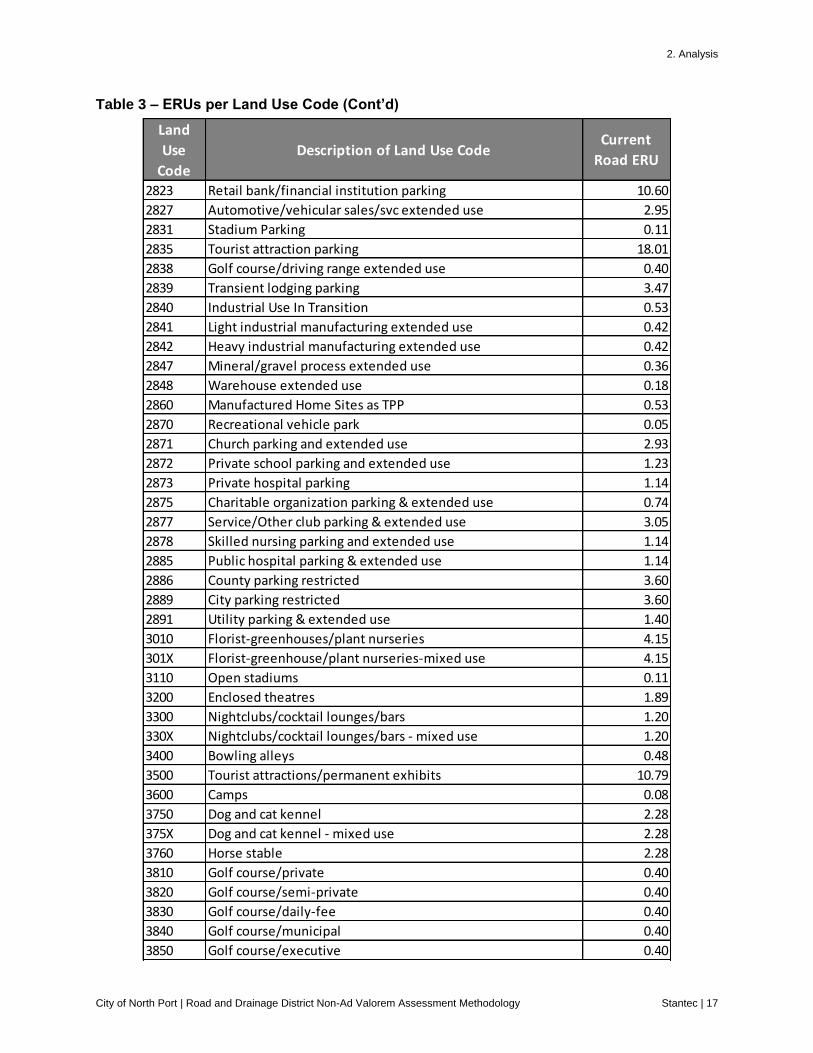
generated by a single-family dwelling unit per day. Table 3 on the following pages shows the ERUs by
property use that were the basis for apportioning the base and enhanced road costs to each benefited
parcel of property.

2. Analysis
City of North Port | Road and Drainage District Non-Ad Valorem Assessment Methodology Stantec | 13
Table 3 – ERUs per Land Use Code
Land
Use
Code
Description of Land Use CodeCurrent
Road ERU
0000 Residential vacant site 1.00
0001 Res-New Construction Not Substantially Complete 1.00
0002 MH Rental Space 1.00
0004 Vacant Condo Lot/Unbuilt Unit 0.78
0010 Vacant Multi-family 0.78
010X Single Family & Other Bldg 1.00
031X Multi-family 10 - 19 units - mixed use 0.78
032X Multi-family 20 - 49 units - mixed use 0.78
035X Multi-family 50 - 99 units - mixed use 0.78
039X Multi-family => 100 units, mixed use 0.78
060X CCRC -Retirement Homes - Independent Living mixed use 0.42
081X Multiple Single Fam Mixed 1.00
082X 2-Family & Other Bldg 1.00
082Y Multiple 2 Family Bldgs 1.00
083X 3 Family & Other Bldg 0.78
084X 4-Family & Other Bldg 0.78
089X Multi-family apts 5-9 units-mixed use 0.78
0100 Single Family Detached 1.00
0101 Single Family Attached - End Unit 1.00
0102 Single Family Attached - Inside Unit 1.00
0200 Manufactured 1-Fam Res 1.00
0310 Multi-family 10 - 19 units 0.78
0320 Multi-family 20 - 49 units 0.78
0350 Multi-family 50 - 99 units 0.78
0380 Govt.-subsidized Multifamily Complex 0.78
0390 Multi-family 100 or more units 0.78
0401 CONDO - Det Single Family 0.58
0402 CONDO - Duplex or Villa 0.58
0403 CONDO - Low-Rise 2-3 Stories 0.78
0404 CONDO - Mid-Rise 4-6 Stories 0.58
0405 CONDO - Hi-Rise 7+ Stories 0.47
0407 CONDO - Row House 0.58
0408 CONDO - Cluster Villa 0.58
0430 CONDO - Time Share/Interval Ownership 0.91
0501 CO-OP - Detached Units 1.00
0502 CO-OP - Duplex or Villa 0.58
0503 CO-OP - Low-Rise 2-3 Stories 0.78
0507 CO-OP - Row House 0.58
0600 CCRC -Retirement Homes - Independent Living 0.42

2. Analysis
City of North Port | Road and Drainage District Non-Ad Valorem Assessment Methodology Stantec | 14
Table 3 – ERUs per Land Use Code (Cont’d)
Land
Use
Code
Description of Land Use CodeCurrent
Road ERU
0700 Misc. Res - no living unit 0.78
0704 Misc. Condo - no living unit 2.60
0810 Multiple Single Fam Dwellings 1.00
0820 2-Family Dwelling 1.00
0830 3-Family Dwelling 0.78
0840 4-Family Bldg 0.78
0850 Multi-Family 5 to 9 Units, Duplex to Quad 0.78
0890 Multi-family apts 5-9 units 0.78
0900 Residential Common Areas/Elements 0.00
1000 Vacant commercial land 1.00
1004 Vacant condo land commercial/industrial 1.00
1009 Commercial Common Areas/Elements 0.00
1100 Store -one story 4.00
1104 Retail condo unit 4.00
110A Store-1 store - Automotive Retail 5.86
110D Store- 1 story - Discount Retail 5.63
110X Store-1 story - mixed use 4.00
1110 Strip store-1 story < 10,000 sf 4.00
111X Strip store-1 story < 10,000 sf mixed use 4.00
1120 Strip store-1 story/=>10,000 and <30,000 sf 4.00
112X Strip store-1 story/=>10,000 and <30,000 sf mixed use 4.00
1130 Store-1/story/ convenience-without gas 80.75
113X Store-1/story/convenience-without gas-mixed use 80.75
1140 Store-1/story/ convenience-with gas 66.12
114X Store-1/story/convenience-with gas - mixed use 66.12
1150 Store-1 story freestanding w/drivethrough 11.56
115X Store-1 story freestanding w/drivethrough mixed use 11.56
1300 Department store - Home Center 3.26
1310 Department store - Discount 9.63
1360 Department Store - Furniture 2.42
1370 Department Store - Warehouse Club 4.43
1410 Supermarket-freestanding 11.31
1420 Supermarket-attached to other retail 11.31
1500 Regional shopping center - 300k-850k sf 4.00
1520 Regional Shopping Center - Department Store 4.00
1560 Lifestyle Center/150-500k sf/upscale specialty entertainment 4.00
1600 Community shopping ctr/100k-450k sf/suprmkt-dept store 4.00
1620 Community neighborhood ctr/30k-100k sf 4.00
1630 Community multi story ctr/single tenant 4.00
163X Community multi story ctr/single tenant/mixed use 4.00
2. Analysis
City of North Port | Road and Drainage District Non-Ad Valorem Assessment Methodology Stantec | 15
Table 3 – ERUs per Land Use Code (Cont’d)
Land
Use
Code
Description of Land Use CodeCurrent
Road ERU
1640 Community multi story strip store <10,000 sf 4.00
164X Community multi story strip store <10,000 sf mixed use 4.00
1650 Community multi story strip ctr=>10,000 sf 4.00
165X Community multi story strip ctr=>10,000 sf mixed use 4.00
1660 Power center - Category dominant anchors >250k sf 4.00
1700 Office - 1 story/single tenant <10,000 sf 1.19
170X Office - 1 story/single tenant <10,000 sf mixed use 1.19
1710 Office - 1 story/single tenant =>10,000 sf 1.19
1720 Office - 1 story/multi tenant <10,000 sf 1.03
172X Office - 1 story/multi tenant <10,000 sf - mixed use 1.03
172Y Office - 1 story/multi tenant <10,000 sf - multi-use 1.03
1730 Office - 1 story/multi tenant =>10,000 sf 1.03
1800 Office /multi story-1 tenant <10,000 1.19
1804 Office condo unit 1.19
180X Office /multi story-1 tenant <10,000 sf mixed use 1.19
1810 Office /multi story-=>2 tenants <10,000 sf 1.03
181X Office /multi story-=>2 tenants <10,000 sf mixed use 1.03
181Y Office /multi story-=>2 tenants <10,000 sf multi use 1.03
1820 Office /multi story-1 tenant=>10,000 sf 1.19
1830 Office /multi story-=>2 tenants=>10,000 sf 1.03
183X Office /multi story-=>2 tenants=>10,000 sf mixed use 1.03
1850 Office /multi story-=>2 tenants =>5 stories 1.03
185X Office /multi story-=>2 tenants=>5 stories mixed use 1.03
1904 Medical office condo unit 3.69
1910 Medical profess/1 story-1 tenant <10,000 sf 3.69
191X Medical profess/1 story-1 tenant <10,000 sf mixed use 3.69
1920 Medical profess/1 story-multi tenant <10,000 sf 3.69
192X Medical profess/1 sty-multi tenant <10,000 sf mixed use 3.69
1930 Medical profess/1 story-single or multi tenant =>10k sf 3.69
193X Medical profess/1 story-single or multi tenant>10k-mixed use 3.69
1940 Medical profess/multi story-single or multi tenant 3.69
194X Medical profess/multi story-single or multi tenant-mixed use 3.69
1950 Medical, veterinary-related 0.40
195X Medical, veterinary-related-mixed use 0.40
1973 Medical, surgery center 3.69
2000 Airport-private or commercial 1.77
2020 Boat Basin 3.05
2040 Marina 3.05
2100 Restaurant -Full service 8.88
2104 Restaurant condominium 8.88

2. Analysis
City of North Port | Road and Drainage District Non-Ad Valorem Assessment Methodology Stantec | 16
Table 3 – ERUs per Land Use Code (Cont’d)
Land
Use
Code
Description of Land Use CodeCurrent
Road ERU
210X Restaurant -Full service - mixed use 8.88
2210 Restaurant - quick service with drive-through window 49.89
2220 Restaurant- quick service without drive thru window 36.68
2300 Financial institutions (Banks, S&L, Mtg co, Credit svcs) 10.60
2304 Bank condominium 2.80
230X Financial institutions mixed use 10.60
2350 Financial institutions (Retail w/drive-through) 10.60
2510 Laundry self service 0.21
2520 Drycleaner 0.21
2620 Self service gasoline-no convenience store 127.42
2630 Car wash - Full service 5.43
263X Car wash - Full service - mixed use 5.43
2640 Car wash - Self-service 5.43
2700 Auto sales (new) 2.95
2710 Auto sales (used) 2.87
271X Auto sales (used) mixed use 2.87
2720 Auto repair/svc & body shps/garage 0.24
272X Auto repair/svc & body shps/garage mixed use 0.24
273X Heavy const/farm vehicles/trailer sales & service mixed use 0.15
2750 Motorcycles sales and service 0.24
2760 Recreational vehicle sales and service 0.53
2770 Auto rental 0.24
277X Auto rental mixed use 0.24
2780 Marine equipment/sales and service 0.53
278X Marine equipment/sales and service mixed use 0.53
2800 Parking lots (commercial or patron) 4.00
2803 Multifamily parking/extended use 4.00
2804 Marina slip - dry rack 3.05
2805 Marina wet slip 3.05
2809 Commercial condo parking/excess land 1.19
280X Parking lots (commercial or patron) mixed use 1.03
2810 Use In Transition 4.00
2811 Retail parking 4.00
2816 Shopping center parking 4.00
2817 Office single story parking 1.19
2818 Office multiple story parking 1.03
2819 Medical professional office parking 3.69
2820 Marina extended use 3.05
2821 Full service restaurant parking 8.88
2822 Fast food restaurant parking 49.89
2. Analysis
City of North Port | Road and Drainage District Non-Ad Valorem Assessment Methodology Stantec | 17
Table 3 – ERUs per Land Use Code (Cont’d)
Land
Use
Code
Description of Land Use CodeCurrent
Road ERU
2823 Retail bank/financial institution parking 10.60
2827 Automotive/vehicular sales/svc extended use 2.95
2831 Stadium Parking 0.11
2835 Tourist attraction parking 18.01
2838 Golf course/driving range extended use 0.40
2839 Transient lodging parking 3.47
2840 Industrial Use In Transition 0.53
2841 Light industrial manufacturing extended use 0.42
2842 Heavy industrial manufacturing extended use 0.42
2847 Mineral/gravel process extended use 0.36
2848 Warehouse extended use 0.18
2860 Manufactured Home Sites as TPP 0.53
2870 Recreational vehicle park 0.05
2871 Church parking and extended use 2.93
2872 Private school parking and extended use 1.23
2873 Private hospital parking 1.14
2875 Charitable organization parking & extended use 0.74
2877 Service/Other club parking & extended use 3.05
2878 Skilled nursing parking and extended use 1.14
2885 Public hospital parking & extended use 1.14
2886 County parking restricted 3.60
2889 City parking restricted 3.60
2891 Utility parking & extended use 1.40
3010 Florist-greenhouses/plant nurseries 4.15
301X Florist-greenhouse/plant nurseries-mixed use 4.15
3110 Open stadiums 0.11
3200 Enclosed theatres 1.89
3300 Nightclubs/cocktail lounges/bars 1.20
330X Nightclubs/cocktail lounges/bars - mixed use 1.20
3400 Bowling alleys 0.48
3500 Tourist attractions/permanent exhibits 10.79
3600 Camps 0.08
3750 Dog and cat kennel 2.28
375X Dog and cat kennel - mixed use 2.28
3760 Horse stable 2.28
3810 Golf course/private 0.40
3820 Golf course/semi-private 0.40
3830 Golf course/daily-fee 0.40
3840 Golf course/municipal 0.40
3850 Golf course/executive 0.40

2. Analysis
City of North Port | Road and Drainage District Non-Ad Valorem Assessment Methodology Stantec | 18
Table 3 – ERUs per Land Use Code (Cont’d)
Land
Use
Code
Description of Land Use CodeCurrent
Road ERU
3890 Golf course/driving range 0.40
3904 Hotel condo unit 3.47
3910 Hotels/motels/lodging (1-40 units) 3.47
391X Hotels/motels/lodging (1-40 units) - mixed use 3.47
3940 Hotels/motels/lodging (41 or more units) 3.47
4000 Vacant industrial land 1.00
4009 Industrial Common Area/Element 0.00
4100 Manufacturing - light 0.42
410X Manufacturing - light - mixed use 0.42
4110 Manufacturing/engineering or scientific 0.42
4200 Manufacturing - heavy 0.36
4300 Lumber yard 0.36
4400 Packing plants (fruit/vegetables/meat) 0.36
4700 Mineral and gravel processing/cement plant 0.36
4800 Warehouse 0.18
4804 Industrial condo unit 0.18
480X Warehouse - mixed use 0.18
4810 Warehouse and sales 0.18
481X Warehouse and sales - mixed use 0.18
4820 Warehouse and office 0.18
482X Warehouse and office - mixed use 0.18
4840 Terminal/distribution or trucking 0.18
4860 Mini-storage warehousing 0.16
486X Mini-storage warehousing - mixed use 0.16
4870 Flex space/overhead door front 0.18
487X Flex space/overhead door front - mixed use 0.18
4880 Flex space/office front 0.18
488X Flex space/office front - mixed use 0.18
4900 Open storage/materials/equipment/building supplies 0.18
490X Open storage/stand alone signage 0.18
4910 Open junk yard or recycling (non auto) 0.18
4920 Open auto wrecking and auto junk yard 0.18
5200 AG - Cropland Soil Capability Class 2 1.00
5700 AG - Timberland- Site Index 60 to 69 1.00
6200 AG- Grazing Land Soil Capability Class 1.00
6610 AG- Citrus Grove 1.00
6700 AG - Poultry 1.00
6710 AG - Bees / Apiary 1.00
6900 AG - Ornamentals 1.00
6930 AG - Horse Breeding 1.00

2. Analysis
City of North Port | Road and Drainage District Non-Ad Valorem Assessment Methodology Stantec | 19
Table 3 – ERUs per Land Use Code (Cont’d)
Land
Use
Code
Description of Land Use CodeCurrent
Road ERU
7000 Vacant Institutional Land 1.00
7100 Church 2.93
7200 School (private) 1.23
720X School (private) - mixed use 1.23
7210 College (private) 2.76
7300 Regional hospital 1.14
7310 Community hospital 1.14
7320 Specialty hospital 1.14
7400 ACLF -Assisted living 0.70
740X ACLF -Assisted living - mixed use 0.70
7500 Orphanages/non-profit/charitable services 2.16
7600 Mortuary 2.93
7610 Cemetery 0.64
7700 Service club 3.05
770X Clubs,lodges,union halls - mixed use 3.05
7710 Beach club 3.05
7720 Community center 3.05
7730 Tennis club 0.21
7740 Yacht club 3.05
7750 Union hall, Other club 3.05
7760 Boat Club 3.05
7800 Nursing home 0.70
7900 Cultural organizations, facilities 1.23
8000 Vacant government land 1.00
8010 Vacant government use in transition 1.00
8100 Military 1.00
8200 Parks - Natural Areas, Preserves 0.08
8210 Parks - Community 0.08
8220 Parks - Recreational area 3.05
8230 Parks - Linear 0.08
8240 Parks - Athletic Complex 3.05
8250 Parks - Neighborhood 0.08
8300 Public school (Board of Public Instruction) 1.90
8400 College (public) 2.76
8500 Hospital (public) 1.14
8600 County government - Administration 3.60
8610 County government - Public Works 1.40
8620 County government - Police protection 1.23
8640 County government - Transportation 1.40
8650 County government - Libraries and archives 3.60

2. Analysis
City of North Port | Road and Drainage District Non-Ad Valorem Assessment Methodology Stantec | 20
Table 3 – ERUs per Land Use Code (Cont’d)
Land
Use
Code
Description of Land Use CodeCurrent
Road ERU
8660 County government - Fire protection 0.05
8680 County government - Professional services 2.39
8700 State government use 3.60
8800 Federal government use 3.60
8900 Municipal government - Administration 3.60
8910 Municipal government - Public Works 3.60
8920 Municipal government - Police protection 1.23
8960 Municipal government - Fire protection 0.05
9000 Leasehold interest (government owned leases) 3.60
9016 Shopping center related long term leasehold 4.00
9100 Gas Utility 1.40
9110 Electric Utility 1.40
9120 Telephone Utility 1.40
9130 Cellular Tower -Telephone Utility 1.40
9140 Railroad Utility (locally assessed) 1.40
9150 Water and sewer Utility 1.40
9160 Cable TV Utility 1.40
9170 Radio/Television Utility 1.40
9300 Misc/ Subsurface Rights 1.40
9400 Right-of-way (Streets and roads, etc.) 1.40
9410 Right-of-way (Canals, Waterways, etc.) 1.40
9500 River or lake 1.40
9600 Solid waste 1.40
9620 Drainage reservoir 1.40
9625 Drainage reservoir - Myakkahatchee Creek Corridor 1.40
9630 Drainage Canals 1.40
9640 Marsh or Swamp 1.40
9650 Sand dunes 1.40
9810 Railroad property (centrally assessed) 1.00
9900 Acreage Not Ag 1.00
9904 Vacant Land /Intended Condo Project 0.78
2. Analysis
City of North Port | Road and Drainage District Non-Ad Valorem Assessment Methodology Stantec | 21
For both the Base Road Services and the Enhanced Road Services, the apportionment methodology is
identical, using trip generation data as previously described. The determination as to whether a parcel
benefits from Base Road Services and/or Enhanced Road Services was based upon the assignment of
benefit reflected in the FY 2020 Road and Drainage Assessment Roll, adjusted where appropriate by City
staff. The ERU calculation is described below:
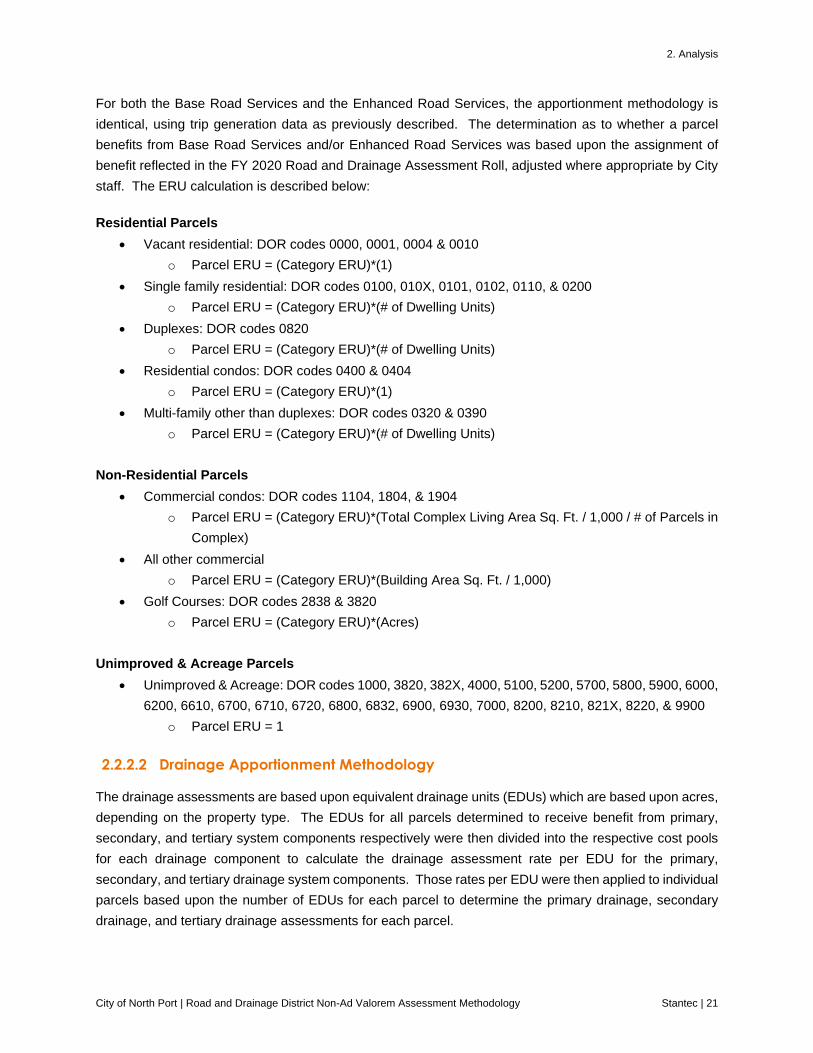
Residential Parcels
• Vacant residential: DOR codes 0000, 0001, 0004 & 0010
o Parcel ERU = (Category ERU)*(1)
• Single family residential: DOR codes 0100, 010X, 0101, 0102, 0110, & 0200
o Parcel ERU = (Category ERU)*(# of Dwelling Units)
• Duplexes: DOR codes 0820
o Parcel ERU = (Category ERU)*(# of Dwelling Units)
• Residential condos: DOR codes 0400 & 0404
o Parcel ERU = (Category ERU)*(1)
• Multi-family other than duplexes: DOR codes 0320 & 0390
o Parcel ERU = (Category ERU)*(# of Dwelling Units)
Non-Residential Parcels
• Commercial condos: DOR codes 1104, 1804, & 1904
o Parcel ERU = (Category ERU)*(Total Complex Living Area Sq. Ft. / 1,000 / # of Parcels in
Complex)
• All other commercial
o Parcel ERU = (Category ERU)*(Building Area Sq. Ft. / 1,000)
• Golf Courses: DOR codes 2838 & 3820
o Parcel ERU = (Category ERU)*(Acres)
Unimproved & Acreage Parcels
• Unimproved & Acreage: DOR codes 1000, 3820, 382X, 4000, 5100, 5200, 5700, 5800, 5900, 6000,
6200, 6610, 6700, 6710, 6720, 6800, 6832, 6900, 6930, 7000, 8200, 8210, 821X, 8220, & 9900
o Parcel ERU = 1
2.2.2.2 Drainage Apportionment Methodology
The drainage assessments are based upon equivalent drainage units (EDUs) which are based upon acres,
depending on the property type. The EDUs for all parcels determined to receive benefit from primary,
secondary, and tertiary system components respectively were then divided into the respective cost pools
for each drainage component to calculate the drainage assessment rate per EDU for the primary,
secondary, and tertiary drainage system components. Those rates per EDU were then applied to individual
parcels based upon the number of EDUs for each parcel to determine the primary drainage, secondary
drainage, and tertiary drainage assessments for each parcel.

2. Analysis
City of North Port | Road and Drainage District Non-Ad Valorem Assessment Methodology Stantec | 22
2.2.3 Exempt Properties
Certain parcel types are exempt by State statutes or case law from non-ad valorem assessments such as
this Road and Drainage Service Assessment. Other parcels are typically exempted from such assessments
because they receive no benefit from Road and Drainage Services, such as lake bottoms, marshes, etc.
The exempted/excluded property types by Land Use Code and the number of parcels for each category
within the City are shown in Table 4 below.
Table 4 – Exempt/Excluded Property Types by Land Use Code
Land
Use
Code
Description of Land Use CodeParcel
Count
1009 Commercial Common Areas/Elements -
7100 Church 31
8000 Vacant government land 22
8010 Vacant government use in transition 193
8200 Parks - Natural Areas, Preserves 28
8220 Parks - Recreational area 2
8300 Public school (Board of Public Instruction) 12
8400 College (public) -
8500 Hospital (public) -
8600 County government - Administration -
8610 County government - Public Works -
8620 County government - Police protection -
8640 County government - Transportation -
8650 County government - Libraries and archives 1
8660 County government - Fire protection -
8680 County government - Professional services -
8700 State government use 1
8800 Federal government use 1
8900 Municipal government - Administration 3
8910 Municipal government - Public Works 3
8920 Municipal government - Police protection -
8960 Municipal government - Fire protection 4
9000 Leasehold interest (government owned leases) -
9100 Gas Utility 1
9110 Electric Utility 6
9120 Telephone Utility 1
9130 Cellular Tower -Telephone Utility 7
9140 Railroad Utility (locally assessed) -
9150 Water and sewer Utility 17
9160 Cable TV Utility -
9170 Radio/Television Utility -
9300 Misc/ Subsurface Rights 62
9400 Right-of-way (Streets and roads, etc.) 29
9410 Right-of-way (Canals, Waterways, etc.) -
9500 River or lake 2
9600 Solid waste 1
9620 Drainage reservoir 442
9625 Drainage reservoir - Myakkahatchee Creek Corridor 420
9630 Drainage Canals 71
9640 Marsh or Swamp -
9650 Sand dunes -

2. Analysis
City of North Port | Road and Drainage District Non-Ad Valorem Assessment Methodology Stantec | 23
CALCULATION OF ASSESSMENTS
The cost allocation process resulted in the allocation of District costs to road and drainage. These cost
pools were then used to develop the road and drainage assessments. The assessment rates are presented
in Section 3 – Results.
Administration – The Administration cost pool was used to calculate the administration fee per parcel of
all properties benefitting from the Road and Drainage District.
Road – The Road cost pool, as allocated to Base and Enhanced Roads, was used to calculate the road
assessment rate per ERU for each of these components. The Base Road and Enhanced Road cost pools
were used to calculate Base Road and Enhanced Road rates based upon the trip generation factors
presented previously in Table 3.
Drainage – The Drainage cost pool, as allocated to Primary, Secondary, and Tertiary Drainage system
components, was used to calculate an assessment rate per EDU for each system component respectively.
In accomplishing the calculation for the cost pool rates, property classes were evaluated and assigned the
system components from which they receive benefit. For example, most residential properties were
assigned primary, secondary, and tertiary system benefits because all system components contribute to
draining rainwater from most residential properties. However, some residential properties, in private
neighborhoods that provide tertiary system components for their properties, were only assigned primary
and secondary system benefits because the tertiary system benefit is not provided by the City’s drainage
system. Also, some properties were only assigned primary system benefit in cases where their runoff goes
directly into the City’s primary system components and they receive no benefit from the City’s secondary
and tertiary system components.
Beginning in FY 2020, the District will start to mow the swales of all properties requiring maintenance to
ensure hydraulic function of the drainage system. It was identified that some property owners are unable
to maintain their swales to the level that is needed to allow the drainage system to work properly. When
the swales are not mowed regularly, trees and other plants begin to grow and obstruct the swales. When
debris begins to fill the bottom of the swale, it is no longer able to properly function as a part of the drainage
system. Due to the drainage issues that can stem from the unmaintained swales, the District will now mow
areas in need, whether vacant or developed, and include these new costs in the overall cost of the drainage
system.
After all properties were assigned to the appropriate system components relative to benefit received, the
cost for each system component was divided by the total EDU’s associated with the parcels assigned to
receive benefit from that system component in order to derive a drainage cost per EDU, for primary,
secondary, and tertiary system components. A drainage EDU is defined as a minimum of one acre, for
parcels that are less than one acre, and per acre, or portion thereof, for parcels greater than one acre. The
exception is large parcels that do not significantly benefit from the drainage system because of the location

2. Analysis
City of North Port | Road and Drainage District Non-Ad Valorem Assessment Methodology Stantec | 24
of the parcel and the large size that precludes much of the acreage to drain to the City’s drainage system
– such parcels are assigned one EDU.
After the drainage cost per EDU was calculated for primary, secondary, and tertiary system components,
the annual assessment for each parcel was calculated by multiplying the cost per EDU by the parcel’s
assigned EDUs for each system component from which the parcel receives benefit.
Assessment Rates and Property Impact Analysis – Upon completion of the above referenced
apportionments, assessment rates were developed, and a preliminary assessment roll was produced which
lists each parcel with its total road and drainage assessment. A comparative analysis was also prepared
which presents a comparison of the proposed road and drainage assessments to the current road, mowing,
and drainage assessments for primary classes of properties in different size ranges. Section 3 – Results
presents the assessment rates and the property impact analysis.
3. Results
City of North Port | Road and Drainage District Non-Ad Valorem Assessment Methodology Stantec | 25
RESULTS
The results of the study are presented in two parts in this section, 1) the cost allocation of District costs to
District administration, road, and drainage, and further to the sub-components for each, and 2) the resulting
calculation of administration, road, and drainage assessments and a comparison of the impact of the
proposed assessments to the current assessments for various property classes and sizes of parcels. These
results are presented in the following subsections.
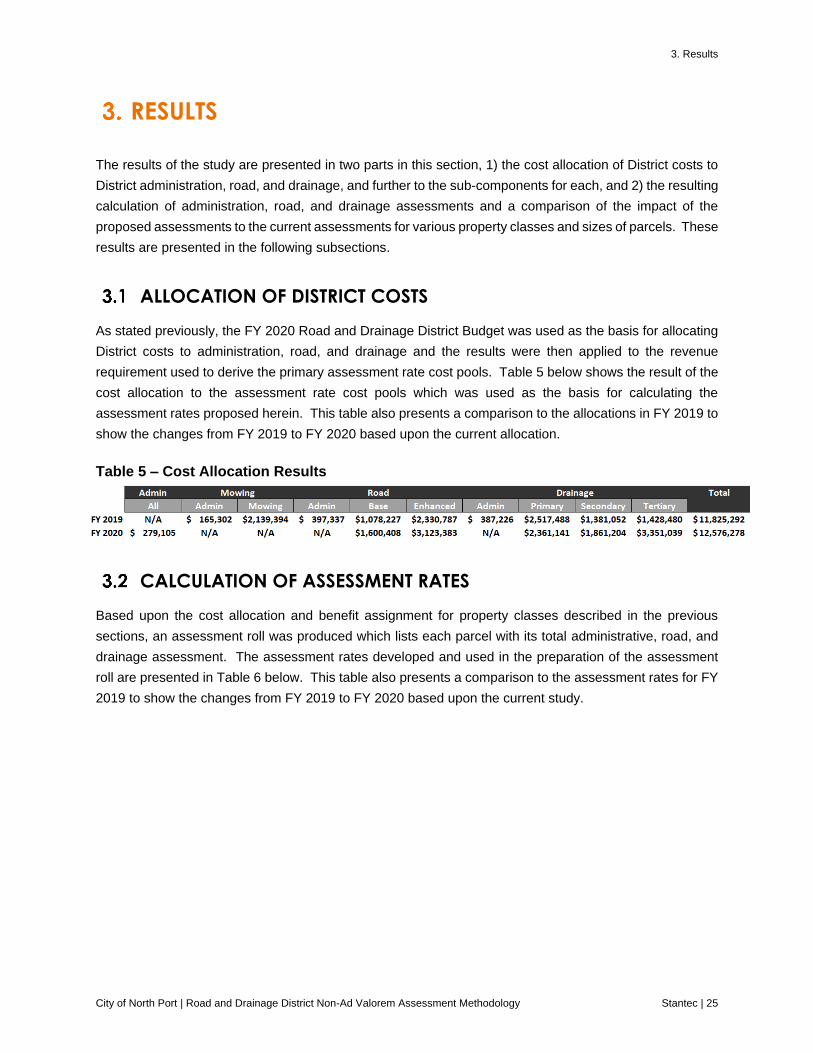
ALLOCATION OF DISTRICT COSTS
As stated previously, the FY 2020 Road and Drainage District Budget was used as the basis for allocating
District costs to administration, road, and drainage and the results were then applied to the revenue
requirement used to derive the primary assessment rate cost pools. Table 5 below shows the result of the
cost allocation to the assessment rate cost pools which was used as the basis for calculating the
assessment rates proposed herein. This table also presents a comparison to the allocations in FY 2019 to
show the changes from FY 2019 to FY 2020 based upon the current allocation.
Table 5 – Cost Allocation Results
CALCULATION OF ASSESSMENT RATES
Based upon the cost allocation and benefit assignment for property classes described in the previous
sections, an assessment roll was produced which lists each parcel with its total administrative, road, and
drainage assessment. The assessment rates developed and used in the preparation of the assessment
roll are presented in Table 6 below. This table also presents a comparison to the assessment rates for FY
2019 to show the changes from FY 2019 to FY 2020 based upon the current study.
3. Results
City of North Port | Road and Drainage District Non-Ad Valorem Assessment Methodology Stantec | 26
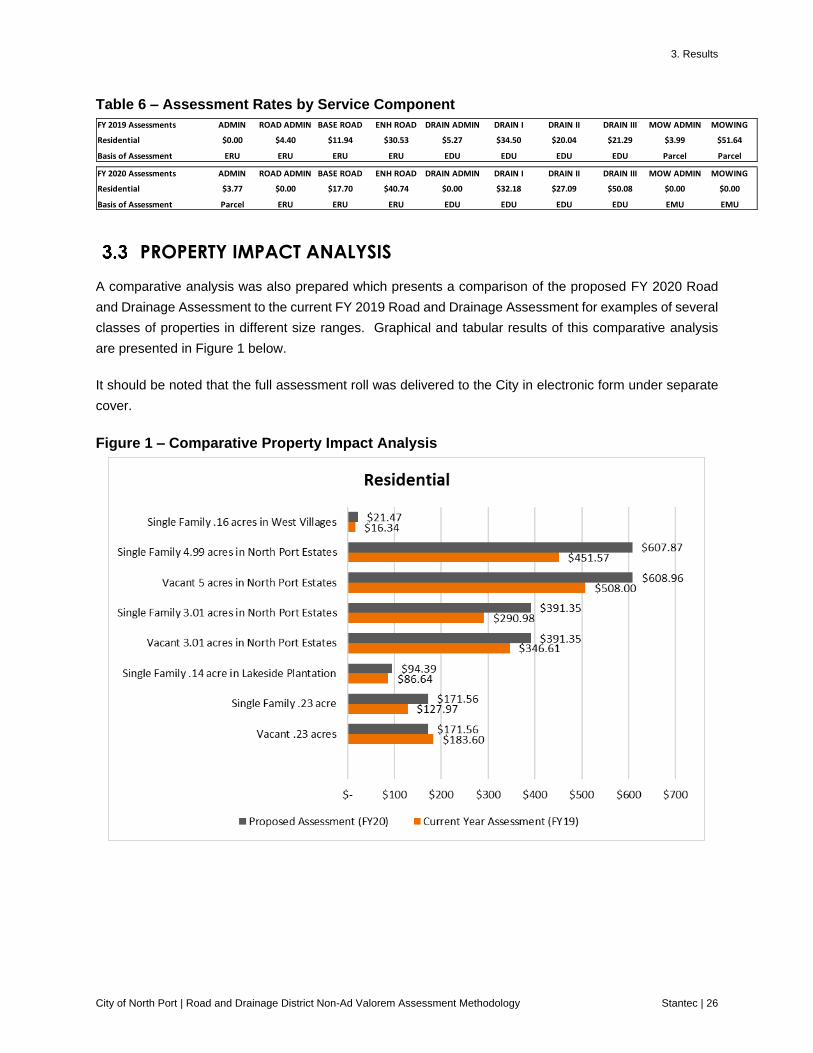
Table 6 – Assessment Rates by Service Component
PROPERTY IMPACT ANALYSIS
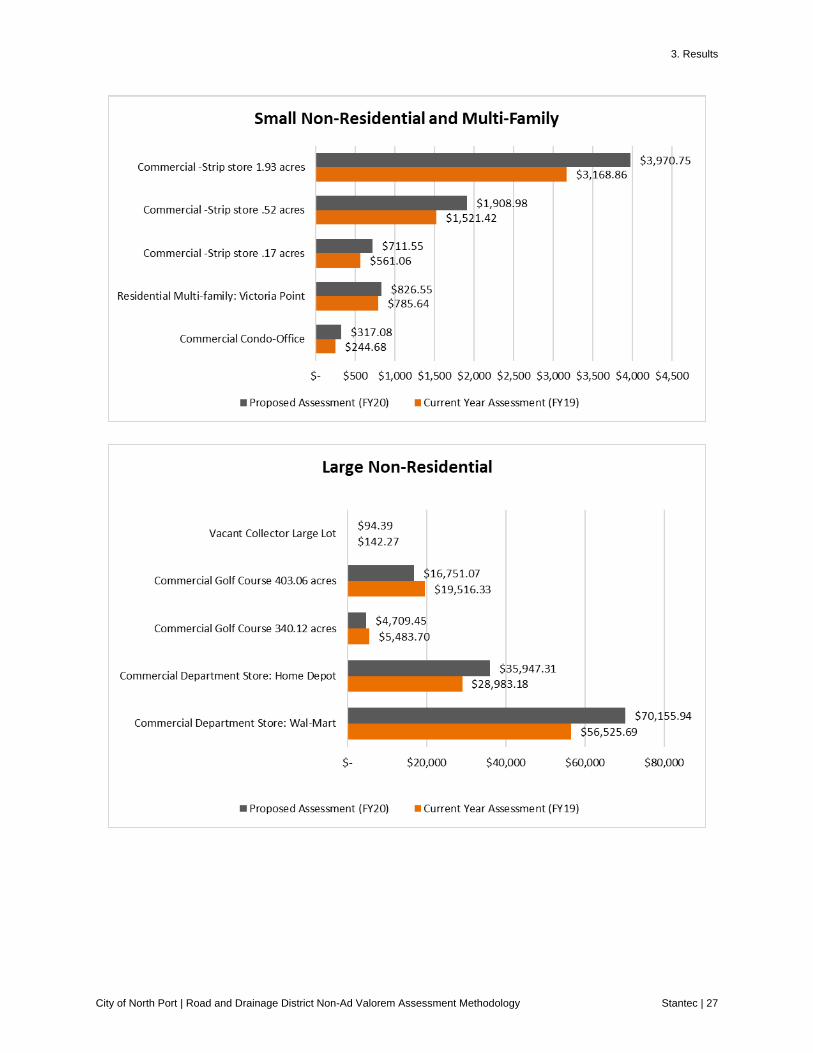
A comparative analysis was also prepared which presents a comparison of the proposed FY 2020 Road
and Drainage Assessment to the current FY 2019 Road and Drainage Assessment for examples of several
classes of properties in different size ranges. Graphical and tabular results of this comparative analysis
are presented in Figure 1 below.
It should be noted that the full assessment roll was delivered to the City in electronic form under separate
cover.
Figure 1 – Comparative Property Impact Analysis
FY 2019 Assessments ADMIN ROAD ADMIN BASE ROAD ENH ROAD DRAIN ADMIN DRAIN I DRAIN II DRAIN III MOW ADMIN MOWING
Residential $0.00 $4.40 $11.94 $30.53 $5.27 $34.50 $20.04 $21.29 $3.99 $51.64
Basis of Assessment ERU ERU ERU ERU EDU EDU EDU EDU Parcel Parcel
FY 2020 Assessments ADMIN ROAD ADMIN BASE ROAD ENH ROAD DRAIN ADMIN DRAIN I DRAIN II DRAIN III MOW ADMIN MOWING
Residential $3.77 $0.00 $17.70 $40.74 $0.00 $32.18 $27.09 $50.08 $0.00 $0.00
Basis of Assessment Parcel ERU ERU ERU EDU EDU EDU EDU EMU EMU
3. Results
City of North Port | Road and Drainage District Non-Ad Valorem Assessment Methodology Stantec | 27
4. Summary of Findings and Recommendations
City of North Port | Road and Drainage District Non-Ad Valorem Assessment Methodology Stantec | 28
SUMMARY OF FINDINGS AND RECOMMENDATIONS
This section of the report presents the findings and recommendations developed during the Road and
Drainage District Non-Ad Valorem Assessment study.
OVERALL RECOMMENDATIONS
Based upon the analysis and results described in the prior sections of this report, we recommend the
following:
1. Adopt the cost allocations to road and drainage presented herein.
2. Adopt the proposed road and drainage cost apportionment methodology presented herein.
3. Adopt a continuing assessment with the provision that assessment rates can be increased up to
10% annually in subsequent years, based upon the decision of the Commission as the revenue
requirements of the assessment are evaluated each year1.
4. Adopt the proposed Road and Drainage Assessment Roll delivered under separate cover.
FINDING OF BENEFITS SUMMARY
The following conclusions support a finding that the road and drainage services provided by the District
confer a special benefit upon the assessed parcels.
• Benefit is conferred by the provision of road and drainage management services and the availability
and use of facilities or improvements by owners and occupants of such property to properly and
safely detain, retain, convey or treat drainage discharged from such property,
• Benefit is conferred by the maintenance of a roadway network that provides safe and ready access
to and from properties,
• Benefit is conferred by stabilization of, and/or the increase in property values,
• Benefit is conferred in the form of increased safety, better access to property and improved
appearance,
• Benefit is conferred by rendering property more adaptable to current or reasonably foreseeable
new and higher use,
• Benefit is conferred by alleviation of the burdens caused by road and drainage runoff and
accumulation attendant with the present or projected use of property, and
• Benefit is conferred by fostering the enhancement of environmentally responsible use and
enjoyment of the natural resources within the City.
1 An adoption of an upper limit of a 10% per year increases will allow the District to react in the future to unforeseen circumstances, if needed, without
having to go through the expensive process of updating the Study, sending first class mail notices and conducting another special hearing.
4. Summary of Findings and Recommendations
City of North Port | Road and Drainage District Non-Ad Valorem Assessment Methodology Stantec | 29
From this analysis, it is concluded that the provision of road and drainage services provided by the District
enhance and strengthen the relationship of such services to the use and enjoyment of the parcels of
property in the area and, ultimately, the property values within the area. It is further concluded that the
value of the special benefit conferred exceeds the assessment in all cases.
RATE STRUCTURE ANALYSIS – RECOMMENDATIONS
Based upon the review of the current networks maintained and services provided by the District we recommend the following:
• Develop one overall administration charge that is applied equally per parcel,
• Absorb all other administration costs into road and drainage service costs and assessments, and
• Absorb mowing services into road and drainage service costs and assessments.
COST APPORTIONMENT AND ASSESSMENT RATE DESIGN
We recommend adoption of the FY 2020 Road and Drainage Assessment rates presented below that were
developed based upon the cost apportionment methodology described herein.
PRELIMINARY ASSESSMENT ROLL
We developed a Preliminary Road and Drainage Assessment Roll (Roll) of all parcels within the District
that will receive a Road and Drainage Assessment. This Roll includes specific information for each parcel,
including the recommended FY 2020 Road and Drainage Assessment. The Roll is being delivered to the
District electronically.
FY 2020 Assessments ADMIN BASE ROAD ENH ROAD DRAIN I DRAIN II DRAIN III
Residential $3.77 $17.70 $40.74 $32.18 $27.09 $50.08
Basis of Assessment Parcel ERU ERU EDU EDU EDU

Appendix: Cost Allocation Analysis
City of North Port | Road and Drainage District Non-Ad Valorem Assessment Methodology Stantec | 30
APPENDIX – COST ALLOCATION ANALYSIS
Schedule 1 – FY 2020 Projected Expenses
Schedule 2 – FY 2020 Allocation to Administration
Schedule 3 – FY 2020 Allocation to Services
Schedule 4 – Road Cost Apportionment
Schedule 5 – Drainage Cost Apportionment
Schedule 6 – FY 2020 Revenue Requirement Allocation Summary

Appendix: Cost Allocation Analysis
FY 2020 Projected Expenses Schedule 1Sources: North Port Road and Drainage FY 2020 Personnel Allocation 05062019; North Port RD FY2020 Preliminary Budget 6-17-19
FY 2020 Projections % Asmt FY 2020 Asmt.PERSONNEL EXPENSESRoads Section Personnel Expenses 2,003,897 100% 2,003,897 Drainage Section Personnel Expenses 2,312,982 100% 2,312,982 Waterways Section Personnel Expenses 345,060 100% 345,060 Engineering Section Personnel Expenses 1,246,983 100% 1,246,983 Administration Personnel Expenses 996,556 100% 996,556
TOTAL PERSONNEL EXPENSES 6,905,478 6,905,478
OPERATING EXPENSES
Professional Services 18,000 100% 18,000 Legal Services 1,000 100% 1,000 Engineer-Architect 6,000 100% 6,000 Medical Services 3,000 100% 3,000 Other Profess Svc 123,580 100% 123,580 Water Quality Testing 11,500 100% 11,500 Npdes (Monitoring) 18,470 100% 18,470 Surveyor 100,000 100% 100,000 Other Contract Svc 14,900 100% 14,900 Travel & Per Diem 15,000 100% 15,000 Communication Svc 81,140 100% 81,140 Postage & Mailing 1,000 100% 1,000 Water & Sewer 10,000 100% 10,000 Electric 15,000 100% 15,000 Street Lights Electric 500,000 100% 500,000 Traffic Lights Electric 13,700 100% 13,700 Rentals & Leases 14,350 100% 14,350 Insurance 117,160 100% 117,160 R&M Office Equip 1,500 100% 1,500 R&M Veh & Equip 8,000 100% 8,000 R&M Buildings 10,800 100% 10,800 R&M Water Control Struc 100,000 100% 100,000
City of North Port | Road and Drainage District Non-Ad Valorem Assessment Methodology Stantec | 31

Appendix: Cost Allocation Analysis
FY 2020 Projected Expenses Schedule 1Sources: North Port Road and Drainage FY 2020 Personnel Allocation 05062019; North Port RD FY2020 Preliminary Budget 6-17-19
FY 2020 Projections % Asmt FY 2020 Asmt.R&M Road & Drainage 105,000 100% 105,000 R&M Streelights 85,000 100% 85,000 R&M Traffic Signals 40,000 100% 40,000 Landscaping 1,582,550 100% 1,582,550 Road Maint Program 3,573,300 100% 3,573,300 Fleet - Admin 266,410 100% 266,410 Fleet - Labor 269,640 100% 269,640 Fleet - Parts 324,380 100% 324,380 Fleet - Outsourced 78,280 100% 78,280 Printing & Binding 1,500 100% 1,500 Promotional Activities 11,500 100% 11,500 Ads And Public Notices 1,000 100% 1,000 Tags, Fees, Licenses 3,290 100% 3,290 Tax Collector Fees 188,860 100% 188,860 Landfill Disp Charges 77,500 100% 77,500 Food 500 100% 500 Payment To Gen Fund 1,823,150 100% 1,823,150 Payment To Sw 9,000 100% 9,000 Office Supplies 7,300 100% 7,300 Other Oper Supplies 25,500 100% 25,500 Fuel 290,000 100% 290,000 Aquatic Weed Control 80,000 100% 80,000 Uniforms 15,430 100% 15,430 Drainage Supplies 50,000 100% 50,000 Street Signs (Includes Traffic Control Supplies) 71,000 100% 71,000 Minor Op Equip 56,930 100% 56,930 Road Materials & Supp 40,000 100% 40,000 Books, Public, Subs 10,440 100% 10,440 Training & Education 25,590 100% 25,590 Executive Salaries 88,920 0% - Regular Salaries 4,635,160 0% - Other Salaries & Wages 164,950 0% - Overtime 56,910 0% - Clothing/Cln Allow 9,670 0% -
City of North Port | Road and Drainage District Non-Ad Valorem Assessment Methodology Stantec | 32

Appendix: Cost Allocation Analysis
FY 2020 Projected Expenses Schedule 1Sources: North Port Road and Drainage FY 2020 Personnel Allocation 05062019; North Port RD FY2020 Preliminary Budget 6-17-19
FY 2020 Projections % Asmt FY 2020 Asmt.Fica 350,630 0% - Florida Retirement Sys 416,450 0% - Insurance-Health/Dental 869,440 0% - Vision 5,610 0% - Dental, Life Add 71,100 0% - Workers Comp 73,890 0% - Unemployment Comp 8,800 0% -
Capital Outlay
Capital - Buildings 95,000 100% 95,000 Infrastructure 325,000 100% 325,000 R18SSM San Mateo Drive Sidewalks 160,500 100% 160,500 R20DSI Drainage System Improvements 701,400 100% 701,400 Machinery & Equip 312,670 100% 312,670
Interfund Transfers
To Cap Acquisition Fund 850,000 0% -
TOTAL OPERATING EXPENSES 19,493,250 11,891,720
TOTAL PERSONNEL & OPERATING EXPENSES 26,398,728 18,797,198
TOTAL EXPENDITURE REQUIREMENTS 26,398,728 18,797,198
OFFSETTING REVENUESCounty 9Th Cent Fuel Tax 302,680 100% 302,680 1St Local Opt Gas Tax 1,693,200 100% 1,693,200 2Nd Local Opt Gas Tax 1,282,210 100% 1,282,210 Municipal Gas Tax 628,930 100% 628,930 District Assessments 12,590,510 0% -
City of North Port | Road and Drainage District Non-Ad Valorem Assessment Methodology Stantec | 33

Appendix: Cost Allocation Analysis
FY 2020 Projected Expenses Schedule 1Sources: North Port Road and Drainage FY 2020 Personnel Allocation 05062019; North Port RD FY2020 Preliminary Budget 6-17-19
FY 2020 Projections % Asmt FY 2020 Asmt.Dot Agreements 114,350 100% 114,350 Delinquent Assessments 175,000 100% 175,000 Constrctn Traffic Rd Fees 1,783,000 100% 1,783,000 Other Charges For Service 2,000 100% 2,000 City Wide Fee Ordinance 300,000 100% 300,000 Investment Income 125,000 100% 125,000 Rental Income 37,590 100% 37,590 Contributions & Donations 10,000 100% 10,000 Insurance Recoveries 4,000 0% - Dispose Of Fixed Assets 20,000 0% - Sale/Recycle of surplus 1,500 0% - Other - App Fund Balance 423,280 0% - Personnel Budget Offset 153,948 100% 153,948
100% - TOTAL OFFSETTING REVENUES 19,647,198 6,607,908
COST OF SERVICE LESS OFFSETTING REVENUES 6,751,530 12,189,290
ADDITIONAL REVENUE REQUIREMENTS/ASSESSMENT GROSS-UPSPlus: Early Payment Discount / Non-Collection 208,810 3.0% 376,988 Plus: Retention Ponds/Credits 10,000 100.0% 10,000
TOTAL ADDITIONAL REVENUE REQUIREMENTS 218,810 386,988
NET REVENUE REQUIREMENT PER FY 20 BUDGET AS ADJUSTED 6,970,340 12,576,278
6/26/2019
City of North Port | Road and Drainage District Non-Ad Valorem Assessment Methodology Stantec | 34

Appendix: Cost Allocation Analysis
FY 2020 Allocation To Administration Schedule 2Admin Admin Svc
FY 2020 Projections % Alloc $ Alloc $ AllocPERSONNEL EXPENSESRoads Section Personnel Expenses 2,003,897 - 2,003,897 Drainage Section Personnel Expenses 2,312,982 - 2,312,982 Waterways Section Personnel Expenses 345,060 - 345,060 Engineering Section Personnel Expenses 1,246,983 - 1,246,983 Administration Personnel Expenses 996,556 72,358 924,198
TOTAL PERSONNEL EXPENSES 6,905,478 72,358 6,833,120
OPERATING EXPENSES
Professional Services 18,000 100% 18,000 - Legal Services 1,000 0% - 1,000 Engineer-Architect 6,000 0% - 6,000 Medical Services 3,000 0% - 3,000 Other Profess Svc 123,580 0% - 123,580 Water Quality Testing 11,500 0% - 11,500 Npdes (Monitoring) 18,470 0% - 18,470 Surveyor 100,000 0% - 100,000 Other Contract Svc 14,900 0% - 14,900 Travel & Per Diem 15,000 0% - 15,000 Communication Svc 81,140 0% - 81,140 Postage & Mailing 1,000 0% - 1,000 Water & Sewer 10,000 0% - 10,000 Electric 15,000 0% - 15,000 Street Lights Electric 500,000 0% - 500,000 Traffic Lights Electric 13,700 0% - 13,700 Rentals & Leases 14,350 0% - 14,350 Insurance 117,160 0% - 117,160 R&M Office Equip 1,500 0% - 1,500 R&M Veh & Equip 8,000 0% - 8,000 R&M Buildings 10,800 0% - 10,800 R&M Water Control Struc 100,000 0% - 100,000 R&M Road & Drainage 105,000 0% - 105,000 R&M Streelights 85,000 0% - 85,000 R&M Traffic Signals 40,000 0% - 40,000 Landscaping 1,582,550 0% - 1,582,550
City of North Port | Road and Drainage District Non-Ad Valorem Assessment Methodology Stantec | 35

Appendix: Cost Allocation Analysis
FY 2020 Allocation To Administration Schedule 2Admin Admin Svc
FY 2020 Projections % Alloc $ Alloc $ AllocRoad Maint Program 3,573,300 0% - 3,573,300 Fleet - Admin 266,410 0% - 266,410 Fleet - Labor 269,640 0% - 269,640 Fleet - Parts 324,380 0% - 324,380 Fleet - Outsourced 78,280 0% - 78,280 Printing & Binding 1,500 0% - 1,500 Promotional Activities 11,500 100% 11,500 - Ads And Public Notices 1,000 0% - 1,000 Tags, Fees, Licenses 3,290 0% - 3,290 Tax Collector Fees 188,860 100% 188,860 - Landfill Disp Charges 77,500 0% - 77,500 Food 500 0% - 500 Payment To Gen Fund 1,823,150 0% - 1,823,150 Payment To Sw 9,000 0% - 9,000 Office Supplies 7,300 0% - 7,300 Other Oper Supplies 25,500 0% - 25,500 Fuel 290,000 0% - 290,000 Aquatic Weed Control 80,000 0% - 80,000 Uniforms 15,430 0% - 15,430 Drainage Supplies 50,000 0% - 50,000 Street Signs (Includes Traffic Control Supplies) 71,000 0% - 71,000 Minor Op Equip 56,930 0% - 56,930 Road Materials & Supp 40,000 0% - 40,000 Books, Public, Subs 10,440 0% - 10,440 Training & Education 25,590 0% - 25,590
Capital Outlay
Capital - Buildings 95,000 0% - 95,000 Infrastructure 325,000 0% - 325,000 R18SSM San Mateo Drive Sidewalks 160,500 0% - 160,500 R20DSI Drainage System Improvements 701,400 0% - 701,400 Machinery & Equip 312,670 0% - 312,670
TOTAL OPERATING EXPENSES 11,891,720 218,360 11,673,360
TOTAL PERSONNEL & OPERATING EXPENSES 18,797,198 290,718 18,506,480
City of North Port | Road and Drainage District Non-Ad Valorem Assessment Methodology Stantec | 36
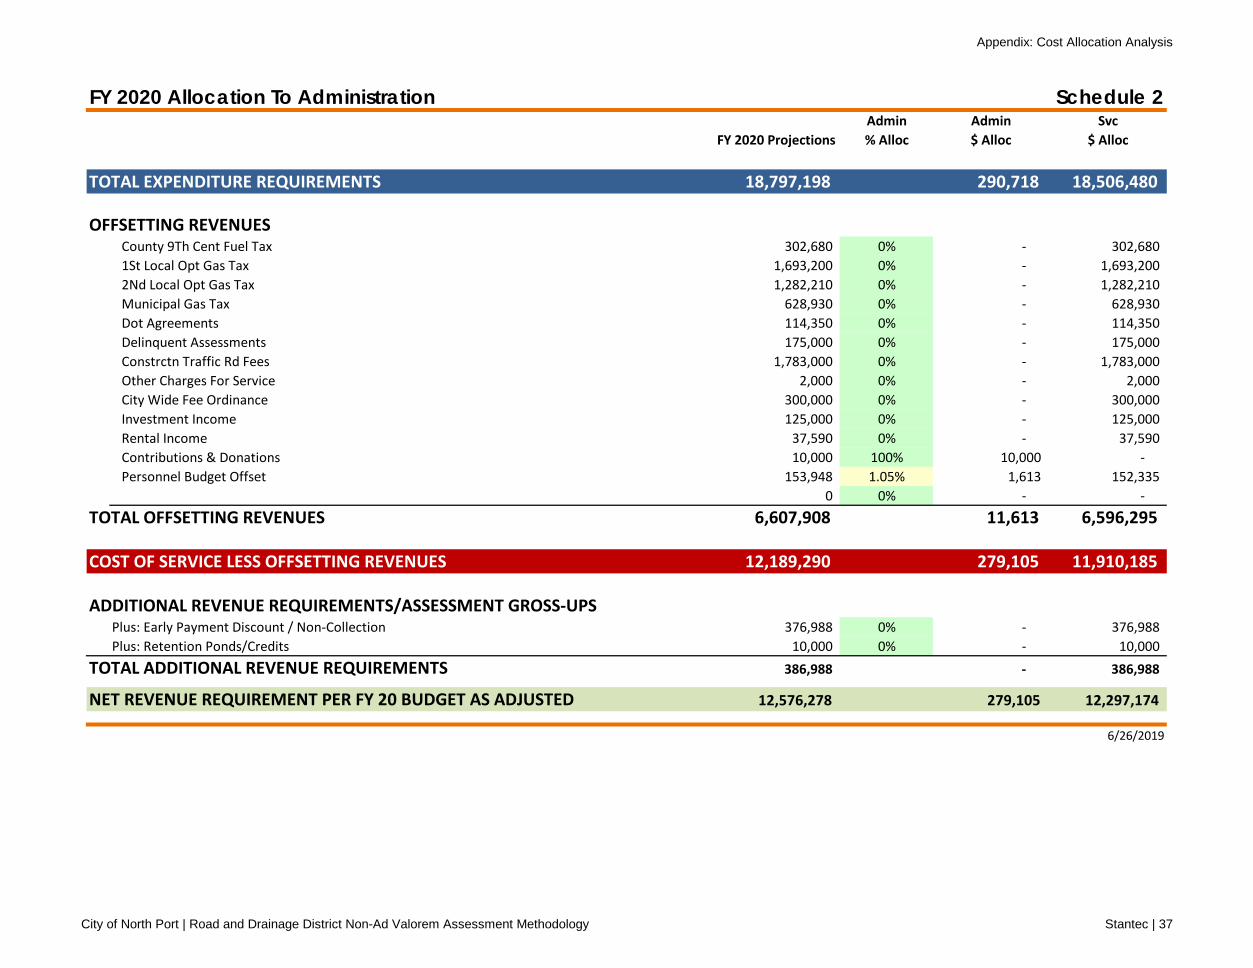
Appendix: Cost Allocation Analysis
FY 2020 Allocation To Administration Schedule 2Admin Admin Svc
FY 2020 Projections % Alloc $ Alloc $ Alloc
TOTAL EXPENDITURE REQUIREMENTS 18,797,198 290,718 18,506,480
OFFSETTING REVENUESCounty 9Th Cent Fuel Tax 302,680 0% - 302,680 1St Local Opt Gas Tax 1,693,200 0% - 1,693,200 2Nd Local Opt Gas Tax 1,282,210 0% - 1,282,210 Municipal Gas Tax 628,930 0% - 628,930 Dot Agreements 114,350 0% - 114,350 Delinquent Assessments 175,000 0% - 175,000 Constrctn Traffic Rd Fees 1,783,000 0% - 1,783,000 Other Charges For Service 2,000 0% - 2,000 City Wide Fee Ordinance 300,000 0% - 300,000 Investment Income 125,000 0% - 125,000 Rental Income 37,590 0% - 37,590 Contributions & Donations 10,000 100% 10,000 - Personnel Budget Offset 153,948 1.05% 1,613 152,335
0 0% - - TOTAL OFFSETTING REVENUES 6,607,908 11,613 6,596,295
COST OF SERVICE LESS OFFSETTING REVENUES 12,189,290 279,105 11,910,185
ADDITIONAL REVENUE REQUIREMENTS/ASSESSMENT GROSS-UPSPlus: Early Payment Discount / Non-Collection 376,988 0% - 376,988 Plus: Retention Ponds/Credits 10,000 0% - 10,000
TOTAL ADDITIONAL REVENUE REQUIREMENTS 386,988 - 386,988
NET REVENUE REQUIREMENT PER FY 20 BUDGET AS ADJUSTED 12,576,278 279,105 12,297,174
6/26/2019
City of North Port | Road and Drainage District Non-Ad Valorem Assessment Methodology Stantec | 37

Appendix: Cost Allocation Analysis
FY 2020 Allocation to Services Schedule 3
FY 2020 Asmt. Allocation Roads Drainage Roads DrainageBasis/Factor % Allocation % Allocation $ Allocation $ Allocation
PERSONNEL EXPENSESRoads Section Personnel Expenses 2,003,897 1,340,758 663,139 Drainage Section Personnel Expenses 2,312,982 14,996 2,297,986 Waterways Section Personnel Expenses 345,060 48,307 296,754 Engineering Section Personnel Expenses 1,246,983 611,342 635,642 Administration Personnel Expenses 924,198 462,099 462,099
TOTAL PERSONNEL EXPENSES 6,833,120 2,477,501 4,355,619
OPERATING EXPENSES
Professional Services - Asmt Revenue 38% 62% - - Legal Services 1,000 Asmt Revenue 38% 62% 384 616 Engineer-Architect 6,000 Staff Override 100% 0% 6,000 - Medical Services 3,000 Total PS 36% 64% 1,088 1,912 Other Profess Svc 123,580 Staff Override 95% 5% 117,401 6,179 Water Quality Testing 11,500 Staff Override 0% 100% - 11,500 Npdes (Monitoring) 18,470 Staff Override 0% 100% - 18,470 Surveyor 100,000 Staff Override 0% 100% - 100,000 Other Contract Svc 14,900 Staff Override 50% 50% 7,450 7,450 Travel & Per Diem 15,000 Total PS 36% 64% 5,439 9,561 Communication Svc 81,140 Total PS 36% 64% 29,419 51,721 Postage & Mailing 1,000 Ops PS 30% 70% 301 699 Water & Sewer 10,000 Total PS 36% 64% 3,626 6,374 Electric 15,000 Total PS 36% 64% 5,439 9,561 Street Lights Electric 500,000 Staff Override 100% 0% 500,000 - Traffic Lights Electric 13,700 Staff Override 100% 0% 13,700 - Rentals & Leases 14,350 Non Admin PS 34% 66% 4,894 9,456 Insurance 117,160 Total PS 36% 64% 42,479 74,681 R&M Office Equip 1,500 Tot. PS & Op Exp 57% 43% 857 643 R&M Veh & Equip 8,000 Staff Override 50% 50% 4,000 4,000 R&M Buildings 10,800 Total PS 36% 64% 3,916 6,884 R&M Water Control Struc 100,000 Staff Override 0% 100% - 100,000 R&M Road & Drainage 105,000 Staff Override 100% 0% 105,000 - R&M Streelights 85,000 Staff Override 100% 0% 85,000 - R&M Traffic Signals 40,000 Staff Override 100% 0% 40,000 - Landscaping 1,582,550 Staff Override 81.00% 19.00% 1,281,866 300,685 Road Maint Program 3,573,300 Staff Override 100% 0% 3,573,300 - Fleet - Admin 266,410 Ops PS 30% 70% 80,236 186,174 Fleet - Labor 269,640 Ops PS 30% 70% 81,209 188,431 Fleet - Parts 324,380 Ops PS 30% 70% 97,695 226,685 Fleet - Outsourced 78,280 Ops PS 30% 70% 23,576 54,704 Printing & Binding 1,500 Admin PS 50% 50% 750 750 Promotional Activities - Asmt Revenue 38% 62% - - Ads And Public Notices 1,000 Staff Override 50% 50% 500 500
City of North Port | Road and Drainage District Non-Ad Valorem Assessment Methodology Stantec | 38

Appendix: Cost Allocation Analysis
FY 2020 Allocation to Services Schedule 3
FY 2020 Asmt. Allocation Roads Drainage Roads DrainageBasis/Factor % Allocation % Allocation $ Allocation $ Allocation
Tags, Fees, Licenses 3,290 Staff Override 50% 50% 1,645 1,645 Tax Collector Fees - Asmt Revenue 38% 62% - - Landfill Disp Charges 77,500 Staff Override 100% 0% 77,500 - Food 500 Total PS 36% 64% 181 319 Payment To Gen Fund 1,823,150 Staff Override 60% 40% 1,093,890 729,260 Payment To Sw 9,000 Staff Override 75% 25% 6,750 2,250 Office Supplies 7,300 Total PS 36% 64% 2,647 4,653 Other Oper Supplies 25,500 Total PS 36% 64% 9,246 16,254 Fuel 290,000 Ops PS 30% 70% 87,341 202,659 Aquatic Weed Control 80,000 Staff Override 25% 75% 20,000 60,000 Uniforms 15,430 Non Admin PS 34% 66% 5,263 10,167 Drainage Supplies 50,000 Staff Override 0% 100% - 50,000 Street Signs (Includes Traffic Control Supplies) 71,000 Staff Override 100% 0% 71,000 - Minor Op Equip 56,930 Total PS 36% 64% 20,641 36,289 Road Materials & Supp 40,000 Staff Override 100% 0% 40,000 - Books, Public, Subs 10,440 Total PS 36% 64% 3,785 6,655 Training & Education 25,590 Total PS 36% 64% 9,278 16,312
Capital Outlay
Capital - Buildings 95,000 Staff Override 50% 50% 47,500 47,500 Infrastructure 325,000 Staff Override 50% 50% 162,500 162,500 R18SSM San Mateo Drive Sidewalks 160,500 Staff Override 100% 0% 160,500 - R20DSI Drainage System Improvements 701,400 Staff Override 0% 100% - 701,400 Machinery & Equip 312,670 Staff Override 50% 50% 156,335 156,335
- - TOTAL OPERATING EXPENSES 11,673,360 8,091,526 3,581,834
TOTAL PERSONNEL & OPERATING EXPENSES 18,506,480 10,569,027 7,937,453
TOTAL EXPENDITURE REQUIREMENTS 18,506,480 10,569,027 7,937,453
OFFSETTING REVENUESCounty 9Th Cent Fuel Tax 302,680 Staff Override 100% 0% 302,680 - 1St Local Opt Gas Tax 1,693,200 Staff Override 100% 0% 1,693,200 - 2Nd Local Opt Gas Tax 1,282,210 Staff Override 100% 0% 1,282,210 - Municipal Gas Tax 628,930 Staff Override 100% 0% 628,930 - Dot Agreements 114,350 Staff Override 100% 0% 114,350 - Delinquent Assessments 175,000 Asmt Revenue 38% 62% 67,224 107,776 Constrctn Traffic Rd Fees 1,783,000 Staff Override 100% 0% 1,783,000 - Other Charges For Service 2,000 Asmt Revenue 38% 62% 768 1,232 City Wide Fee Ordinance 300,000 Staff Override 0% 100% - 300,000 Investment Income 125,000 Asmt Revenue 38% 62% 48,017 76,983 Rental Income 37,590 Asmt Revenue 38% 62% 14,440 23,150
City of North Port | Road and Drainage District Non-Ad Valorem Assessment Methodology Stantec | 39

Appendix: Cost Allocation Analysis
FY 2020 Allocation to Services Schedule 3
FY 2020 Asmt. Allocation Roads Drainage Roads DrainageBasis/Factor % Allocation % Allocation $ Allocation $ Allocation
Contributions & Donations 0 Asmt Revenue 38% 62% - - Personnel Budget Offset 152,335 Total PS 36% 64% 55,232 97,102
Staff Override 0% 0% - - TOTAL OFFSETTING REVENUES 6,596,295 5,990,051 606,244
COST OF SERVICE LESS OFFSETTING REVENUES 11,910,185 4,578,976 7,331,210
ADDITIONAL REVENUE REQUIREMENTS/ASSESSMENT GROSS-UPSPlus: Early Payment Discount / Non-Collection 376,988 Asmt Revenue 38% 62% 144,815 232,173 Plus: Retention Ponds/Credits 10,000 Staff Override 0% 100% - 10,000
TOTAL ADDITIONAL REVENUE REQUIREMENTS 386,988 144,815 242,173
NET REVENUE REQUIREMENT PER FY 20 BUDGET AS ADJUSTED 12,297,174 4,723,790 7,573,383
6/26/2019
City of North Port | Road and Drainage District Non-Ad Valorem Assessment Methodology Stantec | 40
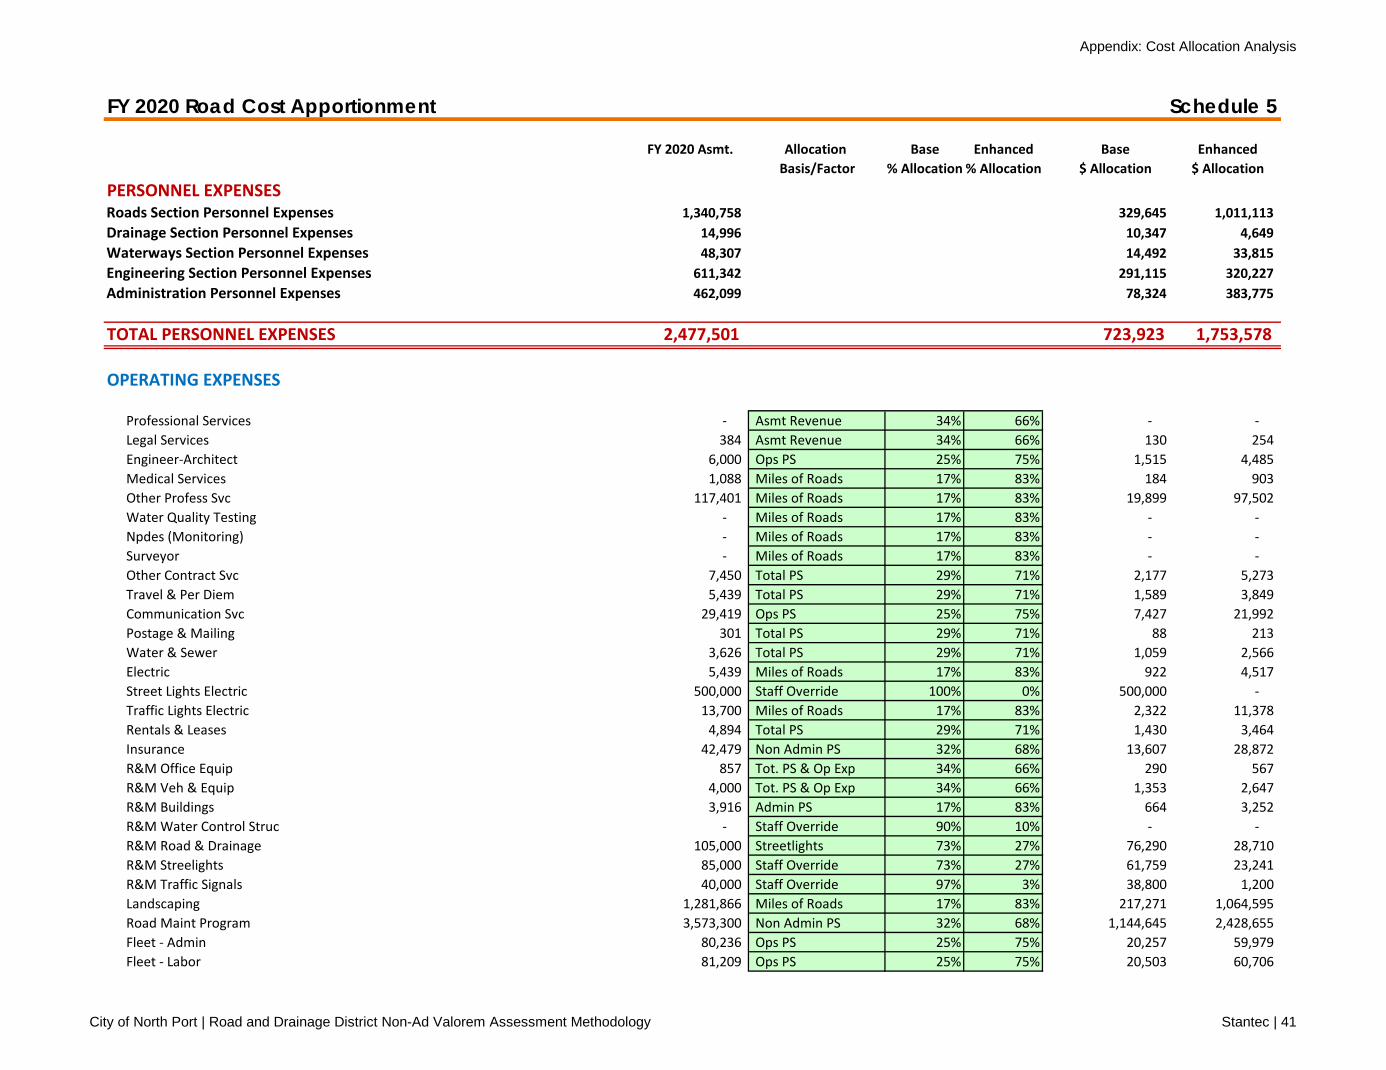
Appendix: Cost Allocation Analysis
FY 2020 Road Cost Apportionment Schedule 5
FY 2020 Asmt. Allocation Base Enhanced Base EnhancedBasis/Factor % Allocation % Allocation $ Allocation $ Allocation
PERSONNEL EXPENSESRoads Section Personnel Expenses 1,340,758 329,645 1,011,113 Drainage Section Personnel Expenses 14,996 10,347 4,649 Waterways Section Personnel Expenses 48,307 14,492 33,815 Engineering Section Personnel Expenses 611,342 291,115 320,227 Administration Personnel Expenses 462,099 78,324 383,775
TOTAL PERSONNEL EXPENSES 2,477,501 723,923 1,753,578
OPERATING EXPENSES
Professional Services - Asmt Revenue 34% 66% - - Legal Services 384 Asmt Revenue 34% 66% 130 254 Engineer-Architect 6,000 Ops PS 25% 75% 1,515 4,485 Medical Services 1,088 Miles of Roads 17% 83% 184 903 Other Profess Svc 117,401 Miles of Roads 17% 83% 19,899 97,502 Water Quality Testing - Miles of Roads 17% 83% - - Npdes (Monitoring) - Miles of Roads 17% 83% - - Surveyor - Miles of Roads 17% 83% - - Other Contract Svc 7,450 Total PS 29% 71% 2,177 5,273 Travel & Per Diem 5,439 Total PS 29% 71% 1,589 3,849 Communication Svc 29,419 Ops PS 25% 75% 7,427 21,992 Postage & Mailing 301 Total PS 29% 71% 88 213 Water & Sewer 3,626 Total PS 29% 71% 1,059 2,566 Electric 5,439 Miles of Roads 17% 83% 922 4,517 Street Lights Electric 500,000 Staff Override 100% 0% 500,000 - Traffic Lights Electric 13,700 Miles of Roads 17% 83% 2,322 11,378 Rentals & Leases 4,894 Total PS 29% 71% 1,430 3,464 Insurance 42,479 Non Admin PS 32% 68% 13,607 28,872 R&M Office Equip 857 Tot. PS & Op Exp 34% 66% 290 567 R&M Veh & Equip 4,000 Tot. PS & Op Exp 34% 66% 1,353 2,647 R&M Buildings 3,916 Admin PS 17% 83% 664 3,252 R&M Water Control Struc - Staff Override 90% 10% - - R&M Road & Drainage 105,000 Streetlights 73% 27% 76,290 28,710 R&M Streelights 85,000 Staff Override 73% 27% 61,759 23,241 R&M Traffic Signals 40,000 Staff Override 97% 3% 38,800 1,200 Landscaping 1,281,866 Miles of Roads 17% 83% 217,271 1,064,595 Road Maint Program 3,573,300 Non Admin PS 32% 68% 1,144,645 2,428,655 Fleet - Admin 80,236 Ops PS 25% 75% 20,257 59,979 Fleet - Labor 81,209 Ops PS 25% 75% 20,503 60,706
City of North Port | Road and Drainage District Non-Ad Valorem Assessment Methodology Stantec | 41

Appendix: Cost Allocation Analysis
FY 2020 Road Cost Apportionment Schedule 5
FY 2020 Asmt. Allocation Base Enhanced Base EnhancedBasis/Factor % Allocation % Allocation $ Allocation $ Allocation
Fleet - Parts 97,695 Ops PS 25% 75% 24,665 73,030 Fleet - Outsourced 23,576 Admin PS 17% 83% 3,996 19,580 Printing & Binding 750 Admin PS 17% 83% 127 623 Promotional Activities - Weighted Miles 23% 77% - - Ads And Public Notices 500 Ops PS 25% 75% 126 374 Tags, Fees, Licenses 1,645 Eng PS 48% 52% 783 862 Tax Collector Fees - Miles of Roads 17% 83% - - Landfill Disp Charges 77,500 Admin PS 17% 83% 13,136 64,364 Food 181 Miles of Roads 17% 83% 31 151 Payment To Gen Fund 1,093,890 Non Admin PS 32% 68% 350,409 743,481 Payment To Sw 6,750 Non Admin PS 32% 68% 2,162 4,588 Office Supplies 2,647 Non Admin PS 32% 68% 848 1,799 Other Oper Supplies 9,246 Ops PS 25% 75% 2,334 6,911 Fuel 87,341 Weighted Miles 23% 77% 20,471 66,870 Aquatic Weed Control 20,000 Non Admin PS 32% 68% 6,407 13,593 Uniforms 5,263 Non Admin PS 32% 68% 1,686 3,577 Drainage Supplies - Miles of Roads 17% 83% - - Street Signs (Includes Traffic Control Supplies) 71,000 Non Admin PS 32% 68% 22,744 48,256 Minor Op Equip 20,641 Miles of Roads 17% 83% 3,499 17,143 Road Materials & Supp 40,000 Non Admin PS 32% 68% 12,813 27,187 Books, Public, Subs 3,785 Non Admin PS 32% 68% 1,213 2,573 Training & Education 9,278 Non Admin PS 32% 68% 2,972 6,306
Capital Outlay
Capital - Buildings 47,500 Weighted Miles 23% 77% 11,133 36,367 Infrastructure 162,500 Weighted Miles 23% 77% 38,087 124,413 R18SSM San Mateo Drive Sidewalks 160,500 Direct Base 100% 0% 160,500 - R20DSI Drainage System Improvements - Weighted Miles 23% 77% - - Machinery & Equip 156,335 Weighted Miles 23% 77% 36,642 119,693
TOTAL OPERATING EXPENSES 8,091,526 2,850,965 5,240,560
TOTAL PERSONNEL & OPERATING EXPENSES 10,569,027 3,574,888 6,994,138
TOTAL EXPENDITURE REQUIREMENTS 10,569,027 3,574,888 6,994,138
OFFSETTING REVENUESCounty 9Th Cent Fuel Tax 302,680 Tot. PS & Op Exp 34% 66% 102,379 200,301
City of North Port | Road and Drainage District Non-Ad Valorem Assessment Methodology Stantec | 42

Appendix: Cost Allocation Analysis
FY 2020 Road Cost Apportionment Schedule 5
FY 2020 Asmt. Allocation Base Enhanced Base EnhancedBasis/Factor % Allocation % Allocation $ Allocation $ Allocation
1St Local Opt Gas Tax 1,693,200 Tot. PS & Op Exp 34% 66% 572,711 1,120,489 2Nd Local Opt Gas Tax 1,282,210 Tot. PS & Op Exp 34% 66% 433,697 848,513 Municipal Gas Tax 628,930 Tot. PS & Op Exp 34% 66% 212,731 416,199 Dot Agreements 114,350 Tot. PS & Op Exp 34% 66% 38,678 75,672 Delinquent Assessments 67,224 Tot. PS & Op Exp 34% 66% 22,738 44,486 Constrctn Traffic Rd Fees 1,783,000 Tot. PS & Op Exp 34% 66% 603,085 1,179,915 Other Charges For Service 768 Tot. PS & Op Exp 34% 66% 260 508 City Wide Fee Ordinance 0 Tot. PS & Op Exp 34% 66% - - Investment Income 48,017 Tot. PS & Op Exp 34% 66% 16,241 31,776 Rental Income 14,440 Tot. PS & Op Exp 34% 66% 4,884 9,556 Contributions & Donations 0 Weighted Miles 23% 77% - - Personnel Budget Offset 55,232 Total PS 29% 71% 16,139 39,094
TOTAL OFFSETTING REVENUES 5,990,051 2,023,544 3,966,508
COST OF SERVICE LESS OFFSETTING REVENUES 4,578,976 1,551,345 3,027,631
ADDITIONAL REVENUE REQUIREMENTS/ASSESSMENT GROSS-UPSPlus: Early Payment Discount / Non-Collection 144,815 Asmt Revenue 34% 66% 49,063 95,752 Plus: Retention Ponds/Credits - Asmt Revenue 34% 66% - -
TOTAL ADDITIONAL REVENUE REQUIREMENTS 144,815 49,063 95,752
NET REVENUE REQUIREMENT PER FY 20 BUDGET AS ADJUSTED 4,723,790 1,600,408 3,123,383
6/26/2019
City of North Port | Road and Drainage District Non-Ad Valorem Assessment Methodology Stantec | 43

Appendix: Cost Allocation Analysis
FY 2020 Drainage Cost Apportionment Schedule 6
FY 2020 Asmt. Allocation Primary Secondary Tertiary Primary Secondary TertiaryBasis/Factor % Allocation % Allocation % Allocation $ Allocation $ Allocation $ Allocation
PERSONNEL EXPENSESRoads Section Personnel Expenses 663,139 44,655 290,634 327,849 Drainage Section Personnel Expenses 2,297,986 764,195 533,973 999,818 Waterways Section Personnel Expenses 296,754 259,484 37,269 - Engineering Section Personnel Expenses 635,642 195,162 161,954 278,526 Administration Personnel Expenses 462,099 152,250 146,404 163,444
TOTAL PERSONNEL EXPENSES 4,355,619 1,415,747 1,170,235 1,769,637
OPERATING EXPENSES
Professional Services - Asmt Revenue 31% 25% 44% - - - Legal Services 616 Asmt Revenue 31% 25% 44% 192 151 273 Engineer-Architect - Staff Override 33% 33% 33% - - - Medical Services 1,912 Non Admin PS 32% 26% 41% 621 503 789 Other Profess Svc 6,179 Asmt Revenue 31% 25% 44% 1,926 1,519 2,734 Water Quality Testing 11,500 Staff Override 100% 0% 0% 11,500 - - Npdes (Monitoring) 18,470 Staff Override 100% 0% 0% 18,470 - - Surveyor 100,000 Staff Override 0% 0% 100% - - 100,000 Other Contract Svc 7,450 Asmt Revenue 31% 25% 44% 2,323 1,831 3,296 Travel & Per Diem 9,561 Non Admin PS 32% 26% 41% 3,103 2,514 3,944 Communication Svc 51,721 Non Admin PS 32% 26% 41% 16,784 13,600 21,336 Postage & Mailing 699 Non Admin PS 32% 26% 41% 227 184 288 Water & Sewer 6,374 Non Admin PS 32% 26% 41% 2,069 1,676 2,630 Electric 9,561 Non Admin PS 32% 26% 41% 3,103 2,514 3,944 Street Lights Electric - Non Admin PS 32% 26% 41% - - - Traffic Lights Electric - Non Admin PS 32% 26% 41% - - - Rentals & Leases 9,456 Non Admin PS 32% 26% 41% 3,068 2,486 3,901 Insurance 74,681 Non Admin PS 32% 26% 41% 24,235 19,638 30,808 R&M Office Equip 643 Non Admin PS 32% 26% 41% 209 169 265 R&M Veh & Equip 4,000 Non Admin PS 32% 26% 41% 1,298 1,052 1,650 R&M Buildings 6,884 Non Admin PS 32% 26% 41% 2,234 1,810 2,840 R&M Water Control Struc 100,000 Staff Override 100% 0% 0% 100,000 - - R&M Road & Drainage - Admin PS 33% 32% 35% - - - R&M Streelights - Admin PS 33% 32% 35% - - - R&M Traffic Signals - Admin PS 33% 32% 35% - - - Landscaping 300,685 Staff Override 0% 8% 92% - 24,055 276,630 Road Maint Program - Admin PS 33% 32% 35% - - - Fleet - Admin 186,174 Ops PS 33% 26% 41% 61,051 49,253 75,871 Fleet - Labor 188,431 Ops PS 33% 26% 41% 61,791 49,850 76,790 Fleet - Parts 226,685 Ops PS 33% 26% 41% 74,335 59,970 92,380 Fleet - Outsourced 54,704 Ops PS 33% 26% 41% 17,939 14,472 22,293 Printing & Binding 750 Admin PS 33% 32% 35% 247 238 265 Promotional Activities - Admin PS 33% 32% 35% - - - Ads And Public Notices 500 Admin PS 33% 32% 35% 165 158 177 Tags, Fees, Licenses 1,645 Ops PS 33% 26% 41% 539 435 670 Tax Collector Fees - Asmt Revenue 31% 25% 44% - - - Landfill Disp Charges - Ops PS 33% 26% 41% - - - Food 319 Admin PS 33% 32% 35% 105 101 113 Payment To Gen Fund 729,260 Tot. PS & Op Exp 31% 25% 44% 226,846 179,650 322,764 Payment To Sw 2,250 Non Admin PS 32% 26% 41% 730 592 928 Office Supplies 4,653 Non Admin PS 32% 26% 41% 1,510 1,224 1,920
City of North Port | Road and Drainage District Non-Ad Valorem Assessment Methodology Stantec | 44

Appendix: Cost Allocation Analysis
FY 2020 Drainage Cost Apportionment Schedule 6
FY 2020 Asmt. Allocation Primary Secondary Tertiary Primary Secondary TertiaryBasis/Factor % Allocation % Allocation % Allocation $ Allocation $ Allocation $ Allocation
Other Oper Supplies 16,254 Non Admin PS 32% 26% 41% 5,275 4,274 6,705 Fuel 202,659 Non Admin PS 32% 26% 41% 65,765 53,291 83,603 Aquatic Weed Control 60,000 Ops PS 33% 26% 41% 19,675 15,873 24,452 Uniforms 10,167 Non Admin PS 32% 26% 41% 3,299 2,674 4,194 Drainage Supplies 50,000 Non Admin PS 32% 26% 41% 16,226 13,148 20,626 Street Signs (Includes Traffic Control Supplies) - Non Admin PS 32% 26% 41% - - - Minor Op Equip 36,289 Non Admin PS 32% 26% 41% 11,776 9,542 14,970 Road Materials & Supp - Non Admin PS 32% 26% 41% - - - Books, Public, Subs 6,655 Non Admin PS 32% 26% 41% 2,160 1,750 2,745 Training & Education 16,312 Non Admin PS 32% 26% 41% 5,293 4,289 6,729
Capital Outlay
Capital - Buildings 47,500 Non Admin PS 32% 26% 41% 15,414 12,490 19,595 Infrastructure 162,500 Non Admin PS 32% 26% 41% 52,733 42,731 67,036 R18SSM San Mateo Drive Sidewalks - Total PS 24% 22% 54% - - - R20DSI Drainage System Improvements 701,400 Staff Override 24% 22% 54% 168,336 154,308 378,756 Machinery & Equip 156,335 Non Admin PS 32% 26% 41% 50,733 41,109 64,493
TOTAL OPERATING EXPENSES 3,581,834 1,053,305 785,124 1,743,405
TOTAL PERSONNEL & OPERATING EXPENSES 7,937,453 2,469,052 1,955,359 3,513,042
TOTAL EXPENDITURE REQUIREMENTS 7,937,453 2,469,052 1,955,359 3,513,042
OFFSETTING REVENUESCounty 9Th Cent Fuel Tax 0 Asmt Revenue 31% 25% 44% - - - 1St Local Opt Gas Tax 0 Asmt Revenue 31% 25% 44% - - - 2Nd Local Opt Gas Tax 0 Asmt Revenue 31% 25% 44% - - - Municipal Gas Tax 0 Asmt Revenue 31% 25% 44% - - - Dot Agreements 0 Asmt Revenue 31% 25% 44% - - - Delinquent Assessments 107,776 Asmt Revenue 31% 25% 44% 33,601 26,487 47,688 Constrctn Traffic Rd Fees 0 Asmt Revenue 31% 25% 44% - - - Other Charges For Service 1,232 Asmt Revenue 31% 25% 44% 384 303 545 City Wide Fee Ordinance 300,000 Asmt Revenue 31% 25% 44% 93,530 73,727 132,743 Investment Income 76,983 Asmt Revenue 31% 25% 44% 24,001 18,919 34,063 Rental Income 23,150 Asmt Revenue 31% 25% 44% 7,218 5,689 10,243 Contributions & Donations 0 Asmt Revenue 31% 25% 44% - - - Personnel Budget Offset 97,102 Total PS 33% 27% 41% 31,562 26,089 39,452 0 0 Non Admin PS 32% 26% 41% - - -
TOTAL OFFSETTING REVENUES 606,244 190,296 151,213 264,734
COST OF SERVICE LESS OFFSETTING REVENUES 7,331,210 2,278,756 1,804,146 3,248,308 2,303,336 1,602,485 2,693,545
ADDITIONAL REVENUE REQUIREMENTS/ASSESSMENT GROSS-UPSPlus: Early Payment Discount / Non-Collection 232,173 Asmt Revenue 31% 25% 44% 72,384 57,058 102,731 Plus: Retention Ponds/Credits 10,000 Staff Override 100% 0% 0% 10,000 - -
TOTAL ADDITIONAL REVENUE REQUIREMENTS 242,173 82,384 57,058 102,731
NET REVENUE REQUIREMENT PER FY 20 BUDGET AS ADJUSTED 7,573,383 2,361,141 1,861,204 3,351,039
6/26/2019
City of North Port | Road and Drainage District Non-Ad Valorem Assessment Methodology Stantec | 45

Appendix: Cost Allocation Analysis
FY 2020 Revenue Requirement Allocation Summary Schedule 7
Admin Mowing Road Drainage Total ResetAll All All All All No
FY 2019 Gross Asmt Rev. Per Roll N/A 2,304,695$ 3,806,351$ 5,714,246$ 11,825,292$ FY 2020 Cost Allocation Amount 279,105$ -$ 4,723,790$ 7,573,383$ 12,576,278$ Variance (Allocation - Asmt) (2,304,695)$ 917,440$ 1,859,137$ 750,987$
AdminAll Admin Mowing Admin Base Enhanced Admin Primary Secondary Tertiary
FY 2019 Gross Asmt Rev. Per Roll N/A 165,302$ 2,139,394$ 397,337$ 1,078,227$ 2,330,787$ 387,226$ 2,517,488$ 1,381,052$ 1,428,480$ FY 2020 Allocation of Asmt. Rev. Req. 279,105$ -$ -$ -$ 1,600,408$ 3,123,383$ -$ 2,361,141$ 1,861,204$ 3,351,039$ Variance (Allocation - Asmt) (165,302)$ (2,139,394)$ (397,337)$ 522,180$ 792,596$ (387,226)$ (156,347)$ 480,152$ 1,922,558$
Gross Asmt. Rev. Requirement 12,576,278$
Mowing Road Drainage
Summary of FY 2019 Gross Assessment Revenue
Breakdown of Gross Assessment Revenue
City of North Port | Road and Drainage District Non-Ad Valorem Assessment Methodology Stantec | 46