Embed Size (px)
Citation preview

WWW.RABCONSULTANTS.CO.UK
Oaston Road, Nuneaton – Drainage 13 April 2017
Version 3.0
RAB: 1558L


1558L
Version 3.0
i | P a g e
Revision History
Version Date Amendments Issued to
Version 1.0 13.04.2017 First issue George Doupnik
Version 2.0 12.06.2017 Amended surface water design George Doupnik
Version 3.0 17.07.2017 Comments addressed George Doupnik
Quality Control
Action Signature Date
Prepared T. Haskey 17.07.2017
Checked P. Batty 17.07.2017
Approved G. Wilson 17.07.2017
Disclaimer
This document has been prepared solely as a drainage strategy report for Jade Homes Construction.
RAB Consultants accepts no responsibility or liability for any use that is made of this document other
than by the client for the purposes for which it was originally commissioned and prepared. No person
other than the client may copy (in whole or in part) use or rely on the contents of this document, without
the prior written permission of the Managing Director of RAB Consultants Ltd. Any advice, opinions, or
recommendations within this document should be read and relied upon only in the context of the
document as a whole.
RAB Office
Lichfield Office
Cathedral House
Beacon Street
Lichfield
WS13 7AA

1558L
Version 3.0
ii | P a g e
This page intentionally left blank

1558L
Version 3.0
iii | P a g e
Contents
1.0 INTRODUCTION................................................................................................................ 1
2.0 SITE DETAILS ................................................................................................................... 1
2.1 Site location ................................................................................................................................... 1
2.2 Site description .............................................................................................................................. 1
2.3 Development proposal ................................................................................................................... 2
3.0 SURFACE WATER ............................................................................................................ 2
3.1 Existing drainage ........................................................................................................................... 2
3.2 Proposed SuDS drainage .............................................................................................................. 2
3.3 SuDS Management Plan ............................................................................................................... 5
4.0 FOUL WATER ................................................................................................................... 6
4.1 Existing drainage ........................................................................................................................... 6
4.2 Proposed drainage ........................................................................................................................ 7
5.0 RECOMMENDATIONS ...................................................................................................... 7
APPENDIX A – SITE INVESTIGATION ....................................................................................... 8
APPENDIX B – ENVIRONMENT AGENCY FLOOD ACTIVITY EXEMPTION PERMIT ............ 10
APPENDIX C – NETWORK ARRANGEMENT .......................................................................... 12
APPENDIX D – SUBMERGED OUTFALL MICRO-DRAINAGE RESULTS ............................... 14
APPENDIX E –MICRO-DRAINAGE RESULTS ......................................................................... 16

1558L
Version 3.0
iv | P a g e
This page intentionally left blank

1558L
Version 3.0
1 | P a g e
1.0 Introduction
RAB Consultants has prepared this technical drainage report in support of the proposed development of
the land off Oaston Road, Nuneaton.
2.0 Site details
2.1 Site location
Table 1 – Site location
Site address Land of Oaston Road, CV11 6PD
Site area 0.325ha
Existing land use Old railway Embankment
OS NGR SP 37141 921111
Local Planning Authority Nuneaton and Bedworth Borough Council
2.2 Site description
The proposed site is currently an overgrown area of land adjacent to Oaston Road. The Nuneaton Flood
Relief Channel runs parallel to the north east boundary of the site at a distance of approximately 8m.
Access to the site is directly from Oaston Road.

1558L
Version 3.0
2 | P a g e
2.3 Development proposal
It is proposed to construct a total of 11 dwellings on the development site, all with associated parking areas
and gardens.
3.0 Surface water
3.1 Existing drainage
The total site area is approx. 3250m2 and comprises of undeveloped land and a small area of hardstanding
at the south of the site.
Existing impermeable areas have been determined from a topographic survey of the site undertaken by
Chandler Land and Building Surveys Ltd in December 2016.
The existing impermeable area is approximately 350m2 and assumed to have no formal drainage.
The remaining 2900m2 is not formally drained. Therefore, rain falling onto the site which is not able to infiltrate will follow the natural topography and either flow to the east, towards the Nuneaton Flood Relief Channel or to the south east towards Oaston Road.
3.2 Proposed SuDS drainage
A search of Nuneaton and Bedworth Borough Council’s website revealed no specific policy documents
relating to SuDS, however, the general advice that is available is clearly supportive of the use of SuDS, in
line with national SuDS standards.
The SuDS Manual (2015), discusses the SuDS approach to managing surface water runoff which is
intended to mimic the natural catchment process as closely as is possible. The approach sets out the
design objectives in respect of SuDS:
• Use of surface water runoff as a resource
• Manage rainwater close to where it falls (at source)
• Manage runoff on the surface (above ground)
• Allow rainwater to soak into the ground (infiltration)
• Promote evapotranspiration
• Slow and store runoff to mimic natural runoff rates and volumes
• Reduce contamination of runoff through pollution prevention and by controlling the runoff at
source
• Treat runoff to reduce the risk of urban contaminants causing environmental pollution
Depending on the characteristics of the site and local requirements, these may be used in conjunction and
to varying degrees.
The recommended hierarchy for discharging surface water (ref. The SuDS Manual, CIRIA C753) is:
1. Infiltration to the maximum extent that is practical.
2. Discharge to surface waters.
3. Discharge to surface water sewer.

1558L
Version 3.0
3 | P a g e
4. Discharge to combined sewers.
In this case, the site investigation (refer to report by Stuart Cooke January 2017 Appendix A) shows that
the natural underlying (natural clays) would not readily allow infiltration directly into the ground.
The Nuneaton Flood Relief Channel is the nearest watercourse and is located approximately 8m from the
site. This watercourse is the preferred discharge location for the site in line with the discharge hierarchy.
Consultation with the Environment Agency has resulted in a flood activity exemption permit (Appendix B)
been registered for the surface water discharge to this watercourse.
Table 2 presents the general functions of SuDS components (from which a management train is
constructed) and their feasibility in respect of the site.
TABLE 2: FEASIBILITY OF SUDS TECHNIQUES AT THE DEVELOPMENT SITE
Technique Description Feasibility
Y / N / M (Maybe)
Good building design and rainwater
harvesting
Components that capture rainwater
and facilitate its use within the
building or local environment.
Yes – it is feasible to
incorporate formal water
harvesting into the
proposed development.
Alternatively, a lower
cost option would be to
include water butts on
downpipes and reuse for
landscaped areas.
Porous and pervious surface
materials
Structural surfaces that allow water
to penetrate, thus reducing the
proportion of runoff that is conveyed
to the drainage system (green roofs,
pervious paving).
No - Ground unsuitable
for infiltration
Infiltration Systems
Components that facilitate the
infiltration of water into the ground.
These often include temporary
storage zones to accommodate
runoff volumes before slow release
to the soil.
No - Ground unsuitable
for infiltration
Conveyance Systems
Components that convey flows to
downstream storage systems (e.g.
swales, watercourses).
No – Space on the site is
severely limited and the
ground unsuitable for
infiltration

1558L
Version 3.0
4 | P a g e
Storage Systems
Components that control the flows
and, where possible, volumes of
runoff being discharged from the
site, by storing water and releasing
it slowly (attenuation). These
systems may also provide further
treatment of the runoff (e.g. ponds,
wetlands, and detention basins).
Yes – There is scope for
a below ground storage
system.
Treatment Systems Components that remove or
facilitate the degradation of
contaminants present in the runoff.
Yes
There are 2 major constraints limiting the use of SuDS: (1) the ground condition is considered unsuitable
for infiltration (2) space on the site is severely limited, with the majority of ground being used for
development.
It is therefore proposed to collect all surface water runoff into a below ground attenuation tank located to
the south of the site. A practicable minimum limit on the discharge rate (in line with guidance from DEFRA
and the Environment Agency report – SC030219, Rainfall runoff management for developments) will be set
at 5l/s, as a compromise between attenuation while keeping the risk of blockage to an acceptable level.
The final discharge will be into the Nuneaton Flood Relief channel.
The arrangement is shown in Appendix C.
Building rooftops will be drained into 150mm and 175mm pipes discharging to the attenuation tank. The
access road, parking areas and hardstanding will drain via an arrangement of gullies and channel drains all
discharging to the attenuation tank.
A 127m3 tank (supporting calculation in Appendix D & E) constructed from 300x Hydro International
Stormbloc units or equivalent (800mm x 800mm x 660mm) arranged in a square or rectangle will be
utilised, set at an invert level of 81.480mAOD. Inlets to and the outlet from the tank will be created with
inspection chambers / catch pits to allow access for inspection, maintenance and to trap sediment. A MD-
SHE-0087-5000-2473-5000 type Hydrobrake (or equivalent – deigned to control flow to no more than 5/ls
with a 2.473m head) set at an invert level of 81.480mAOD will be utilised as an outflow controller.
The final outlet into the Nuneaton Flood Relief Channel is set at 80.766mAOD. This is higher than the
modelled 10% AEP flood level (80.71mAOD), as modelled by the Environment Agency. More extreme
flooding such as the 0.5% AEP (81.65mAOD), would result in the outfall been submerged by a depth of
0.9m, therefore a flap valve is required to stop the tank filling in such event. In this circumstance then the
drainage system would be affected. This has been separately modelled and the full results can be found in
Appendix D.
The full network has been modelled using the Network module of Microdrainage 2016.1.1.
A total drained area of 0.224ha was applied.
FEH2013 point rainfall data was used.
The results show no flooding with 3.33% Annual Exceedance Probability (AEP) rain. The critical storm has
duration 180 minutes and produces a peak water depth of 0.382m within the tank (0.278m from the top of
the tank). The available storage volume within the tank is 127m3, which is 53% more than the peak stored

1558L
Version 3.0
5 | P a g e
water volume during the 3.33% AEP critical storm. The additional tank volume provides mitigation against
sediment build up within the tank.
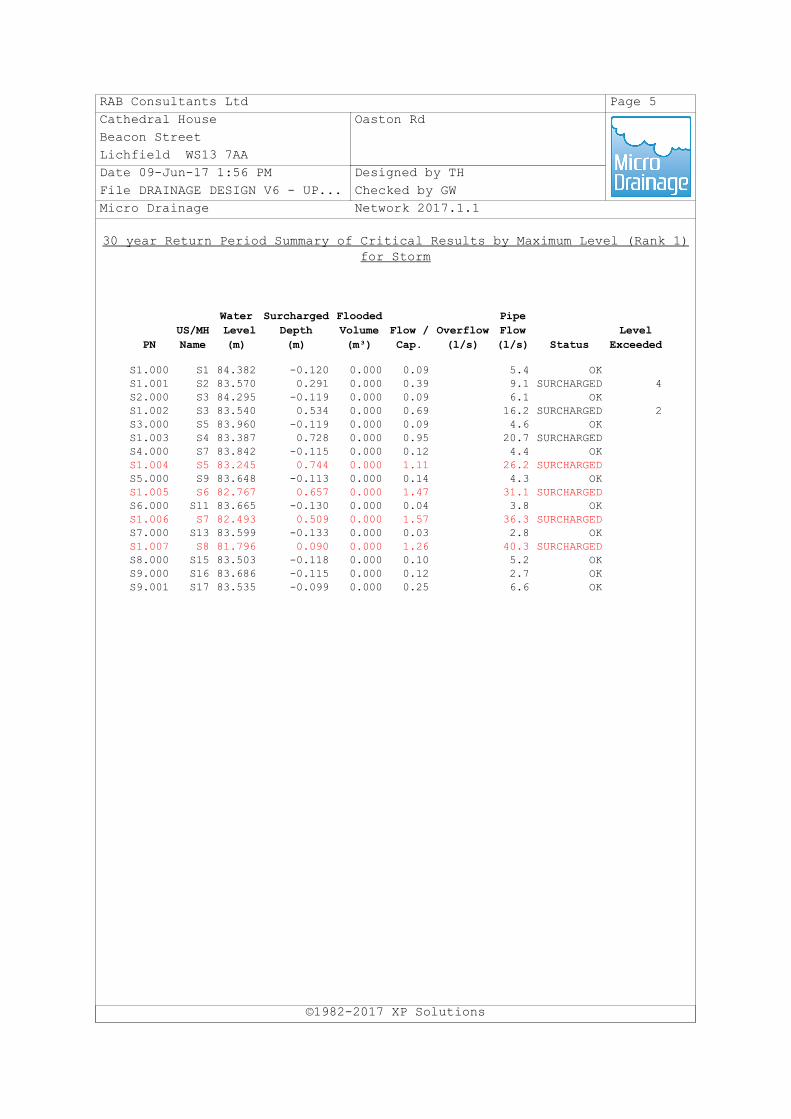
The 1% Annual Exceedance Probability rain plus 40% for climate change results show a small amount of
flooding. The critical storm has a duration of 240 minutes and produces a peak water depth of 2.473m
(1.8m above the top of the tank). This results in a flooded volume of 5.8m3 from manhole 1.008 and 4.7m3
from manhole 1.001. This is a small volume in comparison to the size of the site and could easily be
contained within the access road using kerbs.
With submerged outlet, again no flooding is observed with a 3.33% AEP storms, while 1% AEP plus 40%
results show a slight increase of flooded volume (21.9m3 from manhole 1.008 and 4.7m3 from manhole
1.001). Figure 1 below shows the worst case scenario of flooding at the site, during a 1% AEP Plus climate
change (40%) event with a submerged outlet. It shows that the flood waters directed away from buildings
and are contained within the site.
FIGURE 1 – SCREENSHOT SHOWING WORSE CASE FLOODING IN A SUBMERGED OUTLET SCENARIO
The Microdrainage results are included in Appendix E
3.3 SuDS Management Plan
The long-term design objectives of the drainage scheme are:
• Efficiently collect all rainfall from the rooftops of the eleven buildings, driveway, parking, paths and
runoff from permeable areas enclosed within the development.

1558L
Version 3.0
6 | P a g e
• Efficiently convey all collected rainfall into an online attenuation storage tank, with available volume
of at least 127m3.
• Provide effective conveyance through the storage tank by utilising a geocellular Stormbloc (or
equivalent product) set on a slight downward gradient (1:200) providing unobstructed inlet / outlet,
with a 110mm diameter vent.
• Protect the available storage within the tank by limiting debris / sediment entering the system, by
means of gratings on drain inlets, catch pits at both inlet and outlet to the tank.
• Limit the discharge leaving the attenuation storage tank to 5.0l/s by means of a vortex flow controller
set in the outlet catch pit.
• Route the controlled discharge into the Nuneaton Flood Relief Chanel.
• Protect the design objectives by implementing a maintenance schedule.
• Manage design exceedance and failure by providing an emergency bypass / overflow on the outlet
catch pit and shaping the ground to direct flood water away from houses.
Management responsibility
A private management company will be employed to inspect and maintain the surface water drainage
scheme down to the watercourse outlet.
Maintenance schedule
TABLE 3: SUSTAINABLE DRAINAGE MAINTENANCE SCHEDULE
Level Action Frequency
Regular maintenance
Inspect and identify any areas
that are not operating correctly.
If required, take remedial action.
Monthly for 3 months then
annually
Regular maintenance Remove debris from the
catchment surface. Monthly
Regular maintenance Remove sediment from catch
pits. Annually
Remedial actions Repair / rehabilitate inlet, outlet,
overflow and vent. As required
Monitoring
Inspect / check all inlets, outlets,
vents and overflows to ensure
that they are in good condition
and operating as designed
Annually
Monitoring Survey inside of tank for
sediment build-up and remove if
necessary.
Every 5 years or as required
4.0 Foul water
4.1 Existing drainage

1558L
Version 3.0
7 | P a g e
There is no existing foul drainage network.
4.2 Proposed drainage
The foul water drainage design will be provided at a later date.
5.0 Recommendations
• Install pipes, inspection chambers, tank, inlet, outlet, vortex flow controller, connections in line with
manufacturers recommendations and current best practice (WRc Sewers for Adoption 7th Edition
2012, CIRIA SuDS Manual C753 2015).
• Undertake a geotechnical site investigation to establish foundation design and installation
parameters for the tank, taking account of any groundwater flows and leakage risk from the tank.
This should include an investigation as to whether groundwater linked to an extreme flood event in
the channel could affect the tank.
• Ensure the tank is water tight by following manufacturers recommendations and wet testing prior to
back filling.
• Construct outflow headwall in line the registered Environment Agency flood risk exemption.
• Install a flap valve on the outlet.
• Implement a SuDS Management Plan in line with that given in Section 3.3 of this report.

1558L
Version 3.0
8 | P a g e
Appendix A – Site Investigation

1558L
Version 3.0
9 | P a g e
Page intentionally left blank

STUART COOKE GEOTECHNICAL CONSULTANT
12 First Lane St. James Northampton NN5 5FD 07821 194003 [email protected]
SOIL INFILTRATION TESTING REPORT
Crossing Gates, Oaston Road, Nuneaton, Warwickshire
Report No.: SAC17-200
Client: Jade Homes Construction Ltd
January 2017

STUART COOKE GEOTECHNICAL CONSULTANT
12 First Lane St. James Northampton NN5 5FD 07821 194003 [email protected]
INTRODUCTION
Soil infiltration tests have been undertaken on land known as Crossing Gates, Oaston Road, Nuneaton,
Warwickshire where a residential development is proposed. The tests were required to assess the viability of
using soakaways for surface water drainage and, if achievable, provide parameters for their design. The work
was carried out in accordance with Building Research Establishment (BRE) Digest 365:1991 “Soakaway
Design”.
SITE WORK
The tests were carried out at two locations, ST1 and ST2. The pits for the tests had been excavated some
weeks prior to the day of testing so accurate logging of the ground conditions was not undertaken by this
Practice. However, it was noted that the soils comprised a significant thickness of Made Ground overlying
natural clays of the Mercia Mudstone formation.
For the tests, the pit dimensions were carefully measured and then part-filled using a mobile water bowser.
The starting water levels were below the base level of the Made Ground. The fall in water level was then
measured over several time increments. However, it was soon apparent that ground permeability was very low
with virtually no fall in water level over the 60 to 90 minutes approximately following filling and the tests were
abandoned as ‘unsuccessful’.
The results of the testing are presented in the Appendix, along with a plan indicating the locations of the test
pits.
S.A.COOKE BSc. (Hons)
Geotechnical Engineer

APPENDIX 1
SOIL INFILTRATION TEST RESULTS

Stuart Cooke - Geotechnical Consultant
12 First Lane Project:
St. James
Northampton
NN5 5FD
Project No:
Test Location: ST1 Test No: 1 Date: 18.01.17
Water level during test Trial pit dimensions
Time Depth depth (m) 2.30
mins m bgl length (m) 1.50
0 1.420 width (m) 0.70
5 1.410
35 1.410
51 1.410
60 1.410
82 1.410
f = soil infiltration rate
Vp = volume of water from 75% to 25% effective depth
ap = Internal surface area at 50% effective depth
tp = time for the water level to fall from 75% to 25% effective depth
time at 75% effective depth (mins)
time at 25% effective depth (mins)
(from graph)
No result - infiltration rate too slow
Calculated Soil Infiltration Rate = - m/sec
Oaston Road, Nuneaton
SAC17-200
Soil Infiltration Test
pp
p
t
Vf
a
1 0 0 %
7 5 %
5 0 %
2 5 %
1.40
1.60
1.80
2.00
2.20
0 20 40 60 80 100 120 140 160 180 200 220 240
Dep
th t
o W
ate
r, m
bg
l
Elapsed Time, minutes
Depth to Water vs Elapsed Time
QD047 Issue A

Stuart Cooke - Geotechnical Consultant
12 First Lane Project:
St. James
Northampton
NN5 5FD
Project No:
Test Location: ST2 Test No: 1 Date: 18.01.17
Water level during test Trial pit dimensions
Time Depth depth (m) 2.50
mins m bgl length (m) 1.50
0 1.530 width (m) 0.70
4 1.530
30 1.530
48 1.530
f = soil infiltration rate
Vp = volume of water from 75% to 25% effective depth
ap = Internal surface area at 50% effective depth
tp = time for the water level to fall from 75% to 25% effective depth
time at 75% effective depth (mins)
time at 25% effective depth (mins)
(from graph)
No result - infiltration rate too slow
Calculated Soil Infiltration Rate = - m/sec
Oaston Road, Nuneaton
SAC17-200
Soil Infiltration Test
pp
p
t
Vf
a
1 0 0 %
7 5 %
5 0 %
2 5 %
1.50
1.70
1.90
2.10
2.30
2.50
0 20 40 60 80 100 120 140 160 180 200 220 240
Dep
th t
o W
ate
r, m
bg
l
Elapsed Time, minutes
Depth to Water vs Elapsed Time
QD047 Issue A

APPENDIX 2
TEST LOCATION PLAN

Test Location
Oasten Road, Nuneaton SAC17-200 January 2017
INFILTRATION TEST LOCATION PLAN
STUART COOKE GEOTECHNICAL CONSULTANT
12 First Lane, St James, Northampton NN5 5FD 07821 194003
ST2
ST1

1558L
Version 3.0
10 | P a g e
Appendix B – Environment Agency flood activity exemption permit

1558L
Version 3.0
11 | P a g e
Page intentionally left blank

From: Environment Agency Flood Risk Activity Exemptions <[email protected]>Sent: Tuesday, March 28, 2017 8:53 AMTo: Thomas HaskeySubject: Flood risk activity exemption successfully registered
We’ve registered your flood risk activity exemption Your reference is EXFRA002102 Exemption registered:Outfall pipes less than 300mm diameter through a headwall FRA12 at grid reference SP 37161 92115. Before you start workCheck you can meet the exemption conditionsYou should re-check you can meet the description and conditions of your exemption in the flood risk exemptions guidance. Other things to checkYou should check if there are protected species in the area. If there are, you must make sure your activity doesn’t harm them. You may also need planning permission and to get the landowner's permission to enter the land. Date of registration28 March 2017 08:52 Exemptions don’t expire except for dredging FRA23 which expires 3 years after the registration date and dredging FRA24 which expires 1 year after the registration date. Responsible for activity (the ‘operator’)Jade Homes 28, FAIRLANDS PARK COVENTRY CV4 7DS Who we will contactGeorge Doupnik, project director Tel: 07967801877 [email protected] Responsibilities of the operatorThe organisation or individual responsible must keep to the description and conditions for the exemption. We can prosecute them if they don’t do this. If your activity changesIf the location changes, you will need to register a new exemption. If the activity or the way you are doing the work changes, you will need to check if it is still exempt. If it is not, you will have to apply for a permit.

1558L
Version 3.0
12 | P a g e
Appendix C – Network arrangement

1558L
Version 3.0
13 | P a g e
Page intentionally left blank

Maintenance manhole with catch pit
Cover Level =83.944mAOD
US Invert Level = 81.350mAOD
DS Invert Level =80.766mAOD
Vortex flow controller designed for 5l/s at
2.598m head
200mm pipe
126m3 tank with 110mm vent
Maintenance manhole with catch pit
Cover Level =84.395mAOD
US Invert Level = 82.587mAOD
DS Invert Level =82.244mAOD
Maintenance manhole with catch pit
Cover Level =84.709mAOD
US Invert Level = 81.532mAOD
DS Invert Level =81.375mAOD
175mm pipe
Maintenance manhole with catch
pit
Cover Level =84.821mAOD
US Invert Level =83.471mAOD
DS Invert Level =82.594mAOD
Type 3 Inspection chambers
(Inspection chambers may act as a
demarcation chamber)
All pipes 150mm unless otherwise
stated
Outflow headwall in line the registered
Environment Agency flood risk
exemption

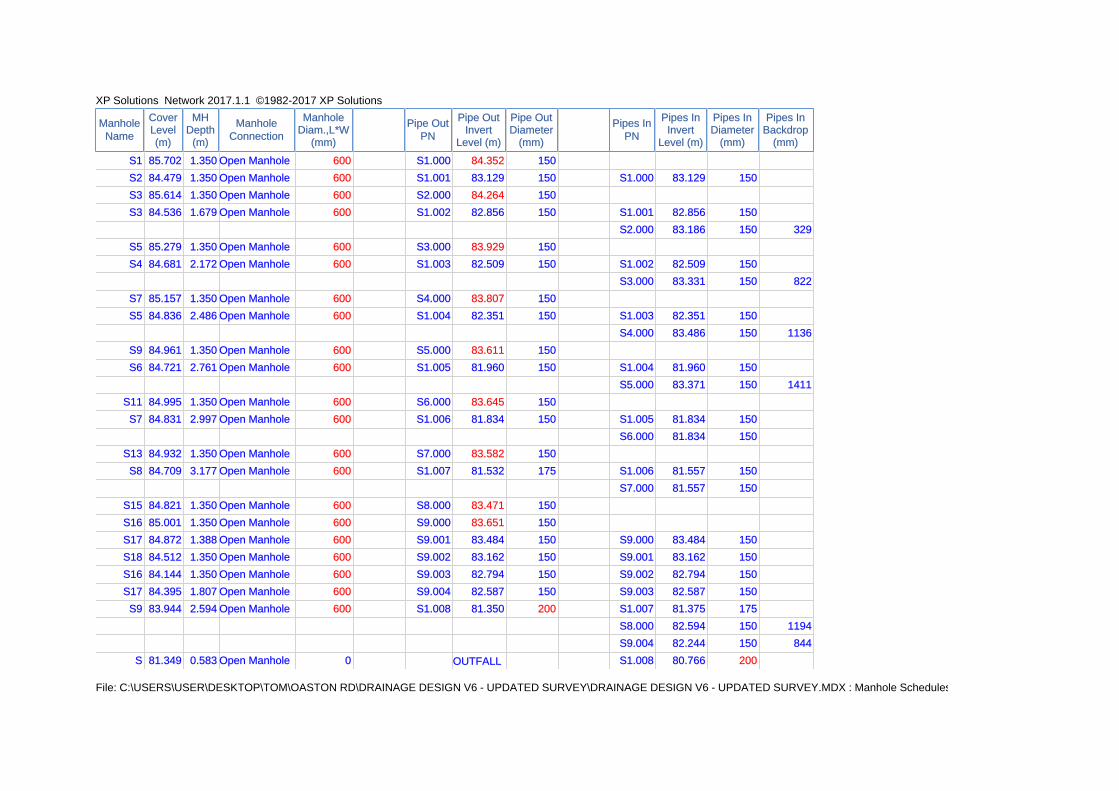
XP Solutions Network 2017.1.1 ©1982-2017 XP Solutions
File: C:\USERS\USER\DESKTOP\TOM\OASTON RD\DRAINAGE DESIGN V6 - UPDATED SURVEY\DRAINAGE DESIGN V6 - UPDATED SURVEY.MDX : Manhole Schedules
ManholeName
CoverLevel(m)
MHDepth
(m)
ManholeConnection
ManholeDiam.,L*W
(mm)
Pipe OutPN
Pipe OutInvert
Level (m)
Pipe OutDiameter
(mm)
Pipes InPN
Pipes InInvert
Level (m)
Pipes InDiameter
(mm)
Pipes InBackdrop
(mm)
S1 85.702 1.350 Open Manhole 600 S1.000 84.352 150
S2 84.479 1.350 Open Manhole 600 S1.001 83.129 150 S1.000 83.129 150
S3 85.614 1.350 Open Manhole 600 S2.000 84.264 150
S3 84.536 1.679 Open Manhole 600 S1.002 82.856 150 S1.001 82.856 150
S2.000 83.186 150 329
S5 85.279 1.350 Open Manhole 600 S3.000 83.929 150
S4 84.681 2.172 Open Manhole 600 S1.003 82.509 150 S1.002 82.509 150
S3.000 83.331 150 822
S7 85.157 1.350 Open Manhole 600 S4.000 83.807 150
S5 84.836 2.486 Open Manhole 600 S1.004 82.351 150 S1.003 82.351 150
S4.000 83.486 150 1136
S9 84.961 1.350 Open Manhole 600 S5.000 83.611 150
S6 84.721 2.761 Open Manhole 600 S1.005 81.960 150 S1.004 81.960 150
S5.000 83.371 150 1411
S11 84.995 1.350 Open Manhole 600 S6.000 83.645 150
S7 84.831 2.997 Open Manhole 600 S1.006 81.834 150 S1.005 81.834 150
S6.000 81.834 150
S13 84.932 1.350 Open Manhole 600 S7.000 83.582 150
S8 84.709 3.177 Open Manhole 600 S1.007 81.532 175 S1.006 81.557 150
S7.000 81.557 150
S15 84.821 1.350 Open Manhole 600 S8.000 83.471 150
S16 85.001 1.350 Open Manhole 600 S9.000 83.651 150
S17 84.872 1.388 Open Manhole 600 S9.001 83.484 150 S9.000 83.484 150
S18 84.512 1.350 Open Manhole 600 S9.002 83.162 150 S9.001 83.162 150
S16 84.144 1.350 Open Manhole 600 S9.003 82.794 150 S9.002 82.794 150
S17 84.395 1.807 Open Manhole 600 S9.004 82.587 150 S9.003 82.587 150
S9 83.944 2.594 Open Manhole 600 S1.008 81.350 200 S1.007 81.375 175
S8.000 82.594 150 1194
S9.004 82.244 150 844
S 81.349 0.583 Open Manhole 0 OUTFALL S1.008 80.766 200

1558L
Version 3.0
14 | P a g e
Appendix D – Submerged outfall Micro-drainage results

1558L
Version 3.0
15 | P a g e
Page intentionally left blank

RAB Consultants Ltd Page 1Cathedral House Oaston RdBeacon StreetLichfield WS13 7AADate 09-Jun-17 1:59 PM Designed by THFile DRAINAGE DESIGN V7 - UP... Checked by GWMicro Drainage Network 2017.1.1
2 year Return Period Summary of Critical Results by Maximum Level (Rank 1)for Storm
©1982-2017 XP Solutions
Simulation CriteriaAreal Reduction Factor 1.000 Additional Flow - % of Total Flow 0.000
Hot Start (mins) 0 MADD Factor * 10m³/ha Storage 2.000Hot Start Level (mm) 0 Inlet Coeffiecient 0.800
Manhole Headloss Coeff (Global) 0.500 Flow per Person per Day (l/per/day) 0.000Foul Sewage per hectare (l/s) 0.000
Number of Input Hydrographs 0 Number of Storage Structures 1Number of Online Controls 1 Number of Time/Area Diagrams 0Number of Offline Controls 0 Number of Real Time Controls 0
Synthetic Rainfall DetailsRainfall Model FEH Data Type Point
FEH Rainfall Version 2013 Cv (Summer) 0.750Site Location GB 437138 292102 Cv (Winter) 0.840
Margin for Flood Risk Warning (mm) 300.0 DVD Status ONAnalysis Timestep Fine Inertia Status ON
DTS Status ON
Profile(s) Summer and WinterDuration(s) (mins) 15, 30, 60, 120, 180, 240, 360, 480, 600,
720, 960, 1440, 2160, 2880, 4320, 5760,7200, 8640, 10080
Return Period(s) (years) 2, 30, 100Climate Change (%) 0, 0, 40
PNUS/MHName Storm
ReturnPeriod
ClimateChange
First (X)Surcharge
First (Y)Flood
First (Z)Overflow
OverflowAct.
S1.000 S1 15 Winter 2 +0% 100/15 SummerS1.001 S2 15 Winter 2 +0% 30/15 Summer 100/15 SummerS2.000 S3 15 Winter 2 +0% 100/15 SummerS1.002 S3 15 Winter 2 +0% 30/15 Summer 100/15 SummerS3.000 S5 15 Winter 2 +0% 100/15 SummerS1.003 S4 15 Winter 2 +0% 30/15 Summer 100/180 WinterS4.000 S7 15 Winter 2 +0% 100/15 SummerS1.004 S5 15 Winter 2 +0% 30/15 Summer 100/360 SummerS5.000 S9 15 Winter 2 +0% 100/15 SummerS1.005 S6 15 Winter 2 +0% 30/15 Summer 100/480 SummerS6.000 S11 15 Winter 2 +0% 100/120 WinterS1.006 S7 15 Winter 2 +0% 30/15 SummerS7.000 S13 15 Winter 2 +0% 100/120 Winter 100/480 SummerS1.007 S8 720 Winter 2 +0% 30/15 Summer 100/480 SummerS8.000 S15 15 Winter 2 +0% 100/120 Winter 100/480 SummerS9.000 S16 15 Winter 2 +0% 100/120 WinterS9.001 S17 15 Winter 2 +0% 100/15 SummerS9.002 S18 15 Winter 2 +0% 100/15 Summer 100/480 SummerS9.003 S16 15 Winter 2 +0% 100/15 Summer 100/180 Winter

RAB Consultants Ltd Page 2Cathedral House Oaston RdBeacon StreetLichfield WS13 7AADate 09-Jun-17 1:59 PM Designed by THFile DRAINAGE DESIGN V7 - UP... Checked by GWMicro Drainage Network 2017.1.1
2 year Return Period Summary of Critical Results by Maximum Level (Rank 1)for Storm
©1982-2017 XP Solutions
PNUS/MHName
Water Level(m)
SurchargedDepth(m)
FloodedVolume(m³)
Flow /Cap.
Overflow(l/s)
PipeFlow(l/s) Status
LevelExceeded
S1.000 S1 84.372 -0.131 0.000 0.04 2.5 OKS1.001 S2 83.172 -0.108 0.000 0.17 4.0 OK 4S2.000 S3 84.284 -0.130 0.000 0.04 2.8 OKS1.002 S3 82.918 -0.088 0.000 0.34 8.1 OK 2S3.000 S5 83.949 -0.130 0.000 0.04 2.1 OKS1.003 S4 82.585 -0.074 0.000 0.50 10.9 OK 1S4.000 S7 83.830 -0.127 0.000 0.06 2.0 OKS1.004 S5 82.434 -0.067 0.000 0.58 13.8 OKS5.000 S9 83.636 -0.125 0.000 0.06 1.9 OKS1.005 S6 82.060 -0.050 0.000 0.78 16.5 OKS6.000 S11 83.659 -0.135 0.000 0.02 1.7 OKS1.006 S7 81.939 -0.045 0.000 0.83 19.2 OKS7.000 S13 83.592 -0.140 0.000 0.01 1.3 OKS1.007 S8 81.688 -0.019 0.000 0.07 2.4 OKS8.000 S15 83.492 -0.129 0.000 0.05 2.4 OKS9.000 S16 83.674 -0.127 0.000 0.06 1.2 OKS9.001 S17 83.516 -0.118 0.000 0.10 2.6 OKS9.002 S18 83.202 -0.110 0.000 0.15 4.9 OKS9.003 S16 82.848 -0.096 0.000 0.28 6.2 OK

RAB Consultants Ltd Page 3Cathedral House Oaston RdBeacon StreetLichfield WS13 7AADate 09-Jun-17 1:59 PM Designed by THFile DRAINAGE DESIGN V7 - UP... Checked by GWMicro Drainage Network 2017.1.1
2 year Return Period Summary of Critical Results by Maximum Level (Rank 1)for Storm
©1982-2017 XP Solutions
PNUS/MHName Storm
ReturnPeriod
ClimateChange
First (X)Surcharge
First (Y)Flood
First (Z)Overflow
OverflowAct.
S9.004 S17 15 Winter 2 +0% 100/15 Summer 100/480 SummerS1.008 S9 720 Winter 2 +0% 2/180 Summer 100/120 Winter
PNUS/MHName
Water Level(m)
SurchargedDepth(m)
FloodedVolume(m³)
Flow /Cap.
Overflow(l/s)
PipeFlow(l/s) Status
LevelExceeded
S9.004 S17 82.650 -0.088 0.000 0.36 8.4 OKS1.008 S9 81.687 0.137 0.000 0.07 3.2 SURCHARGED 14

RAB Consultants Ltd Page 4Cathedral House Oaston RdBeacon StreetLichfield WS13 7AADate 09-Jun-17 1:59 PM Designed by THFile DRAINAGE DESIGN V7 - UP... Checked by GWMicro Drainage Network 2017.1.1
30 year Return Period Summary of Critical Results by Maximum Level (Rank 1)for Storm
©1982-2017 XP Solutions
Simulation CriteriaAreal Reduction Factor 1.000 Additional Flow - % of Total Flow 0.000
Hot Start (mins) 0 MADD Factor * 10m³/ha Storage 2.000Hot Start Level (mm) 0 Inlet Coeffiecient 0.800
Manhole Headloss Coeff (Global) 0.500 Flow per Person per Day (l/per/day) 0.000Foul Sewage per hectare (l/s) 0.000
Number of Input Hydrographs 0 Number of Storage Structures 1Number of Online Controls 1 Number of Time/Area Diagrams 0Number of Offline Controls 0 Number of Real Time Controls 0
Synthetic Rainfall DetailsRainfall Model FEH Data Type Point
FEH Rainfall Version 2013 Cv (Summer) 0.750Site Location GB 437138 292102 Cv (Winter) 0.840
Margin for Flood Risk Warning (mm) 300.0 DVD Status ONAnalysis Timestep Fine Inertia Status ON
DTS Status ON
Profile(s) Summer and WinterDuration(s) (mins) 15, 30, 60, 120, 180, 240, 360, 480, 600,
720, 960, 1440, 2160, 2880, 4320, 5760,7200, 8640, 10080
Return Period(s) (years) 2, 30, 100Climate Change (%) 0, 0, 40
PNUS/MHName Storm
ReturnPeriod
ClimateChange
First (X)Surcharge
First (Y)Flood
First (Z)Overflow
OverflowAct.
S1.000 S1 15 Winter 30 +0% 100/15 SummerS1.001 S2 15 Winter 30 +0% 30/15 Summer 100/15 SummerS2.000 S3 15 Winter 30 +0% 100/15 SummerS1.002 S3 15 Winter 30 +0% 30/15 Summer 100/15 SummerS3.000 S5 15 Winter 30 +0% 100/15 SummerS1.003 S4 15 Winter 30 +0% 30/15 Summer 100/180 WinterS4.000 S7 15 Winter 30 +0% 100/15 SummerS1.004 S5 15 Winter 30 +0% 30/15 Summer 100/360 SummerS5.000 S9 15 Winter 30 +0% 100/15 SummerS1.005 S6 15 Winter 30 +0% 30/15 Summer 100/480 SummerS6.000 S11 15 Winter 30 +0% 100/120 WinterS1.006 S7 15 Winter 30 +0% 30/15 SummerS7.000 S13 15 Winter 30 +0% 100/120 Winter 100/480 SummerS1.007 S8 600 Winter 30 +0% 30/15 Summer 100/480 SummerS8.000 S15 15 Winter 30 +0% 100/120 Winter 100/480 SummerS9.000 S16 15 Winter 30 +0% 100/120 WinterS9.001 S17 15 Winter 30 +0% 100/15 SummerS9.002 S18 15 Winter 30 +0% 100/15 Summer 100/480 SummerS9.003 S16 15 Winter 30 +0% 100/15 Summer 100/180 Winter

RAB Consultants Ltd Page 5Cathedral House Oaston RdBeacon StreetLichfield WS13 7AADate 09-Jun-17 1:59 PM Designed by THFile DRAINAGE DESIGN V7 - UP... Checked by GWMicro Drainage Network 2017.1.1
30 year Return Period Summary of Critical Results by Maximum Level (Rank 1)for Storm
©1982-2017 XP Solutions
PNUS/MHName
Water Level(m)
SurchargedDepth(m)
FloodedVolume(m³)
Flow /Cap.
Overflow(l/s)
PipeFlow(l/s) Status
LevelExceeded
S1.000 S1 84.382 -0.120 0.000 0.09 5.4 OKS1.001 S2 83.570 0.291 0.000 0.39 9.1 SURCHARGED 4S2.000 S3 84.295 -0.119 0.000 0.09 6.1 OKS1.002 S3 83.540 0.534 0.000 0.69 16.2 SURCHARGED 2S3.000 S5 83.960 -0.119 0.000 0.09 4.6 OKS1.003 S4 83.387 0.728 0.000 0.95 20.7 SURCHARGED 1S4.000 S7 83.842 -0.115 0.000 0.12 4.4 OKS1.004 S5 83.245 0.744 0.000 1.11 26.2 SURCHARGEDS5.000 S9 83.648 -0.113 0.000 0.14 4.3 OKS1.005 S6 82.767 0.657 0.000 1.47 31.1 SURCHARGEDS6.000 S11 83.665 -0.130 0.000 0.04 3.8 OKS1.006 S7 82.493 0.509 0.000 1.57 36.3 SURCHARGEDS7.000 S13 83.599 -0.133 0.000 0.03 2.8 OKS1.007 S8 81.803 0.096 0.000 0.15 4.9 SURCHARGEDS8.000 S15 83.503 -0.118 0.000 0.10 5.2 OKS9.000 S16 83.686 -0.115 0.000 0.12 2.7 OKS9.001 S17 83.535 -0.099 0.000 0.25 6.6 OKS9.002 S18 83.229 -0.084 0.000 0.40 13.1 OKS9.003 S16 82.891 -0.054 0.000 0.73 16.5 OK

RAB Consultants Ltd Page 6Cathedral House Oaston RdBeacon StreetLichfield WS13 7AADate 09-Jun-17 1:59 PM Designed by THFile DRAINAGE DESIGN V7 - UP... Checked by GWMicro Drainage Network 2017.1.1
30 year Return Period Summary of Critical Results by Maximum Level (Rank 1)for Storm
©1982-2017 XP Solutions
PNUS/MHName Storm
ReturnPeriod
ClimateChange
First (X)Surcharge
First (Y)Flood
First (Z)Overflow
OverflowAct.
S9.004 S17 15 Winter 30 +0% 100/15 Summer 100/480 SummerS1.008 S9 600 Winter 30 +0% 2/180 Summer 100/120 Winter
PNUS/MHName
Water Level(m)
SurchargedDepth(m)
FloodedVolume(m³)
Flow /Cap.
Overflow(l/s)
PipeFlow(l/s) Status
LevelExceeded
S9.004 S17 82.704 -0.033 0.000 0.96 22.5 OKS1.008 S9 81.799 0.250 0.000 0.07 3.2 SURCHARGED 14

RAB Consultants Ltd Page 7Cathedral House Oaston RdBeacon StreetLichfield WS13 7AADate 09-Jun-17 1:59 PM Designed by THFile DRAINAGE DESIGN V7 - UP... Checked by GWMicro Drainage Network 2017.1.1
100 year Return Period Summary of Critical Results by Maximum Level (Rank1) for Storm
©1982-2017 XP Solutions
Simulation CriteriaAreal Reduction Factor 1.000 Additional Flow - % of Total Flow 0.000
Hot Start (mins) 0 MADD Factor * 10m³/ha Storage 2.000Hot Start Level (mm) 0 Inlet Coeffiecient 0.800
Manhole Headloss Coeff (Global) 0.500 Flow per Person per Day (l/per/day) 0.000Foul Sewage per hectare (l/s) 0.000
Number of Input Hydrographs 0 Number of Storage Structures 1Number of Online Controls 1 Number of Time/Area Diagrams 0Number of Offline Controls 0 Number of Real Time Controls 0
Synthetic Rainfall DetailsRainfall Model FEH Data Type Point
FEH Rainfall Version 2013 Cv (Summer) 0.750Site Location GB 437138 292102 Cv (Winter) 0.840
Margin for Flood Risk Warning (mm) 300.0 DVD Status ONAnalysis Timestep Fine Inertia Status ON
DTS Status ON
Profile(s) Summer and WinterDuration(s) (mins) 15, 30, 60, 120, 180, 240, 360, 480, 600,
720, 960, 1440, 2160, 2880, 4320, 5760,7200, 8640, 10080
Return Period(s) (years) 2, 30, 100Climate Change (%) 0, 0, 40
PNUS/MHName Storm
ReturnPeriod
ClimateChange
First (X)Surcharge
First (Y)Flood
First (Z)Overflow
OverflowAct.
S1.000 S1 15 Winter 100 +40% 100/15 SummerS1.001 S2 15 Winter 100 +40% 30/15 Summer 100/15 SummerS2.000 S3 15 Winter 100 +40% 100/15 SummerS1.002 S3 15 Winter 100 +40% 30/15 Summer 100/15 SummerS3.000 S5 15 Winter 100 +40% 100/15 SummerS1.003 S4 600 Summer 100 +40% 30/15 Summer 100/180 WinterS4.000 S7 15 Winter 100 +40% 100/15 SummerS1.004 S5 15 Winter 100 +40% 30/15 Summer 100/360 SummerS5.000 S9 180 Winter 100 +40% 100/15 SummerS1.005 S6 240 Summer 100 +40% 30/15 Summer 100/480 SummerS6.000 S11 600 Summer 100 +40% 100/120 WinterS1.006 S7 240 Summer 100 +40% 30/15 SummerS7.000 S13 600 Summer 100 +40% 100/120 Winter 100/480 SummerS1.007 S8 600 Summer 100 +40% 30/15 Summer 100/480 SummerS8.000 S15 720 Winter 100 +40% 100/120 Winter 100/480 SummerS9.000 S16 240 Winter 100 +40% 100/120 WinterS9.001 S17 240 Winter 100 +40% 100/15 SummerS9.002 S18 720 Winter 100 +40% 100/15 Summer 100/480 SummerS9.003 S16 720 Winter 100 +40% 100/15 Summer 100/180 Winter

RAB Consultants Ltd Page 8Cathedral House Oaston RdBeacon StreetLichfield WS13 7AADate 09-Jun-17 1:59 PM Designed by THFile DRAINAGE DESIGN V7 - UP... Checked by GWMicro Drainage Network 2017.1.1
100 year Return Period Summary of Critical Results by Maximum Level (Rank1) for Storm
©1982-2017 XP Solutions
PNUS/MHName
Water Level(m)
SurchargedDepth(m)
FloodedVolume(m³)
Flow /Cap.
Overflow(l/s)
PipeFlow(l/s) Status
LevelExceeded
S1.000 S1 84.534 0.032 0.000 0.16 10.1 SURCHARGEDS1.001 S2 84.484 1.205 4.745 1.14 26.4 FLOOD 4S2.000 S3 84.569 0.154 0.000 0.17 10.8 SURCHARGEDS1.002 S3 84.536 1.530 0.518 1.18 27.8 FLOOD 2S3.000 S5 84.551 0.472 0.000 0.17 8.4 SURCHARGEDS1.003 S4 84.682 2.023 0.735 0.29 6.3 FLOOD 1S4.000 S7 84.456 0.499 0.000 0.22 7.9 SURCHARGEDS1.004 S5 84.439 1.939 0.000 1.34 31.8 SURCHARGEDS5.000 S9 84.062 0.301 0.000 0.06 2.0 SURCHARGEDS1.005 S6 84.099 1.989 0.000 0.94 20.0 SURCHARGEDS6.000 S11 84.062 0.267 0.000 0.01 0.9 SURCHARGEDS1.006 S7 84.096 2.112 0.000 1.23 28.5 SURCHARGEDS7.000 S13 84.017 0.285 0.000 0.01 0.7 SURCHARGEDS1.007 S8 84.218 2.511 0.000 0.38 12.1 SURCHARGEDS8.000 S15 84.007 0.386 0.000 0.02 0.8 SURCHARGEDS9.000 S16 83.998 0.197 0.000 0.05 1.0 SURCHARGEDS9.001 S17 83.996 0.361 0.000 0.09 2.4 SURCHARGEDS9.002 S18 84.037 0.725 0.000 0.06 2.0 SURCHARGEDS9.003 S16 84.002 1.058 0.000 0.11 2.5 FLOOD RISK

RAB Consultants Ltd Page 9Cathedral House Oaston RdBeacon StreetLichfield WS13 7AADate 09-Jun-17 1:59 PM Designed by THFile DRAINAGE DESIGN V7 - UP... Checked by GWMicro Drainage Network 2017.1.1
100 year Return Period Summary of Critical Results by Maximum Level (Rank1) for Storm
©1982-2017 XP Solutions
PNUS/MHName Storm
ReturnPeriod
ClimateChange
First (X)Surcharge
First (Y)Flood
First (Z)Overflow
OverflowAct.
S9.004 S17 720 Winter 100 +40% 100/15 Summer 100/480 SummerS1.008 S9 360 Winter 100 +40% 2/180 Summer 100/120 Winter
PNUS/MHName
Water Level(m)
SurchargedDepth(m)
FloodedVolume(m³)
Flow /Cap.
Overflow(l/s)
PipeFlow(l/s) Status
LevelExceeded
S9.004 S17 84.009 1.272 0.000 0.14 3.4 SURCHARGEDS1.008 S9 83.966 2.416 21.915 0.10 4.7 FLOOD 14

1558L
Version 3.0
16 | P a g e
Appendix E –Micro-drainage results

1558L
Version 3.0
17 | P a g e
Page intentionally left blank

1558L
Version 3.0
18 | P a g e

RAB Consultants Ltd Page 1Cathedral House Oaston RdBeacon StreetLichfield WS13 7AADate 09-Jun-17 1:56 PM Designed by THFile DRAINAGE DESIGN V6 - UP... Checked by GWMicro Drainage Network 2017.1.1
2 year Return Period Summary of Critical Results by Maximum Level (Rank 1)for Storm
©1982-2017 XP Solutions
Simulation CriteriaAreal Reduction Factor 1.000 Additional Flow - % of Total Flow 0.000
Hot Start (mins) 0 MADD Factor * 10m³/ha Storage 2.000Hot Start Level (mm) 0 Inlet Coeffiecient 0.800
Manhole Headloss Coeff (Global) 0.500 Flow per Person per Day (l/per/day) 0.000Foul Sewage per hectare (l/s) 0.000
Number of Input Hydrographs 0 Number of Storage Structures 1Number of Online Controls 1 Number of Time/Area Diagrams 0Number of Offline Controls 0 Number of Real Time Controls 0
Synthetic Rainfall DetailsRainfall Model FEH Data Type Point
FEH Rainfall Version 2013 Cv (Summer) 0.750Site Location GB 437138 292102 Cv (Winter) 0.840
Margin for Flood Risk Warning (mm) 300.0Analysis Timestep 2.5 Second Increment (Extended)
DTS Status ONDVD Status ON
Inertia Status ON
Profile(s) Summer and WinterDuration(s) (mins) 15, 30, 60, 120, 180, 240, 360, 480, 600,
720, 960, 1440, 2160, 2880, 4320, 5760,7200, 8640, 10080
Return Period(s) (years) 2, 30, 100Climate Change (%) 0, 0, 40
PNUS/MHName Storm
ReturnPeriod
ClimateChange
First (X)Surcharge
First (Y)Flood
First (Z)Overflow
OverflowAct.
S1.000 S1 15 Winter 2 +0% 100/15 SummerS1.001 S2 15 Winter 2 +0% 30/15 Summer 100/15 SummerS2.000 S3 15 Winter 2 +0% 100/15 SummerS1.002 S3 15 Winter 2 +0% 30/15 Summer 100/15 SummerS3.000 S5 15 Winter 2 +0% 100/15 SummerS1.003 S4 15 Winter 2 +0% 30/15 SummerS4.000 S7 15 Winter 2 +0% 100/15 SummerS1.004 S5 15 Winter 2 +0% 30/15 SummerS5.000 S9 15 Winter 2 +0% 100/15 SummerS1.005 S6 15 Winter 2 +0% 30/15 SummerS6.000 S11 15 Winter 2 +0% 100/180 WinterS1.006 S7 15 Winter 2 +0% 30/15 SummerS7.000 S13 15 Winter 2 +0% 100/120 WinterS1.007 S8 15 Winter 2 +0% 30/15 SummerS8.000 S15 15 Winter 2 +0% 100/120 WinterS9.000 S16 15 Winter 2 +0% 100/180 WinterS9.001 S17 15 Winter 2 +0% 100/15 Summer

RAB Consultants Ltd Page 2Cathedral House Oaston RdBeacon StreetLichfield WS13 7AADate 09-Jun-17 1:56 PM Designed by THFile DRAINAGE DESIGN V6 - UP... Checked by GWMicro Drainage Network 2017.1.1
2 year Return Period Summary of Critical Results by Maximum Level (Rank 1)for Storm
©1982-2017 XP Solutions
PNUS/MHName
Water Level(m)
SurchargedDepth(m)
FloodedVolume(m³)
Flow /Cap.
Overflow(l/s)
PipeFlow(l/s) Status
LevelExceeded
S1.000 S1 84.372 -0.131 0.000 0.04 2.5 OKS1.001 S2 83.172 -0.108 0.000 0.17 4.0 OK 4S2.000 S3 84.284 -0.130 0.000 0.04 2.8 OKS1.002 S3 82.918 -0.088 0.000 0.34 8.1 OK 2S3.000 S5 83.949 -0.130 0.000 0.04 2.1 OKS1.003 S4 82.585 -0.074 0.000 0.50 10.9 OKS4.000 S7 83.830 -0.127 0.000 0.06 2.0 OKS1.004 S5 82.434 -0.067 0.000 0.58 13.8 OKS5.000 S9 83.636 -0.125 0.000 0.06 1.9 OKS1.005 S6 82.060 -0.050 0.000 0.78 16.5 OKS6.000 S11 83.659 -0.135 0.000 0.02 1.7 OKS1.006 S7 81.939 -0.045 0.000 0.83 19.2 OKS7.000 S13 83.592 -0.140 0.000 0.01 1.3 OKS1.007 S8 81.636 -0.071 0.000 0.66 21.2 OKS8.000 S15 83.492 -0.129 0.000 0.05 2.4 OKS9.000 S16 83.674 -0.127 0.000 0.06 1.2 OKS9.001 S17 83.516 -0.118 0.000 0.10 2.6 OK

RAB Consultants Ltd Page 3Cathedral House Oaston RdBeacon StreetLichfield WS13 7AADate 09-Jun-17 1:56 PM Designed by THFile DRAINAGE DESIGN V6 - UP... Checked by GWMicro Drainage Network 2017.1.1
2 year Return Period Summary of Critical Results by Maximum Level (Rank 1)for Storm
©1982-2017 XP Solutions
PNUS/MHName Storm
ReturnPeriod
ClimateChange
First (X)Surcharge
First (Y)Flood
First (Z)Overflow
OverflowAct.
S9.002 S18 15 Winter 2 +0% 100/15 SummerS9.003 S16 15 Winter 2 +0% 100/15 SummerS9.004 S17 15 Winter 2 +0% 100/15 SummerS1.008 S9 240 Winter 2 +0% 30/30 Summer 100/180 Winter
PNUS/MHName
Water Level(m)
SurchargedDepth(m)
FloodedVolume(m³)
Flow /Cap.
Overflow(l/s)
PipeFlow(l/s) Status
LevelExceeded
S9.002 S18 83.202 -0.110 0.000 0.15 4.9 OKS9.003 S16 82.848 -0.096 0.000 0.28 6.2 OKS9.004 S17 82.650 -0.088 0.000 0.36 8.4 OKS1.008 S9 81.500 -0.050 0.000 0.06 3.1 OK 4

RAB Consultants Ltd Page 4Cathedral House Oaston RdBeacon StreetLichfield WS13 7AADate 09-Jun-17 1:56 PM Designed by THFile DRAINAGE DESIGN V6 - UP... Checked by GWMicro Drainage Network 2017.1.1
30 year Return Period Summary of Critical Results by Maximum Level (Rank 1)for Storm
©1982-2017 XP Solutions
Simulation CriteriaAreal Reduction Factor 1.000 Additional Flow - % of Total Flow 0.000
Hot Start (mins) 0 MADD Factor * 10m³/ha Storage 2.000Hot Start Level (mm) 0 Inlet Coeffiecient 0.800
Manhole Headloss Coeff (Global) 0.500 Flow per Person per Day (l/per/day) 0.000Foul Sewage per hectare (l/s) 0.000
Number of Input Hydrographs 0 Number of Storage Structures 1Number of Online Controls 1 Number of Time/Area Diagrams 0Number of Offline Controls 0 Number of Real Time Controls 0
Synthetic Rainfall DetailsRainfall Model FEH Data Type Point
FEH Rainfall Version 2013 Cv (Summer) 0.750Site Location GB 437138 292102 Cv (Winter) 0.840
Margin for Flood Risk Warning (mm) 300.0Analysis Timestep 2.5 Second Increment (Extended)
DTS Status ONDVD Status ON
Inertia Status ON
Profile(s) Summer and WinterDuration(s) (mins) 15, 30, 60, 120, 180, 240, 360, 480, 600,
720, 960, 1440, 2160, 2880, 4320, 5760,7200, 8640, 10080
Return Period(s) (years) 2, 30, 100Climate Change (%) 0, 0, 40
PNUS/MHName Storm
ReturnPeriod
ClimateChange
First (X)Surcharge
First (Y)Flood
First (Z)Overflow
OverflowAct.
S1.000 S1 15 Winter 30 +0% 100/15 SummerS1.001 S2 15 Winter 30 +0% 30/15 Summer 100/15 SummerS2.000 S3 15 Winter 30 +0% 100/15 SummerS1.002 S3 15 Winter 30 +0% 30/15 Summer 100/15 SummerS3.000 S5 15 Winter 30 +0% 100/15 SummerS1.003 S4 15 Winter 30 +0% 30/15 SummerS4.000 S7 15 Winter 30 +0% 100/15 SummerS1.004 S5 15 Winter 30 +0% 30/15 SummerS5.000 S9 15 Winter 30 +0% 100/15 SummerS1.005 S6 15 Winter 30 +0% 30/15 SummerS6.000 S11 15 Winter 30 +0% 100/180 WinterS1.006 S7 15 Winter 30 +0% 30/15 SummerS7.000 S13 15 Winter 30 +0% 100/120 WinterS1.007 S8 15 Winter 30 +0% 30/15 SummerS8.000 S15 15 Winter 30 +0% 100/120 WinterS9.000 S16 15 Winter 30 +0% 100/180 WinterS9.001 S17 15 Winter 30 +0% 100/15 Summer
RAB Consultants Ltd Page 5Cathedral House Oaston RdBeacon StreetLichfield WS13 7AADate 09-Jun-17 1:56 PM Designed by THFile DRAINAGE DESIGN V6 - UP... Checked by GWMicro Drainage Network 2017.1.1
30 year Return Period Summary of Critical Results by Maximum Level (Rank 1)for Storm
©1982-2017 XP Solutions
PNUS/MHName
Water Level(m)
SurchargedDepth(m)
FloodedVolume(m³)
Flow /Cap.
Overflow(l/s)
PipeFlow(l/s) Status
LevelExceeded
S1.000 S1 84.382 -0.120 0.000 0.09 5.4 OKS1.001 S2 83.570 0.291 0.000 0.39 9.1 SURCHARGED 4S2.000 S3 84.295 -0.119 0.000 0.09 6.1 OKS1.002 S3 83.540 0.534 0.000 0.69 16.2 SURCHARGED 2S3.000 S5 83.960 -0.119 0.000 0.09 4.6 OKS1.003 S4 83.387 0.728 0.000 0.95 20.7 SURCHARGEDS4.000 S7 83.842 -0.115 0.000 0.12 4.4 OKS1.004 S5 83.245 0.744 0.000 1.11 26.2 SURCHARGEDS5.000 S9 83.648 -0.113 0.000 0.14 4.3 OKS1.005 S6 82.767 0.657 0.000 1.47 31.1 SURCHARGEDS6.000 S11 83.665 -0.130 0.000 0.04 3.8 OKS1.006 S7 82.493 0.509 0.000 1.57 36.3 SURCHARGEDS7.000 S13 83.599 -0.133 0.000 0.03 2.8 OKS1.007 S8 81.796 0.090 0.000 1.26 40.3 SURCHARGEDS8.000 S15 83.503 -0.118 0.000 0.10 5.2 OKS9.000 S16 83.686 -0.115 0.000 0.12 2.7 OKS9.001 S17 83.535 -0.099 0.000 0.25 6.6 OK

RAB Consultants Ltd Page 6Cathedral House Oaston RdBeacon StreetLichfield WS13 7AADate 09-Jun-17 1:56 PM Designed by THFile DRAINAGE DESIGN V6 - UP... Checked by GWMicro Drainage Network 2017.1.1
30 year Return Period Summary of Critical Results by Maximum Level (Rank 1)for Storm
©1982-2017 XP Solutions
PNUS/MHName Storm
ReturnPeriod
ClimateChange
First (X)Surcharge
First (Y)Flood
First (Z)Overflow
OverflowAct.
S9.002 S18 15 Winter 30 +0% 100/15 SummerS9.003 S16 15 Winter 30 +0% 100/15 SummerS9.004 S17 15 Winter 30 +0% 100/15 SummerS1.008 S9 240 Winter 30 +0% 30/30 Summer 100/180 Winter
PNUS/MHName
Water Level(m)
SurchargedDepth(m)
FloodedVolume(m³)
Flow /Cap.
Overflow(l/s)
PipeFlow(l/s) Status
LevelExceeded
S9.002 S18 83.229 -0.084 0.000 0.40 13.1 OKS9.003 S16 82.891 -0.054 0.000 0.73 16.5 OKS9.004 S17 82.704 -0.033 0.000 0.96 22.5 OKS1.008 S9 81.684 0.134 0.000 0.07 3.2 SURCHARGED 4

RAB Consultants Ltd Page 7Cathedral House Oaston RdBeacon StreetLichfield WS13 7AADate 09-Jun-17 1:56 PM Designed by THFile DRAINAGE DESIGN V6 - UP... Checked by GWMicro Drainage Network 2017.1.1
100 year Return Period Summary of Critical Results by Maximum Level (Rank1) for Storm
©1982-2017 XP Solutions
Simulation CriteriaAreal Reduction Factor 1.000 Additional Flow - % of Total Flow 0.000
Hot Start (mins) 0 MADD Factor * 10m³/ha Storage 2.000Hot Start Level (mm) 0 Inlet Coeffiecient 0.800
Manhole Headloss Coeff (Global) 0.500 Flow per Person per Day (l/per/day) 0.000Foul Sewage per hectare (l/s) 0.000
Number of Input Hydrographs 0 Number of Storage Structures 1Number of Online Controls 1 Number of Time/Area Diagrams 0Number of Offline Controls 0 Number of Real Time Controls 0
Synthetic Rainfall DetailsRainfall Model FEH Data Type Point
FEH Rainfall Version 2013 Cv (Summer) 0.750Site Location GB 437138 292102 Cv (Winter) 0.840
Margin for Flood Risk Warning (mm) 300.0Analysis Timestep 2.5 Second Increment (Extended)
DTS Status ONDVD Status ON
Inertia Status ON
Profile(s) Summer and WinterDuration(s) (mins) 15, 30, 60, 120, 180, 240, 360, 480, 600,
720, 960, 1440, 2160, 2880, 4320, 5760,7200, 8640, 10080
Return Period(s) (years) 2, 30, 100Climate Change (%) 0, 0, 40
PNUS/MHName Storm
ReturnPeriod
ClimateChange
First (X)Surcharge
First (Y)Flood
First (Z)Overflow
OverflowAct.
S1.000 S1 15 Winter 100 +40% 100/15 SummerS1.001 S2 15 Winter 100 +40% 30/15 Summer 100/15 SummerS2.000 S3 15 Winter 100 +40% 100/15 SummerS1.002 S3 15 Winter 100 +40% 30/15 Summer 100/15 SummerS3.000 S5 15 Winter 100 +40% 100/15 SummerS1.003 S4 15 Winter 100 +40% 30/15 SummerS4.000 S7 15 Winter 100 +40% 100/15 SummerS1.004 S5 15 Winter 100 +40% 30/15 SummerS5.000 S9 240 Winter 100 +40% 100/15 SummerS1.005 S6 240 Winter 100 +40% 30/15 SummerS6.000 S11 240 Winter 100 +40% 100/180 WinterS1.006 S7 240 Winter 100 +40% 30/15 SummerS7.000 S13 240 Winter 100 +40% 100/120 WinterS1.007 S8 240 Winter 100 +40% 30/15 SummerS8.000 S15 360 Winter 100 +40% 100/120 WinterS9.000 S16 240 Winter 100 +40% 100/180 WinterS9.001 S17 240 Winter 100 +40% 100/15 Summer

RAB Consultants Ltd Page 8Cathedral House Oaston RdBeacon StreetLichfield WS13 7AADate 09-Jun-17 1:56 PM Designed by THFile DRAINAGE DESIGN V6 - UP... Checked by GWMicro Drainage Network 2017.1.1
100 year Return Period Summary of Critical Results by Maximum Level (Rank1) for Storm
©1982-2017 XP Solutions
PNUS/MHName
Water Level(m)
SurchargedDepth(m)
FloodedVolume(m³)
Flow /Cap.
Overflow(l/s)
PipeFlow(l/s) Status
LevelExceeded
S1.000 S1 84.534 0.032 0.000 0.16 10.1 SURCHARGEDS1.001 S2 84.484 1.205 4.744 1.14 26.4 FLOOD 4S2.000 S3 84.569 0.154 0.000 0.17 10.8 SURCHARGEDS1.002 S3 84.536 1.530 0.518 1.18 27.8 FLOOD 2S3.000 S5 84.551 0.472 0.000 0.17 8.4 SURCHARGEDS1.003 S4 84.529 1.870 0.000 1.33 29.1 FLOOD RISKS4.000 S7 84.456 0.499 0.000 0.22 7.9 SURCHARGEDS1.004 S5 84.439 1.939 0.000 1.34 31.8 SURCHARGEDS5.000 S9 83.997 0.236 0.000 0.05 1.6 SURCHARGEDS1.005 S6 83.996 1.886 0.000 0.68 14.3 SURCHARGEDS6.000 S11 83.984 0.190 0.000 0.02 1.4 SURCHARGEDS1.006 S7 83.984 2.000 0.000 0.72 16.7 SURCHARGEDS7.000 S13 83.959 0.227 0.000 0.01 1.0 SURCHARGEDS1.007 S8 83.959 2.252 0.000 0.57 18.3 SURCHARGEDS8.000 S15 83.951 0.330 0.000 0.03 1.4 SURCHARGEDS9.000 S16 83.978 0.177 0.000 0.05 1.0 SURCHARGEDS9.001 S17 83.977 0.343 0.000 0.09 2.4 SURCHARGED

RAB Consultants Ltd Page 9Cathedral House Oaston RdBeacon StreetLichfield WS13 7AADate 09-Jun-17 1:56 PM Designed by THFile DRAINAGE DESIGN V6 - UP... Checked by GWMicro Drainage Network 2017.1.1
100 year Return Period Summary of Critical Results by Maximum Level (Rank1) for Storm
©1982-2017 XP Solutions
PNUS/MHName Storm
ReturnPeriod
ClimateChange
First (X)Surcharge
First (Y)Flood
First (Z)Overflow
OverflowAct.
S9.002 S18 240 Winter 100 +40% 100/15 SummerS9.003 S16 240 Winter 100 +40% 100/15 SummerS9.004 S17 240 Winter 100 +40% 100/15 SummerS1.008 S9 360 Winter 100 +40% 30/30 Summer 100/180 Winter
PNUS/MHName
Water Level(m)
SurchargedDepth(m)
FloodedVolume(m³)
Flow /Cap.
Overflow(l/s)
PipeFlow(l/s) Status
LevelExceeded
S9.002 S18 83.973 0.661 0.000 0.14 4.6 SURCHARGEDS9.003 S16 83.967 1.023 0.000 0.26 5.9 FLOOD RISKS9.004 S17 83.959 1.222 0.000 0.34 8.0 SURCHARGEDS1.008 S9 83.950 2.400 5.816 0.10 5.0 FLOOD 4