Embed Size (px)
Citation preview

RNS3
PASPA3
A-1 Anthesis A+1 A+2 A+3
A+4
Supplemental Figure S1. Developmental series for petal senescence. The series starts one bud before anthesis (A-1), followed
by the subsequent flowers before the dry stage (Anthesis, A+1 to A+4). Petals were dissected under a stereoscopic microscope,
mounted in slides using Tween 0.01% dissolved in 1/10 MS and imaged in 2x4 tiles using confocal microscopy. The flowers were
collected from one or two inflorescences from homozygous lines of the indicated transcriptional fusions with H2A-GFP cloned in a
GAL4-UAS transactivation system.
A-1 Anthesis A+1 A+2 A+3
A+4
CEP1
DMP4
SCPL48

Supplemental Figure S2. Developmental series for tapetum differentiation. The series starts one
bud before anthesis (Anthesis-1), and the previous floral buds around tapetum cell death (A-2 to A-
4). Flowers at the indicated developmental stage were fixed for 2 hours at room temperature in a
3.7% Paraformaldehyde solution (dissolved in 50mM PIPES, 5mM EGTA and 1mM MgSO4 buffer),
embedded in 5% agarose blocks and sectioned using a vibratome. They were mounted in slides with
water and imaged using confocal microscopy. The flowers were collected from one or two
inflorescences of the same plant using homozygous lines of the indicated transcriptional fusions with
H2A-GFP in a GAL4-UAS transactivation system.
CEP1
SCPL48
RNS3
DMP4
Anthesis -1 A-2 A-3 A-4
PASPA3
CEP1

SCPL48
RNS3
DMP4
PASPA3
Early-late Late torpedo- Bent Mature green
torpedo walking stick cotyledon
Supplemental Figure S3. Developmental series for seed development. Siliques at the indicated
developmental stage were dissected in a stereoscopic microscope to remove the valves , fixed for
2 hours at room temperature in a 3.7% Paraformaldehyde solution (dissolved in 50mM PIPES, 5mM
EGTA and 1mM MgSO4 buffer), embedded in 5% agarose blocks and sectioned using a vibratome.
They were mounted with water in slides and imaged using CLSM. The siliques were collected from
one or two stems of the same plant using homozygous lines of the indicated transcriptional fusions
with H2A-GFP in a GAL4-UAS transactivation system.
CEP1

.6TdT ,6DNase
Supplementary6Figure6Sw
Untreated6 HoOo6
L LL
Untreated6 fh6NaCl 1h6NaCl owh6NaCl
Untreated6 UV.B Untreated6 BM
A B C D E F
G H I J K L
SupplementalcFigurecS4.cWhole-mountcTUNELcofc5-toc6-daycoldcrootctipcaftercdifferentcabioticcstressescprovokingccellcdeath.cTUNEL6signals6are6in6greenP6DAPI6signals6in6red)6A.BK6Oxidative6strss)6AK6untreated6control)6BK6after6treatment6with65mM6HoOo6for6fh)6C.FK6salt6stress)6CK6untreated6control)6DK6after6fhP6EK6after61hP6FK6after6owh6of6treatment6with6cwvmM6NaCl)6G.HK6ultraviolet6radiation6stress)6GK6non.radiated6control)6HK68h6after6exposure6to6UV.B6radiation)6I.JK6genotoxic6stressP6IK6non.treated6controlP6JK6after6owh6of6treatment6with6v)1ugxml6bleomycin)6KK6negative6control6without6TdT6enzyme)6LK6positive6control6after6DNase6treatment)6Scale6bars6are65vum)

0
1
2
3
4
5
0 4 8 12 16 20 24
Re
lati
ve g
en
e e
xpre
ssio
n (
a.u
.)
hpi
MC1
HR
Perif
N I
0
10
20
30
40
50
60
70
0 4 8 12 16 20 24
Re
lati
ve g
en
e e
xpre
ssio
n (
a.u
.)
hpi
PR1
Center
Periferic
N I
0
2
4
6
8
10
0 4 8 12 16 20 24
Rel
ativ
e ge
ne
exp
ress
ion
(a.
u.)
hpi
SCPL48
HR
Periph
N I
0
0.2
0.4
0.6
0.8
1
0 4 8 12 16 20 24
Rel
ativ
e ge
ne
exp
ress
ion
(a.
u.)
hpi
MYB30
HR
Periph
NI
0
0.05
0.1
0.15
0.2
0.25
0.3
0.35
0 4 8 12 16 20 24R
elat
ive
gen
e e
xpre
ssio
n (
a.u
.)
hpi
CEP1
HR
Periph
N I
0
0.2
0.4
0.6
0.8
1
0 4 8 12 16 20 24
Rel
ativ
e ge
ne
exp
ress
ion
(a.
u.)
hpi
RNS3
HR
Periph
N I
0
0.1
0.2
0.3
0.4
0.5
0.6
0 4 8 12 16 20 24
Rel
ativ
e ge
ne
exp
ress
ion
(a.
u.)
hpi
BFN1
HR
Periph
N I
0
0.05
0.1
0.15
0.2
0.25
0 4 8 12 16 20 24
Rel
ativ
e ge
ne
exp
ress
ion
(a.
u.)
hpi
PASPA3
HR
Periph
N I
0
0.02
0.04
0.06
0.08
0.1
0.12
0 4 8 12 16 20 24
Rel
ativ
e ge
ne
exp
ress
ion
(a.
u.)
hpi
DMP4
HR
Periph
N I
0
0.1
0.2
0.3
0.4
0.5
0 4 8 12 16 20 24
Rel
ativ
e ge
ne
exp
ress
ion
(a.
u.)
hpi
MC9
HR
Periph
N I
Supplemental Figure S4. dPCD marker genes are not transcriptionally regulated during HR-related ePCD. Arabidopsis Col-0 plants were inoculated with Pst AvrRpm1 (5 x 10⁷ cfu/ml). Leaf samples were harvested at the indicated time points from areas inside the infiltrated zone that develops the HR (HR; blue), immediately neighboring the infiltrated zone (periph; red), and from non-inoculated tissues (NI; green) at the indicated time points. Relative expression of the indicated genes in the three zones was determined by Q-RT-PCR. PATHOGENESIS RELATED1 (PR1),METACASPASE1 (MC1), and MYB DOMAIN PROTEIN 30 (MYB30) were used as HR marker genes. Expression values were normalized using SAND family gene as internal standard. Mean and SEM values were calculated from 3 independent experiments with 3 replicates. hpi: hours after inoculation; a.u.: arbitrary units.
1
PCD Control PCD type TC Description Identifier CEL files Ref.
Differentiating xylem Cortex Tracheary elements
No sorted cells from 6 day-old roots, cell type specific- GFP expressing protoplast
GSE16468 GSM413912 -14, GSM413909- 11
(1)
VND6 and SND1 expressing cells
WT cells
Tracheary elements
No cells treated with 2 μM estrogen for 12h GSE20586 GSM517076 - 78, 82 -84, 88-90
(2)
35S:VND7-VP16-GR
Empty vector
Tracheary elements
No 10 day old seedlings treated with 10mM CHX for 2hrs followed by 10mM DEX for 4hrs
GSE24169
GSM594701-05, GSM594711-15
(3)
J3411:GFP, Lateral root cap plus epidermis
J0571:GFP, ground tissue (endodermis and cortex) and the QC
Lateral Root Cap
No sorted cells from 4-5 day-old roots, cell type specific- GFP expressing protoplast
GSE5749
GSM133968-70 GSM133992-93
(4)
Peripheral endosperm-bending cotyledon stage
Embryo proper-bending cotyledon stage
Endosperm
No Siliques containing bending cotyledon stage seeds were sectioned and the seed compartments were isolated using Laser Capture Microdissection (LCM)
GSE20039
GSM501159-60 GSM501157-58
(5)
Cellularized endosperm-linear cotyledon stage, Peripheral endosperm-bending cotyledon stage
Peripheral endosperm-globular stage, Peripheral endosperm-heart stage
Endosperm
No Siliques containing seeds in the appropriate stage were sectioned and the seed compartments were isolated using LCM
GSE12403 GSE20039 GSE11262 GSE15160
GSM311289-90 GSM501159-60 GSM284390-91 GSM378649-50
(6)
General seed coat- bending cotyledon and linear cotyledon stage
LCM general seed coat at the heart stage
Seed coat
No Siliques between 1.2 and 1.5 cm long, 1.6 and 1.9 cm long and 1.9-2.0 cm long were sectioned and the seed compartments isolated using LCM
GSE20039 GSE12403 GSE15160
GSM501165-66 GSM311295-96 GSM378657-58
(5)
Inducible overexpression ANAC059 and ANAC092
Empty vector Senescence
No 3 weeks old shoots treated with 10µM estradiole and harvested 5 hours after induction
GSE14091
GSM353584-88 GSM353591-93
(7)
Partially senescent leaves, developmental stage: 6.0
Fully developed green leaves, developmental stage: 3.9
Senescence
No Leaves were harvested at two stages to identify the senescence- enhanced genes
GSE5727
GSM133729-32
NA
Senescent leaf Rosette leaf # 6 Senescence No AtGenExpress: Developmental series GSE5630 GSM131513-15 NA
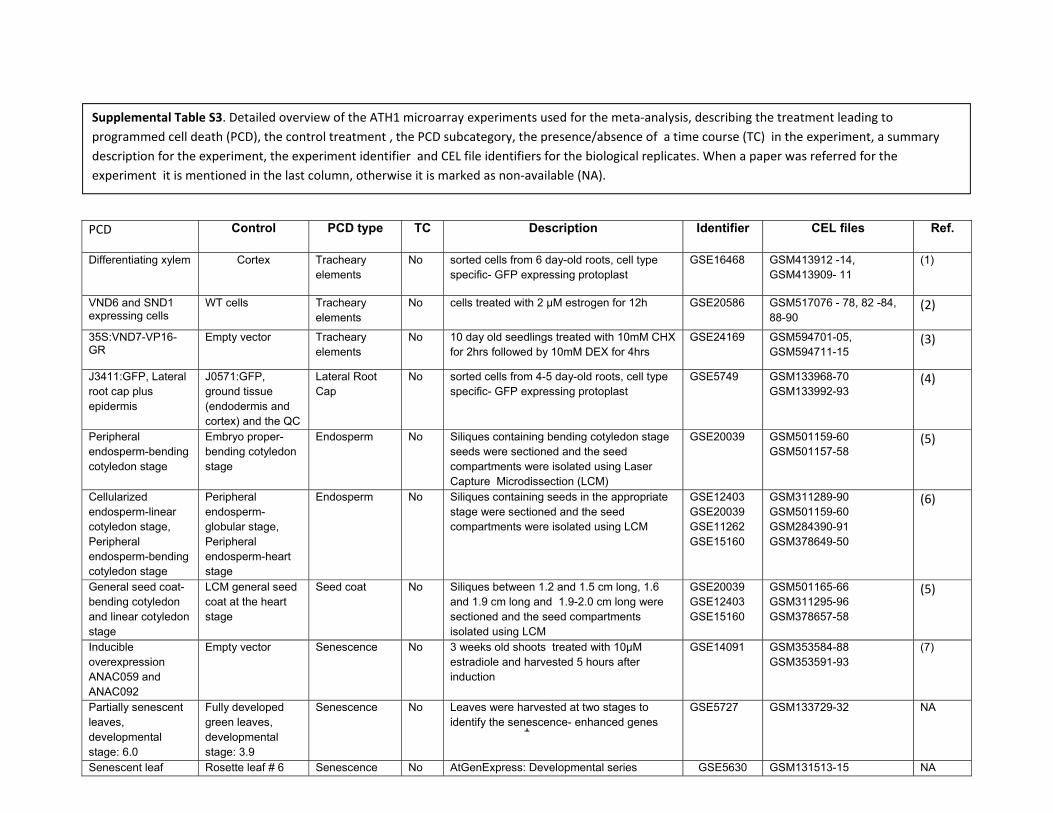
Supplemental Table S3. Detailed overview of the ATH1 microarray experiments used for the meta-analysis, describing the treatment leading to programmed cell death (PCD), the control treatment , the PCD subcategory, the presence/absence of a time course (TC) in the experiment, a summary description for the experiment, the experiment identifier and CEL file identifiers for the biological replicates. When a paper was referred for the experiment it is mentioned in the last column, otherwise it is marked as non-available (NA).

2
(leaves) GSM131537-39 Flowers stage 15, petals
Flowers stage 12, petals
Senescence
No AtGenExpress: Developmental series (flowers and pollen)
GSE5632
GSM131588-90 GSM131606-08
NA
Flowers stage 15, sepals
Flowers stage 12, sepals
Senescence
No AtGenExpress: Developmental series (flowers and pollen)
GSE5632
GSM131585-87 GSM131603-05
NA
Senescing siliques of 20 days after anthesis
Mature green silique tissues of 10 days after anthesis
Senescence
No Two pods collected from each plant and pooled from 20 plants
GSE5736
GSM133816-21
(8)
saul1 mutants transferred to low light treatment for 0, 48h
wt transferred to low light treatment for 0, 48h
Senescence
Yes 11 d old seedlings grown in permissive light (60 umol m-2 s-1) and then transferred to low light treatment
NA NA (9)
When 10-30 % cell death was observed in protoplasts the samples were harvested and pooled in one sample
No cell death Biotic stress No 6-day old, dark grown cell cultures were treated with 20uM Fumonisin B1 (mycotoxin that induces PCD by disrupting ceramide synthesis) or Methanol as mock treatment, pooled and then protoplasted
GSE5735
GSM133808-15
NA
cpr5 mutant
Wt
Biotic stress No Cpr5 mutant exhibits spontaneous cell death and heightened immunity
GSE40322
GSM991294-99
(10)
Wt rpp4 mutant
Biotic stress Yes 2-week old leaves were inoculated with Hyaloperonospora arabidopsidis Emwa1. RNA extracted 0 and 6 days after inoculation. rpp4 mutant had the highest percentage of leaves with sporangiophores (SPP), confirming that its resistance to Hpa Emwa1 is completely compromised
GSE22274
GSM554311_rep1, _rep2
GSM554315_rep1, _rep2 GSM554316_rep1,_rep2 GSM554320_rep1,_rep2
(11)
30 h after inoculation
Before inoculation
Biotic stress No 2 week old Wt roots were inoculated with Phytophthora parasitica 310 strain (10^6
GSE20226
GSM507047-48, GSM507055-56
(12)

3
zoospores per Petri dish) Botrytis cinerea conidiospores
Mock treated
Biotic stress Yes Four 5 ul droplets of Botrytis cinerea conidiospores diluted to 5X10⁵ spores/ml or sterile potato dextrose broth were placed on each of 4-5 rosette leaves (4 week old) per plant. Laeves were harvested 18 hpi
GSE5684
GSM133025-36
(13)
Phytophthora infestans spores
Water drops on leaves
Biotic stress Yes Phytophthora infestans (5x10⁵ spores) in water applied to 5 week old leaf surfaces. Tissue was harvested 6, 12, 24 hpi
GSE5616
GSM131160-68, GSM131151-59
NA
1 µM GST-NPP1 in water
1 µM GST in water Biotic stress No 5 week old leaves infiltrated, harvested 4 hours later
GSE5615
GSM131110, 12, 24, 26, 38, 40
NA
Chitosan 150 μg/ml
Mock solution (0.02% acetic acid)
Biotic stress No 4 day-old seedlings were treated for 3 hours before RNA extraction
GSE17193
GSM429956,61 GSM429980-81,
(14)
10 µM HrpZ
leaves infiltrated with water
Biotic stress No 5-weeks old rosette leaves treated for 4 hours
GSE5615
GSM131111, 22, 25, 36, 39,50
NA
AtMYB30-ox
Arabidopsis AtMYB30-as
Biotic stress No 4 weeks old leaves, 90-105 min after inoculation with a Xanthomonas strain, Xcc147
GSE9674
GSM244451-52, 58-59
(15)
Inoculation with Pseudomonas syringae pv. tomato (Pto) expressing the effector HopZ1a into Wt plants
Inoculation with Pseudomonas syringae pv. tomato (Pto) wt, into WT plants
Biotic stress No The effector HopZ1a is recognized in Arabidopsis, triggering the hypersensitive response (HR). Rosette leaf 1-5 harvested 6 hpi
GSE21920
GSM545364, 67, 72 84-86
NA
Cucumber mosaic virus (CMV) 2b counter-defense protein- expressing plants
Wt plants, mock treated
Biotic stress No The Cucumber mosaic virus (CMV) 2b counter-defense protein disrupts plant antiviral mechanisms mediated by RNA silencing and salicylic acid (SA)
GSE37921
GSM929932-33, 35, 36, 38, 39
(16)
Cell suspension cultures were exposed to high
Cell suspension cultures were kept at 50 microE/m2/s
Oxidative stress
No 200 mL of cultures with a cell density of approximately 150-200 mg/mL, kept at constant temperature
GSE22671
GSM562208-10, GSM562214-16
(17)

4
light during 30 minutes (1800 microE/m2/s)
flu mutant Wt Oxidative stress
No Plants grown under continuous light 90 mmol. m-2 . s-1 for 3 weeks, transferred to the dark for 8 h and rosette leaves were harvested 2 h after reillumination
GSE10812
GSM272985-88
(18)
Wt, 20mM hydrogen peroxide
Wt, sprayed with deionised water
Oxidative stress
No 2 week old seedlings were harvested 3 hr after treatment
GSE41136
GSM1009029-34
NA
Fumigation with 500 ppb ozone .
Fumigation with scrubbed air (filtered through charcoal and purafill)
Oxidative stress
No 2 week-old seedlings were harvested 6 hr after treatment. Flow rate was 910ml/min
GSE5722
GSM133705-10
NA
Wt seedlings treated with 5mM H2O2
Untreated Oxidative stress
No 7d dark-grown seedlings were used to reduce the endogenous H2O2 level caused by light
GSE40574
GSM996955-58
(19)
Methyl viologen (10 uM final conc) was added to the media to induce Oxidative stress
Control plants were handled like the treated plants and harvested in parallel
Oxidative stress
Yes 18-day-old shoots were harvested 12 and 24 h after treatment
ME00340
OXIDATIVE_12H_SHOOT_REP1, REP2, OXIDATIVE_24H_SHOOT_REP1, REP2, OXIDATIVE_CONTROL_12H_SHOOT_REP1, REP2 OXIDATIVE_CONTROL_24H_SHOOT_REP1, REP2
NA
Methyl viologen (10 uM final conc) was added to the media to induce Oxidative stress
Control plants were handled like the treated plants and harvested in parallel
Oxidative stress
Yes 18-day-old roots were harvested 12 and 24 h after treatment
ME00340
OXIDATIVE_12H_ROOT_REP1, REP2, OXIDATIVE_24H_ROOT_REP1, REP2, OXIDATIVE_CONTROL_12H_ROOT_REP1, REP2 OXIDATIVE_CONTROL_24H_ROOT_REP1, REP2
NA

5
cat2 mutant, high light exposure in a
sun simulator
cat2, Ambient growth conditions
Oxidative stress
Yes 6 week old leaves were harvested 0, 3 and 8 h after treatment
E-MEXP-449
pz220803_04, _05,_12, hyb1480, 81, 83
NA
wee1KO, transferred to medium with 2mM Hydroxyurea
wee1KO, transferred to control medium
Genotoxic stress
Yes 5d old roots were harvested 5 and 24 h after treatment
E-MEXP-3048, E-MEXP-3053
hyb2133-36, 39-42
(20)
1.5ug/ml bleomycin + 22 ug/ml mitomycin
Control- no treatment
Genotoxic stress
Yes 16 d old seedling shoots were harvested 12 and 24 h after treatment
GSE5620 GSE5625
GSM131251,52,55,56 GSM131375,76,79,80
NA
1.5ug/ml bleomycin + 22 ug/ml mitomycin
Control- no treatment
Genotoxic stress
Yes 16 d old seedling roots were harvested 12 and 24 h after treatment
GSE5620 GSE5625
GSM131253,54,57,58 GSM131377,78,81,82
NA
Thaxtomin A
Methanol
Genotoxic stress
No suspension cell culture 6 h after treatment
GSE17824
GSM444737-44
NA
Isoxaben Methanol
Genotoxic stress
No Suspension cell culture, 6 h after treatment
GSE17824
GSM444745-52
NA
UV-1-day radiation
Continuos white light
UV stress No 18 d old seedlings, shoots harvested 24h after treatment
GSE22951
GSM566614-16 GSM566623-25
NA
UV-B stress (15 min. 1.18 W/m2)
Control- no treatment
UV stress Yes 16 d old seedlings, Shoots harvested 12 and 24 h after treatment
GSE5626
GSM131403-04 GSM131407-08
(17)
UV-B stress (15 min. 1.18 W/m2)
Control- no treatment
UV stress Yes 16 d old seedlings Roots-12 and 24 h
GSE5626
GSM131405-06 GSM131409-10
(17)
30 h at 37 °C Heat stress, no recovery
No treatment, no recovery
Heat stress No 3 week old seedling
GSE18666
GSM463683-86
(21)
55 C for 10 minutes
No treatment Heat stress No 6 d suspension cells
NASCARRAYS-30
NRID5299-NRID5304_Swidzinski
NA
250mM NaCl solution
Only water supply
Salt stress No 5-week-old rosette leaves harvested 24 h after treatment
E-ATMX-30
E-ATMX-30.raw.1.zip/ WT-NaCl1.CEL / WT_NaCl2.CEL / WT-
(22)

6
1.CEL /WT-2 140 mM NaCl
No treatment
Salt stress Yes whole seedling roots ,5 days after germination, were harvested 16 and 32 h after treatment
GSE7642
GSM184925-26, GSM184933-36
(23)
Nacl 150 mM
No treatment
Salt stress Yes 16 d old seedling shoots were harvested 12 and 24 h after treatment
GSE5623
GSM131323-24, GSM131327-28
(17)
Nacl 150 mM
No treatment
Salt stress Yes 16 d old seedling roots were harvested 12 and 24 h after treatment
GSE5623
GSM131325-26, GSM131329-30
(17)
Wildtype_24H 0°C_Rep1
Wildtype_no treatment_Rep2
Cold stress No 10 day old seedlings-grown in plate GSE3326
GSM74900-01, GSM748995
(24)
4°C_under continuous light (~25 umol m-2 s-1)
24°C_under continuous light
(~25 umol m-2 s-1)
Cold stress No 10 day old seedlings-grown in plate 18 days old, aerial parts, soil grown
GSE5534 GSE5535
GSM128789-90, GSM128795-96, GSM128797-98 GSM128803-04
NA
0.3 M mannitol Control- no treatmen
Osmotic stress Yes 16-day-old seedlings, Shoots harvested 12 and 24 h after treatment
GSE5622
GSM131299-300 GSM131303-304
(17)
0.3 M mannitol
Control- no treatment
Osmotic stress Yes 16-day-old seedlings, Shoots harvested 12 and 24 h after treatment
GSE5622
GSM131301-302 GSM131305-306
(17)
0.3M mannitol
Mock treated
Osmotic stress No 30 d old leaf, 10 day treatment
GSE36789
GSM901069-71 GSM901075-77
(25)
0.3M mannitol
Mock treated
Osmotic stress No
30 d old root, 10 day treatment
GSE36789
GSM901072-74 GSM901078-80
(25)
ACC (10 uM) ethylene precursor
Mock (3 hours)
Hormone (Ethylene)
No
7-day-old seedling, 3 h after treatment
ME00334
RIKEN-GODA23A, 23B RIKEN-GODA17BA,17AA
NA
5 ppm ethylene
Air
Hormone (Ethylene)
No
Petiole harvested 3 h after treatment
NASC ARRAYS-32
Millenaar_A2_ETH_Rep1, Rep2, Millenaar_A5_ETH_Rep3, Millenaar_A1_AIR_Rep1, Rep2 Millenaar_A4_AIR_Rep3
NA
10 ppm ethylene
Air
Hormone (Ethylene)
No
7-day-old seedling, 3 h after treatment ME00364
RIKEN-GODA21AH, BH RIKEN-GODA1AH, BH
(26)
Salicylic acid (10 uM, 3 hours)
Mock (3 hours)
Hormone (Salicylic acid)
No
3 week old plants, 4 h after treatment GSE14247
GSM356823-26 NA
2 mM SA treated
Water treated
Hormone (Salicylic acid)
No
9-day-old seedling, 24 h after treatment GSE14961
GSM373532-36
NA

7
1
2
1. Lee JY, Colinas J, Wang JY, Mace D, Ohler U, Benfey PN. Transcriptional and posttranscriptional regulation of transcription factor expression in 3 Arabidopsis roots. Proc Natl Acad Sci U S A. 2006;103(15):6055-60. 4 2. Ohashi-Ito K, Oda Y, Fukuda H. Arabidopsis VASCULAR-RELATED NAC-DOMAIN6 directly regulates the genes that govern programmed cell death and 5 secondary wall formation during xylem differentiation. Plant Cell. 2010;22(10):3461-73. 6 3. Yamaguchi M, Mitsuda N, Ohtani M, Ohme-Takagi M, Kato K, Demura T. VASCULAR-RELATED NAC-DOMAIN7 directly regulates the expression of a 7 broad range of genes for xylem vessel formation. Plant J. 2011;66(4):579-90. 8 4. Birnbaum K, Shasha DE, Wang JY, Jung JW, Lambert GM, Galbraith DW, et al. A gene expression map of the Arabidopsis root. Science. 9 2003;302(5652):1956-60. 10 5. Zuber H, Davidian JC, Aubert G, Aime D, Belghazi M, Lugan R, et al. The seed composition of Arabidopsis mutants for the group 3 sulfate transporters 11 indicates a role in sulfate translocation within developing seeds. Plant Physiol. 2010;154(2):913-26. 12 6. Le BH, Cheng C, Bui AQ, Wagmaister JA, Henry KF, Pelletier J, et al. Global analysis of gene activity during Arabidopsis seed development and 13 identification of seed-specific transcription factors. Proc Natl Acad Sci U S A. 2010;107(18):8063-70. 14 7. Balazadeh S, Siddiqui H, Allu AD, Matallana-Ramirez LP, Caldana C, Mehrnia M, et al. A gene regulatory network controlled by the NAC transcription 15 factor ANAC092/AtNAC2/ORE1 during salt-promoted senescence. Plant J. 2010;62(2):250-64. 16 8. Wagstaff C, Yang TJ, Stead AD, Buchanan-Wollaston V, Roberts JA. A molecular and structural characterization of senescing Arabidopsis siliques and 17 comparison of transcriptional profiles with senescing petals and leaves. Plant J. 2009;57(4):690-705. 18 9. Vogelmann K, Drechsel G, Bergler J, Subert C, Philippar K, Soll J, et al. Early senescence and cell death in Arabidopsis saul1 mutants involves the 19 PAD4-dependent salicylic acid pathway. Plant Physiol. 2012;159(4):1477-87. 20 10. Bowling SA, Clarke JD, Liu Y, Klessig DF, Dong X. The cpr5 mutant of Arabidopsis expresses both NPR1-dependent and NPR1-independent resistance. 21 Plant Cell. 1997;9(9):1573-84. 22 11. Wang W, Barnaby JY, Tada Y, Li H, Tor M, Caldelari D, et al. Timing of plant immune responses by a central circadian regulator. Nature. 23 2011;470(7332):110-4. 24 12. Attard A, Gourgues M, Callemeyn-Torre N, Keller H. The immediate activation of defense responses in Arabidopsis roots is not sufficient to prevent 25 Phytophthora parasitica infection. New Phytol. 2010;187(2):449-60. 26 13. Ferrari S, Galletti R, Denoux C, De Lorenzo G, Ausubel FM, Dewdney J. Resistance to Botrytis cinerea induced in Arabidopsis by elicitors is 27 independent of salicylic acid, ethylene, or jasmonate signaling but requires PHYTOALEXIN DEFICIENT3. Plant Physiol. 2007;144(1):367-79. 28 14. Povero G, Loreti E, Pucciariello C, Santaniello A, Di Tommaso D, Di Tommaso G, et al. Transcript profiling of chitosan-treated Arabidopsis seedlings. J 29 Plant Res. 2011;124(5):619-29. 30
8
15. Raffaele S, Vailleau F, Leger A, Joubes J, Miersch O, Huard C, et al. A MYB transcription factor regulates very-long-chain fatty acid biosynthesis for 31 activation of the hypersensitive cell death response in Arabidopsis. Plant Cell. 2008;20(3):752-67. 32 16. Lewsey MG, Murphy AM, Maclean D, Dalchau N, Westwood JH, Macaulay K, et al. Disruption of two defensive signaling pathways by a viral RNA 33 silencing suppressor. Mol Plant Microbe Interact. 2010;23(7):835-45. 34 17. Kilian J, Whitehead D, Horak J, Wanke D, Weinl S, Batistic O, et al. The AtGenExpress global stress expression data set: protocols, evaluation and 35 model data analysis of UV-B light, drought and cold stress responses. Plant J. 2007;50(2):347-63. 36 18. Laloi C, Stachowiak M, Pers-Kamczyc E, Warzych E, Murgia I, Apel K. Cross-talk between singlet oxygen- and hydrogen peroxide-dependent signaling 37 of stress responses in Arabidopsis thaliana. Proc Natl Acad Sci U S A. 2007;104(2):672-7. 38 19. Cheng H, Zhang Q, Guo D. Genes that respond to H(2)O(2) are also evoked under light in Arabidopsis. Mol Plant. 2013;6(1):226-8. 39 20. Cools T, Iantcheva A, Weimer AK, Boens S, Takahashi N, Maes S, et al. The Arabidopsis thaliana checkpoint kinase WEE1 protects against premature 40 vascular differentiation during replication stress. Plant Cell. 2011;23(4):1435-48. 41 21. Pecinka A, Dinh HQ, Baubec T, Rosa M, Lettner N, Mittelsten Scheid O. Epigenetic regulation of repetitive elements is attenuated by prolonged heat 42 stress in Arabidopsis. Plant Cell. 2010;22(9):3118-29. 43 22. Jung C, Seo JS, Han SW, Koo YJ, Kim CH, Song SI, et al. Overexpression of AtMYB44 enhances stomatal closure to confer abiotic stress tolerance in 44 transgenic Arabidopsis. Plant Physiol. 2008;146(2):623-35. 45 23. Dinneny JR, Long TA, Wang JY, Jung JW, Mace D, Pointer S, et al. Cell identity mediates the response of Arabidopsis roots to abiotic stress. Science. 46 2008;320(5878):942-5. 47 24. Lee BH, Henderson DA, Zhu JK. The Arabidopsis cold-responsive transcriptome and its regulation by ICE1. Plant Cell. 2005;17(11):3155-75. 48 25. Kinoshita N, Wang H, Kasahara H, Liu J, Macpherson C, Machida Y, et al. IAA-Ala Resistant3, an evolutionarily conserved target of miR167, mediates 49 Arabidopsis root architecture changes during high osmotic stress. Plant Cell. 2012;24(9):3590-602. 50 26. Qiao H, Chang KN, Yazaki J, Ecker JR. Interplay between ethylene, ETP1/ETP2 F-box proteins, and degradation of EIN2 triggers ethylene responses in 51 Arabidopsis. Genes Dev. 2009;23(4):512-21. 52
53
54
55

1
1) Developmental induced cell death Number of genes Condition Experiment
1.1 Differentiation induced PCD Down Up Total e-1 vs e-2 Xylem vs cortex 3124 2208 5332 1 1e-3 vs e-5 VND6 vs Wt 995 1273 2268 2 2e-4- vs e-5 SND1 vs Wt 371 1030 1401 3 2e-6 vs e-7 VND7 vs mock 64 133 197 4 3e-8 vs e-9 LRC vs ground 994 1108 2102 5 4e-10 vs e-11 End vs embryo, bending cotyledon stage 2793 1834 4627 6 5e-13 vs e-15 Linear cotyledon 2983 2907 5890 7 6
vs globular stage, endosperm e-14 vs e-12 Bending cotyledon 2850 2120 4970 8 6
vs heart stage, endosperm e-16 vs e-18 Bending cotyledon 2265 1770 4035 9 7
vs heart stage,seed coat e-17 vs e-18 Linear cotyledon 1611 1643 3254 10 7
vs heart stage,seed coat 1.2 Senescence induced PCD e-19 vs e-21 Inducible ANAC059 vs empty vector 27 46 73 11 8e-20 vs e-21 Inducible ANAC092 vs empty vector 60 180 240 12 8e-22 vs e-23 Mature green vs senescing siliques 1513 1383 2896 13 9e-24 vs e-25 Rosette, green vs senescing leaves 2338 2572 4910 14 10e-26 vs e-27 Flower stage 15 vs stage 12, petals 2478 2217 4695 15 11e-28 vs e-29 Flower stage 15 vs stage 12, sepals 1794 1435 3229 16 12e-30 vs e-31 Leaf stage 6 vs 3.9, 1485 1748 3233 17 13
partially senescent vs mature green e-32 vs e-34 saul vs wt, time 0, low light 1 26 27 18 14e-33 vs e-35 saul vs wt, time 48 h, low light 2677 2172 4849 19 14
2) Environmental induced cell death
2.1 Biotic induced PCD Down Up Total Contrast Experimente-36 vs e-37 Fumonisin B1 vs mock, protoplast 21 39 60 20 15e-38 vs e-39 cpr5 vs wt 129 751 880 21 16e-40 vs e-42 rpp4 vs wt, time 0 354 256 610 22 17e-41 vs e-43 rpp4 vs wt, 6 days after inoculation 174 84 258 23 17e-44 vs e-45 Phytophthora inoculated root vs control, 30 hpi 1634 1303 2937 24 18e-46 vs e-48 Botrytis inoculated leaves, vs control, 18 hpi 73 539 612 25 19e-47 vs e-49 Botrytis inoculated leaves, vs control, 48 hpi 1597 1287 2884 26 19e-50 vs e-53 Phytophthora inoculated leaves, vs control, 6 hpi 1190 1051 2241 27 20e-51 vs e-54 Phytophthora inoculated leaves, vs control, 12 hpi 333 658 991 28 20e-52 vs e-55 Phytophthora inoculated leaves, vs control, 24 hpi 356 563 919 29 20e-56 vs e-57 NPP1 treated leaves vs mock, 4h 241 722 963 30 21e-58 vs e-59 chitosan vs mock,seedlings, 3h 501 634 1135 31 22e-60 vs e-61 HrpZ treated leaves vs mock, 4h 1141 1374 2515 32 23e-62 vs e-63 AtMYB30-ox vs AtMYB30-as, Xanthomonas 35 53 88 33 24
inoculated, 90-105 min after inoc
Supplemental Table S4. Overview of the number of up- and down-regulated genes per condition in the experiments used in the meta-analysis. For each condition the associated experiment number is indicated.

2
e-64 vs e-65 Pseudomonas expressing HopZ1a, into Wt plants vs Pseudomonas Wt , into Wt plants 754 693 1447 34 25
e-66 vs e-67 Cucumber mosaic virus (CMV) 2b counter-defenseprotein- expressing plants vs wt plants 78 391 469 35 26
2.2 Oxidative stress Down Up Total Contrast Experimente-68 vs e-69 HL exposed cultures, vs control, 30 min 42 277 319 36 27e-70 vs e-71 flu vs wt, continuos light-dark-light, leaves 386 1261 1647 37 28e-72 vs e-73 20mM hydrogen peroxide vs control, 3 h, seedling 45 198 243 38 29e-74 vs e-75 500 ppb ozone vs control, 6h, seedling 860 1538 2398 39 30e-76 vs e-77 5mM H2O2 vs control, seedling dark grown 205 693 898 40 31e-78 vs e-80 Methyl viologen vs control, 12h, shoots 0 73 73 41 32e-79 vs e-81 Methyl viologen vs control, 24h, shoots 8 274 282 42 32e-82 vs e-84 Methyl viologen vs control, 12h, roots 3 1 4 43 33e-83 vs e-85 Methyl viologen vs control, 24h, roots 99 21 120 44 33e-86 vs e-88 cat2 mutant, high light, vs control, 3h 563 593 1156 45 34e-87 vs e-88 cat2 mutant, high light, vs control, 8h 1326 1674 3000 46 34 2.3 Genotoxic stress e-89 vs e-91 wee1 KO- Hydroxyurea, vs control,5h 3 60 63 47 35e-90 vs e-92 wee1 KO- Hydroxyurea, vs control,24h 49 138 187 48 35e-93 vs e-95 bleomycin +mitomycin vs control, shoots, 12 h 25 158 183 49 36e-94 vs e-96 bleomycin +mitomycin vs control, shoots, 24 h 16 152 168 50 36e-97 vs e-99 bleomycin +mitomycin vs control, roots, 12 h 116 223 339 51 37e-98 vs e-100 bleomycin +mitomycin vs control, roots, 24 h 175 283 458 52 37e-101 vs e-102 TA, cell cultures vs mock, 6h 1 189 190 53 38e-103 vs e-104 IXB, cell cultures vs mock, 6h 0 37 37 54 39 2.4 UV stress e-105 vs e-106 UV-1-day radiation vs white light, shoots 18d, 24h 483 570 1053 55 40e-107 vs e-95 UV-15min vs control, shoots 16d , 12 h 89 358 447 56 41e-108 vs e-96 UV-15min vs control, shoots 16d , 24 h 87 314 401 57 41e-109 vs e-99 UV-15min vs control, roots 16d , 12 h 3 4 7 58 42e-110 vs e-100 UV-15min vs control, roots 16d , 24 h 88 155 243 59 42 2.5 Heat stress
e-111 vs e-112 30 h, 37 °C- no recovery vs control, 3week seedling 2125 2170 4295 60 43
e-113 vs e-115 10m , 55 °C vs mock,suspension cells 610 759 1369 61 44 2.6 Salt stress e-116 vs e-117 250mM NaCl vs control, rosette leaves, 24 h 1251 965 1351 62 45e-118 vs e-120 140mM NaCl vs control, seedling root, 16 h 162 334 496 63 46e-119 vs e-120 140mM NaCl vs control, seedling root, 32 h 112 300 412 64 46e-121 vs e-95 250mM NaCl vs control, shoots 16d , 12 h 342 449 791 65 47e-122 vs e-96 250mM NaCl vs control, shoots 16d , 24 h 874 953 1827 66 47e-123 vs e-99 250mM NaCl vs control, roots 16d , 12 h 1652 1613 3265 67 48

3
1
e-124 vs e-100 250mM NaCl vs control, roots 16d , 24 h 1269 1618 2887 68 48
2.7 Cold stress e-125 vs e-126 Wildtype_24h 0°C vs control, 24 h 938 1123 2061 69 49e-127 vs e-129 4°C vs 24°C, 7days treated, seedlings 10d old 784 718 1502 70 50e-128 vs e-130 4°C vs 24°C, 7days treated, seedlings 18d old 368 358 726 71 50 2.8 Osmotic stress e-131 vs e-95 300 mM Mannitol-12 h vs control, shoots, 16 d 1901 1657 3558 72 51e-132 vs e-96 300 mM Mannitol-24 h vs control, shoots, 16 d 2439 2168 4607 73 51e-133 vs e-99 300 mM Mannitol-12 h vs control, roots, 16 d 1501 1196 2697 74 52e-134 vs e-100 300 mM Mannitol-24 h vs control, roots, 16 d 1290 1073 2363 75 52e-135 vs e-136 300 mM Mannitol-10 d vs control, 30 d old , leaf 331 533 864 76 53e-137 vs e-138 301 mM Mannitol-10 d vs control, 30 d old , leaf 642 857 1499 77 54
2.9 Hormone Down Up Total Contrast Experimente-139 vs e-140 ACC (10 uM, 3 h), seedling 14 53 67 78 55e-141 vs e-142 5 ppm ethylene, 3h, petiole 149 244 393 79 56e-143 vs e-144 Salicylic acid (SA, 10 uM, 3 h), seedling 96 403 499 80 57e-145 vs e-146 10 ppm ethylene vs air, 3 week old, 4h 2969 3027 5996 81 58e-147 vs e-148 2 mM SA vs control, seedling, 24h 1543 1558 3101 82 59
1
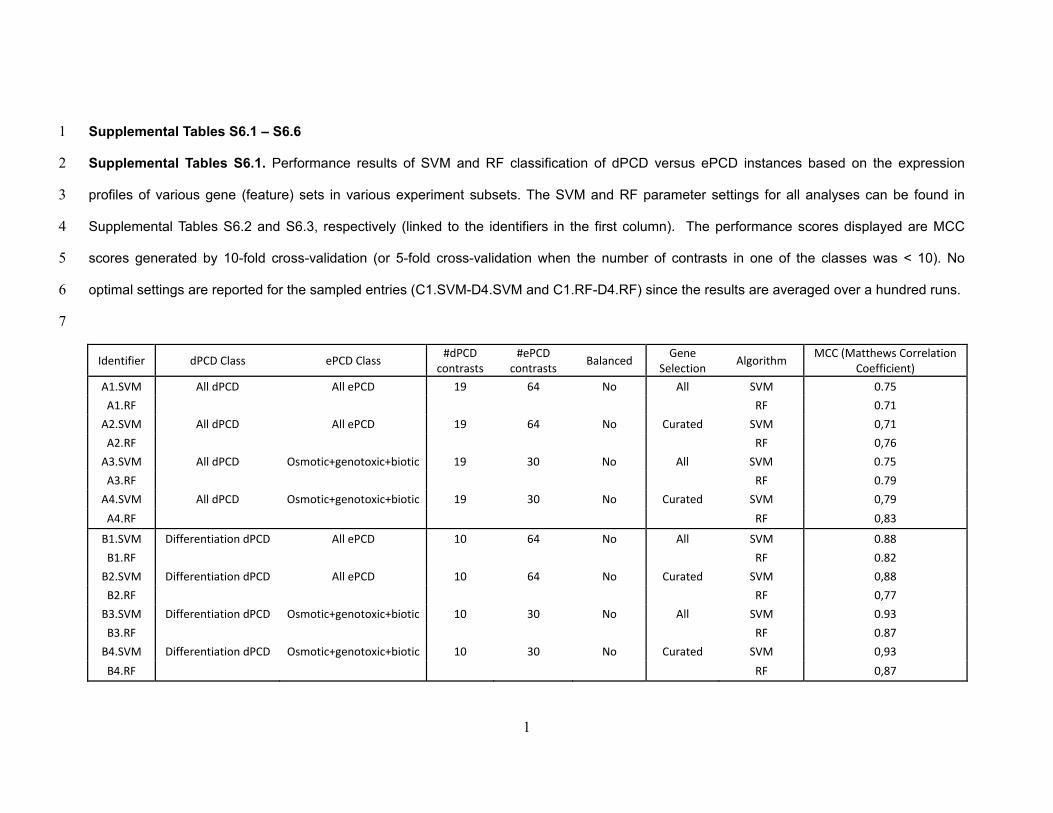
Supplemental Tables S6.1 – S6.6 1
Supplemental Tables S6.1. Performance results of SVM and RF classification of dPCD versus ePCD instances based on the expression 2
profiles of various gene (feature) sets in various experiment subsets. The SVM and RF parameter settings for all analyses can be found in 3
Supplemental Tables S6.2 and S6.3, respectively (linked to the identifiers in the first column). The performance scores displayed are MCC 4
scores generated by 10-fold cross-validation (or 5-fold cross-validation when the number of contrasts in one of the classes was < 10). No 5
optimal settings are reported for the sampled entries (C1.SVM-D4.SVM and C1.RF-D4.RF) since the results are averaged over a hundred runs. 6
7
Identifier dPCD Class ePCD Class #dPCD contrasts
#ePCD contrasts Balanced Gene
Selection Algorithm MCC (Matthews Correlation Coefficient)
A1.SVM All dPCD All ePCD 19 64 No All SVM 0.75 A1.RF RF 0.71
A2.SVM All dPCD All ePCD 19 64 No Curated SVM 0,71 A2.RF RF 0,76
A3.SVM All dPCD Osmotic+genotoxic+biotic 19 30 No All SVM 0.75 A3.RF RF 0.79
A4.SVM All dPCD Osmotic+genotoxic+biotic 19 30 No Curated SVM 0,79 A4.RF RF 0,83
B1.SVM Differentiation dPCD All ePCD 10 64 No All SVM 0.88 B1.RF RF 0.82
B2.SVM Differentiation dPCD All ePCD 10 64 No Curated SVM 0,88 B2.RF RF 0,77
B3.SVM Differentiation dPCD Osmotic+genotoxic+biotic 10 30 No All SVM 0.93 B3.RF RF 0.87
B4.SVM Differentiation dPCD Osmotic+genotoxic+biotic 10 30 No Curated SVM 0,93 B4.RF RF 0,87

2
8 9
Supplemental Table S6.1 (continued): 10
11 C1.SVM All dPCD Sampled from all ePCD 19 19 Yes All SVM 0.74 C1.RF RF 0.77
C2.SVM All dPCD Sampled from all ePCD 19 19 Yes Curated SVM 0,77 C2.RF RF 0,81
C3.SVM All dPCD Sampled from Osmotic+genotoxic+biotic 19 19 Yes All SVM 0.73
C3.RF RF 0.79
C4.SVM All dPCD Sampled from Osmotic+genotoxic+biotic 19 19 Yes Curated SVM 0,76
C4.RF RF 0,83 D1.SVM Differentiation dPCD Sampled from all ePCD 10 10 Yes All SVM 0.75 D1.RF RF 0.8
D2.SVM Differentiation dPCD Sampled from all ePCD 10 10 Yes Curated SVM 0,79 D2.RF RF 0,81
D3.SVM Differentiation dPCD Sampled from Osmotic+genotoxic+biotic 10 10 Yes All SVM 0.71
D3.RF RF 0.79
D4.SVM Differentiation dPCD Sampled from Osmotic+genotoxic+biotic 10 10 Yes Curated SVM 0.77
D4.RF RF 0.82 12

3
Supplemental Table S6.2. Optimized SVM parameter settings for the analyses in Supplemental Table S6.1 13
Identifier Kernel Type Gamma Nu Eps A1.SVM RBF 0 0.2 0.001 A2.SVM RBF 0,125 0,2 0,001 A3.SVM Linear 0 0.1 0.001 A4.SVM RBF 0,5 0,2 0,001 B1.SVM RBF 0 0.1 0.001 B2.SVM RBF 0,125 0,1 0,001 B3.SVM RBF 0.5 0.2 0.001 B4.SVM RBF 0,5 0,2 0,001
14
15
16
Supplemental Table S6.3. Optimized RF parameter settings for the analyses in Supplemental Table S6.1 17
Identifier max-depth min instances num trees A1.RF 2 7 20 A2.RF 2 5 30 A3.RF 2 4 10 A4.RF 2 3 100 B1.RF 1 10 30 B2.RF 1 10 30 B3.RF 1 10 30 B4.RF 1 10 30
18
19

4
Supplemental Table S6.4. The performance of binary classifiers discriminating a particular PCD subclass from all other subclasses. N/A 20
indicates that the MCC could not be calculated by lack of positives or negatives, and thus indicates very poor performance. The SVM and RF 21
parameter settings for all analyses can be found in Supplemental Tables S6.5 and S6.6, respectively (linked to the identifiers in the first column). 22
23
Identifier Class 1 Class 2 #ContrastsClass 1
#ContrastsClass 2 Gene Selection Algorithm MCC
E1.SVM Senescence dPCD All - Senescence dPCD 9 74 All SVM 0.46 E1.RF RF 0.46
E2.SVM Senescence dPCD All - Senescence dPCD 9 74 Curated SVM 0.73 E2.RF RF 0.4
F1.SVM Differentiation dPCD All - Differentiation dPCD 10 73 All SVM 0.88 F1.RF RF 0.75
F2.SVM Differentiation dPCD All - Differentiation dPCD 10 73 Curated SVM 0.88 F2.RF RF 0.82
G1.SVM Genotoxic ePCD All - Genotoxic ePCD 9 74 All SVM 0.73 G1.RF RF 0.8
G2.SVM Genotoxic ePCD All - Genotoxic ePCD 9 74 Curated SVM 0.8 G2.RF RF 0.8
H1.SVM Oxidative ePCD All - Oxidative ePCD 10 73 All SVM 0.3 H1.RF RF N/A
H2.SVM Oxidative ePCD All - Oxidative ePCD 10 73 Curated SVM 0.29 H2.RF RF N/A
I1.SVM UV ePCD All - UV ePCD 5 78 All SVM N/A I1.RF RF N/A
I2.SVM UV ePCD All - UV ePCD 5 78 Curated SVM N/A I2.RF RF N/A

5
24 25 26 Supplemental Table S6.4 (continued) 27 28
J1.SVM Temperature ePCD All - Temperature ePCD 6 77 All SVM N/A J1.RF RF N/A
J2.SVM Temperature ePCD All - Temperature ePCD 6 77 Curated SVM 0.39 J2.RF RF 0.39
K1.SVM Osmotic/Salt ePCD All - Osmotic/Salt ePCD 13 70 All SVM 0.77 K1.RF RF 0.82
K2.SVM Osmotic/Salt ePCD All - Osmotic/Salt ePCD 13 70 Curated SVM 0.96 K2.RF RF 0.86
L1.SVM Hormone ePCD All - Hormone ePCD 5 78 All SVM N/A L1.RF RF 0.44
L2.SVM Hormone ePCD All - Hormone ePCD 5 78 Curated SVM 0.62 L2.RF RF 0.17
M1.SVM Biotic ePCD All - Biotic ePCD 16 67 All SVM 0.62 M1.RF RF 0.49
M2.SVM Biotic ePCD All - Biotic ePCD 16 67 Curated SVM 0.66 M2.RF RF 0.46
29
30
31
32
33

6
34
35
Supplemental Table S6.5. Optimized SVM parameter settings for the analyses in Supplemental Table S6.4 36
Identifier Kernel Type Gamma Nu Eps E1.SVM RBF 0 0.1 0.001 E2.SVM RBF 0.03 0.1 0.001 F1.SVM RBF 0 0.1 0.001 F2.SVM RBF 0.03 0.1 0.001 G1.SVM RBF 0.03 0.1 0.001 G2.SVM RBF 0 0.1 0.001 H1.SVM RBF 0.5 0.1 0.001 H2.SVM RBF 0.5 0.1 0.001 I1.SVM N/A N/A N/A N/A I2.SVM N/A N/A N/A N/A J1.SVM N/A N/A N/A N/A J2.SVM RBF 2 0.1 0.001 K1.SVM RBF 0 0.1 0.001 K2.SVM RBF 0.5 0.2 0.001 L1.SVM N/A N/A N/A N/A L2.SVM RBF 2 0.1 0.01 M1.SVM RBF 0 0.1 0.001 M2.SVM RBF 0.5 0.1 0.001
37
38
39
40

7
41
Supplemental Table S6.6. Optimized RF parameter settings for the analyses in Supplemental Table S6.4 42
Identifier max-depth min instances num trees E1.RF 1 8 20 E2.RF 3 1 30 F1.RF 1 1 10 F2.RF 2 1 30 G1.RF 1 8 10 G2.RF 1 8 10 H1.RF N/A N/A N/A H2.RF N/A N/A N/A I1.RF N/A N/A N/A I2.RF N/A N/A N/A J1.RF N/A N/A N/A J2.RF 1 2 200 K1.RF 1 1 10 K2.RF 1 1 10 L1.RF 1 5 20 L2.RF 4 2 30 M1.RF 2 6 10 M2.RF 1 9 10
43
44
45
46
47

8
48

1
Supplemental Table S7. Phytozome blast search for putative homologs of the Arabidopsis dPCD marker genes MC9, BFN1, PASPA3, RNS3, 1 and SCPL48 2
MC9 (325AA)
BFN1 (305AA)
PASPA3 (508AA)
best blast hit %ID blast length
e-value best blast hit %ID blast length
e-value best blast hit %ID blast length
e-value
Arabidospis lyrata scaffold_600361.1 95.3 319 1.2e-163 fgenesh2_kg.1 98.69 305 4.6e-169 fgenesh2_kg.6 95.67 508 1.1e-268
Medicago truncatula AES66180 42.4 300 3.5e-42 AES63715 68.67 300 2.2e-113 AES92659 63.08 520 5.8e-184
Solanum lycopersicum Solyc10g081300.1.1 53.5 331 8.9e-83 Solyc02g078910.2.1 69.00 300 1.1e-121 Solyc02g080880.2.1 66.60 515 4.0e-190
Populus trichocarpa POPTR_0006s02730.1 65.3 326 7.8e-109 POPTR_0011s04430.1 71.90 274 6.2e-116 POPTR_0004s00900.1 64.79 514 1.0e-186
Oryza sativa OS11T0134700-01 56.5 329 6.2e-87 OS04T0636400-01 67.23 296 7.5e-114 OS01T0663400-01 60.99 523 1.4e-178
Brachypodium distachyon BRADI2G50480.1 50.7 337 8.7e-77 BRADI5G23280.1 69.64 280 1.4e-115 BRADI2G16160.1 62.23 511 7.3e-183
Hordeum vulgare MLOC_5735.2 52.9 331 7.9e-81 MLOC_73587.1 56.57 293 1.1e-113 MLOC_64394.1 54.33 508 7.2e-158
Zea mays GRMZM2G022799_P01 51.2 336 1.1e-76 GRMZM2G168744_P01 68.93 280 4.3e-114 GRMZM2G065757_P01 60.74 517 6.2e-177
Amborella trichopoda ERM98168 54.1 320 1.6e-85 ERN03432 56.57 274 1.4e-86 ERN00700 64.24 509 1.5e-183
Selaginella moellendorffii EFJ20498 50.5 196 6.4e-68 EFJ33450 46.32 285 1.4e-70 EFJ06917 52.80 500 1.8e-146
Physcomitrella patens PP1S165_65V6 55.0 169 7.1e-73 PP1S211_122V6.1 49.20 311 2.2e-78 PP1S93_73V6.2 55.29 510 3.6e-156
Chlamydomonas reinhardtii EDP04316 39.5 253 3.1e-57 EDP02767 37.84 37 7.7 EDP04281 55.74 235 6.1e-74
3
4
5
6

2
Supplemental Table S7 (continued) 7
8
RNS3 (222AA)
SCPL48 (510AA)
best blast hit %ID blast
length e-value best blast hit %ID blast
length e-value
Arabidospis lyrata fgenesh2_kg.1 96.40 222 2.4e-124 fgenesh2_kg.5 97.06 510 1.6e-276
Medicago truncatula AES96753 65.91 220 1.7e-90 AES67523 66.47 501 1.1e-184
Solanum lycopersicum Solyc05g007940.2.1 58.48 224 1.0e-74 Solyc06g017860.1.1 68.18 506 1.1e-187
Populus trichocarpa POPTR_0008s08650.1 64.89 225 1.1e-84 POPTR_0004s22520.1 66.67 504 1.9e-185
Oryza sativa OS08T0434100-01 56.68 217 5.3e-74 OS02T0114200-01 66.02 465 6.4e-172
Brachypodium distachyon BRADI3G37130.2 58.05 205 2.4e-74 BRADI3G01320.1 66.11 478 2.5e-175
Hordeum vulgare MLOC_19306.1 58.42 202 4.8e-74 MLOC_77869.2 65.68 472 3.5e-174
Zea mays GRMZM2G161274_P02 56.16 219 2.9e-76 GRMZM2G020146_P01 63.47 501 1.5e-173
Amborella trichopoda ERM94495 60.55 218 5.2e-78 ERN12871 65.73 496 1.5e-181
Selaginella moellendorffii EFJ09665 50.22 225 7.2e-65 EFJ15031 59.57 465 6.8e-156
Physcomitrella patens PP1S59_320V6.1 47.87 211 2.1e-57 PP1S149_206V6.1 59.53 467 6.9e-153
Chlamydomonas reinhardtii EDP05112 38.24 204 7.8e-35 EDP01561 44.67 441 2.9e-106
9