Embed Size (px)
Citation preview

RESEARCH ARTICLE Open Access
RNA-seq based transcriptional analysis ofSaccharomyces cerevisiae and Lachanceathermotolerans in mixed-culturefermentations under anaerobic conditionsKirti Shekhawat1, Hugh Patterton2, Florian F. Bauer1 and Mathabatha E. Setati1*
Abstract
Background: In wine fermentation starter cultures, the blending of non-Saccharomyces yeast withSaccharomyces cerevisiae to improve the complexity of wine has become common practice, but data regardingthe impact of co-cultivation on yeast physiology and on genetic and metabolic regulation remain limited. Herewe describe a transcriptomic analysis of mixed fermentations of Saccharomyces cerevisiae and Lachancea thermotolerans.The fermentations were carried out in carefully controlled environmental conditions in a bioreactor to reducetranscriptomic responses that would be due to factors other than the presence of the second species.
Results: The transcriptomic data revealed that both yeast species showed a clear response to the presence of theother. Affected genes primarily belonged to two groups: genes whose expression can be linked to the competition forcertain trace elements such as copper and iron, as well as genes required for cell wall structure and integrity. Furthermore,the data revealed divergent transcriptional responses with regard to carbon metabolism in response to anoxic conditions.
Conclusions: The results suggest that the mixed fermentation created a more competitive and stressful environment forthe two species than single strain fermentations independently from total biomass, i.e. competition between cells of thesame species is less stressful, or may present a different set of challenges, than interspecies competition. The changes incell wall and adhesion properties encoding genes suggest that the adjustment of physical contact between cells mayplay a direct role in the response to the presence of competing species.
Keywords: Transcriptome, RNA-seq, Wine fermentation, Yeast interactions, Lachancea thermotolerans, Saccharomycescerevisiae, Mixed-cultures, Anoxia
BackgroundDuring crushing of grapes, grape juice is exposed to airand becomes saturated with oxygen. Oxygen may alsobe discretely introduced into the wine fermentationprocess at various stages in amounts ranging from 2mgL− 1 to 6 mg L− 1 depending on the method employed[1, 2]. Most of the oxygen is rapidly consumed by yeastcells, and concomitant CO2 production has a negative im-pact on oxygen dissolution, creating an anaerobic environ-ment [1]. Several yeast species that constitute the wine
fermentation community including members of the generaSaccharomyces, Torulaspora, Hanseniaspora, Lachancea,Pichia, Candida and Starmerella are facultative anaerobesthat can grow and survive under these conditions. How-ever, most of the non-Saccharomyces yeasts have highoxygen demands and low fermentation capacity comparedto Saccharomyces species, particularly Saccharomycescerevisiae [3–5]. Consequently, such species are used inmixed cultures with S. cerevisiae to ensure complete con-version of grape sugars to ethanol, CO2 and other metabo-lites that constitute the wine fermentation bouquet. Thispractice has gained tremendous interest in the global wineindustry over the past decade, mainly due to improvedwine flavour and aroma complexity, as well as potential
* Correspondence: [email protected] for Wine Biotechnology, Department of Viticulture and Oenology,Stellenbosch University, Stellenbosch, Western Cape, South AfricaFull list of author information is available at the end of the article
© The Author(s). 2019 Open Access This article is distributed under the terms of the Creative Commons Attribution 4.0International License (http://creativecommons.org/licenses/by/4.0/), which permits unrestricted use, distribution, andreproduction in any medium, provided you give appropriate credit to the original author(s) and the source, provide a link tothe Creative Commons license, and indicate if changes were made. The Creative Commons Public Domain Dedication waiver(http://creativecommons.org/publicdomain/zero/1.0/) applies to the data made available in this article, unless otherwise stated.
Shekhawat et al. BMC Genomics (2019) 20:145 https://doi.org/10.1186/s12864-019-5511-x

reduction in ethanol levels, resulting from the underlyingyeast-yeast interactions [6–12]. Consequently, understan-ding the interaction between Saccharomyces and non--Saccharomyces yeasts has become a central focus ofecological and of wine-related research. The nature ofsome of the ecological interactions between two yeast spe-cies have been previously evaluated. The data show that inmixed fermentation of S. cerevisiae and non-Saccharo-myces yeasts, S. cerevisiae displays antagonistic interactiontowards non-Saccharomyces yeasts such as Torulasporadelbrueckii, Hanseniaspora guilliermondii, Lachanceathermotolerans and Kluyveromyces lactis [13–15]. Earlystudies revealed that presence of S. cerevisiae cells at ahigh concentration causes cellular death in T. delbrueckiiand L. thermotolerans [13]. These studies were subse-quently followed by pioneering work attributing this anta-gonism to direct cell-cell contact as well as the productionof antimicrobial peptides by S. cerevisiae [15, 16]. The datastrongly suggest the existence of specific physical and meta-bolic interactions between yeast species, but do not provideany insights about the molecular mechanism behind suchinteractions, and little is known about the molecular factorsinfluencing the response of any yeast species to the pres-ence of another species. Such studies are challenging be-cause of the complexity of multispecies systems and ofecological interactions. In particular, very few investi-gations have thus far been published reportinggenome-wide data sets for such interactions, and mostof these studies have primarily been reporting on theresponse of S. cerevisiae to the presence of another spe-cies. For instance, DNA microarray-based transcriptomeanalyses and mass spectrometry-based proteome analyseshave been used to study the interaction between yeast andbacteria as well as between S. cerevisiae and non-Saccha-romyces yeasts under oenological conditions [17–24]. Fur-thermore, these studies have usually relied on batchfermentation conditions. Such conditions make it difficultto differentiate the relative impact of the continuouschanges in media composition from the specific responseof one yeast species to the presence of the other.In the current study, we evaluated the transcriptomic
response of L. thermotolerans and S. cerevisiae in mixedfermentations when compared to single strain cultures inthe same environmental conditions. We selected L. thermo-tolerans as a non-Saccharomyces wine yeast as that yeasthas already been commercialised for use in mixed starterfermentations. Mixed culture fermentation with L. thermo-tolerans are known for leading to enhanced concentrationof higher alcohols (particularly 2-phenylethanol), L-lacticacid, glycerol and esters, while in some conditions alsoresulting in lower ethanol wines [10]. The genome of thisyeast has been sequenced and the genome sequence hasbeen partially annotated. As demonstrated in previous stud-ies [3, 5], oxygen enhances the growth and persistence of L.
thermotolerans in mixed starter fermentations. To bettercharacterise the molecular nature of the interactions, weused a controlled bioreactor system that allowed mainten-ance of two species in fermentation with continuousin-flow and out-flow of medium. The conditions were setto ensure that the total biomass of mixed and single speciesfermentations, and the environmental factors that stronglyimpact gene transcription in fermentative conditions suchas nutrient availability, oxygen, ethanol and hexose concen-trations, were maintained at similar levels in all fermenta-tions. These settings should restrict the transcriptomicresponse to factors linked to the presence of a secondspecies.
ResultsOptimisation of fermentation conditionsMultispecies interaction studies at the molecular, tran-scriptomic or proteomic level face significant challenges.Indeed, when such studies are carried out in standardbatch fermentation conditions, both species continuouslymodify gene expression to respond to the dynamic environ-ment. Furthermore, population evolution leads to conti-nuous change in the level of mutual exposure. In suchconditions, any specific transcriptional response of one spe-cies to the presence of the other species will be hiddenwithin a broader transcriptional response to changes in theenvironment. To overcome this problem, and to focus theinvestigation on the transcriptomic signature of theinteraction between species, a system with similarity toa chemostat was optimised. The specific growth rate ofS. cerevisiae and L. thermotolerans monocultures underanaerobic conditions, was found to be 0.2 h− 1 at a dilutionrate of 0.1 h− 1 and 0.17 h− 1 at a dilution rate of 0.075 h− 1,respectively, and similar cell concentrations were obtained(Table 1). In order to avoid a washout of L. thermotoleransin mixed fermentations, the cultures were co-inoculatedand cultivated in batch for 30 h, and then switched to con-tinuous mode at a dilution rate of 0.1 h− 1 for the anae-robic fermentation. In contrast, under aerobic conditions,the two yeasts displayed similar specific growth rates andreached comparable cell concentrations under the samedilution rate (Table 1). Consequently, the same dilutionrate could be applied in the mixed culture fermentations.The aim of this optimisation was to ensure similar popula-tion densities and similar growth medium composition inboth monocultures and mixed culture fermentations. Asillustrated in Fig. 1, under these optimised conditions, thespecies display similar growth rates in single and mixedfermentations, and after 48 h of continuous culture, thetotal number of cells, as well as the sugar concentrationswere similar in all the fermentations. The viable countsobtained from samples used for RNA extraction andexpression analysis, showed that the cell concentrations of
Shekhawat et al. BMC Genomics (2019) 20:145 Page 2 of 15

both species were ≈ 108 CFUmL− 1 in both mono- andmixed-cultures (Table 1).
Global analysis of the transcriptomeThe RNA-sequencing was performed for two biologicalreplicates of each fermentation. RNA extractions were per-formed on samples collected after the two species were incontact for 48 h and had maintained similar cell concentra-tions (Fig. 1). This was done to allow sufficient metabolicinteraction under conditions akin to a steady state. After fil-tering and trimming, RNAseq samples contained between11 and 15Mb total reads (Additional file 1: Table S1).These reads were mapped to the S288CplusLT chimericgenome which was generated after cross-mapping betweenS. cerevisiae and L. thermotolerans was found to be lessthan 1%. The data show that the mixed culture transcrip-tome had low coverage of L. thermotolerans. In particular,the oxygenated fermentation samples generated a total sumof ≈ 2Mb L. thermotolerans reads between the two bio-logical replicates, which is below the recommendedthreshold. Nevertheless, the data were considered useful forcertain analyses. One of the S. cerevisiae anaerobic mono-cultures (Sc.AN.2) appeared to be mixed and was thereforenot considered in subsequent analyses. Principal Compo-nent Analysis (PCA) performed on normalized TPM datashowed that the samples clustered together in a yeast andtreatment specific manner, with only minor variationsbetween the independent biological replicates (Fig. 2). L.thermotolerans displayed higher levels of transcriptomicchange under each condition compared to S. cerevisiae, asevident in the separation of the samples along PC2. Thestatistical analysis was done using Benjamini-Hochberg onall highly-expressed genes to control the FDR.
Overview of transcriptional response in mixedfermentationThe effect of mixing (MIX) on the gene transcription inS. cerevisiae and L. thermotolerans was assessed by
comparing the transcriptome of the mixed cultures tothe monocultures under both aerobic and anaerobicconditions (i.e Sc-Lt-AN and Sc-Lt-AR compared toSc-AN, Sc-AR, Lt-AN and Lt-AR). Genes uniquely dif-ferentially expressed in the mixed fermentations com-pared to monocultures were identified (Additional file 2:Table S2). The genes differentially expressed under an-aerobic conditions (AN) were determined by comparingthe anaerobic cultures to the aerobic cultures (i.eSc-Lt-AN, Sc-AN and Lt-AN compared to Sc-Lt-AR,Sc-AR and Lt-AR). Furthermore, common genes differ-entially expressed in both MIX and AN sets were con-sidered to be affected by the interaction (INT) betweenmixing and anoxia (Additional file 2: Table S2). For theinitial global analysis, the differentially expressedgenes (DEGs) were visualized by overlaying the dataon the Biocyc Omics dashboard. Overall, the inter-action between mixing and anoxia (INT) elicited a stron-ger response in L. thermotolerans than in S. cerevisiae(Fig. 3). In S. cerevisiae, only the degradation of secondarymetabolites as well as the biosynthesis of metabolic regu-lators were significantly up-regulated. These includedTSL1, TPS1, TPS2 and TPS3, involved in trehalose biosyn-thesis (Additional file 3: Table S3). Conversely, L. thermo-tolerans displayed an up-regulation of several biologicalprocesses most notably detoxification, cell death, adhesionas well as response to stimulus (Fig. 3). The highlyup-regulated detoxification and adhesion-related genes inL. thermotolerans included ALD2, ALD5, SOD1, SOD2,DLD1, CTT1, and HSP12, FLO9, NRG1, SDS3 andCCW12, respectively (Additional file 3: Table S3).
Response to anoxia in mixed fermentationsThe anaerobic and aerobic mixed cultures (Sc-Lt-AN vsSc-Lt-AR) were compared to assess the transcriptionalresponse of S. cerevisiae and L. thermotolerans to anoxiain a mixed fermentation setting. Considering DEGs withlog2FC ≥ 1.5 or ≤ − 1.5, only 8 genes were up-regulatedgenes and 22 down-regulated genes were common
Table 1 A summary of the dilutions rates applied to maintain similar cell concentrations, as well as the chemical fermentationparameters at the time of sampling for transcriptome analysis
Fermentations Dilution rateh− 1
CFUmL− 1 at48 h
Sugar concentration at 48 h(g L− 1)
Glycerol concentration at 48 h(g L− 1)
μMax at exponential phase(h− 1)
L. thermotolerans-AN
0.075 2.1E+ 08 68.0 2.92 0.17
S. cerevisiae-AN 0.10 1.2E+ 08 62.5 2.40 0.20
Mixed-AN 0.10 Sc- 1.1E+ 08Lt- 8.6E+ 07
59.6 3.14
S. cerevisiae-AR 0.125 1.0E+ 08 60.0 1.09 0.23
L. thermotolerans-AR
0.125 2.5E+ 08 58.0 1.34 0.24
Mixed-AR 0.125 Sc- 1.1E+ 08Lt- 2.3E+ 08
62.0 1.12
Shekhawat et al. BMC Genomics (2019) 20:145 Page 3 of 15

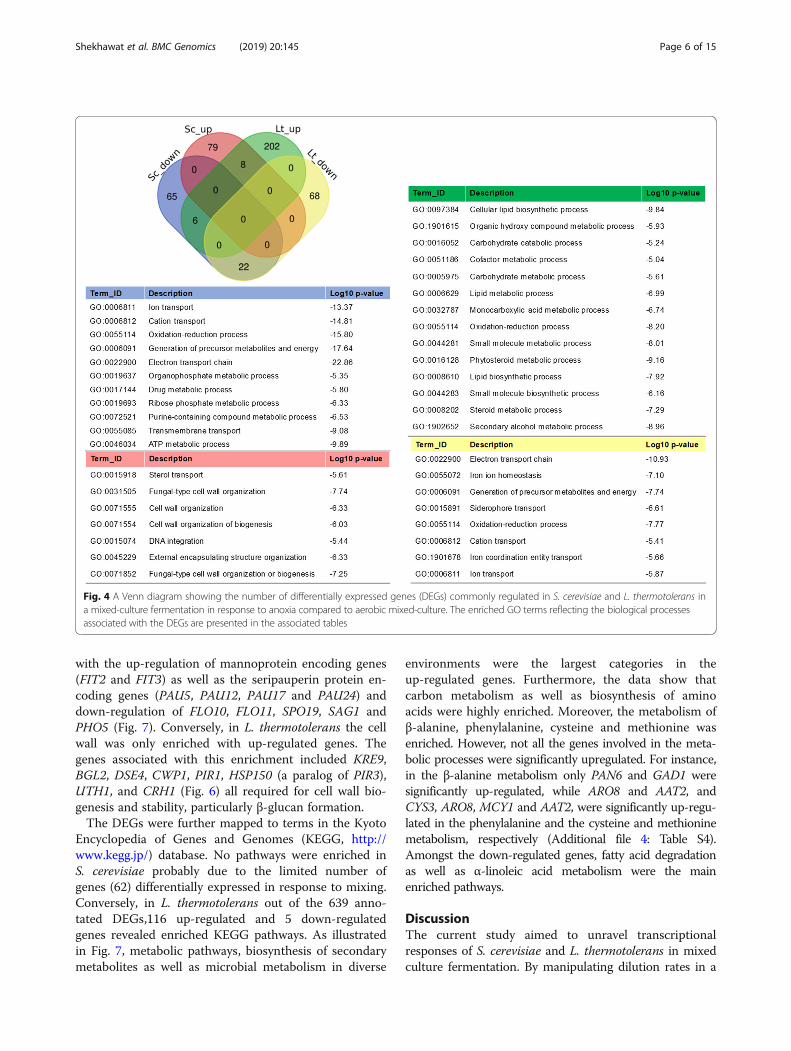
between S. cerevisiae and L. thermotolerans (Fig. 4).Gene ontology (GO) enrichment showed that cationtransport, electron transport chain, generation of precur-sor metabolites and energy, were some of the highlydown-regulated biological processes in both yeasts. Bycontrast, biological processes enriched in up-regulatedgenes were distinct between the two yeasts. For in-stance, in S. cerevisiae, sterol transport, cell wallorganization and associated processes were enrichedwhile in L. thermotolerans oxidation-reduction process,carbohydrate catabolism as well as cellular lipid biosyn-thetic processes were enriched (Fig. 4).
Response to mixing under anaerobic conditionsSince the mixed aerobic fermentation samples contained alow percentage of L. thermotolerans reads and transcripts,which reduced the power to detect differentially expressedgenes, we only considered the mixed culture fermenta-tions under anaerobic conditions for further analyses. Thetranscriptional response of the two yeasts to mixing was
analysed by comparing the mixed culture transcriptometo the monocultures in these conditions (i.e. Sc-Lt-AN vsSc-AN and Lt-AN). The data revealed that only 62 geneswere differentially expressed (31 up-regulated and 31down-regulated) in S. cerevisiae in response to the pres-ence of L. thermotolerans. In contrast, in L. thermotolerans687 genes were differentially expressed, amongst them639 (408 up-regulated and 231 down-regulated) whichcould be annotated to S. cerevisiae homologs. The DEGswere independently analysed for enriched GO terms atthe three hierarchical categories (biological process, mo-lecular function and cellular component). Up-regulatedgenes in S. cerevisiae were mainly associated with copperand iron ion import, as well as iron ion homeostasis, whilethe down-regulated genes were associated with cell aggre-gation and flocculation (Table 2). The genes significantlyup-regulated in the copper and iron homeostasis wereFRE1 and FRE7 which encode ferric reductases, CTR1 andCTR3 encoding high affinity copper transporters, as wellas ENB1 and FIT2 that encode an endosomal ferric
Fig. 1 Fermentation kinetics and population dynamics of S. cerevisiae and L. thermotolerans in single and mixed fermentation under anaerobic(left panel) and aerobic (right panel) fermentation conditions. The red line indicates the start of continuous culture, the arrows indicate thesampling point
Shekhawat et al. BMC Genomics (2019) 20:145 Page 4 of 15

enterobactin transporter and a mannoprotein, respect-ively. In contrast, FLO10, FLO11 and SAG1 required forpseudohyphal and invasive growth, as well as flocculationand agglutination, respectively, were down-regulated(Fig. 5). In L. thermotolerans, biological processes associ-ated with filamentous growth in response to starvationwere enriched with up-regulated genes, while processesassociated with iron assimilation, iron ion homeostasis aswell as siderophore transport were enriched with down-regulated genes (Table 3). The data show that transcrip-tional factors and repressors (e.g. MIG1, MIG2, OPY2)
that are likely involved in the regulation of filamentousgrowth were up-regulated, while FTR1, FRE3, FET3 andARN1 encoding a high affinity iron permease, ferric reduc-tase, ferro-O2-oxidoreductase, as well as ARN familytransporter for siderophore-iron chelates, respectively,were down-regulated (Fig. 5).Within the category of Cellular component, GO en-
richment revealed that the extracellular region and thecell wall were the most enriched cellular component GOterms in S. cerevisiae with both up- and down-regulatedgenes (Table 2). The enrichment is mainly associated
Fig. 2 Principal Component Analysis (PCA) plot of the biological replicates of transcripts from Lachancea thermotolerans (Lt) and Saccharomycescerevisiae (Sc) monocultures and mixed cultures (Lt.MIX and Sc.MIX) under aerobic (AR) and anaerobic (AN) conditions
-1
-0,5
0
0,5
1
1,5
2
2,5
PP
P
Oth
er
Sec
Met
abol
ites
Alc
ohol
s
Am
ines
Met
ab R
eg
De
toxi
ficat
ion
Ce
ll D
eat
h
Adh
esio
n
Co
ld
Sig
nalin
g
Energy Metabolism Degradation Biosynthesis OtherPathways
Cellular Processes StimulusResponse
Regulation
go
L egarev
A2F
C
Sc-mix Sc-Int Lt-mix Lt-int
Fig. 3 Overall comparison of transcriptional response of Saccharomyces cerevisiae (Sc) and Lachancea thermotolerans (Lt) to mixed-cultureenvironment (Sc-mix and Lt-mix), and to the combined effect of mixing and anoxia (Sc-int and Lt-int)
Shekhawat et al. BMC Genomics (2019) 20:145 Page 5 of 15
with the up-regulation of mannoprotein encoding genes(FIT2 and FIT3) as well as the seripauperin protein en-coding genes (PAU5, PAU12, PAU17 and PAU24) anddown-regulation of FLO10, FLO11, SPO19, SAG1 andPHO5 (Fig. 7). Conversely, in L. thermotolerans the cellwall was only enriched with up-regulated genes. Thegenes associated with this enrichment included KRE9,BGL2, DSE4, CWP1, PIR1, HSP150 (a paralog of PIR3),UTH1, and CRH1 (Fig. 6) all required for cell wall bio-genesis and stability, particularly β-glucan formation.The DEGs were further mapped to terms in the Kyoto
Encyclopedia of Genes and Genomes (KEGG, http://www.kegg.jp/) database. No pathways were enriched inS. cerevisiae probably due to the limited number ofgenes (62) differentially expressed in response to mixing.Conversely, in L. thermotolerans out of the 639 anno-tated DEGs,116 up-regulated and 5 down-regulatedgenes revealed enriched KEGG pathways. As illustratedin Fig. 7, metabolic pathways, biosynthesis of secondarymetabolites as well as microbial metabolism in diverse
environments were the largest categories in theup-regulated genes. Furthermore, the data show thatcarbon metabolism as well as biosynthesis of aminoacids were highly enriched. Moreover, the metabolism ofβ-alanine, phenylalanine, cysteine and methionine wasenriched. However, not all the genes involved in the meta-bolic processes were significantly upregulated. For instance,in the β-alanine metabolism only PAN6 and GAD1 weresignificantly up-regulated, while ARO8 and AAT2, andCYS3, ARO8, MCY1 and AAT2, were significantly up-regu-lated in the phenylalanine and the cysteine and methioninemetabolism, respectively (Additional file 4: Table S4).Amongst the down-regulated genes, fatty acid degradationas well as α-linoleic acid metabolism were the mainenriched pathways.
DiscussionThe current study aimed to unravel transcriptionalresponses of S. cerevisiae and L. thermotolerans in mixedculture fermentation. By manipulating dilution rates in a
Fig. 4 A Venn diagram showing the number of differentially expressed genes (DEGs) commonly regulated in S. cerevisiae and L. thermotolerans ina mixed-culture fermentation in response to anoxia compared to aerobic mixed-culture. The enriched GO terms reflecting the biological processesassociated with the DEGs are presented in the associated tables
Shekhawat et al. BMC Genomics (2019) 20:145 Page 6 of 15

continuous culture, the two yeasts were maintained atapproximately equal concentrations for 24 h. L. ther-motolerans transcripts accounted for 24% of the se-quences reads in anaerobic mixed cultures and ≈ 8% inaerobic mixed cultures. However, there was sufficientdepth in the anaerobic mixed fermentation transcriptometo extract key genes that are influenced by mixing andinteraction between S. cerevisiae and L. thermotolerans.
Related studies have employed strategies, which onlyallowed for analysis of early transcriptional responses tomixed culture or analyses of S. cerevisiae transcriptionalresponse only. For instance, Tronchoni et al. [25] firstpre-cultured S. cerevisiae and the T. delbrueckii in separ-ate bioreactors and then mixed the two at equal volumes,followed by withdrawal of samples for RNAseq before thecells started proliferating and in the early exponential
Table 2 Enriched GO terms (Biological Processes (BP), Biological Function (BF) and Cellular component (CC)) in Saccharomycescerevisiae in anaerobic mixed fermentations
Expression Category GO Terms FDR q-value Description
Up regulated BP GO:0015677 1.70E-04 Copper ion import
GO:0000041 9.06E-04 Transition metal ion transport
GO:0006825 8.15E-04 Copper ion transport
GO:0030001 8.85E-03 Metal ion transport
GO:0006826 2.82E-02 Iron ion transport
GO:0055072 3.28E-02 Iron ion homeostasis
GO:0055076 1.26E-01 Transition metal ion homeostasis
GO:0035434 1.50E-01 Copper ion transmembrane transport
GO:0055065 2.84E-01 Metal ion homeostasis
GO:0015688 3.12E-01 Iron chelate transport
GO:0015891 2.83E-01 Siderophore transport
GO:0071555 3.78E-01 Cell wall organization
GO:0045229 3.49E-01 External encapsulating structure organization
BF GO:0005199 1.70E-02 Structural constituent of cell wall
GO:0005375 1.36E-01 Copper ion transmembrane transporter activity
GO:0052851 1.90E-01 Ferric-chelate reductase (NADPH) activity
GO:0000293 1.89E-01 Ferric-chelate reductase activity
GO:0016723 1.51E-01 Oxidoreductase activity, oxidizing metal ions, NAD or NADP as acceptor
GO:0016811 2.35E-01 Hydrolase activity, acting on carbon-nitrogen (but not peptide) bonds, in linear amides
GO:0016722 3.47E-01 Oxidoreductase activity, oxidizing metal ions
CC GO:0009277 4.84E-02 Fungal-type cell wall
GO:0030312 3.04E-02 External encapsulating structure
GO:0005618 2.30E-02 Cell wall
Down-regulated BP GO:0098743 8.92E-03 Cell aggregation
GO:0098630 4.46E-03 Aggregation of unicellular organisms
GO:0051704 6.15E-03 Multi-organism process
GO:0098609 8.21E-02 Cell-cell adhesion
GO:0000128 9.84E-06 Flocculation
BF GO.0035673 1.56E-01 Oligopeptide transmembrane transporter activity
GO:1904680 1.00E+ 00 Peptide transmembrane transporter activity
CC GO:0005576 2.42E-04 Extracellular region
GO:0030312 7.10E-03 External encapsulating structure
GO:0005618 4.74E-03 Cell wall
GO:0031225 6.22E-03 Anchored component of membrane
GO:0000322 1.08E-02 Storage vacuole
GO:0000324 8.99E-03 Fungal-type vacuole
Shekhawat et al. BMC Genomics (2019) 20:145 Page 7 of 15

phase to avoid over-representation of only one species. Incontrast, Barbosa et al. [17] conducted mixed-culture fer-mentations of S. cerevisiae with Hanseniaspora guillier-mondii in a typical wine fermentation batch set-up,extracted RNA at different fermentation stages and onlyfocused on the transcriptional response of S. cerevisiae.The specific conditions also aimed at maintaining rela-tively stable environmental conditions and cell densitiesduring the co-culture of the two species by using a set-upsimilar to a continuous fermentation. This strategy wasintended to limit the transcriptomic signature to theinteraction-relevant responses by reducing genetic re-sponses that would be due to the continuous dynamicadaptation to changing conditions that are prevalent inbatch cultures [17, 25]. The relatively limited number of S.cerevisiae genes that are significantly affected by the mixedculture conditions in our study when compared to othersuch data sets suggests that this strategy has succeeded,and that the highlighted genes are indeed the core of aperpetual interaction response.
Overall response to the interaction between mixing andanoxiaThe transcriptomic data revealed divergent responses ofthe two yeasts to the interaction between mixing and an-oxia. These conditions elicited a stronger response in L.thermotolerans. Indeed, on average L. thermotoleransdisplayed a marked up-regulation of genes associatedwith cell aggregation, cell death and response to osmoticstress. Furthermore, several genes encoding catalase,
superoxide dismutases, and peroxidases were signifi-cantly up-regulated, suggesting that L. thermotoleranscells are experiencing some level of oxidative stress. Thisis not surprising since other studies have demonstratedthat hypoxia and anoxia induce transient oxidative stressin other yeasts such as S. cerevisiae and Kluyveromyceslactis [26]. Our data also suggest that L. thermotoleransredirects its metabolic flux from glycolysis to the PPPsimilar to K. lactis and Pichia pastoris [26, 27].Under anoxic conditions, mitochondrial and cyto-
chrome c activities were down-regulated in both yeasts.However, differences were observed in the up-regulated pro-cesses, where seemingly S. cerevisiae increased its steroluptake while L. thermotolerans increased the expression ofgenes required for ergosterol biosynthesis including thoseencoding enzymes that catalyse oxygen-dependent reactionse.g. ERG3, ERG11 and ERG25. This induction of oxygen-dependent genes has been observed in other yeasts in-cluding S. cerevisiae and P. pastoris albeit transiently,and has been attributed to cells adjusting to anaerobicconditions following cultivations in oxygenatedenvironments [27].
Transcriptional responses to mixed culture fermentation –Iron and copper acquisitionIn the current study, it was evident that in mixed-culturefermentation, S. cerevisiae increased the expression of ironand copper acquisition systems. Indeed, the data showthat FRE1, FRE7, ENB1, FIT2, CTR1 and CTR3 were sig-nificantly upregulated. Fre1p, Enb1p and Fit2p form a
Fig. 5 Differentially expressed genes involved in enriched biological processes in S. cerevisiae and L. thermotolerans in response to mixing underanaerobic conditions compared to aerobic conditions
Shekhawat et al. BMC Genomics (2019) 20:145 Page 8 of 15

cluster of proteins required for the uptake of siderophores.Fre1p has broad substrate specificity and can catalyse thereduction of iron-sidephore chelates such as ferrichrome,ferrioxamine B and enterobactin. Enb1p exclusively recog-nizes and transports enterobactin, while Fit2p contributesto the retention of siderophore-iron chelates in the cell
wall [28]. Regarding copper uptake, Ctr1p and Ctr3p to-gether with Fre1p and Fre7p are important in high affinityuptake of copper ions. Their expression is a cellular re-sponse to inadequate intracellular copper levels [29]. Con-versely, L. thermotolerans shown a down-regulation ofgenes encoding nonreductive (copper independent)
Table 3 Enriched GO terms (Biological Processes (BP), Biological Function (BF) and Cellular component (CC)) in Lachanceathermotolerans under anaerobic mixed fermentations
Expression Category GO Terms FDR q-value Description
Up regulated BP GO:0005975 9.65E-03 Carbohydrate metabolic process
GO:0044281 8.15E-03 Small molecule metabolic process
GO:0035434 4.67E-02 Copper ion transmembrane transport
GO:0044282 4.19E02 Small molecule catabolic process
GO:0043436 4.79E02 Oxoacid metabolic process
GO:0006082 4.34E-02 Organic acid metabolic process
GO:1900434 3.91E-02 Regulation of filamentous growth of a population of unicellular organismsin response to starvation
GO:0019752 3.79E-02 Carboxylic acid metabolic process
BF GO:0001078 1.96E-03 Transcriptional repressor activity, RNA polymerase II proximal promotersequence-specific DNA binding
GO:0001227 1.47E-03 Transcriptional repressor activity, RNA polymerase II transcription regulatoryregion sequence-specific DNA binding
GO:0000982 5.40E-02 Transcription factor activity, RNA polymerase II proximal promotersequence-specific DNA binding
CC GO:0005576 1.39E-03 Extracellular region
GO:0005618 6.98E-02 Cell wall
Down-regulated BP GO:0055072 2.97E-05 Iron ion homeostasis
GO:0055076 4.61E-04 Transition metal ion homeostasis
GO:0006879 6.37E-04 Cellular iron ion homeostasis
GO:0048878 1.03E-03 Chemical homeostasis
GO:0055065 1.98E-03 Metal ion homeostasis
GO:0015688 2.89E-03 Iron chelate transport
GO:0015891 2.48E-03 Siderophore transport
GO:0046916 5.32E-03 Cellular transition metal ion homeostasis
GO:0051321 5.84E-03 Meiotic cell cycle
GO:0042592 7.78E-03 Homeostatic process
GO:1901678 8.35E-03 Iron coordination entity transport
GO:0098771 8.65E-03 Inorganic ion homeostasis
GO:0055080 1.04E-02 Cation homeostasis
GO:0006826 1.09E-02 Iron ion transport
GO:0050801 1.97E-02 Ion homeostasis
BF GO:0016491 5.40E-01 Oxidoreductase activity
GO:0016722 4.45E-01 Oxidoreductase activity, oxidizing metal ions
GO:0050662 6.57E-01 Coenzyme binding
CC GO:1990351 2.83E-01 Transporter complex
GO:0097249 1.66E-01 Mitochondrial respiratory chain supercomplex
GO:0033573 2.19E-01 High-affinity iron permease complex
GO:19–05862 1.64E-01 Ferroxidase complex
Shekhawat et al. BMC Genomics (2019) 20:145 Page 9 of 15

siderophore-iron transport (ARN1, FIT2, FIT3), as well asthose required for reductive iron uptake (FRE3) andcopper-dependent iron import (FTR1 and FET3). Fet3p ismulticopper oxidase that also exhibit ferrous oxidaseactivity and forms a high-affinity iron transport complexwith Ftr1p as well as Fet5p and Fth1p [30], which werenot differentially expressed in the current study.Hodgins-Davis et al. [31] showed that FTR1 and FET3were uniformly downregulated under copper deprivation
in different S. cerevisiae strains. Since high-affinity copperand iron acquisition systems are homeostatically regu-lated, we can infer from the current data that both yeastsexperience the growth conditions to be limited in bioavail-able iron and copper, and therefore activate different sys-tems to allow them to thrive in such environments. In S.cerevisiae, high expression of CTR1 gene is reported to beinduced when copper levels are below 10 μM [30], whilehigh concentrations of copper result in down-regulation
Fig. 6 DEGs associated with the enrichment of the cellular component GO terms: cell wall and cell exterior
Fig. 7 KEGG pathways enriched in L. thermotolerans in mixed culture fermentation under anaerobic conditions compared to aerobic conditions
Shekhawat et al. BMC Genomics (2019) 20:145 Page 10 of 15

of both CTR1 and CTR3 [29]. The synthetic grape juicemedium used in the current study contains 0.11 μM cop-per. Copper is required for iron homeostasis in yeast andthe link between copper and iron metabolism in S. cerevi-siae is well recognized [29]. Evidently, in mixed-culture fer-mentation, S. cerevisiae competes with L. thermotolerans byactivating a full set of genes to acquire different forms ofiron from the environment and to store it in the cells inbound-form (e.g. ferrichrome).
Transcriptional responses to mixed culture fermentation –Cell wall integrity and adhesionOur data show a strong response to cell wall integrity inboth yeasts in mixed fermentation when compared tosingle species fermentation. Indeed, both yeast speciesup-regulate genes that are involved in cell wall integrityunder stress conditions although different genes andprocesses are induced. Indeed, under anaerobic mecha-nisms in mixed fermentations. In particular, S. cerevisiaeshows a significant up-regulation of 5 PAU genes (PAU5,PAU9, PAU12, PAU17, PAU24). These genes have beenreported to play an important role in promoting fitnessunder anaerobic and fermentative condition as well as ininteractions between natural strains of S. cerevisiae [32, 33].In particular, PAU5 was shown to play a key role in compe-tition by providing protection against killer toxins [33]. Theabundance of the PAU genes in the S. cerevisiae transcrip-tome in the presence of L. thermotolerans could there-fore suggest that they also play a role in interactionswith other yeast species which are phylogeneticallyclosely related to S. cerevisiae. Indeed, in another study,Tronchoni et al. [25] reported an induction of 20 of the24 PAU genes in the primary response of S. cerevisiaeto Torulaspora delbrueckii. Our data suggest that thesegenes are indeed specifically associated with yeast-yeastinteractions. Interestingly, in the mixed fermentationunder anaerobic conditions, L. thermotolerans increasesthe expression of endoglucanases (e.g. BGL2), whilesimultaneously reinforcing and stabilizing its cell wall,as evident in the up-regulation of genes involved in thebiogenesis, assembly and maintenance of glucan andchitin. The overexpression of BGL2 in S. cerevisiae hasbeen shown to retard growth, which could suggest thatL. thermotolerans compensates for this possible impactby strengthening the cell wall. In contrast, S. cerevisiaeprotects itself through the upregulation of PAU genes,which are amongst the genes that encode cell wall pro-teins thought to be important in cell wall remodelling andmaintenance of cell wall integrity during stress [32]. In thecurrent study, the recovery of L. thermotolerans reads inmixed culture fermentations was consitently lower thanthose of S. cerevisiae (Additional file 1: Table S1). We maydeduce from our data that this alludes to poor RNAextraction which could partly be due to cell wall thickness
and rigidity, that rendered the L. thermotolerans cells lesssensitive to mechanical disruption. However, this willrequire further evaluation.
Transcriptional responses to mixed culture fermentation –Amino acid metabolismOur data suggest that in mixed culture fermentationunder anaerobic conditions, L. thermotolerans specific-ally increases the expression of genes involved in themetabolism of four amino acids viz. cysteine, methio-nine, phenylalanine and β-alanine. The up-regulation ofcystein and methionine-related metabolic activities maysuggest that sulphur-related processes are directlyaffected by co-culture conditions. Furthermore, all genesinvolved in the conversion of phenylalanine to pheny-lethanol were up-regulated. These data support our pre-vious findings which showed that L. thermotoleransproduces high levels of phenylethanol in monoculture,and to enhance phenylethanol production in mixed fer-mentations with S. cerevisiae [5]. This trait seems com-mon in various L. thermotolerans since other studieshave reported increased levels of phenylethanol incombinations of different strains of L. thermotoleransand S. cerevisiae [10, 11].
ConclusionsOverall, our study reveals divergent molecular signa-tures underlying the performance of S. cerevisiae andL. thermotolerans in mixed culture fermentation. Thedata shows that S. cerevisiae is better able to deal withthe fermentation environment possibly due to its effi-cient competitive uptake of sterols, copper and iron,accompanied by cell wall remodelling to accommodateadditional mannoproteins and PAU proteins. Thesestrategies allow the yeast to regulate membrane fluidityand cell wall porosity, and withstand an anaerobic, highethanol environment. Conversely, the fermentation en-vironment seems highly toxic to L. thermotolerans,which mainly features a molecular signature that ischaracterized by detoxification, cell aggregation andcell death associated genes. The strong cell wall-relatedresponses in both species suggest the importance ofthis organelle in the cellular response to other species.In particular, the data support that the regulation ofadhesion properties may play a central role in modu-lating the physical and ecological interactions betweenspecies [16].The data are also a confirmation of many studies that
have reported a rapid decline of L. thermotolerans inwine fermentation especially in mixed cultures with S.cerevisiae. The study also underlines the usefulness of aglobal approach to the study of yeast-yeast interactionsto shed light on the molecular basis of yeast dynamicsduring wine fermentation. Besides a general contribution
Shekhawat et al. BMC Genomics (2019) 20:145 Page 11 of 15

to a better understanding of yeast ecological interactions,the data will be useful for the rational development ofmixed-starter cultures in the winemaking industry.
MethodsYeast strains and mediaS. cerevisiae (Cross evolution-285) was obtained fromLallemand SAS (Blagnac, France), while L. thermotolerans(IWBT-Y1240) was obtained from the culture collectionof the Institute for Wine Biotechnology (Stellenbosch Uni-versity). Yeast strains were maintained cryogenically (− 80°C) and were reactivated by streaking out on YPD agarplates containing (per litre) 10 g yeast extract, 20 g pep-tone and 20 g glucose and 20 g bacteriological agar. Cul-tures were stored at 4 °C for short-term use.
Batch fermentationBatch fermentations were performed in synthetic grapejuice medium containing (per litre) 100 g glucose, 100 gfructose (Merck), 1 g yeast extract (Oxoid), 0.3 g citricacid, 5 g L-malic acid, 5 g L-tartaric acid, 0.4 g MgSO4, 5 gKH2PO4, 0.2 g NaCl, 0.05 g MnSO4 (Sigma-Aldrich) andanaerobic factors (ergosterol 10mg (Sigma-Aldrich),tween 80 0.5mL (Merck)) [34, 35]. Fermentations wereconducted in 1.3 L BioFlo 110 bench top bioreactors (NewBrunswick, NJ, USA) using 900mL of final workingvolume, a temperature of 25 °C and an agitation speed of200 rpm. Fermentations were performed under twoconditions: anaerobic and aerobic at 5% (0.41 mg L− 1)dissolved oxygen (DO). The anaerobic conditions werecreated by initially sparging N2 to bring down the DOlevel to 0%, and then to minimize diffusion of atmos-pheric oxygen into the cultures, the entire fermentationset-up was equipped with Norprene tubing. The 5% DOlevel was maintained through the supplementaryaddition of 4 gasses (CO2, N2, O2 and compressed air)whenever required, using an automated gas flow con-troller. The DO levels in the cultures were monitoredwith an oxygen electrode.
Fermentation conditionsIn order to maintain similar environmental conditions inmixed and single-culture fermentations, a system similarto continuous fermentation using continuous in-flowand out-flow of the medium was optimised for singleand mixed fermentations. Samples for RNAseq analysiswere withdrawn at 48 h when total viable cell count wassimilar between the mixed and single culture fermenta-tion. The feeding medium contained glucose and fructose,each at 50 g L− 1. The working volume was maintained at0.7 L using a peristaltic effluent pump. All fermentationswere conducted in duplicate.
Analysis of population dynamicsSerial dilutions of the cell suspensions were performedwith 0.9% (w/v) NaCl. One hundred microliter sampleswere spread on YPD agar and incubated at 30 °C for 2–3 days. For yeast enumeration in mixed culture fermen-tations, both species were distinguished based on colonymorphology. Colony counts were performed on plateswith 30–300 colonies.
Analytical methodsSupernatants were obtained by centrifuging cell suspen-sions at 5000×g for 5 min. The concentrations of fruc-tose, glucose, acetaldehyde and acetic acid weremeasured using specific enzymatic kits, Enytec™ FluidD-fructose, glucose, acetic acid (Thermo Fisher ScientificOy, Finland), Boehringer Mannheim / R-Biopharm-acet-aldehyde (R-Biopharm AG, Darmstadt) and analyzedusing Arena 20XT photometric analyzer (Thermo Elec-tron Oy, Helsinki, Finland). Ethanol was analysed byhigh performance liquid chromatography (HPLC) on anAMINEX HPX-87H ion exchange column using 5 mMH2SO4 (Sigma-Aldrich) as the mobile phase as describedby Rossouw et al. [24]. The major volatiles were ex-tracted with diethyl ether and analysed by Gas Chroma-tography with Flame Ionization Detection (GC-FID) asdescribed in previously [36].
Sampling, RNA-extraction and RNA-sequencingCell samples for RNA-sequencing were obtained fromboth single and mixed culture fermentations (anaerobicand aerobic, respectively) at 48 h when population andsugar levels were approximately same in all fermenta-tions. Total RNA extractions were performed accordingto the hot phenol method [37]. Concentration and purityof RNA were determined by spectrophotometry and in-tegrity was confirmed using an Agilent 2100 Bioanalyzerwith an RNA 6000 Nano Assay (Agilent Technologies,Palo Alto, CA, USA). The RNA samples with RNA integ-rity number (RIN) more than 8, and 280:260 ratios morethan 2 were further used for the RNA-sequencing pur-pose. Library preparation and sequencing was performedby VIB Nucleomics core (KU, Leuven (Belgium). Comple-mentary DNA (cDNA) library was generated using Tru-Seq® Library Prep Kit v2. Paired-end reads weresequenced on the Illumina NextSeq platform.
RNAseq data processingLow quality reads (< Q20), polyA-reads as well as am-biguous reads (containing N) were removed using FastX0.0.13 [38]. Furthermore, reads shorter than 35 bp wereremoved with ShortRead 1.16.3 [39] and adapters on theremaining reads were trimmed with cutadapt 1.7.1 [40].
Shekhawat et al. BMC Genomics (2019) 20:145 Page 12 of 15

RNAseq data analysisAnnotation of genomic features was performed usingthe reference genomes of S. cerevisiae S288c and L. ther-motolerans CBS6340. In the case of L. thermotoleransunknown genes were identified by the homology withthe S. cerevisiae S288c genome. Reads from L. thermoto-lerans and S. cerevisiae monoculture fermentation sam-ples were aligned to the reference genomes of the twoyeasts with TopHat v2.0.13 [41]; and reads that werenon-primary mapping or had a mapping quality ≤20,were removed. Subsequently, cross-mapping between S.cerevisiae S288c and L. thermotolerans was evaluated todetermine the impact of merging the genomes. Cross-mapping between the two yeasts was found to be lessthan 1%; consequently, pre-processed reads of all fer-mentations were aligned to the reference genome ofS288cplusLT. The obtained bam files were further con-verted in to gff files to analyse the data further. Thenumber of reads in the alignments that overlap withgene features were counted using htseq-count 0.6.1p1[42]. Genes for which all samples had less than 1count-per-million were removed and full quantilenormalization using the EDASeq package from Biocon-ductor was applied to correct for sample-specific va-riation typically introduced by differences in library sizeand RNA composition. Transcript abundance was mea-sured in Fragments Per Kilobase of exon per Millionmapped reads (FPKM).
Identification and statistical analysis of differentiallyexpressed genesFor the selection of differentially expressed genes statisticalmodelling was used to design the following experiments:
log Countð Þ ¼ β1þMIX � β2þ AN � β3þ INT� β4
For each gene the coefficients β were estimated withthe edgeR 3.8.6 package of Bioconductor [43], by fittinga negative binomial generalized linear model (GLM)[44]. Offsets were used to estimate the models. Subse-quently, the model estimates were used to compute con-trasts of primary interest which were (i) MIX vs PURE(MIX effect) (ii) AN vs AR (AN effect), (iii) the inter-action between MIX and AN effect (INT), (iv) MIX vsPURE, only in AR samples, (v) MIX vs PURE, only inAN samples and (vi) AN vs AR, only in MIX samples.The differential expression was tested with a GLM likeli-hood ratio test, also implemented in the edgeR 3.8.6package. The resulting p-values were corrected for mul-tiple testing with Benjamini-Hochberg to control thefalse discovery rate (FDR) [45]. Genes with an absolutelog2-ratio larger than 1 and an adjusted p-value < 0.05were considered differentially expressed.
Additional files
Additional file 1: Table S1. The table provides details of number ofreads per sample sequenced and after number of reads used to analyse thedata after removing bad sequences and reads less than 35 bp (DOCX 27 kb)
Additional file 2: Table S2. A list of genes differentially expressed inSaccharomyces cerevisiae and Lachancea thermotolerans in mixedfermentations compared to monocultures. (XLSX 1539 kb)
Additional file 3: Table S3. A summary of genes differentiallyexpressed in different metabolic processes in Saccharomyces cerevisiaeand Lachancea thermotolerans due to mixing and the interactionbetween mixing and anoxia (DOCX 49 kb)
Additional file 4: Table S4. Up-regulated genes involved in the metab-olism of cysteine, methionine, phenylalanine and β-alanine in Lachanceathermotolerans (DOCX 28 kb)
AbbreviationsADP: Adenosine di-phosphate; AN: Anaerobic; AR: Aerobic; ATP: Adenosinetri-phosphate; BF: Biological function; BP: Biological processes; CC: Cellularcomponent; cDNA: Complementary DNA; CFU: Colony forming units;DEG: Differentially expressed genes; DNA: Deoxyribonucleic acid;DO: Dissolved oxygen; FC: Fold change; FDR: False discovery rate;FPKM: Fragments per kilobase of exon per million mapped reads; GC-FID: Gas chromatography with flame ionization detection; GEO: Geneexpression omnibus; GLM: Generalized linear model; GO: Gene ontology;HPLC: High performance liquid chromatography; IWBT: Institute for winebiotechnology; KEGG: Kyoto encyclopedia of genes and genomes;Lt: Lachancea thermotolerans; Mb: Million base; NADP: Nicotinamide adeninedinucleotide phosphate; NCBI: National Centre for BiotechnologyInformation; NRF: National Research Foundation; PCA: Principal componentanalysis; RIN: RNA integrity number; RNA: Ribonucleic acid; Sc: Saccharomycescerevisiae; TPM: Transcripts per million; YPD: Yeast potato dextrose
AcknowledgmentsWe would like to thank Arrie Arends, a Senior technical officer inDepartment of Biochemistry for helping with Bioreactors; VIB Nucleomicscore in Leuven, Belgium for performing RNA-sequencing, analysing data andtheir support and assistance at several points; International office, Stellen-bosch University, for providing the travel grant to Kirti Shekhawat for a visitto VIB Genomics.
FundingThis research for the present study was funded by the National ResearchFoundation (NRF) Grant Unique Number 83471 and the National ResearchFoundation-Technology and Human Resources for Industry Programme(grant TP14070874355). The opinions expressed and conclusions arrived at,are those of the authors and are not necessarily to be attributed to the fund-ing agencies.
Availability of data and materialsThe data set supporting the results of this article is included within thearticle and its additional files. The raw data from the RNAseq samples weresubmitted to the National Centre for Biotechnology Information (NCBI) GeneExpression Omnibus (GEO) database, under project GSE112581, accessionnumbers GSM3073202 - GSM3073211. The data are publicly available andaccessible at https://www.ncbi.nlm.nih.gov/geo/query/acc.cgi?acc=GSE112581
Authors’ contributionsKS, FFB and MES conceptualized and designed the experiments, KSperformed all the experiments, analysed data and wrote the draftmanuscript; FFB and MES supervised the project and edited the manuscript.HP provided bioinformatics support and guidance. All authors have read andapproved the manuscript.
Ethics approval and consent to participateNot Applicable.
Shekhawat et al. BMC Genomics (2019) 20:145 Page 13 of 15

Consent for publicationNot Applicable.
Competing interestsThe authors declare that they have no competing interests.
Publisher’s NoteSpringer Nature remains neutral with regard to jurisdictional claims inpublished maps and institutional affiliations.
Author details1Institute for Wine Biotechnology, Department of Viticulture and Oenology,Stellenbosch University, Stellenbosch, Western Cape, South Africa. 2Centre forBioinformatics and Computational Biology, Stellenbosch University,Stellenbosch, Western Cape, South Africa.
Received: 17 April 2018 Accepted: 5 February 2019
References1. Moenne MI, Saa P, Felipe Laurie V, Ricardo Pérez-Correa J, Agosin E. Oxygen
incorporation and dissolution during industrial-scale red winefermentations. Food Bioprocess Technol. 2014;9:2627–36.
2. Boulton RB, Singleton VL, Bisson LF, Kunkee RE. Principles and practices ofwinemaking. New York: Springer-Verlag Inc.; 1996.
3. Hansen EH, Nissen P, Sommer P, Nielsen JC, Arneborg N. The effect ofoxygen on the survival of non-Saccharomyces yeasts during mixed culturefermentations of grape juice with Saccharomyces cerevisiae. J Appl Microbiol.2001;91:541–7.
4. Quirós M, Rojas V, Gonzalez R, Morales P. Selection of non-Saccharomycesyeast strains for reducing alcohol levels in wine by sugar respiration. Int JFood Microbiol. 2014;181:85–91.
5. Shekhawat K, Bauer FF, Setati ME. Impact of oxygenation on theperformance of three non-Saccharomyces yeasts in co-fermentation withSaccharomyces cerevisiae. Appl Microbiol Biotechnol. 2017;101:2479–91.
6. Ciani M, Beco L, Comitini F. Fermentation behavior and metabolicinteractions of multistarter wine yeast fermentations. Int J Food Microbiol.2006;108:239–45.
7. Ciani M, Capece A, Comitini F, Canonico L, Siesto G, Romano P. Yeastinteractions in inoculated wine fermentation. Front Microbiol. 2016;7:1–7.
8. Ciani M, Comitini F, Mannazzu I, Domizio P. Controlled mixed culturefermentation: a new perspective on the use of non-Saccharomyces yeasts inwinemaking. FEMS Yeast Res. 2010;10:123–33.
9. Comitini F, Gobbi M, Domizio P, Romani C, Lencioni L, Mannazzu I, Ciani M.Selected non-Saccharomyces wine yeasts in controlled multistarterfermentations with Saccharomyces cerevisiae. Food Microbiol. 2011;28:873–82.
10. Gobbi M, Comitini F, Domizio P, Romani C, Lencioni L, Mannazzu I, Ciani M.Lachancea thermotolerans and Saccharomyces cerevisiae in simultaneous andsequential co-fermentation: a strategy to enhance acidity and improve theoverall quality of wine. Food Microbiol. 2013;33:271–81.
11. Sadoudi M, Tourdot-Marechal R, Rousseaux S, Steyer D, Gallardo-Chacon JJ,Ballester J, Vichi S, Guerin-Schneider R, Caixach J, Alexandre H. Yeast-yeastinteractions revealed by aromatic profile analysis of sauvignon blanc winefermented by single or co-culture of non-Saccharomyces and Saccharomycesyeasts. Food Microbiol. 2012;32:243–53.
12. Soden A, Francis IL, Oakey H, Henschke PA. Effect of co-fermentation withCandida stellata and Saccharomyces cerevisiae on the aroma andcomposition of chardonnay wine. Aust J Grape Wine Res. 2000;6:21–30.
13. Nissen P, Nielsen D, Arneborg N. Viable Saccharomyces cerevisiae cellsat high concentrations cause early growth arrest of non-Saccharomycesyeasts in mixed cultures by a cell-cell contact- mediated mechanism.Yeast. 2003;20:331–41.
14. Pérez-Nevado F, Albergaria H, Hogg T, Girio F. Cellular death of two non-Saccharomyces wine-related yeasts during mixed fermentations withSaccharomyces cerevisiae. Int J Food Microbiol. 2006;108:336–45.
15. Albergaria H, Francisco D, Gori K, Arneborg N, Girio F. Saccharomyces cerevisiaeCCMI 885 secretes peptides that inhibit the growth of some non-Saccharomyces wine-related strains. Appl Microbiol Biotechnol. 2010;86:965–72.
16. Rossouw D, Meiring S, Bauer FF. Modifying Saccharomyces cerevisiaeadhesion properties regulates yeast ecosystem dynamics. mSphere. 2018;3:e00383–18.
17. Barbosa C, Mendes-Faia A, Lage P, Mira NP, Mendes-Ferreira A.Genomic expression program of Saccharomyces cerevisiae along amixed-culture wine fermentation with Hanseniaspora guilliermondii.Microb Cell Factories. 2015;14:124.
18. Bron PA, Wels M, Bongers RS, van Bokhorst-van V, Wiersma A, Overmars L,Marco ML, Kleerebezem M. Transcriptomes reveal genetic signaturesunderlying physiological variations imposed by different fermentationconditions in Lactobacillus plantarum. PLoS One. 2012;7:e38720.
19. de Groot MJL, Daran-Lapujade P, van Breukelen B, Knijnenburg TH, pronk JT,Slijper M, Heck AJR. Quantitative proteomics and transcriptomics ofanaerobic and aerobic yeast cultures reveals post-transcriptional regulationof key cellular processes. Microbiology. 2007;153:3864–78.
20. Gasch AP, Spellma PT, Kao CM, Carmel-Harel O, Eisen MB, Storz G, BotsteinD, Brown PO. Genomic expression programs in the response of yeast cellsto environmental changes. Mol Biol Cell. 2000;11:4241–57.
21. Koskenniemi K, Laakso K, Koponen J, Kankainen M, Greco D, Auvinen P,Savijoki K, Nyman TA, Surakka A, Salusjarvi T, de Vos WM, Tynkkynen S,Kalkkinen N, Varmanen P. Proteomics and transcriptomics characterizationof bile stress response in probiotic Lactobacillus rhamnosus GG. Mol CellProteomics. 2011;10:M110.002741.
22. Lee JY, Pajarillo EA, Kim MJ, Chae JP, Kang DK. Proteomic and transcriptionalanalysis of Lactobacillus johnsonii PF01 during bile salt exposure by iTRAQshotgun proteomics and quantitative RT-PCR. J Proteome Res. 2013;12:432–43.
23. Mostert TT, Divol B. Investigating the proteins released by yeasts insynthetic wine fermentations. Int J Food Microbiol. 2014;171:108–18.
24. Rossouw D, Du Toit M, Bauer FF. The impact of co-inoculation withOenococcus oeni on the transcriptome of Saccharomyces cerevisiae and onthe flavour-active metabolite profiles during fermentation in synthetic must.Food Microbiol. 2012;29:121–31.
25. Tronchoni J, Curiel JA, Morales P, Torres-Pérez R, Gonzalez R. Earlytranscriptional response to biotic stress in mixed starter fermentationsinvolving Saccharomyces cerevisiae and Torulaspora delbrueckii. Int J FoodMicrobiol. 2017;241:60–8.
26. González Siso MI, Cerdán ME. Kluyveromyces lactis: a suitable yeast model tostudy cellular defense mechanisms against hypoxia-induced oxidative stress.Oxidative Med Cell Longev. 2012;2012:634674.
27. Baumann K, Dato L, Graf AAB, Frascotti G, Dragositis M, Porro D,Mattanovich D, Ferrer P, Branduardi P. The impact of oxygen on thetranscriptome of recombinant S. cerevisiae and P. pastoris – a comparativeanalysis. BMC Genomics. 2011;12:218.
28. Philpott CC. Iron uptake in fungi: a system for every source. BiochimBiophys Acta. 2006;1763:636–45.
29. Gross C, Kelleher M, Iyer V, Brown P, Winge D. Identification of thecopper regulon in Saccharomyces cerevisiae by DNA microarrays. J BiolChem. 2000;275:32310–6.
30. van Bakel H, Strengman E, Wijmenga C, Holstege F. Gene expressionprofiling and phenotype analyses of S. cerevisiae in response to changingcopper reveals six genes with new roles in copper and iron metabolism.Physiol Genomics. 2005;22:356–67.
31. Hodgins-Davis A, Adomas AB, Warringer J, Townsend JP. Abundant gene-by-environment interactions in gene expression reaction norms to copperwithin Saccharomyces cerevisiae. Genome Biol Evol. 2012;11:1061–79.
32. Luo Z, van Vuuren HJJ. Functional analyses of PAU genes in Saccharomycescerevisiae. Microbiology. 2009;155:4036–49.
33. Rivero D, Berná L, Stefanini I, Baruffini E, Bergerat A, Csikász-Nagy A, FilippoC, Cavalieri D. Hsp12p and PAU genes are involved in ecological interactionsbetween natural yeast strains. Environ Microbiol. 2015;17:3069–81.
34. Henschke P, Jiranek V. Yeasts-metabolism of nitrogen compounds. In: FleetGH, editor. Wine microbiology and biotechnology. Chur: HarwoodAcademic; 1993. p. 77–164.
35. Ough CS, Davenport M, Joseph K. Effect of certain vitamins on growth andfermentation rate of several commercial active dry wine yeasts. Am J EnolVitic. 1989;40:208–13.
36. Louw L, Tredoux AGJ, Van Rensburg P, Kidd M, Naes T, Nieuwoudt HH.Fermentation-derived aroma compounds in varietal young wines fromSouth Africa. S Afr J Enol Vitic. 2010;31:213–25.
37. Schmitt ME, Brown TA, Trumpower BL. A rapid and simple method forpreparation of RNA from Saccharomyces cerevisiae. Nucleic Acids Res.1990;18:3091–2.
38. HannonLab. Fastx-toolkit. 2010. http://hannonlab.cshl.edu/fastx_toolkit/index.html. Accessed May 2016.
Shekhawat et al. BMC Genomics (2019) 20:145 Page 14 of 15

39. Morgan M, Anders S, Lawrence M, Aboyoun P, Pagès H, Gentleman R.ShortRead: a Bioconductor package for input, quality assessment andexploration of high-throughput sequence data. Bioinformatics. 2009;25:2607–8.
40. Martin M. Cutadapt removes adapter sequences from high-throughputsequencing reads. EMBnetjournal. 2011;17:1.
41. Trapnell C, Pachter I, Salzberg SL. TopHat: discovering splice junctions withRNA-seq. Bioinformatics. 2009;25:1105–11.
42. Anders S, Pyl PT, Huber W. HTSeq-a Python framework to work with high-throughput sequencing data. Bioinformatics. 2015;31:166–9.
43. Robinson MD, McCarthy DJ, Smyth GK. edgeR: a Bioconductor package fordifferential expression analysis of digital gene expression data.Bioinformatics. 2010;26:139–40.
44. Robinson MD, Smyth GK. Moderated statistical tests for assessing differencesin tag abundance. Bioinformatics. 2007;23:2881–7.
45. Benjamini Y, Hochberg Y. Controlling the false discovery rate: a practicaland powerful approach to multiple testing. J R Stat Soc Ser B Methodol.1995;57:289–300.
Shekhawat et al. BMC Genomics (2019) 20:145 Page 15 of 15


![[V]. Process of Transcription and Transcriptional Control of Gene Expression 1 RNA polymerases and Initiation of transcription Transcriptional elongation](https://img.pdfslide.us/doc/110x75/56649e595503460f94b52b31/v-process-of-transcription-and-transcriptional-control-of-gene-expression.jpg)