Embed Size (px)
Citation preview

RNA-Seq Analysis
in Partek® Flow®
HANDS-ON TRAINING
Xiaowen Wang
Field Application Specialist
Partek Incorporated
National Institutes of Health
November 2018
Copyright © 2018 Partek Incorporated. All rights reserved.
Notes:
Login and Project Set-up
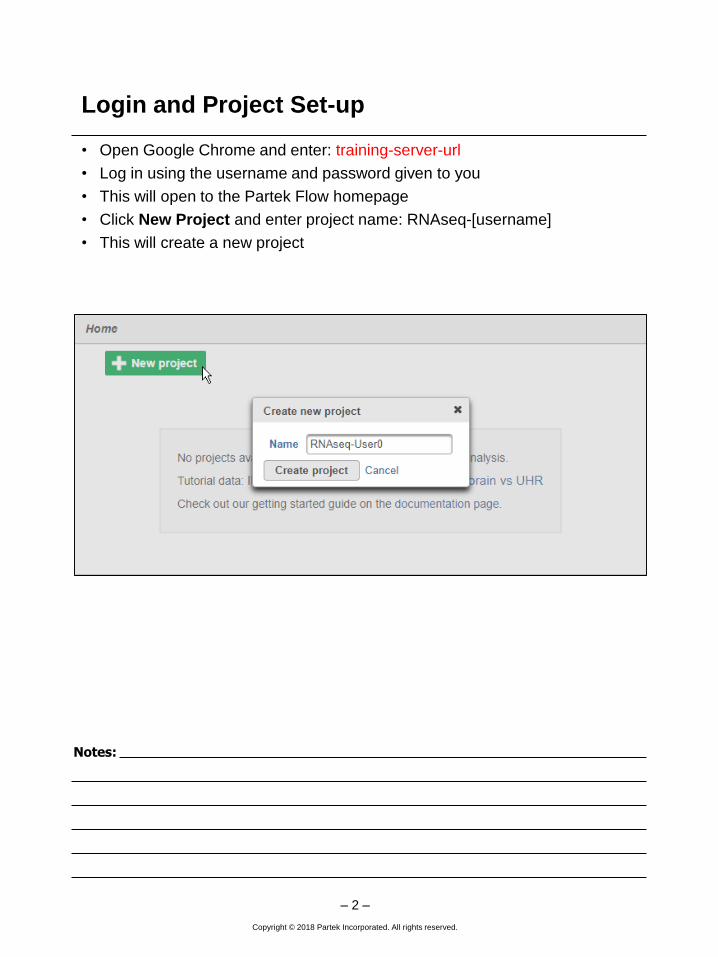
• Open Google Chrome and enter: training-server-url
• Log in using the username and password given to you
• This will open to the Partek Flow homepage
• Click New Project and enter project name: RNAseq-[username]
• This will create a new project
– 2 –
Copyright © 2018 Partek Incorporated. All rights reserved.
Notes:
Experiment Description
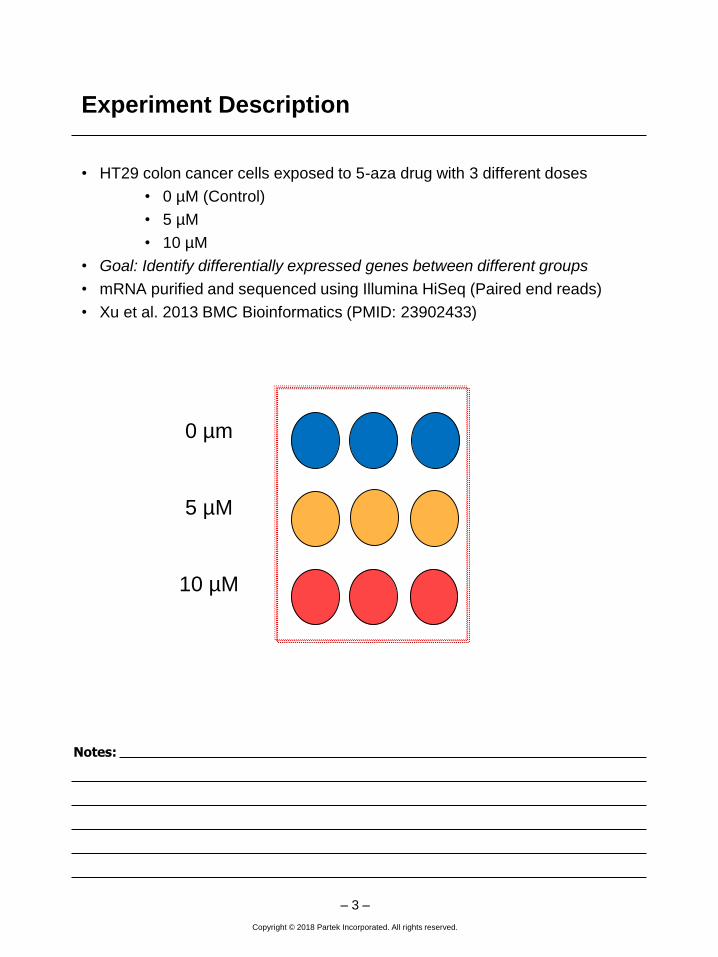
• HT29 colon cancer cells exposed to 5-aza drug with 3 different doses
• 0 µM (Control)
• 5 µM
• 10 µM
• Goal: Identify differentially expressed genes between different groups
• mRNA purified and sequenced using Illumina HiSeq (Paired end reads)
• Xu et al. 2013 BMC Bioinformatics (PMID: 23902433)
– 3 –
0 µm
5 µM
10 µM
Copyright © 2018 Partek Incorporated. All rights reserved.
Notes:
Data Upload
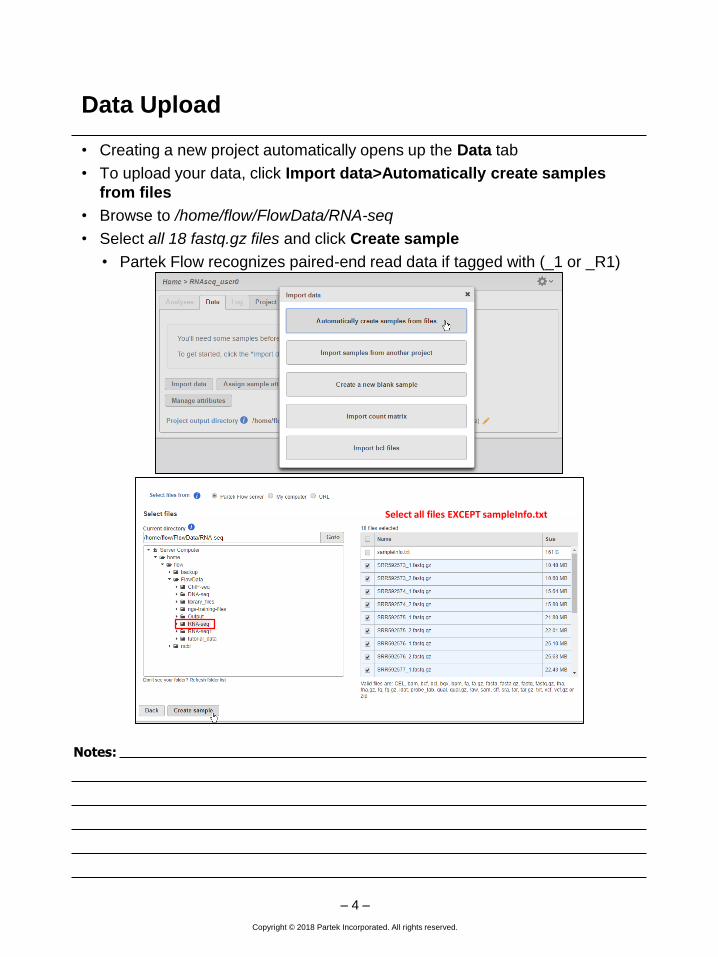
• Creating a new project automatically opens up the Data tab
• To upload your data, click Import data>Automatically create samples
from files
• Browse to /home/flow/FlowData/RNA-seq
• Select all 18 fastq.gz files and click Create sample
• Partek Flow recognizes paired-end read data if tagged with (_1 or _R1)
– 4 –
Select all files EXCEPT sampleInfo.txt
Copyright © 2018 Partek Incorporated. All rights reserved.
Notes:
Sample Attribute Assignment
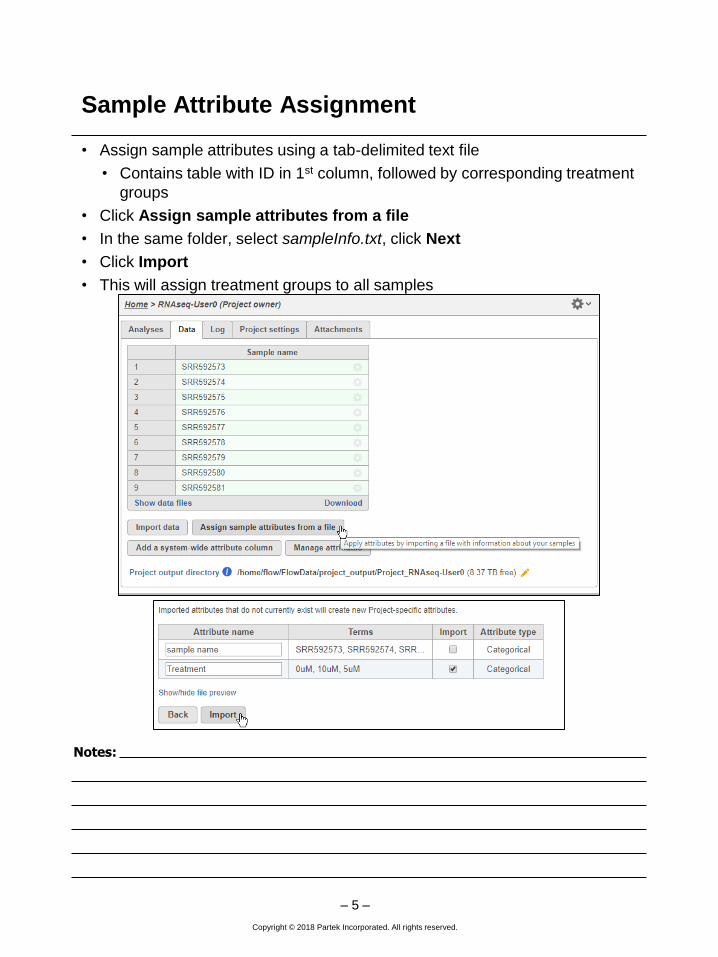
• Assign sample attributes using a tab-delimited text file
• Contains table with ID in 1st column, followed by corresponding treatment
groups
• Click Assign sample attributes from a file
• In the same folder, select sampleInfo.txt, click Next
• Click Import
• This will assign treatment groups to all samples
– 5 –
Copyright © 2018 Partek Incorporated. All rights reserved.
Notes:
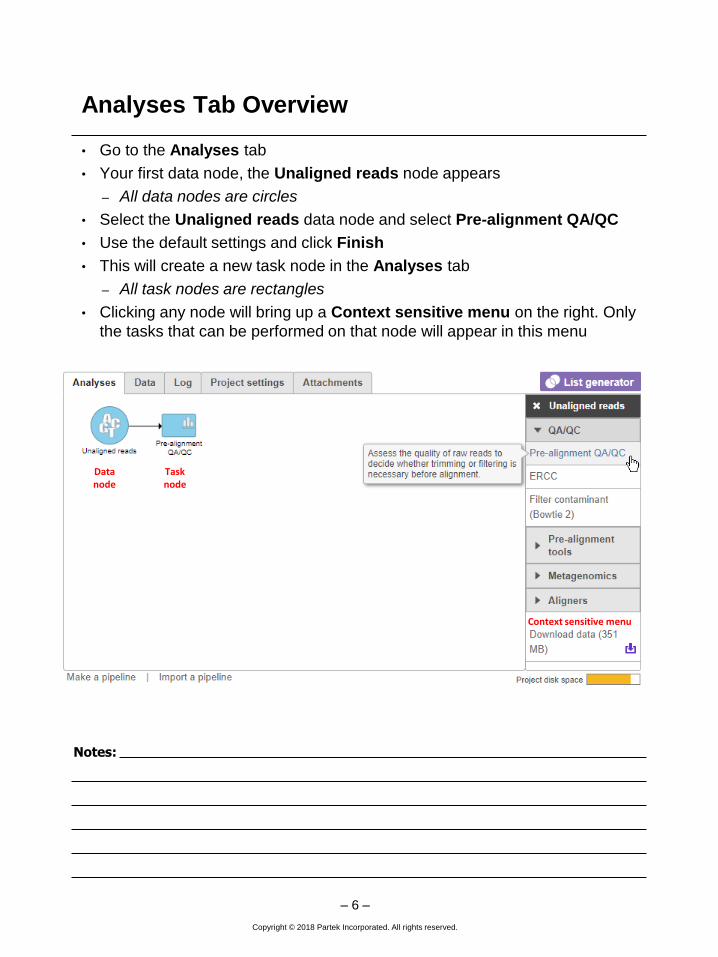
Analyses Tab Overview
• Go to the Analyses tab
• Your first data node, the Unaligned reads node appears
– All data nodes are circles
• Select the Unaligned reads data node and select Pre-alignment QA/QC
• Use the default settings and click Finish
• This will create a new task node in the Analyses tab
– All task nodes are rectangles
• Clicking any node will bring up a Context sensitive menu on the right. Only
the tasks that can be performed on that node will appear in this menu
– 6 –
Data node
Task node
Context sensitive menu
Copyright © 2018 Partek Incorporated. All rights reserved.
Notes:
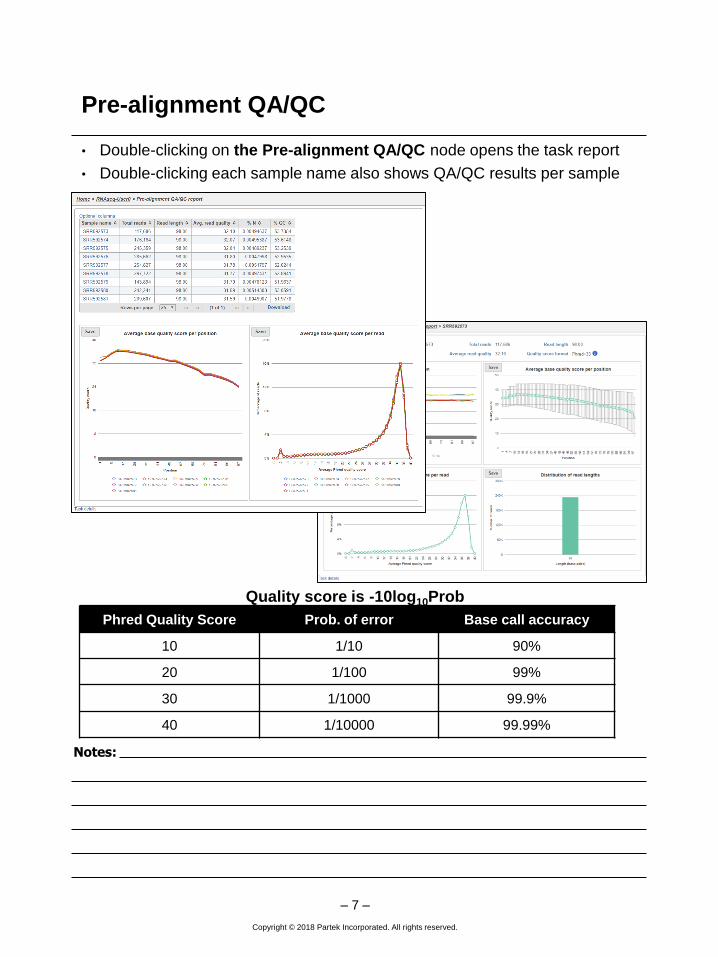
Pre-alignment QA/QC
• Double-clicking on the Pre-alignment QA/QC node opens the task report
• Double-clicking each sample name also shows QA/QC results per sample
– 7 –
Phred Quality Score Prob. of error Base call accuracy
10 1/10 90%
20 1/100 99%
30 1/1000 99.9%
40 1/10000 99.99%
Quality score is -10log10Prob
Copyright © 2018 Partek Incorporated. All rights reserved.
Notes:
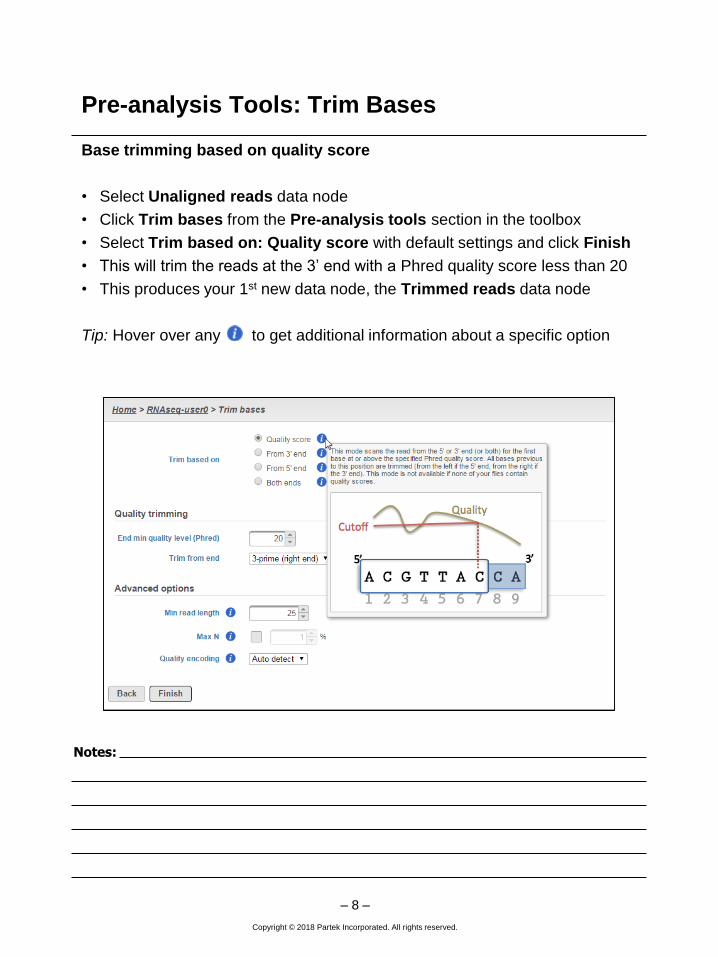
Pre-analysis Tools: Trim Bases
Base trimming based on quality score
• Select Unaligned reads data node
• Click Trim bases from the Pre-analysis tools section in the toolbox
• Select Trim based on: Quality score with default settings and click Finish
• This will trim the reads at the 3’ end with a Phred quality score less than 20
• This produces your 1st new data node, the Trimmed reads data node
Tip: Hover over any to get additional information about a specific option
– 8 –
Copyright © 2018 Partek Incorporated. All rights reserved.
Notes:
Aligning RNA-Seq Data
– 9 –
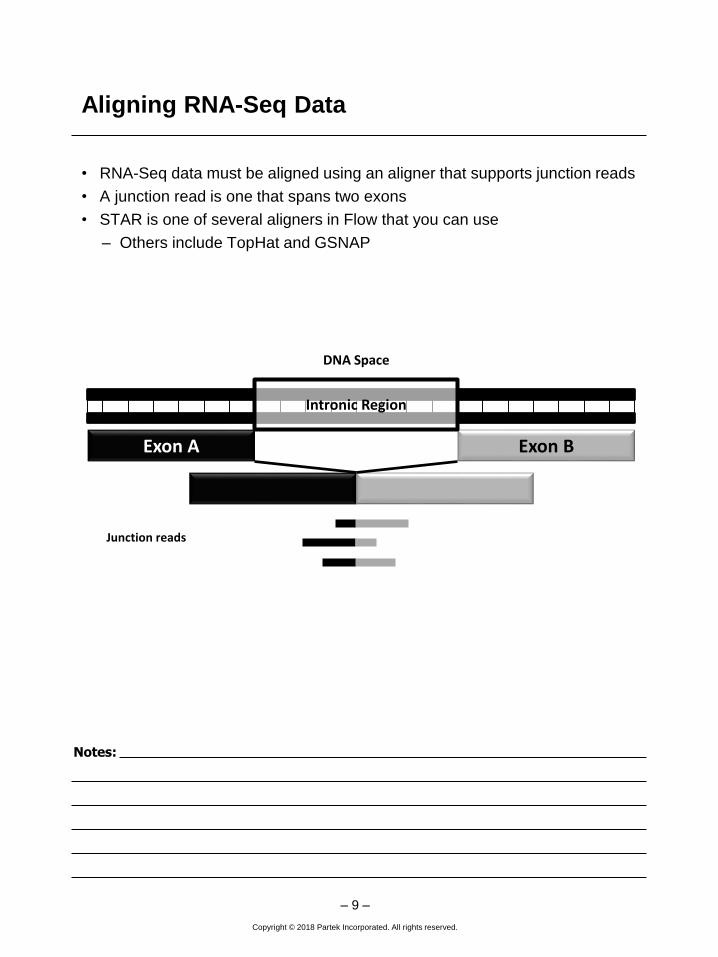
• RNA-Seq data must be aligned using an aligner that supports junction reads
• A junction read is one that spans two exons
• STAR is one of several aligners in Flow that you can use
– Others include TopHat and GSNAP
DNA Space
Exon A Exon B
Intronic Region
Junction reads
Copyright © 2018 Partek Incorporated. All rights reserved.
Notes:
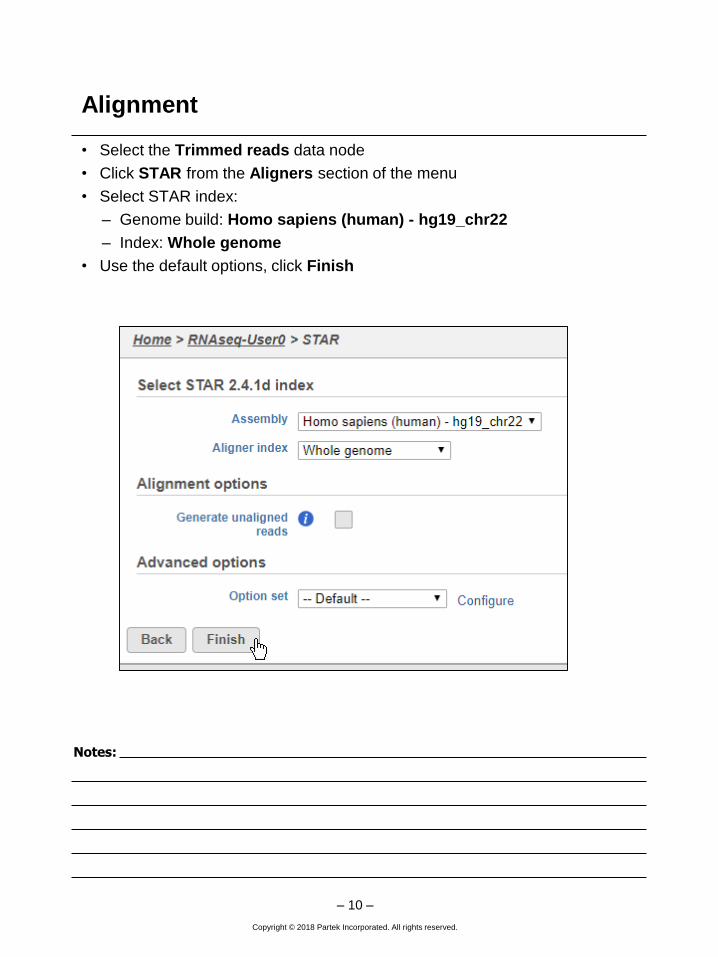
Alignment
• Select the Trimmed reads data node
• Click STAR from the Aligners section of the menu
• Select STAR index:
– Genome build: Homo sapiens (human) - hg19_chr22
– Index: Whole genome
• Use the default options, click Finish
– 10 –
Copyright © 2018 Partek Incorporated. All rights reserved.
Notes:
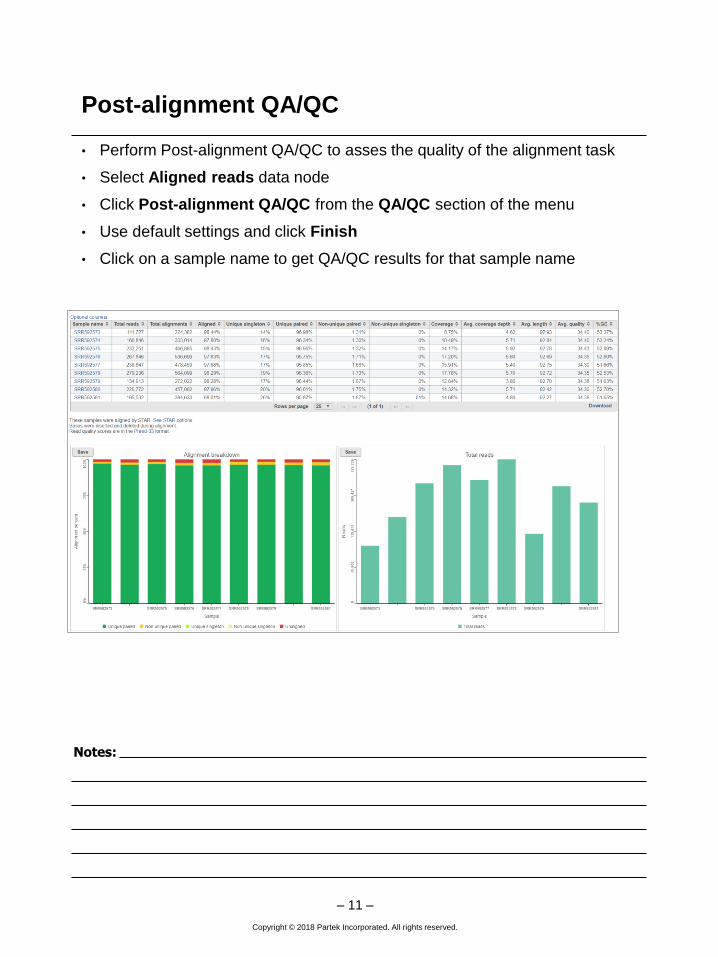
Post-alignment QA/QC
• Perform Post-alignment QA/QC to asses the quality of the alignment task
• Select Aligned reads data node
• Click Post-alignment QA/QC from the QA/QC section of the menu
• Use default settings and click Finish
• Click on a sample name to get QA/QC results for that sample name
– 11 –
Copyright © 2018 Partek Incorporated. All rights reserved.
Notes:
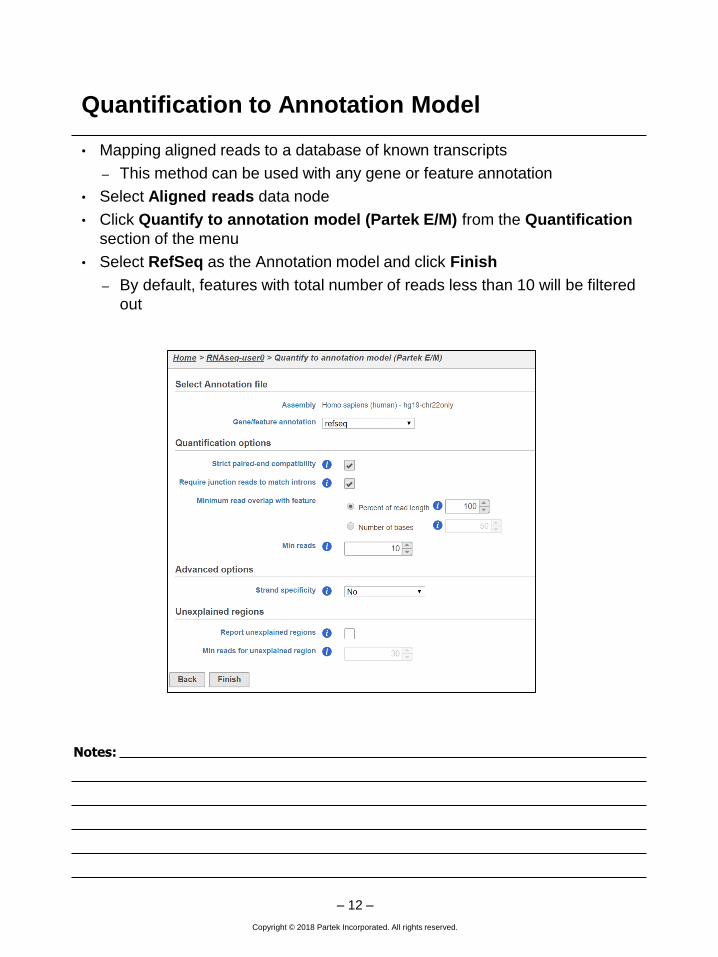
Quantification to Annotation Model
• Mapping aligned reads to a database of known transcripts
– This method can be used with any gene or feature annotation
• Select Aligned reads data node
• Click Quantify to annotation model (Partek E/M) from the Quantification
section of the menu
• Select RefSeq as the Annotation model and click Finish
– By default, features with total number of reads less than 10 will be filtered
out
– 12 –
Copyright © 2018 Partek Incorporated. All rights reserved.
Notes:
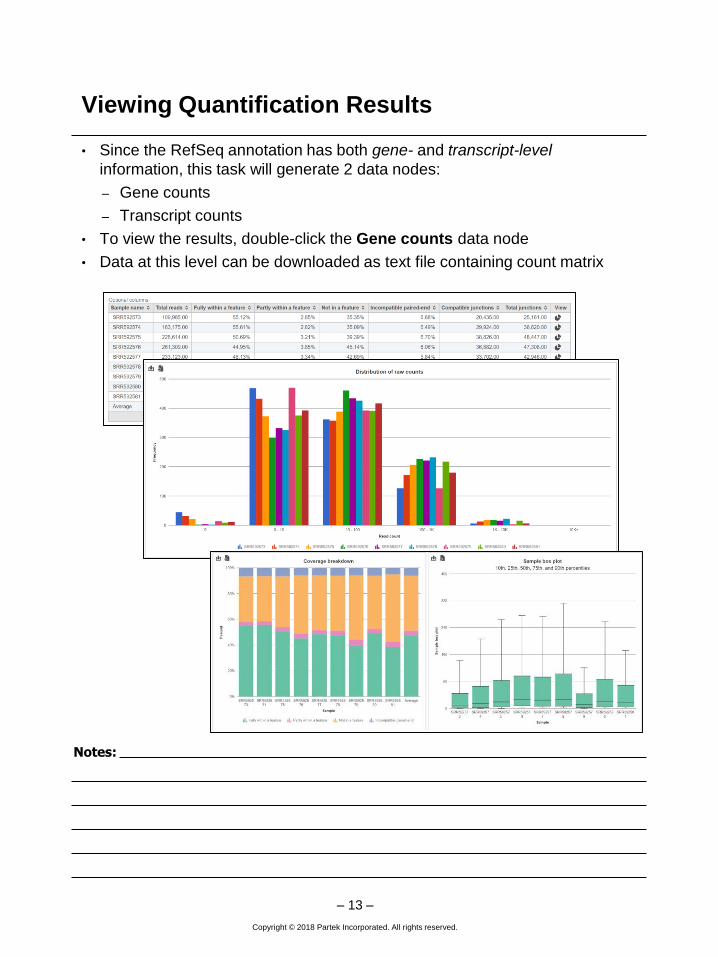
Viewing Quantification Results
• Since the RefSeq annotation has both gene- and transcript-level
information, this task will generate 2 data nodes:
– Gene counts
– Transcript counts
• To view the results, double-click the Gene counts data node
• Data at this level can be downloaded as text file containing count matrix
– 13 –
Copyright © 2018 Partek Incorporated. All rights reserved.
Notes:
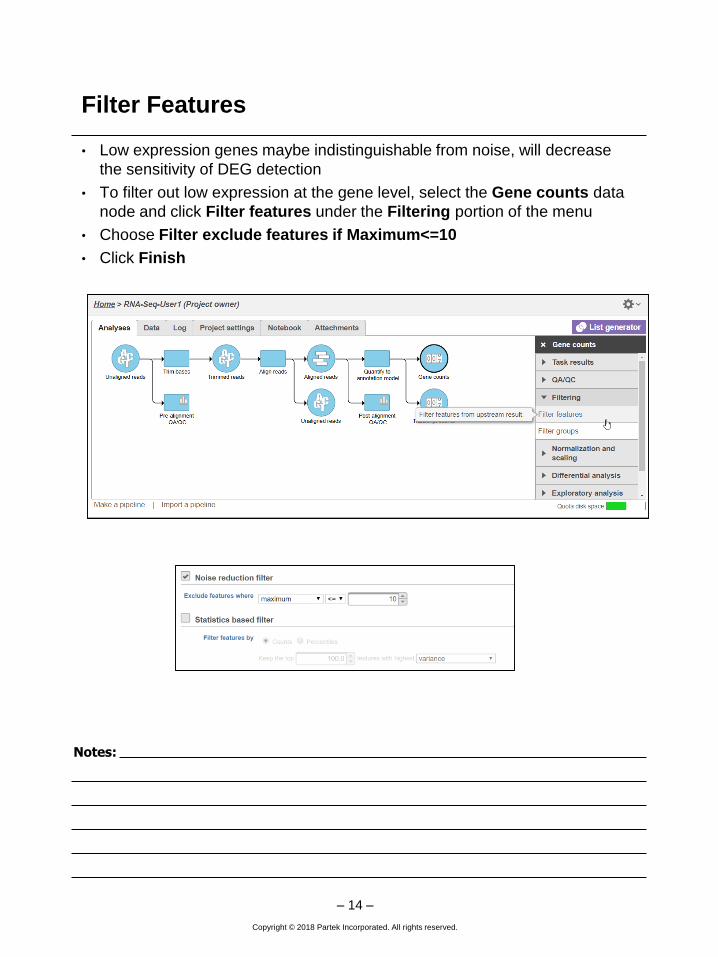
Filter Features
• Low expression genes maybe indistinguishable from noise, will decrease
the sensitivity of DEG detection
• To filter out low expression at the gene level, select the Gene counts data
node and click Filter features under the Filtering portion of the menu
• Choose Filter exclude features if Maximum<=10
• Click Finish
– 14 –
Copyright © 2018 Partek Incorporated. All rights reserved.
Notes:
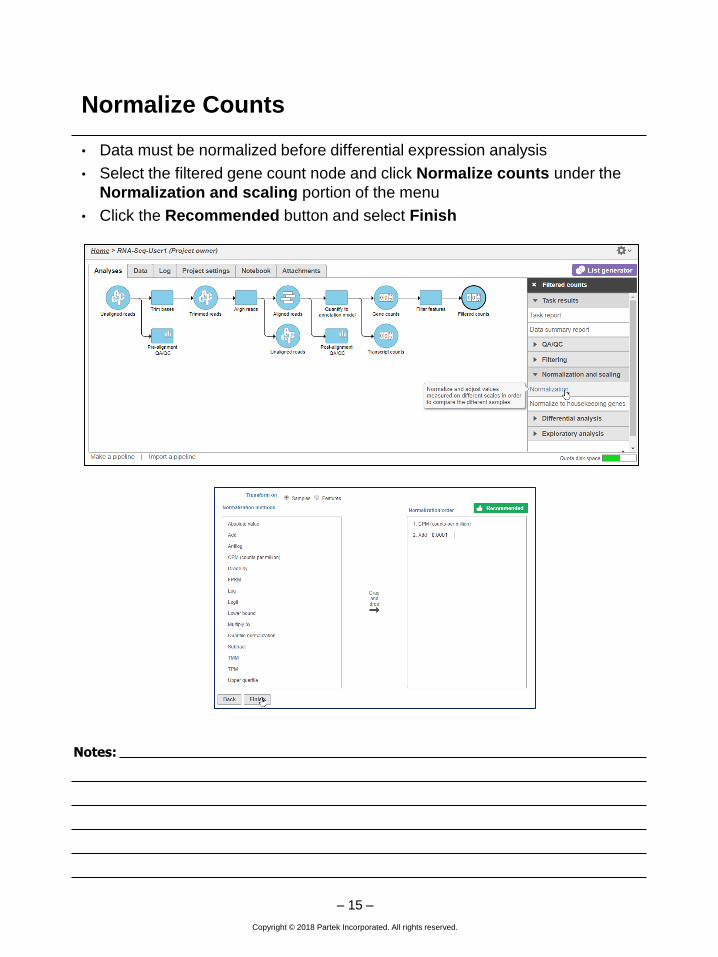
Normalize Counts
• Data must be normalized before differential expression analysis
• Select the filtered gene count node and click Normalize counts under the
Normalization and scaling portion of the menu
• Click the Recommended button and select Finish
– 15 –
Copyright © 2018 Partek Incorporated. All rights reserved.
Notes:
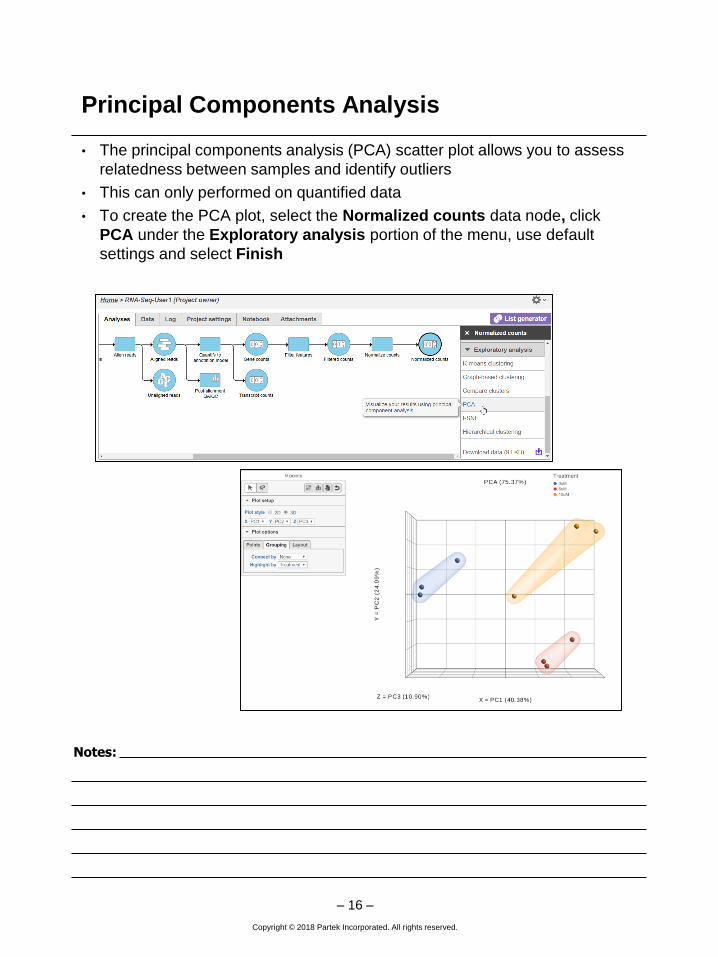
Principal Components Analysis
• The principal components analysis (PCA) scatter plot allows you to assess
relatedness between samples and identify outliers
• This can only performed on quantified data
• To create the PCA plot, select the Normalized counts data node, click
PCA under the Exploratory analysis portion of the menu, use default
settings and select Finish
– 16 –
Copyright © 2018 Partek Incorporated. All rights reserved.
Notes:
Differential Expression Analysis
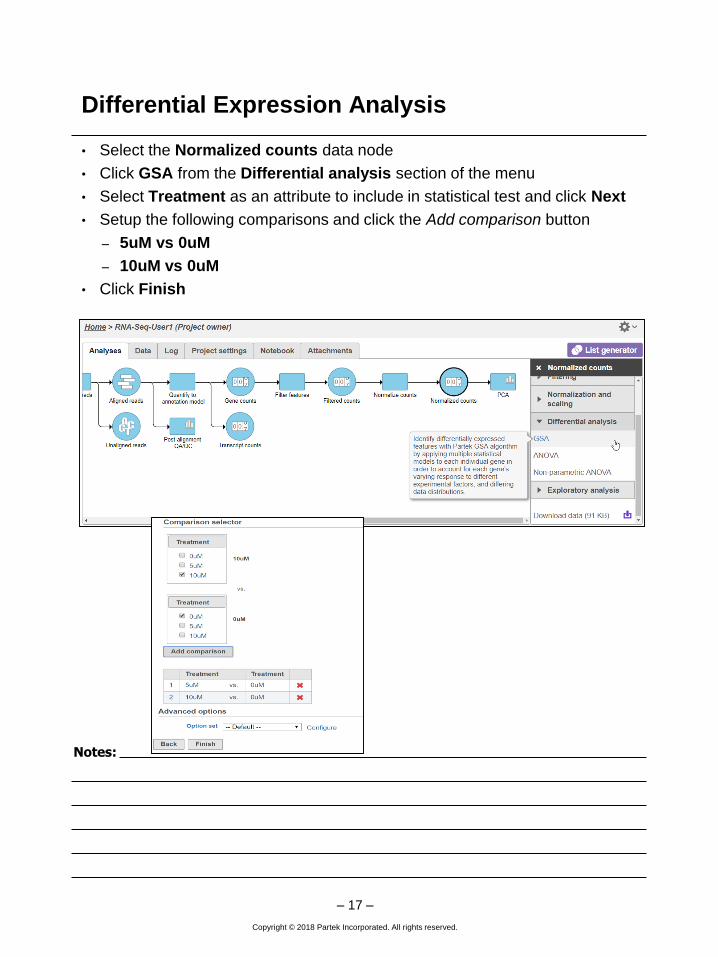
• Select the Normalized counts data node
• Click GSA from the Differential analysis section of the menu
• Select Treatment as an attribute to include in statistical test and click Next
• Setup the following comparisons and click the Add comparison button
– 5uM vs 0uM
– 10uM vs 0uM
• Click Finish
– 17 –
Copyright © 2018 Partek Incorporated. All rights reserved.
Notes:
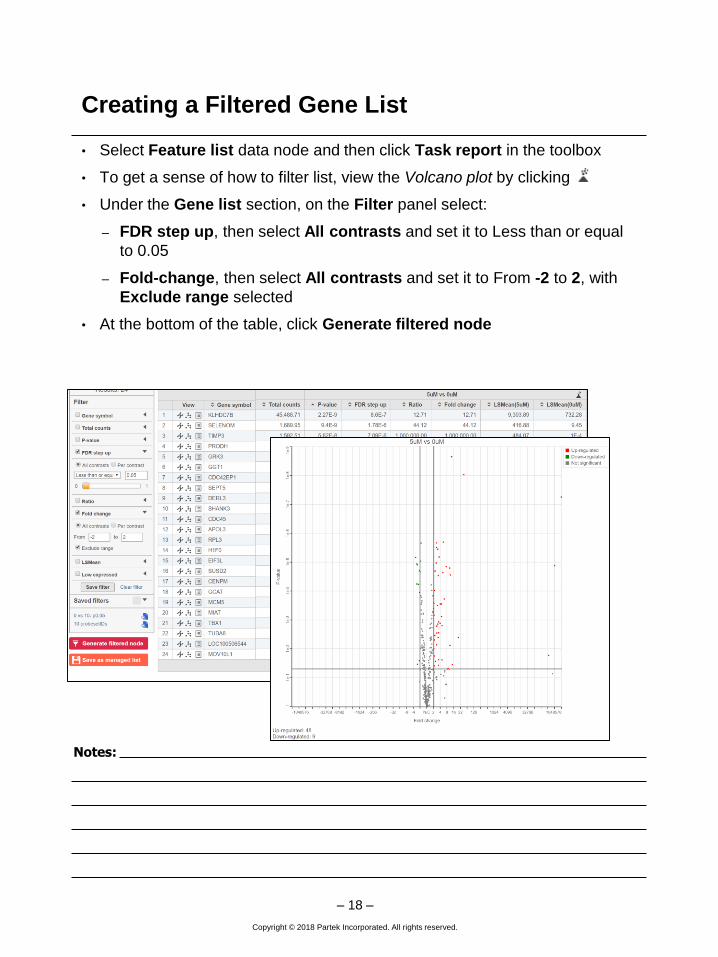
Creating a Filtered Gene List
• Select Feature list data node and then click Task report in the toolbox
• To get a sense of how to filter list, view the Volcano plot by clicking
• Under the Gene list section, on the Filter panel select:
– FDR step up, then select All contrasts and set it to Less than or equal
to 0.05
– Fold-change, then select All contrasts and set it to From -2 to 2, with
Exclude range selected
• At the bottom of the table, click Generate filtered node
– 18 –
Copyright © 2018 Partek Incorporated. All rights reserved.
Notes:
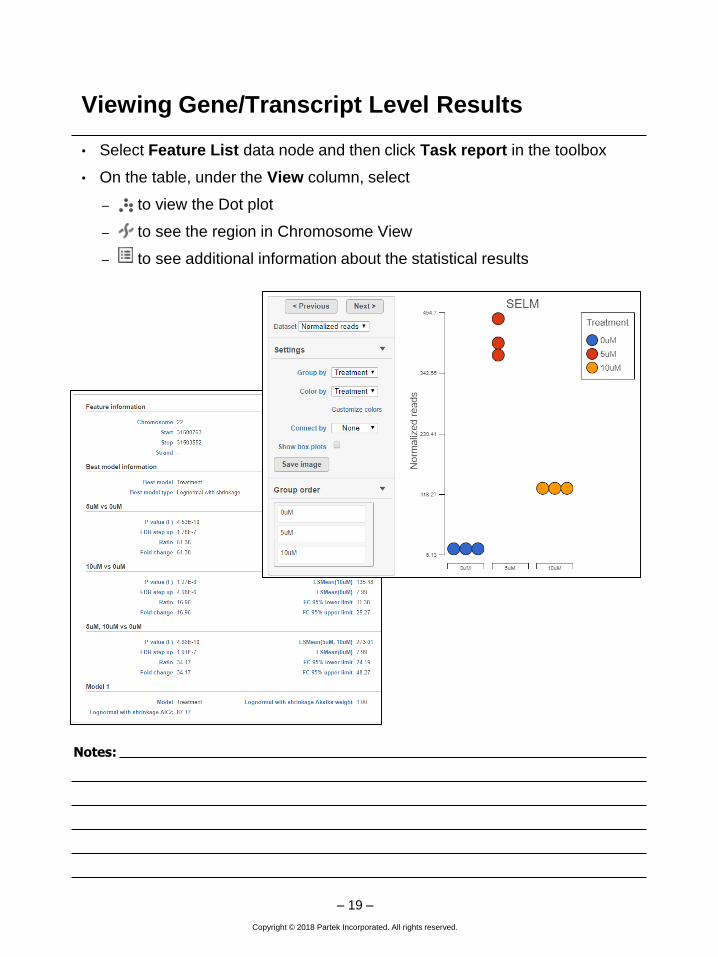
• Select Feature List data node and then click Task report in the toolbox
• On the table, under the View column, select
– to view the Dot plot
– to see the region in Chromosome View
– to see additional information about the statistical results
Viewing Gene/Transcript Level Results
– 19 –
Copyright © 2018 Partek Incorporated. All rights reserved.
Notes:
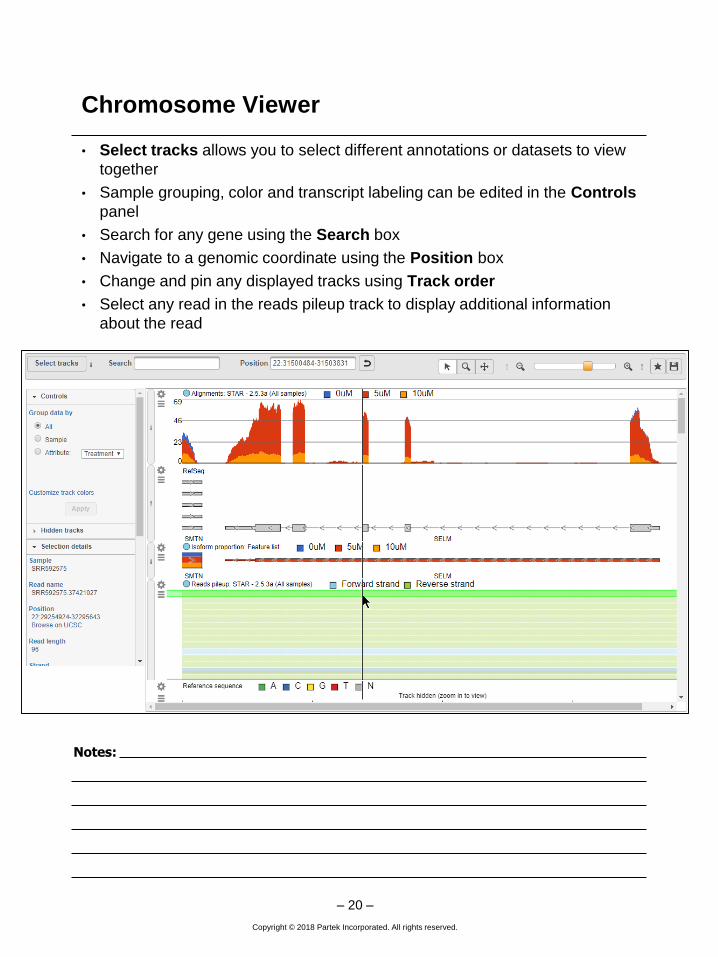
Chromosome Viewer
• Select tracks allows you to select different annotations or datasets to view
together
• Sample grouping, color and transcript labeling can be edited in the Controls
panel
• Search for any gene using the Search box
• Navigate to a genomic coordinate using the Position box
• Change and pin any displayed tracks using Track order
• Select any read in the reads pileup track to display additional information
about the read
– 20 –
Copyright © 2018 Partek Incorporated. All rights reserved.
Notes:
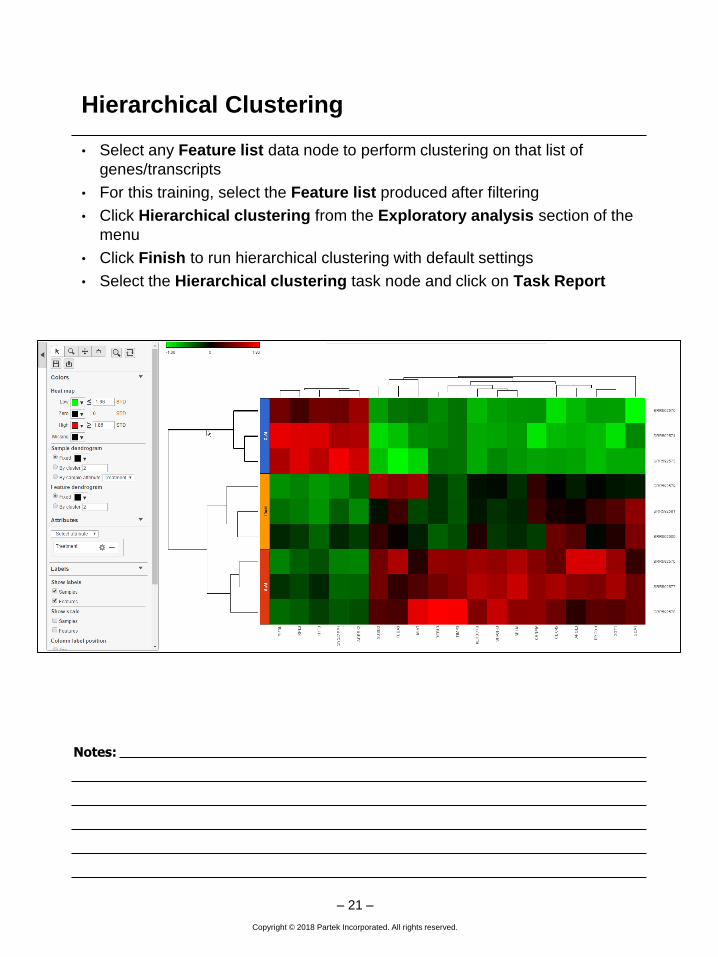
Hierarchical Clustering
• Select any Feature list data node to perform clustering on that list of
genes/transcripts
• For this training, select the Feature list produced after filtering
• Click Hierarchical clustering from the Exploratory analysis section of the
menu
• Click Finish to run hierarchical clustering with default settings
• Select the Hierarchical clustering task node and click on Task Report
– 21 –
Copyright © 2018 Partek Incorporated. All rights reserved.
Notes:
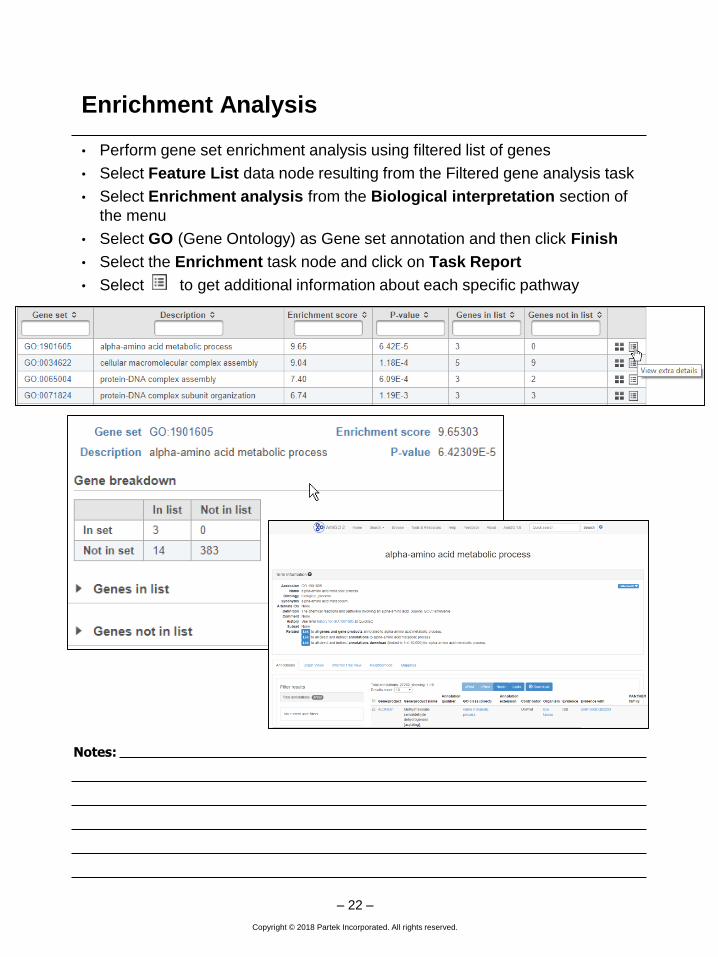
Enrichment Analysis
• Perform gene set enrichment analysis using filtered list of genes
• Select Feature List data node resulting from the Filtered gene analysis task
• Select Enrichment analysis from the Biological interpretation section of
the menu
• Select GO (Gene Ontology) as Gene set annotation and then click Finish
• Select the Enrichment task node and click on Task Report
• Select to get additional information about each specific pathway
– 22 –
Copyright © 2018 Partek Incorporated. All rights reserved.
Notes:
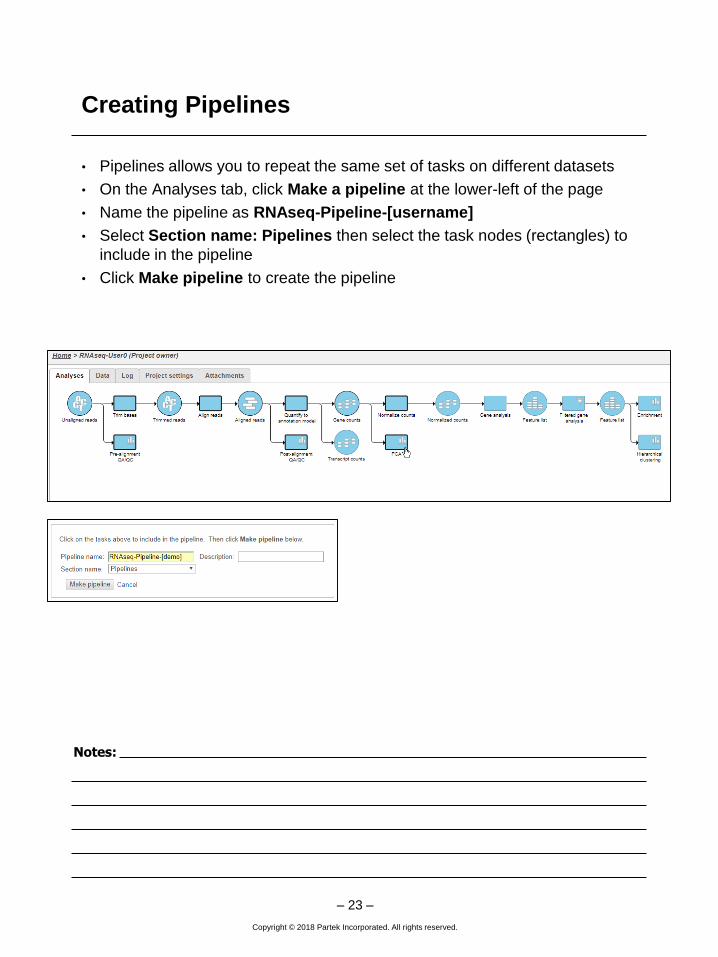
Creating Pipelines
• Pipelines allows you to repeat the same set of tasks on different datasets
• On the Analyses tab, click Make a pipeline at the lower-left of the page
• Name the pipeline as RNAseq-Pipeline-[username]
• Select Section name: Pipelines then select the task nodes (rectangles) to
include in the pipeline
• Click Make pipeline to create the pipeline
– 23 –
Copyright © 2018 Partek Incorporated. All rights reserved.
Notes:
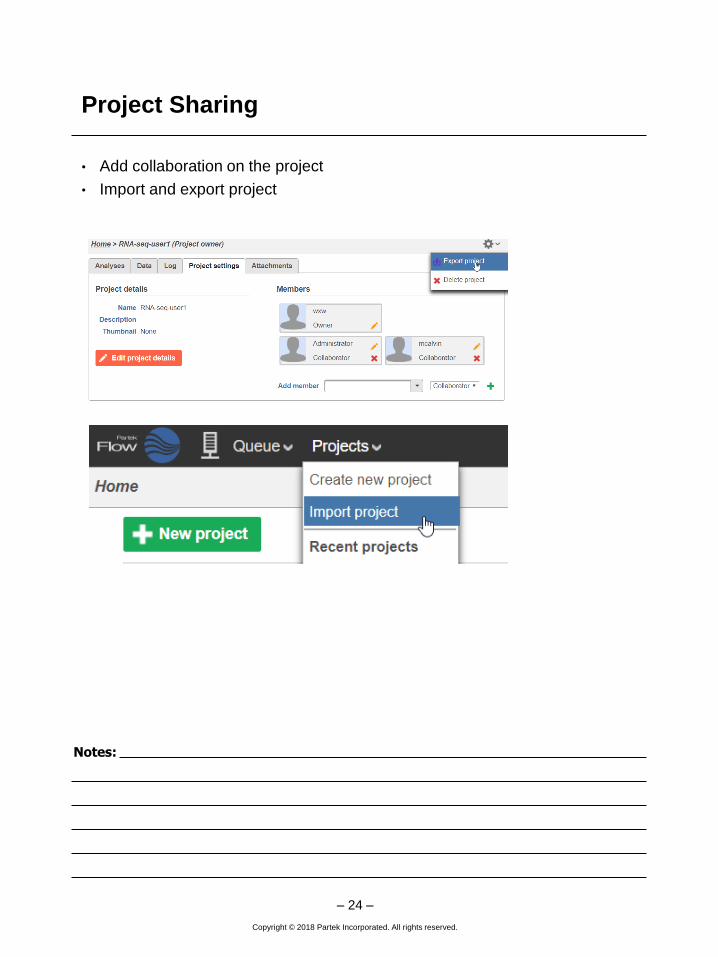
Project Sharing
• Add collaboration on the project
• Import and export project
– 24 –
Copyright © 2018 Partek Incorporated. All rights reserved.
Notes:
Further Training
Self-learning
• Check out http://www.partek.com/flow-resources for documentation and
additional resources
• Recorded webinars available on http://www.partek.com/webinars
Regional Technical Support
• www.partek.com/PartekSupport
– 25 –